report driving out pollution - natural … 3 driving out pollution: how utilities can accelerate the...
TRANSCRIPT

JUNE 2016 R: 16-05-B
REPORT
DRIVING OUT POLLUTION: How Utilities Can Accelerate the Market for Electric VehiclesMax Baumhefner Roland Hwang Pierre Bull

About NRDCThe Natural Resources Defense Council is an international nonprofit environmental organization with more than 2.4 million members and online activists. Since 1970, our lawyers, scientists, and other environmental specialists have worked to protect the world’s natural resources, public health, and the environment. NRDC has offices in New York City, Washington, D.C., Los Angeles, San Francisco, Chicago, Montana, and Beijing. Visit us at nrdc.org.
NRDC Chief Communications Officer: Lisa BenensonNRDC Deputy Directors of Communications: Michelle Egan and Lisa GoffrediNRDC Policy Editor: Mary Annaïse HeglarDesign and Production: www.suerossi.com
© Natural Resources Defense Council 2016
Acknowledgments Report written by:Max BaumhefnerRoland HwangPierre Bull Reviews by:Sheryl Carter (NRDC)JJ McCoy (Northwest Energy Coalition)Pat Remick (NRDC)Luke Tonachel (NRDC)Seth Zuckerman (Climate Solutions)
Other substantive contributions by: Mary Heglar (NRDC)Allison Kotch (NRDC)

Page 3 DRIVING OUT POLLUTION: HOW UTILITIES CAN ACCELERATE THE MARKET FOR ELECTRIC VEHICLES NRDC
Executive Summary ....................................................................................................................................................4
A. Introduction .........................................................................................................................................................6
B. The Need for Utility Electric Vehicle Programs ...................................................................................................7
1. Electric Vehicles and Clean Power Are Needed to Solve Global Warming and Air Pollution .......................................... 7
2. Utility Investment in Charging Infrastructure Is Needed to Expand the Electric Vehicle Market .................................. 7
3. Widespread and Well-Managed Electric Vehicle Charging Can Benefit All Utility Customers ....................................... 9
4. Electric Vehicles Can Provide Valuable Grid Services .................................................................................................... 10
C. The Three Phases of Utility Policy to Accelerate the Electric Vehicle Market ................................................. 14
1. Removing Barriers to Adoption, Ensuring Grid Reliability, and Maximizing Fuel Cost Savings ................................... 14
2. Closing the Charging Infrastructure Gap and Promoting Equity .................................................................................... 16
3. Capturing the Value of Grid Services and Integrating Renewable Energy ......................................................................17
D. Conclusion .......................................................................................................................................................... 18
Endnotes ................................................................................................................................................................... 19
LIST OF FIGURES AND TABLES
Figure 1: SDG&E Cost of Service Before and After Widespread Electric Vehicle Adoption ......................................................... 9
Figure 2: Present Value of EV Adoption in California Through 2030, by Rate Scenario .............................................................. 9
Figure 3: Estimated Percentage of Time EVs Spend by Location .................................................................................................. 10
Figure 4: Modeled Storage Needs of Four Exemplary Subregions of the
U.S. Western Grid with 27 Percent Renewables in 2022 ....................................................................................................... 12
Figure 5: Most Important Reason to Acquire an Electric Vehicle ..................................................................................................15
Figure 6: Residential EV Charging in Dallas/Fort Worth Region by Time of Day .........................................................................15
Figure 7: Residential EV Charging in San Diego Region by Time of Day .......................................................................................15
Table ES-1: The Three Phases of Utility Electric Vehicle Market-Acceleration Policy .................................................................. 5
Table 1: Grid Services That Electric Vehicles Could Potentially Provide, by Grid Segment ......................................................... 11
Table 2: Estimated Value of Select Electric Vehicle Pilot Programs ..............................................................................................13
Table 3: The Three Phases of Utility Policy to Accelerate the Electric Vehicle Market............................................................... 14
Table of Contents

Page 4 DRIVING OUT POLLUTION: HOW UTILITIES CAN ACCELERATE THE MARKET FOR ELECTRIC VEHICLES NRDC
Widespread adoption of electric vehicles (EVs) is an essential strategy for driving carbon pollution out of the transportation sector.1 Large-scale deployment of EVs can also help replace dirty power plants with clean energy like wind and solar power. And EVs powered by those renewable resources are virtually emissions-free.
Realizing this potential requires a robust network of charging stations where consumers live, work, and play. Such a network will pave the way for a larger and more diverse EV market. Electric utilities are uniquely positioned to facilitate the creation of this network because they can make use of spare grid capacity to charge EVs, generating significant new revenues. In turn, the growing customer investment in EVs with large, advanced batteries can be leveraged to bring more renewable energy into the system.
With the right policies, the power and scale of the electric industry could be unleashed to transform the way America travels while saving us money and protecting our health, environment, and economy from dangerous climate change.
Putting the transportation sector, which accounts for a third of U.S. carbon pollution, on track to meet the nation’s climate goals requires greatly accelerating EV sales.2 EVs will need to account for 40 percent or more of new vehicle sales by 2030, up from the current less than 1 percent, in order to meet long-term carbon-reduction targets, according to numerous studies.3
This is not impossible. In a period of about two weeks, almost 400,000 people put down $1,000 deposits for the next-generation, moderately priced Tesla.4 However, Tesla may be forced to return many of those deposits, if the charging infrastructure network does not catch up to consumer demand. A major barrier to the growth of the EV market is the lack of charging stations outside of single-family detached homes, where more than 80 percent of current EV owners live.5
A substantial investment is needed. By way of example, to meet California’s EV deployment goals, it is estimated 125,000 to 220,000 publicly accessible charging ports are needed by 2020, a dramatic increase from the estimated 10,000 the state has today.6 And hundreds of thousands of additional charging stations at apartment complexes and other multi-unit dwellings will be needed over the same time period to unleash the pent up demand from consumers who do not live in single-family detached homes.
The electric industry is uniquely positioned to accelerate the EV market and help meet air quality standards and climate goals by deploying more charging stations and educating customers on the benefits of driving on electricity.
Executive Summary
As noted in a recent National Academies of Science study, only utilities can capture the “incremental revenue from additional electricity that EV drivers consume at home, where roughly 80 percent of the charging takes place,” and use it to increase access to electricity as a transportation fuel.7 This means serving the “garageless” who cannot buy a plug-in electric vehicle because they are not able to plug it in at home, and growing the market in low-income communities that are historically exposed to dangerous air pollution and also the most vulnerable to volatile gas prices. It also means deploying charging stations at workplaces and other visible locations to drive new sales, alleviate “range anxiety” (fear of running out of juice while driving), and make greater use of solar energy that generally peaks when people are away from home. Combined with residential charging, which ensures EVs are plugged in overnight when wind power is abundant, this maximizes the availability of EVs to support the grid.
Researchers at the Pacific Northwest National Laboratory found sufficient spare capacity in the nation’s grid to power nearly all of our passenger cars and trucks, if vehicle charging is properly managed.8 Charging EVs during hours when the grid is underutilized increases utility revenues without commensurate increases in costs, putting downward pressure on electricity rates. This effect is the opposite of the utility “death spiral,” whereby increasing costs borne by a decreasing pool of customers causes rate increases that drive away more customers, leaving those who cannot afford distributed (onsite) generation or home energy storage to pay for an aging grid. In fact, a recent study estimates large-scale commercialization of EVs in California would generate net revenues of $2 billion to $8 billion for Southern California Edison (SCE), San Diego Gas & Electric (SDG&E), Pacific Gas & Electric (PG&E) and the Sacramento Municipal Utility District (SMUD), enough to allow those utilities to both invest in charging infrastructure and reduce consumer bills.9
Electric utilities can also leverage the growing number of EV batteries already on the road to absorb increasing amounts of wind and solar electricity that may otherwise be dumped if it is not generated at times when there is sufficient demand. The charging of EVs can be managed to avoid hours when the grid is strained and to coincide with

Page 5 DRIVING OUT POLLUTION: HOW UTILITIES CAN ACCELERATE THE MARKET FOR ELECTRIC VEHICLES NRDC
hours when renewable energy is plentiful, avoiding the need to either spill valuable clean energy or invest in stand-alone energy storage.
In the future, EV batteries could even put electricity back onto the grid when it is most needed. This can be accomplished both via “vehicle-to-grid” or “V2G” (storing energy in EVs and putting it back onto the grid later) and via “Battery Second Life” (storing energy in used EV batteries redeployed as stationary energy storage and putting it back onto the grid later). American drivers have already purchased, in the form of EV batteries, more than enough energy storage to power all the homes in the District of Columbia on an average day.10 That sunk investment grows with every EV purchase. Researchers at the National Renewable Energy Laboratory (NREL) estimate massive amounts of energy storage will likely be needed to balance a U.S. electric grid that is 80 percent renewable by the year 2050.11 That need could theoretically be met entirely with batteries from as few as 10 percent of the EVs on the road in that year.12 Stand-alone energy storage on that scale could require an investment somewhere between $120 billion and $180 billion.13 Directing even some portion of that investment away from capital-intensive, utility-scale projects and toward EV drivers to provide energy storage with the batteries they have already purchased could reduce the cost of transitioning to a cleaner grid and accelerate the electrification of the transportation sector.
To realize this potential, we need utility policies to unleash greater investments in charging infrastructure and other programs that expand EV adoption in a manner that
TABLE ES-1: THE THREE PHASES OF UTILITY ELECTRIC VEHICLE MARKET-ACCELERATION POLICY
1. Removing Barriers To Adoption, Ensuring Grid Reliability, And Maximizing Fuel Cost Savings
Clarify that electric vehicle charging companies will not be regulated as utilities
Inform distribution system planning
Provide consistent and fair treatment of electric vehicle load
Adopt appropriate rates to maximize fuel savings and manage charging
Target customer education and outreach programs
2. Closing the Charging Infrastructure Gap and Promoting Equity
Utility-facilitated deployment of charging infrastructure
Increase access to electricity as transportation fuel in disadvantaged communities
Promote broader awareness through mass-market education and outreach
3. Capturing the Value of Grid Services and Integrating Renewable Energy
Implement traditional demand response programs for electric vehicle customers
Implement advanced demand response programs for electric vehicle customers
Integrate V2G and battery second life programs into wholesale and retail markets
supports the grid and returns the value of doing so to EV drivers. Utility policies to accelerate the EV market can be broken down into three phases, as shown in Table ES-1. Phase 1 removes barriers to EV purchases, facilitates a competitive market for third-party charging services, prepares utilities to integrate EV load, and encourages drivers to charge in a manner that avoids adverse grid impacts and maximizes their fuel cost savings relative to gasoline. Phase 2 focuses on infrastructure, equity, and education programs to accelerate the EV market and increase access to electricity as a transportation fuel. Phase 3 develops managed charging programs so that EVs can facilitate the integration of renewable energy and provide other grid services, and returns the value of such services to EV drivers to further accelerate the market.
Phase 1 presents the most pressing issues, but the foundations for Phase 2 and Phase 3 must be laid today in order to realize the long-term benefits of widespread EV adoption. Now is the time for utilities and utility regulators to act. Short-term delays could result in a near-impossible task in the future, as it takes decades to turn over the nation’s vehicle fleet. It is estimated that traffic pollution causes more than 50,000 premature deaths annually in the lower 48 states, which is more than 1.5 times the deaths from traffic accidents on an annual basis.14 The electric industry should move quickly to bring forward the environmental and economic benefits of moving America off oil—once and for good.

Page 6 DRIVING OUT POLLUTION: HOW UTILITIES CAN ACCELERATE THE MARKET FOR ELECTRIC VEHICLES NRDC
Achieving long-term greenhouse gas (GHG) reduction targets in the United States and internationally requires large-scale deployment of electric vehicles (EVs), including both pure battery electric vehicles and hybrids that can be plugged into the grid, increasingly fueled by renewable electricity. Electric utilities are singularly positioned to provide ubiquitous access to charging—while supporting the grid and facilitating its transition to variable resources like wind and solar energy, benefiting all customers, and returning value to EV drivers.
Studies show that putting the transportation sector on track to meet long-term GHG reduction goals requires greatly accelerating the sale of EVs—currently less than 1 percent of new sales—in the near term.15 Fortunately, the initial U.S. market launch of EVs has been highly successful. Over the first five years of sales, from 2011 to 2015, about 388,000 EVs were sold; that is comparable to the number of conventional hybrid electric vehicles (which cannot be plugged into the grid) sold during their first five years on the U.S. market.16 Electric vehicles have also enjoyed extremely high levels of customer satisfaction: 98 percent of Tesla Model S owners, 85 percent of Chevrolet Volt owners, and 77 percent of Nissan LEAF owners report they would definitely purchase the same vehicle again.17 Over the next couple of years, the number of models will almost double, and these next-generation models promise improved range and performance. Battery costs have been falling more rapidly than previously predicted and will continue to drop. In a period of about two weeks, almost 400,000 people put down $1,000 deposits for the next-generation, moderately priced Tesla Model 3.18
However, without major new market-transformation policies, the EV market could stall before it reaches a critical tipping point. To achieve mass commercialization, EVs must overcome three key barriers: higher initial purchase prices, concerns over lack of charging stations and range, and low consumer awareness. Utilities can accelerate the mass commercialization of EVs by reducing the cost of ownership through appropriate rate design
and compensating EV drivers for valuable grid services, deploying charging infrastructure that can act as a grid resource and reduce range anxiety, and conducting customer education and outreach.
The electric industry is one of the few that have the power to challenge the market dominance of the oil industry. Utility-scale investment is also needed to facilitate the expansion of the nascent competitive EV charging service industry. Since they provide the fuel, utilities and independent EV charging service companies play a critical role in determining the success of the EV market. With the right programs to manage charging, widespread EV adoption could benefit the entire utility system and its customers.
Electric vehicles are not the only form of fuel-switching that can reduce overall emissions, but substituting electricity for petroleum fuels has the greatest potential to reduce emissions of any electrification opportunity. Likewise, no other single customer-side resource combines the attributes of a typical EV that could be utilized to support the grid. A 2016 Nissan LEAF can store as much electricity as the average American home uses in a day, equal the instantaneous demand of several homes, and be recharged while its owner is sleeping, eating, working, or doing anything other than driving.
Utility programs that maximize the storage, power, and flexibility of EVs can benefit all utility customers. Charging EVs when there is spare grid capacity avoids the need for new capital investments and provides additional revenue without a commensurate increase in costs, thereby putting downward pressure on electricity rates. By providing valuable grid services that facilitate the integration of variable renewable resources like wind and solar, widespread EV adoption can also lower the costs of de-carbonizing the electricity sector. Achieving this promise requires the rapid adoption of major new utility programs and policies that can drive out pollution while benefiting the power grid and its customers.
A. Introduction

Page 7 DRIVING OUT POLLUTION: HOW UTILITIES CAN ACCELERATE THE MARKET FOR ELECTRIC VEHICLES NRDC
1. ELECTRIC VEHICLES AND CLEAN POWER ARE NEEDED TO SOLVE GLOBAL WARMING AND AIR POLLUTIONNumerous independent studies have come to the same conclusion: reducing global warming pollution to 80 percent below 1990 levels by 2050 will require a dramatic shift to electric vehicles powered by renewable and other zero-carbon energy sources.19 Because just 15 million to 17 million passenger vehicles are sold each year in the United States, it will take decades to transform the existing U.S. stock of 250 million vehicles. To meet long-term GHG emissions reduction targets, studies have estimated EVs will need to account for 40 percent or more of new vehicle sales by 2030.20
Electric vehicles are also increasingly needed to meet clean air standards in the most polluted areas of the country. It is estimated that traffic pollution causes more than 50,000 premature deaths annually in the lower 48 states, which is more than 1.5 times the deaths from traffic accidents on an annual basis.21 In California, regulators have concluded that broad deployment of zero- and near-zero-emissions technologies in the South Coast and San Joaquin Valley air basins will be needed between 2023 and 2032 to comply with current federal health-based air quality standards. The regulators also project that by 2040, all passenger vehicles sold in California will need to be zero-emissions vehicles.22 Major metro areas outside of California with dangerous levels of air pollution, such as Houston and Dallas, are increasingly looking to EVs to comply with federal air quality standards.23 In light of the pressing need to combat dangerous air pollution, 13 North American and European governments, including those of Germany, the United Kingdom, California, Connecticut, Maryland, and New York, signed a pact to ensure that all new vehicles sold be zero-emissions vehicles by 2050.24
2. UTILITY INVESTMENT IN CHARGING INFRASTRUCTURE IS NEEDED TO EXPAND THE ELECTRIC VEHICLE MARKETIt is becoming increasingly clear that a new model is needed to deliver the robust charging network necessary to accelerate EV adoption. Market research shows that consumers’ top four reasons for rejecting EVs were all related to lack of infrastructure or range.25 Survey analysis by the National Renewable Energy Laboratory (NREL) shows that the lack of infrastructure for alternative-fuel vehicles is as much of a barrier to adoption as incremental vehicle price.26 To date, the limited charging infrastructure that exists beyond single-family homes has generally been deployed by government, automakers, and start-up charging service companies. This model is unlikely to deliver the comprehensive network needed to meet
long-term emissions reduction goals. Electric utilities are singularly positioned to close the charging infrastructure gap. Utilities can work with third-party charging service providers to leverage existing customer relationships and their knowledge of the electric grid to capture the value of grid services provided by EVs and increased revenues from well-managed residential charging, which meets the vast majority of fueling needs.27
Recent studies have concluded that expanding charging infrastructure is critical to increasing EV adoption. As explained by the “network effect” of market diffusion, consumer valuation of EVs increases with the number of charging stations, but investors are less willing to build stations when the EV market is small (this is also known as the classic “chicken or the egg” problem). Researchers from Cornell University analyzed network effects associated with quarterly EV sales in 353 metro areas. They found that “the increased availability of public charging stations has a statistically and economically significant impact on EV adoption decisions.”28 Another recent study of global EV markets concluded that of all the factors examined, charging infrastructure was the best predictor of a country’s EV market share.29
Recent investments by automakers further illustrate the importance of infrastructure in driving increased sales. BMW, Volkswagen, and Nissan have pledged to help finance more than 1,000 publicly available stations in key U.S. markets. In Japan, Nissan, Honda, Toyota, and Mitsubishi have agreed to fund one-third of the cost of installing 12,000 public charging stations (with the balance provided by the government). According to Nissan’s market research, sufficient charging infrastructure would double the number of Leading, Environmentally-friendly, Affordable, Family (LEAF) car owners who would repurchase an EV.30 Nissan also saw a marked increase in LEAF sales in 2013 when the company deployed a large number of direct current (DC) fast charging stations at dealerships across North America and Europe.31 Similarly, Tesla officials report their DC fast charging network has been critical to growing sales of the Model S sedan.32
However, deploying charging infrastructure is not the core business of automakers. After all, automakers did not enter the gas station business to sell gasoline-powered vehicles. Likewise, while state and federal programs have supported much of the existing charging network, public funding alone will likely not be sufficient to meet the scale of the challenge.
Even California, which has been a strong supporter of infrastructure deployment and has almost 30 percent of the nation’s publicly available charging ports, still falls far short
B. The Need for Utility Electric Vehicle Programs

Page 8 DRIVING OUT POLLUTION: HOW UTILITIES CAN ACCELERATE THE MARKET FOR ELECTRIC VEHICLES NRDC
of what is needed to scale up the EV market.33 According to a study by NREL, to support 1 million EVs, California would need 125,000 to 220,000 publicly accessible charging ports (including those deployed at workplaces), a dramatic increase from the estimated 10,000 the state has today.34
To meet emissions reduction goals, we need to rapidly increase our investment in infrastructure. Unfortunately, private financing of the installation and operation of charging stations alone does not appear to be sufficient. A recent study commissioned for the state of Washington found that “charging station business models that rely solely on direct revenue from EV charging services currently are not financially feasible” and that viable business models must “capture other types of business value in addition to selling electricity.”35 The challenge is especially acute for DC fast charging stations, which have high capital costs and can be subject to demand charges meant to recover investments needed to meet peak electricity demand.
Utilities are uniquely situated to capture the system-wide benefits of a comprehensive charging network. As noted in a recent National Academies of Science study, utilities can capture the “incremental revenue from additional electricity that EV drivers consume at home, where roughly 80 percent of the charging takes place” and use that revenue to both deploy charging stations and reduce rates and bills for all customers.36
Increasing access to electricity as a transportation fuel is a natural fit for the electric industry. A multi-state survey conducted by researchers at the University of California, Davis reveals EV drivers believe utilities should lead the deployment of charging infrastructure.37 Building upon their history of helping to transform the market for energy efficiency and renewable energy, utilities are also well situated to deploy infrastructure, especially in segments where the need is greatest, such as:
Apartment Complexes and Other Multiunit DwellingsDrivers are unlikely to purchase plug-in vehicles if they cannot plug in at home, where cars are parked for 12 hours out of every day and the vast majority of driving needs can be met with overnight charging.38 Unfortunately, less than half of U.S. vehicles have reliable access to a dedicated off-street parking space at an owned residence where charging infrastructure could be installed.39 More than 80 percent of EV drivers live in single-family detached homes.40 It is essential for the EV market to move beyond the suburbs to meet long-term climate and air quality goals. Installing charging stations at apartment buildings and other multiunit dwellings could unlock the potential for a broader, younger, and more diverse market for the next generation of EVs. Utilities can leverage existing customer relationships, knowledge of the electric grid, and economies of scale to deploy charging stations in this critical but underserved market.
Workplaces and Other Long-Dwell- Time LocationsAdding charging stations to workplaces can both extend range for drivers and increase EV visibility, which can spur additional vehicle sales. Nissan credits a workplace charging initiative with a fivefold increase in monthly EV purchases by employees at Cisco Systems, Coca-Cola, Google, Microsoft, and Oracle.41 Likewise, the U.S. Department of Energy (DOE) recently concluded that employees of companies participating in its Workplace Charging Challenge were 20 times more likely to drive an EV than the average worker.42 Workplace charging can also increase electric miles driven, especially for drivers of plug-in hybrid vehicles with shorter all-electric ranges, reducing their reliance on petroleum. Utility-facilitated deployments of grid-integrated charging infrastructure at workplaces and other long-dwell-time locations such as park-and-ride commuter lots also ensure EVs are available in the afternoon to serve as a form of energy storage to absorb peak production from solar energy (see Section 4).
Public Fast ChargingNine days out of ten that a car is driven, it is driven less than 70 miles, which is well within the range of today’s pure battery electric vehicles, but the lack of fast charging infrastructure needed to make that one-in-ten trip remains a significant obstacle to the purchase of pure battery EVs.43 Drivers’ purchase decisions are often disproportionately influenced by rare use cases; for example, the off-road capability of SUVs remains a driving force behind their market dominance, even though that capability is almost never used. Consumer research shows the lack of “robust DC fast charging infrastructure is seriously inhibiting the value, utility, and sales potential” of typical pure-battery electric vehicles.44 Unfortunately, without extremely high utilization rates, it is difficult for private firms to recoup installation costs and cover operating expenses, including utility demand charges that are meant to recover grid investments needed to serve customers with high power requirements.45 As the keepers of the electric grid, utilities are singularly situated to facilitate the deployment of fast charging stations that incorporate strategies to minimize the need for additional grid investments, including managing the demand of both charging stations and other loads, as well as on- and off-site energy storage. Utility-funded researchers are also in the process of developing more efficient utility fast charging stations that require less power to deliver the same amount of electricity.46 Utilities are also uniquely able to fund the deployment of fast charging stations needed for widespread EV adoption with additional revenues derived from the residential charging that will occur as a result of greater adoption and use of EVs.

Page 9 DRIVING OUT POLLUTION: HOW UTILITIES CAN ACCELERATE THE MARKET FOR ELECTRIC VEHICLES NRDC
0
50
100
150
$200
$17.39
$33.16
$60.58
$24.17
$46.47
$84.88
Before WidespreadEV Adoption
After WidespreadEV Adoption
■ Generation■ Transmission■ Distribution
FIGURE 1: SDG&E COST OF SERVICE BEFORE AND AFTER WIDESPREAD ELECTRIC VEHICLE ADOPTION
SDG&
E Co
st of
Ser
vice
(Dol
lars
per
Meg
awat
t-hou
r)
3. WIDESPREAD AND WELL-MANAGED ELECTRIC VEHICLE CHARGING CAN BENEFIT ALL UTILITY CUSTOMERSCharging electric vehicles predominantly during off-peak electricity hours (when the electric grid is underutilized and there is plenty of spare capacity in the generation, transmission, and distribution system) allows utilities to avoid new capital investments while capturing additional revenues, lowering the average electricity cost for all their customers. This effect is the opposite of the utility “death spiral,” whereby increasing costs borne by a decreasing pool of customers causes rate increases that drive away more customers, leaving those who cannot afford distributed generation or home energy storage to pay for an aging grid.
Researchers at the Pacific Northwest National Laboratory found sufficient spare capacity in the nation’s electric grid to power virtually the entire light-duty passenger vehicle fleet, if vehicle charging load is integrated during off-peak hours and at lower power levels.47 As the grid becomes more dominated by renewable energy generation that varies depending upon the weather, time of day, and season, the amount of spare capacity may grow even larger. The same researchers also modeled impacts on the marginal cost of utility service associated with transformative transportation electrification for two utilities, Cincinnati Gas & Electric and San Diego Gas & Electric (SDG&E). The results of a 60 percent plug-in hybrid penetration scenario in SDG&E territory are illustrated in Figure 1.
These results do not reflect all the complexities of SDG&E’s systems, but the directional shift (~20 percent reduction
FIGURE 1: SDG&E COST OF SERVICE BEFORE AND AFTER WIDESPREAD ELECTRIC VEHICLE ADOPTION
FIGURE 2: PRESENT VALUE OF EV ADOPTION IN CALIFORNIA THROUGH 2030, BY RATE SCENARIO
in the cost of service) is significant. All customers would benefit from this shift in the form of lower electricity bills.
Using standard regulatory cost benefit tests, recent analysis conducted by Energy and Environmental Economics (E3) demonstrates that the body of utility customers is likely to benefit from the additional revenue provided by properly managed EV charging. Figure 2 presents results from the Ratepayer Impact Measure test, a restrictive test that fails to account for systemic benefits, for a typical California utility under typical rate structures. It reveals that, by 2030, EVs will contribute $2 billion to $8 billion more in revenue to SCE, SDG&E, PG&E and SMUD than they cost to serve, putting downward pressure on rates for all customers.
Notes: Based on California utility system, assuming charging occurs predominantly when the system is underutilized. Net revenues are positive under ”Tiered,” ”Flat,” and “TOU” (time-of-use) rate structures and a “Mixed” TOU/Tiered scenario. Under TOU rates, EV owners are rewarded for charging during hours of the day when the cost of energy is at its lowest, resulting in smaller, but still significant, net revenues.
FIGURE 2: PRESENT VALUE OF EV ADOPTION IN CALIFORNIA THROUGH 2030 BY RATE SCENARIO
REVE
NUE
COST
REVE
NUE
COST
REVE
NUE
COST
REVE
NUE
COST
PRES
ENT
VALU
E ($
IN B
ILLI
ONS)
$16
14
12
10
8
6
4
2
$0
$8.11
TIERED
$3.90$3.12
$2.26
FLAT MIXED TOU
■ Net Revenue
■ Rate Base
■ RPS Cost
■ Carbon Cost
■ Capacity Cost
■ Energy Cost
■ Utility Bills
Notes: Based on California utility system assuming charging predomi-nately occurs when the system is underutilized. “Infrastructure” is the cost of upgrading the transmission and distribution system. “Energy and Capacity” is the cost to the utility to procure electricity and add new generation capacity to the system. Net revenues are positive under ”Tiered,” ”Flat,” and “TOU” (time-of-use) rate structures, and a “Mixed” TOU/Tiered scenario. Under TOU rates, EV owners are rewarded for charging during hours of the day when the cost of energy is at its lowest, resulting in smaller, but still significant net revenues.
(Adapted from Kintner-Myer et al., 2007) 48
(Environmental and Energy Economics, California Transportation Electrification Assessment—Phase 2: Grid Impacts)49

Page 10 DRIVING OUT POLLUTION: HOW UTILITIES CAN ACCELERATE THE MARKET FOR ELECTRIC VEHICLES NRDC
To capture the potential of widespread EV adoption to benefit all customers, utilities should implement rate designs and programs to ensure EV charging occurs predominantly when there is excess capacity in the grid. SDG&E has already demonstrated that the combination of time-of-use rates and education and outreach can push 80 percent of EV charging to the hours between midnight and 5 a.m., the “super off-peak” period on the utility’s EV tariff (see Figure 7).50 Such time-of-use rates are likely sufficient to integrate EV load in the early market. However, analysis conducted by SMUD shows that more sophisticated forms of load management, such as the use of dynamic price signals or advanced demand response, will likely be needed to minimize costs and allow for net benefits as the EV market scales up.51
4. ELECTRIC VEHICLES CAN PROVIDE VALUABLE GRID SERVICESAlready highly valued by grid operators and utilities, flexible resources that keep the grid stable by ensuring electricity demand and supply remain perfectly in sync will become increasingly valuable as variable resources like wind and solar replace fossil and nuclear generation. With the right policy framework, utilities can leverage the growing customer sunk investment in EV batteries to capture this value and use it to drive additional EV sales. Rewarding EV customers for facilitating the transition to renewable energy could prove a sustainable replacement for federal and state purchase incentives that are likely to be phased out as the EV market moves beyond the early-adopter segment.
Electric Vehicles Represent a Unique Opportunity to Support the Grid American drivers have already purchased approximately 11 gigawatt-hours (GWh) of advanced battery storage in the form of EV batteries, more than enough to power all the homes in the District of Columbia on an average day.52 This sunk investment grows with every new EV purchase and represents a unique opportunity to support the electric grid. There is no other single customer-side “smart appliance” that combines the potential for immense flexibility with significant capacity for both power and storage.
Peak demand for electricity generally occurs during the early-evening hours when people return home from work, turn on the lights, crank up air conditioners, watch television, and do all the other things that require electricity—most of which can be done only when people are at home and awake. In contrast, EVs can be charged whenever they are not being driven, which is 96 percent of the average day, as shown in Figure 3, provided they have access to charging stations.
The average American drives 35 miles per day.54 Using a standard 120-volt wall outlet and the “level 1” charging cords that are provided with every EV, 35 miles’ worth of electricity can be delivered in nine hours of low-power
charging that can easily be accomplished during off-peak hours for the electricity grid. Using “level 2” charging equipment, which plugs into a 240-volt outlet (like those used by clothes dryers), 35 miles of electricity can be delivered in two hours. This provides an immense amount of flexibility, considering the typical EV is parked for 23 hours a day. That flexibility means an EV battery could satisfy typical driving needs while supporting the electric grid and providing EV drivers with significant value.
The Types of Grid Services Electric Vehicles Could ProvideImagine a vehicle that stops charging when demand for electricity peaks in the early evening and begins again late at night when most people are asleep and electricity is cheap. Now picture that EV being driven to work in the morning, charging up on excess solar generation during the afternoon, being driven home, selling electricity back to the grid when demand peaks in the evening, and then recharging again at midnight when there is an oversupply of cheap wind energy. Imagine further that after many years of service, when the battery in that EV has lost enough capacity that it no longer provides the range its driver requires, it is redeployed as a form of stationary energy storage that could be charged and discharged whenever or wherever most needed to support the grid. All of these functions are already being proved in the real world. They can be categorized as follows:
1. Traditional Demand Response: Turning charging off.
2. Advanced Demand Response: Turning charging on or off and/or changing the rate of charging.
3. Vehicle-to-Grid, or V2G: Putting electricity stored in EVs back onto the grid.
FIGURE 3: ESTIMATED PERCENTAGE OF TIME EVs SPEND BY LOCATIONFIGURE 5: MOST IMPORTANT REASONTO ACQUIRE AN ELECTRIC VEHICLE
Driving4%
Home50%
Parkedelsewhere
46%
(Adapted from Langton & Crisotomo, Vehicle-Grid Integration, California Public Utilities Commission)53

Page 11 DRIVING OUT POLLUTION: HOW UTILITIES CAN ACCELERATE THE MARKET FOR ELECTRIC VEHICLES NRDC
4. Battery Second Life: Putting electricity stored in used EV batteries redeployed in stationary applications back onto the grid.
These four functions can potentially provide the full range of services required to keep the grid stable at all levels. Supply of electricity must instantaneously and precisely match demand to prevent blackouts. Yet both demand and supply of electricity change by the second, minute, hour, day, and season. Grid operators must maintain this equilibrium, even as they integrate greater levels of variable renewable resources, like wind and solar.
This holds true across the entire electric grid, which comprises both a transmission and a distribution system operated by different entities. The transmission system moves electricity from power plants in bulk, often across state lines. It is kept in balance by independent system operators (ISOs), such as the California ISO, and regional transmission organizations (RTOs), such as PJM Interconnection, which operate wholesale energy markets. The distribution system delivers electricity from the transmission system to retail customers in homes and businesses. Its reliability is ensured by local utilities. Utilities, ISOs, and RTOs rely on the transmission and distribution system grid services to keep the whole system in balance.
Transmission System Grid Services “Day-Ahead Resources,” typically bid into wholesale
markets one day before deployment, must be able to turn on within minutes, reach full power within 30 minutes, and be maintained for about four hours. These resources are typically used only 5 to 20 days per year, often to meet peak demand from air conditioners during heat waves. “Ancillary Services” (including “Frequency Regulation” and “Spinning Reserves”) meet the instantaneous needs of the grid, requiring an immediate response for up to 30 minutes. These are called upon several times per day for around 50 days a year. For more than a century, procuring “Day-Ahead Resources” and “Ancillary Services” meant building expensive fossil-fuel power plants, called “peakers,” that sat idle most of the
year; a single typical peaker natural gas plant costs about $120 million to build at $1,200 per kW of capacity.55 In some regions, peaker plants are supplemented by “Pumped Hydro Storage” facilities that pump water uphill and use gravity to power turbines at a later time. This is by far the most widely deployed form of energy storage currently operating, but it is expensive and it has a large geographic footprint.56
Distribution System Grid Services Local utilities often rely on customer-side resources
to defer upgrades to equipment such as neighborhood transformers. To date, this has meant rewarding participating utility customers for occasionally turning things off (“Traditional Demand Response”) or firing up diesel generators during peak-demand hours. In the future, “Advanced Demand Response” programs could reward customers for allowing things to be automatically turned off, on, down, and up in a manner that still meets their needs. Customer-side energy storage resources could also provide “Power Quality” (keeping local voltage, frequency, and power stable to protect critical equipment), “Energy Arbitrage” (storing electricity during hours when it is cheap, and either using it later or selling it back to the grid when it is expensive), and “Demand Charge Mitigation” (managing on-site consumption to minimize “demand charges” on utility bills, which recover investments needed to accommodate peak demand).
As shown in Table 1, the four categories of EV functions can provide the full spectrum of grid services at both the transmission and distribution system levels.
Utility-scale projects take years to finance, permit, and construct and can be difficult to site where they are most needed. In contrast, EVs can be scaled precisely and deployed strategically to provide the full spectrum of grid services required at the transmission level by ISOs and RTOs operating wholesale markets, and at the distribution level by local utilities that interact directly with retail customers. The challenges associated with relying on vehicles, the primary purpose of which is to
TABLE 1: GRID SERVICES THAT ELECTRIC VEHICLES COULD POTENTIALLY PROVIDE, BY GRID SEGMENT
Electric Vehicle FunctionPotential Grid Services, by Grid Segment
Transmission Distribution
Traditional Demand Response: Powering charging down or off
Day-ahead resource, spinning reserve Grid upgrade deferral, demand charge mitigation
Advanced Demand Response: Powering charging down, off, on, or up
Day-ahead resource, spinning reserve, frequency regulation, one-way energy storage
Grid upgrade deferral, demand charge mitigation, energy arbitrage
Vehicle-to-Grid (“V2G”): Discharging energy stored in EVs back to the grid
Day-ahead resource, spinning reserve, frequency regulation, two-way energy storage
Grid upgrade deferral, power quality, demand charge mitigation, energy arbitrage
Battery Second Life: Deploying used EV batteries as stationary energy storage
Day-ahead resource, spinning reserve, frequency regulation, two-way energy storage
Grid upgrade deferral, power quality, demand charge mitigation, energy arbitrage

Page 12 DRIVING OUT POLLUTION: HOW UTILITIES CAN ACCELERATE THE MARKET FOR ELECTRIC VEHICLES NRDC
provide mobility, to also provide grid services can be largely mitigated with sufficient scale; with a large enough fleet, the fact that some vehicles are not available at any given moment becomes increasingly irrelevant because enough other vehicles will be available at that time.
Electric Vehicles Can Provide a Variety of Grid Support and Storage Services to Meet Unique Regional System NeedsIntegrating higher levels of renewable energy, chiefly wind and solar, will increase the demand for flexible grid resources that could be provided by EV batteries across the nation, but resources and needs will vary regionally. As shown in Figure 4, in solar-dominant California and the desert Southwest, solar generation can create an oversupply of electricity during the afternoon but does little to help meet peak demand during evening hours. Both Traditional Demand Response and Advanced Demand Response can help avoid exacerbating that evening peak, and the latter can also help absorb excess solar generation during the afternoon by ramping up EV charging. V2G and Battery Second Life (see Table 1) provide the additional benefit of selling excess solar energy stored during the afternoon back to the grid to supply peak demand during the evening (Energy Arbitrage). This regular pattern of excess solar generation during the afternoon will be most common in the spring and fall, when the biggest source of demand for electricity resources—heating or cooling of buildings—is at its lowest. Solar could provide as much as one-quarter of the regional electricity supply at these times.57
Wind energy generation often peaks during early-morning hours, when demand for electricity is typically at its lowest point because the vast majority of the population is asleep.58 EVs can be conveniently refueled while their drivers are still in bed and electricity is cheap. In 2009, BMW and the European utility Vattenfall demonstrated the potential for EVs to function as a form of Advanced Demand Response in which overnight charging was ramped up and down to match variable wind generation, integrating renewable generation while effectively lowering the emissions of the vehicles.59 However, the wind does not always blow at night, nor does it blow every day. Such varying intervals typical of onshore wind generation as well as seasonal variation in hydropower resources are shown in Figure 4 in the Rocky Mountain (top right) and Pacific Northwest (bottom right) regions. A similar pattern is likely to emerge for the wind-rich Midwest, South, and Northeast (counting both onshore and offshore generation), which also contain a sizable share of hydropower resources. In such regions, energy must often be stored for longer periods of time, requiring EV grid services such as Advanced Demand Response and V2G to be supplemented with stationary forms of energy storage, including Battery Second Life.
FIGURE 4: MODELED STORAGE NEEDS OF FOUR EXEMPLARY SUBREGIONS OF THE U.S. WESTERN GRID WITH 27 PERCENT RENEWABLES IN 2022
Note: Top line is the net generation for a 27 percent renewables scenario over a one-month period. The bottom line is the net load. The green-shaded area represents the oversupply of electricity that will be wasted if it cannot be stored and used later to power EVs or put back onto the grid when demand for electricity peaks. That need for energy storage could be met with Advanced Demand Response, V2G, or Battery Second Life programs.
SOLAR-DOMINATED REGIONS
WIND-DOMINATED REGIONS
(Energy and Environmental Economics, Inc., Investigating a Higher Renewables Portfolio Standard in California)60

Page 13 DRIVING OUT POLLUTION: HOW UTILITIES CAN ACCELERATE THE MARKET FOR ELECTRIC VEHICLES NRDC
The Potential Value of Electric Vehicle Grid ServicesThe full range of EV grid support functions is already being demonstrated in projects that are providing considerable value, especially in highly remunerative but limited ancillary services markets. However, leadership by regulators and the utilities under their jurisdiction is needed for EVs to capture the full value of facilitating the transition to a grid dominated by variable renewable resources.
PG&E and BMW have partnered in a novel pilot project that combines Traditional Demand Response and Battery Second Life to provide a flexible grid resource with a capacity of at least 100 kW. They are offering a $1,000 incentive to encourage 100 EV drivers to participate in an 18-month pilot study. Participants could earn an additional $540 by responding to day-ahead requests to curtail charging during hours when the grid is pushed to its limits. The $540 figure was derived using the tool approved by the California Public Utilities Commission to determine the value of investments deferred as the result of demand response programs. If the response rate is not high enough to reduce demand by the full 100 kW, BMW will return energy to the grid from used EV batteries redeployed in a stationary second-life application to make up the balance.61 In addition, the pilot is meant to build a technical foundation and customer interface that could be used in future Advanced Demand Response and V2G programs. BMW is also using this real-world test to determine whether sufficient value can be derived from stationary storage to justify pre-engineering battery packs to be easily redeployed in Battery Second Life applications.
In the PJM Interconnection regional wholesale market, which serves approximately 50 million people in the mid-Atlantic and Midwest states, the University of Delaware and NRG Energy have a demonstration V2G project underway, in which a fleet of EVs is charged at optimal times and returns power to the grid to provide Frequency Regulation, earning annual revenues of about $1,800 per vehicle.62 By managing the charging and discharging of the vehicles’
energy, the project is able to meet the PJM minimum 100-kW capacity required to participate in the ancillary services market.63 A similar V2G pilot at an Air Force base in Southern California, with 32 EVs that provide up to 655 kW of power to California ISO’s ancillary services market, is returning annual revenues of around $2,500 per vehicle.64 Table 2 shows per-vehicle estimates of value for pilot projects currently underway.
Questions remain as to the willingness of automakers to allow their vehicles’ batteries to be used for V2G. Likewise, the scalability of V2G remains to be seen. While today’s Frequency Regulation markets are highly remunerative, they could be saturated with as few as 136,000 EVs in the PJM market or 45,000 EVs in the California ISO region if one assumes V2G-enabled vehicles are able to return electricity to the grid at the same rate at which they charge using typical level 2 equipment plugged into 240-volt outlets.69 The market for Frequency Regulation could double or triple as more variable solar and wind energy is integrated into the generation mix. Over the longer term, however, one-way storage is likely to emerge as the greatest opportunity for drivers to earn value since it allows utilities to call upon EVs as a “dispatchable” resource to absorb low-cost wind and solar, balance the grid, and improve the utilization of the system.70
Researchers at NREL have estimated that 100 to 152 GW of energy storage will likely be needed to balance a U.S. electric grid that is based on 80 percent renewable resources by the year 2050.71 That need could theoretically be met entirely with EV batteries from as few as 10 percent of the EVs on the road in that year.72 Stand-alone energy storage on that scale could require an investment somewhere between $120 billion and $180 billion.73 Directing even some portion of that investment away from capital-intensive, utility-scale projects and toward EV drivers to provide energy storage with the batteries they have already purchased could reduce the cost of transitioning to a cleaner grid and accelerate the electrification of the transportation sector.
TABLE 2: ESTIMATED VALUE OF SELECT ELECTRIC VEHICLE PILOT PROGRAMS
Project Electric Vehicle Function Market Grid Services Estimated $/Vehicle
BMW/PG&E Pilot Traditional Demand Response California ISO
Day Ahead Resource, Spinning Reserve $360 per year65
Hypothetical at 40% Renewable Penetration
Advanced Demand Response Retail One-way Storage (storing renewable energy and using to drive later)
$850 over vehicle lifetime66
Univ. of Delaware & NRG Demonstration
V2G PJM Frequency Regulation $1,800 per year67
U.S. Dept. of Defense V2G California ISO
Frequency Regulation $2,520 per year68

Page 14 DRIVING OUT POLLUTION: HOW UTILITIES CAN ACCELERATE THE MARKET FOR ELECTRIC VEHICLES NRDC
Realizing the environmental, consumer, and grid benefits of EV adoption requires regulators to move quickly to develop new programs and policies to accelerate the market. Based on experience in the major early EV markets, the necessary utility policies can be separated into three phases, introduced in Table ES-1, repeated below, and discussed in detail in the subsections that follow.
1. REMOVING BARRIERS TO ADOPTION, ENSURING GRID RELIABILITY, AND MAXIMIZING FUEL COST SAVINGSPhase 1 removes barriers to consumer adoption, facilitates a competitive market for third-party charging services, prepares utilities to integrate EV load, and encourages drivers to charge in a manner that avoids adverse grid impacts and maximizes savings relative to gasoline. Example policies include:
Clarify that Electric Vehicle Charging Companies Will Not Be Regulated as UtilitiesRegulatory treatment of independent EV charging companies is a fundamental issue that must be decided at the state level. State codes often define the term electric utility very broadly, potentially subjecting EV charging service providers to the jurisdiction of state utility regulators. In most instances, such companies will simply act as customers of utilities and will be subject to the
terms of service, rates, and other policies adopted by state commissions. Sixteen states have adopted policies to make it clear that such companies are not subject to the full extent of utility regulatory authority. Policymakers should make it clear that companies acting as customers of utilities will not be regulated like public utilities, but they should also avoid creating sweeping exemptions that could hinder future efforts to ensure the environmental performance and integrity of the electric grid.
Inform Distribution System PlanningA fundamental tool to minimize the costs of integrating vehicle charging is timely utility notification when a customer buys an EV. In California, one of the world’s largest EV markets with more than 200,000 vehicles, costs associated with integrated EV load so far have been de minimis—only 0.1 percent of EVs have required a service line and/or distribution system upgrade.76 A detailed analysis of California’s distribution systems also reveals that, with the right policies, a mass market for EVs could be achieved without significant new investments.77 However, the instantaneous demand of a single EV can be comparable to that of an entire home, which could result in local distribution system impacts if not properly managed.78
For example, the cost of replacing a transformer on an emergency basis can be twice that of a planned upgrade.79
Therefore, regulators and utilities need to know where EVs
TABLE 3: THE THREE PHASES OF UTILITY POLICY TO ACCELERATE THE ELECTRIC VEHICLE MARKET
1. Removing Barriers to Adoption, Ensuring Grid Reliability, and Maximizing Fuel Cost Savings
Clarify that electric vehicle charging companies will not be regulated as utilities
Inform distribution system planning
Provide consistent and fair treatment of electric vehicle load
Adopt appropriate rates to maximize fuel savings and manage charging
Target customer education and outreach programs
2. Closing the Charging Infrastructure Gap and Promoting Equity
Utility-facilitated deployment of charging infrastructure
Increase access to electricity as transportation fuel in disadvantaged communities
Promote broader awareness through mass-market education and outreach
3. Capturing the Value of Grid Services and Integrating Renewable Energy
Implement traditional demand response programs for electric vehicle customers
Implement advanced demand response programs for electric vehicle customers
Integrate V2G and battery second life programs into wholesale and retail markets
C. The Three Phases of Utility Policy to Accelerate the Electric Vehicle Market
Page 15 DRIVING OUT POLLUTION: HOW UTILITIES CAN ACCELERATE THE MARKET FOR ELECTRIC VEHICLES NRDC
are charging if they are to manage the load. Four states have adopted some form of notification requirements.80 Notification is also essential to facilitate targeted customer outreach regarding EV rate options, policies, and programs. Existing utility rules generally require customers to provide notification whenever they add significant new load, but customers are often unaware of this requirement and contact their utility only if something goes wrong.81 Utilities must proactively identify EV owners. Potential sources of actionable information include automakers, auto dealers, charging equipment installers, local building permit offices, smart meter data, and state departments of motor vehicles (DMVs). Legislative changes are sometimes necessary to allow access to DMV data, which is the most comprehensive source.82
Provide Consistent and Fair Treatment of Electric Vehicle Load
Utility regulators should resist calls to implement EV-specific charges or fees. Existing utility rules are generally sufficient to recover costs associated with integrating vehicle load. There is no reason to treat EV load less favorably than comparably demanding loads such as hot tubs and air conditioners, which lack the corresponding environmental benefits.
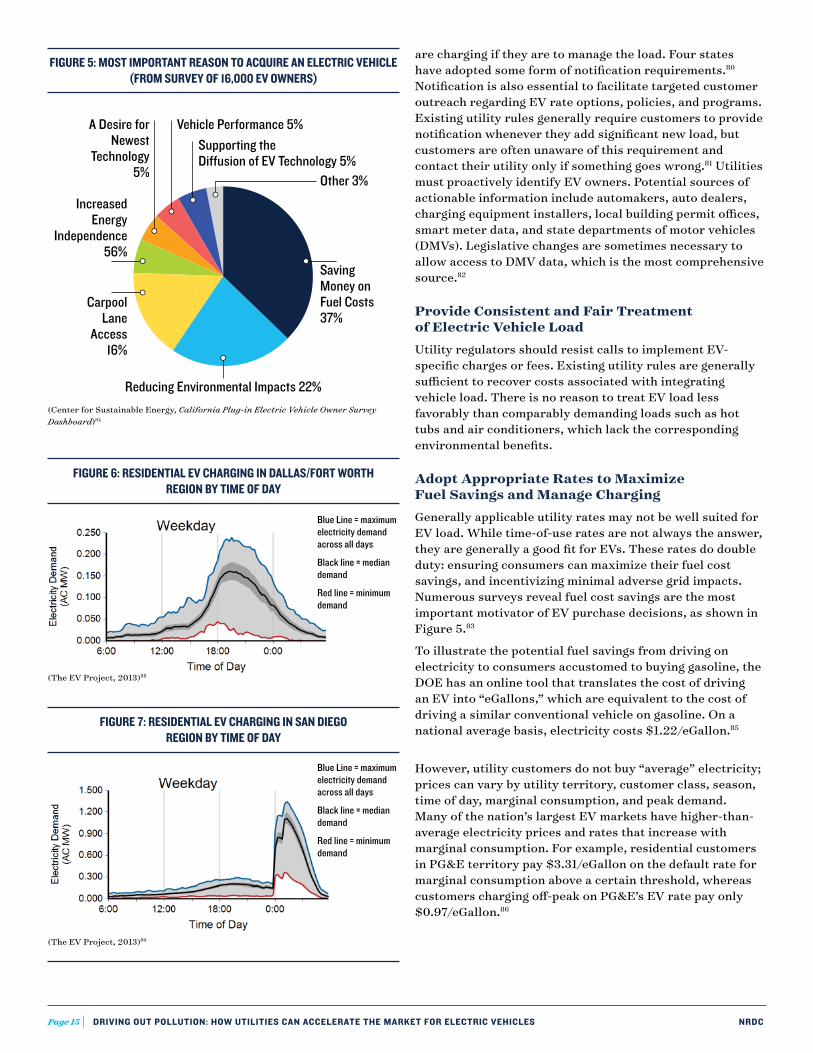
Adopt Appropriate Rates to Maximize Fuel Savings and Manage ChargingGenerally applicable utility rates may not be well suited for EV load. While time-of-use rates are not always the answer, they are generally a good fit for EVs. These rates do double duty: ensuring consumers can maximize their fuel cost savings, and incentivizing minimal adverse grid impacts. Numerous surveys reveal fuel cost savings are the most important motivator of EV purchase decisions, as shown in Figure 5.83
To illustrate the potential fuel savings from driving on electricity to consumers accustomed to buying gasoline, the DOE has an online tool that translates the cost of driving an EV into “eGallons,” which are equivalent to the cost of driving a similar conventional vehicle on gasoline. On a national average basis, electricity costs $1.22/eGallon.85
However, utility customers do not buy “average” electricity; prices can vary by utility territory, customer class, season, time of day, marginal consumption, and peak demand. Many of the nation’s largest EV markets have higher-than-average electricity prices and rates that increase with marginal consumption. For example, residential customers in PG&E territory pay $3.31/eGallon on the default rate for marginal consumption above a certain threshold, whereas customers charging off-peak on PG&E’s EV rate pay only $0.97/eGallon.86
FIGURE 5: MOST IMPORTANT REASON TO ACQUIRE AN ELECTRIC VEHICLE (FROM SURVEY OF 16,000 EV OWNERS)
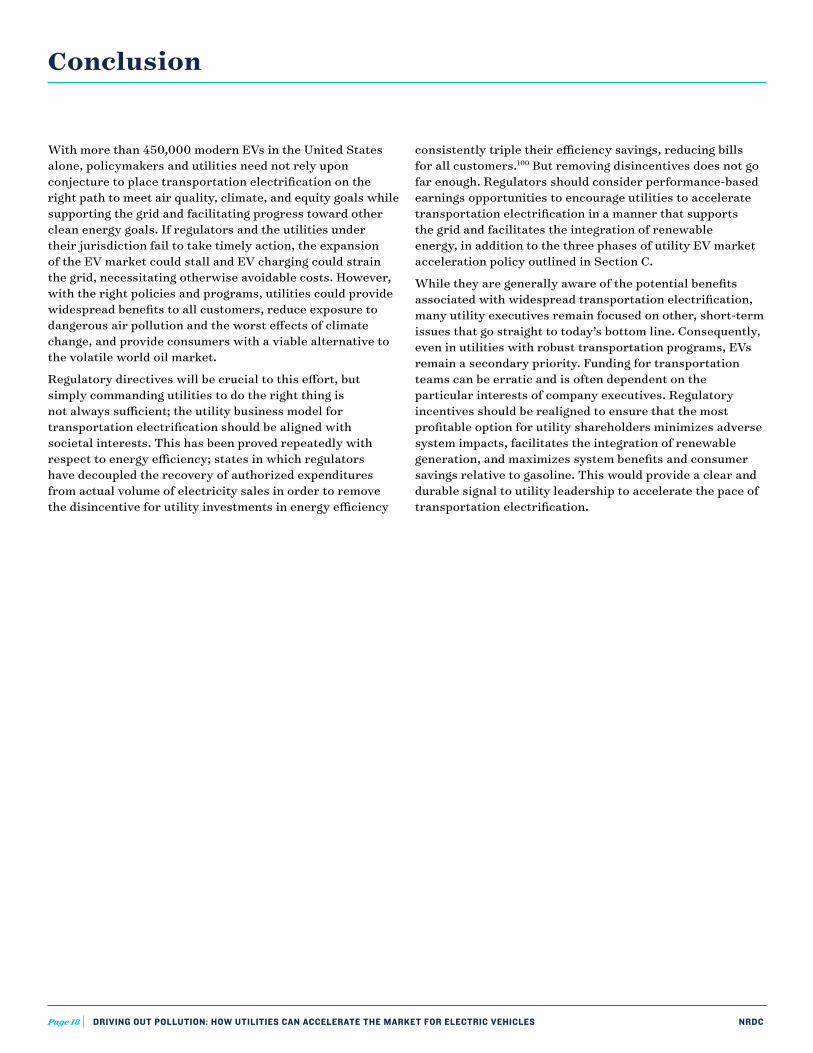
Blue Line = maximum electricity demand across all days
Black line = median demand
Red line = minimum demand
Blue Line = maximum electricity demand across all days
Black line = median demand
Red line = minimum demand
FIGURE 6: RESIDENTIAL EV CHARGING IN DALLAS/FORT WORTH REGION BY TIME OF DAY
FIGURE 7: RESIDENTIAL EV CHARGING IN SAN DIEGO REGION BY TIME OF DAY
FIGURE 5: MOST IMPORTANT REASONTO ACQUIRE AN ELECTRIC VEHICLE
Vehicle Performance 5%Supporting theDiusion of EV Technology 5%
IncreasedEnergy
Independence56%
Reducing Environmental Impacts 22%
SavingMoney onFuel Costs37%
Other 3%
CarpoolLane
Access16%
A Desire forNewest
Technology5%
(Center for Sustainable Energy, California Plug-in Electric Vehicle Owner Survey Dashboard)84
(The EV Project, 2013)88
(The EV Project, 2013)89

Page 16 DRIVING OUT POLLUTION: HOW UTILITIES CAN ACCELERATE THE MARKET FOR ELECTRIC VEHICLES NRDC
Time-of-use rates are also an important tool to encourage drivers to charge during off-peak hours when the electricity grid has spare capacity. Without a price signal, drivers will generally plug in and charge immediately upon arriving home after work, exacerbating system-wide evening peak demand, as shown in Figure 6 for the Dallas/Fort Worth area. This stands in marked contrast to the charging pattern of EV drivers in San Diego (Figure 7), who meet 80 percent of their refueling needs during the “super-off-peak” period from midnight to 5 a.m. on SDG&E’s time-of-use rate. Were EVs in Dallas on similar rates, instead of exacerbating peak demand and driving the need for additional investments, they would be charging while their drivers are asleep and when Texas’ considerable wind generation is often at peak production.87
Target Customer Education and Outreach ProgramsAt a minimum, utilities should prepare their customer service agents and modify their websites to answer common questions from new or prospective EV owners regarding home charger installation, availability of public charging, benefits of off-peak charging, fuel cost savings on applicable rates, and other issues. This can help ensure grid safety and reliability, and promote a positive consumer experience in the early market. However, a more proactive approach is needed to avoid adverse grid impacts and maximize fuel cost savings that motivate EV purchase decisions.
Even in California, where utilities have been very active with respect to vehicle electrification, the majority of customers remain unaware of the potential savings of switching to time-of-use rates. Utilities should identify and reach out to customers who would benefit financially by switching to more appropriate rates. Rate options and other programs for EV customers must be coupled with targeted customer education and outreach.
2. CLOSING THE CHARGING INFRASTRUCTURE GAP AND PROMOTING EQUITYPhase 2 focuses on robust policies and programs that can accelerate the EV market and increase access to electricity as a transportation fuel. Example policies include:
Utility-Facilitated Deployment of Charging InfrastructureAs noted in Section B, the lack of access to charging infrastructure remains a significant obstacle to widespread EV adoption. Electric utilities are singularly positioned to close the charging infrastructure gap by capturing the value of additional grid services and increased revenues from system-wide charging. Utility involvement is also necessary to ensure that the charging network is expanded in a manner that supports the grid to the benefit of all customers.
Utility leadership is especially needed in the 10 states that have adopted zero-emissions vehicle (ZEV) programs in order to meet federal air quality standards. Combined, they require about 3.3 million ZEVs by 2025, which will require a comprehensive charging network where drivers live, work, and play.
Utilities are beginning to move forward with infrastructure investments. A recent decision issued by the California Public Utilities Commission (CPUC) found agreement among charging companies, automakers, utilities, and nonprofit organizations that “utilities should have an expanded role in EV infrastructure support and development in order to realize the potential benefits of widespread EV adoption.”90
This decision allowed the CPUC to evaluate separate applications submitted by SDG&E, SCE, and PG&E to install more than 60,000 charging stations at public, workplace, and multiunit residential locations. In January 2016, the CPUC approved a modified version of the SDG&E proposal and the first phase of the SCE proposal. In March 2016, a widely supported settlement agreement was proposed in the PG&E proceeding, building on the guidance provided by the CPUC in its decisions approving the SCE and SDG&E programs.91 Meanwhile, the Washington Utilities and Transportation Commission approved a $3 million EV infrastructure deployment pilot proposed by Avista, which serves rural areas in the eastern Washington and northern Idaho. Kansas City Power and Light is also investing $20 million to install more than 1,000 public and workplace charging stations, and Georgia Power and Light has a $12 million “Get Current. Drive Electric” charging program to install 60 public charging stations with both DC fast chargers and Level 2 stations. Utilities in other states have taken notice; the majority of respondents to a recent survey of utility professionals across the nation stated their utilities are pursuing EV infrastructure deployment as a new and emerging revenue stream.92
Increase Access to Electricity as Transportation Fuel in Disadvantaged CommunitiesTo increase access to electricity as a transportation fuel in communities with the greatest need for cleaner air and lower fuel bills, utilities can target charging infrastructure investments in low-income communities and communities of color. Communities of color represent the fastest-growing consumer segment in America, and their buying power will be critical in using EVs to meet long-term air quality standards and GHG emission reduction targets.93 As noted in the Greenlining Institute’s 2011 report “Electric Vehicles: Who’s Left Stranded?” communities of color are more concerned about air pollution, making them a natural but largely untapped market for ZEVs.94 The SDG&E and SCE programs approved by the CPUC both include requirements to deploy at least 10 percent of charging stations in “disadvantaged communities,” as identified by the California

Page 17 DRIVING OUT POLLUTION: HOW UTILITIES CAN ACCELERATE THE MARKET FOR ELECTRIC VEHICLES NRDC
Environmental Protection Agency’s CalEnviroScreen 2.0, which scores census tracts using 12 types of pollution and environmental factors and seven population characteristics and socioeconomic factors.95 The settlement proposed in the PG&E proceeding requires that at least 15 percent of the charging stations be deployed in disadvantaged communities, with a stretch goal of 20 percent, and also sets aside $5 million for additional equity programs in those communities.
Promote Broader Awareness through Mass-Market Education and OutreachTo expand the EV market, a general lack of consumer awareness must be overcome and common misperceptions, often fueled by misleading press coverage, must be corrected.96 Consumers in the market for a new car need to be educated about the benefits of vehicle electrification and applicable utility rates, incentives, and programs. Utilities are better positioned to conduct this type of broad customer education effort than individual automakers seeking to promote specific vehicles, or charging service providers seeking to promote specific business models.
3. CAPTURING THE VALUE OF GRID SERVICES AND INTEGRATING RENEWABLE ENERGYPhase 3 leverages the growing customer investment in EV batteries to provide valuable grid services that can facilitate the integration of renewable energy, and return the value of such services to EV drivers to further accelerate the market. Example policies include:
Implement Traditional Demand Response Programs for Electric Vehicle CustomersTraditional Demand Response programs that either curtail or reduce the rate of charging can provide value to both the grid and EV drivers without compromising transportation needs. Such programs can be deployed today with readily available technology. As noted in Section B(4), PG&E and BMW are demonstrating this functionality in the San Francisco Bay Area, but they are not alone. Pepco (a utility serving Maryland and the District of Columbia), Eversource (a utility serving the Northeast), and SCE have all launched pilot programs to test EV charging as a form of Traditional Demand Response.97
Implement Advanced Demand Response Programs for Electric Vehicle CustomersAdvanced Demand Response programs not only curtail or reduce EV charging when necessary, but turn on and ramp up charging to absorb excess renewable generation. Although EV Advanced Demand Response does not feed power back to the grid, it is a form of energy storage that takes power off the grid for use at a later time (like
ice storage used for cooling needs), and it should not be excluded from energy storage procurement mandates. Rather, it should be valued for the services it provides.
SDG&E’s charging infrastructure deployment program, recently approved by the CPUC, includes a price-based form of Advanced Demand Response that aggregates EV charging load by deploying banks of grid-integrated charging stations at multiunit dwellings and workplaces. It is partially meant to test EV Advanced Demand Response as a form of energy storage. Participating customers charge on a real-time rate that reflects hourly wholesale market prices and are billed on their normal home energy bill. Customers can actively manage their charging by providing basic parameters (e.g., when they want the vehicle to be fully charged) or allow the system to minimize costs by absorbing cheap electricity (e.g., excess solar in the afternoon or excess wind at night) and avoiding expensive electricity during evening peak hours.
In the future, leveraging the “smarts” and communications capabilities embedded in EVs themselves may prove a cost-effective solution for Advanced Demand Response. The Electric Power Research Institute, utilities, and automakers are developing an Open Vehicle Grid Integration Platform that uses non-proprietary communications protocols and takes advantage of the connectivity in vehicles to manage EV load in response to grid conditions.98
Integrate V2G and Battery Second Life Programs into Wholesale and Retail MarketsAs noted in Section B(4), leveraging EV drivers’ sunk investment in advanced batteries to provide energy storage that both absorbs excess renewable generation and feeds electricity back to the grid during hours of peak demand could reduce the cost of integrating wind and solar resources and accelerate the EV market. However, if utilities, automakers, and other relevant parties do not act now to demonstrate V2G and Battery Second Life programs at scale, the opportunity could be lost. Significant investments in large-scale energy storage projects are already being made.99 Grid operators, utilities, and regulators should prioritize V2G and Battery Second Life programs because they could provide value to utility customers that would otherwise go to private interests and prove more cost-effective by leveraging sunk investments. They also have a unique potential to simultaneously reduce emissions in the electricity and transportation sectors.
Page 18 DRIVING OUT POLLUTION: HOW UTILITIES CAN ACCELERATE THE MARKET FOR ELECTRIC VEHICLES NRDC
consistently triple their efficiency savings, reducing bills for all customers.100 But removing disincentives does not go far enough. Regulators should consider performance-based earnings opportunities to encourage utilities to accelerate transportation electrification in a manner that supports the grid and facilitates the integration of renewable energy, in addition to the three phases of utility EV market acceleration policy outlined in Section C.
While they are generally aware of the potential benefits associated with widespread transportation electrification, many utility executives remain focused on other, short-term issues that go straight to today’s bottom line. Consequently, even in utilities with robust transportation programs, EVs remain a secondary priority. Funding for transportation teams can be erratic and is often dependent on the particular interests of company executives. Regulatory incentives should be realigned to ensure that the most profitable option for utility shareholders minimizes adverse system impacts, facilitates the integration of renewable generation, and maximizes system benefits and consumer savings relative to gasoline. This would provide a clear and durable signal to utility leadership to accelerate the pace of transportation electrification.
With more than 450,000 modern EVs in the United States alone, policymakers and utilities need not rely upon conjecture to place transportation electrification on the right path to meet air quality, climate, and equity goals while supporting the grid and facilitating progress toward other clean energy goals. If regulators and the utilities under their jurisdiction fail to take timely action, the expansion of the EV market could stall and EV charging could strain the grid, necessitating otherwise avoidable costs. However, with the right policies and programs, utilities could provide widespread benefits to all customers, reduce exposure to dangerous air pollution and the worst effects of climate change, and provide consumers with a viable alternative to the volatile world oil market.
Regulatory directives will be crucial to this effort, but simply commanding utilities to do the right thing is not always sufficient; the utility business model for transportation electrification should be aligned with societal interests. This has been proved repeatedly with respect to energy efficiency; states in which regulators have decoupled the recovery of authorized expenditures from actual volume of electricity sales in order to remove the disincentive for utility investments in energy efficiency
Conclusion

Page 19 DRIVING OUT POLLUTION: HOW UTILITIES CAN ACCELERATE THE MARKET FOR ELECTRIC VEHICLES NRDC
ENDNOTES
1 See Williams, J.H. et al., Pathways to Deep Decarbonization in the United States, Energy and Environmental Economics, Inc. (E3), November 2014; California Council on Science and Technology, California’s Energy Future: The View to 2050, May 2011; Williams, J.H. et al., “The Technology Path to Deep Greenhouse Gas Emissions Cuts by 2050: The Pivotal Role of Electricity,” Science 335, no. 6064 (January 2012): 53-59; Cunningham, Joshua, “Achieving an 80% GHG Reduction by 2050 in California’s Passenger Vehicle Fleet,” SAE International Journal of Passenger Cars—Electronic and Electrical Systems 3, no. 2 ( December 2010): 19-36; Wei, Max et al., “Deep Carbon Reductions in California Require Electrification and Integration across Economic Sectors,” Environmental Research Letters 8, no. 1 (2013); Melaina, M. and K. Webster, “Role of Fuel Carbon Intensity in Achieving 2050 Greenhouse Gas Reductions within the Light-Duty Vehicle Sector,” Environ. Sci. Technol. 45, no. 9 (2011): 3865–3871; International Energy Agency, Transport, Energy, and CO2: Moving Towards Sustainability, OECD/IEA, 2009; National Research Council, Transitions to Alternative Vehicles and Fuels (Washington, D.C.: The National Academies Press, 2013).
2 Ibid.
3 See California Air Resources Board (CARB), Vision for Clean Air: A Framework for Air Quality and Climate Planning, public review draft, June 27, 2012; and National Research Council, Transitions to Alternative Vehicles and Fuels.
4 Fehrenbacher, Katie, Tesla’s Model 3 Reservations Rise to Almost 400,000, Fortune, April 15, 2016.
5 Center for Sustainable Energy, California Plug-in Electric Vehicle Owner Survey Dashboard.
6 NREL, California Statewide Plug-in Electric Vehicle Infrastructure Assessment, prepared for the California Energy Commission, CEC-600-2014-2013, May 2014; DOE, Alternative Fuel Data Center, accessed May, 2015.
7 Committee on Overcoming Barriers to Electric-Vehicle Deployment et al., Overcoming Barriers to Deployment of Plug-in Electric Vehicles (Washington, D.C.: Na-tional Academies Press, 2015), www.nap.edu/catalog/21725/overcoming-barriers-to-deployment-of-plug-in-electric-vehicles.
8 Kintner-Meyer, M., K. Schneider, and R. Pratt, Impacts Assessment of Plug-in Hybrid Vehicles on Electric Utilities and Regional U.S. Power Grids, Pacific Northwest National Laboratory, November 2007, energyenvironment.pnnl.gov/ei/pdf/PHEV_Feasibility_Analysis_Part1.pdf.
9 Energy and Environmental Economics (E3), California Transportation Electrification Assessment, Phase 2: Grid Impacts, California Electric Transportation Coalition, October 2014, www.caletc.com/wp-content/uploads/2014/10/CalETC_TEA_Phase_2_Final_10-23-14.pdf.
10 Assuming a sales-weighted average EV battery size of 24.6 kWh, based on sales by model provided by the Alternative Fuels Data Center, and cumulative sales of 453,069 (California Plug-in Electric Vehicle Collaborative, April 2016). U.S. Department of Energy (DOE), Energy Information Administration (EIA), “District of Columbia Electricity Profile 2012,” accessed April 10, 2015, www.eia.gov/electricity/state/DistrictofColumbia/.
11 NREL, Renewable Electricity Futures Study, Table 12-7, 2013, www.nrel.gov/docs/fy12osti/52409-2.pdf.
12 Ten percent estimate derived from taking the average within the range of 15 to 23 million vehicles at level 2 charging capacity (6.6 kW) that would be needed to fulfill the 100 to 152 GW of energy storage capacity modeled by NREL, divided by 175 million EVs (including both battery electric vehicles (BEVs) and plug-in hybrid electric vehicles [PHEVs]) modeled out to 2050 in National Research Council, Transitions to Alternative Vehicles and Fuels, Appendix H, Figure H. 13, “Vehicle Stock by Vehicle Technology Assuming Optimistic PEV Technology Estimates,” 2013, www.nap.edu/download.php?record_id=18264#.
13 Using the current cost estimate of $1,200/kW for a peaker plant as a proxy ceiling price for utility-scale energy storage capacity cost. See California Energy Commission, Estimated Cost of New Renewable and Fossil Generation in California, CEC-200-2014-003-SF, March 2013, p. 140, Table 59, “Mid Case” Capital Cost for Combustion Turbine 100 MW.
14 See Caiazzo, Fabio et al., “Air Pollution and Early Deaths in the United States,” Atmospheric Environment 79 (November 2013): 198-208; National Highway Traffic Safety Administration, Fatality Analysis Reporting System (FARS) Encyclopedia.
15 See Williams, J.H. et al., Pathways to Deep Decarbonization in the United States, Energy and Environmental Economics, Inc. (E3), November 2014; California Council on Science and Technology, California’s Energy Future: The View to 2050, May 2011; Williams, J.H. et al., “The Technology Path to Deep Greenhouse Gas Emissions Cuts by 2050: The Pivotal Role of Electricity,” Science 335, no. 6064 (January 2012): 53-59; Cunningham, Joshua, “Achieving an 80% GHG Reduction by 2050 in California’s Passenger Vehicle Fleet,” SAE International Journal of Passenger Cars—Electronic and Electrical Systems 3, no. 2 ( December 2010): 19-36; Wei, Max et al., “Deep Carbon Reductions in California Require Electrification and Integration across Economic Sectors,” Environmental Research Letters 8, no. 1 (2013); Melaina, M. and K. Webster, “Role of Fuel Carbon Intensity in Achieving 2050 Greenhouse Gas Reductions within the Light-Duty Vehicle Sector,” Environ. Sci. Technol. 45, no. 9 (2011): 3865–3871; International Energy Agency, Transport, Energy, and CO2: Moving Towards Sustainability, OECD/IEA, 2009; National Research Council, Transitions to Alternative Vehicles and Fuels (Washington, D.C.: The National Academies Press, 2013).
16 See DOE, Alternative Fuels Data Center, www.afdc.energy.gov/.
17 See Kane, Mark, “Consumer Reports: Tesla Model S Rated #1 in Consumer Satisfaction,” Inside EVs, 2015, insideevs.com/consumer-reports-tesla-model-s-rated-1-in-customer-satisfaction/.
18 Fehrenbacher, Katie, Tesla’s Model 3 Reservations Rise to Almost 400,000, Fortune, April 15, 2016.
19 See Williams, J.H. et al., Pathways to Deep Decarbonization in the United States, Energy and Environmental Economics, Inc. (E3), November 2014; California Council on Science and Technology, California’s Energy Future: The View to 2050, May 2011; Williams, J.H. et al., “The Technology Path to Deep Greenhouse Gas Emissions Cuts by 2050: The Pivotal Role of Electricity,” Science 335, no. 6064 (January 2012): 53-59; Cunningham, Joshua, “Achieving an 80% GHG Reduction by 2050 in California’s Passenger Vehicle Fleet,” SAE International Journal of Passenger Cars—Electronic and Electrical Systems 3, no. 2 ( December 2010): 19-36; Wei, Max et al., “Deep Carbon Reductions in California Require Electrification and Integration across Economic Sectors,” Environmental Research Letters 8, no. 1 (2013); Melaina, M. and K. Webster, “Role of Fuel Carbon Intensity in Achieving 2050 Greenhouse Gas Reductions within the Light-Duty Vehicle Sector,” Environ. Sci. Technol. 45, no. 9 (2011): 3865–3871; International Energy Agency, Transport, Energy, and CO2: Moving Towards Sustainability, OECD/IEA, 2009; National Research Council, Transitions to Alternative Vehicles and Fuels (Washington, D.C.: The National Academies Press, 2013).
20 See California Air Resources Board (CARB), Vision for Clean Air: A Framework for Air Quality and Climate Planning, public review draft, June 27, 2012; and National Research Council, Transitions to Alternative Vehicles and Fuels.
21 See Caiazzo, Fabio et al., “Air Pollution and Early Deaths in the United States,” Atmospheric Environment 79 (November 2013): 198-208; National Highway Traffic Safety Administration, Fatality Analysis Reporting System (FARS) Encyclopedia.
22 CARB, Vision for Clean Air.
23 Nichols et al., “Air Quality Impacts of Electric Vehicle Adoption in Texas,” Transportation Research Part D: Transport and Environment 34 (January 2015): 208-218.
24 Office of Governor Edmund Brown, “Day 4: UN Climate Change Conference: Governor Brown Highlights Bold Subnational Action at COP 21 Events,” press release, December 8, 2015, www.gov.ca.gov/news.php?id=19235.
25 Peterson, David, “1700 Fast Chargers by 2016,” presentation to the California PEV Collaborative, Nissan North America, March 10, 2015, slide 6 citing survey by PG&E and RDA Group, 2014.
26 Malaina, M., Y. Sun, and A. Brooker, “Vehicle Attributes and Alternative Fuel Station Availability Metrics for Consumer Preference Modeling,” NREL Transportation Center, presented at Energy Commission Workshops, Sacramento, California, March 19, 2015.

Page 20 DRIVING OUT POLLUTION: HOW UTILITIES CAN ACCELERATE THE MARKET FOR ELECTRIC VEHICLES NRDC
27 Idaho National Laboratory, 2013 EV Project Electric Vehicle Charging Infrastructure Summary Report, January 2013 through December 2013.
28 Li, S. et al., “The Market for Electric Vehicles: Indirect Network Effects and Policy Impacts,” Cornell University, June 2015.
29 Sierzchula, W. et al., “The Influence of Financial Incentives and Other Socio-Economic Factors on Electric Vehicle Adoption,” Energy Policy 68 (May 2014): 183-194.
30 Peterson, David, “1700 Fast Chargers.”
31 Rovito, M., “Will Nissan’s No Charge to Charge Program Drive LEAF Sales?” Charged Electric Vehicles Magazine, July 3, 2014.
32 Lankton, Cal, Director of EV Infrastructure, Tesla Motor Company, “Plenary Panel: Technology Marches On—The Impact of New Vehicle and Infrastructure Technologies,” EPRI Plug-in 2014 conference, San Jose, California, July 2014.
33 DOE, Alternative Fuel Data Center, accessed March 26, 2015.
34 NREL, California Statewide Plug-in Electric Vehicle Infrastructure Assessment, prepared for the California Energy Commission, CEC-600-2014-2013, May 2014; DOE, Alternative Fuel Data Center, accessed May, 2015.
35 Nigro, N. and Frades, M. Business Models for Financially Sustainable EV Charging Networks, Center for Climate and Energy Solutions, March 2015.
36 Committee on Overcoming Barriers to Electric-Vehicle Deployment et al., Overcoming Barriers to Deployment of Plug-in Electric Vehicles.
37 Electric Power Research Institute (EPRI), “Plug-In Electric Vehicle Multi-State Market and Charging Survey,” Product Abstract, www.epri.com/abstracts/Pages/ProductAbstract.aspx?ProductId=000000003002002931.
38 See Figure 3 of this report, “Estimated Percent of Time EVs Spend by Location”; see also Alexander, Marcus, Transportation Statistics Analysis for Electric Transportation, EPRI, December 2011.
39 Traut, Elizabeth et al., “US Residential Charging Potential for Electric Vehicles,” Transportation Research Part D 25 (November 2013): 139-145.
40 Center for Sustainable Energy, California Plug-in Electric Vehicle Owner Survey Dashboard.
41 White, Brandon, Senior Manager of EV Sales Operations, Nissan North America, “Taking the ‘Work’ Out of Workplace Charging,” presentation at EPRI Plug-in 2014 conference, San Jose, California, July 2014.
42 DOE, Workplace Charging Challenge—Progress Update 2014: Employers Take Charge, November 2014.
43 Alexander, Marcus, Transportation Statistics Analysis for Electric Transportation.
44 Hajjar, Norman, New Survey Data: BEV Drivers and the Desire for DC Fast Charging, California Plug-in Electric Vehicle Collaborative, March 11, 2014.
45 Beauregard, Garrett, Lessons Learned on the EV Project and DC Fast Charging, EV Project presentation at Navigant Research webinar, Fast DC Charging for Electric Vehicles, April 9, 2013.
46 See EPRI, Fast Charging Technology.
47 Kintner-Meyer, M., K. Schneider, and R. Pratt, Impacts Assessment of Plug-in Hybrid Vehicles.
48 Ibid.
49 Environmental and Energy Economics, California Transportation Electrification Assessment.
50 Idaho National Laboratory, 2013 EV Project Electric Vehicle Charging Infrastructure Summary Report, January 2013 through December 2013.
51 Berkheimer, J. et al., “Electric Grid Integration Costs for Plug-In Electric Vehicles,” SAE Int. J. Alt. Power 3, no. 1 (2014), doi:10.4271/2014-01-0344.
52 Assuming a sales-weighted average EV battery size of 24.6 kWh, based on sales by model provided by the Alternative Fuels Data Center, and cumulative sales of 453,069 (California Plug-in Electric Vehicle Collaborative, April 2016). U.S. Department of Energy (DOE), Energy Information Administration (EIA), “District of Columbia Electricity Profile 2012,” accessed April 10, 2015, www.eia.gov/electricity/state/DistrictofColumbia/.
53 Chart adapted from Adam Langton and Noel Crisotomo, Vehicle-Grid Integration, California Public Utilities Commission, October 2013., www.cpuc.ca.gov/WorkArea/DownloadAsset.aspx?id=7744.
54 From 1970 to 2008: U.S. Department of Transportation, Federal Highway Administration, Highway Statistics 2009, 2011, Table VM-1 and annual. From 2009 on, see Appendix A for Car/Light Truck Shares. (Additional resources: www.fhwa.dot.gov.)
55 California Energy Commission, Estimated Cost of New Renewable and Fossil Generation in California.
56 NREL, Renewable Electricity Futures Study, 12-16, 2013. www.nrel.gov/docs/fy12osti/52409-2.pdf.
57 Energy and Environmental Economics, Inc. (E3), Investigating a Higher Renewables Portfolio Standard in California, January 2014.
58 See Electric Reliability Council of Texas (ERCOT), Wind Integration Report, May 17, 2014.
59 Vattenfall AG, Klimaentlastung durch den Einsatz erneuerbarer Energien im Zusammenwirken mit emissionsfreien Elektrofahrzeugen (“Climate Change Mitigation Through Usage of Renewable Energy Sources in Combination with Emission Free Electric Vehicles”), March 2011.
60 Energy and Environmental Economics, Inc., (E3), Investigating a Higher Renewables Portfolio Standard in California.
61 These batteries were taken out of a fleet of preproduction vehicles used for several years by real-world customers.
62 New York State Energy Research and Development Authority (NYSERDA), Compilation of Utility Commission Initiatives Related to Plug-in Electric Vehicles and Electric Vehicle Supply Equipment, April 2013, www.nyserda.ny.gov/-/media/Files/Publications/Research/Transportation/Compilation-Utility-Commission-Initiatives-Plug-acc.pdf.
63 Shepard, Scott and Gartner, John, Vehicle to Grid Technologies, Navigant Research, 2013.
64 Gorguinpour, Camron, DOD, Office of the Assistant Secretary of the Air Force, “Plug-In Electric Vehicle Program: The DOD V2G Pilot Project Overview,” 2013, electricvehicle.ieee.org/files/2013/03/DoD-Plug-In-Electric-Vehicle-Program.pdf.
65 Annual value is calculated based on the 18-month pilot estimated to return a total of $540 per vehicle over that period, and multiplying by 2/3 (12 months/18 months) to equal $360 per year.
66 Energy and Environmental Economics (E3), California Transportation Electrification Assessment Phase 2.
67 It is important to note that the estimated average of $1,800 per year per vehicle was based on a small fleet of 15 vehicles that were part of a closely managed duty cycle and usage reservation system. Therefore we caution against making broader conclusions from this pilot about the V2G value stream for a more broadly applicable scenario involving more random driving cycles with different vehicle types and charging capacities. Wald, Matthew L., “Electric Vehicles Begin to Earn Money from the Grid,” New York Times, April 25, 2013, www.nytimes.com/2013/04/26/business/energy-environment/electric-vehicles-begin-toearn-money-from-the-grid.html.

Page 21 DRIVING OUT POLLUTION: HOW UTILITIES CAN ACCELERATE THE MARKET FOR ELECTRIC VEHICLES NRDC
68 It is important to note that the estimated average of $2,520 per year per vehicle was based on a vehicle fleet that includes EV-retrofitted mid-sized trucks that were used for daily-patterned duty cycles and on a managed reservation system. Thus we caution in making broader conclusions from this pilot about the V2G value stream for a more broadly applicable scenario involving more random driving cycles with different vehicle types charging capacities. Gorguinpour, Camron, DOD, Office of the Assistant Secretary of the Air Force, “Plug-In Electric Vehicle Program: The DOD V2G Pilot Project Overview,” 2013, electricvehicle.ieee.org/files/2013/03/DoD-Plug-In-Electric-Vehicle-Program.pdf.
69 A general rule of thumb used to determine the market demand for frequency regulation in a given regional grid today is to take 1 percent of the average total capacity. Thus for a California ISO that has an average system capacity of around 30 GW, the demand for frequency regulation is on average around 300 MW; likewise, for the PJM market the average system capacity is around 90 GW, and therefore the average demand for frequency regulation is around 900 MW. The average level 2 charging capacity standard is 6.6 kW. See Monitoring Analytics, State of the Market Report for PJM, 2014. www.monitoringanalytics.com/reports/PJM_State_of_the_Market/2014/2014-som-pjm-volume2-sec3.pdf.
70 According to modeled estimates from Denholm, P. et al., “The Impact of Wind and Solar on the Value of Energy Storage,” NREL, 2013, www.nrel.gov/docs/fy14osti/60568.pdf.
71 NREL (2013) Renewable Electricity Futures Study, Table 12-7.
72 Ten percent estimate derived from taking the average within the range of 15 to 23 million vehicles at level 2 charging capacity (6.6 kW) that would be needed to fulfill the 100 to 152 GW of energy storage capacity modeled by NREL, divided by 175 million EVs (including both battery electric vehicles (BEVs) and plug-in hybrid electric vehicles [PHEVs]) modeled out to 2050 in National Research Council, Transitions to Alternative Vehicles and Fuels, Appendix H, Figure H. 13, “Vehicle Stock by Vehicle Technology Assuming Optimistic PEV Technology Estimates,” 2013, www.nap.edu/download.php?record_id=18264#.
73 Using the current cost estimate of $1,200/kW for a peaker plant as a proxy ceiling price for utility-scale energy storage capacity cost. See California Energy Commission, Estimated Cost of New Renewable and Fossil Generation in California, CEC-200-2014-003-SF, March 2013, p. 140, Table 59, “Mid Case” Capital Cost for Combustion Turbine 100 MW.
74 Center for Climate and Energy Solutions (C2ES), “Who Can Own/Operate a Charging Station,” accessed March 24, 2015, www.c2es.org/initiatives/pev/maps/who-can-own-operate-a-charging-station.
75 California Public Utilities Code Section 216(i) strikes an appropriate balance.
76 See California Auto Outlook 12, no. 1 (February 2016); Pacific Gas & Electric, San Diego Gas & Electric, Southern California Edison, Joint IOU Electric Vehicle Load Research Report 4th Report, filed December 24, 2015. http://docs.cpuc.ca.gov/PublishedDocs/Efile/G000/M158/K122/158122370.PDF.
77 Energy and Environmental Economics (E3), California Transportation Electrification Assessment Phase 2.
78 Today’s EVs are generally capable of charging at 1.2, 3.3, or 6.6 kilowatts, a range that is comparable to the range in peak summer demand between typical California coastal and inland homes, according to Pacific Gas & Electric.
79 California Public Utilities Commission, Joint IOU Assessment Report for EV Notification, Rulemaking 09-08-009 (2011), at 27.
80 C2ES, “PEV Integration with Electrical Grid,” accessed March 24, 2015, www.c2es.org/initiatives/pev/maps/pev-integration-with-electrical-grid.
81 California Public Utilities Commission, Joint IOU Assessment Report for EV Notification, Rulemaking 09-08-009 (2011), at 27.
82 See California Senate Bill 859 (Padilla, 2011).
83 Center for Sustainable Energy, California Plug-in Electric Vehicle Owner Survey Dashboard; Steele, David E., J.D. Power and Associates, “Predicting Progress: What We Are Learning About Why People Buy and Do Not Buy EVs,” Electric Drive Transportation Association 2013 Annual Meeting, Washington, D.C., June 11, 2013; Maritz Research, “Consumers’ Thoughts, Attitudes, and Potential Acceptance of Electric Vehicles,” National Research Council meeting, Washington, D.C., August 13, 2013.
84 Center for Sustainable Energy, California Plug-in Electric Vehicle Owner Survey Dashboard.
85 Using Department of Energy eGallon assumptions and methodology (electric vehicle efficiency of 0.35 kilowatt-hour/mile and conventional vehicle fuel economy of 28.2 miles per gallon).
86 This margin will decrease with recently adopted default residential rates.
87 See ERCOT, Wind Integration Report.
88 Idaho National Laboratory, 2013 EV Project Electric Vehicle Charging Infrastructure Summary Report, January 2013 through December 2013.
89 Ibid.
90 California Public Utilities Commission, “Phase 1 Decision Establishing Policy to Expand the Utilities’’ Role in Development in Electric Vehicle Infrastructure,” Deci-sion 14-12-079, December 18, 2014.
91 See Baumhefner, Max, “Proposal to Charge Electric Cars in Southern California Gets the Green Light,” Natural Resources Defense Council (NRDC), January 14, 2016; Baumhefner, Max, “San Diego Gas & Electric to Use Electric Cars to Integrate Renewable Energy,” NRDC, January 28, 2016; Agreement Proposed to Deploy Charging Stations for Electric Cars in Northern and Central California, Medium, March 21, 2016.
92 Utility Dive, 2016 State of the Electric Utility Survey, p. 11.
93 See generally Treuhaft, S., J. Scoggins, and J. Tran, “The Equity Solution: Racial Inclusion Is Key to Growing a Strong New Economy,” PolicyLink, October, 2014.
94 Song, C.C., “Electric Vehicles: Who’s Left Stranded?” Greenlining Institute, August 2011, p. 4.
95 The U.S. Environmental Protection Agency has developed a similar national tool: www2.epa.gov/ejscreen.
96 See Krause, R.M. et al., “Perception and Reality: Public Knowledge of Plug-In Electric Vehicles in 21 U.S. Cities,” Energy Policy 63 (December 2013): 433-440.
97 Itron, “Pepco Deploys Itron and ClipperCreek Electric Vehicle Smart Charging Solution,” press release, November 6, 2014, www.itron.com/na/newsAndEvents/Pages/Pepco-Deploys-Itron-and-ClipperCreek-Electric-Vehicle-Smart-Charging-Solution.aspx; Rivera-Linares, Corina, “NSTAR Electric to Kick Off Vehicle Program,” Electric Light & Power/PowerGrid International, June 27, 2014, www.elp.com/articles/2014/06/nstar-electric-to-kick-off-electric-vehicle-program.html; California Public Utilities Commission, Advice Letter 2746-E, January 3, 2013, www.sce.com/NR/sc3/tm2/pdf/2746-E.pdf.
98 See EPRI, “Unified Plug-in Electric Vehicle (PEV) to Smart Grid Integration Approach Within Automotive and Utility Industries,” Product Abstract, December 2013.
99 Kelly-Detwiler, Peter, “Storage Industry Celebrates Big Win in California,” Forbes, November 5, 2014.
100 Kushler, Martin, “IRP vs. EERS: There’s One Clear Winner Among State Energy Efficiency Policies,” American Council for an Energy-Efficient Economy (ACEEE), December 16, 2014, aceee.org/blog/2014/12/irp-vs-eers-there%E2%80%99s-one-clear-winner-.