report brl-mr-3992 brl · report documentation page form no. approved0704-018 public reporting...
TRANSCRIPT
BRI-,3m
AD-A254 142
MEMORANDUM REPORT BRL-MR-3992
BRLAN EXPERIMENTAL FACILITY FOR
PACKED AND FLUIDIZED BED STUDIES
CSABA K. ZOLTANI
JULY 1992 A, 9
APPROVED FOR PUBLIC RELEASE; DISTRIBUTION IS UNLIMITED.
U.S. ARMY LABORATORY COMMAND
BALLISTIC RESEARCH LABORATORYABERDEEN PROVING GROUND, MARYLAND
V 92-21855

NOTICES
Destroy this report when it is no longer needed. DO NOT return it to the originator.
Additional copies of this report may be obtained from the National Technical Information Service,U.S. Department of Commerce, 5285 Port Royal Road, Springfield, VA 22161.
The findings of this report are not to be construed as an official Department of the Army position,unless so designated by other authorized documents.
The use of trade names or manufacturers' names in this report does not constitute indorsementof any 'commercial product.

Form ApprovedREPORT DOCUMENTATION PAGE No. 0704-018
Public reporting burden for this collection of information is estimated to average I hour per response, ncluding the time for reviewing instructions, searching enistcng daca sources.gathering and maintaining the data needed, and completing and reviewing the collection of information. Send comments regarding this burden estimate or any other aspect of thiscollection of information, including suggestions for reducing this burden to Washington HeadQuarters Services. Oirectorate for information Operations and Reports. 1215 effersonDavis ',ghway. Suite 1204. Arlington. VA 22202-1302. and to the Office of Management and Rudget. Paperwork Reduction Project (0704-0188). Washington. DC 20503.
1. AGENCY USE ONLY (Leave blank) 2. REPORT DATE 3. REPORT TYPE AND DATES COVEREDJuly 1992 Fma, Jim 91 - Feb 92
4. TITLE AND SUBTITLE S. FUNDING NUMBERS
An Experimental Facility for Packed and Fluidized Bed Studies PR: IL161102AH43V
G. AUTHOR(S)
C. K. Zolani
7. PERFORMING ORGANIZATION NAME(S) AND ADORESS(ES) 8. PERFORMING ORGANIZATIONREPORT NUMBER
9. SPONSORING/MONITORING AGENCY NAME(S) AND ADDRESS(ES) 10. SPONSORING/MONITORINGAGENCY REPORT NUMBER
U.S. Army Ballistic Research LaboratoryATIIN: SLCBR-DD-T BRL-M4R-3992Aberdeen Proving Ground, MD 21005-5066
11. SUPPLEMENTARY NOTES
12a. DISTRIBUTION / AVAILABILITY STATEMENT 12b. DISTRIBUTION CODE
Approved for public release; distribution is unlimited.
13. ABSTRACT (Maximum 200 words)
The design of an experimental facility for the study of drag resistance in stationary and fluidized gunpropellant beds is described. It establishes the capability for the simulation of flows at five times the Reynoldsnumber and in tubes of four times the cross-sectional area heretofore reported. The design makes possible forthe first time, at Reynolds numbers encountered in a ballistic packed bed, unlimied running times. Inaddition, transient flow conditions can also be simulated.
14. SUBJECT TERMS 15. NUMBER OF PAGESfluidized bed prcesse, ballistics, packed beds, flow measurement, Reynolds number 16. PRICE 36
bed~~~~~6 PRcessbllsic, bes CODE
17. SECURITY CLASSIFICATION 18. SECURITY CLASSIFICATION 19. SECURITY CLASSIFICATION 20. LIMITATION OF ABSTRACTOF REPORT OF THIS PAGE OF ABSTRACTUNCLASSIFIED UNCLASSIFIED UNCLASSIFIED SAR
NSN 7540-01-280-5500 Standard Form 298 (Rev 2-89)
Prescribed by ANSI Std 39-18298-102
INTENToNALLY LEFr BLANK.

TABLE OF CONTENTS
Page
LIST OF FIGURES .............................................. v
LIST OF TABLES ................................................. V
ACKNOWLEDGMENTS .......................................... vii
1. INTRODUCTION ............................................... 1
2. REQUIREMENTS OF THE NEW TEST FACILITY ....................... 3
3. DESIGN OF THE FLOW RIG ...................................... 4
3.1 Background ................................................. 43.2 Specification of the Components ................................... 73.2.1 Straight Pipe Section ........................................ 73.2.2 Loss at an Orifice .......................................... 113.2.3 Flow Straightener .......................................... 113.2.4 Perforated Plates and Baffles .................................. 133.2.5 Screens ................................................. 133.2.6 Test Bed ................................................ 143.2.7 Sonic Nozzle ....... ..................................... 143.2.8 The Choice for a High Pressure Gas Source ........................ 143.2.9 Optical Access .......... .................................. 163.2.10 Tube Material Strength ...................................... 16
4. RESULTS .................................................... 17
5. CONCLUSIONS ................................................ 17
6. REFERENCES .................................................. 19
APPENDIX: THE BLOWDOWN PROCESS ............................ 21
LIST OF SYM BOLS ............................................. 25
DISTRIBUTION LIST ............................................ 27
iii!1

INTENTIONALLY LEFr BLANK.
iv

LIST OF FIGURES
Figure Page
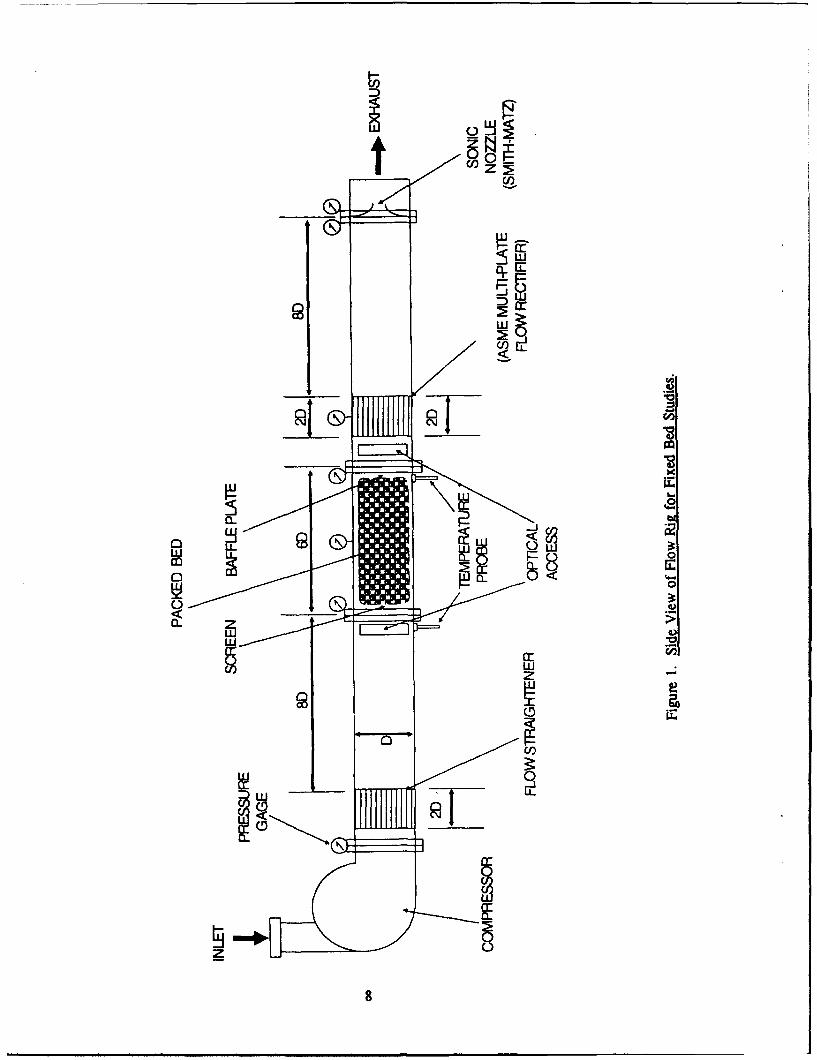
1. Side View of Flow Rig for Fixed Bed Studies ............................ 8
2. Instrumentation for Laser Doppler Anemometry (LDA) Velocity Field Analysis( op V iew ) ................................................... 9
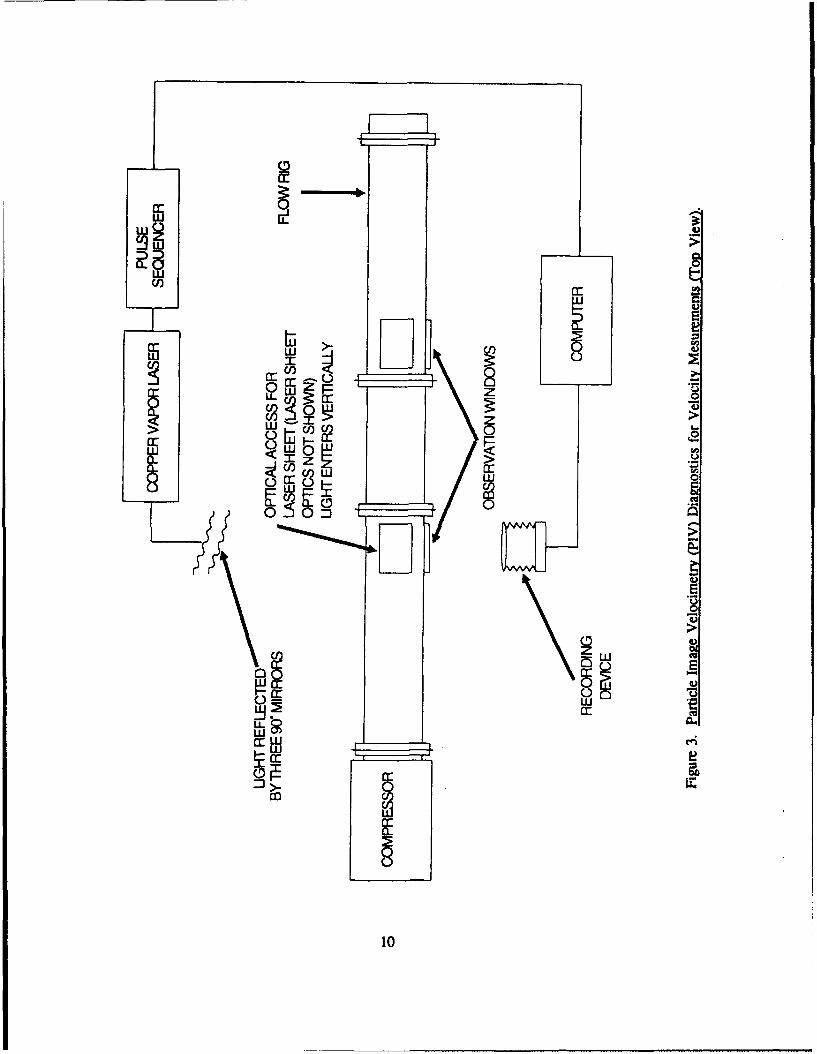
3. Particle Image Velocimetry (PIV) Diagnostics for Velocity Measurements(Top V iew ) ................................................... 10
LIST OF TABLES
Table Page
1. Packed Bed Simulators ............................................ 1
2. Drag Correlations in Use ........................................... 2
3. Pressure Loss Summary ........................................... 15
M, C QT7 AL T77 ,:E 5
I Accession For
STIS GRA&IDTI? TAP 0
By
Dist l
vIV Y ;.. ..

INTENToNALLY LEFr BLANK.
ACKNOWLEDGMENTS
It is a pleasure to thank Mr. Fred Robbins, Ballistic Research Laboratory (BRL), for sharing his
experience related to fixed bed resistance experiments. Thanks are also due to Ms. Liz Marcou, BRL, for
drawing the figures.
vii

INTENTIONALLY LEFr BLANK.
viii

1. INTRODUCTION
Gun performance predictions rely on the availability of packed and fluidized bed drag data. Due to
the difficulty and cost, only a very limited amount of exoerimental bed drag data is available at the present
time. To fill this gap, a new flow rig, which allows routine data generation under a wide variety of
conditions, was designed.
The resistance to flow through packed beds has many industrial applications and has received wide
attention. Some of its relevance to the ballistic problem has been summarized recently in Zoltani (1991).
Industrial interest usually centers on low velocity flows and, therefore, the experimental results must be
interpreted with caution when used in a ballistic context. Current practice has its antecedents in the
research of Forchheimer (1901) and Ergun (1952) and is basically an attempt to record pressures on the
walls of the container of the packed bed. Cold flow experiments of interest to ballisticians have been
reported by Jones and Krier (1983), Wilcox and Krier (1980), Kuo and Nydegger (1978) and Robbins and
Gough (1978) (see Zoltani [1991, Tables 1 and 2]).
Table 1. Packed Bed Simulators
Bed Test Section ParticleReference Diameter Length Scale D/dP p.. Remark
(cm) (cm) (cm) (MPa)
Ergun 2.54 20.0 0.02-0.10 25-111 - glass, lead(1952) shot
Kuo et al. 0.77 30.0 0.0826 9.3 14.0 WC 870(1978) ball
Robbins et 7.62 93.0 1.39-30.3 9.6-60 20.0 perfal. (1978)
Jones et al. 2.54-5.08 20.3 0.96-6.0 8.5-50 2.5 glass beads(1983)
proposed 15.24 100.0 1 cm up 15 7.0work
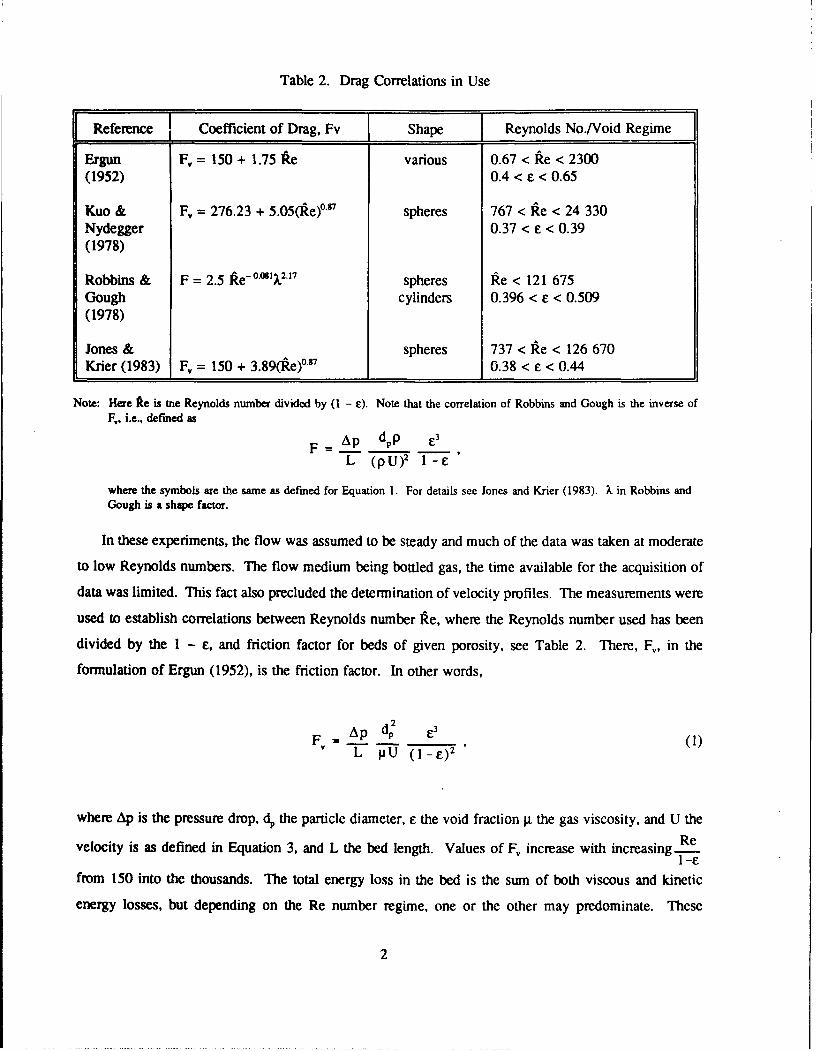
Table 2. Drag Correlations in Use
Reference Coefficient of Drag, Fv Shape Reynolds No./Void Regime
Ergun F, = 150 + 1.75 Ae various 0.67 < ke < 2300(1952) 0.4 < £ < 0.65
Kuo & F, = 276.23 + 5.05(1ke)orl spheres 767 < lie < 24 330Nydegger 0.37 < e < 0.39(1978)
Robbins & F = 2.5 Ike-°u1X2,2 17 spheres Re < 121 675Gough cylinders 0.396 < c < 0.509(1978)
Jones & spheres 737 < lAe < 126 670Krier (1983) F, = 150 + 3.89(1te)0 0.38 < e < 0.44
Note: Here Ae is tne Reynolds number divided by (I - c). Note that the correlation of Robbins and Gough is the inverse ofF,, i.e., defined as
F=Ap dpp E3
L (pU) 2 1 '="
where the symbols are the same as defined for Equation 1. For details see Jones and Krier (1983). k in Robbins andGough is a shape factor.
In these experiments, the flow was assumed to be steady and much of the data was taken at moderate
to low Reynolds numbers. The flow medium being bottled gas, the time available for the acquisition of
data was limited. This fact also precluded the determination of velocity profiles. The measurements were
used to establish correlations between Reynolds number le, where the Reynolds number used has been
divided by the 1 - E, and friction factor for beds of given porosity, see Table 2. There, FI, in the
formulation of Ergun (1952), is the friction factor. In other words,
=V , P (1)L pU ( -8)2
where Ap is the pressure drop, dp the particle diameter, E the void fraction .i the gas viscosity, and U the
velocity is as defined in Equation 3, and L the bed length. Values of F, increase with increasing ReI-8
from 150 into the thousands. The total energy loss in the bed is the sum of both viscous and kinetic
energy losses, but depending on the Re number regime, one or the other may predominate. These
2

correlations rely to various degrees on Ergun's (1952) results. The effect of the proximity of the walls
is not directly included. Validity of the correlations are restricted to the indicated Re number and porosity
regimes. Extrapolation of the formulas to outside these regimes usually entails a serious error. A number
of unanswered questions remain, including: Are radial pressure gradients present in the bed? and What
is the nature of the velocity field in and past the bed?
The next sections describe the requirements on the experimental facility followed by the actual
specifications required to attain these goals.
2. REQUIREMENTS ON THE NEW TEST FACILITY
To extend the existing database on packed bed propellant drag, an experimental rig was designed to
generate flows with Reynolds numbers, based on propellant length scale of 1 cm, to exceed lOW in the test
section. Beds up to 155 mm in diameter need to be accommodated.
The experiments must yield the following data:
(1) gas mass flow rate
(2) pressure at several stations along the packed bed
(3) temperature at the entrance and exit of the bed
(4) velocity profiles of the gas flow at the entrance and the exit of the bed
(5) boundary layer profiles in the presence of ullage and in the two-phase medium
Propellants of different shapes, sizes and perforations at different densities of loading will constitute the
bed components. Means of restraining the bed from moving during the experiment must be devised.
The measurement of velocity profiles in tubes, especially near curved wall surfaces, is a challenging
task. For an adequate resolution of the boundary layer and flow profile in each of the two perpendicular
coordinate directions at each cross section requires between 15 and 20 data points per radius. The
symmetry of the flow is checked by taking data across the whole cross section. The data taken at each
and every location must be repeatable within a small percentage of deviation. Prudent experimental
practice requires that data be checked repeatedly and often to find errors in the flow or the
3
instrumentation. The bottom line is that at the upstream and downstream locations where velocity assays
are required, in excess of 240 measurements each may be required for a total of around 500 measurements.
To date, propellant bed drag experiments were run with bottled gas. However, velocity measurements
impose a taxing burden on the gas supply. To illustrate, for a given propellant bed, to take 500 velocity
measurements, the flow taking place at Re = I0 would require the following quantities of gas: a size 300
gas cylinder of 1.75 ft3 capacity (49.6 liters), say, initially at 2,490 psi (1.71 x 10 7 Pa) and a throat area
of 1.24 x 10⁻⁵ m2 (piping of 5/32-inch ID) empties in about 174 seconds when the flow is choked. (For
an overview of the blowdown process see the Appendix.) In a reasonably seeded flow, the acquisition
of data by LDA takes about 10 seconds per point. The traversing table must then be moved to the new
position, which takes another 10 seconds at the minimum. Thus, allowing for a 10% wastage, eight data
points per gas cylinder can be anticipated. One can then conclude that 62 bottles of gas at $90 each for
ultra high purity nitrogen (since it must be oil free), or about $6,000 per experiment in gas cost alone can
be anticipated. This may be somewhat optimistic since many times, due to uneven seeding and other
factors related to the nature of Laser Doppler Anemometry (LDA) data acquisition, more time per data
point may be logged. To shut off the gas supply between data positions is not practical since flow
transients will be introduced and time must be allotted for these to die down. One sees then that using
bottled gas is not an economical way to proceed. An alternative way of supplying the required amounts
of gas is needed and is suggested below.
3. DESIGN OF THE FLOW RIG
3.1 Background. Drag, or resistance to flow, can be inferred from the pressure drop caused by the
presence of the obstacle in the flow. Differential pressure flow metering devices such as orifices, sonic
nozzles, and venturis rely on the fact that the pressure distribution in a flow can be related to the flow rate.
Thus, if the pressure drop caused by the presence of a device can be accurately recorded, a direct
relationship to the flow rate can be established. Accelerating the flow through a constriction of known
area and knowing the resulting pressure drop, the mass flow rate can be determined.
Three coefficients are of interest: the flow coefficient, Cd ; the discharge coefficient, CD ; and the
pressure drop coefficient, K. Recall that the pressure drop between two axial stations, x, and x2 in a tube
under incompressible flow assumptions, is directly proportional to the distance x2 - x,.
4
Ap/(0.5pU 2 ) = f(x 2 - x1 ,Re) (2)
where U is the mean approach flow velocity, D the tube diameter, p the gas density, and the right side
is a functional relationship. We note that the Fanning factor, more commonly used in aerodynamics, is
one-quarter as large as f. A relationship for f can be obtained by combining the continuity equation
m = pQ = pAU, (3)
with Equation 2,
1 p2U 2A 2 (4)
f 2pApA 2
Taking the square root of both sides and defining 4 = 1- one gets
f = m/[A(2pAp) °5 ] . (5)
Also, it should be noted that measurement accuracy is increased when Ap is large. Since the flow rate
Q is proportional to the square root of the pressure drop (i.e., if the variation in p is 10 to 1), the
corresponding flow rate variation is 3 to 1. This can be easily inferred from m = pQ = fAI-2pAp , i.e.,
For a flow meter, the friction factor is commonly referred to as a flow coefficient Cd and expressed
as
C . = (, k/D, Re). (6)
5
where Q is the volume flow rate, X is the area ratio .of the orifice to the pipe cross-sectional area
A,, k is the roughness of the pipe, the pipe diameter is , and Re is the Reynolds number. Note that
Cd = f.
Recalling that the pressure difference upstream of the constriction to that at the minimum cross-
sectional area of the flow can be related to the area ratio as
Ap- (I -X 2) , (7)
the effect of the magnitude of the area ratio on the magnitude of Cd can be reduced by dividing Ap by(1 - 2) yielding the so-called discharge coefficient, CD.
CD = (Q/A)/[p (I - X2)/(2Ap)o] . (8)
CD is the true flow rate divided by the theoretical flow rate and the relationship between Cd and CD is
given by
CD = Cd(1 - X2) 0.5 (9)
At higher Reynolds numbers the discharge coefficient can be expressed with an equation of the form
C =C +b/Re , (10)
where the C= is the discharge coefficient at infinite Reynolds number, and b and n are constants (Miller
1989). Typically, at Re = I0, the discharge coefficient is around 0.6. Finally, the pressure drop
coefficient is defined as
K a Ap/(0.5pU 2) = [(1 - 0 X.)/(0 XW)]2 (11)
where 0 is the coefficient of contraction AriA2; A, is the area of the vena contracta, the smallest area of
the discharge past the orifice plate; A2 is the orifice cross-sectional area; and X, as before, is an area ratio.
6

The right-hand side of Equation 11 follows from straightforward manipulation of the conservation laws
for incompressible flow.
3.2 Specification of the Components. An overview of the flow rig is given in Figure 1. One of the
innovations introduced is that the rig incorporates its own gas source, furnishing air at a rate high enough
to ensure that the desired Reynolds number in the test section is reached. Upon leaving the compressor,
the gas enters the test section after traversing a flow straightener (ASME-type, perforated, multiplate flow
rectifier). The gases exiting the test bed go through a second flow straightener and the sonic nozzle
metering section before exiting. By carefully calibrating the sonic nozzle, it may be adapted to function
as a metering device both in the choked and subsonic regimes, alleviating the need for an orifice plate for
flow measurement when subsonic conditions prevail. Pressure probes across the flow meters, along the
test section as well as temperature gages fore and aft of the test bed will be mounted as shown in
Figure 1. Optical access to the flow will also be provided to enable velocity measurements to be made
by state-of-the-art flow diagnostic techniques (Figures 2 and 3), see for example Dybbs and Ghorashi
(1991).
The sonic nozzle flow meter assembly of Smith-Matz geometry with a 1.798-inch (0.045-m) throat,
contains the flow rectifier, inlet temperature, inlet pressure, and throat taps with a balancing manifold.
Sonic and subsonic calibration need to be provided with the unchoking test. It is felt that the discharge
coefficient variation can be held to be within 0.5%. The associated instrument package includes the inlet
temperature, pressure and differential pressure probes, and transmitters. The data acquisition board for
a 286-type computer and custom software will display the mass, volumetric flow rates, and the status and
readings of the pressure probes.
The modus operandi adopted here was to start at the back of the rig (exhaust end), calculate the
pressure 'irop through each of the components, and thus arrive at the performance required of the device
furnishing the required amount of air. The calculations were based on a standard 6-inch (152.4-mm) pipe,
which, due to cost considerations, is preferable to a specially fabricated 155-mm tube.
3.2.1 Straight Pipe Section. The pressure drop in a pipe under steady flow conditions, as already
shown in Equation 2, is given by the following relationship,
Ap = f(L/D)pU2 /2 , (12)
7
tol) z
ON")
LU0
a_.
Ll0
V
zl -D-
0g
CF

IZIL K.11 inif in
V
0
ci,C') LL~
0
-J
o0
o
0N; Li LL -
I-t 01~0
1 0
0
Ie4
9
L2
:ooW 6
W, zo0
a1 C)
C) -10

where, as usual, f is the friction factor, L the length of the pipe section, D the diameter, and p the density
of the fluid. Machining costs dictate that pipe sections should not exceed 1 meter in length.
Commercially available steel pipes have an f value of around 0.02 at Re = I05. Thus, the pressure loss
in a 1-meter pipe section, under the conditions of interest here (p = 1.2 kg/m3, U of the order of 10 m/s,
and LD = 6) will be 185 Pa and the K value is 0.12 based on
K = f • L/D = Ap/(0.5pU 2). (13)
3.2.2 Loss at an Orifice. For a Class 2 orifice (i.e., one having sharp edges and made of thin plate)
and t < 0.1d where d is the orifice opening diameter, t the orifice material thickness, and Re > 10, where
the Re number is based on the orifice diameter, in the nomenclature of Ward-Smith (1980), and noting
the similarity to Equation 10, i.e., = X,
K = [(1- )/ )]. (14)
Here t is the orifice opening to the tube area ratio and 0 the contraction ratio. Ward-Smith (1980) gives
tabulations of 0 vs. 4. For 4 = 0.5, K turns out to be 4.954. Equation 14 is derived by using the
definitions of 0, t in conjunction with the incompressible conservation equations between the upstream,
vena contracta and downstream positions of a metering device.
3.2.3 Flow Straightener. The accuracy of flow metering devices depends on whether the flow is fully
developed and on the success of eliminating transverse motion (i.e., swirl) in the flow. Several studies
exist on the effect of swirl on the discharge coefficient of an orifice plate (Zanker 1962). Kinghom (1977)
determined discharge coefficient bias errors for venturis and orifices. For a swirl angle of fifteen degrees,
typically, the error can approach 10%. BSI (1963) stated, as was also confirmed by Kreith and Sonju
(1965) and Miller (1989), that the persistence of swirl may extend over considerable distances. Without
a flow straightener, general practice suggests (Miller 1989) that 100 pipe diameters may be needed to
attenuate, at Re = 10' a swirl at 2'. ISO Standard 5167 (1980) states that "Acceptable velocity profile
conditions can be presumed to prevail when at each point across the pipe cross section the ratio of local
axial velocity to the maximum axial velocity at the cross section located at the end of a very long straight
length over 100 D of similar pipe." Flow straighteners remove the necessity of including long runs of
straight tubing to achieve fully developed flow conditions.
II

Swirl has several effects on the flow: with increasing swirl, the position of the maximum axial
velocity moves progressively away from the tube axis. Consequently, there is a reduction of the axial
velocity along the axis and, at high enough swirl, reversed flow can occur at the pipe axis. Swirl can
defined by a parameter W as follows:
W-4M /(XpU 2 D3 ) , (15)
where M,, is the angular momentum flux. As shown by Baker and Sayre (1974), the ratio of the mean
to fully developed flow without swirl friction factors can be given as
fM/f = 1 + 11.5W 1.32 exp(O.45 L/D) , (16)
where L is the distance between measuring stations and D the pipe diameter. The relation is valid for
1.25 x 10' < Re < 2.0 x 10⁵. Lugt (1963) describes a simple device which can indicate the presence of
swirl in a pipe flow. It consists of a fitting with two pressure holes side by side on the periphery of the
pipe. A swirl at the wall will produce a differential pressure detectable by a simple manometer.
Thus, the basic objective is to remove major flow distortions of the axial velocity so that fully
developed flow conditions exist at all metering devices. Toward these ends, a number of authors have
suggested remedies, here we discuss two of them. It is important to minimize the value of K of these
devices so that the pressure loss occurring there remains small. Sprenkle and Courtright (1958) proposed
a three-plate arrangement with one tube diameter spacing between plates with holes amounting to about
1/2 of the pipe cross section distributed over the plate. A value of K = 16 was measured for the device.
This value declined to 11 when the inlet side of the orifices was beveled. It was also found that a length
of eight diameters before the orifice after the flow straightener assured settling of the flow and elimination
of metering errors.
An improvement in the K value was reported by Zanker (1962) with a single perforated plate but with
orifices of different sizes distributed on the plate. The largest hole was placed near the axis and a
honeycomb (one pipe diameter in length) was attached to the plate. The cells were square with their axes
coinciding with the holes in the plate. The settling length was four pipe diameters and the velocity profile
was found to approach that of fully developed flow. At Re = 10W, the K value was 5.7; while at Re = 10P,
12
it declined to 5.1. Kinghom et al. (1976) report a further improvement with a straightener-venturi nozzle
package. The Mitsubishi conditioner (Miller 1989) is easier to fabricate than that due to Zanker, however,
the design is proprietary.
3.2.4 Perforated Plates and Baffles. To hold the test bed in place, either a screen or plate and a baffle
may be used. A perforated plate may be treated as an orifice plate with an opening equal to the sum of
the holes in the plate.
Assume a plate of thickness t with N orifices of diameter d. The porosity of the plate k is defined
as
a tNd 2/(4A) , (17)
where A is the pipe cross section. For t/d < 0.8, Ward-Smith (1980) gives the following relation:
K = [(0.609 (I - (t/d) 3 . 5} (1- _ + 2 3.6)-1,_ 112 , (18)
which correlates data in the range 0.006 < 4 < 0.75 with a root-mean-square error of 10% in the value of
K. K can vary widely; indeed, Ward-Smith (1980) quotes values from 0.57 to 3.58 x 10'.
3.2.5 Screens. The upstream end of the propellant bed is usually held in place by a screen. A wire
mesh may be characterized by the number of wires per unit length, m (units of inverse length), and the
porosity 4, of wire strands of diameter d.
m (1 -md) 2 . (19)
Gauzes and screens offer a high resistance to the flow compared with the wall shear stress in developing
or fully developed flow. A sudden change in pressure is experienced when flow traverses the screen.
Experimental values are given in both Ward-Smith (1980) and Miller (1990).
Conventionally, the flow through each aperture in a screen is viewed as the flow through a single
orifice of porosity 4. Note that Ward-Smith (1980) reports that at high Reynolds numbers, with turbulent
13

flow, K is independent of Reynolds number. Under these conditions, de Vahl-Davis (1964) gives the
following relationship,
K = K+ 55/Re = [(1- w/ ]2 + 55/Re . (20)
K. is the value of K at high Reynolds. Ward-Smith (1980), for Re > 103 and 0.3 < < 0.9, gives curves
of K as a function of a pressure parameter, [(1 + K,..)] - . Alternatively, Ower (1977) gives for the
resistance of a gauze screen the expression,
K = 6.5[(1 - 0)/0 2] [Ud/13(p/p) ] - 3 , (21)
where I0 is the open area of the gauze, U the velocity ahead of the screen, d the diameter of the wires, and
(pIp) the kinematic viscosity of the air. No general formula for the resistance of honeycombs is known,
but some data is available from Whitaker et al. (1970) and Wieghart (1953).
3.2.6 Test Bed. The pressure drop through the test bed was calculated on the basis of Ergun's (1952)
theory neglecting the first term, the constant 150, which is small with respect to the retained second term
(see Table 2).
Ap/L = 1.75[(1 - E)/e 3]pU 2/dp . (22)
Here, dp is the particle mean diameter, c the void fraction, and p the gas density.
3.2.7 Sonic Nozzle. The advantage of sonic nozzles as flow measuring devices is that upstream of
the nozzle changes in the downstream conditions, as long as the nozzle is choked, are not felt. The
pressure recovery across the nozzle can approach 92%, however, a more conservative and likely figure
is 85%. It is also possible to instrument the sonic nozzle so that it can act as an orifice plate when sonic
conditions are not reached.
3.2.8 The Choice for a High Pressure Gas Source. The estimated pressure drop through the flow rig
is given in Table 3. The Reynolds number at the entrance to the test section, based on a propellant
particle size of I cm, an approach velocity of 6.41 m/s and gas density of 73.2 kg/m3, is 2.5 x lW. The
14

Table 3. Pressure Loss Summary
Component Pressure Drop Comments(Mpa)
flow straightener 0.0077 ASME typestraight section 0.0003 steel tubewire screen 0.0030test section 4.9340 Ergun's eq.wire screen 0.0030baffle plate 0.0315flow straightener 0.0003 ASME typestraight section 0.0003 -sonic nozzle 0.2200 est. 15% loss
particle loading e was taken to be 0.5. Allowing for a 5% pressure loss in the system due to extraneous
causes, the gas must be supplied at a pressure exceeding 6.0 MPa.
As pointed out in Section 2, for a gas source, bottled gas in view of the anticipated cost is not a viable
option. Rather, an situ generation of the pressurized gas suggests itself. Though the up-front
investmentmay be higher than for the conventional approach, the facility will pay for itself in gas cost
savings in a short period of time.
Several types of compressors (see Pichot [1986 and Compressed Air and Gas Institute [1989] for
details) need to be considered. Basically, one can distinguish between positive displacement types
(i.e., reciprocating, rotary, dynamic, centrifugal, and axial) and thermal types, that is injectors.
Reciprocating compressors can produce gases in the tens of thousands of psig, are flexible and efficient.
Their big drawback is that they require large foundations due to the unbalanced inertial forces and, most
importantly, the gas flow is discontinuous. Thus, their use in the packed bed studies can only be
comtemplated in conjunction with the use of a gas accumulator.
Screw-type rotary compressors are capable of handling flows ranging from 200 to 20,000 m3/hr under
discharge pressure ranging from 3 bar gage in a single stage to about 13 bar gage in two stages. These
compressors use two spiral lobed rotors whose hollows are filled with gas at the inlet port. Compression
begins because of the spiral configuration (i.e., during rotation the contact surfaces move parallel to the
15

axes of the rotors toward the outlet causing gradual compression until the trapped air is put at the outlet
port).
Centrifugal compressors can reach discharge pressures of 10,000 psi (68.94 MPa) with an inlet
capacity better than 200,000 acfmn (94.38 m3/s). Staging is usually employed. Ambient air is accelerated
by the first impeller, then a diffuser converts the velocity into pressure. A heat exchanger cools the air
before it flows through a second stage impeller and is then discharged through an aftercooler to the user.
Axial machines, on the other hand, have even higher capacities but their discharge is limited to 500 psi
(3.44 MPa).
3.2.9 Optical Access. Velocity measurement in the flow requires optical access. At elevated
pressures, windows must be specially fabricated. With a Young's modulus of 50 x 106, modulus of
rupture up to 100,000 psi (689.4 MPa), sapphire has the needed strength and optical qualities. At 0.5 tm
wavelength, transmittance approaches 85% and the index of refraction is 1.77. The hydrostatic burst
strength of simply supported windows is 8,300 psi (57.22 MPa). Thus, to maintain 1,000 psi (6.89 MPa)
with a safety factor of four, the manufacturer, Union Carbide (1988), recommends a thickness to diameter
ratio of a window of 0.15.
3.2.10 Tube Material Strength. In tubes where the radius to the tube wall thickness exceeds 10, the
circumferential stress can be calculated based on the following relation (Gere and Timoshenko 1990),
a, = (pr)/5 , (23)
where p is the pressure inside the tube, r the radius, and t the wall thickness. The longitudinal stress
follows from
a2 = (pr)/(2t) . (24)
Taking, as a typical example, a steel tube of 0.15 m (6 inch) ID, wall thickness of 0.0063 m (0.25 inch),
with a safety factor of 4, say at 13.78 MPa (2,000 psi) in the flow, the stresses are well below the
allowable yield and tensile stresses of commercially available, resistance-welded carbon steel pipes of 68
and 76 ksi (4.68 x 10' Pa), respectively.
16

4. RESULTS
To create the desired flow conditions in the test cell, the best solution is to use a compressor.
Experiments can be run indefinitely, a great advantage when performing difficult flow surveys. Unsteady
flow conditions can also be simulated.
In choosing a compressor, several trade-offs must be considered. Most of the centrifugal compressors
on the market guarantee high flow rates but at moderate to low pressures. The present requirement calls
for high pressures by compressor standards, but at fairly low flow rates. Also, as the compressor gas exit
velocity increases, due to the U2 term (Equation 22), the pressure drop through the bed increases rapidly
putting a large demand on the gas generator.
To reach the required Reynolds number at the entrance to the test section, and assuming gas exit
temperatures of 300 K (which is realizable if the compressor comes with a heat exchanger), a multi-stage
compressor is required. For example, the Bauer Model B 28.3 three-stage compressor discharges air at
300 K, a density of 73.20 kg/m3, and a pressure of 6.40 x 10⁶ Pa. At a flow rate of 250 cfm (0.117 m3/s),
the velocity is 6.41 m/s, yielding a Reynolds number of 2.5 x 10.
The facility will allow the generation ot data heretofore unavailable and needed by interior ballistic
modelers. By including a particle disperser and a means of recovering the propellant in the experimental
rig, many aspects of the fluidized bed can also be simulated. This could include but is not limited to
ullage, center core, and velocity field data in addition to detailed drag data.
5. CONCLUSIONS
A new experimental facility for the measurement of inert propellant bed drag has been designed. Its
operational envelope encompasses Reynolds numbers in excess of 2.5 x I0 in test beds up to 155 mm
in diameter. Both steady-state and time-dependent operations are possible. In steady state there is no
restriction on the time for the experiment. This allows the taking of velocity profiles of the flow. The
experiment is also instrumented with both LDA and PIV (particle image velocimetry) data acquisition
systems enabling for the first time the determination of both the pressure along the test section as well as
velocity profiles and turbulence data fore and aft of the packed bed.
17

INTENrIONALLY LEFr BLANK.
18
6. REFERENCES
Baker, D. W., and C. L. Sayre. "Decay of Swirling Turbulent Flow of Incompressible in Long Pipes."Proceedings of the Symposium on Flow: Its Measurement and Control in Science and Industry.vol. 1, pp. 301-12, R. B. Dowdell (ed), Instrument Society of America, 1974.
British Standards Institution. Methods of Testing Fans for General Purposes. BSI 848, Part 1, London,1963.
de Vahl-Davis, G. "The Flow of Air Through Wire Screens." Proceedings of the First AustralaianConference on Hydraulics and Fluid Mechanics, pp. 191-212, 1964.
Dybbs, A., and B. Ghorashi (eds). Laser Anemometry Advances and Applications 1991. New York:
ASME, 1991.
Ergun, S. "Fluid Flow Through Packed Columns." Chemical Engineering Prog., vol. 48, pp. 89-94, 1952.
Forchheimer, P. "Wasserbewegung durch Boden." Z. VDI, vol. 45, pp. 1782-1788, 1901.
Gere, J. M., and S. P. Timoshenko. Mechanics of Materials. Third edition, PWS-Kent, 1990.
International Standards Organization. "Measurement of Fluid Flow by Means of Orifice Plates, Nozzlesand Venturi Tubes Inserted in Circular Cross Section Conduits Running Full." ISO Standard 5167,Geneva, 1980.
Jones, D. P., and H. Krier. "Gas Flow Resistance Measurements Through Packed Beds at High ReynoldsNumbers." ASME, J. Fluids Eng., vol. 105, pp. 168-173, 1983.
Kinghorn, F. C. "Flow Measurement in Swirling or Asymmetric Flow: A Review." Flow-Con 77Proceedings, Institute of Measurement and Control, Gatton and Kent, U.K., 1977.
Kinghom, F. C., A. Kennedy, and P. Bedin. "The Use of a Flow Straightener-Venturi-Nozzle Packagein Swirling Flow." Report No. 618, National Engineering Laboratory, East Kilbride, Glasgow,Scotland, 1976.
Kreith, F., and 0. K. Sonju. "The Decay of Turbulent Swirl in a Pipe." Journal of Fluid Mechanics,vol. 22, pp. 257-271, 1965.
Kuo, K. K., and C. C. Nydegger. "Flow Resistance Measurements and Correlation in Packed Beds of GunPropellant." Journal of Ballistics, vol. 2, pp. 1-25, 1978.
Lugt, H. "Einfluss der Drallstr6mung auf die Durchflusszahlen genormter Drosselmessgerate."
Brennstoff-Warme-Kraft, vol. 13, pp. 121, 1963.
Miller, D. S. Internal Flow Systems. Second edition, BHRA Information Services Cranfield, 1990.
Miller, R. W. Flow Measurement Engineering Handbook. Second edition, New York: McGraw Hill,1989.
19

Ower, E., and R. C. Pankhurst. The Measurement of Air Flow. Oxford: Pergamon Press, 1977.
Pichot, P. Compressor Application Engineering. Vol. 1, Houston: Gulf Publishing Company, 1986.
Robbins, R., and P. S. Gough. "Experimental Determination of Flow Resistance in Packed Beds of GunPropellant." Proceedings of the 15th JANNAF Combustion Meeting, Chemical Propulsion InformationAgency, Publication 297, 1978.
Sprenkle, R. E., and N. S. Courtright. "Straightening Vanes for Flow Measurement." MechanicalEngineering, vol. 80, pp. 71-73, 92-95, 1958.
Union Carbide. "Optical Properties and Application of Linde Cz Sapphire." Crystal Products TechnicalBulletin Industrial Chemicals Division, 1988.
Ward-Smith, A. J. Internal Fluid Flow. Oxford: Clarendon Press, 1980.
Wieghart, C. E. G. "On the Resistance of Screens." Aero. Quarterly, vol. 4, p. 186, 1953.
Whitaker, J., P. G. Bean, and E. Hay. "Measurement of Losses Across Multi-cell Flow Straightener."Report No. 461, National Engineering Laboratory, East Kilbride, Glasgow, Scotland, 1970.
Wilcox, S. F., and H. Krier. "Gas Flow Resistance Measurement Through Packed Beds At High ReynoldsNumber." Technical Report AAE 80-1, University of Illinois Aero and Astronautical EngineeringDepartment, 1980.
Zanker, K. J. "The Development of a Flow Straightener For Use With Orifice-Plate Flow Meter inDisturbed Flows." Proceedings of the Symposium on Flow Measurement in Closed Conduits, vol. 2,pp. 395-415, HMSO, Edinburgh, 1962.
Zoltani, C. K. "Flow Resistance in Packed and Fluidized Beds: An Assessment of Current Practice."Proceedinas of the 28th JANNAF Combustion Meeting, vol. I, Chemical Propulsion InformationAgency Publication 573, Columbia, MD, October 1991.
20

APPENDIX:
THE BLOWDOWN PROCESS
21

INTENTIONALLY LEFr BLANK.
22

THE BLOWDOWN PROCESS
A mass M of gas is contained in a tank of volume V. Through an opening of area A the gas exits.
Choked conditions prevail at the exit from time t = 0 to time t = t. It is desired to calculate the pressure
history during the emptying process as well as the time needed from the initial opening of the valve to
the time that choking conditions can no longer be maintained. It is assumed that the flow process is
isentropic and k is the ratio of specific heats in the gas.
dM- - M (A-i)
dt
M PI , (A-2)
where i denotes the initial state. Differentiating the above expression,
k d (p/pi) kr = kGA (A-3)dt p TV pi (
where the critical mass flux is given by
G.(k, k + 1 2 -1) " (A-4)
Note that the conditions in the reservoir are continuously changing and these time-dependent conditions
have to be reflected in the use of Equation (A-4).
23

Substituting and rearranging,
(p ) 12kk d I(P/Pi~ /- ==+7
P d (k .kA(piV) . _p+) 2 (k-I) (A-5)
this is a differential equation with the initial conditions,
att=0, p/l:i=l.
Let (p/p) = x and let n = (I - 3k)/2k. The equation then can be written in the simplified form as follows:
x . dx = C. (A-6)dT
Here C is a constant, the value being the right-hand side of Equation A-5. This is the classical Bernoulli
equation. The substitution v = x"*' reduces it to a linear equation which was first solved by Leibniz in
1696. The result is
2 .( - [ p A , (A-7)
which alternatively can be solved for t for a given (p/p,) ratio.
24

LIST OF SYMBOLS
A cross-sectional area
CD discharge coefficient
Cd flow coefficient
D bed (pipe) diameter
d wire diameter, orifice diameter
dp particle diameter
F drag force
f friction factor
G mass flow rate per unit area
g acceleration due to gravity
h hydraulic height
K pressure drop coefficient
k roughness, also ratio of specific heats
L length
M angular momentum flux, also total mass
m number of wires per unit length, also pQ
N number of particles
p pressure
Q volume flow rate
Re Reynolds number= pUD
t plate thickness
U mean approach flow velocity
V volume
W swirl parameter
GREEK
1i open area
C void fraction
X. area ratio
. viscosity
25

porosity of plate
p density
a stress
T shear sume
* coefficient of contraction
SUBSCRIPT
ang angular
c critical condition (choked)
i initial value
mn mean
p partcle
v velocity
I circumferential
2 orifice
00 free stream condition
26

No. of No. ofC Organization Covies Organization
2 Administrator 1 CommanderDefense Technical Info Center U.S. Army Tank-Automotive CommandATTN: DTIC-DDA ATTN: ASQNC-TAC-DIT (TechnicalCameron Station Information Center)Alexandria, VA 22304-6145 Warren, MI 48397-5000
Commander 1 DirectorU.S. Army Materiel Command U.S. Army TRADOC Analysis CommandATTN: AMCAM ATTN: ATRC-WSR5001 Eisenhower Ave. White Sands Missile Range, NM 88002-5502Alexandria, VA 22333-0001
I CommandantCommander U.S. Army Field Artillery SchoolU.S. Army Laboratory Command ATTN: ATSF-CSIATTN: AMSLC-DL Ft. Sill, OK 73503-50002800 Powder Mill Rd.Adelphi, MD 20783-1145 (Cam ony) 1 Commandant
U.S. Army Infantry School2 Commander ATIN: ATSH-CD (Security Mgr.)
U.S. Army Armament Research, Fort Benning, GA 31905-5660Development, and Engineering Center
ATIN: SMCAR-IMI-I (Un.c Only) 1 CommandantPicatinny Arsenal, NJ r-/806-5000 U.S. Army Infantry School
ATITN: ATSH-CD-CSO-OR2 Commander Fort Benning, GA 31905-5660
U.S. Army -', .Anent Research,Development, and Engineering Center 1 WLMNOI
ATTN: SMCAR-TDC Eglin AFB, FL 32542-5000Piciinny Arsenal, NJ 07806-5000 Aberdeen Proving~ Ground
DirectorBenet Weapons Laboratory 2 Dir, USAMSAAU.S. Army Armament Research, ATIN: AMXSY-D
Development, and Engineering Center AMXSY-MP, H. CohenATTN: SMCAR-CCB-TLWatervliet, NY 12189-4050 1 Cdr, USATECOM
ATTN: AMSTE-TC(Undas-. only) 1 Commander
U.S. Army Rock Island Arsenal 3 Cdr, CRDEC, AMCCOMATrN: SMCRI-TL/Technical Library ATTN: SMCCR-RSP-ARock Island, IL 61299-5000 SMCCR-MU
SMCCR-MSIDirectorU.S. Army Aviation Research 1 Dir, VLAMO
and Technology Activity ATTN: AMSLC-VL-DATTN: SAVRT-R (Library)M/S 219-3 10 Dir, USABRLAmes Research Center ATTN: SLCBR-DD-TMoffett Field, CA 94035-1000
CommanderU.S. Army Missile CommandATIN: AMSMI-RD-CS-R (DOC)Redstone Arsenal, AL 35898-5010
27

No. of No. ofCopies Organization Copies Organization
Commander 15 CommanderU.S. Army Concepts Analysis Agency U.S. Army Armament Research,ATN: D. Hardison Development, and Engineering Center8120 Woodmont Ave. A'ITN: SMCAR-AEEBethesda, MD 20014 SMCAR-AEE-B,
A. BeardellC.I.A. D. DownsO1R/DB/Standard S. EinsteinWashington, DC 20505 S. Westley
S. BernsteinDirector J. RutkowskiU.S. Army Ballistic Missile B. Brodman
Defense Systems Command R. CirincioneAdvanced Technology Center A. GrabowskyP. O. Box 1500 P. HuiHuntsville, AL 35807-3801 J. O'Reilly
P. O'ReillyChairman N. DeVriesDOD Explosives Safety Board SMCAR-AES, S. Kaplowitz, Bldg. 321Room 856-C Picatinny Arsenal, NJ 07806-5000Hoffman Bldg. 12461 Eisenhower Ave. 2 CommanderAlexandria, VA 22331-0600 U.S. Army Armament Research,
Development, and Engineering CenterDepartment of the Army ATTN: SMCAR-CCD, D. SpringOffice of the Product Manager SMCAR-CCH-V, C. Mandala155mm Howitzer, M109A6, Paladin Picatinny Arsenal, NJ 07806-5000ATTN: SFAE-AR-HIP-IP, Mr. R. De KleinePicatinny Arsenal, NJ 07806-5000 1 Commander
U.S. Army Armament Research,2 Commander Development, and Engineering Center
Production Base Modernization Agency ATTN: SMCAR-HFM, E. BarrieresU.S. Army Armament Research, Picatinny Arsenal, NJ 07806-5000
Development, and Engineering CenterATIN: AMSMC-PBM, A. Siklosi 1 Commander
AMSMC-PBM-E, L. Laibson U.S. Army Armament Research,Picatinny Arsenal, NJ 07806-5000 Development, and Engineering Center
ATTN: SMCAR-FSA-T, M. Salsbury3 PEO-Armaments Picatinny Arsenal, NJ 07806-5000
Project ManagerTank Main Armament Systems I Commander, USACECOMATTN: AMCPM-TMA/K. Russell R&D Technical Library
AMCPM-TMA-105 ATTN: ASQNC-ELC-IS-L-R, Myer CenterAMCPM-TMA-120, C. Roller Fort Monmouth, NJ 07703-5301
Picatinny Arsenal, NJ 07806-5000
28

No. of No. ofCopies Organization Copies Organization
Commander 1 DirectorU.S. Army Harry Diamond Laboratories U.S. Army TRAC-Ft. LeeATTN: SLCHD-TA-L ATTN: ATRC-L, Mr. Cameron2800 Powder Mill Rd. Fort Lee, VA 23801-6140Adelphi, MD 20783-1145
1 CommandantCommandant U.S. Army Command and GeneralU.S. Army Aviation School Staff CollegeATTN: Aviation Agency Fort Leavenworth, KS 66027Fort Rucker, AL 36360
1 Commandant2 Program Manager U.S. Army Special Warfare School
U.S. Army Tank-Automotive Command ATTN: Rev and Trng Lit DivATTN: AMCPM-ABMS, T. Dean (2 cps) Fort Bragg, NC 28307Warren, MI 48092-2498
3 CommanderProgram Manager Radford Army Ammunition PlantU.S. Army Tank-Automotive Command ATITN: SMCAR-QA/HI LIB (3 cps)Fighting Vehicles Systems Radford, VA 24141-0298ATTN: SFAE-ASM-BVWarren, M! 48092-2498 1 Commander
U.S. Army Foreign Science andProject Manager Technology CenterAbrams Tank System ATTN: AMXST-MC-3ATTN: SFAE-ASM-AB 220 Seventh Street, NEWarren, MI 48397-5000 Charlottesville, VA 22901-5396
Director 2 CommanderHQ, TRAC RPD Naval Sea Systems CommandATTN: ATCD-MA ATTN: SEA 62RFort Monroe, VA 23651-5143 SEA 64
Washington, DC 20362-51012 Director
U.S. Army Materials Technology 1 CommanderLaboratory Naval Air Systems Command
ATTN: SLCMT-ATL (2 cps) ATTN: AIR-954-Technical LibraryWatertown, MA 02172-0001 Washington, DC 20360
Commander 1 Naval Research LaboratoryU.S. Army Research Office Technical LibraryATN: Technical Library Washington, DC 20375P.O. Box 12211Research Triangle Park, NC 27709-2211 2 Commandant
U.S. Army Field Artillery CenterCommander and SchoolU.S. Army Belvoir Research and ATTN: ATSF-CO-MW, E. Dublisky (2 cps)Development Center Fort Sill, OK 73503-5600ATTN: STRBE-WCFort Belvoir, VA 22060-5006
29
No. of No. ofCopies Organization Copies Organization
Office of Naval Research 3 CommanderATTN: Code 473, R. S. Miller Naval Weapons Center800 N. Quincy Street ATITN: Code 388, C. F. PriceArlington, VA 22217-9999 Code 3895, T. Parr
Information Science Division3 Commandant China Lake, CA 93555-6001
U.S. Army Armor SchoolATTN: ATZK-CD-MS, M. Falkovitch (3 cps) 1 OSD/SDIO/ISTArmor Agency ATTN: Dr. Len CavenyFort Knox, KY 40121-5215 Pentagon
Washington, DC 20301-71002 Commander
U.S. Naval Surface Warfare Center 4 CommanderATTN: J. P. Consaga Indian Head Division
C. Gotzmer Naval Surface Warfare CenterIndian Head, MD 20640-5000 ATTN: Code 610, T. C. Smith
D. Brooks
4 Commander K. RiceNaval Surface Warfare Center Technical LibraryATTN: Code 730 Indian Head, MD 20640-5035
Code R-13,K. Kim 1 OLAC PL/TSTLR. Bernecker ATTN: D. ShiplettH. Sandusky Edwards AFB, CA 93523-5000
Silver Spring, MD 20903-50001 AFATL/DLYV
2 Commanding Officer Eglin AFB, FL 32542-5000Naval Underwater Systems CenterATTN: Code 5B331, R. S. Lazar 1 AFATL/DLXP
Technical Library Eglin AFB, FL 32542-5000Newport, RI 02840
1 AFATL/DLJEDirector Eglin AFB, FL 32542-5000Benet Weapons LaboratoriesAT' N: SMCAR-CCB-RA, G. P. O'Hara I AFELM, The Rand CorporationWatervliet, NY 12189-4050 ATTN: Library D
1700 Main Street4 Commander Santa Monica, CA 90401-3297
Dahlgren DivisionNaval Surface Warfare Center 3 AAI CorporationATITN: Code G30, Guns and Muritions Division ATTN: J. Hebert
Code G301, D. Wilson J. FrankleCode G32, Gun Systems Branch D. ClevelandCode E23, Technical Library P.O. Box 126
Dahlgren, VA 22448-5000 Hunt Valley, MD 21030-0126
30
No. of No. ofCopies Organization Copies Organization
3 AL/LSCF 1 Olin CorporationATIN: J. Levine Badger Army Ammunition Plant
L. Quinn ATTN: F. E. WolfT. Edwards Bamboo, WI 53913
Edwards AFB, CA 93523-50003 Olin Ordnance
AVCO Everett Research Laboratory ATTN: E. J. KirschkeATTN: D. Stickler A. F. Gonzalez2385 Revere Beach Parkway D. W. WorthingtonEverett, MA 02149-5936 P.O. Box 222
St. Marks, FL 32355-0222General Electric CompanyTactical Systems Department 1 Olin OrdnanceATTN: J. Mandzy ATTN: H. A. McElroy100 Plastics Ave. 10101 9th Street, NorthPittsfield, MA 01201-3698 St. Petersburg, FL 33716
IITRI I Paul Gough Associates, Inc.ATTIN: M. J. Klein ATTN: Dr. Paul S. Gough10 W. 35th Street 1048 South StreetChicago, IL 60616-3799 Portsmouth, NH 03801-5423
Hercules, Inc. 1 Physics International CompanyAllegheny Ballistics Laboratory ATTN: Library, H. Wayne WamplerAT, 14: William B. Walkup 2700 Merced StreetP.O. r'ox 210 San Leandro, CA 98457-5602Rr,;cket Center, WV 26726
1 Princeton Combustion Research-Hercules, Inc. Laboratory, Inc.
Radford Army Ammunition Plant ATTN: M. SummerfieldATTN: E. Hibshman 475 U.S. Highway OneRadford, VA 24141-0299 Monmouth Junction, NJ 08852-9650
Hercules, Inc. 2 Rockwell InternationalHercules Plaza Rocketdyne DivisionA'IrN: B. M. Riggleman A'TTN: BA08,Wilmington, DE 19894 J.E. Flanagan
J. Gray3 Director 6633 Canoga Ave.
Lawrence Livermore National Canoga Park, CA 91303-2703Laboratory
ATTN: L-355, 1 Sverdrup Technology, Inc./A.. Buckingham ATTN: Dr. John DeurM. Finger 2001 Aerospace Parkway
L-324, M. Constantino Brook Park, OH 44142P.O. Box 808Livermore, CA 94550-0622
31

No. of No. ofCopies Organization Copies Organization
2 Thiokol Corporation 1 University of MassachusettsElkton Division Department of Mechanical EngineeringATIN: R. Biddle ATTN: K. Jakus
Technical Library Amherst, MA 01002-0014P.O. Box 241Elkton, MD 21921-0241 1 University of Minnesota
Department of Mechanical EngineeringVeritay Technology, Inc. A'ITN: E. FletcherATTN: E. Fisher Minneapolis, MN 55414-33684845 Millersport HighwayEast Amherst, NY 14501-0305 3 Georgia Institute of Technology
School of Aerospace EngineeringUniversal Propulsion Company ATTN: B.T. ZimATT'N: H. J. McSpadden E. Price25401 North Central Ave. W.C. StrahlePhoenix, AZ 85027-7837 Atlanta, GA 30332
Battelle 1 Institute of Gas TechnologyATTN: TACTEC Library, J.N. Huggins ATTN: D. Gidaspow505 King Ave. 3424 S. State StreetColumbus, OH 43201-2693 Chicago, IL 60616-3896
Brigham Young University 1 Johns Hopkins UniversityDepartment of Chemical Engineering Applied Physics LaboratoryATTN: M. Beckstead Chemical PropulsionProvo, UT 84601 Information Agency
ATN: T. ChristianCalifornia Institute of Technology Johns Hopkins Road204 Karman Laboratory Laurel, MD 20707-0690Main Stop 301-46ATTN: F.E.C. Culick I Massachusetts Institute of Technology1201 E. California Street Department of Mechanical EngineeringPasadena, CA 91109 ATTN: T. Toong
77 Massachusetts Ave.Jet Propulsion Laboratory Cambridge, MA 02139-4307California Institute of TechnologyATTN: L. Strand, MS 125-224 1 Pennsylvania State University4800 Oak Grove Drive Department of Mechanical EngineeringPasadena, CA 91109-8099 ATTN: V. Yang
University Park, PA 16802-7501University of IllinoisDepartment of Mechanical/Industrial Pennsylvania State University
Engineering Department of Mechanical EngineeringATI'N: H. Krier ATTN: K. Kuo144 MEB; 1206 N. Green Street University Park, PA 16802-7501Urbana, IL 61801-2978
32

No. of No. ofope Organization Coies Organization
Pennsylvania State University 1 Rutgers UniversityAssistant Professor Department of Mechanical andDepartment of Mechanical Engineering Aerospace EngineeringATTN: Dr. Stefan T. Thynell ATTN: S. Temkin219 Hallowell Building University Heights CampusUniversity Park, PA 16802-7501 New Brunswick, NJ 08903
Pennsylvania State University 1 University of Southern CaliforniaDirector, Gas Dynamics Laboratory Mechanical Engineering DepartmentDepartment of Mechanical Engineering ATIN: OHE200, M. GersteinATTN: Dr. Gary S. Settles Los Angeles, CA 90089-5199303 Mechanical Engineering BuildingUniversity Park, PA 16802-7501 1 University of Utah
Department of Chemical EngineeringSRI International ATIN: A. BaerPropulsion Sciences Division Salt Lake City, UT 84112-1194ATIN: Technical Library333 Ravenwood Ave. 1 Washington State UniversityMenlo Park, CA 94025-3493 Department of Mechanical Engineering
ATTN: C. T. CroweRensselaer Polytechnic Institute Pullman, WA 99163-5201Department of MathematicsTroy, NY 12181 1 Alliant Techsystems, Inc.
ATTN: R. E. Tompkins2 Director MN38-3300
Los Alamos Scientific Laboratory 5700 Smetana DriveATTN: T3, D. Butler Minnetonka, MN 55343
M. Division, B. CraigP.O. Box 1663 1 Alliant Techsystems, Inc.Los Alamos, NM 87544 ATTN: J. Kennedy
7225 Northland DriveGeneral Applied Sciences Laboratory Brooklyn Park, MN 55428ATTN: J. Erdos77 Raynor Ave. 1 Science Applications, Inc.Ronkonkama, NY 11779-6649 ATTN: R. B. Edelman
23146 Cumorah Crest DriveBattelle PNL Woodland Hills, CA 91364-3710ATTN: Mr. Mark GamichP.O. Box 999 1 Battelle Columbus LaboratoriesRichland, WA 99352 ATIN: Mr. Victor Levin
505 King Ave.Stevens Institute of Technology Columbus, OH 43201-2693Davidson LaboratoryAT'N: R. McAlevy III 1 Allegheny Ballistics LaboratoryCastle Point Station Propulsion Technology DepartmentHoboken, NJ 07030-5907 Hercules Aerospace Company
ATTN: Mr. Thomas F. FarabaughP.O. Box 210Rocket Center, WV 26726
33
No. ofCope Organization
1 MER Research Inc.ATTN: Dr. Moshe Ben-Reuven601 Ewing SL, Suite C-22Princeton, NJ 08540
Aberdeen Proving Ground
I Cdr, USACSTAATTN: STECS-PO, R. Hendricksen
34

USER EVALUATION SHEET/CHANGE OF ADDRESS
This Laboratory undertakes a continuing effort to improve the quality of the reports it publishes. Yourcomments/answers to the items/questions below will aid us in our efforts.
1. BRL Report Number BRL-MR-3992 Date of Report July 1992
2. Date Report Received
3. Does this report satisfy a need? (Comment on purpose, related project, or other area of interest forwhich the report will be used.)
4. Specifically, how is the report being used? (Information source, design data, procelure, source ofideas, etc.)
5. Has the information in this report led to any quantitative savings as far as man-hours or dollars saved,
operating costs avoided, or efficiencies achieved, etc? It so, please elaborate.
6. General Comments. What do you think should be changed to improve future reports? (Indicatechanges to organization, technical content, format, etc.)
Name
CURRENT OrganizationADDRESS
Address
City, State, Zip Code
7. If indicating a Change of Address or Address Correction, please provide the New or Correct Addressin Block 6 above and the Old or Incorrect address below.
Name
OLD OrganizationADDRESS
Address
City, State, Zip Code
(Remove this sheet, fold as indicated, staple or tape closed, and mail.)
DEPARTMENT OF THE ARMYDirector N OTG
S. yBaili tic Research LaboratoryNESAYATTN: SLBR-DD-T NECESARYEAberdeen Proving Groujnd, MD 21 005-5066 IF MAIED
OFICCIAL ss'u BUSINESS S E REPLY MARLUIEDSAEIRRSTUS FEW N O, AM MD
Postage will be paid by addressee.
DirectorU.S. Army Ballistic Research Laboratory________ATTN: SLCBR-DD-TAberdeen Proving Ground, MD 21005-5066 _______