report blended finance: understanding its november...
TRANSCRIPT

Report
www.devinit.org
Our vision is a world without poverty that
invests in human security, where everyone
shares the benefits of opportunity and growth
2016November
Blended finance: Understanding its potential for Agenda 2030

ii
Acknowledgements
This report was written by Rob Tew and Cecilia Caio of the Research and Analysis team at Development Initiatives. Additional content, analysis and guidance were provided by our colleagues Cordelia Lonsdale, Duncan Knox, Matthew Johnson, Emmanuel Kisaame, Kerry Smith, Anna Abuhelal, Simon Murphy, Rebecca Hills, Rory Scott, Bill Anderson, Wendy Rogers and Dan Coppard.
The authors are grateful for the cooperation of the following people who assisted us in obtaining data and other information on the use of blended finance in development:
Jaime Garcia Alba, Søren Peter Andreasen, Amy Bellinger, Julia Benn, Vladimir Betov, San Bilal, Clare Callender, Scarlett Carré de Malberg, Paddy Carter, Alice Chapple, Brenna Clerkin Lundstrom, Carmen Colla, Jeremie Dumon, Luca Etter, Christian Freres Kuer, Gonzalo Gutierrez, Monika Gysin, Tomas Hos, Ben Leo, Augusto Maquengo, Megumi Muto, Ola Nafstad, Andrew Palmer, Heike Rüttgers, Cecile Sangare, Emanuele Santi, Dean Segell, Marie Sennequier and Kruskaia Sierra-Escalante.
The content presented in this paper is the sole responsibility of Development Initiatives.

1
ContentsAcknowledgements ii
Executive summary 2
The context: a global development finance challenge 4
Analysis of current data on blended finance 6
Key findings 6
The global scale of blended finance 7
Where is blended finance spent? 9
Which countries and regions receive the most private capital through blended finance? 9
How is the distribution of blended finance affected by poverty or income levels? 11
How do blended finance allocations compare with other flows? 14
What is blended finance invested in? 16
Which sectors receive most private capital through blended finance? 16
How do blended finance investments align with the SDGs? 16
How do the main providers allocate blended finance by sector? 18
What difference does income level make to sector allocations? 18
Who are the main providers of blended finance? 21
How can data on blended finance be improved? 26
The need for better data 26
What improvements are needed? 26
Building blended finance into existing data standards 27
Annex: What is blended finance? 28
The challenge of defining blended finance 28
Blended finance and other forms of collaborative finance 28
The instruments used to blend finance 30
Acronyms and abbreviations 32
Methodology note 33
Notes 35
2 BLENDED F INANCE: UNDERSTANDING ITS POTENTIAL FOR AGENDA 2030
Financing the ambitious Agenda 2030 and the Sustainable Development Goals (SDGs) will be an enormous undertaking, with a funding gap in developing countries estimated at between US$1.9 trillion and US$3.1 trillion each year between now and 2030. Substantial additional financial resources from both domestic and international sources need to be mobilised, and attention has turned to how to make this happen.
Blended finance, or the use of public funds to de-risk or ‘leverage’ private investments in development, has been presented by donors and development finance institutions (DFIs) as having the potential to provide at least part of the solution. It is argued that it could tip the balance and encourage private investors to go where they normally would not. Some have gone even further, saying that blended finance could plug the entire SDG funding gap, expecting that it could turn billions of dollars into trillions. However, the discussion about blending has been based on very little evidence to date, and before scaling up investments
in this area we need a much better understanding of the role and the potential of blended finance.
This report contributes evidence to advance the policy debate on the use of blended finance by collating and analysing the available data about where blended finance is coming from and going to, and what it is being used for. We look at what this can tell us about its potential for financing the SDGs and look at the associated risks, opportunities and potential benefits for developing countries. The report considers these issues in the context of Agenda 2030’s ultimate goal of ending poverty and ensuring that no one is left behind.
Key findings
We find that the amount of private sector investment going to developing countries as a result of blended finance is currently small compared with other financial flows. The use of blended finance is growing, and there does appear to be potential for significant future growth. However, this growth
is not likely to meet the expectations of some blending champions: if the current annual growth rate were continued, private capital mobilised through blended finance would total US$42 billion by 2020 and US$252 billion by 2030 – well short of the gap in SDG funding.
Private investments mobilised through blended finance are currently higher in middle-income countries and developing countries with lower levels of poverty. However, private capital mobilised through blended finance does seem more likely to be invested in poorer countries than does foreign direct investment (FDI). We find that blended finance is most likely to be invested in infrastructure and the productive sectors, though we identify some case study examples of blended finance within the education and health sectors. It appears that, if blended finance is significantly scaled up, official development assistance (ODA) may need to be increasingly directed to the countries and sectors that benefit less from these instruments to optimise the
Executive summary

EXECUTIVE SUMMARY 3
comparative advantage of different resources within the financing mix. In other words, blended finance should be viewed by donors as a resource that complements rather than simply adds to other resources. This is an especially important point when ODA is continuing to plateau yet evidence shows that it is uniquely placed to target poverty.
Recommendations
Crucially, for blended finance to work for the sustainable development agenda, we need improved transparency and better data on how and where blended finance is going and the impact it is having. The analysis in this report highlights the gaps in evidence that currently exist, and what needs to change for the situation to adequately improve. A common standard of reporting needs to be established for all providers using blended finance instruments. The standard should ensure that data is sufficiently timely, comparable, accessible and disaggregated to use for tracking blended finance to the
destination country and receiving entity, and reporting its impact. It is also important to agree on a way of reporting information on investee companies (such as their jurisdiction and size) in order to understand whether ODA used in blending is complying with established standards of ‘untied aid’ and whether it is causing any distortions to local markets. This information is also necessary to enhance accountability of blended investments to beneficiary communities in countries.
The International Aid Transparency Initiative (IATI) standard could be used as the basis for reporting, since many actors in blending are already using it to report on their development spending, although the quality of data reported to IATI needs to improve. There also needs to be open dialogue between public sector providers of blended finance investments and other stakeholders, to establish how to improve qualitative aspects of reporting.
All of this is critical to ensure that donors and their partner countries can better understand the impacts of blending on poverty. It is also important for understanding the comparative advantages for poverty eradication of blending instruments in relation to traditional grants and loans. The guiding principle for donors should be that the role of ODA in blended finance increases available resources for targeting poverty, rather than pursuing private investment through blending as an end in its own right. Donors must carefully consider and discuss with their partner countries the most appropriate use of ODA for blending. This is particularly pertinent in light of the ongoing modernisation of the definition of ODA, which could incentivise donors to scale up their use of blended finance instruments in some of the poorest and most fragile developing countries. Since data and evidence are currently insufficient to inform decision-making on these points, providers should be active in calling for improved evidence and should be cautious in scaling up blending until better data becomes available.
4 BLENDED F INANCE: UNDERSTANDING ITS POTENTIAL FOR AGENDA 2030
The context: a global development finance challenge
Introduction: what is blended finance, and why do donors want to use it?
Broadly, blended finance can be defined as the use of public or philanthropic funds to attract additional investments from private sector actors into development projects.1 There are a range of opinions on, and differences in the definition of, blended finance (see Annex). However, for the purposes of this report, we focus mainly on the use of international public finance to attract additional investments from private sector actors. While acknowledging that some actors have been active in blending grants and loans solely from public sources, this focus on the mobilisation of private sector investments reflects the international debate and the focus of key donors; for example, the European Union has set out in its 2016 European External Investment Plan (EEIP) its intention to scale up the use of guarantees and other blending instruments to attract more private investments in development, particularly in Africa.2
Despite the recent upsurge in international attention, the concept behind blended finance is not a new one. The use of some blended finance instruments, such as guarantees, in the funding of projects has been a feature of development finance for decades. The main reason for the current increased focus is its perceived potential to raise very large sums of money for development projects from the private sector. This is especially important in light of the gap in funding available to pay for the Sustainable Development Goals (SDGs). It is estimated that the total investment needs in developing countries are
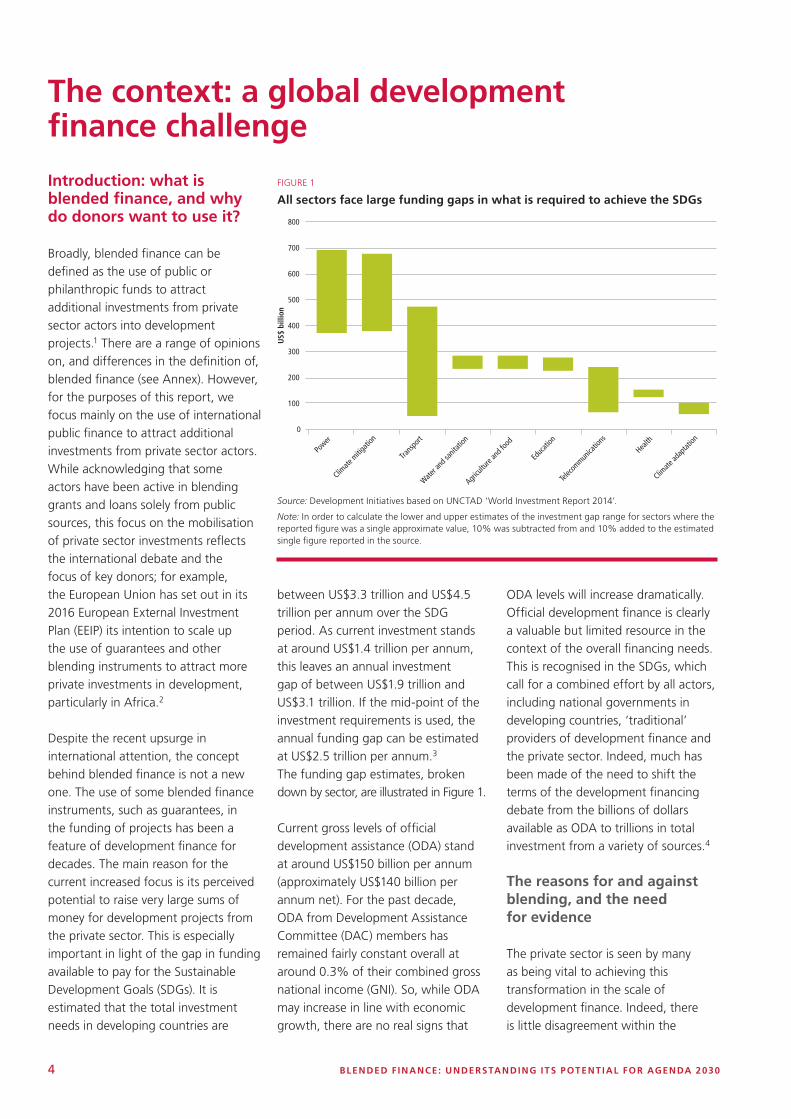
between US$3.3 trillion and US$4.5 trillion per annum over the SDG period. As current investment stands at around US$1.4 trillion per annum, this leaves an annual investment gap of between US$1.9 trillion and US$3.1 trillion. If the mid-point of the investment requirements is used, the annual funding gap can be estimated at US$2.5 trillion per annum.3 The funding gap estimates, broken down by sector, are illustrated in Figure 1.
Current gross levels of official development assistance (ODA) stand at around US$150 billion per annum (approximately US$140 billion per annum net). For the past decade, ODA from Development Assistance Committee (DAC) members has remained fairly constant overall at around 0.3% of their combined gross national income (GNI). So, while ODA may increase in line with economic growth, there are no real signs that
ODA levels will increase dramatically. Official development finance is clearly a valuable but limited resource in the context of the overall financing needs. This is recognised in the SDGs, which call for a combined effort by all actors, including national governments in developing countries, ‘traditional’ providers of development finance and the private sector. Indeed, much has been made of the need to shift the terms of the development financing debate from the billions of dollars available as ODA to trillions in total investment from a variety of sources.4
The reasons for and against blending, and the need for evidence
The private sector is seen by many as being vital to achieving this transformation in the scale of development finance. Indeed, there is little disagreement within the
Source: Development Initiatives based on UNCTAD ‘World Investment Report 2014’.
Note: In order to calculate the lower and upper estimates of the investment gap range for sectors where the reported figure was a single approximate value, 10% was subtracted from and 10% added to the estimated single figure reported in the source.
FIGURE 1
All sectors face large funding gaps in what is required to achieve the SDGs
0
100
200
300
400
500
600
700
800
Power
Climate
mitig
ation
Trans
port
Water a
nd sa
nitati
on
Agricu
lture
and f
ood
Educ
ation
Teleco
mmunica
tions
Health
Climate
adap
tation
US$
bill
ion
THE CONTEX T: A GLOBAL DEVELOPMENT F INANCE CHALLENGE 5
international community about the fact that private investment in developing countries is needed in order to finance the SDGs. Developing countries also prioritise the mobilisation of private investments in their own national plans and discourses.
Blended finance is viewed, by some, as a key means of underpinning private sector investment in development, allowing these investors to balance risk and reward in the world’s emerging markets. Some proponents of blended finance have been very optimistic about its potential to plug the SDG investment gap.5 Providers of blended finance also point to other advantages which make the case for the use of public finance in investment projects, such as adding a developmental focus to private projects, the sharing of best practice and skills enhancement, in addition to the financial potential.6
However, not all actors agree that using public money, especially ODA, to attract private investment is the solution, and the debate has become somewhat polarised between proponents and critics of blending. Critics have raised serious questions regarding the efficacy of blending as a financing source. They question whether it can truly meet the needs of developing countries, citing challenges with the transparency of such funding, its lack of focus on poverty and its lack of ownership by developing countries.7 There are also more technical and market-related concerns with blending, with a lack of consensus about how to measure its developmental and financial additionality, and a limited understanding of the long-term impacts of blending on markets – for example, the possible ‘crowding out’ of local investors.
There is also an important discussion to be had about the appropriate use of scarce ODA resources in blending, which will form part of the ongoing
discussion amongst DAC donors around the ‘modernisation’ of ODA. Currently, due to the poor quality of data, it is unclear how much ODA is being used to support blended finance; however, this finance will certainly be an increasing part of the ODA landscape. Changes in the rules governing ODA will mean that donors will be able to include in their ODA totals some types of support to the private sector that previously could not be counted as ODA.8 These private sector instruments (PSIs) will include investments in at least some forms of blended finance arrangements. This means that choices will have to be made as to how much ODA should be used to support blended finance. Also, other forms of ODA may need to be redirected away from areas that more readily attract private investment and toward interventions that are less likely to benefit from blended finance.
These discussions, and the decisions arising from them, must be informed by evidence founded on accurate, timely and accessible data. Fundamentally, the current debate around blended finance, for or against, is seriously hampered by a lack of data and evidence, both quantitative and qualitative.9
There is limited information on how and where blended finance is being used and what its impacts are. Much of the data that does exist is not publicly available, or is not easily comparable. A recently published OECD survey on the amounts mobilised from the private sector by official development finance interventions gives some insights into the places and sectors funded by blended finance.10 However, it does not provide data on the amounts spent by public actors in order to mobilise such private funding, nor the extent to which this has been counted as ODA. Some development finance institutions (DFIs) publish project-level data on their websites while others
include project information, including financial data, in their annual reports. This can provide useful insights into the scale of investments and, in some instances, the nature of the investors from whom additional financing is mobilised, as well as the countries and sectors of intervention. However, given the lack of common reporting standards, this data is not easily comparable across institutions, either in terms of comprehensiveness or format. Moreover, it can be difficult to separate data on blending activities from other, more traditional operations undertaken by DFIs – such as direct loans or equity purchases in private sector entities. The challenges and limitations of data on blended finance are discussed more fully later in this report.
This report uses OECD data on amounts mobilised, plus additional information obtained directly from some key actors, to assess the use of blended finance in order to begin to inform the debates around its current role and its potential as a source of development financing for the SDGs.

6 BLENDED F INANCE: UNDERSTANDING ITS POTENTIAL FOR AGENDA 2030
Key findings
The current amount of private sector investment going to developing countries as a result of blended finance is small compared with other financial flows. Private investment mobilised by blended finance accounts for less than 1% of flows to developing countries – far less than is provided through other sources such as commercial debt, foreign direct investment (FDI), remittances, ODA, etc.
The use of blended finance is growing and there does appear to be potential for significant future growth. Private investments mobilised by blended finance grew by around 20% annually between 2012 and 2014; by contrast, net ODA grew by 3.5% per annum over that period. Furthermore, the scale of funds available to private sector banks and other investors, such as pension funds, has led to speculation that the amount of finance that could potentially be mobilised through blended finance may be far greater than the current level. However, even if this potential is realised, it appears unlikely that blended finance alone will bridge the SDG funding gap. For example, if the current annual growth rate were continued, private capital mobilised through blended finance would total US$42 billion by 2020 and US$252 billion by 2030 – well short of what is required to meet the SDGs.
Private investments mobilised through blended finance are currently higher in middle-income countries and developing countries with lower levels of poverty. Although blended finance goes to countries at all levels of income, the amounts invested in middle-income
countries (MICs) are much higher than in low-income countries (LICs). Many countries which are facing the toughest challenges in achieving the SDGs – countries with high rates of poverty and very low government revenues – receive little or no investment from blended finance. LICs that received private capital investment through blended finance between 2012 and 2014 each received, on average, US$60 million of this type of finance; the equivalent figures for middle-income countries were US$352 million for lower-middle-income countries (LMICs) and US$404 million for upper-middle-income countries (UMICs).
However, private capital mobilised through blended finance does seem more likely than FDI to be invested in poorer countries. Although relatively small amounts of private capital mobilised through blended finance are invested in LICs, a large proportion is invested in LMICs. This is in contrast with FDI, which overwhelmingly gravitates towards UMICs. Between 2012 and 2014, 43% of private capital mobilised through blended finance went to LMICs and 47% to UMICs; for FDI, these figures were 22% and 70% respectively. Similarly, private capital mobilised through blended finance is more likely to be invested in countries with higher poverty levels or lower government revenues than is typical for FDI.
Private capital mobilised through blended finance is most likely to be invested in infrastructure and the productive sectors. Most private capital mobilised through blended finance is directed to the energy, industry, mining, construction and banking sectors. These sectors received two-thirds of all private
capital mobilised through blended finance between 2012 and 2014. Some sectors, such as education, biodiversity and water and sanitation, face large funding gaps in relation to the SDGs, but receive relatively little investment through blended finance. Blended finance may therefore be more relevant to some sectors than others. If its use increases and the sectoral pattern of current blended finance investments continues, other resources such as ODA may need to be diverted away from areas where blended finance is strong in order to target sectors receiving low levels of such investment.
Improved transparency of blended finance is critical. The findings of this report are based on the best available data, but that data has very significant room for improvement. Informed decision-making on the potential role of blended finance in development requires data and evidence. At present, judgements on the usefulness of blended finance in development are hampered by the quality and consistency of data available on such investments. As more blended finance-related activities are included in ODA, decisions will need to be taken on how much ODA should be spent on subsidising blended finance versus more traditional ODA interventions. There are no common reporting standards for actors involved in blended finance, and the data that does exist is typically contained in a range of disparate datasets. Much of the data is not publicly available and, where figures are available, data from different actors may be inconsistent or incompatible.
Analysis of current data on blended finance

ANALYSIS OF CURRENT DATA ON BLENDED F INANCE 7
FIGURE 2
Blended finance accounted for a small proportion of international financial flows to developing countries in 2014
US$ billion
The global scale of blended finance
Despite the recent attention given to the subject of blended finance, this form of investment represents a very small part of the resources directed toward developing countries. Data from the OECD’s survey of amounts mobilised from the private sector11 shows that in 2014 the blended finance activities of donors, DFIs and multilateral development banks (MDBs) collectively leveraged US$14.3 billion of investment from the private sector into development-related projects. By comparison, gross ODA disbursements to developing countries were over 10 times larger than this, at US$160 billion. When all forms of international resource flows to developing countries are taken into consideration (see Figure 2), it can be seen that private sector investment resulting from blended finance accounts for just 0.7% of the global total. The amount of money mobilised from the private sector by this means would have to increase by over 170-fold in order for blended finance alone to generate enough investment to address the SDG funding gap.
When considered in the context of the domestic resources of developing countries, the scale of resources mobilised via blended finance looks smaller still. The combined public and domestic commercial resources of developing nations amounted to approximately four times the total international flows to these countries in 2014 and over 600 times the scale of international private finance mobilised through blended finance (see Figure 3).
Although the amounts of international private capital mobilised through blended finance currently appear small in relation to the level of attention being given to blending in policy debates, this finding is not unexpected. Despite the use of blended finance
Sources: Development Initiatives based on data included in Investments to End Poverty (ITEP) 2015 and on OECD DAC, SIPRI Yearbook 2014, UN Conference on Trade and Development (UNCTAD), World Bank World Development Indicators (WDI), World Bank International Debt Statistics (IDS), World Bank Migration and Remittances database and OECD survey ‘Amounts Mobilised from the Private Sector by Official Development Finance Interventions’.
Note: Negatives have been set to zero at the country level for FDI, net short-term debt and net portfolio equity. Data is from 2014 where available. Most recent estimates for other providers of development cooperation, DFIs and private development assistance (PDA) are from 2013.
FIGURE 3
Domestic resources of developing countries exceed international flows, and dwarf private finance mobilised by blending (2014)
Sources: Development Initiatives based on data included in ITEP 2015 and on OECD DAC, SIPRI Yearbook 2014, UNCTAD, World Bank WDI, World Bank IDS, World Bank Migration and Remittances database, OECD survey ‘Amounts Mobilised from the Private Sector by Official Development Finance Interventions’ and IMF Article IV publications.
Note: Where available, data is for 2014. Most recent estimates for a number of flows included in both international and domestic resources are from 2013 – other providers of development cooperation, DFIs, PDA and domestic commercial resources.12
ODA – 7.2%
Other offical flows (OOFs) – 2.9%
Long-term debt (official) – 0.8%
Other providers of development cooperation – 1.1%
Development finance institutions (DFIs) – 1.8%
Peacekeeping – 0.4%
FDI – 22.4%
Long-term debt (commercial) – 32.2%
Short-term debt (net) – 5.0%
Portfolio equity (net) – 4.6%
Remittances – 19.0%
Private development assistance (PDA) – 2.0%
Private finance mobilised via blending – 0.6%
160
64 1725
39 9
501
720
111
103
424
45
14
6.6
0.3
2.2
1.4
0.5 0.014
US$8.9 trillion
US$2.2 trillion
0
1
2
3
4
5
6
7
8
9
10
Domestic International
US$
tri
llion
s
Public Commercial Private Private finance via blended finance
8 BLENDED F INANCE: UNDERSTANDING ITS POTENTIAL FOR AGENDA 2030
instruments for a number of years, it is widely accepted that this form of finance has not yet played a significant part in the financing of development. As the OECD DAC notes: “While the concept of blending public and private finance in the context of development co-operation is nothing new, it has played a marginal role so far.”13
The current focus on blended finance has far more to do with its perceived potential rather than the past or present scale of its deployment. According to many commentators, there is huge potential for scaling up blended finance to the point where it becomes a major component of funding for the SDGs.14 The optimism regarding this potential is largely based on the scale of private capital that exists globally – the annual SDG financing gap of approximately US$2.5 trillion is estimated to represent just 3% of global gross domestic product (GDP), 14% of global annual savings or 1.1% of the value of global capital markets, estimated at US$218 trillion.15 The expectation is that blended finance could ‘unlock’ this capital.
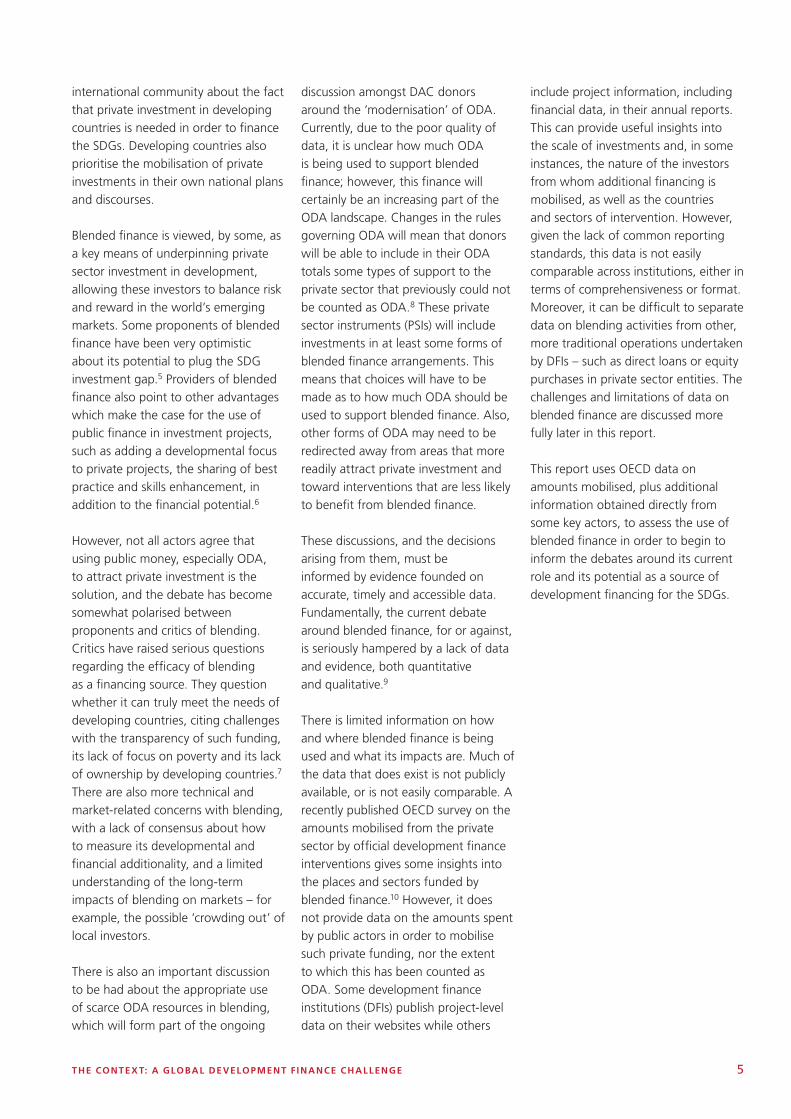
The use of blended finance has, indeed, increased in recent years – the amounts mobilised from the private sector by official development finance interventions increased year-on-year between 2012 and 2014, reaching US$14.3 billion in 201416 (see Figure 4). This represents an average annual increase in amounts mobilised of just under 20% per annum. This compares with an annual increase of less than 4% in ODA over the same period.
However, even if this growth rate were sustainable over the long run, private capital mobilised via blended finance will still provide only a fraction of the funds needed to finance the SDGs. If the 2012–2014 growth rate were extrapolated over the whole SDG period, the US$14.3 billion mobilised in 2014 would become approximately
Source: Development Initiatives based on OECD survey ‘Amounts Mobilised from the Private Sector by Official Development Finance Interventions’.
FIGURE 4
Private investment mobilised globally through blended finance have increased yearly
US$42 billion by 2020 and US$252 billion by 2030. While this would represent a very significant level of finance for developing countries, it would still be the case that by the end of the SDG period in 2030 private capital raised through blended finance would fill little more than a tenth of the estimated annual SDG funding gap. Though the figures are large, they fall a long way short of the increase from “billions to trillions” often referred to in the context of development finance.17 Development actors should not, therefore, see blending as a ‘silver bullet’ for financing all of the SDGs. Instead, we should now carefully assess where blending instruments can be a strategically deployed financing tool incorporated cohesively in the national financing frameworks of developing countries. Once we understand this evidence, blending could become part of a suite of international official financing tools, with each working to its comparative advantage, especially considering their impacts on poor people and communities.
‘Leverage ratios’ in particular can impact the scale of resources that can
be made available through blended finance. This term refers to the amount of additional finance mobilised from other sources divided by the amount of investment from the public sector provider (i.e. the DFI or donor agency investing in the blended finance arrangement). In plainer language: how much private finance does the public intervention manage to attract, or ‘leverage’?
Evidence on the leverage ratios achieved through blended finance is mixed, and there is no single methodology used by different blending actors to measure and monitor leverage. Data from CDC, the UK’s bilateral DFI, suggests that every dollar the institution invested in blended finance between 2012 and 2015 resulted in approximately an additional US$4.50 in investments from other actors, US$3.50 of which came from private sector investors.18 The 2015 annual report of SIFEM,19 the Swiss DFI, stated that every dollar it invested mobilised around US$9.30 of private investment for 2014–2015. Some organisations report even higher ratios – the 2016 annual report of
10.0
12.4
14.3
0
2
4
6
8
10
12
14
16
2012 2013 2014
US$
bill
ions
ANALYSIS OF CURRENT DATA ON BLENDED F INANCE 9
the International Finance Corporation (IFC),20 for example, states: “Each dollar of IFC capital leads to about US$20 of total project financing, including co-financing from other investors.”
On the one hand, these figures do appear to support the case that blended finance can be used to mobilise capital many times greater than the initial investment. However, they also suggest a potential ceiling to the amount of financing that could ultimately be generated through blended finance. DFIs invested a total of $40 billion in 2013 – only a fraction of which went to blended finance deals. Even if all of this money were diverted to blended finance, and assuming a uniform 20x leverage ratio, that would generate $800 billion of additional investment – well short of the $2.5 trillion SDG funding gap. In practice, even if this were desirable, DFIs are unlikely to divert all of their money into blended finance, and few are reporting leverage ratios as high as 20.
Thus, development actors may need to adjust global expectations for the realistic potential of blended finance in the future. Also, as the remainder of our analysis shows, any upscaling of private capital due to blended finance may be concentrated in certain sectors and countries, rather than spread across the board.
Where is blended finance spent?
Agenda 2030 has set the bar high for development actors and finance: to leave no one behind, and to end poverty everywhere in all its forms. While poverty is still deep and intractable in some of the poorest and least developed countries, there are also large numbers of poor people in some emerging and middle-income countries.
We know that the spread and distribution of both ODA and private investments do not always reach areas of global need. In this context, we need to understand better where blended finance is going, particularly in comparison with these other forms of finance. The developing countries of the world are not a homogenous group; different countries face very different levels of poverty and fragility, with wide disparities in the resources available to tackle these issues. The existing data on blended finance, though sparse, can give insights into which types of country are currently attracting most of these types of investment.
Most investments mobilised through blended finance are concentrated in a small number of developing countries. Further, the amount of private investment mobilised through blended finance varies according to the income level, poverty rate and government revenue of the recipient country. For example, levels of investment are
much lower in low-income countries compared with middle-income countries. During the period 2012–2014 LICs, which comprise 21% of the world’s developing countries, received only around 5% of private investment mobilised through blended finance.
Which countries and regions receive the most private capital through blended finance?
Between 2012 and 2014, private capital mobilised through the use of blended finance was invested in 98 developing countries – 39 in Africa, 29 in Asia, 19 in the Americas, 10 in Europe21 and just one country in Oceania.
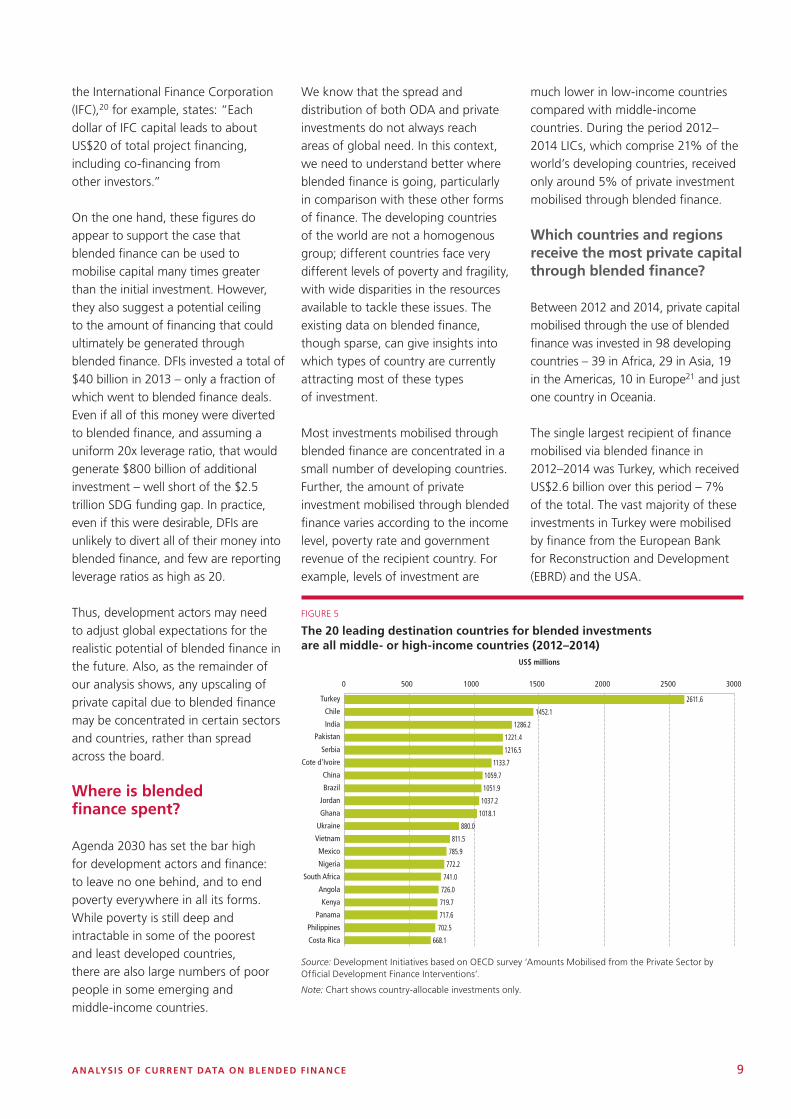
The single largest recipient of finance mobilised via blended finance in 2012–2014 was Turkey, which received US$2.6 billion over this period – 7% of the total. The vast majority of these investments in Turkey were mobilised by finance from the European Bank for Reconstruction and Development (EBRD) and the USA.
FIGURE 5
The 20 leading destination countries for blended investments are all middle- or high-income countries (2012–2014)
Source: Development Initiatives based on OECD survey ‘Amounts Mobilised from the Private Sector by Official Development Finance Interventions’.
Note: Chart shows country-allocable investments only.
2611.6
1452.1
1286.2
1221.4
1216.5
1133.7
1059.7
1051.9
1037.2
1018.1
880.0
811.5
785.9
772.2
741.0
726.0
719.7
717.6
702.5
668.1
0 500 1000 1500 2000 2500
Turkey
Chile
India
Pakistan
Serbia
Cote d'Ivoire
China
Brazil
Jordan
Ghana
Ukraine
Vietnam
Mexico
Nigeria
South Africa
Angola
Kenya
Panama
Philippines
Costa Rica
US$ millions
3000

10 BLENDED F INANCE: UNDERSTANDING ITS POTENTIAL FOR AGENDA 2030
Blended finance investments are fairly concentrated in a small number of countries, with the five largest recipients accounting for over a fifth of the total. Of the 20 biggest recipients, nine are LMICs, ten are UMICs and one (Chile) is classed as a high-income country (HIC) by the World Bank. The LIC that received the largest amount of investment mobilised by blended finance is Senegal – the 34th largest recipient of such finance. Senegal has made use of blended finance for development through initiatives such as the Senegal Strategic Investment Fund (FONSIS). The country’s key international partners include proponents of blending such as the World Bank’s IFC and the French development agency Agence Française de Développement (AFD).22
Oceania aside, countries on the other four continents benefited from substantial amounts of private capital mobilised through blended finance. Africa received the largest amount of such investment over the three-year period – US$10.6 billion, or 29% of the total. However, amounts mobilised for African nations fell in 2014, and Asia received the largest share of this type of finance in that year.
Breaking these allocations down into sub-regions, it can be seen that sub-Saharan Africa receives around nine times the level of private capital mobilised through blended finance compared with North Africa. Most of this private capital invested in sub-Saharan Africa went to five MICs in Western and Southern Africa – Angola, Cote d’Ivoire, Ghana, Nigeria and South Africa. Conversely, the Middle East region receives a much smaller share of this type of finance than the other regions of Asia.
Source: Development Initiatives based on OECD survey ‘Amounts Mobilised from the Private Sector by Official Development Finance Interventions’.
Note: ‘Unspecified’ refers to expenditure within donor country or which benefits several regions.
FIGURE 6
Africa saw a fall in private investment mobilised through blended finance in 2014
FIGURE 7
Sub-Saharan Africa received more private investment mobilised through blended finance than any other region between 2012 and 2014
Source: Development Initiatives based on OECD survey ‘Amounts Mobilised from the Private Sector by Official Development Finance Interventions’.
Note: ‘Unspecified’ refers to expenditure within donor country or which benefits several regions. Data for ‘Africa, regional’, ‘Asia, regional’ and ‘America, regional’ has been imputed to sub-regions based on the distribution of other recorded expenditure to these sub-regions.
2.8
4.3 3.5
3.4
2.4 4.2
1.3
3.2
3.3
2.3
1.1
2.1 1.3
1.2
0
2
4
6
8
10
12
14
16
2012 2013 2014
US$
bill
ions
Unspecified
Oceania
Europe
Americas
Asia
Africa
424, 19.3%
South of Sahara
North of Sahara
Far East Asia
Middle East
South and Central Asia
North and Central America
South America
Europe
Oceania
Unspecified
26.3%
2.8% 11.4%
4.2%
11.7%
8.9%
12.2%
15.1% 0.2%
7.3%

ANALYSIS OF CURRENT DATA ON BLENDED F INANCE 11
How is the distribution of blended finance affected by poverty or income levels?
Income groups
The income level of a country reflects the developmental challenges faced by that country. Specifically, LICs are characterised by high levels of vulnerability to external shocks.23 These may be purely economic shocks, due to e.g. falls in commodity prices, or driven by other factors, e.g. climate change. While there are limitations to grouping countries into broad categories, the particular challenges facing LICs are recognised by the World Bank, which uses income level as a key determinant of the level of concessionality of finance provided to a country.
Although private capital mobilised by blended finance is invested in countries in all regions of the world, the income level of the recipient country is a key indicator in the level of blended finance investments.
In the group of developing countries as a whole, 98 countries24 – almost 70% of all developing countries – were reported as receiving private sector funding via blended finance arrangements between 2012 and 2014. Countries receiving blended finance are spread across the different income groups: 24 out of 31 LICs received this type of funding, compared with 37 out of 52 LMICs and 35 out of 55 UMICs. Investments also went to two countries classed as both HICs and developing nations.
However, within the group of countries attracting blended finance investments, LICs receive much less on a per country basis compared with other developing countries. LICs obtained, on average, US$60 million of private investment per country between 2012 and 2014; the equivalent figures for other developing countries were six times higher – US$352 million for LMICs and US$404 million for UMICs.
FIGURE 8
Low-income countries receive a fraction of the private investment mobilised through blended finance
Sources: Development Initiatives based on OECD survey ‘Amounts Mobilised from the Private Sector by Official Development Finance Interventions’ and World Bank.
Note: Chart shows data for country-allocable investments only.
FIGURE 9
Allocation of amounts invested by six official sector providers by income group, 2012–2014
The result of this is that the overall amount of private investment associated with blended finance is far smaller for LICs compared with countries at higher income levels, as can be seen in Figure 8. During the period 2012–2014 LICs, which comprise 21% of the world’s developing countries, received around 5% of private investment mobilised through blended finance.
Analysis of the amounts invested by donor agencies and DFIs (as opposed to the private capital mobilised by these investments) reveals a similar pattern. An analysis of data (obtained by Development Initiatives) of six official sector providers of blended finance investments25 found that, collectively, these providers allocated 8% of their investments to LICs, 50% to LMICs and 38% to UMICs.
Sources: AFD, African Development Bank (ADB), Multilateral Investment Guarantee Agency (MIGA), Norfund, Overseas Private Investment Corporation (OPIC) and Private Infrastructure Development Group (PIDG).
4.4 4.0
4.6
4.4 3.7
6.0 1.1
0
2
4
6
8
10
12
14
2012 2013 2014
US$
bill
ions
(con
stan
t 20
14)
High-income (HIC)
Upper-middle-income (UMIC)
Lower-middle-income (LMIC)
Low-income (LIC)
7% 4% 12%
56%
49%
46%
37%
36%
40%
12% 2%
0%
10%
20%
30%
40%
50%
60%
70%
80%
90%
100%
2012 2013 2014
% o
f am
ount
inve
sted
/com
mit
ed
HIC
UMIC
LMIC
LIC
12 BLENDED F INANCE: UNDERSTANDING ITS POTENTIAL FOR AGENDA 2030
There are, however, significant variations between official sector providers in the type of country to which they direct their investments. For example, the Overseas Private Investment Corporation (OPIC, the USA’s bilateral DFI) and the Multilateral Investment Guarantee Agency (MIGA, the arm of the World Bank Group that focuses on providing guarantees for investments in developing countries) each directed only around 1% of their blended finance investments or guarantees to LICs between 2012 and 2014. By contrast, the one government development agency in this group, the French bilateral agency AFD, directed over 40% of its blended finance-related investments to LICs in this period.
Countries with different levels of domestic resources
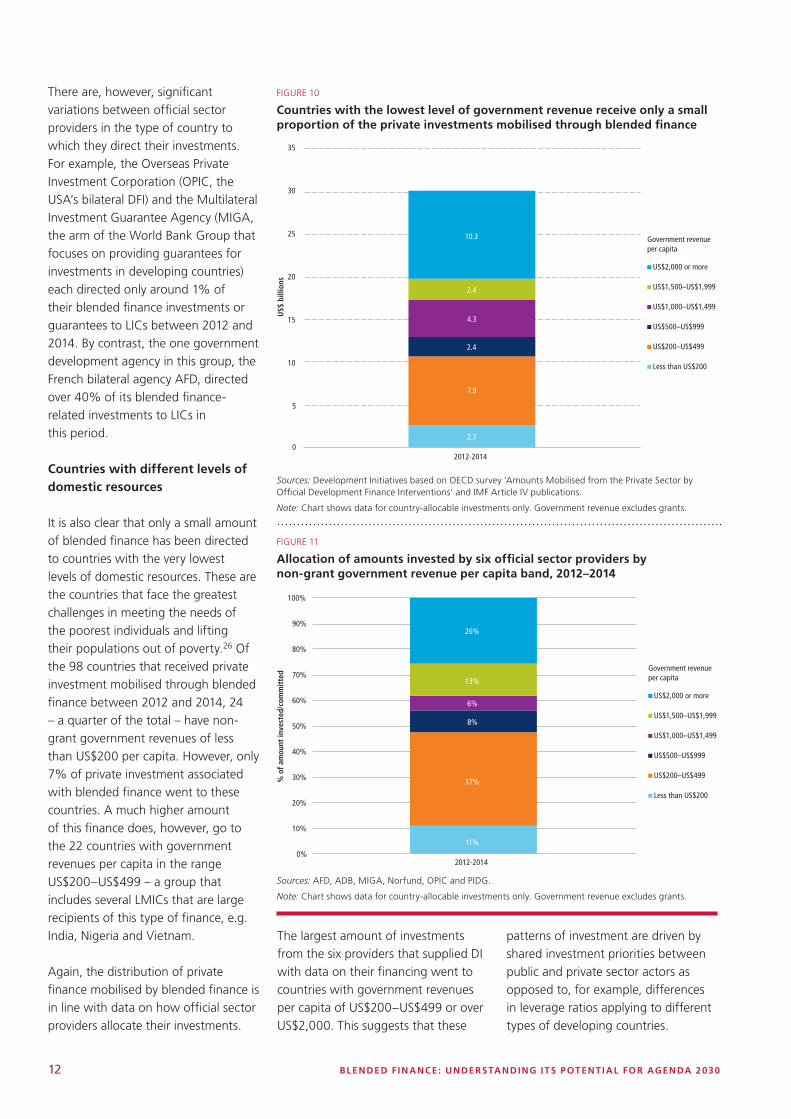
It is also clear that only a small amount of blended finance has been directed to countries with the very lowest levels of domestic resources. These are the countries that face the greatest challenges in meeting the needs of the poorest individuals and lifting their populations out of poverty.26 Of the 98 countries that received private investment mobilised through blended finance between 2012 and 2014, 24 – a quarter of the total – have non-grant government revenues of less than US$200 per capita. However, only 7% of private investment associated with blended finance went to these countries. A much higher amount of this finance does, however, go to the 22 countries with government revenues per capita in the range US$200–US$499 – a group that includes several LMICs that are large recipients of this type of finance, e.g. India, Nigeria and Vietnam.
Again, the distribution of private finance mobilised by blended finance is in line with data on how official sector providers allocate their investments.
The largest amount of investments from the six providers that supplied DI with data on their financing went to countries with government revenues per capita of US$200–US$499 or over US$2,000. This suggests that these
Sources: Development Initiatives based on OECD survey ‘Amounts Mobilised from the Private Sector by Official Development Finance Interventions’ and IMF Article IV publications.
Note: Chart shows data for country-allocable investments only. Government revenue excludes grants.
FIGURE 10
Countries with the lowest level of government revenue receive only a small proportion of the private investments mobilised through blended finance
FIGURE 11
Allocation of amounts invested by six official sector providers by non-grant government revenue per capita band, 2012–2014
Sources: AFD, ADB, MIGA, Norfund, OPIC and PIDG.
Note: Chart shows data for country-allocable investments only. Government revenue excludes grants.
patterns of investment are driven by shared investment priorities between public and private sector actors as opposed to, for example, differences in leverage ratios applying to different types of developing countries.
2.7
7.9
2.4
4.3
2.4
10.3
0
5
10
15
20
25
30
35
2012-2014
US$
bill
ions
US$2,000 or more
US$1,500–US$1,999
US$1,000–US$1,499
US$500–US$999
US$200–US$499
Less than US$200
Government revenueper capita
11%
37%
8%
6%
13%
26%
0%
10%
20%
30%
40%
50%
60%
70%
80%
90%
100%
% o
f am
ount
inve
sted
/com
mit
ted
2012-2014
US$2,000 or more
US$1,500–US$1,999
US$1,000–US$1,499
US$500–US$999
US$200–US$499
Less than US$200
Government revenueper capita
ANALYSIS OF CURRENT DATA ON BLENDED F INANCE 13
Countries with different poverty levels
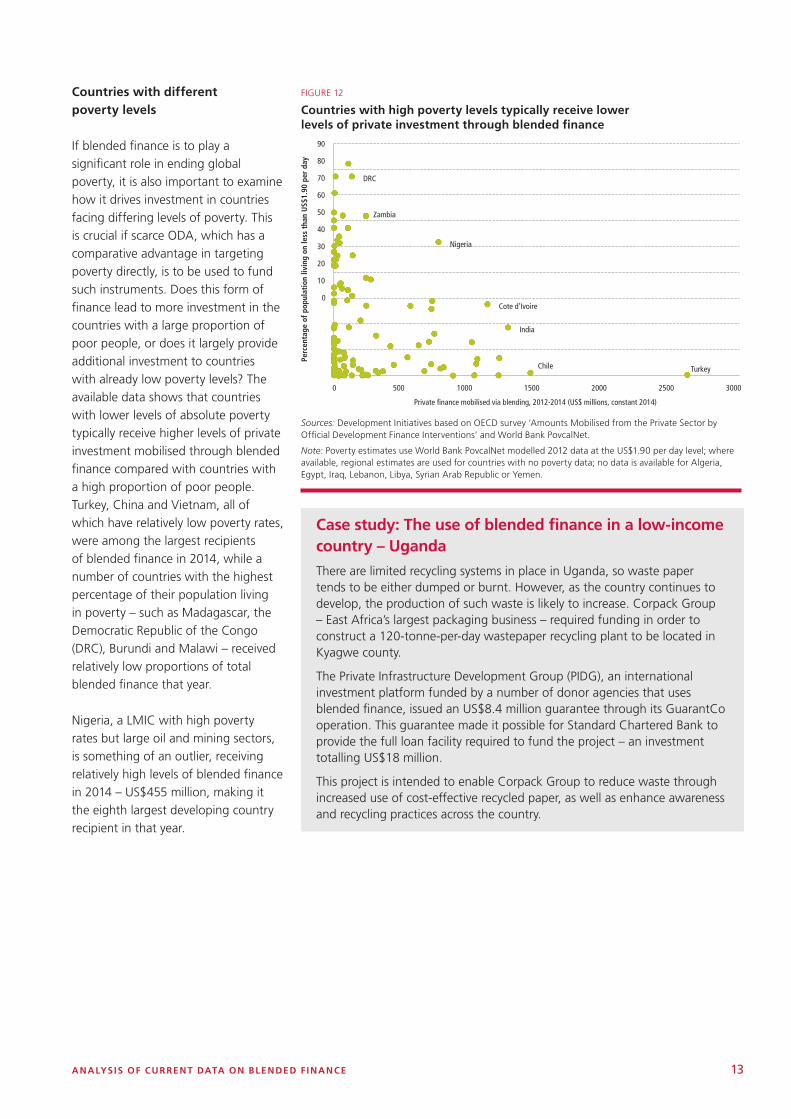
If blended finance is to play a significant role in ending global poverty, it is also important to examine how it drives investment in countries facing differing levels of poverty. This is crucial if scarce ODA, which has a comparative advantage in targeting poverty directly, is to be used to fund such instruments. Does this form of finance lead to more investment in the countries with a large proportion of poor people, or does it largely provide additional investment to countries with already low poverty levels? The available data shows that countries with lower levels of absolute poverty typically receive higher levels of private investment mobilised through blended finance compared with countries with a high proportion of poor people. Turkey, China and Vietnam, all of which have relatively low poverty rates, were among the largest recipients of blended finance in 2014, while a number of countries with the highest percentage of their population living in poverty – such as Madagascar, the Democratic Republic of the Congo (DRC), Burundi and Malawi – received relatively low proportions of total blended finance that year.
Nigeria, a LMIC with high poverty rates but large oil and mining sectors, is something of an outlier, receiving relatively high levels of blended finance in 2014 – US$455 million, making it the eighth largest developing country recipient in that year.
Sources: Development Initiatives based on OECD survey ‘Amounts Mobilised from the Private Sector by Official Development Finance Interventions’ and World Bank PovcalNet.
Note: Poverty estimates use World Bank PovcalNet modelled 2012 data at the US$1.90 per day level; where available, regional estimates are used for countries with no poverty data; no data is available for Algeria, Egypt, Iraq, Lebanon, Libya, Syrian Arab Republic or Yemen.
FIGURE 12
Countries with high poverty levels typically receive lower levels of private investment through blended finance
Case study: The use of blended finance in a low-income country – Uganda
There are limited recycling systems in place in Uganda, so waste paper tends to be either dumped or burnt. However, as the country continues to develop, the production of such waste is likely to increase. Corpack Group – East Africa’s largest packaging business – required funding in order to construct a 120-tonne-per-day wastepaper recycling plant to be located in Kyagwe county.
The Private Infrastructure Development Group (PIDG), an international investment platform funded by a number of donor agencies that uses blended finance, issued an US$8.4 million guarantee through its GuarantCo operation. This guarantee made it possible for Standard Chartered Bank to provide the full loan facility required to fund the project – an investment totalling US$18 million.
This project is intended to enable Corpack Group to reduce waste through increased use of cost-effective recycled paper, as well as enhance awareness and recycling practices across the country.
Chile
DRC
Cote d'Ivoire
India
Nigeria
Turkey
Zambia
0 500 1000 1500 2000 2500 3000
Private finance mobilised via blending, 2012-2014 (US$ millions, constant 2014)
0
10
20
30
40
50
60
70
80
90
Perc
enta
ge o
f pop
ulat
ion
livin
g on
less
tha
n U
S$1.
90 p
er d
ay

14 BLENDED F INANCE: UNDERSTANDING ITS POTENTIAL FOR AGENDA 2030
How do blended finance allocations compare with other flows?
Blended finance is one of many international financial flows to developing countries, all of which play a different role in financing development. The allocation of different types of financial flow is governed and motivated by different criteria. ODA is intended to focus exclusively on economic development or welfare while the allocation of other flows, such as FDI, is driven mainly by profit. Blended finance is a collaboration between development actors and profit-seeking private investors. Therefore, where a project is funded through blended finance investments, the aim of the project can and should be both developmental and profit-making. The way in which this affects the allocation of different types of finance can be seen by comparing blended finance distributions against those of FDI and ODA.
Blended finance is no more likely to be invested in LICs than FDI. Between 2012 and 2014, just 4% of FDI and 5% of private finance mobilised through blended finance was invested in LICs. This contrasts markedly with ODA
– 25% of which went to LICs over the same period.
However, there is a striking difference between blended finance and FDI investments in middle-income countries over this period. FDI overwhelmingly was invested in UMICs, while private investments mobilised by blended finance went to LMICs and UMICs in roughly equal proportions. In fact, the proportion of private finance mobilised through blended finance that was invested in LMICs (46%) was double the proportion of FDI invested in such countries. So while blended finance may not have a large impact in increasing investments in LICs, it may have some effect in incentivising private investments in LMICs.
When comparing the allocation of resources to countries experiencing different levels of extreme poverty, blended finance lies somewhere between ODA and FDI in terms of how much is allocated to countries experiencing high levels of poverty. Countries with less than 20% of their population living on less than $1.90 per day comprise almost two-thirds of developing countries, while 14% have a poverty headcount of 20–40% and 15% have a poverty headcount
Sources: Development Initiatives based on OECD survey ‘Amounts Mobilised from the Private Sector by Official Development Finance Interventions’, OECD DAC and UNCTAD.
Note: Data is for 2012-2014 and includes country-allocable inflows to all developing countries. Countries for which no income classification data is available are excluded from this analysis (Cook Islands, Montserrat, Niue, Saint Helena, Tokelau, Wallis and Futuna).
FIGURE 13
Proportionately, twice as much blended finance goes to LMICs compared with FDI
of 40–60%. The allocation of ODA broadly mirrors these proportions, whereas blended finance and especially FDI focus on countries with lower poverty rates.
Almost four-fifths of blended finance is allocated to countries with less than 20% of the population in absolute poverty (ODA: 57%) while the proportions allocated to countries with a poverty headcount of 20–40% and 40–60% are 16% and 4% respectively (ODA: 19% and 16%). This is in contrast to the allocation of FDI, over 90% of which goes to countries with less than 20% of the population living in absolute poverty.
However, even ODA is not, in general, strongly focused on the very poorest nations and, given the comparative advantage of ODA, there is considerable scope to improve its targeting of poverty. This has important implications for the future allocation of ODA, especially if blended finance increases in scale and continues mainly to be invested in countries with relatively low levels of poverty. An increase in blended finance to less poor countries may make it possible to focus ODA more closely on interventions that specifically target the poorest people.
Low-income
Lower-middle-income
Upper-middle-income
High-income
FDI
Private finance mobilised via blending
ODA
% of finance directed to countries with different income levels
30% 51% 19% 0.2%
5% 43% 47% 5%
70%4% 22% 5%

ANALYSIS OF CURRENT DATA ON BLENDED F INANCE 15
Sources: Development Initiatives based on OECD survey ‘Amounts Mobilised from the Private Sector by Official Development Finance Interventions’, OECD DAC, UNCTAD, World Bank PovCalNet.
Note: Data is for 2012-2014 and includes country-allocable inflows to all developing countries. Countries for which poverty data is not available are excluded from this analysis (Algeria, Egypt, Iraq, Lebanon, Libya, Syrian Arab Republic and Yemen).
FIGURE 14
80% of private investment generated by blended finance goes to countries with less than 20% of their population living in poverty – more than ODA but less than FDI
The allocation of these three classes of resource against the government revenue of destination countries also differs. It is clear that ODA is more likely to be allocated to countries with the very lowest level of government resources than either blended finance or FDI. However, this analysis also suggests that blended finance is more likely to attract investment into poorer countries than is the case for FDI.
FDI overwhelmingly goes to the 31 developing countries with government revenues of over US$2,000 per capita. Just 4% of FDI goes to the 29 countries with the lowest government revenues per capita. Of the private sector investment mobilised by blended finance, 34% went to the countries with the highest levels of domestic resources, with 9% to countries with government revenues of less than
US$200 per capita. A significant proportion of resources mobilised via blended finance (26%) went to the 23 countries with government revenues of between US$200 and US$499 per capita.
Sources: Development Initiatives based on OECD survey ‘Amounts Mobilised from the Private Sector by Official Development Finance Interventions’, OECD DAC, UNCTAD, IMF Article IV publications, IMF World Economic Outlook (WEO), World Bank World Development Indicators (WDI).
Note: Data is for 2012-2014 and includes country-allocable inflows to all developing countries. Countries for which no government revenue data is available are excluded from this analysis (Cook Islands, Cuba, Korea DPR, Montserrat, Nauru, Niue, Saint Helena, Syrian Arab Republic, Tokelau, Wallis and Futuna, West Bank and Gaza Strip).
FIGURE 15
A higher proportion of blended finance goes to countries with lower government revenues compared with FDI
FDI
Private finance mobilised via blending
ODA
US$2,000 or more
US$1,500–US$1,999
US$1,000–US$1,499
US$500–US$999
US$200–US$499
Less than US$200
Government revenueper capita
35% 30% 13% 7% 2% 13%
9% 26% 8% 14% 8% 34%
3%4% 12% 8% 9% 64%
% of finance directed to countries with different levels of government revenue
2%
2%
8%
3%
4%
16%
3%
16%
19%
92%
79%
57%
FDI
Private finance mobilised via blending
ODA
% of finance directed to countries with different levels of poverty
More than 60%
40–60%
20–40%
Less than 20%
Poverty headcount indestination country

16 BLENDED F INANCE: UNDERSTANDING ITS POTENTIAL FOR AGENDA 2030
What is blended finance invested in?
If blended finance is to play a significant role in funding the SDGs, this raises the question – which SDGs? Is this form of finance likely to target all development goals equally, or will some goals be more suitable for or attractive to it?
It has been stated that some investments in the social sectors are unlikely to generate sufficient financial returns to support the use of market-based instruments.27 Other observers have, however, been optimistic about using mechanisms such as social impact bonds to leverage private capital into social sector interventions.28
Ultimately, national actors will define which goals need to be incorporated into their national plans and so require financing. Therefore analysis of the sectors likely to be supported by blended finance is also necessary to inform countries’ dialogue with partners, as well as the global debate.
Which sectors receive most private capital through blended finance?
Currently blended finance is invested primarily in the productive sectors. The top three sectors over the 2012–2014 period were energy (US$11 billion), industry, mining and construction (US$8 billion) and banking and financial services (US$7 billion). Combined, these three sectors accounted for over two-thirds of private sector investment mobilised by blended finance.
Significant amounts also went to the transport and storage sector (US$2 billion) and the agriculture, forestry and fishing sector (US$1.5 billion). Investments in water supply and sanitation associated with blended finance totalled over US$1.3 billion but almost $1 billion of this was in 2013,
with much smaller amounts invested in 2012 and 2014.
Of the social sectors, health received almost US$1.3 billion during this period, although volumes fell by 32% between 2013 and 2014. The education sector received just US$29 million of this type of funding between 2012 and 2014 – less than 0.1% of the global total.
Unfortunately, the data that is currently available does not make it possible to analyse the sector split of private finance mobilised through blended finance in any more detail. In order to thoroughly evaluate how these investments are being used, it will be necessary for the providers of blended finance to publish better information. This should include sub-divisions of sectors to show, for example, what type of health interventions are being funded (see section: “How can data on blended finance be improved?” below).
Source: Development Initiatives based on OECD survey ‘Amounts Mobilised from the Private Sector by Official Development Finance Interventions’.
FIGURE 16
Infrastructure and productive sectors receive most private investment mobilised through blended finance
How do blended finance investments align with the SDGs?
As previously noted, much of the debate around blended finance focuses on its potential to mobilise significant funding toward the SDGs. However, the private capital mobilised through blended finance is overwhelmingly invested in just a few sectors. This fact has important implications regarding the extent to which blended finance is likely to support the SDGs.
Figure 17 shows the percentage of the overall SDG funding gap attributable to each sector against the proportion of blended finance going to each sector (percentage of private finance mobilised via blending over the period 2012–2014).
The power/energy sector, which accounts for 20% of the overall SDG funding gap, receives 30% of the
2.8
4.4 3.9
2.2
3.3
2.6
2.3
1.7
3.1
0
2
4
6
8
10
12
14
16
2012 2013 2014
US$
bill
ions
8 others
Communications
Trade policies and regulations
Health
Water supply and sanitation
Other multi-sector
Agriculture, forestry, fishing
Transport and storage
Banking and financial services
Industry, mining, construction
Energy

ANALYSIS OF CURRENT DATA ON BLENDED F INANCE 17
FIGURE 17
Some sectors receive a small amount of private finance from blending compared to their share of the SDG funding gap
Sources: Development Initiatives based on OECD survey ‘Amounts Mobilised from the Private Sector by Official Development Finance Interventions’ and UNCTAD ‘World Investment Report 2014’.
Note: The total SDG funding gap estimate is based on sectoral investment gap estimates reported in UNCTAD’s ‘World Investment Report 2014’. Total private finance mobilised via blending include all data from the OECD survey on amounts mobilised from the private sector, for the years 2012–2014. The latter includes sectors beyond those that feature in the chart, so the percentages shown for amounts mobilised do not add up to 100%.
amount mobilised through blended finance. Conversely, some sectors receive very little capital from blended finance in relation to their share of the funding gap – most notably education and, to a lesser extent, telecoms, agriculture, and water and sanitation.
Thus, even if there is a very large scaling-up of private investments mobilised through blended finance, some key components of the SDGs will still be left facing substantial funding gaps. The comparative lack of support to transport and telecommunications appears anomalous, as these are areas of infrastructure that could be expected to attract the sort of private capital that blended finance aims to mobilise. Other sectors, such as education, biodiversity and water and sanitation, may need additional attention. There is some evidence that it is possible to use blended finance in education (see EYE Bond case study). However, if the current pattern of investment is maintained, the financing for some SDGs will need to come mainly from sources other than blended finance.
Case study: Using blended finance in the education sector – the Education, Youth and Employment (EYE) Bond
The Inter-American Development Bank (IADB) launched the EYE bond programme in 2014, and to date this has raised over $650 million.29 The IADB helps Latin American and Caribbean (LAC) countries to increase productivity and improve social inclusion of young people through key stages: education (e.g. promoting effective teaching and learning, enhancing teacher training and ensuring adequate resources); youth (e.g. acquisition of life skills to reduce the likelihood of engaging in high-risk behaviour); and employment (e.g. design, implementation and evaluation of policies to improve job opportunities and develop workforce skills).30 The EYE bond was launched as a means for the IADB to attract funding for these interventions from a broader investor base.
EYE bonds provide loan funding to eligible projects in LAC countries. From 1 October 2014 to 31 March 2016, the bonds provided funds to 23 education projects, seven youth projects and five employment projects in 19 different countries.31
The IADB issued an inaugural EYE bond of US$500 million, maturing in 2018, which was purchased by 24 investors. Fifteen of these investors were from the private sector and included pension funds, insurance companies, banks and asset management companies. The other investors were central banks or other official institutions (e.g. the UN Development Programme). Since the launch of the initial bond, smaller bonds have been issued targeted at specific markets, e.g. Japanese retail investors, and managed by different managers such as Nomura and JP Morgan.32
The IADB uses commercial banks to structure the bonds, and it meets with potential investors itself. The investors purchase a bond, receiving periodic coupons (interest payments) and the bond principal at maturity. An amount equal to the net proceeds of the EYE bond is then put into a sub-account for eligible projects. EYE bonds carry the triple-A credit rating of the IADB, and not the risk of the underlying projects. This means that they provide investors with a financial return commensurate with a triple-A rating, plus a social return.33
22%
25%
11% 11% 11% 10%
6% 6%
30%
19%
5%
4% 4%
0%
2%
4%
0%
5%
10%
15%
20%
25%
30%
35%
Power
Climate
Trans
port
Water a
nd sa
nitati
on
Agricu
lture
and f
ood s
ecurity
Educ
ation
Teleco
mmunica
tions
Health
% of SDG fundinggap attributableto each sector
% of private capitalmobilised by blendingallocated toeach sector

18 BLENDED F INANCE: UNDERSTANDING ITS POTENTIAL FOR AGENDA 2030
How do the main providers allocate blended finance by sector?
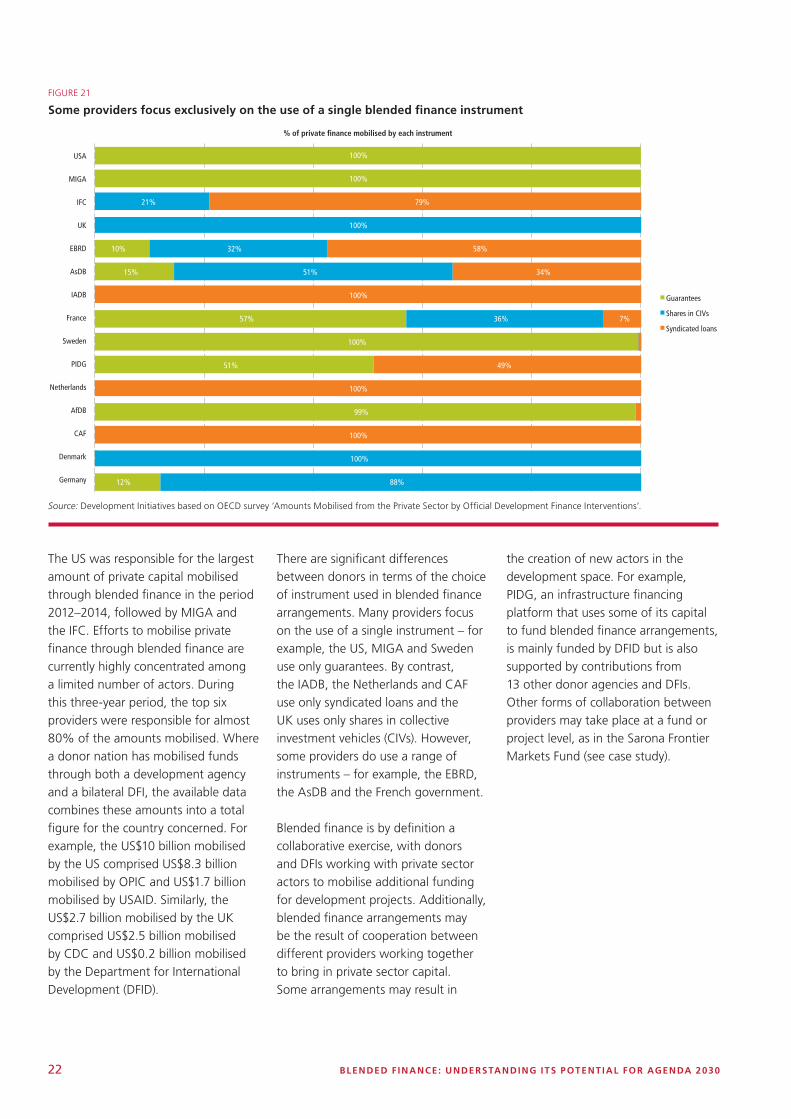
The focus on investment in infrastructure and the productive sectors is evident across all the main providers of blended finance. Energy; banking and financial services; and industry, mining and construction were the sectors receiving the highest investments mobilised by four of the top six providers of this type of finance (IFC, MIGA, the UK and the US). For the EBRD, the main sectors were industry, mining and construction; banking and financial services; and agriculture, while for funds mobilised through the Asian Development Bank (AsDB) the leading sectors were energy; banking and financial services; and water and sanitation.
What difference does income level make to sector allocations?
The main sectors receiving investment through blended finance are quite similar across different types of country. Investments in productive sectors and infrastructure dominate allocations across countries at all income levels.
This is different from the distribution of ODA, which can vary significantly from country to country. For example, LICs receive large amounts of ODA funding for health and humanitarian crisis situations. In MICs, more ODA is directed toward infrastructure. ODA also supports efforts to improve governance and security in countries
at all income levels – a sector grouping that is less likely to receive funding through blended finance.
Consequently, if blended finance investments were to increase in scale, the current level of ODA spending on infrastructure projects in middle-income countries may become duplicative. This could enable donors to redirect ODA away from e.g. infrastructure projects in MICs and to focus ODA more closely on its potential areas of comparative advantage, increasing funding for LICs while maintaining support for governance and security across developing nations at all income levels.
Country governments identify a project for which they need a loan and apply to the IADB, and the IADB evaluates the project against eligibility criteria. If approved, the IADB assesses whether the project is eligible for EYE bond funding based on its sector and timing. Often projects are funded through a mix of EYE bond funding and other IADB funds. Once approved, the country government implements the project and the IADB supervises and monitors it, including disbursement, financial management, procurement procedures, risk management and/or safeguards and compliance policy.34
The projects themselves are executed by agencies such as ministries of education and labour on behalf of the governments taking out the IADB loans. Projects are typically executed over a period of 5–7 years and so, as the EYE bonds were only introduced in 2014, many projects have yet to achieve their final results. However, some bond funds have been used for existing projects, and examples of interim results to date include improved learning outcomes for first-grade children in Panama, support provided to over 50,000 job seekers in Bolivia and home visits made to almost 50,000 families in Nicaragua with a child under six to promote parenting skills.35

ANALYSIS OF CURRENT DATA ON BLENDED F INANCE 19
FIGURE 18
Top six blended finance providers by sector, 2012–2014
Source: Development Initiatives based on OECD survey ‘Amounts Mobilised from the Private Sector by Official Development Finance Interventions’.
36%
33%
18%
13%
Asian Development Bank
Energy
Banking andfinancial services
Water supplyand sanitation
Health
European Bank for Reconstruction and Development
Energy
Banking andfinancial services
Health
Industry, mining,construction
Agriculture, forestry,fishing
Transport and storage
Other
32%
26%
13%
12%
8%
7% 2%
International Finance Corporation
Energy
Banking andfinancial services
Industry, mining,construction
Agriculture, forestry,fishing
Transport and storage
Other
27%
26%
22%
16%
6% 3%
Multilateral Investment Guarantee Agency
Energy
Banking andfinancial services
Water supplyand sanitation
Industry, mining,construction
Transport and storage
Other multi-sector
Other
25%
19%
15%
12%
11%
11%
7%
United Kingdom
Energy
Banking andfinancial services
Industry, mining,construction
Unallocated /unspecified 65%
23%
11% 1%
United States
Energy
Banking andfinancial services
Health
Industry, mining,construction
Agriculture, forestry,fishing
Other
33%
23%
22%
7%
6%
9%

20 BLENDED F INANCE: UNDERSTANDING ITS POTENTIAL FOR AGENDA 2030
FIGURE 19
ODA and blended finance fund different sectors in LICs, but may be duplicative in MICs
Source: Development Initiatives based on OECD survey ‘Amounts Mobilised from the Private Sector by Official Development Finance Interventions’ and OECD DAC CRS database.
0%
10%
20%
30%
40%
50%
60%
70%
80%
90%
100%
ODA Private finance mobilised via blending
Global
Other62%
Other33%
Governance and security10%
Health13%
Infrastructure15%
Industry, mining, construction18%
Banking and financial services21%
Energy27%
0%
10%
20%
30%
40%
50%
60%
70%
80%
90%
100%
ODA
LICs
Other51%
Other30%
Humanitarian14%
Governance and security14%
Health21%
Industry, mining, construction13%
Banking and financial services27%
Communications30%
Private finance mobilised via blending
0%
10%
20%
30%
40%
50%
60%
70%
80%
90%
100%
ODA
LMICs
Other56%
Other28%
Health13%
Governance and security14%
Infrastructure21%
Industry, mining, construction22%
Transport and storage15%
Energy35%
Private finance mobilised via blending0%
10%
20%
30%
40%
50%
60%
70%
80%
90%
100%
ODA
UMICs
Other60%
Other37%
Education8%
Governance and security9%
Infrastructure23%
Industry, mining, construction21%
Banking and financial services27%
Energy15%
Private finance mobilised via blending

ANALYSIS OF CURRENT DATA ON BLENDED F INANCE 21
Who are the main providers of blended finance?
Blended finance, by its nature, involves a combination of actors, including domestic governments, international, official/public, philanthropic and private/commercial (both financial and non-financial, ranging in size from multinationals to micro, small and medium-size enterprises).
The institutional set-ups in blended finance are often complex. It is perhaps unhelpful to think of the actors involved in terms of the traditional donor–recipient, North–South model of aid relations. By nature and objective, blended finance requires a much greater role to be played by private capital (whether domestic or international), which points to the need for official development partners to find ways of effectively working with new actors within new incentive and institutional set-ups.36 For the purposes of this paper, partly due to the limitations of data, we have focused on the activities of those organisations that provide public, or official, sector finance (or other inputs that are non-financial, such as guarantees) which are intended to mobilise additional investment from private sector investors. These actors we have termed the providers of blended finance.
These providers include donor governments,37 which provide direct funding to blended finance investments through their bilateral development agencies, such as the French development agency AFD. Apart from donor governments, DFIs, both bilateral and multilateral, are key players in blended finance – these organisations typically occupy the space between public aid and private investment.38 They generally provide credit in the form of higher-risk loans, equity positions and risk guarantee instruments to private sector investments in developing countries.39 They are, for the most part,
controlled by governments40 and exist to catalyse increased investment in developing countries in order to foster economic growth and development. While some (not all) mention poverty reduction specifically in their mission statements, DFIs operate in a different way from government development agencies in that they adhere to market rules and aim to remain financially viable. However, DFIs vary as to the profit targets they set and so cannot be lumped together as a single actor. They have different governance structures, different return on investment (ROI) targets, different portfolio sizes and different comparative advantages in terms of sectors, geographical locations and instruments. This means that the nature of DFIs can be diverse, and so can their role and the scale of their involvement in blended finance activities. Also, in addition to pre-existing organisations, actors may, individually or acting collectively, set up and fund specific entities that focus on the mobilisation of private capital for development purposes. An example of this is the Private Infrastructure
Development Group (PIDG), a multi-donor organisation funded by a combination of bilateral donor agencies, bilateral DFIs and multilateral DFIs.
Philanthropic foundations and international NGOs/CSOs can also provide concessional inputs into blended finance activities. Both these types of actor have similar motivations41 for participating in blending activities: these relate to the scaling up of the development impact of their projects by expanding the pool of available funding by attracting additional private capital.
The OECD survey of amounts mobilised from the private sector by official development finance interventions identified 30 separate providers who reported activities that resulted in the investment of private capital. Six of these providers were donor development agencies, 14 were bilateral DFIs and 10 were multilateral bodies such as regional development banks, international finance institutions and PIDG.
Source: Development Initiatives based on OECD survey ‘Amounts Mobilised from the Private Sector by Official Development Finance Interventions’.
Note: Data for the IFC is available only for 2014; data for other providers covers 2012–2014.
FIGURE 20
Most private sector investment from blended finance is mobilised by a small number of actors
10.0
8.1
3.7
2.7
2.1
2.1
1.9
1.7
0.8
0.8
0.7
0.4
0.4
0.3
0.3
0.6
0 2 4 6 8 10 12
US
MIGA
IFC
UK
EBRD
AsDB
IADB
France
Sweden
PIDG
Netherlands
AfDB
CAF
Denmark
Germany
10 others
US$ billions (constant 2014 prices)
22 BLENDED F INANCE: UNDERSTANDING ITS POTENTIAL FOR AGENDA 2030
The US was responsible for the largest amount of private capital mobilised through blended finance in the period 2012–2014, followed by MIGA and the IFC. Efforts to mobilise private finance through blended finance are currently highly concentrated among a limited number of actors. During this three-year period, the top six providers were responsible for almost 80% of the amounts mobilised. Where a donor nation has mobilised funds through both a development agency and a bilateral DFI, the available data combines these amounts into a total figure for the country concerned. For example, the US$10 billion mobilised by the US comprised US$8.3 billion mobilised by OPIC and US$1.7 billion mobilised by USAID. Similarly, the US$2.7 billion mobilised by the UK comprised US$2.5 billion mobilised by CDC and US$0.2 billion mobilised by the Department for International Development (DFID).
FIGURE 21
Some providers focus exclusively on the use of a single blended finance instrument
There are significant differences between donors in terms of the choice of instrument used in blended finance arrangements. Many providers focus on the use of a single instrument – for example, the US, MIGA and Sweden use only guarantees. By contrast, the IADB, the Netherlands and CAF use only syndicated loans and the UK uses only shares in collective investment vehicles (CIVs). However, some providers do use a range of instruments – for example, the EBRD, the AsDB and the French government.
Blended finance is by definition a collaborative exercise, with donors and DFIs working with private sector actors to mobilise additional funding for development projects. Additionally, blended finance arrangements may be the result of cooperation between different providers working together to bring in private sector capital. Some arrangements may result in
the creation of new actors in the development space. For example, PIDG, an infrastructure financing platform that uses some of its capital to fund blended finance arrangements, is mainly funded by DFID but is also supported by contributions from 13 other donor agencies and DFIs. Other forms of collaboration between providers may take place at a fund or project level, as in the Sarona Frontier Markets Fund (see case study).
Source: Development Initiatives based on OECD survey ‘Amounts Mobilised from the Private Sector by Official Development Finance Interventions’.
100%
100%
10%
15%
57%
100%
51%
99%
12%
21%
100%
32%
51%
36%
100%
88%
79%
58%
34%
100%
7%
49%
100%
100%
USA
MIGA
IFC
UK
EBRD
AsDB
IADB
France
Sweden
PIDG
Netherlands
AfDB
CAF
Denmark
Germany
Guarantees
Shares in CIVs
Syndicated loans
% of private finance mobilised by each instrument

ANALYSIS OF CURRENT DATA ON BLENDED F INANCE 23
In line with the analysis of data at a global level, the majority of private finance mobilised by most providers is destined for countries with relatively low poverty rates. For some providers, for example the UK and Germany, it is not clear how much of their blended finance efforts are focused on countries at different levels of poverty, since they report the majority of private finance mobilised as going to regional projects.
However, there are exceptions to this overall trend. Some leading providers of blended finance do report mobilising private finance for projects in countries with higher poverty rates. France reports that 46% of private finance mobilised through its blended finance investments went to countries with a poverty headcount of over 20% of the population. PIDG also reported that nearly half of the private finance mobilised through its blended finance investments went to countries with a poverty headcount of over 20%. Of the other providers, 38% of private finance mobilised by MIGA went to countries with a poverty headcount of over 20% of the population.
It is clear that some providers are mobilising more private finance in the poorest countries than is the case for others. If blended finance is to have a positive impact on the poorest countries, the experiences of those actors who have a track
Source: Development Initiatives based on OECD survey ‘Amounts Mobilised from the Private Sector by Official Development Finance Interventions’.
Note: Data is for 2012 -2014. Countries for which poverty data is not available are excluded from this analysis (Algeria, Egypt, Iraq, Lebanon, Libya, Syrian Arab Republic and Yemen).
FIGURE 22
A few providers mobilise significant amounts of blended finance in countries with higher poverty levels
Case study: Donor collaboration to establish blended finance facilities – the Sarona Frontier Markets Fund 2 (SFMF2), jointly funded/guaranteed by Canada and the US
Established in 2013, SFMF2 is a partnership between Global Affairs Canada (formerly DFATD42), the Overseas Private Investment Corporation (OPIC – a DFI set up by the US government) and Sarona Asset Management Inc. SFMF2 aims to close funding gaps faced by small and medium-sized enterprises (SMEs) which, despite playing a pivotal role in economic growth and development, are often constrained by limited resources. It is through the development-related work that SMEs are doing that SFMF2 contributes to the attainment of the SDGs; Sarona’s ’Annual Values Report 2016’ documents the various contributions being made towards this goal.43
SFMF2 is a fund of funds that was established with an initial investment of US$15 million from DFATD, which acted as first-loss capital. An additional US$50 million was supplied through a loan arrangement set up by OPIC. In this arrangement, OPIC acted as the lender of record and provided its funding through certificates of participation (COPs) in the loan. These were sold in the US capital markets and guaranteed by OPIC. A further US$85 million was directly invested in SFMF2 by a range of individuals, corporations, foundations, non-profit organisations, pension funds and endowments, making a total fund value of US$150 million.
SFMF2 “focuses on investing growth capital in companies and private equity funds in frontier and emerging markets around the world”.44 By June 2016, it had provided capital for investment in many countries, including Colombia, Egypt, Tunisia, Mexico, Malaysia, Nigeria, Morocco, Turkey, India, Algeria, Angola, Brazil, Indonesia, Ecuador, Peru, Vietnam and South Africa.45 SFMF2 is reported to be contributing to 15 of the 17 SDGs through the various portfolios that Sarona funds.46
record of mobilising investments in such countries will be an important source of evidence about how these investments work in a poor-country context. This emphasises the need to promote more systematic reporting practices to generate evidence.
29%
35%
12%
33%
17%
17%
7%
75%
62%
88%
20%
100% 68%
81%
19%
39%
52%
90%
100%
36%
13%
79%
20%
18%
34%
41%
93%
64%
98%
% of private finance to each poverty band
More than 60%
40–60%
20–40%
Less than 20%
Non-country recipient
Poverty headcount indestination country
USA
MIGA
IFC
UK
EBRD
AsDB
IADB
France
Sweden
PIDG
Netherlands
AfDB
CAF
Denmark
Germany

24 BLENDED F INANCE: UNDERSTANDING ITS POTENTIAL FOR AGENDA 2030
Blending is defined by the European Commission as “the combination of EU grants with loans or equity from public and private financiers”.47 To date, however, EU blending projects have mainly leveraged loans from DFIs, as opposed to private sector actors – which is why data on EU blended finance projects has not been collated with other data used elsewhere in this report.
Blending by the EU takes place through seven regional blending facilities, which have been established for all regions of EU external cooperation.48 Blending operations are guided by the EU Platform for Blending in External Cooperation, whose objective is to improve the quality and efficiency of EU blending mechanisms, while also helping to strengthen coherence between blending activities and EU policies.49 The EU has also recently insisted that blending operations be consistent with development effectiveness principles and that they should pursue the SDGs.50 Since it was first introduced in
The European Union blending facilities – using blended finance to combine investments from official sector actors
the 2007–2013 Multiannual Financial Framework, blending has become an increasingly important tool of EU external cooperation, and its scope is being further expanded in terms of both scale and sectors of implementation (i.e. there is an intention of going beyond infrastructure projects into agriculture and social sectors).
The amount of EU budget grant funding spent on blended finance projects grew from US$22 million in 2007 (when only one regional investment facility was active) to US$516 million in 2014 (by which time all seven were operational). The loan funding provided by financial institutions (including both bilateral and multilateral DFIs) and global facilities (such as the Global Environment Facility (GEF)) into EU blended finance projects also increased substantially over the period, though less rapidly, from US$1.4 billion in 2007 to US$11.3 billion in 2014.
On average, between 2007 and 2014 loan funding across the seven facilities
represented over 30 times the amount of EU budget grant funding provided to blended projects. However, the ratio of loans to grants used to fund projects differs across facilities: in 2014, this ranged from less than 2:1 in the case of the Investment Facility for Central Asia (IFCA) to 15:1 in the case of the EU-Africa Infrastructure Trust Fund (EU-AITF) and to 77:1 for the Asia Investment Facility (AIF).
The energy sector is the most targeted by EU blending projects, although in recent years the variety of sectors being funded has expanded to include, among others, social sector projects – mostly in the housing and education sectors – and private sector projects, mostly around strengthening entrepreneurship and SME funding. This reflects the potential that EU blending can have in reaching sectors that, according to other data, do not seem to be as heavily targeted by blended finance activities involving the private sector e.g. education (see Figure 24).

THE EUROPEAN UNION BLENDING FACILITIES – USING BLENDED FINANCE TO COMBINE INVESTMENTS FROM OFFICIAL SECTOR ACTORS 25
Sources: List of approved grant operations for EU-AITF; operational reports for the other six facilities.
Note: Data for the seven facilities is included for the following years: ITF – 2007–2014; NIF – 2008–2014; AIF – 2012–2014; IFCA – 2011–2014; LAIF – 2010–2014; IFP – 2014 only; CIF – 2013 only.
FIGURE 23
Total public-sector funding provided to blended finance projects via EU blending facilities has increased more than eight-fold since 2007, from US$1.4 billion to US$11.8 billion in 2014
Sources: List of approved grant operations for EU-AITF; operational reports for the other six facilities.
Note: Data for the seven facilities is included for the following years: ITF – 2007–2014; NIF – 2008–2014; AIF – 2012–2014; IFCA – 2011–2014; LAIF – 2010–2014; IFP – 2014 only; CIF – 2013 only. The relatively large proportion of funding that targeted social sectors in 2009 consisted of a single project in the education sector in Morocco, funded through the NIF.
FIGURE 24
The energy sector remains the most funded sector, although the variety of sectors targeted by EU blending has increased in recent years
0
2
4
6
8
10
12
14
2007 2008 2009 2010 2011 2012 2013 2014
US$
bill
ions
, 201
4 co
nsta
nt
Grant funding
Loan funding
0%
10%
20%
30%
40%
50%
60%
70%
80%
90%
100%
2007 2008 2009 2010 2011 2012 2013 2014
Energy
Environment
ICT
Water/sanitation
Social
Transport
Private sector
Multi-sector
26 BLENDED F INANCE: UNDERSTANDING ITS POTENTIAL FOR AGENDA 2030
The need for better data
Having comprehensive, consistent and timely data on blended finance is a crucial step towards being able to assess how it could most effectively be used within an ‘all resources’ approach to financing for development in the SDG era. In an increasingly complex financing landscape, better data will allow policymakers to identify contexts in which blended finance can be most effective and those that other resources, including traditional ODA, should increasingly target.
Enhancing transparency and accountability around blended finance is also fundamental given the use of taxpayers’ money – whether in the form of ODA or other, less concessional public finance. As illustrated in this report, blended finance projects are not set up within traditional donor–recipient structures; rather they can involve a series of intermediary steps before funding from different providers reaches the receiving entity: these can involve, for example, blending facilities or funds of funds managed by third parties. Tracing the money from the original providers of funding all the way to the recipient entities can thus be an extremely difficult task. At the very least, public actors should be reporting on the destination of their funding, whether this is an individual investee company or a pooled facility or fund; progress on this could be made quickly as some key actors are already publishing this information (e.g. PIDG publishes the names and jurisdictions of recipients of its funding) and existing standards such as the International Aid Transparency Initiative (IATI)51 can provide an appropriate platform to do this in a consistent manner.
How can data on blended finance be improved?
However, currently, the lack of common reporting standards and the limited level of disaggregation of available data means that analysing the use and role of blended finance is extremely challenging. As mentioned previously, while some DFIs do report project-level data in publicly available documents, this tends not to be equally comprehensive across the board, or comparable. It is often difficult to discern when these projects involve blending and when they are traditional DFI activities.
What improvements are needed?
By their nature, blended finance deals involve a combination of different resources, provided by different actors, on different investment terms and through different channels and instruments. A common standard of reporting needs to be established for all providers using blended finance instruments. The standard should ensure that data is sufficiently timely, comparable, accessible and disaggregated to use for tracking blended finance to the destination country and receiving entity, and reporting its impact. As a minimum the following elements are required:
• Information on the providers of the funding that is combined into each blended finance project/deal – including who all the involved actors are, both public and private;
• Volumes of funding provided by each actor;
• Terms of each individual investment – including how much of the public input can be reported as ODA;
• Instrument(s) that the funding is channelled through;
• Any facility or fund through which the funding is pooled and channelled to investees;
• Information on investee entities – public or private, foreign or domestic, as well as their scale;
• Country of intervention;
• Sector of intervention, including appropriate sub-sector breakdown.
Having consistent and comparable data on this would allow stakeholders to accurately reflect on the role that different types of blended finance can play in financing development, including which combinations of actors and instruments may work best in different geographical, political or sectoral contexts. In addition, if information on all components of blended finance projects were available, analysis of the use of this type of financing, as well as considerations of comparative advantage, would not be hindered by the fact that different actors may adopt different definitions of the term.
Information on investees of blended finance deals should also be clearly reported. Unlike traditional ODA relations, in blended finance set-ups it is rarely government entities that receive funding. Most often blended financing is disbursed to private sector companies, whether domestic or foreign. Information on who the investees are – public or private, foreign or domestic, as well as their scale – is necessary in order to explore the extent to which blended finance targets domestic actors as opposed to international ones. This in turn is useful to strengthen evidence on whether blended finance tends to provide unnecessary subsidies to international companies to operate in developing countries where local actors already exist, and the extent to which it could thus hinder (as opposed to facilitate) the development of local markets. This information could also be used to assess whether ODA used in

HOW C AN DATA ON BLENDED F INANCE BE IMPROVED? 27
blending is complying with established standards of ‘untied aid’.
Commercial confidentiality requirements of most DFIs pose a challenge to full transparency.52 However, this should not be an insurmountable hurdle and should be actively addressed, especially given the use of public money in blended finance deals when donor agencies are involved. There is a need to strike a balance with transparency and accountability commitments to which donors have signed up (e.g. the Busan effectiveness principles). A possible solution is to require that, for each blended finance project, public (and philanthropic) organisations report on total project cost in addition to their own contributions (i.e. all funding used for the project including their contributions plus any additional amounts mobilised from other actors). This would allow data users to infer the scale of funding to the project that was provided by other actors, and therefore give an indication of amounts mobilised. To complete the picture, information on who these actors are would also be necessary – names should not be required, but the nature of the additional investments brought into the deal/project should be (i.e. whether private or public, and their terms). Information on the type and nationality of the actors providing the additional funding is especially relevant in order to strengthen the evidence on whether blended finance tends to crowd out local private investors and distort local markets – something that cannot be assessed comprehensively using existing data.
Building blended finance into existing data standards
Existing data standards, especially IATI, represent robust starting points that can be adapted to address new needs. Harmonisation and improvement of reporting systems for blended finance
could usefully build on the lessons learned and groundwork done by other actors who have worked to improve transparency in development finance. The OECD, for example, is planning to add an additional field to its Creditor Reporting System (CRS) reporting requirements to allow organisations to report on amounts mobilised from the private sector. While this is a welcome development, however, it will only partially fill existing gaps in the data. Existing limitations to the CRS would continue to apply – especially around the timeliness of the published data and the extent to which the reporting system is used by organisations beyond the DAC and some key multilateral institutions. Ongoing discussions around the concept of total official support for sustainable development (TOSSD) also highlight the growing recognition of the need to measure private sector contributions to development more accurately and comprehensively – although it is still unclear how exactly this would be done within the proposed framework and the extent to which TOSSD data would provide the necessary level of detail on blended finance activities.
IATI is well placed to provide disaggregated, transparent and timely data on blended finance activities and thus has the potential to effectively enhance the state of current data. While most of the fields in IATI are the same as those used within the CRS, IATI provides additional flexibility to publishers to report on relevant details within and outside of these fields, especially with regard to forward-looking elements and traceability issues. This means that, although additional fields may need to be included, most of the additional information specific to blended finance could fit within the existing structure of the standard. New codes or vocabularies relevant to blended finance could be added to existing code lists in order to reflect
elements that, although not relevant within the context of traditional development cooperation relations, are becoming increasingly important in the context of innovative financing modalities. For example, discussions could be had around the new types of publisher, collaboration, disbursement channel, finance, flow and aid that would be necessary to accurately reflect how blended finance projects are funded and implemented. Further, IATI allows for related entries to be linked, which can help address some of the traceability issues raised above.
Finally, it must be noted that changes or additions to existing reporting standards should not be developed in isolation from one another. As the international financing landscape becomes more complex, reporting standards for new forms of financing will increasingly be discussed, and this should happen alongside more political debates about how to measure the contributions of different actors – for example, whether or how to count contributions to blended finance activities as ODA or within TOSSD. Another issue is the discussions related to monitoring frameworks, such as the changes being discussed around indicator 3 of the Global Partnership for Effective Development Co-operation (GPEDC) Monitoring Framework (which currently refers to private sector engagement and contribution to development in terms of public-private dialogue alone). These debates are directly related to incentive structures and it is thus crucial that they are considered if we want organisations to see the need to report more and better data on emerging forms of development finance such as blended finance, and to fulfil the additional requirements that may result from this. Other relevant conversations that should be taken into account include those related to other forms of financing, such as the work being done to improve the interoperability of data on social impact investment.

28 BLENDED F INANCE: UNDERSTANDING ITS POTENTIAL FOR AGENDA 2030
The challenge of defining blended finance
For analytical purposes, clarifying what is meant by the term ‘blended finance’ is a necessary first step in order to gain a better understanding of the factors and dynamics at play.
A challenge with analysing and discussing blended finance is that different actors have adopted different definitions of this concept, making it difficult to have constructive debates around its current and potential role. For example, there are multiple interpretations of whether ‘blended finance’ refers solely to the use of ODA to mobilise additional investments into developing countries, or whether it refers to the use of public funding more broadly for this purpose, or to the use of public and/or philanthropic funding. Moreover, the nature of the ‘mobilised’ capital is also not uniformly interpreted: it can refer to investments made solely by private sector actors or to investments made by public actors (such as DFIs) on commercial terms or on less concessional terms than ODA, or either of these.
Depending on the nature of the capital invested in order to do the mobilising (i.e. public or philanthropic) and that of the capital being mobilised (i.e. public or private), different incentives, objectives and opportunities will come into play and different considerations will have to be made with regard to ways of scaling up overall volumes according to different actors’ comparative advantages and ensuring a positive developmental impact. So the first level of unbundling refers to the nature and source of the capital used in both sides of the blending.
Annex: What is blended finance?
Broadly, blended finance can be defined as the use of public or philanthropic funds to attract additional investments from private sector actors into development projects.53 However, for the purposes of this report and given the objective of our initial analysis (i.e. exploring the role of international donors in blending), we have narrowed this further, and define blending as the use of international public finance to attract additional investments from private sector actors. We are therefore excluding from this initial data analysis the use of philanthropic funds and of domestic public resources to mobilise additional capital, and we are also excluding instances in which the additional capital is mobilised from public sources (e.g. less concessional
or commercial investments from DFIs) – thus focusing solely on leveraging that takes place outside the public sector. This allows us to investigate specifically the kind of blended finance that explicitly intends to strengthen the involvement of private sector actors in development and that involves international public actors to do so (through both ODA and other public development finance).
Blended finance and other forms of collaborative finance
Figure 25 further details the overlaps as well as the distinctive features of blended finance, as defined in this report, and other forms of collaborative financing i.e. impact investing,
FIGURE 25
The relationship between blended finance and other forms of collaborative financing
PPPs
4
CO-FINANCING
3
BLENDING
1
2
IMPACT INVESTING
5
7 6

ANNEX: WHAT IS BLENDED F INANCE? 29
public-private partnerships (PPPs) and co-financing.
The distinctive characteristics of blended finance range in nature from the intent of the investments being made to the way the financing is structured.
Intent
Firstly, the intent of the international public resources invested in blended finance projects is to attract additional financing from private sector actors who would not otherwise have invested, and thus demonstrate the viability of investing in development projects in ‘emerging/frontier’ contexts. Additionality is a key, albeit controversial, feature of blended finance, and one that is not equally prominent in other forms of collaborative financing. Given the lack of counterfactuals, it is difficult to demonstrate that projects would not have happened at all, or to the same scale, or within the same timescale, or to the same degree of impact without the public sector input – i.e. it is difficult to evaluate with certainty if public inputs are unnecessarily subsidising the private sector and in so doing displacing other actors who could have provided the necessary finance. In the case of ODA, this also begs the question of whether it would contribute to greater development impact if spent on non-blended projects. Unbundling what we know about blended finance and strengthening the evidence base on the set-ups and contexts in which this type of financing works best will provide increasing insight to address
these questions and to establish what the comparative advantage of blended finance is vis-à-vis other forms of financing for development.
Structure
Secondly, and with regard to the structure of blended finance investments, key aspects include the involvement of international public inputs in the investment in the first place, their nature – i.e. they can be financial or non-financial, such as technical assistance (TA) – and their timing in the project cycle, i.e. they can either be invested at the same time as private inputs, such as in a syndicated loan arrangement, or precede them, e.g. if they are used to carry out a feasibility study for a project that will then be implemented using private investments. They also include the fact that public and private inputs tend to be provided on different terms, with concessional public inputs acting as a sort of subsidy to commercial private investment.
The main differences between blended finance and the other forms of collaborative financing included in Figure 25 are as follows. Impact investing – defined as “investments made into companies, organizations, and funds with the intention to generate social and environmental impact alongside a financial return”54 – does not involve the use of public resources by design. Under co-financing set-ups, all parties provide financial inputs; in addition, co-financing includes arrangements that do not involve private sector actors (e.g. two donor agencies pooling
resources to build a hospital in a developing country) and in which all parties may contribute funding on the same terms (i.e. there does not necessarily need to be a public sector actor providing concessional inputs that then attract additional commercial capital from other actors). PPPs – defined as “a long-term contract between a private party and a government entity, for providing a public asset or service, in which the private party bears significant risk and management responsibility, and remuneration is linked to performance”55 – can involve, and most times do involve, domestic governments.
However there are overlaps between blended finance and these other forms of collaborative financing (represented by areas 5, 6 and 7 in Figure 25). Blending can trigger increased investments by private sector actors that have social and environmental impacts in addition to financial returns; thus impact investments that have been triggered by the use of public funds or TA fall within our definition of blended finance (e.g. the Sarona Frontier Markets Fund 2, to which the Canadian government provided initial backing). Moreover, a co-financing arrangement in which the funding is provided by public and private parties, and in which the public party facilitates the private investment by providing more concessional resources to the deal, would fall within our definition of blended finance. Lastly, PPPs are one of the institutional arrangements within which blended finance projects can be implemented, and so in these cases PPPs are relevant to our definition.

30 BLENDED F INANCE: UNDERSTANDING ITS POTENTIAL FOR AGENDA 2030
The instruments used to blend finance
In order to aid understanding of the broad characteristics of the various blended finance instruments, Table 1 groups blended finance instruments into four broad categories: mezzanine finance, non-mezzanine finance, unfunded liabilities and other collaborative arrangements.
Subordinated, or mezzanine finance arrangements can be in the form of debt, equity or a hybrid form (e.g. a debt that can be converted into equity). The key characteristic of such an arrangement is that one actor (e.g. a DFI or other public sector agency) agrees to be repaid only if the organisation that received the funds has first repaid other investors. Thus a public sector body can accept the first loss arising from any default and this, therefore, reduces the risk to private investors, making them more likely to invest.
Financial instruments that are not part of a mezzanine finance arrangement ‘mobilise’ additional funding without the private sector actor agreeing to bear the first loss in the event of a default. This may be achieved either by compensating private investors for the increased risk (by direct subsidy or by a higher rate of return) and/or via risk mitigation through spreading the financial risk among a number of investors. In the case of syndicated loans, a DFI may act as the principal ‘lender of record’, meaning that any funds provided by other lenders are effectively lent ‘through’ the DFI. If the DFI has preferred creditor status (i.e. it will be paid back before other creditors in the event of the borrower becoming insolvent), then all members of the loan syndicate potentially benefit from this preferred creditor status.
Unfunded liabilities refer to arrangements where the public sector agency does not provide immediate funding but instead enters into an agreement to repay the private investor some or all of the amount owed to them if the borrower should default.
In addition to purely financial instruments, there are a number of other forms of cooperation where the inputs from both the public and private sector may be a combination of financial and non-financial transfers, which cannot be easily separated out. These include advance market commitments (AMCs) and technical cooperation (e.g. to conduct feasibility studies into projects with the potential to attract private investors).

ANNEX: WHAT IS BLENDED F INANCE? 31
Finance type Description
Mez
zan
ine
fin
ance Subordinated loans
A loan that, in the event of default, will only be repaid after all senior obligations have been satisfied.
Preferred equityEquity that, in the event of default, will be repaid after all senior obligations have been satisfied and will be paid before common equity holders.
Convertible debt/equityA form of hybrid mezzanine finance denoting a loan that can, at some point in the future, be converted into shares in a company.
No
n-m
ezza
nin
e fi
nan
cial
inst
rum
ents
Loans with publicly funded interest subsidy
An arrangement whereby an official institution (e.g. a DFI) provides a parallel loan to a loan from a private investor.
Syndicated loansA payment to soften the terms of private export credits, or loans or credits by the banking sector.
Shares in collective investment vehicles (CIVs)
An arrangement whereby an official institution (e.g. a DFI) provides a parallel loan to a loan from a private investor.
BondsFixed-interest debt instruments, issued by governments, public utilities, banks or companies, tradable in financial markets.
Additional finance mobilised by cash grants
Grant funding for a proportion of a project’s costs may improve the viability of the project and make it more attractive to investors.
Asset-backed securitiesSecurities whose value and income payments are derived from and backed by a specific pool of underlying assets.
Un
fun
ded
lia
bili
ties
Funds mobilised by guarantees
Guarantees refer to risk-sharing agreements under which the guarantor agrees to pay part or the entire amount due on a loan, equity or other instrument to the lender/investor in the event of non-payment by the borrower or loss of value in case of investment.
Funds mobilised by insurances
Insurances typically cover specific risks, e.g. political risk insurance.
Oth
er
Advance market commitments (AMCs)
A binding contract, typically offered by a government or other financial entity, used to guarantee a viable market if a product such as a vaccine or other medicine is successfully developed.
Technical cooperation and other in-kind efforts to mobilise private investment
For example, technical cooperation to conduct a feasibility study in order to establish the investment potential of a project.
TABLE 1
Description of individual blended finance instruments

32 BLENDED F INANCE: UNDERSTANDING ITS POTENTIAL FOR AGENDA 2030
Acronyms and abbreviations
ADB African Development BankAFD Agence Française de Développement (French Development Agency)AIF Asia Investment FacilityAMC Advance market commitmentAsDB Asian Development BankCAF Development Bank of Latin AmericaCIF Caribbean Investment FacilityCIV Collective investment vehicleCOP Certificate of participationCRS Creditor Reporting SystemCSO Civil society organisationDAC Development Assistance CommitteeDFI Development finance institutionDFID Department for International DevelopmentDRC Democratic Republic of the CongoEBRD European Bank for Reconstruction and DevelopmentEDFI European Development Finance InstitutionsEEIP European External Investment PlanEIB European Investment BankEU-AITF EU-Africa Infrastructure Trust FundEYE Education, Youth and EmploymentFDI Foreign direct investmentGDP Gross domestic productGEF Global Environment FacilityGNI Gross national incomeGPEDC Global Partnership for Effective Development Co-operationIADB Inter-American Development BankIATI International Aid Transparency InitiativeIDS World Bank International Debt StatisticsIFC International Finance CorporationIFCA Investment Facility for Central Asia IFP Investment Facility for the PacificIMF International Monetary FundITEP Investments to End PovertyLAC Latin America and CaribbeanLAIF Latin America Investment FacilityLIC Low-income countryLMIC Lower-middle-income countryMDB Multilateral development bankMIC Middle-income countryMIGA Multilateral Investment Guarantee AgencyNGO Non-governmental organisationNIF Neighbourhood Investment Facility ODA Official development assistanceOECD Organisation for Economic Co-operation and DevelopmentOOF Other official flowOPIC Overseas Private Investment CorporationPDA Private development assistancePIDG Private Infrastructure Development GroupPPP Public-private partnershipPSI Private sector instrumentROI Return on investmentSDGs Sustainable Development GoalsSDIP Sustainable Development Investment PartnershipSIFEM Swiss Investment Fund for Emerging MarketsSIPRI Stockholm International Peace Research InstituteSME Small/medium-sized enterpriseTA Technical assistanceTOSSD Total official support for sustainable developmentUMIC Upper-middle-income countryUNCDF United Nations Capital Development FundUNCTAD United Nations Conference on Trade and DevelopmentWDI World Development IndicatorsWEF World Economic Forum
METHODOLOGY NOTE 33
The OECD survey on `Amounts Mobilised from the Private Sector by Official Development Finance Interventions’ provides valuable insight into private investments in blended finance projects in the years 2012 to 2014 (data for IFC is only available for 2014). However, this is only one side of the blended finance coin. In order to assess current volumes and allocations of blended finance more comprehensively, data on the amounts invested by official institutions is also necessary. For most providers, however, this data is not readily available to the public. The main obstacle is probably the lack of standard reporting guidelines on blended finance activities, which makes it difficult (and sometimes impossible) to separate investments made into blended finance projects from those made into other, more traditional projects. In order to provide an initial estimate of the investments made into blended finance projects by official institutions, we have therefore had to use a combination of different datasets.
Project-level data available online was used for three organisations.56 In these cases, the distinction between blended finance projects and other, more traditional projects was possible, and we liaised directly with data providers in order to avoid any misinterpretations of the data.
For those institutions that do not provide project-level data online and those for which the distinction between blended finance and other investments is not possible, primary data was sought. Based on an initial scoping exercise, a survey was sent out to 23 institutions, which were identified as key players in the blended finance field.57 Due to a combination of factors – including the fact that not all organisations have systems in place to collect and share data that is relevant
Methodology noteBlended finance data
to blended finance activities specifically, the timing of the survey (August/September) and the limited timeframe allowed for responding – we received inputs from only five organisations.58
The data from these eight organisations was compiled into one ‘master’ dataset. This involved standardising data from each organisation according to a set of fields that were identified as being most relevant for the analysis undertaken in this report, and then combining all datasets into one.
The following assumptions were made when standardising individual datasets:
• PIDG: All projects were considered as blended finance projects; depending on the facility through which each project was implemented, different methodologies were used to estimate the additional amounts committed to each project by actors other than PIDG. This was done in line with the different reporting approaches used by different PIDG facilities. For all facilities except DevCo, additional amounts were calculated by subtracting PIDG commitments from contributions by DFIs and adding private sector investments. For DevCo, additional amounts were calculated by adding together DFIs’ contributions and private sector investments. TAF grants59 were included within PIDG commitments.
• MIGA: All projects were considered as blended finance projects and the date field was populated using the years reported under ‘fiscal years’ (no data was available on additional amounts invested/committed by actors other than MIGA).
• OPIC: OPIC does not engage in blended finance activities alone so, in order to estimate its contribution
to blended finance (in line with the definition adopted in the report), only projects with a corporation among the sponsor organisations were included in the master dataset. Additional amounts invested by actors other than OPIC were calculated by subtracting OPIC commitments from the total project funding figures.
Once all relevant data was collated into the master dataset, the following transformations were performed in order to enable comparisons between organisations as well as historical trend analysis.
• All data was converted into US$ using OECD exchange rates.
• All data was deflated to constant 2014 prices using OECD deflators as follows:
• Country deflators were used to convert amounts invested/committed by bilateral DFIs from current to constant prices;
• DAC average deflators were used to convert amounts invested/committed by multilateral DFIs from current to constant prices, and to convert figures reported under additional amounts invested/committed (the latter because we assumed that such financing could have been provided from actors residing in locations other than the country of the reporting organisation).
In addition to the data collated in the master dataset, two other sources were used to further inform the estimate of current blended finance volumes: data on EU blending facilities and data from the Convergence platform.
The EU adopts a definition of blended finance that is not completely in line with that used in this report, referring to blending as “a combination of

34 BLENDED F INANCE: UNDERSTANDING ITS POTENTIAL FOR AGENDA 2030
EU grants with loans or equity from public and private financiers”,60 and thus including cases in which public finance is used to mobilise additional public investments, e.g. from bilateral or multilateral DFIs. To date, projects implemented through EU blending facilities have not involved any financing from private sector actors; thus data on projects implemented through EU blending facilities was not included in the master dataset. Nonetheless, some analysis was undertaken of EU investments in blending, given the major role that the EU plays in current blended finance debates. Data was collated from annual reports of the seven EU blending facilities and analysed in aggregate to estimate the scale of investments made and mobilised through current EU blending mechanisms. Given the fact that project-level data was available for multiple years, figures were deflated using OECD deflators similar to the approach adopted in the master dataset – i.e. amounts invested were deflated using the EU Institutions deflator, while additional amounts invested by actors other than EU member states were deflated using DAC average deflators. In cases where the additional amounts invested were not provided by multiple organisations, the figures were deflated using the respective country deflators: e.g. if additional amounts invested were provided by KFW alone, then Germany’s deflators would have been used, or if the EBRD or the European Investment Bank (EIB) were the additional investors, then the EU deflator would have been used.
Data from Convergence includes a wealth of information on 219 blended finance deals, including an overview of the deal, its status, geographical location, sector of intervention, organisations/investors involved, targeted investment size, total investment size and in some cases a breakdown of this total by organisation and instrument. Given the complexity and format of the dataset, this report
drew only from the total investment size field in order to complement other estimates on the current global scale of blended finance.
Finally, we acknowledge the existence of other potentially relevant data sources, but time constraints for the completion of this initial report meant that these will be further explored in future work. These include overviews of investments by blending facilities such as the one undertaken by the Association of European Development Finance Institutions (EDFI) in collaboration with Common Consultants,61 as well as relevant research and publications from the Sustainable Development Investment Partnership (SDIP) and the United Nations Capital Development Fund (UNCDF). We will also continue to work on the data that we have been compiling over the past few months in order to provide additional analysis where possible, and we welcome continued input from relevant organisations.
Data on other financial flows
Analysis of financing flows has been undertaken from the recipient perspective. Aggregate figures represent flows to developing countries (defined as those countries that are eligible to receive ODA62).
Domestic resources include official and commercial finance. Government revenue data excludes grants and is sourced from IMF Article IV publications to allow for aggregating across countries. Domestic commercial estimates are based on gross fixed capital formation (GFCF) data from the World Bank World Development Indicators (WDI), which are used to estimate total investment in each country. Foreign direct investment (FDI) sourced from UNCTAD and public capital expenditure data sourced from IMF Article IV publications, are then deducted at the country level to obtain an estimate for domestic private investment.
International financing flows include official, commercial and private resources received by developing
countries - namely: Official Development Assistance (gross), Other Official Flows (gross), official long-term debt (gross), development cooperation from other providers, DFIs activities in developing countries, peacekeeping operations, foreign direct investment (FDI), commercial long-term debt (gross), short-term debt (net), portfolio equity (net), remittances and private development assistance (including philanthropy, NGOs, corporate giving). Data on ODA and OOFs is sourced from OECD DAC Tables 2A and 2B respectively; data from the Creditor Reporting System (CRS) is used to determine ODA sector allocations. Data on official long-term debt is estimated by subtracting data on ODA and OOF loans from data on disbursements of external debt from official creditors, sourced from the World Bank International Debt Statistics (IDS) database - this is done to avoid double counting. Any negatives are set to zero at the country level. Data on FDI is sourced from UNCTAD; data on commercial long-term debt is based on disbursements of external debt from private creditors, sourced from the World Bank IDS. Data on short-term debt and portfolio equity is sourced from the World Bank WDI. Data on remittances is sourced from the World Bank Migration and Remittances database. Data on development cooperation from other providers, DFIs, peacekeeping and private development assistance is sourced from the report Investments To End Poverty 2015. Poverty data
Poverty estimates use World Bank PovcalNet data at the US$1.90 per day level. They refer to headcount percentage values, thus representing the percentage of the population in each country that lives below US$1.90 per day. Where available, regional estimates are used for countries with no national poverty data. No data is available for Algeria, Egypt, Iraq, Lebanon, Libya, Syrian Arab Republic or Yemen.
NOTES 35
Notes
1 This is in line with the World Economic Forum (WEF) definition of blended finance and usefully highlights the main potential of this type of financing in mobilising increased private sector involvement in development.
2 European Union (2016), ‘State of the Union 2016: European External Investment Plan’.
3 UNCTAD (2014), ‘World Investment Report 2014’. http://unctad.org/en/pages/PublicationWebflyer.aspx?publicationid=937
4 For example, World Bank (2015), http://siteresources.worldbank.org/DEVCOMMINT/Documentation/23659446/DC2015-0002(E)FinancingforDevelopment.pdf
5 WEF (2016), ‘There’s a $2.5 trillion development investment gap. Blended finance could plug it’. https://www.weforum.org/agenda/2016/07/blended-finance-sustainable-development-goals/
6 For example, OECD/WEF (2015), ‘Blended Finance Vol. 1: A Primer for Development Finance and Philanthropic Funders’. http://www3.weforum.org/docs/WEF_Blended_Finance_A_Primer_Development_Finance_Philanthropic_Funders_report_2015.pdf
7 Eurodad (2015), ‘Financing for development or for private interests?’ http://www.eurodad.org/Entries/view/1546407/2015/05/13/Financing-for-development-or-for-private-interests
8 OECD (2014), ‘Background paper: Including the cost of using private-sector instruments in ODA’. http://www.oecd.org/dac/DAC%20HLM%202014%20Background%20paper%20Including%20the%20cost%20of%20using%20private-sector%20instruments%20in%20ODA.pdf
9 The issue of transparency in blending is explored in more detail in Development Initiatives’ 2016 discussion paper, ‘Aligning blended finance with the Busan principles of development effectiveness’. http://devinit.org/wp-content/uploads/2016/10/aligning-blended-finance-with-the-busan-principles-of-development-effectiveness_di_discussion-paper.pdf
10 OECD (2016), ‘Amounts Mobilised from the Private Sector by Official Development Finance Interventions’. http://www.oecd-ilibrary.org/development/amounts-mobilised-from-the-private-sector-by-official-development-finance-interventions_5jm3xh459n37-en
11 Ibid.
12 Domestic public resources refers to non-grant government revenue. Domestic commercial resources are estimated using World Bank data on gross fixed capital formation (GFCF) and subtracting FDI and capital expenditure figures at the country level; while this cannot be considered an accurate reflection of domestic commercial investment taking place in each country, it can be used to provide an estimate for overall comparisons with other flows. International public includes ODA, other official flows (OOFs), official long-term debt, activities of DFIs, development cooperation provided by emerging/non-DAC donors and peacekeeping costs. International commercial includes FDI, commercial long-term debt, short-term debt (net) and portfolio equity (net). International private includes remittances and private development assistance (i.e. funding going to developing countries through foundations, NGOs and corporate philanthropic activities).
13 OECD DAC (2016), ‘Development Co-operation Report 2016: The Sustainable Development Goals as Business Opportunities’. http://www.oecd.org/dac/DCR%202016%20Highlights%20booklet%20FINAL.pdf
14 For example, OECD/WEF (2016), ‘Blended Finance Vol. 1. A Primer for Development Finance and Philanthropic Funders’, op. cit.
15 Schmidt-Traub, G. and Sachs, J. (2015), ‘Financing Sustainable Development: Implementing the SDGs through Effective Investment Strategies and Partnerships’, United Nations Sustainable Development Solutions Network (UNSDSN). http://unsdsn.org/wp-content/uploads/2015/04/150619-SDSN-Financing-Sustainable-Development-Paper-FINAL-02.pdf
16 Data from the Convergence platform, which includes volumes invested by public, private and philanthropic actors, shows that in aggregate total investments by all these actors in the 200-plus blended finance deals included in the database amount to US$63.5 billion. This covers a period of over two decades, with deal launch dates included from 1994 to 2016. On a yearly basis, total investments recorded in the database range from below US$1 billion in the early 2000s to US$11.2billion in 2014. https://convergence.finance/
17 World Bank (2015), ‘From Billions to Trillions: Transforming Development Finance’. http://siteresources.worldbank.org/DEVCOMMINT/Documentation/23659446/DC2015-0002(E)FinancingforDevelopment.pdf
18 Calculated from data supplied to Development Initiatives by CDC
19 Swiss Investment Fund for Emerging Markets (SIFEM) (2015), ‘Annual Report 2015’. http://www.sifem.ch/fileadmin/user_upload/sifem/pdf/en/Reports/2015_Annual_Report.pdf
20 International Finance Corporation (IFC) (2016), ‘Annual Report 2016’. http://www.ifc.org/wps/wcm/connect/corp_ext_content/ifc_external_corporate_site/annual+report/2016+online+report/printed+version
21 Note that in the OECD data Turkey is classified as part of Europe.
22 World Bank (2016), ‘Development finance frontline: Senegal’s Strategic Investments Fund’. http://blogs.worldbank.org/psd/development-finance-frontline-senegal-s-strategic-investments-fund; and Hurley, G. and Mensah, M. (2016) ‘Big gaps and little money: Why solutions to finance SDGs in LDCs matter’, Devex. https://www.devex.com/news/big-gaps-and-little-money-why-solutions-to-finance-sdgs-in-ldcs-matter-87958
23 International Monetary Fund (2015). ‘Macroeconomic Developments and Prospects in Low-Income Developing Countries: 2015’. http://www.imf.org/external/np/pp/eng/2015/111915.pdf
24 Approximately 18% of private investment mobilised through blended finance was not reported as going to a single country – these investments were either regional in nature or went to projects with no recipient specified.
25 AFD, African Development Bank (ADB), Multilateral Investment Guarantee Agency (MIGA), Norfund, Overseas Private Investment Corporation (OPIC) and Private Infrastructure Development Group (PIDG).
26 Development Initiatives (2013), ‘Investments to End Poverty’ http://devinit.org/wp-content/uploads/2013/09/Investments_to_End_Poverty_full_report.pdf
27 For example, the OECD’s ‘Development Co-operation Report 2014: Mobilising Resources for Sustainable Development’ (p.143). http://www.oecd-ilibrary.org/docserver/download/4314031ec015.pdf?expires=1474470186&id=id&accname=guest&checksum= C6ED1150D8AB98272191602F48D2E775

36 BLENDED F INANCE: UNDERSTANDING ITS POTENTIAL FOR AGENDA 2030
28 For example, McKinsey & Company (2013), ‘Innovative Development Financing’. http://www.mckinsey.com/industries/social-sector/our-insights/innovative-development-financing
29 Interview with Rafael Rodriguez-Balza, IADB, 26 September 2016.
30 IADB (n.d.) ‘Education, Youth, and Employment (EYE) Bond’. http://idbdocs.iadb.org/wsdocs/getdocument.aspx?docnum=39047836
31 IADB (2016), ‘IADB Projects Eligible for EYE Bond Financing’. http://www.iadb.org/en/idb-finance/investors/eye-bond-project-list,19297.html
32 IADB Investor Presentation 2016 downloaded from the IADB website, 19 September 2016
33 IADB (2016), ‘About IDB EYE (Education, Youth, Employment) Bonds’. http://www.iadb.org/en/idb-finance/investors/eye-bond-program,18001.html
34 IADB (2016), ‘IADB Projects Eligible for EYE Bond Financing’.
35 IADB (2016) ‘Selected EYE Eligible Project Summaries’. http://www.iadb.org/en/idb-finance/investors/selected-eye-eligible-project-summaries,19294.html
36 Development Initiatives (2016), ‘Aligning blended finance with the Busan principles of development effectiveness’, op. cit.
37 Note that some countries that feature in the OECD list of ODA recipients have their own bilateral DFIs and/or participate in multilateral DFIs; thus, we are not referring only to traditional DAC donors here: to the extent that the data will allow, we seek to include DFIs of emerging economies in our analysis, specifically focusing on their international activities.
38 Dickinson, T. (OECD), ‘Development Finance Institutions: Profitability Promoting Development’. http://www.oecd.org/dev/41302068.pdf
39 Eurodad has produced extensive research on the role, operations, challenges and risks of DFIs in development projects, as well as factsheets for major bilateral DFIs. Jose Romero, M. and Van de Poel, J. (2014), ‘Private finance for development unravelled’; Jose Romero, M. (2014), ‘A private affair’.
40 All multilateral DFIs are 100% government-owned, except for the Development Bank of Latin America, CAF, which is partly owned by commercial banks. Of the 22 bilateral DFIs that DI has reviewed so far, the majority are 100% government-owned, some have private participation and one (Austria’s OEEB) is 100% privately owned.
41 OECD/WEF (2015), ‘Blended Finance Vol. 1: A Primer for Development Finance and Philanthropic Funders’, op. cit., p.4.
42 Department of Foreign Affairs, Trade and Development, Government of Canada.
43 Sarona (2016), ‘Growth That Matters: Annual Values Report 2016’. http://www.saronafund.com/user-files/uploads/2016/07/2016-Values-Report-FINAL.pdf
44 See: http://www.slideshare.net/MelwynDcosta/infront-global-fund-manager-onepager-45127243
45 Convergence/Sarona (2016), ‘Case Study: Sarona Frontier Markets Fund 2 (SFM2)’. https://assets.contentful.com/bbfdx7vx8x8r/5i8FCsLPQcOYGk0K4IgmMg/9b008ff0e148127e8e9a00febada3b5e/Convergence__Sarona_Frontier_Markets_Fund_2__SFMF2__Case_Study__2016.pdf
46 Sarona (2016), ‘Growth That Matters: Annual Values Report 2016’, op. cit.
47 European Commission (2014), ‘Blending European Union aid to catalyse investments’. http://ec.europa.eu/clima/publications/docs/blending_en.pdf
48 Africa Investment Facility (which was created in 2015 to replace the EU-Africa Infrastructure Trust Fund (EU-AITF)); Asia Investment Facility (AIF); Caribbean Investment Facility (CIF); Investment Facility for Central Asia (IFCA); Investment Facility for the Pacific (IFP); Latin America Investment Facility (LAIF); Neighbourhood Investment Facility (NIF). The EU-Africa ITF was created in 2007; the NIF was created in 2008; the AIF, IFCA and LAIF were created in 2010; the IFP and the CIF were created in 2012.
49 European Commission (2016), ‘EU Platform for Blending in External Cooperation’. http://ec.europa.eu/transparency/regexpert/index.cfm?do=groupDetail.groupDetail&groupID=2852
50 European Parliament (2016), ‘Texts adopted’. http://www.europarl.europa.eu/sides/getDoc.do?pubRef=-//EP//TEXT+TA+P8-TA-2016-0137+0+DOC+XML+V0//EN
51 “IATI is a voluntary, multi-stakeholder initiative that seeks to improve the transparency of aid, development, and humanitarian resources in order to increase their effectiveness in tackling poverty. At the centre of IATI is the IATI Standard, a format and framework for publishing data on development cooperation activities, intended to be used by all organisations in development, including government donors, private sector organisations, and national and international NGOs.” International Aid Transparency Initiative. http://www.aidtransparency.net/
52 Development Initiatives (2016), ‘Aligning blended finance with the Busan principles of development effectiveness’, op. cit., p.12.
53 This is in line with the WEF definition of blended finance and usefully highlights the main potential of this type of financing in mobilising increased private sector involvement in development.
54 Global Impact Investing Network (GIIN) definition: https://thegiin.org/impact-investing/
55 World Bank definition: http://ppp.worldbank.org/public-private-partnership/overview/what-are-public-private-partnerships
56 OPIC, MIGA and PIDG
57 Organisations were considered key players in blended finance if they provided data on blended finance investments online or in publicly available documents, or if references to blended finance were included in their policy documents, annual reports, websites or other publications.
58 AFD, ADB, CDC, IADB and NORFUND. A sixth organisation also provided input, but since it related exclusively to contributions to EU blending facilities, this was included in the EU dataset, not in the master dataset.
59 The technical assistance facility of PIDG
60 EU Commission (2015), ’EU Blending: European aid to catalyse investments’. https://ec.europa.eu/europeaid/sites/devco/files/leaflet-eu-blending-10.2841-748965-20150710_en.pdf
61 Commons Consultants (2015), ‘The Pitfalls of Innovative Private Sector Financing: Emerging lessons from benchmarking of investment funds supported by aid agencies. Summary Report’. http://www.norfund.no/getfile.php/137139/Documents/Homepage/Reports and presentations/External reports_flyers/Pitfalls of Innovative Private Sector Financing_Commons Consultants_final_150826.pdf
62. See OECD list of ODA-eligible countries available at: http://www.oecd.org/dac/stats/documentupload/DAC%20List%20of%20ODA%20Recipients%202014%20final.pdf


Development Initiatives (DI) is an independent
international development organisation
working on the use of data to drive poverty
eradication and sustainable development. Our
vision is a world without poverty that invests in
human security and where everyone shares the
benefits of opportunity and growth.
We work to ensure that decisions about the
allocation of finance and resources result in an
end to poverty, increase the resilience of the
world’s most vulnerable people, and ensure no
one is left behind.
Copyright © 2016 Development Initiatives
We encourage dissemination of our work
providing a reference is included.
Typeset by Definite Design,
www.definite.design
Cover illustration by Broadley Creative,
www.broadleycreative.co.uk
Contact
Cordelia Lonsdale
Policy and Engagement Adviser
T: +44 (0) 1179 272 505
To find out more about our work visit: www.devinit.org
Twitter: @devinitorg
Email: [email protected]
Development Initiatives is the
trading name of DI International
Ltd. Registered in England and
Wales No. 05802543.
Development Initiatives Poverty
Research is the not-for-profit
partner of DI International Ltd.
Registered in England and Wales
No. 06368740.
Registered office: North Quay
House, Quay Side, Temple Back,
Bristol, BS1 6FL, UK.
UK OFFICE
Development Initiatives
North Quay House
Quay Side, Temple Back
Bristol, BS1 6FL, UK
+44 (0) 1179 272 505
www.devinit.org
KENYA OFFICE
Development Initiatives
Shelter Afrique Building
4th Floor, Mamlaka Road
Nairobi, Kenya
PO Box 102802-00101
+254 (0) 20 272 5346
www.devinit.org
DEVELOPMENT RESEARCH
AND TRAINING (DRT)
Ggaba Road, Mutesasira
Zone, Kansanga
PO Box 22459
Kampala, Uganda
+256 (0) 312 – 263629/30
+256 (0) 414 – 269495
www.drt-ug.org
US OFFICE
Development Initiatives
1110 Vermont Ave NW,
Suite 500, Washington DC
20005, US