report 360 aquifers of the edwards plateau chapter 18
TRANSCRIPT

345
Chapter 18
Estimate of recharge to the Edwards (Balcones Fault Zone)
and Edwards–Trinity (Plateau) aquifers in Kinney County, Texas
Robert E. Mace1 and Roberto Anaya1
Introduction Recharge is an important part of the water budget of a groundwater system and therefore is often of great interest to groundwater conservation districts. 'Recharge' is generally defined as the amount of water that reaches the water table from the unsaturated zone above (for example, see Freeze and Cherry, 1979; Domenico and Schwartz, 1990; Jackson, 1997; Wilson and Moore, 1998; Fitts, 2002). Recharge generally sources from rainfall or other precipitation that percolates into the ground or from streams or other surface water bodies that leak water into the underlying aquifer. TWDB rules concerning groundwater management plan certification define recharge as "The addition of water from precipitation or runoff by seepage or infiltration to an aquifer from the land surface, streams, or lakes directly into a formation or indirectly by way of leakage from another formation." By this definition, recharge also includes cross-formational flow.
Groundwater conservation districts in Texas generally follow county boundaries, which typically do not follow hydrologic boundaries. Therefore, the groundwater budget of a district, in addition to recharge, also includes underflow (flow into and out of the district in the aquifer), natural discharge (such as springs and gaining streams), and pumping. Estimates of recharge generally do not consider underflow.
Recharge is of particular interest in Kinney County. The 77th Texas Legislature created the Kinney County Groundwater Conservation District (Kinney County GCD) in September 2001 (confirmed by local election in January 2002). In its groundwater management plan, the Kinney County GCD equates total usable amount of groundwater (generally considered to be groundwater availability by GCDs) to recharge. Because of the relatively high transmissivities and well yields in Kinney County, several private marketing groups are interested in selling groundwater from the county The Kinney
1 Texas Water Development Board

346
County GCD and the groundwater marketing groups are interested in the recharge value because it may be used to limit production from the aquifer.
There has not been a lot of recent hydrogeologic research in Kinney County. Before 2002, the last estimate of recharge in Kinney County was published by Bennett and Sayre in 1962 using streamflow information from 1939 to 1950. Kaveh Khorzad (2001, personal communication) noted that precipitation since 1950 has been quite a bit higher and would therefore result in a higher recharge rate than that reported by Bennett and Sayre (1962). Khorzad (2002) sent a letter report to the Kinney County GCD with his analysis (the content of which was later published in October 2003 in a paper in the Journal of the American Water Resources Association). In early 2003, the Kinney County GCD asked the Texas Water Development (TWDB) to compile technical information and estimates for the preparation of its management plan. This included a request to assess the annual amount of recharge to the groundwater resources within the district. We sent the district a report of our analysis in August 2003 (Mace and Anaya, 2003). This chapter is, for the most part, that report. However, we have added discussion related to the Khorzad (2003) paper, not published at the time of our initial report, and to work by HDR (2002), not known to us at the time of our initial report. We have also reorganized parts of the paper.
The purpose of this chapter is to present the methodology and results of our assessment of mean annual recharge to the aquifers in Kinney County. We did this by (1) reviewing previous estimates of recharge and (2) estimating recharge in the county using available data. We also provide recommendations for possible future studies. Note that we report recharge in two ways in this report: as a total volume per year (that is, acre-feet per year) and as a rate (that is, inches per year). If the area of the recharge zone is known, it is possible to convert between these two conventions.
Study Area The study area is located in Kinney County, Texas. Kinney County is located in southwestern Texas about 130 miles west of San Antonio and adjacent to the Mexican border (Figure 18-1). The county is one of the most sparsely populated in the state with a current population of about 3,400 of which approximately two-thirds is concentrated in the county seat of Brackettville (U.S. Census Bureau, 2000). The region is subtropical steppe transitional with the Chihuahua Desert (Long, 2002) and has a hot semiarid climate where the mean annual pan evaporation of about 68 inches exceeds the mean annual precipitation of about 24 inches. Overgrazing during the past 100 years has deteriorated previous grassland savanna and soil covers into the present rock, shrub, cactus, and oak-mesquite-juniper brushland dominated landscape (Mecke, 1996). This alteration of the landscape has changed many perennial springs and creeks into ephemeral or intermittent ones. Agricultural landuse is still dominated by rangeland primarily for sheep, goat, and, to a much lesser extent, cattle livestock (Kinney County Extension Office, 2001). Irrigated and non-irrigated farmland for hay, grain sorghum, cotton, oats, and wheat is minimal (Kinney County Extension Office, 2001; Long, 2002). The

347
Kinney County
1000 200 Miles
N
twdb2003-013
Figure 18-1: Location of Kinney County in Texas.
boundaries of the Kinney County Groundwater Conservation District coincide with the boundaries of the county.
The study area includes rock outcrops of the Edwards (Balcones Fault Zone [BFZ]) and Edwards-Trinity (Plateau) aquifers located within the Nueces and West Nueces River basins as well as within Kinney County (Figure 18-2). Both aquifers collectively occupy the northern half of Kinney County where the western Balcones Fault Zone escarpment terminates the southern margin of the Edwards Plateau. In the Nueces and West Nueces River basins as well as within Kinney County, the Edwards (BFZ) aquifer consists of rocks of the Edwards Group that include the West Nueces, McKnight, and Salmon Peak formations (Figure 18-3). In Kinney County, the Edwards-Trinity (Plateau) aquifer consists of rocks of the Edwards Group that include the West Nueces, McKnight, Salmon Peak, and the Devils River formations (Figure 18-3). In the Nueces and West Nueces River basins, the Edwards-Trinity (Plateau) aquifer consists of rocks of the Edwards

348
EDWARDS
REAL
KINNEY UVALDE
NuecesRiverBasin
West NuecesRiver Basin
N 0 20 Miles10
twdb2003-014
Edwards-Trintity (Plateau) aquifer confined zone
Legend
Edwards (BFZ) aquifer recharge zone
Edwards (BFZ) aquifer confined zone
Nueces and West Nueces River basins
Edwards-Trinity (Plateau) aquifer recharge zone
Figure 18-2: Edwards (BFZ) and Edwards-Trinity (Plateau) aquifers in study area.

349
BasalCretaceous
Sand
Glen Rose Limestone
Pearsall Fm.
Sligo Fm.
Hosston Fm.
Del Rio Clay
Upper CretaceousUndivided
PaleozoicUndivided
Buda Limestone
UvaldeGravel
Alluvium
N SMIDDLEBASIN
UPPERBASIN
LOWERBASIN
Segovia Fm.
FortTerrett Fm.
Salmon Peak Fm.
McKnight Fm.
West Nueces Fm.
twdb2003-015
Figure 18-3: Correlation chart showing chronostratigraphic, lithostratigraphic, and hydrologic units of the Edwards-Trinity and Edwards Aquifer systems within the Nueces and West Nueces River basins (after Barker and Ardis, 1996). The Edwards (BFZ) consists only of the West Nueces, McKnight, and Salmon Peak formations within the study area.

350
Group that include the West Nueces, McKnight, Salmon Peak, Devils River, Fort Terrett, and Segovia formations (Figure 18-3). In addition to Edwards Group rocks, the Edwards-Trinity (Plateau) aquifer also consists of rocks of the underlying Trinity Group (Figure 18-3) occurring mostly in the subsurface except where exposed by erosion in the lower valleys and canyons of the Nueces River basin. Edwards Group rocks outcrop at elevations ranging from about 1,100 feet to about 2,000 feet above mean sea level within Kinney County and from about 950 feet to about 2,400 feet above mean sea level within the Nueces and West Nueces River basins.
As stated above, the aquifers in Kinney County are the Edwards (BFZ) aquifer and the Edwards-Trinity (Plateau) aquifer. The Edwards-Trinity (Plateau) aquifer in Kinney County primarily expresses itself at land surface with rocks of the Edwards Group. It is these rocks of the Edwards Group that accept recharge in Kinney County. Therefore, we refer to recharge to the Edwards (BFZ) and Edwards-Trinity (Plateau) aquifers as recharge to the Edwards aquifers in this document when referred to collectively.
Previous estimates of recharge Previous estimates of recharge to the Edwards aquifers in Kinney County fall into three categories: (1) published estimates of recharge specifically for Kinney County, (2) published estimates of recharge for a greater area that includes Kinney County, and (3) unpublished estimates, generally consultant reports, of recharge for Kinney County.
Published estimates of recharge for Kinney County
Bennett and Sayre (1962) used streamflow information (as measured between September 28, 1939 and September 30, 1950) for the Nueces and West Nueces Rivers to estimate the amount of recharge to the Edwards aquifers in Kinney County (an explanation of their approach is described later). This resulted in an estimate of recharge of "…roughly…" 70,000 acre-feet/year to the Edwards aquifers in Kinney County, or an equivalent of 1.4 inches per year.
Khorzad (2003) noted that considerably more streamflow data had been collected since Bennett and Sayre's (1962) analysis. Furthermore, he noted that the current (as of 1998) record indicated a much wetter regime than the focus of Bennett and Sayre's (1962) analysis of 1940s data. Therefore, Khorzad (2003) reapplied the Bennett and Sayre (1962) method to the full period of record, although he used proportions of the full record to the 1939 to 1950 period of record to calculate flow at the mouth of the West Nueces River instead of directly calculating flow using the information presented by Bennett and Sayre (1962). Also, Khorzad (2003) restricted his calculations to the recharge in the part of Kinney County in the West Nueces River basin. His analysis results in an estimate of 67, 983 acre-feet per year. Khorzad (2003) also accounted for cross-formational flow, assuming that five percent of the recharge calculated above would come from cross-formational flow from the Edwards-Trinity aquifer. Accounting for this flow, Khorzad's (2003) recharge estimate for the Edwards aquifer in Kinney County (the northeastern part of the county) is 71,382 acre-feet per year.

351
EDWARDS
REAL
KINNEY UVALDE
Nueces RiverbasinWest Nueces
River basin
Streamflow gage on theWest Nueces Rivernear Brackettville
Streamflow gage on theNueces River
at Laguna
Mouth of theWest Nueces River
0 20 Miles10N
twdb2003-017
Figure 18-4: Nueces and West Nueces River basins.
Published estimates of recharge for an area that includes Kinney County
Muller and Price (1979) estimated recharge to the Edwards-Trinity (Plateau) aquifer in the Nueces and West Nueces River basins at 107,500 acre-ft per year. The Nueces and West Nueces River basins include parts of Edwards, Kinney, Real, and Uvalde counties (Figure 18-4). We calculated this to be a recharge rate of about 1.4 inches per year (using the area of 1,464 square miles estimated by Bennett and Sayre (1962) for Nueces and West Nueces River basins above their upstream gages). Muller and Price (1979) do not explain how they calculated their recharge number, but it is likely that they used Bennett and Sayre's (1962) estimate.

352
Kuniansky and Holligan (1994) developed a numerical groundwater flow model of the Edwards (BFZ) and Edwards-Trinity (Plateau) aquifers and assigned recharge rates between 0.25 and 2.0 inches per year for the recharge zone in Kinney County with higher values generally in the eastern part of the county. They assigned recharge values according to baseflow estimates and variations in precipitation and then adjusted these values to calibrate the model. Kuniansky and Holligan (1994, using information from Kuniansky, 1989) did not calculate and therefore did not use baseflow estimates for the basins in Kinney County1. Recharge rates assigned in Kinney County appear to be based on calibration of the model, variations in precipitation, and relative consistency with the baseflow estimates of the Nueces River basin. Kuniansky and Holligan (1994) did not report recharge volumes on a county basis. We were not able to calculate recharge volume based on the information in the report.
The eastern part of Kinney County includes part of the recharge zone for the Edwards (BFZ) aquifer. Several authors have estimated recharge for the Edwards (BFZ) aquifer (for example, Petitt and George, 1956; Garza, 1962; Puente, 1978; Muller and Price 1979; Wanakule and Anaya, 1993; Choffel and Vaugh, 1993). However, those recharge estimates combine the recharge from both the Nueces and West Nueces River basins and exclude recharge in the western portion of Kinney County outside of those basins. Most, if not all, of these methods do not include recharge to the Edwards (BFZ) aquifer north of the stream gage near Brackettville.
The Edwards Aquifer Authority (EAA) contracted HDR Engineering, Inc. to develop a new recharge calculation methodology for the San Antonio segment of the Edwards (BFZ) aquifer (HDR, 2002). HDR developed pilot recharge models for the Nueces and Blanco recharge basins using Hydrologic Simulation Program-Fortran (HSPF) to translate daily upstream flows, rainfall, and evaporation into recharge and downstream flows with a water-balance approach. As in the traditional USGS recharge method, the pilot model incorporated both the Nueces and West Nueces basins to calculate a mean annual recharge of about 117,280 acre-feet for the period of 1950 to 1998. The pilot model calculated a long-term (1950-1998) mean annual diffuse recharge of 28,322 acre- feet or 16 percent of annual rainfall to the Edwards (BFZ) aquifer of the West Nueces land segment of which about 60 percent is within Kinney County. In addition, HDR
separated baseflow from historical flows at the stream-flow gage near Laguna to determine recharge to the Edwards-Trinity (Plateau) aquifer as 1.78 inches per year or 7.1 percent of annual rainfall. The pilot model alternatively expresses mean annual diffuse recharge for the Edwards (BFZ) within both the Nueces and West Nueces River Basins as 10.7 percent of annual rainfall.
1 This was appropriate. Using baseflow analysis to estimate recharge requires that water that recharges the aquifer within the basin be discharged as baseflow within that basin. This does not occur in the basins in Kinney County.
353
Unpublished estimates of recharge for Kinney County
Robert S. Kier Consulting (1998) produced a report on a preliminary assessment of groundwater availability for central Kinney County. They reported Bennett and Sayre's (1962) estimate of recharge and observed that Bennett and Sayre's (1962) discharge numbers suggest an average annual recharge of 90,000 to 95,000 acre-feet per year for Kinney County. Although not stated in the report, this definition of recharge used by Robert S. Kier Consulting (1998) includes underflow in addition to recharge due to infiltration.
In a letter sent to the Kinney County Groundwater Conservation District, Khorzad (2002) summarized work to assess the availability of groundwater in the county that included an estimate of recharge. He offered two estimates of average annual recharge to the Edwards aquifers in the county: 139,365 acre-feet per year and 140,498 acre-feet per year. The first value is derived from applying a modified Bennett and Sayre (1962) method over the longer period of record and adding an additional five percent of the recharge in the West Nueces River basin in Kinney County to account for cross-formational flow from the Glen Rose Limestone of the Trinity Group to the Edwards (BFZ) aquifer. The second value is derived by assigning two thirds of the recharge calculated from applying the modified Bennett and Sayre (1962) method over the longer period of record to the recharge area in the West Nueces River basin in Kinney County and then adding an additional five percent of the recharge in the West Nueces River basin in Kinney County to account for cross-formational flow from the Glen Rose Limestone of the Trinity Group to the Edwards (BFZ) aquifer.
The Bennett and Sayre (1962) method Bennett and Sayre (1962) noted that recharge to the Edwards aquifers in Kinney County "…cannot be computed directly…". This is because the Edwards aquifers in Kinney County are karstic, are recharged over a large area, and are not entirely discharged locally. However, Bennett and Sayre (1962) recognized that they could estimate recharge to the Edwards aquifers in Kinney County by taking advantage of similarities and an important difference between the adjacent catchment areas of the upper reaches of the West Nueces and Nueces River basins.
The similarities between the two basins are that they have similar catchment areas above their upstream gages, similar climates, similar vegetation, and similar geology in the recharge areas on the plateau. The important difference between the two basins is the geology exposed in the river valleys (Figure 18-5). The Nueces River and its major tributaries have cut through the Edwards Group rocks and into the Upper Glen Rose Formation of the Trinity Group. The Upper Glen Rose Formation has a lower permeability than does the overlying Edwards Group rocks. This dissimilarity in permeability enables most of the water that recharges the Edwards Group on the plateau to discharge into the Nueces River basin from springs near the contact between the Edwards Group and the Upper Glen Rose Formation. In contrast, the West Nueces River has not cut all the way through the Edwards Group rocks except in a few locations.

354
EDWARDS
KINNEY UVALDE
REAL
LegendNueces & West Nueces ConfluenceUSGS Streamflow GagesQuaternary Stream Deposits
Tertiary Igneous
Upper Cretaceous
Edwards Group
Trinity Group
Nueces and West Nueces Basin Boundaries
N 0 20 Miles10
Streamflow gage on theWest Nueces Rivernear Brackettville
Streamflow gage on theNueces River
at Laguna
Mouth of theWest Nueces River
twdb2003-018
Figure 18-5: Geologic units of the Nueces and West Nueces River basins.

355
As Bennett and Sayre (1962) note, streamflow measured at the gage near Brackettville on the West Nueces River is only a fraction of the streamflow measured at the Laguna gage on the Nueces River despite their basin similarities and proximity to each other (Figure 18-7). This difference is due to the different geology exposed in the river valleys.
Bennett and Sayre (1962) estimated recharge in the West Nueces River basin by calculating the difference between the amount of water available for recharge and the amount of runoff that flowed out of the West Nueces basin. They estimated the amount of water available for recharge in the West Nueces basin by using streamflow measured by the Nueces River gage at Laguna. The gage at Laguna captures the surface runoff in the Nueces River basin and baseflow that is primarily derived from water that recharged the Edwards Group rocks on the plateau. Bennett and Sayre (1962) observed that the West Nueces River needed a minimum flow of 2,040 cubic feet per second at the gage near Brackettville for flow to reach the confluence with the Nueces River. Therefore, runoff out of the West Nueces River basin above the confluence is equal to the streamflow measured at the gage near Brackettville minus 2,040 cubic feet per second when flow at the gage is greater than 2,040 cubic feet per second.
Based on the above observations, Bennett and Sayre (1962) estimated recharge in the West Nueces River basin using the following equation:
wnnwn RoRoR −≈ where:
wnR = recharge per unit area in the West Nueces basin above the confluence,
nRo = runoff per unit area for the Nueces basin above the upstream gage at Laguna, and
wnRo = runoff per unit area for the West Nueces River basin above the confluence.
Bennett and Sayre's (1962) equation represents a simple water budget such that the difference between water available for recharge into a basin and water as runoff out of a basin is equal to the water that recharges the Edwards aquifers in the basin.
Methodology After reviewing the available information and different methods of estimating recharge, we decided that the Bennett and Sayre (1962) method was the best available method for estimating recharge. However, additional streamflow information has been collected since Bennett and Sayre's (1962) original calculations. Our intent was to apply the Bennett and Sayre (1962) method with the longer period of streamflow record to improve upon the original recharge estimate for Kinney County, similar to what Khorzad (2002) did.
When we applied the Bennett and Sayre (1962) method, we wanted to be sure that we were applying it correctly. Therefore, we tried to reproduce the recharge estimates they published in their report. It was during this effort that we discovered two errors that

356
Bennett and Sayre (1962) made when they applied their method. One error was using the wrong streamflow, and the other error was using an incorrect area for the West Nueces River basin in Kinney County. Note that although the recharge numbers originally reported in Bennett and Sayre (1962) are wrong, they are wrong because of how Bennett and Sayre (1962) applied their method, not because of a flaw in their method.
The errors that Bennett and Sayre (1962) made in their calculations result in large changes in estimates of recharge. Therefore, in the sub-sections below, we present what their estimates of recharge should have been if they had used the proper numbers. We do this so that the reader can understand and put into context our final estimates of recharge based on the longer period of record.
For our final estimate of recharge, we improved upon the Bennett and Sayre (1962) recharge estimate in three ways: (1) we used a longer period of record, (2) we more accurately quantified recharge area in the county and West Nueces basin, and (3) we more appropriately distributed recharge to the Edwards (BFZ) and Edwards-Trinity (Plateau) aquifers in Kinney County.
The following sections include (1) application of the Bennett and Sayre (1962) method to the original data set, (2) description of work to quantify county recharge and basin area, (3) application of the Bennett and Sayre (1962) method to the longer data set using more accurately quantified areas, (4) discussion and application of a modified Bennett and Sayre (1962) method that more appropriately distributes recharge to the Edwards (BFZ) and Edwards-Trinity (Plateau) aquifers in Kinney County, and (5) discussion of assumptions used in our modified Bennett and Sayre (1962) method. A summary of each of the recharge estimates is shown in Table 18-1.
Application of the Bennett and Sayre (1962) method to the original data set
To be sure that we were using the Bennett and Sayre (1962) method correctly, we applied it to streamflow data downloaded from the U.S. Geological Survey Web page for the same time period used by Bennett and Sayre (1962) in their study. This resulted in a recharge of about 86,000 acre-ft per year for the West Nueces River basin, greater than the 70,000 acre-ft per year reported by Bennett and Sayre (1962). After careful review, we found a disagreement between the annual flow reported for the Nueces River at Laguna by Bennett and Sayre (1962, table 2, p. 76, 21,600 acre-ft) and the value reported in the information downloaded from the U.S. Geological Survey Web site (165,600 acre- ft). The number reported in the online file agrees with the value reported in Geological Survey Water Supply Paper - 1148 for the 1949 water year (USGS, 1951). Therefore, it appears that Bennett and Sayre (1962) used the wrong streamflow value for the Nueces River for water year 1949.
Consequently, using the correct streamflow with Bennett and Sayre's (1962) estimates of recharge areas in Kinney County results in a recharge value of 86,000 acre-feet per year for the Edwards aquifers in Kinney County.
357
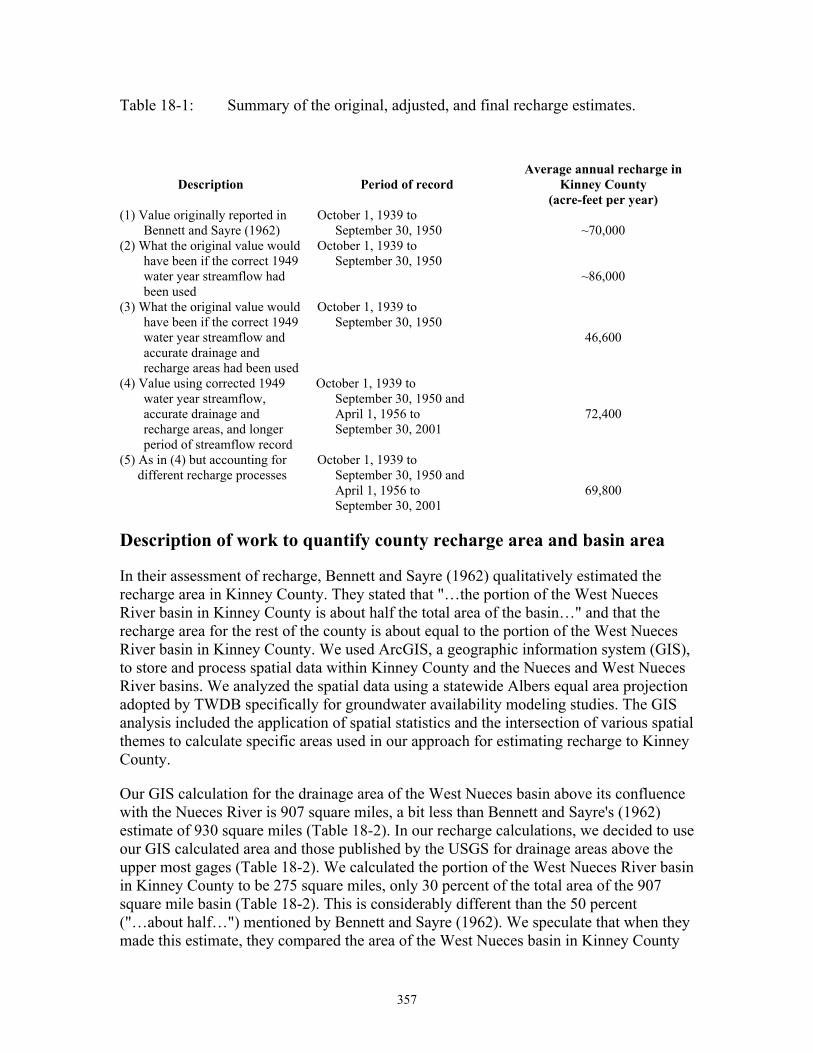
Table 18-1: Summary of the original, adjusted, and final recharge estimates.
Description Period of record Average annual recharge in
Kinney County (acre-feet per year)
(1) Value originally reported in Bennett and Sayre (1962)
October 1, 1939 to September 30, 1950
~70,000
(2) What the original value would have been if the correct 1949 water year streamflow had been used
October 1, 1939 to September 30, 1950
~86,000
(3) What the original value would have been if the correct 1949 water year streamflow and accurate drainage and recharge areas had been used
October 1, 1939 to September 30, 1950
46,600
(4) Value using corrected 1949 water year streamflow, accurate drainage and recharge areas, and longer period of streamflow record
October 1, 1939 to September 30, 1950 and April 1, 1956 to September 30, 2001
72,400
(5) As in (4) but accounting for different recharge processes
October 1, 1939 to September 30, 1950 and April 1, 1956 to September 30, 2001
69,800
Description of work to quantify county recharge area and basin area
In their assessment of recharge, Bennett and Sayre (1962) qualitatively estimated the recharge area in Kinney County. They stated that "…the portion of the West Nueces River basin in Kinney County is about half the total area of the basin…" and that the recharge area for the rest of the county is about equal to the portion of the West Nueces River basin in Kinney County. We used ArcGIS, a geographic information system (GIS), to store and process spatial data within Kinney County and the Nueces and West Nueces River basins. We analyzed the spatial data using a statewide Albers equal area projection adopted by TWDB specifically for groundwater availability modeling studies. The GIS analysis included the application of spatial statistics and the intersection of various spatial themes to calculate specific areas used in our approach for estimating recharge to Kinney County.
Our GIS calculation for the drainage area of the West Nueces basin above its confluence with the Nueces River is 907 square miles, a bit less than Bennett and Sayre's (1962) estimate of 930 square miles (Table 18-2). In our recharge calculations, we decided to use our GIS calculated area and those published by the USGS for drainage areas above the upper most gages (Table 18-2). We calculated the portion of the West Nueces River basin in Kinney County to be 275 square miles, only 30 percent of the total area of the 907 square mile basin (Table 18-2). This is considerably different than the 50 percent ("…about half…") mentioned by Bennett and Sayre (1962). We speculate that when they made this estimate, they compared the area of the West Nueces basin in Kinney County

358
Table 18-2: Drainage and recharge areas for the Nueces and West Nueces River basins and Kinney County.
TWDB Drainage area of West Nueces River above gage near Brackettville......................................... 688 mi2
Drainage area of West Nueces River above confluence with Nueces River ............................. 907 mi2
Drainage area of Nueces River above gage near Laguna........................................................... 744 mi2
Area of recharge zone in Kinney County inside West Nueces River basin............................... 275 mi2
Area of recharge zone in Kinney County outside West Nueces River basin............................. 216 mi2
USGS Drainage area of West Nueces River above gage near Brackettville......................................... 694 mi2
Drainage area of Nueces River above gage near Laguna........................................................... 737 mi2
Bennett and Sayre (1962) Drainage area of West Nueces River above gage near Brackettville......................................... 700 mi2
Drainage area of West Nueces River above confluence with Nueces River ............................. 930 mi2
Drainage area of Nueces River above gage near Laguna........................................................... 764 mi2
Area of recharge zone in Kinney County inside West Nueces River basin.............................~350 mi2
Area of recharge zone in Kinney County outside West Nueces River basin...........................~350 mi2
Bold = values used in the final analysis presented in this document
to the area of the West Nueces basin outside of Kinney County instead of to the area of the entire West Nueces basin (Figure 18-5). Bennett and Sayre (1962) estimated the recharge area for the rest of the county as being equal to that portion of the West Nueces basin in Kinney County. We calculated the rest of the county to be 216 square miles or about 79 percent of that portion of the West Nueces basin in Kinney County (Table 18-2).
Revising Bennett and Sayre's (1962) recharge estimate to consider the correct streamflow for water year 1949 and the correct drainage and recharge areas result in a recharge estimate of about 46,600 acre-ft per year for the Edwards aquifers in Kinney County. This is the value that Bennett and Sayre (1962) should have published in their report.
Application of the Bennett and Sayre (1962) method to the longer data set using more accurately quantified areas
In their assessment of recharge, Bennett and Sayre (1962) used streamflow measurements from October 1, 1939 to September 30, 1950. In our assessment, we used streamflow measurements from September 28, 1939 to September 30, 1950 and from April 1, 1956 to September 30, 2001 (streamflow was not measured in the West Nueces River between October 1, 1950 and March 31, 1956). This 56.5-year record allowed for a longer period to estimate an 'average' recharge value. In comparison, Bennett and Sayre (1962) used a period of record of 11 years during a time when rainfall was relatively low.
359
Using the longer period of record and the correct drainage and recharge areas resulted in a recharge of about 133,800 acre-ft per year for the West Nueces basin. This equates to a recharge of about 72,400 acre-ft per year for the Edwards aquifers in Kinney County.
Discussion and application of a modified Bennett and Sayre (1962) method that more appropriately distributes recharge to the Edwards (BFZ) and Edwards-Trinity (Plateau) aquifers in Kinney County
Recharge occurs differently for the Edwards (BFZ) aquifer than for the Edwards-Trinity (Plateau) aquifer. In the Edwards (BFZ) aquifer, much of the recharge occurs by rivers losing streamflow directly into the aquifer. This type of recharge is facilitated by faulting and fracturing associated with the Balcones Fault Zone. In the Edwards-Trinity (Plateau) aquifer, much of the recharge occurs more diffusely over a larger area instead of along a specific discrete feature such as faults and fractures in a riverbed. This diffuse type of recharge also occurs in the Edwards (BFZ) aquifer but at a lesser magnitude than the direct type of recharge. Kinney County likely includes both of these types of recharge: direct recharge where the West Nueces River crosses the Edwards (BFZ) aquifer and diffuse recharge everywhere else.
The Bennett and Sayre (1962) method does not distinguish between direct recharge from losing streamflow and diffuse recharge. Instead, their method averages both of these types of recharge over the entire West Nueces basin. On one hand, this averaging potentially results in an underestimate of recharge to the Edwards (BFZ) aquifer in the West Nueces River basin in Kinney County. On the other hand, this averaging potentially results in an overestimate of recharge to the Edwards-Trinity (Plateau) aquifer in Kinney County.
We modified the Bennett and Sayre (1962) method to consider these differences in recharge mechanisms in Kinney County. The approach we followed (with volumes rounded to the nearest 100 acre-ft) was:
1. Estimate mean annual total recharge in the West Nueces basin above the confluence with the Nueces River using the Bennett and Sayre (1962) method using the longer period of record and correctly quantified areas (133,800 acre-ft per year).
2. Estimate the direct recharge to the Edwards (BFZ) aquifer from the West Nueces River by calculating the streamflow loss between the gage near Brackettville and the confluence with the Nueces River (all daily streamflows less than 2,040 cubic feet per second with those greater than or equal to 2040 cubic feet per second set to a maximum of 2040 cubic feet per second yields 12,200 acre-ft per year).
3. Estimate the amount of diffuse recharge by subtracting the estimate of direct recharge from the estimate of total recharge (133,800 acre-ft per year minus 12,200 acre-ft per year equals 121,600 acre-ft per year).

360
4. Calculate the diffuse recharge per square mile for the West Nueces basin (121,600 acre-ft per year divided by 907 square miles equals 134 acre-ft per year per square mile).
5. Estimate the diffuse recharge to the Edwards aquifers in Kinney County by multiplying the diffuse recharge per square mile by the total recharge area in the county (134 acre-ft per year per square mile multiplied by 491 square miles equals 65,800 acre-ft per year).
6. Estimate direct recharge into Kinney County by calculating the length of the West Nueces River in Kinney County below the gage near Brackettville, dividing by the length of the West Nueces River between the gage near Brackettville and the confluence in Uvalde County, and multiplying by the direct recharge ([13.7 miles divided by 41.6 miles] multiplied by 12,200 acre-ft per year equals 4,000 acre-ft per year).
7. Calculate the total recharge to the Edwards aquifer in Kinney County by summing the estimate of diffuse recharge to the Edwards aquifer in Kinney County with the estimate of direct recharge into Kinney County (65,800 acre-ft per year plus 4,000 acre-ft per year equals 69,800 acre-ft per year)
Therefore, our estimate of recharge to the Edwards aquifers in Kinney County is 69,800 acre-ft per year. Modification of the Bennett and Sayre (1962) method to account for differences in direct and diffuse recharge only yielded about a 3 percent correction to the recharge estimate for Kinney County. However, we felt that this exercise was justified in that we were able to eliminate an otherwise additional assumption to the method.
Discussion of assumptions used in the Bennett and Sayre (1962) method
Bennett and Sayre (1962) state that an estimate based on their methodology may be in error due to several assumptions that may not be wholly true. The assumptions they list are:
• the surface-water divides and groundwater divides coincide, • the rainfall in the Nueces and West Nueces River basins is the same, • average evapotranspiration rates are the same in both basins, and • withdrawals by man are negligible.
In addition, we identified several other assumptions associated with the methodology:
• direct recharge from streamflow losses of the West Nueces River into the Edwards (BFZ) aquifer is uniform along the entire stream reach,
• there are no surface-water diversions from the Nueces River above the streamflow gage at Laguna, and
• cross-formational flow of water from the underlying rocks of the Trinity Group into the Edwards aquifers is negligible.

361
We discuss each assumption in more detail below and the effects that each of the assumptions may have on an estimate of recharge in Kinney County.
Surface-water divides and groundwater divides coincide
This assumption is important relative to surface-water and groundwater flow in the basin above the gage on the Nueces River at Laguna. The Bennett and Sayre (1962) method assumes that the flow measured at the gage represents direct runoff and groundwater baseflow resulting from water that recharged the Edwards rocks on the plateau and then discharged back into the basin. Based on a water-level map developed by Bush and others (1993, sheet 3), it appears that this is a reasonable assumption. The map shows that groundwater divides approximate the location of surface-water divides for the Nueces basin above the gage near Laguna. If the surface-water divides delineate a greater area than the groundwater divides, recharge to Kinney County may be over estimated. If the surface-water divides delineate a smaller area than the groundwater divides, the recharge to Kinney County may be under estimated.
Rainfall in the Nueces and West Nueces River basins is the same
Rainfall affects how much runoff there is and the total amount of water that may be available for recharge. To test this assumption, we compared 1961 to 1990 mean annual precipitation data developed from the Parameter-elevation Regressions on Independent Slopes Model (PRISM) analytical model (Daly and Taylor, 1998) between the two basins. Since our objective was to analyze the relative precipitation difference between recharge areas of interest, we felt that the spatially interpolated PRISM data set would provide more accurate spatial characteristics of precipitation than would the longer period of record National Weather Service (NWS) gage site data. For comparison, 1961 to 1990 mean annual precipitation for the NWS gage station at Brackettville is 22.24 inches per year. The PRISM interpolated 1961 to 1990 mean annual precipitation for the same location is 21.78 inches per year. We downloaded the 4-kilometer resolution PRISM data from http://www.ocs.orst.edu/prism/prism_products.html and resampled it into a 1-mile resolution equal area coordinate system using GIS. The ArcGIS Spatial Analyst extension was then used to calculate zonal statistics for each recharge area of interest (Table 18-3).
In general, precipitation is spatially variable and decreases toward the west with the highest precipitation occurring in the east-central portion of the Nueces River basin. We found that the West Nueces River basin above the streamflow gage near Brackettville has about 93 percent of the mean annual precipitation of the Nueces River basin above the gage at Laguna. The West Nueces drainage area between its confluence with the Nueces River and the gage near Brackettville has about 92 percent of the mean annual precipitation of the Nueces River basin above the gage at Laguna. This assumption also applies to precipitation in the western part of Kinney County, which is about 86 percent of the rainfall in the Nueces River basin. Correcting for the spatial variability of rainfall would require more extensive analysis and modeling of runoff response to spatially distributed precipitation data. Divergence from this assumption generally results in an overestimate of recharge in Kinney County.

362
Table 18-3: Precipitation statistics for specific recharge areas.
Zone Zones of Interest Area (mi2)
Min (in/yr)
Max (in/yr)
Mean (in/yr)
% Mean Zone 1
1 Nueces River basin above upper gage @ Laguna
744 24.04 28.00 26.33 100
2 West Nueces River basin above upper gage near Brackettville
688 23.27 27.03 24.56 93
3 West Nueces River basin between confluence and upper gage near Brackettville
140 22.59 27.03 24.22 92
4 West Nueces River basin above confluence
907 22.59 27.03 24.48 93
5 Edwards outcrop in Kinney County inside of West Nueces River basin
275 22.59 27.03 24.10 92
6 Edwards outcrop in western Kinney County outside of basins
216 21.08 23.81 22.57 86
Average evapotranspiration rates are the same in both basins
Evapotranspiration affects how much precipitation percolates into the ground and runs off into stream. We were not able to locate measured values of evapotranspiration or evaporation at detailed enough resolution to quantify differences between the two basins. However, similar to precipitation, we would not expect there to be large differences between the two basins, especially where there are Edwards rocks. However, we would expect evapotranspiration to be greater to the west. Consequently, a divergence from this assumption in this case will likely result in an overestimate of recharge for Kinney County.
Evapotranspiration also affects baseflow to the Nueces River. Water that recharges the Edwards rocks on the plateau in the Nueces basin discharges to tributaries where they cut through the Edwards rocks into lower permeability Trinity rocks beneath. When this water approaches the land surface and discharges, some of it has a potential to be evapotranspirated. It is not possible to estimate how much of this water may be evapotranspirated since it is likely to vary in space and time. The perennial nature of baseflow in the Nueces River suggests that divergence from this assumption in this case results in an underestimate of recharge for Kinney County.
Groundwater withdrawals by man are negligible
An important assumption for our approach to estimating recharge for Kinney County is that anthropomorphic groundwater withdrawals are negligible for the Nueces River basin above the streamflow gage at Laguna. Groundwater withdrawals from the Edwards rocks in the Nueces River basin would decrease discharge from the Edwards rocks to the Nueces River tributaries where they cut through the Edwards rocks into lower permeability rocks beneath thus lowering flow at the Laguna gage. To assess the effect of this assumption, we compiled water-use information collected and estimated between 1980 and 2000 by the Texas Water Development Board Water Uses Section for the Edwards-Trinity (Plateau) aquifer for Uvalde, Real, and Edwards counties and within the

363
Nueces River basin. We estimated that about one third of the 1,400 acre-feet of mean annual groundwater discharge to actually occur within the Nueces River basin above the streamflow gage at Laguna. Therefore, it appears to be a reasonable assumption that groundwater withdrawals by man are negligible at less than 1 percent of the 119,500 acre-feet mean annual streamflow at the Laguna gage. Divergence from this assumption would result in an underestimate of recharge in Kinney County.
Leakage from the West Nueces River into the Edwards (BFZ) aquifer is uniform
Leakage from the West Nueces River into the Edwards (BFZ) aquifer is affected by the availability of water to flow along the river reach and the ability of that water to leak into the aquifer, both of which are assumed to be uniform along the riverbed in our and Bennett and Sayre's (1962) method. The availability of water is actually greater in the upper part of the reach than in the lower part. This is because the upper reach has the first chance to access water flowing from the basin upstream of the gage near Brackettville. Flows less than 2,040 cubic per second do not reach the confluence and likely stop further upstream. Divergence from this assumption based on the availability of water results in an underestimate of recharge in Kinney County.
The ability for water to leak into the Edwards (BFZ) aquifer is also likely not uniform along the West Nueces River. This ability is greatly affected by faulting and underlying geology. The faulting and underlying geology suggest that there may be a greater ability for water to leak into the Edwards (BFZ) aquifer in Uvalde County than in Kinney County. Most of the primary faults that likely cross the West Nueces River appear to occur in Uvalde County. Furthermore, the lower permeability rocks of the Trinity crop out along the West Nueces River in Kinney County. Consequently, the ability for water to leak into the Edwards (BFZ) aquifer from the West Nueces increases downstream. Divergence from this assumption based on the ability of water to leak into the aquifer likely results in an overestimate of recharge in Kinney County.
There are no surface-water diversions from the Nueces River above the gage near Laguna
Our approach for estimating recharge for the West Nueces River basin assumes that there are no surface-water diversions from the Nueces River above the gage near Laguna. We investigated the water rights and permitted diversions for the Nueces River above the gage at Laguna and found that a maximum of about 6,200 acre-feet per year may potentially and legally be removed from the streamflow for 2003. Except for 1,000 acre-feet per year permitted for use by the town of Camp Wood, the use of these diversions is for irrigation. Although the 6,200 acre-feet may not necessarily be used in its entirety in any given year, it amounts to 5 percent of the 119,500 acre-feet of mean annual streamflow as measured at the gage near Laguna. Consequently, this assumption may underestimate recharge in Kinney County by as much as six percent if the full permitted amounts are used and there is no return flow to the river.
364
Leakage of water from the underlying rocks of the Trinity Group into the Edwards aquifers is negligible
Rocks of the Trinity Group underlay the Edwards aquifers in Kinney County and most part of the Edwards-Trinity (Plateau) aquifer. There is potential for groundwater to flow between the Edwards aquifer and the Trinity aquifer. Khorzad (2002) discussed the possibility of water flowing from the Trinity aquifer up into the Edwards aquifer and reported a range of 5 to 53 percent (as discussed in Mace and others [2000, p. 57 and 86], the higher number from Kuniansky and Holligan [1994] is likely much too high). He used the lower value of the range (five percent) to estimate the possible component of flow into the Edwards aquifers.
The references named by Khorzad (2002) that estimate the amount of flow from the Trinity aquifer into the Edwards aquifer are for the Trinity aquifer in the Hill Country where the Trinity aquifer is exposed at land surface and can be easily recharged. The Trinity part of the Edwards-Trinity (Plateau) aquifer is not exposed on the plateau and therefore receives less recharge than its companion sediments in the Hill Country. To our knowledge, no one has estimated what this cross-formational flow may be. Divergence from this assumption results in an underestimate of recharge in Kinney County.
Discussion We believe that the recharge value that we calculated for Kinney County is the best available estimate given the available information. The recharge value reported by Bennett and Sayre (1962) is in error because they used an incorrect streamflow and incorrect areas. Because Bennett and Sayre (1962) is in error, any of the estimates based on Bennett and Sayre (1962) (that is, Muller and Price, 1979; Robert S. Kier Consulting, 1998; and Khorzad, 2002, 2003) are also in error. The recharge values of Kuniansky and Holligan (1994) are not the best available because a single value cannot be computed from their report and the values are from a very large regional model that may have considerable uncertainty. It is not possible to directly assess a recharge value for Kinney County with the information provided by HDR (2002).
Conclusions Bennett and Sayre (1962) developed a method to estimate recharge to the Edwards aquifers in Kinney County using stream-flow information from the Nueces and West Nueces River basins. Unfortunately, they erred in applying their methodology by using an incorrect value of streamflow and incorrectly estimating the recharge area for the West Nueces River basin in Kinney County. Therefore, authors that cite or use their methodology with the wrong area are also in error (that is, Khorzad, 2002, 2003; Muller and Price, 1979; Robert S. Kier Consulting, 1998). Using the correct value of stream flow and the correct area, Bennett and Sayre's (1962) estimate of average annual recharge for 1939 to 1950 should have been 46,600 acre-feet per year instead of the 70,000 acre-feet per year they reported. Using the Bennett and Sayre (1962) method with the correct area

365
and the full period of record (1939 to 1950 and 1956 to 2001) results in an average annual recharge of 69,800 acre-ft per year.
References Bennett, R. R., and Sayre, A. N., 1962, Geology and ground water resources of Kinney
County, Texas: Texas Water Commission, Bulletin 6216, 163 p.
Bicknell, B. R., Imhoff, J. C., Kittle, J. L., Jr., Donigian, A. S., Jr., and Johanson, R. C., 1997, Hydrological Simulation Program--Fortran, User's manual for version 11: U.S. Environmental Protection Agency, National Exposure Research Laboratory, Athens, Ga., EPA/600/R-97/080, 755 p.
Bush, P. W., Ardis, A. F., and Wynn, K. H., 1993, Historical potentiometric surface of the Edwards-Trinity aquifer system and contiguous hydraulically connected units, West-Central Texas: U.S. Geological Survey Water-Resources Investigations Report 92-4055, 3 plates.
Daly, C., and Taylor, G., 1998, Texas Average Annual Precipitation, 1961-90: Water and Climate Center of the Natural Resources Conservation Service, Portland, Oregon, CD-ROM.
Domenico, P. A. and Schwartz, F. W., 1990, Physical and chemical hydrology: John Wiley & Sons, New York, 824 p.
Fitts, C. R., 2002, Groundwater science: Academic Press, San Diego, California, 450 p.
Freeze, R. A., and Cherry, J. A., 1979, Groundwater: Englewood Cliffs, New Jersey, Prentice-Hall, Inc., 604 p.
Garza, S., 1962, Recharge, discharge, and changes in ground-water storage in the Edwards and associated limestones, San Antonio area, Texas, a progress report on studies, 1955-1959: Texas Board of Water Engineers Bulletin 6201, 51 p.
HDR, 2002. Pilot Recharge Models of the Nueces and Blanco River Basins: HDR Engineering, Inc., report to the Edwards Aquifer Authority, San Antonio, TX., variously paginated.
Jackson, J. A., 1997, Glossary of geology: American Geographical Society, Alexandria, Virginia, 769 p.
Kinney County Extension Office, 2001, Retrieved June 18, 2003, from http://kinney-tx.tamu.edu/.
Khorzad, K., 2002, Kinney County groundwater study: letter to the Kinney County Groundwater Conservation District dated July 25, 2002 from Wet Rock Groundwater Services, 13 p.
Khorzad, K., 2003, Edwards aquifer evaluation: Kinney County, Texas: Journal of the American Water Resources Association, October, p. 1093-1107.
Kuniansky, E. L., 1989, Precipitation, streamflow, and base flow in west-central Texas, December 1974 through March 1977: U.S. Geological Survey Water Resources Investigations Report 88-4218, 2 sheets.

366
Kuniansky, E. L., and Holligan, K. Q., 1994, Simulations of flow in the Edwards–Trinity aquifer system and contiguous hydraulically connected units, west-central Texas: U. S. Geological Survey Water-Resources Investigations Report 93-4039, 40 p.
Long, C., 2002, The Handbook of Texas Online - Kinney County: The General Libraries at the University of Texas at Austin and the Texas State Historical Association, Retrieved June 18, 2003, from http://www.tsha.utexas.edu/handbook/online/articles/view/KK/hck9.html.
Mace, R. E., and Anaya, R., 2003, Estimate of recharge to the Edwards (Balcones Fault Zone) and Edwards-Trinity (Plateau) aquifers in Kinney County, Texas:unpublished report delivered to the Kinney County Groundwater Conservation District by the Texas Water Development Board, Austin, Texas, 26 p.
Mace, R. E., Chowdhury, A. H., Anaya, R., and Way, S.-C., 2000, Groundwater availability of the Middle Trinity aquifer, Hill Country area, Texas- Numerical simulations through 2050: Texas Water Development Board Report 353, 117 p.
Mecke, M. B., 1996, Historical Vegetation Changes on the Edwards Plateau of Texas and the Effects Upon Watersheds: Proceedings ’96 - Moving Ahead Together, Technical Conference and Exposition, U. S. Environmental Protection Agency, Retrieved June 18, 2003, from http://www.epa.gov/owow/watershed/Proceed/mecke.html.
Muller, D. A. and Price R. D., 1979, Ground-water Availability in Texas, Estimates and Projections Through 2030: Texas Department of Water Resources Report 238, 77 p.
Petitt, B. M., Jr., and George, W. O., 1956, Ground-water resources of the San Antonio area, Texas: Texas Board of Water Engineers Bulletin 5608, v. I, 80 p. and v. II, pt. III, 231 p.
Puente, C., 1978, Method of estimating natural recharge to the Edwards aquifer in the San Antonio area, Texas: U.S. Geological Survey Water-Resources Investigations 78-10, 34 p.
Robert S. Kier Consulting, 1998, Edwards-Trinity aquifer ground water availability, preliminary assessment for central Kinney County, Texas- Revision: Consultant report, 9 p. + attachments.
U.S. Census Bureau, 2000, State and County QuickFacts – Kinney County: Retrieved June 18, 2003, from http://quickfacts.census.gov/qfd/states/48/48271.html.
USGS, 1951, Surface Water Supply of the United States 1949, Part 8 Western Gulf of Mexico Basins, Geological Survey Water Supply Paper – 1148: U.S. Government Printing Office, 197 p.
Wanakule, N., and Anaya, R., 1993, A lumped parameter model for the Edwards aquifer: Texas A&M University, Texas Water Resources Institute, Technical Report No. 163, 84 p.
Wilson, W. E., and Moore, J. E., 1998, Glossary of hydrology: American Geological Institute, Alexandria, Virginia, 248 p.