report - 2 - apeda...estimated as transplanted in the 27 districts of the state. shahjahanpur...
TRANSCRIPT

REPORT - 2 September 18th, 2018
Basmati Acreage & Yield Estimation in Punjab, Haryana, Delhi,
Uttarakhand, Himachal Pradesh, Western Uttar Pradesh and Parts of
Jammu & Kashmir
Basmati Export Development Foundation
APEDA, New Delhi
Basmati Survey - Report-2 (Season 2018)
This is the 2nd report for Basmati crop across 7 states totalling 81 districts. Detailed microscopic level
information has been collected and compiled in this report. The report begins with an overview of the
entire scenario of Basmati crop for the current season and then goes on to provide state wise and
then district wise production details.
Kharif 2018


Geotrans Technologies Pvt. Ltd.
Geotrans Technologies Pvt. Ltd. Page | 2
Geotrans Technologies Pvt. Ltd.
Contents Acknowledgement ................................................................................................................................................ 3
Chapter 1 ............................................................................................................................................................... 4
Executive Summary ......................................................................................................................................... 4
Chapter 2 ............................................................................................................................................................. 11
Project Background ........................................................................................................................................ 11
Scope of the current report ............................................................................................................................... 13
Study Area Details ......................................................................................................................................... 13
Chapter-3 ............................................................................................................................................................. 15
Rainfall ............................................................................................................................................................. 15
Chapter-4 ............................................................................................................................................................. 16
Ground Survey based Basmati Rice Acreage ........................................................................................... 16
District wise Basmati details ......................................................................................................................... 18
Haryana ....................................................................................................................................................... 18
Punjab .......................................................................................................................................................... 20
Uttar Pradesh .............................................................................................................................................. 22
Uttarakhand ................................................................................................................................................. 24
Jammu & Kashmir ...................................................................................................................................... 25
Himachal Pradesh ...................................................................................................................................... 25
Chapter-5 ............................................................................................................................................................. 26
District wise Production Details ................................................................................................................ 26
Basmati & Long Grain Non- Notified Non-Basmati ............................................................................... 26
(Production in 000 tons) ............................................................................................................................ 26
Chapter-6 ............................................................................................................................................................. 29
Rainfall ( District wise rainfall data) ............................................................................................................. 29
Chapter-7 ............................................................................................................................................................. 32
Price Monitor ................................................................................................................................................... 32
Methodology .................................................................................................................................................... 34
Way Forward ................................................................................................................................................... 34
Data Source .................................................................................................................................................... 34
Geotrans Technologies Pvt. Ltd.
Acknowledgement
We are thankful to the Chairman, Agricultural and Processed Food Products Export Development
Authority (APEDA) – Shri. Paban Kumar Borthakur and the Director, Basmati Export Development
Foundation (BEDF) - Mr. A. K. Gupta, for assigning the work and being a force behind the basmati
study.
We are grateful to Mr. Vijay Setia, President, All India Rice Exporters’ Association (AIREA) and
Hon’ble Exporter Members of AIREA for cooperating in the field survey.
We would like to thank the Director, AIREA and his complete team for providing the details on various
aspects of farms/ farmers/ acreage and other relevant historical details for completing this survey.
The scientific team of Geotrans would like to thank all the farmers, traders, exporters, agriculture input
dealers and others who participated in this survey programme and supported our field team. We
expect that all stakeholders extend similar kind of support in subsequent reports for successful
completion of project in time bound manner
TEAM GEOTRANS
Geotrans Technologies Pvt. Ltd.

Geotrans Technologies Pvt. Ltd. Page | 4
Chapter 1 Executive Summary
Scope of the Report
The present report for Kharif 2018 covers the results of field survey-based acreage estimation &
crop health reporting of rice area transplanted and Basmati varieties in the different districts of
Punjab, Haryana, Delhi, Uttar Pradesh, Uttarakhand, Himachal Pradesh and Jammu & Kashmir.
This time we have also taken the help of satellite images to generate the second opinion on the
crop acreage, its spread & crop health to substantiate with our field report findings. Basis the crop
health we have derived to the yield levels which lead us to give the initial estimates of the basmati
cop production across various districts in studied 7 states. As we move further in the harvest
season we will give more insights on the realized yields and the clearer picture that will immerse on
the production of basmati crop. This report primarily covers the crop acreage to the level of district
wise & state wise along with preliminary estimates on basmati crop production.
Study districts
The study has been conducted in 81 districts, which includes 22 districts of Punjab, 21 districts of
Haryana, 29 districts of Uttar Pradesh, 4 districts of Uttarakhand, 2 districts of Himachal Pradesh
and 3 districts of Jammu & Kashmir and findings are elaborated in form of tables / text and pictures.
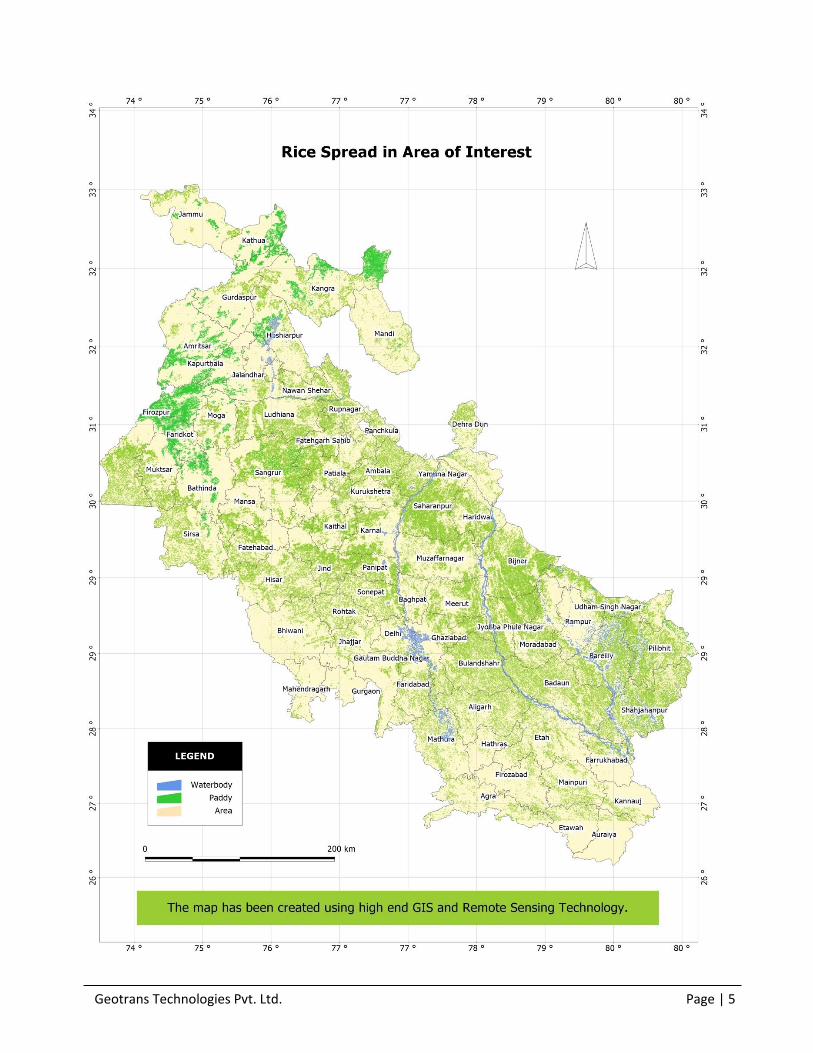
Rice Acreage
Apart from field survey techniques we have validated the data using high end satellite mapping
technology. The spatial spread of the same is shown in the next page...
This year the total rice transplanted area in India has increased by 2.3% i.e. from 37.33 million ha to
38.19 million ha in the kharif 2018-19 season. The total rice crop in the studied 7 states & 81
districts has been increased by 2.54% in the kharif 2018-19 season. Although, the% area occupied
by Basmati has reduced in major states of Haryana and Punjab by 2.87% and 2.67% respectively
as observed during the second survey estimates, which will be further substantiated in subsequent
reports from field visits. While in U.P. the area under Basmati has decreased by almost five
thousand ha. Overall, Basmati area has decreased by 2.46% in comparison to last year. Whereas,
the area under other Long Grain Non-Basmati (Sharbati & Sugandha) rice has slightly increased
from 302,817 to 304,482 ha.
In Punjab, the rice transplanting has been done on 30,37,379 ha in 22 districts this year. Sangrur
district has the largest area under rice (281,605 ha), followed by Ludhiana district (261,841 ha). The
area under Basmati variety Pusa Basmati-1121 has reduced this year by 3.48% in comparison to
last year. The area under Pusa Basmati-1509 has significantly increased from 40,168 ha. to
41,087ha in comparison to last year as the farmers shifted to PB 1509 from PB 1121. Farmers
realized yields & higher return on PB 1509 along with shorter duration makes PB 1509 as preferred
choice over PB 1121 in Punjab.
Geotrans Technologies Pvt. Ltd. Page | 5

Geotrans Technologies Pvt. Ltd. Page | 6
In Haryana, the total rice acreage based on field survey has been estimated at 13,29,000 ha in 20
districts, which is about 3.26% higher than last year. Karnal district has the highest transplanted
area under rice (166,618 ha), followed by Kaithal district (164,542ha). However, overall Basmati
area has reduced by 2.87% in comparison to last year.
In Uttar Pradesh, timely onset of monsoon, rice transplanting was started in time and continued in
full swing during July end. A total of 13,36,066 ha. rice acreage based on field survey has been
estimated as transplanted in the 27 districts of the state. Shahjahanpur district has the largest total
rice area (1,97,622 ha), followed by Pilibhit (1,52,942 ha) and in districts like Muzaffarnagar,
Bagpat, Meerut, many farmers have sown sugarcane replacing Basmati speculating higher
sugarcane state advised prices from the state Govt and timely payment from sugarmills. The
overall Basmati acreage in UP has been reduced by 1.96% over last year.
In Uttarakhand, a total of 129,635 ha rice acreage has been estimated as transplanted in the 4
studied districts. Udham Singh Nagar district has the largest area under rice (99,480 ha). This year
overall basmati crop has been reduced to 1.5% across state, while in certain major districts of
Uttarakhand basmati acreage, especially Pusa 1121 has been reduced more than 10%.
In Jammu & Kashmir, three districts have been taken up for study. The total rice area is estimated
to be 137,000 ha. in these studied districts. The state has received normal rainfall this year. Area
under basmati & rice is almost intact as farmer have lesser choice other than variety like Ranbir/
Basmati 307. These varieties pay well to farmers in recent past and has constant demand in market
too.
In Himachal Pradesh, a total of 74,000 ha rice acreage based on field survey has been estimated in
11 districts (but we covered only two districts in our study). Basmati is majorly grown in Kangra and
Mandi districts only. Kangra district has the highest area under basmati in the state. The farmers
opted Permal varieties including PR-123. Farmers also preferred Pusa-Basmati 1509 over Pusa
1121.
State Wise Transplanted Area
Basmati & Non-Basmati Long Grain Rice Area during Kharif 2018
Total rice transplanting in the studied 7 states has been increased by 2.54% from last year.
Farmers shifted from crops like cotton / coarse cereals / basmati in Haryana/ Punjab & Wester part
of Uttar Pradesh. The total Basmati (notified varieties) area in these targeted 7 states& 81 districts
has decreased by 2.46%. The notified Basmati varieties majorly comprises of Basmati-370,
Basmati- 386, Type-3 (Dehraduni), Taraori, Ranbir/ Basmati 307, Pusa-1509, Pusa Basmati-1,
CSR–30 and Pusa Basmati-1121
This year about forty to fifty thousand hac area under basmati has been shifted either to normal
paddy or shifted to other major competitive crops like sugarcane/coarse cereals in comparison to
last year.

Geotrans Technologies Pvt. Ltd. Page | 7
State Wise Transplanted Area,
Basmati & Non-Basmati long grain Rice Area during Kharif 2018 (Area in 000 ha.)
S. No State Total
Basmati Pusa-1121 PB-1
Pusa-1509
Pusa-1401
Basmati 370
CSR-30
Type-3 &
Others
Non-Notified
Sharbati Sugandha
1 Haryana 633.7 428.5 41.2 33.6 43.1 87.3 5.8
2 Punjab 546.6 482.2 23.1 41.1 5.9
3 Uttar Pradesh 250.8 138.0 41.8 58.2 12.7 174.0 91.6
4 Uttarakhand 14.6 3.4 2.3 2.6 6.3 17.0 0.5
5 Jammu & Kashmir 62.6 8.2 0.3 54.1 10.1
6 Himachal Pradesh 7.1 1.9 5.2 0.0
7 Delhi 0.0
Total 1515.3 1062.2 108.3 140.8 43.1 54.1 87.3 19.1 212.8 92
State Wise initial estimated production of Basmati & Non-Basmati long
grain Rice during Kharif 2018
Field team has gathered the information on crop health in 7 studied areas and found that this year
Haryana / Punjab/ Uttar Pradesh/ Uttarakhand basmati crop is in better condition if compared with that
of last year. However, this is too early to say on the overall crop production but initial crop indicators
show lightly better crop prospects over last year.
This year initial round of farmer interaction and various field visits suggests that this year about 55-58
lakh tons of basmati production is expected against 56.5 lakh tons production on last year. The exact
figures of basmati production can be assessed once harvesting and crop cutting experiments will be
taken in our subsequent reports.
State Wise Production
Basmati & Non-Basmati long grain Rice during Kharif 2018 (production in 000 ton)
S. No State Total
Basmati Pusa-1121 PB-1
Pusa-1509
Pusa-1401
Basmati 370
CSR-30
Type-3 &
Others
Non-Notified
Sharbati Sugandha
1 Haryana 2502.1 1582.22 221.6 169.3 267.2 261.7 20.5
2 Punjab 2102.3 1788.69 110.1 202.6 22.2
3 Uttar Pradesh 754.8 386.75 130.0 217.5 20.5 529.5 308.3
4 Uttarakhand 37.8 8.70 6.8 10.3 12.0 53.7 1.9
5 Jammu & Kashmir 134.4 25.24 1.1 108.02 35.9
6 Himachal Pradesh 29.8 7.223 22.5 0.0
Total 5561.2 3798.8 468.6 623.4 267.2 108.0 261.7 32.5 661.8 310.3
However, all the above figures are initial estimations and can be further vetted as and when we move near to
harvesting season

Geotrans Technologies Pvt. Ltd. Page | 8
This year initial reports shows that total basmati acreage has been reduced to 2.46% but with improved yield
levels this year overall loss might be restricted to only about 1.43% as compared to last year
State wise Variety wise
Basmati Acreages (000 ha.) & Production (000 tons) of basmati rice basis initial estimations
Area (in 000 Ha.)
S. No State
2017 2018 2017 2018
Basmati Area Basmati Production
1 Haryana 652.4 633.7 2535.0 2502
2 Punjab 561.7 546.6 2142.2 2102
3 Uttar Pradesh 255.8 250.8 763.2 755
4 Uttarakhand 14.8 14.6 39.0 38
5 Jammu & Kashmir 61.5 62.6 132.2 134
6 Himachal Pradesh 7.0 7.1 29.5 30
Total 1553.2 1515.3 5641.1 5563
PB 1121
In the current season PB 1121 acreage in the 7 states have been reduced by 3.51% over last year.
Farmer preferred high yielding Pusa-1509 in place of low yielding PB-1121. Moreover, PB 1509 also has
shorter time period and early maturity trait if compared with PB 1121. Initial crop health report shows that
PB 1121 is performing good in Haryana and Punjab while some crop damage reported in UP /
Uttarakhand but over this year lesser crop infestation and timely application on remedial action by farmers
on brown plant hopper & White bagged plant hopper reduces the crop losses. This year farmers are
expected to harvest about 35-38 lakh tons of PB 1121 against the 39-40 lakh tons of harvest happened
last year. However, final figures might differ once actual arrival will start coming in the market.
State wise Acreages (000 ha.) & Production (000 tons) of Pusa-basmati 1121 Area (in 000 Ha.)
S. No State 2017 2018 2017 2018
Basmati Area Basmati Production
1 Haryana 444 428.5 1612 1582.2
2 Punjab 500 482.2 1842 1788.7
3 Uttar Pradesh 144 138.0 403 386.8
4 Uttarakhand 4 3.4 9 8.7
5 Jammu & Kashmir 8 8.2 25 25.2
6 Himachal Pradesh 2 1.9 7 7.1
Total 1100.8 1062.2 3898.1 3798.7

Geotrans Technologies Pvt. Ltd. Page | 9
Pusa-1509
This year Pusa-1509 increased by 5.7% over last year. It clearly indicates that farmer replaced PB 1121 with
Pusa -1509 due to lesser price differential between these two prominent varieties. Farmer preferred high
yielding Pusa-1509 in place of low yielding PB-1121. Also, PB-1509 shorter time period and early maturity trait
preferred choice among farmers; PB 1509 crop health is also intact and expected to give slightly better yields in
Haryana, UP & Punjab as compare to last year. Overall PB 1509 yields will be little bit on positive side as
compare to last year, basis the current crop conditions
This year farmers are expected to harvest around 6.0-6.5 lakh tons of PB 1509 which could be around 5.8-6.0
lakh ton last year. However, final figures might differ once actual arrival will start coming in the market.
State wise Acreages (000 ha.) & Production (000 tons) of Pusa-basmati 1509
Area (in 000 Ha.)
S. No State
2017 2018 2017 2018
Basmati Area Basmati Production
1 Haryana 29.9 33.6 147.9 169.3
2 Punjab 39.5 41.1 192.9 202.6
3 Uttar Pradesh 56.0 58.2 206.3 217.5
4 Uttarakhand 2.5 2.6 10.1 10.3
5 Jammu & Kashmir 0.3 0.3 1.1 1.1
6 Himachal Pradesh 5.1 5.2 22.3 22.5
Total 133.2 140.8 580.7 623.4
Pusa basmati – 1
Pusa basmati – 1 is continuously reducing in acreage over years and now is only preferred by farmers who take
it for their self-consumption or places where exporters are demanding to grow for their specific markets. PB -1
still has good market potential in Europe & Saudi Arabia, which is about 1.5-2 lacs ton each.
State wise Acreages (000 ha.) & Production (000 tons) of Pusa-basmati 1 Area (in 000 Ha.)
S. No State 2017 2018 2017 2018
Basmati Area Basmati Production
1 Haryana 41.5 41.2 223.0 221.6
2 Punjab 23.1 23.1 110.2 110.1
3 Uttar Pradesh 42.8 41.8 133.0 130.0
4 Uttarakhand 2.3 2.3 7.6 6.8
Total 109.7 108.3 473.9 468.6
Geotrans Technologies Pvt. Ltd. Page | 10
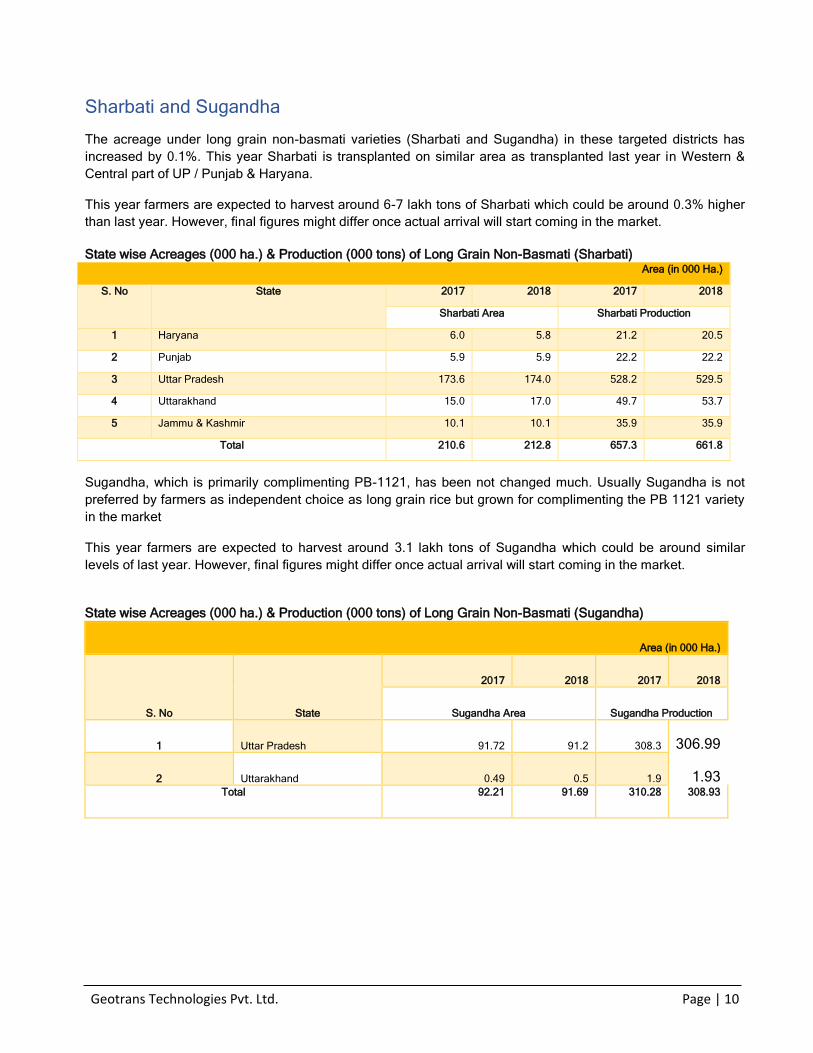
Sharbati and Sugandha
The acreage under long grain non-basmati varieties (Sharbati and Sugandha) in these targeted districts has
increased by 0.1%. This year Sharbati is transplanted on similar area as transplanted last year in Western &
Central part of UP / Punjab & Haryana.
This year farmers are expected to harvest around 6-7 lakh tons of Sharbati which could be around 0.3% higher
than last year. However, final figures might differ once actual arrival will start coming in the market.
State wise Acreages (000 ha.) & Production (000 tons) of Long Grain Non-Basmati (Sharbati)
Area (in 000 Ha.)
S. No State 2017 2018 2017 2018
Sharbati Area Sharbati Production
1 Haryana 6.0 5.8 21.2 20.5
2 Punjab 5.9 5.9 22.2 22.2
3 Uttar Pradesh 173.6 174.0 528.2 529.5
4 Uttarakhand 15.0 17.0 49.7 53.7
5 Jammu & Kashmir 10.1 10.1 35.9 35.9
Total 210.6 212.8 657.3 661.8
Sugandha, which is primarily complimenting PB-1121, has been not changed much. Usually Sugandha is not
preferred by farmers as independent choice as long grain rice but grown for complimenting the PB 1121 variety
in the market
This year farmers are expected to harvest around 3.1 lakh tons of Sugandha which could be around similar
levels of last year. However, final figures might differ once actual arrival will start coming in the market.
State wise Acreages (000 ha.) & Production (000 tons) of Long Grain Non-Basmati (Sugandha)
Area (in 000 Ha.)
S. No State
2017 2018 2017 2018
Sugandha Area Sugandha Production
1 Uttar Pradesh 91.72 91.2 308.3 306.99
2 Uttarakhand 0.49 0.5 1.9 1.93 Total 92.21 91.69 310.28 308.93
Geotrans Technologies Pvt. Ltd. Page | 11
Chapter 2 Project Background
Basmati rice is an important export commodity among the food grains exported from India. During the
past few years, the Basmati export has been growing steadily, from 7.71 lakh metric tonnes in 2003 to an
estimated 4.04 million metric tonnes in 2017-18 on robust demand from the traditional markets in West
Asia. Almost 132 countries have been importing Basmati from India every year. Out of which, Iran, Saudi
Arabia, UAE and Iraq are the major importers. Apart from India second is Pakistan from where Basmati is
exported to many countries. Timely information on the area and likely production of the crop before the
harvest helps exporters and other decision makers involved in Basmati trade to take decisions about the
quantum and time of export. Realizing this potential, the Basmati Export Development Foundation
(BEDF), New Delhi contracted M/s Geotrans Technologies Pvt. Ltd the work of field survey validation
based acreage estimation for Basmati crop and for selected other non-notified varieties along with crop
health monitoring and yield estimation and production for Basmati rice and non-notified varieties and
questionnaire based sample survey of farmers, for 81 districts in the selected seven states i.e. Punjab,
Haryana, Uttar Pradesh, Uttarakhand, Himachal Pradesh, and Jammu & Kashmir apart from Delhi. The
field survey-based approach has been being applied to collect the information at block level to improve
the accuracy further to a desired level. The Basmati varieties for which information is required include
Basmati-370, Basmati- 386, Type-3 (Dehraduni), Taraori, Ranbir, Pusa-1509, Pusa Basmati-1, CSR–30
and Pusa Basmati-1121 and non-notified, non- Basmati (Sharbati, and Permal).

Geotrans Technologies Pvt. Ltd. Page | 12
Basmati Rice export from India (Apr 2017-July 2018)
(Fig in Tons)
Basmati Export (Fig in Tons)
Basmati Export (Fig qty in Tons and value in Rs. crore)
2014-15 2015-16 2016-17 2017-18 2018-19
Months qty value qty value qty value qty value qty value
April 285108 242828 348565 213672 336769 174586 389406 242040 371868 270029
May 337150 290474 431895 251399 412769 215543 406253 268295 373566 275132
June 364636 308190 351894 213011 436780 229824 459334 306447 428300 315887
July 233774 196313 276219 161864 363185 194315 299339 195313 403371 296490
August 217355 182883 270100 154122 225776 122830 286514 180585
Sept 203733 165977 405980 236906 291636 155626 285853 174711
Oct 295146 194556 304647 166454 237108 124029 234077 149492
Nov 298274 210241 301920 158710 275149 140966 254676 165341
Dec 382720 257997 378714 203263 343848 180567 281818 191924
Jan 350320 227594 347789 180645 328677 182550 367761 251777
Feb 379888 235181 287501 153088 339748 196093 343792 244430
March 400195 250633 325944 171450 392731 235253 428076 307369
Total 3748299 2762867 4031168 2264585 3984176 2152182 4036899 2677724 1577105 1157538
0
50
100
150
200
250
300
350
400
450
500
Months April May June July August Sept Oct Nov Dec Jan Feb March
2014-15
2015-16
2016-17
2017-18
2018-19

Geotrans Technologies Pvt. Ltd. Page | 13
Scope of the current report
The present report being the report for Kharif-2018 covers the results of field survey based total rice and
Basmati acreage / production under various varieties in different states.
Study Area Details
The study is confined to 79 districts, which includes 22 districts of Punjab (Amritsar, Barnala, Bathinda,
Faridkot,Fatehgarh,Sahib, Firozpur, Fazilka, Gurdaspur,Pathankot, Hoshiarpur, Jalandhar, Kapurthala,
Ludhiana, Mansa, Moga, Mohali, Muktsar, Nawanshahr, Patiala, Ropar, Sangrur and Tarantaran), 21
districts of Haryana (Ambala, Faridabad, Bhiwani, Fatehabad, Gurgaon, Hissar, Jhajjar, Jind, Kaithal,
Karnal, Kurukshetra, MahendraGarh, Mewat, Palwal, Panchkula, Panipat, Rewari, Rohtak, Sirsa,
Sonepat, Yamunanagar), 3 Districts of Jammu & Kashmir (Jammu, Samba and Kathua), 27 districts of
Uttar Pradesh (Agra, Aligarh, Auraiya, Baghpat, Bareilly, Bijnore, Budaun, Bulandshahr, Etah, Kasganj,
Etawah, Ferozabad, Gautam Buddha Nagar, Ghaziabad, Hapur, Hathras,J. P. Nagar, Kannauj, Mainpuri,
Mathura, Meerut,Moradabad,Sambhal, Muzaffarnagar, Shamli, Pilibhit, Rampur, Saharanpur,
Shahjehanpur), 4 districts of Uttarakhand, 2 district of Himachal Pradesh and one of Delhi.
Districts of Study Area

Geotrans Technologies Pvt. Ltd. Page | 14
Sample size selection & methodology
S.no State Districts
coverage No. of blocks
No. of farmers targeted
Share of Basmati Acreage
1 Haryana 21 93 1350 42%
2 Punjab 22 143 950 36%
3 Uttar Pradesh 27 255 720 19%
4 Uttarakhand 4 27 230 1%
5 Jammu & Kashmir 3 13 50 2%
Total (Incld. Delhi / HP)
79 536 3300 100%
The number of farmer interaction may vary from one state to another based on their availability and
responses. We will update the number of farmers in the above list as and when we cover more area
and blocks
• Four different teams each with four experts have been deputed on field for collecting
information from farmers
• Teams not only interviewed farmers but also clicked pictures of their fields along with same
day newspaper
• Farmers pictures are geo-tagged for reference purpose
• Tele-callers have been deputed to collect the mandi prices & arrival trend so that seasonal
trend can be ascertained.
• Technical team is working on the Agri-dash-boards for quick understanding and analysis.
• Field team will remain on ground till harvest period of basmati. They will post reports on the
crop progress to APEDA regularly in the form of either formal or informal reports so that ARIEA
members can be upraised according.
Geotrans Technologies Pvt. Ltd. Page | 15
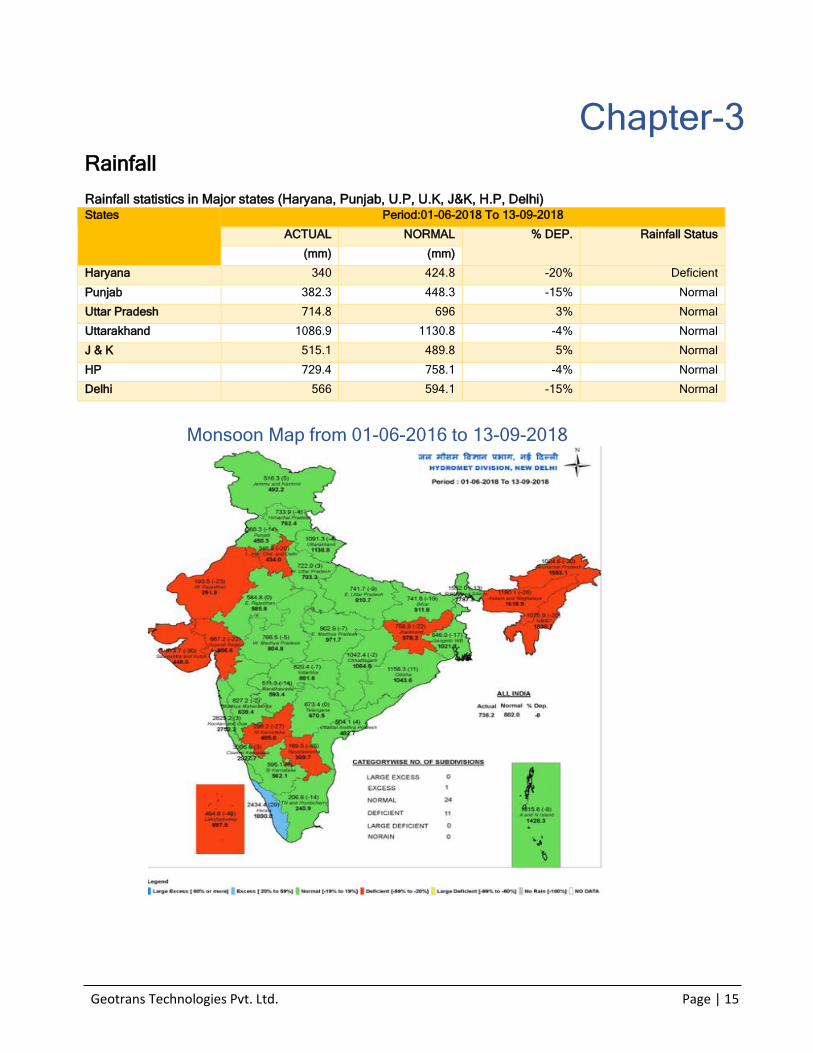
Chapter-3 Rainfall
Rainfall statistics in Major states (Haryana, Punjab, U.P, U.K, J&K, H.P, Delhi) States Period:01-06-2018 To 13-09-2018
ACTUAL NORMAL % DEP. Rainfall Status
(mm) (mm)
Haryana 340 424.8 -20% Deficient
Punjab 382.3 448.3 -15% Normal
Uttar Pradesh 714.8 696 3% Normal
Uttarakhand 1086.9 1130.8 -4% Normal
J & K 515.1 489.8 5% Normal
HP 729.4 758.1 -4% Normal
Delhi 566 594.1 -15% Normal
Monsoon Map from 01-06-2016 to 13-09-2018

Geotrans Technologies Pvt. Ltd. Page | 16
Chapter-4 Ground Survey based Basmati Rice Acreage
HARYANA
In Haryana, the total rice acreage based on field survey has been estimated at 13,28,948 ha in 20
districts. The area under Basmati rice has reduced by 2.9%. Pusa Basmati- 1121 has decreased almost
3.39% over the last year. The area under CSR-30 has also reduced by almost 5,741ha. Under Pusa
Basmati- 1509, almost 3,708 ha area has increases as comparison to last year. The district wise area
figures under Basmati varieties have been given in annexure tables.
PUNJAB
A total of 30.4 lakh ha. area has been transplanted in the state this year. Whereas last year 29.2 lakh ha.
area was transplanted. Basmati has occupied 5.47 lakh ha. and the area under Basmati varieties has
reduced by almost 2.67% in comparison to the last year. After Pusa Basmati-1121, the other variety
transplanted in the major area state under Basmati is Pusa Basmati-1509 (41,087 ha.). Pusa -1121 has
reduced to 482,156 ha. i.e. 3.48% in comparison to last year. Pusa Basmati-1 has almost same acreage
as that of last year. Pusa Basmati-1509 has increased from 39,500 ha. in the year 2017 to 41,087 ha in
2018. This varietal shift is due to price economy prevailed last year. The district wise area figures under
Basmati varieties have been given in annexure tables.
UTTAR PRADESH
In overall districts of Uttar Pradesh rice transplanted on a total 59.7 lakh ha area which is almost similar to
last year. The area under Pusa Basmati- 1121 has been reported 1.38 lakh ha. (a reduction of 4.2%). and
Pusa Basmati-1509 has increased to 58,173 ha. (4.0% increased). Long grain Non- Notified Non-
Basmati variety Sugandha has decreased by 0.6%. The crop health is good. The district wise area figures
under Basmati varieties have been given in annexure tables.
UTTARAKHAND
The state has received a normal rainfall during the months of June, July & August. Pusa Basmati-1509
has increased to 2,583 ha. area in the state in comparison to 2,533 ha. last year. Overall Basmati area in
Uttarakhand has been reduced by 1.5%. The district wise area figures under Basmati varieties have been
given in annexure tables.
Geotrans Technologies Pvt. Ltd. Page | 17
JAMMU & KASHMIR
The rice transplanting in Jammu & Kashmir is estimated 1.14 lakh ha. in three study districts. The major
area in Jammu is under Basmati 370/ Ranbir. In Kathua Pusa Basmati-1121 has increased during the last
3 years. The farmers didn’t preferred Pusa Basmati-1509 in both Jammu and Kathua districts if compared
with other state farmers like Punjab/ Haryana. The district wise area figures under Basmati varieties have
been given in annexure tables.
HIMACHAL PRADESH
About 76,000 ha. area has been transplanted in major Basmati growing district Kangra and Mandi in the
state this year. Out of which, 7,000 ha. is estimated to be under Basmati varieties. The district wise area
figures under Basmati varieties have been given in annexure tables.
DELHI
Almost 1000 ha Basmati area has been transplanted in Delhi. The district wise area figures under
Basmati varieties have been given in annexure tables.
Geotrans Technologies Pvt. Ltd. Page | 18
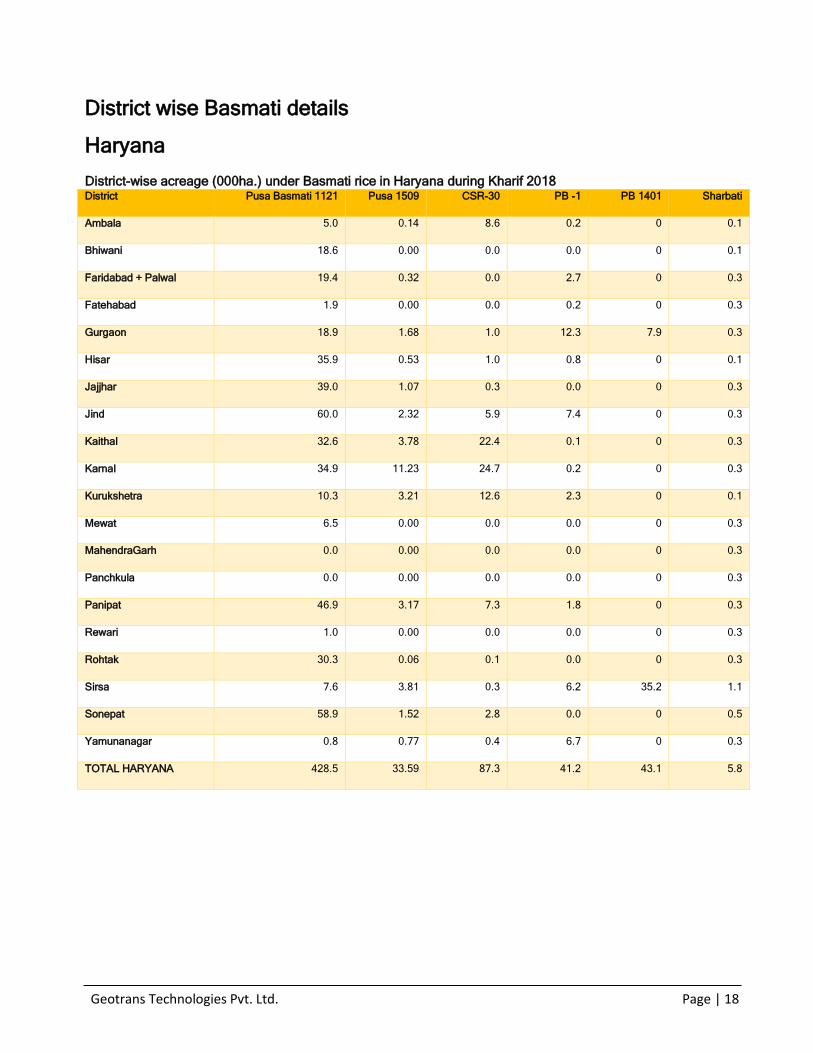
District wise Basmati details
Haryana
District-wise acreage (000ha.) under Basmati rice in Haryana during Kharif 2018 District Pusa Basmati 1121 Pusa 1509 CSR-30 PB -1 PB 1401 Sharbati
Ambala 5.0 0.14 8.6 0.2 0 0.1
Bhiwani 18.6 0.00 0.0 0.0 0 0.1
Faridabad + Palwal 19.4 0.32 0.0 2.7 0 0.3
Fatehabad 1.9 0.00 0.0 0.2 0 0.3
Gurgaon 18.9 1.68 1.0 12.3 7.9 0.3
Hisar 35.9 0.53 1.0 0.8 0 0.1
Jajjhar 39.0 1.07 0.3 0.0 0 0.3
Jind 60.0 2.32 5.9 7.4 0 0.3
Kaithal 32.6 3.78 22.4 0.1 0 0.3
Karnal 34.9 11.23 24.7 0.2 0 0.3
Kurukshetra 10.3 3.21 12.6 2.3 0 0.1
Mewat 6.5 0.00 0.0 0.0 0 0.3
MahendraGarh 0.0 0.00 0.0 0.0 0 0.3
Panchkula 0.0 0.00 0.0 0.0 0 0.3
Panipat 46.9 3.17 7.3 1.8 0 0.3
Rewari 1.0 0.00 0.0 0.0 0 0.3
Rohtak 30.3 0.06 0.1 0.0 0 0.3
Sirsa 7.6 3.81 0.3 6.2 35.2 1.1
Sonepat 58.9 1.52 2.8 0.0 0 0.5
Yamunanagar 0.8 0.77 0.4 6.7 0 0.3
TOTAL HARYANA 428.5 33.59 87.3 41.2 43.1 5.8
Geotrans Technologies Pvt. Ltd. Page | 19
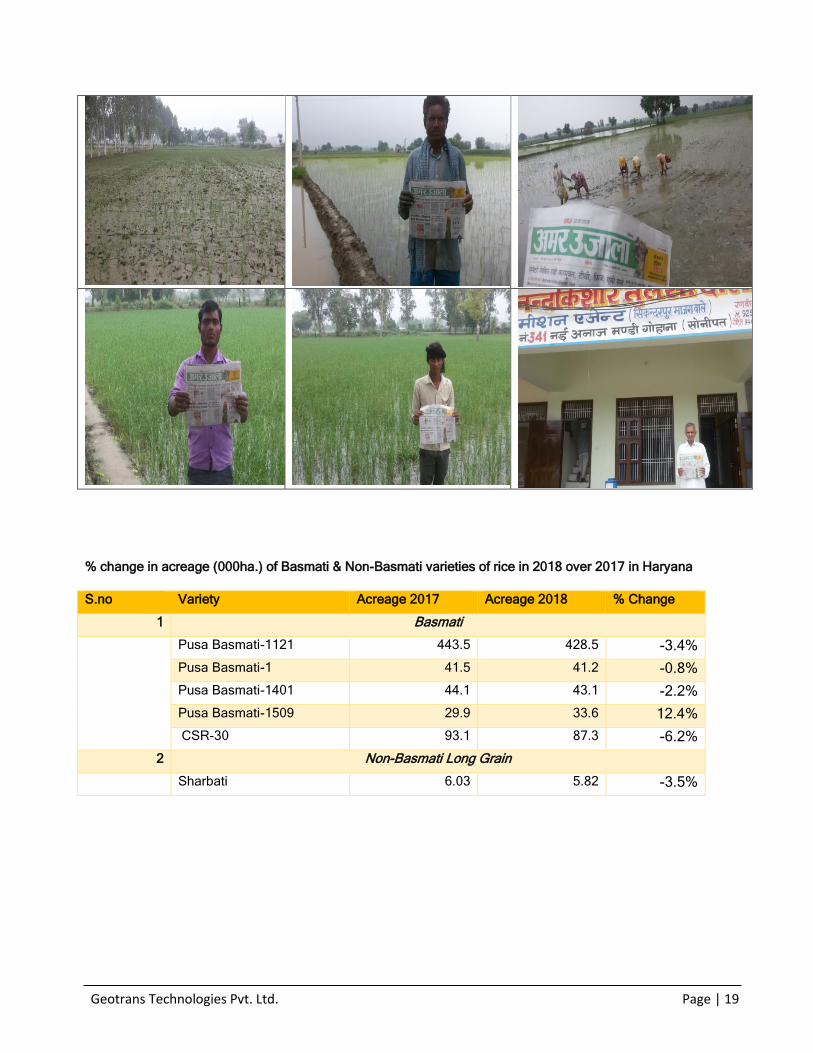
% change in acreage (000ha.) of Basmati & Non-Basmati varieties of rice in 2018 over 2017 in Haryana
S.no Variety Acreage 2017 Acreage 2018 % Change
1 Basmati
Pusa Basmati-1121 443.5 428.5 -3.4%
Pusa Basmati-1 41.5 41.2 -0.8%
Pusa Basmati-1401 44.1 43.1 -2.2%
Pusa Basmati-1509 29.9 33.6 12.4%
CSR-30 93.1 87.3 -6.2%
2 Non-Basmati Long Grain
Sharbati 6.03 5.82 -3.5%

Geotrans Technologies Pvt. Ltd. Page | 20
Punjab
District-wise acreage (000ha.) Under Basmati rice in Punjab during Kharif 2018
District Pusa Basmati 1121 Pusa 1509 Bas-386 PB -1
Amritsar 72.3 32.6 0.4
Barnala 1.8 0.0 0.5
Bhatinda 9.1 0.0
Faridkot 19.7 0.0
Fatehgarh Sahib 7.7 0.0 1.9
Fazilka 66.1 0.0
Firozepur 36.2 0.0
Gurdaspur 41.1 0.1
Pathankot 2.7 0.0
Hoshiarpur 5.9 0.0
Jalandhar 9.7 0.8
Kapurthala 7.7 0.0
Ludhiana 17.4 2.2 3.2
Mansa 0.9 0.0
Moga 17.0 0.0 0.1
Mohali 3.9 0.0
Muktsar 42.4 0.0 8.3
Nawanshahr 4.6 0.2
Patiala 15.8 1.4 2.6
Rupnagar 2.9 0.0
Sangrur 25.4 0.0 6.4
Tarantaran 71.8 3.8
Total 482.2 41.1 0.4 23.0

Geotrans Technologies Pvt. Ltd. Page | 21
% change in acreage (000ha.) of Basmati & Non-Basmati varieties of rice in 2018 over 2017 in Punjab
S.no Variety Acreage 2017 Acreage 2018 % Change
1 Basmati
Pusa Basmati-1121 499.5 482.2 -3.5%
Pusa Basmati-1 41.5 23.0 -0.8%
Pusa Basmati-1509 39.5 41.1 4.0%
Bas-386 0.4 0.4 0.0%
Non-Basmati Long Grain
2 Sharbati 6.0 5.8 -3.5%

Geotrans Technologies Pvt. Ltd. Page | 22
Uttar Pradesh
District-wise acreage (000ha.) under Basmati rice in U.P during Kharif 2018
District Type-3 &
Others Pusa Basmati-
1121 Pusa Basmati-
1509 Pusa Basmati- 1 &
6 Sharbati Sugandha
Agra 0.31 0.48 0.07 2.18
Aligarh 14.04 5.16 4.33 2.48 9.06
Auraiya 0.7 1.01 0.16 0.05 1.75 0.19
Baghpat 0.0 1.83 0.54 1.17 0.24 0.85
Bareilly 0.7 1.16 0.63 0.43 46.38 0.49
Bijnore 0.0 1.44 2.38 3.18 18.07 1.34
Budaun 9.3 1.88 2.07 0.74 20.75 1.97
Bulandshahr 0.0 19.31 4.70 5.73 4.48 14.78
Etah+Kasganj 0.0 4.71 3.14 0.48 0.88 7.41
Farukhabad 0.0 1.69 0.85 0.06 0.14 2.39
Firozabad 0.0 2.18 1.31 0.24 0.12 5.32
Etawah 0.0 5.99 2.57 0.16 0.06 4.59
Gautam Buddha Nagar 0.0 17.11 0.78 1.76 1.38 0.85
Ghaziabad+Hapur 0.0 4.66 3.24 1.40 3.48 4.87
Hathras 0.0 3.79 2.41 0.79 0.70 5.90
Mathura 0.0 22.48 3.43 1.04 0.28 3.42
Mainpuri 0.0 13.86 2.61 0.20 0.18 5.97
Meerut 0.0 2.05 2.84 2.32 0.63 3.19
Moradabad 0.0 1.07 2.26 0.30 9.30 2.38
J. P. Nagar 0.0 1.16 2.00 0.96 7.23 2.76
Kannauj 0.0 0.62 1.41 0.16 0.14 1.42
Muzaffarnagar+Shamli 0.1 4.14 2.54 3.88 1.26 1.99
Pilibhit 0.0 0.81 3.41 0.16 5.41 0.38
Rampur 0.0 0.61 1.29 0.14 23.97 0.19
Saharanpur 0.2 6.49 3.39 11.41 7.46 2.88
Shahjehanpur 1.7 1.32 0.83 0.27 8.69 0.43
Sambhal 0.0 1.42 1.74 0.39 8.53 4.39
Total 12.7 137.12 58.17 41.82 173.97 91.59
Geotrans Technologies Pvt. Ltd. Page | 23
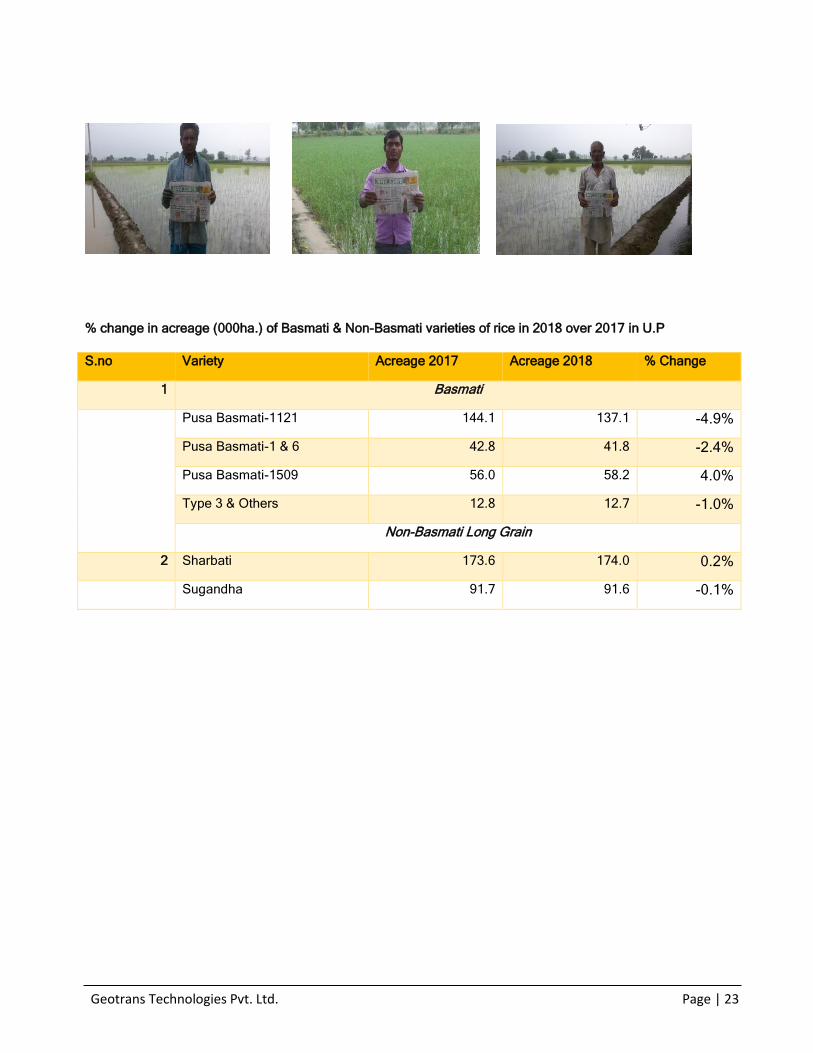
% change in acreage (000ha.) of Basmati & Non-Basmati varieties of rice in 2018 over 2017 in U.P
S.no Variety Acreage 2017 Acreage 2018 % Change
1 Basmati
Pusa Basmati-1121 144.1 137.1 -4.9%
Pusa Basmati-1 & 6 42.8 41.8 -2.4%
Pusa Basmati-1509 56.0 58.2 4.0%
Type 3 & Others 12.8 12.7 -1.0%
Non-Basmati Long Grain
2 Sharbati 173.6 174.0 0.2%
Sugandha 91.7 91.6 -0.1%
Geotrans Technologies Pvt. Ltd. Page | 24
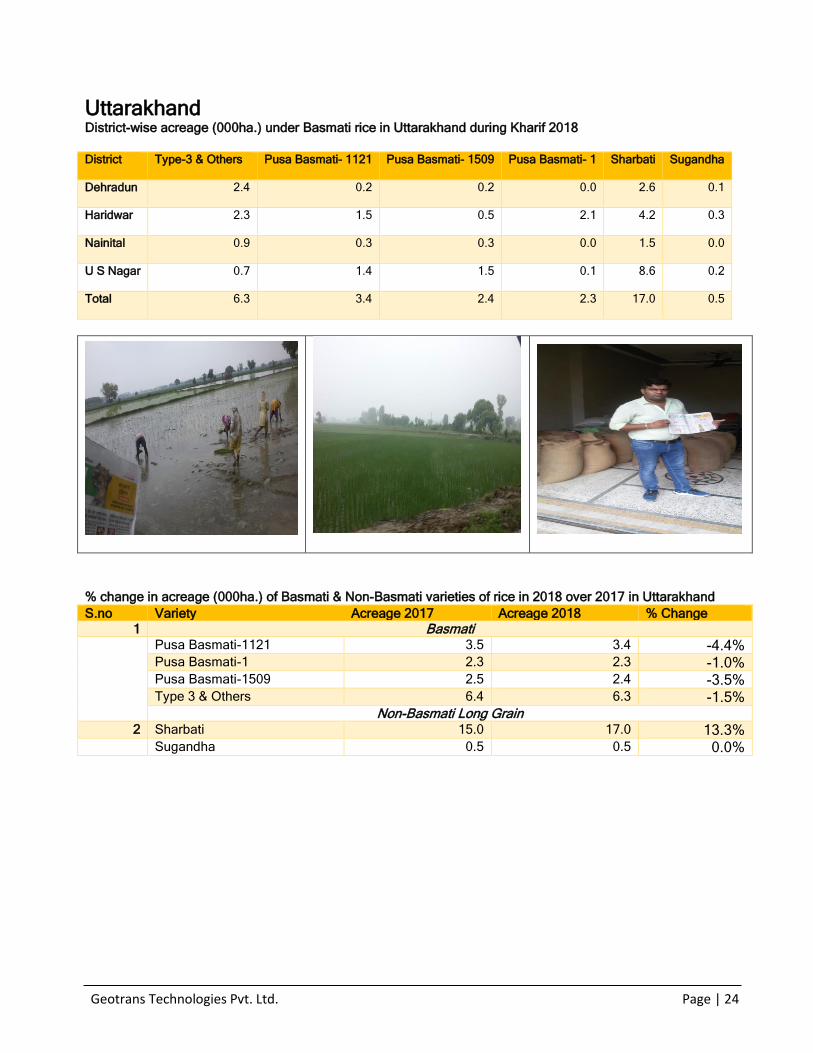
Uttarakhand District-wise acreage (000ha.) under Basmati rice in Uttarakhand during Kharif 2018
District Type-3 & Others Pusa Basmati- 1121 Pusa Basmati- 1509 Pusa Basmati- 1 Sharbati Sugandha
Dehradun 2.4 0.2 0.2 0.0 2.6 0.1
Haridwar 2.3 1.5 0.5 2.1 4.2 0.3
Nainital 0.9 0.3 0.3 0.0 1.5 0.0
U S Nagar 0.7 1.4 1.5 0.1 8.6 0.2
Total 6.3 3.4 2.4 2.3 17.0 0.5
% change in acreage (000ha.) of Basmati & Non-Basmati varieties of rice in 2018 over 2017 in Uttarakhand
S.no Variety Acreage 2017 Acreage 2018 % Change
1 Basmati Pusa Basmati-1121 3.5 3.4 -4.4%
Pusa Basmati-1 2.3 2.3 -1.0% Pusa Basmati-1509 2.5 2.4 -3.5% Type 3 & Others 6.4 6.3 -1.5%
Non-Basmati Long Grain 2 Sharbati 15.0 17.0 13.3%
Sugandha 0.5 0.5 0.0%
Geotrans Technologies Pvt. Ltd. Page | 25
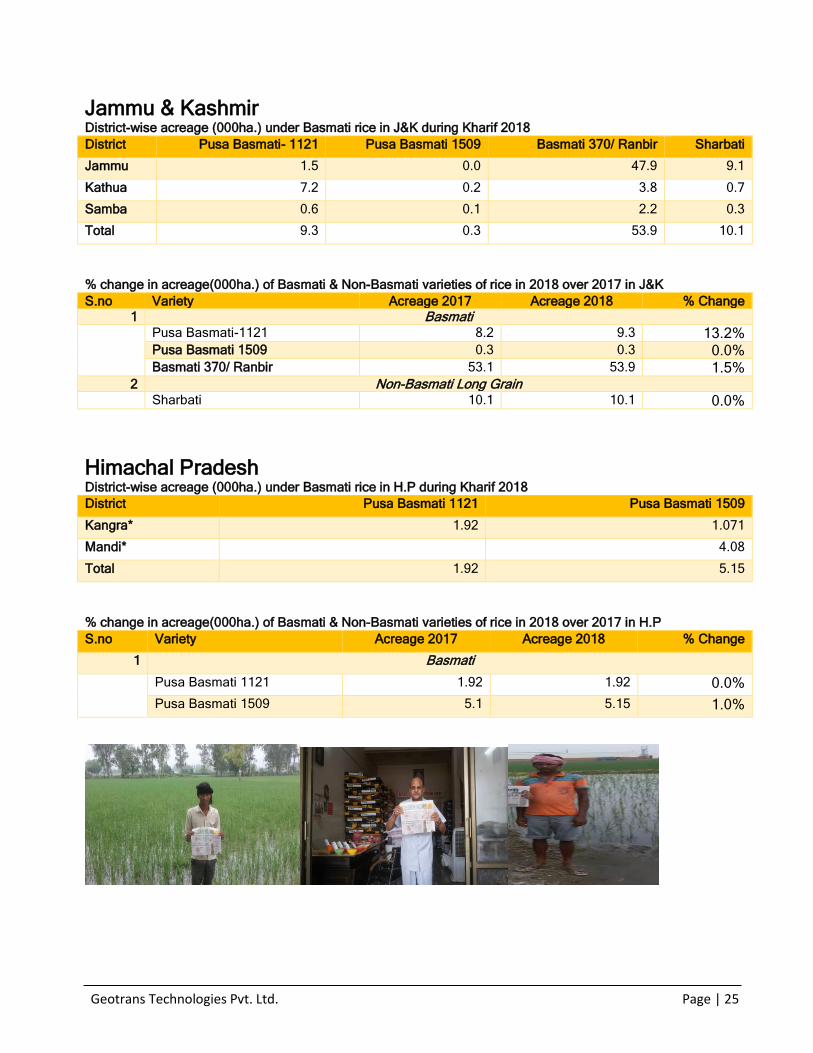
Jammu & Kashmir District-wise acreage (000ha.) under Basmati rice in J&K during Kharif 2018
District Pusa Basmati- 1121 Pusa Basmati 1509 Basmati 370/ Ranbir Sharbati
Jammu 1.5 0.0 47.9 9.1
Kathua 7.2 0.2 3.8 0.7
Samba 0.6 0.1 2.2 0.3
Total 9.3 0.3 53.9 10.1
% change in acreage(000ha.) of Basmati & Non-Basmati varieties of rice in 2018 over 2017 in J&K
S.no Variety Acreage 2017 Acreage 2018 % Change
1 Basmati Pusa Basmati-1121 8.2 9.3 13.2%
Pusa Basmati 1509 0.3 0.3 0.0% Basmati 370/ Ranbir 53.1 53.9 1.5%
2 Non-Basmati Long Grain Sharbati 10.1 10.1 0.0%
Himachal Pradesh District-wise acreage (000ha.) under Basmati rice in H.P during Kharif 2018
District Pusa Basmati 1121 Pusa Basmati 1509
Kangra* 1.92 1.071
Mandi* 4.08
Total 1.92 5.15
% change in acreage(000ha.) of Basmati & Non-Basmati varieties of rice in 2018 over 2017 in H.P
S.no Variety Acreage 2017 Acreage 2018 % Change
1 Basmati
Pusa Basmati 1121 1.92 1.92 0.0%
Pusa Basmati 1509 5.1 5.15 1.0%

Geotrans Technologies Pvt. Ltd. Page | 26
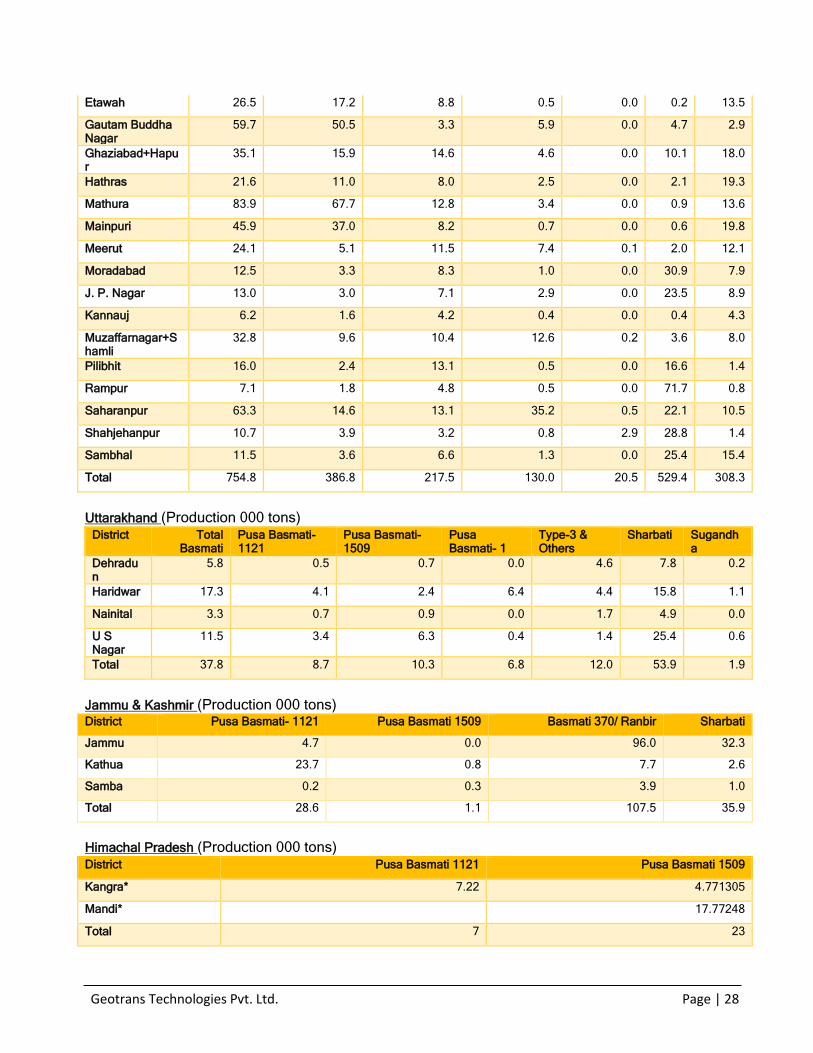
Chapter-5 District wise Production Details
Basmati & Long Grain Non- Notified Non-Basmati
(Production in 000 tons)
All the below stated figures are based on the initial feedback received from farmers and crop health conditions.
All the below figures are derived on the statistical model using sampling techniques. Such figures will quickly
give an idea on the overall district level and block-level detailing on acreage &tentative production, which might
differ from actual figures. As and when we progress in the season, we will do corrections if we observe
something different from our currently reported figures.
Haryana (Production 000 tons) District Total
Basmati Pusa Basmati 1121
Pusa 1509
CSR-30 PB -1 PB 1401 Sharbati
Ambala 35.1 14.0 0.6 19.4 1.1 0.0 0.4
Bhiwani 59.5 59.5 0.0 0.0 0.0 0.0 0.3
Faridabad + Palwal
70.0 56.7 1.3 0.0 12.0 0.0 1.1
Fatehabad 6.5 5.7 0.0 0.0 0.7 0.0 0.9
Gurgaon 224.7 76.7 9.1 2.9 82.5 53.5 1.1
Hisar 153.3 143.4 3.1 2.8 4.1 0.0 0.2
Jajjhar 134.7 129.6 4.5 0.6 0.0 0.0 0.9
Jind 345.5 283.3 10.6 17.3 34.2 0.0 0.9
Kaithal 208.2 122.3 19.6 65.7 0.5 0.0 0.9
Karnal 276.8 145.2 56.4 74.3 1.0 0.0 0.8
Kurukshetra 108.0 40.8 15.9 39.2 12.1 0.0 0.4
Mewat 22.6 22.6 0.0 0.0 0.0 0.0 1.0
MahendraGarh 0.0 0.0 0.0 0.0 0.0 0.0 0.9
Panchkula 0.0 0.0 0.0 0.0 0.0 0.0 0.9
Panipat 196.8 145.7 15.5 28.3 7.2 0.0 1.2
Rewari 3.9 3.9 0.0 0.0 0.0 0.0 1.0
Rohtak 104.8 104.6 0.0 0.1 0.0 0.0 0.9
Sirsa 305.5 37.4 22.3 0.8 31.3 213.7 4.3
Sonepat 203.0 187.5 6.4 9.1 0.0 0.0 1.6
Yamunanagar 43.3 3.3 4.0 1.2 34.8 0.0 0.9
TOTAL HARYANA
2502.1 1582.2 169.3 261.7 221.6 267.2 20.3

Geotrans Technologies Pvt. Ltd. Page | 27
Punjab (Production 000 tons)
District Total Basmati Pusa Basmati 1121 Pusa 1509 Bas-386 PB -1
Amritsar 434.0 270.7 162.3 0.9 0.0
Barnala 9.6 7.2 0.0 0.0 2.4
Bhatinda 30.9 30.9 0.0 0.0 0.0
Faridkot 80.8 80.8 0.0 0.0 0.0
Fatehgarh Sahib 40.0 30.8 0.0 0.0 9.2
Fazilka 265.1 265.1 0.0 0.0 0.0
Firozepur 131.2 131.2 0.0 0.0 0.0
Gurdaspur 150.8 150.3 0.5 0.0 0.0
Pathankot 7.7 7.7 0.0 0.0 0.0
Hoshiarpur 22.5 22.5 0.0 0.0 0.0
Jalandhar 36.9 36.6 0.4 0.0 0.0
Kapurthala 27.6 27.6 0.0 0.0 0.0
Ludhiana 90.8 65.0 11.5 0.0 14.3
Mansa 3.3 3.3 0.0 0.0 0.0
Moga 43.4 42.9 0.0 0.0 0.6
Mohali 12.0 12.0 0.0 0.0 0.0
Muktsar 191.4 151.5 0.0 0.0 39.9
Nawanshahar 17.5 16.4 1.1 0.0 0.0
Patiala 82.2 62.6 6.9 0.0 12.6
Rupnagar 9.9 9.8 0.1 0.0 0.0
Sangrur 128.2 97.1 0.0 0.0 31.1
Tarantaran 286.7 266.9 19.8 0.0 0.0
Total 2102.3 1788.7 202.6 0.9 110.1
Uttar Pradesh (Production 000 tons)
District Total Basmati
Pusa Basmati- 1121
Pusa Basmati- 1509
Pusa Basmati- 1 & 6
Type-3 & Others
Sharbati
Sugandha
Agra 2.9 0.8 1.8 0.2 0.0 6.4
Aligarh 76.4 42.6 21.9 11.9 0.0 8.4 28.0
Auraiya 4.3 2.5 0.5 0.2 1.1 4.8 0.6
Baghpat 10.7 5.2 2.1 3.4 0.0 0.8 2.3
Bareilly 7.8 3.1 2.2 1.2 1.3 135.2 1.6
Bijnore 20.9 3.4 8.3 9.2 0.0 56.0 4.8
Budaun 27.3 4.8 6.1 2.2 14.3 62.0 6.8
Bulandshahr 92.8 54.6 19.0 19.1 0.0 15.3 52.3
Etah+Kasganj 23.1 11.5 10.1 1.5 0.0 2.5 23.5
Farukhabad 7.1 4.4 2.5 0.2 0.0 0.4 6.9
Firozabad 11.4 5.8 4.9 0.7 0.0 0.3 17.2
Geotrans Technologies Pvt. Ltd. Page | 28
Etawah 26.5 17.2 8.8 0.5 0.0 0.2 13.5
Gautam Buddha Nagar
59.7 50.5 3.3 5.9 0.0 4.7 2.9
Ghaziabad+Hapur
35.1 15.9 14.6 4.6 0.0 10.1 18.0
Hathras 21.6 11.0 8.0 2.5 0.0 2.1 19.3
Mathura 83.9 67.7 12.8 3.4 0.0 0.9 13.6
Mainpuri 45.9 37.0 8.2 0.7 0.0 0.6 19.8
Meerut 24.1 5.1 11.5 7.4 0.1 2.0 12.1
Moradabad 12.5 3.3 8.3 1.0 0.0 30.9 7.9
J. P. Nagar 13.0 3.0 7.1 2.9 0.0 23.5 8.9
Kannauj 6.2 1.6 4.2 0.4 0.0 0.4 4.3
Muzaffarnagar+Shamli
32.8 9.6 10.4 12.6 0.2 3.6 8.0
Pilibhit 16.0 2.4 13.1 0.5 0.0 16.6 1.4
Rampur 7.1 1.8 4.8 0.5 0.0 71.7 0.8
Saharanpur 63.3 14.6 13.1 35.2 0.5 22.1 10.5
Shahjehanpur 10.7 3.9 3.2 0.8 2.9 28.8 1.4
Sambhal 11.5 3.6 6.6 1.3 0.0 25.4 15.4
Total 754.8 386.8 217.5 130.0 20.5 529.4 308.3
Uttarakhand (Production 000 tons) District Total
Basmati Pusa Basmati- 1121
Pusa Basmati- 1509
Pusa Basmati- 1
Type-3 & Others
Sharbati Sugandha
Dehradun
5.8 0.5 0.7 0.0 4.6 7.8 0.2
Haridwar 17.3 4.1 2.4 6.4 4.4 15.8 1.1
Nainital 3.3 0.7 0.9 0.0 1.7 4.9 0.0
U S Nagar
11.5 3.4 6.3 0.4 1.4 25.4 0.6
Total 37.8 8.7 10.3 6.8 12.0 53.9 1.9
Jammu & Kashmir (Production 000 tons) District Pusa Basmati- 1121 Pusa Basmati 1509 Basmati 370/ Ranbir Sharbati
Jammu 4.7 0.0 96.0 32.3
Kathua 23.7 0.8 7.7 2.6
Samba 0.2 0.3 3.9 1.0
Total 28.6 1.1 107.5 35.9
Himachal Pradesh (Production 000 tons) District Pusa Basmati 1121 Pusa Basmati 1509
Kangra* 7.22 4.771305
Mandi* 17.77248
Total 7 23

Geotrans Technologies Pvt. Ltd. Page | 29
Chapter-6 Rainfall ( District wise rainfall data)
The Basmati growing belt has witnessed normal to deficient rainfall. Punjab, Uttarakhand, U.P, H.P. &
Delhi has witnessed normal rainfall while Haryana has witnessed deficient rainfall this year. The rainfall
during 1-06-2018 to 12 -09-2018in meteorological divisions under study area is given in below table and
the rainfall in prominent districts (Haryana, Punjab, U.P, U.K, J & K, H.P, Delhi)
Haryana/Districts Period:01-06-2018 To12-09-2018
ACTUAL (mm)
NORMAL (mm)
% DEP. Rainfall Status
AMBALA 566.8 822.0 -31% Deficient
BHIWANI 213.4 325.0 -34% Deficient
FARIDABAD 491.3 555.5 -12% Normal
FATEHABAD 125.7 258.0 -51% Deficient GURGAON 339.0 445.3 -24% Deficient HISAR 161.4 298.7 -46% Deficient JHAJJAR 382.3 393.4 -3% Normal
JIND 280.3 375.8 -25% Deficient
KAITHAL 301.8 350.0 -14% Normal
KARNAL 662.8 528.2 25% Excess
KURUKSHETRA 528.3 515.2 3% Normal MAHENDRAGARH 357.1 376.2 -5% Normal MEWAT 477.7 466.9 2% Normal PALWAL 345.9 404.8 -15% Normal PANCHKULA 431.1 874.2 -51% Deficient PANIPAT 309.7 481.9 -36% Deficient REWARI 429.2 410.9 4% Normal
ROHTAK 249.8 483.9 -48% Deficient
SIRSA 178.7 221.0 -19% Normal
SONIPAT 291.8 499.4 -42% Deficient
YAMUNANAGAR 826.5 832.9 -1% Normal
TOTAL HARYANA 340.0 424.8 -20% Deficient
Punjab/Districts Period:01-06-2018 To12-09-2018
ACTUAL (mm)
NORMAL (mm)
% DEP. Rainfall Status
AMRITSAR 261.0 497.0 -47% Deficient BARNALA 394.5 314.7 25% Excess
BATHINDA 156.9 286.8 -45% Deficient FARIDKOT 288.3 300.0 -4% Normal FATEHGARH SAHIB 393.6 487.6 -19% Normal FIROZPUR 76.7 323.8 -76% Large Deficient GURDASPUR 883.1 768.5 15% Normal HOSHIARPUR 552.7 654.6 -16% Normal JALANDHAR 347.6 504.3 -39% Deficient KAPURTHALA 281.6 380.9 -31% Deficient LUDHIANA 468.6 483.8 -26% Normal
MANSA 108.0 296.5 -64% Large Deficient MOGA 233.3 327.3 -29% Deficient MUKTSAR 205.8 292.7 -30% Deficient NAWASHAHR 823.6 715.6 15% Normal

Geotrans Technologies Pvt. Ltd. Page | 30
Punjab/Districts Period:01-06-2018 To12-09-2018
PATIALA 534.1 554.0 -4% Normal RUPNAGAR 968.3 670.4 44% Excess
SANGRUR 344.9 394.6 -13% Normal SAS NAGAR 606.9 590.3 3% Normal TARN TARAN 267.5 310.7 -14% Normal
Punjab Total 382.3 448.3 -15% Normal
Uttar Pradesh/District Period:01-06-2018 To12-09-2018
ACTUAL (mm)
NORMAL (mm)
% DEP. Rainfall Status
Agra 709.8 624.1 14% Normal
Aligarh 576.2 586.2 -2% Normal
Auraiya 539.3 630.7 -14% Normal
Baghpat 594.6 688.8 -14% Normal
Bareilly 670.0 497.5 35% Excess
Bijnore 1137.5 776.5 46% Excess
Budaun 958.0 834.6 15% Normal
Bulandshahr 404.4 596.9 -32% Deficient
Etah 840.3 555.9 51% Excess
Farukhabad 656.3 659.9 -1% Normal
Firozabad 739.3 595.4 24% Excess
Etawah 543.0 495.8 10% Normal
Gautam Buddha Nagar 337.0 574.3 -41% Deficient
Ghaziabad+Hapur 799.1 720.5 11% Normal
Mathura 590.5 695.7 -15% Normal
Mainpuri 765.4 754.3 1% Normal
Meerut 535.5 700.8 -24% Deficient
Moradabad 863.9 629.4 37% Excess
J.P.Nagar 827.0 861.6 -4% Normal
Kannauj 683.5 558.0 22% Excess
Muzaffarnagar+Shamli 335.6 705.4 -52% Deficient
Pilibhit 704.9 587.2 20% Excess
Rampur 778.7 527.9 47% Excess
Saharanpur 621.8 705.2 -12% Normal
Shahjehanpur 917.9 778.4 18% Normal
UP Total 714.8 696.0 3% Normal
Uttarakhand/District Period:01-06-2018 To12-09-2018
ACTUAL (mm)
NORMAL (mm)
% DEP. Rainfall Status
ALMORA 486.8 776.1 -37% Deficient
BAGESHWAR 1421.3 776.1 83% Large Deficient
CHAMOLI 1130.2 800.8 41% Excess
CHAMPAWAT 1241.1 1210.1 3% Normal
DEHRADUN 1594.6 1684.4 -5% Normal
HARIDWAR 1100.0 892.4 23% Excess
NANITAL 1413.7 1304.8 8% Normal
PAURI GARHWAL 705.1 1124.7 -37% Deficient
PITHORAGARH 1461.5 1558.9 -6% Normal
RUDRAPRAYAG 1272.9 1574.9 -19% Normal
TEHRI GARWAL 650.8 970.4 -33% Deficient

Geotrans Technologies Pvt. Ltd. Page | 31
UDHAM SINGH NAGAR 709.4 1011.3 -30% Deficient
UTTARKASHI 978.9 1036.8 -6% Deficient
Uttarakhand Total 1086.9 1130.8 -4% Normal
J & K/District Period:01-06-2018 To12-09-2018
ACTUAL (mm)
NORMAL (mm)
% DEP. Rainfall Status
Jammu 1136.0 809.2 40% Excess
Kathua 1024.8 920.0 11% Normal
Samba 746.9 809.2 -8% Normal J & K Total 515.1 489.8 5% Normal
HP/District Period:01-06-2018 To12-09-2018
ACTUAL (mm)
NORMAL (mm)
% DEP. Rainfall Status
BILASPUR 969.1 800.9 21% Excess
CHAMBA 637.3 1306.9 -51% Deficient
HAMIRPUR 1128.7 1001.0 13% Normal
KANGRA 1811.3 1483.3 22% Excess
KINNAUR 111.6 223.0 -50% Deficient
KULLU 562.8 476.1 18% Normal
Mandi 157.8 401.1 -61% Large Deficient
Simla 1175.9 1024.6 15% Normal
Sirmaur 664.6 579.5 15% Normal
Solan 1139.9 1240.4 -8% Normal
Una 882.6 917.6 -4% Normal
HP Total 729.4 758.1 -4% Normal
Delhi/District Period:01-06-2018 To12-09-2018
ACTUAL (mm)
NORMAL (mm)
% DEP. Rainfall Status
CENTRAL DELHI 472.0 594.1 -21% Deficient
NEW DELHI 450.2 594.1 -24% Deficient
NORTH DELHI 589.8 594.1 -1% Normal
NORTH EAST DELHI 741.1 594.1 25% Excess
NORTH WEST DELHI 474.5 594.1 -20% Deficient
SOUTH DELHI 472.8 594.1 -20% Deficient
SOUTH WEST DELHI 532.0 594.1 -10% Normal
WEST DELHI 667.7 594.1 12% Normal
Delhi Total 566.0 594.1 -5% Normal

Geotrans Technologies Pvt. Ltd. Page | 32
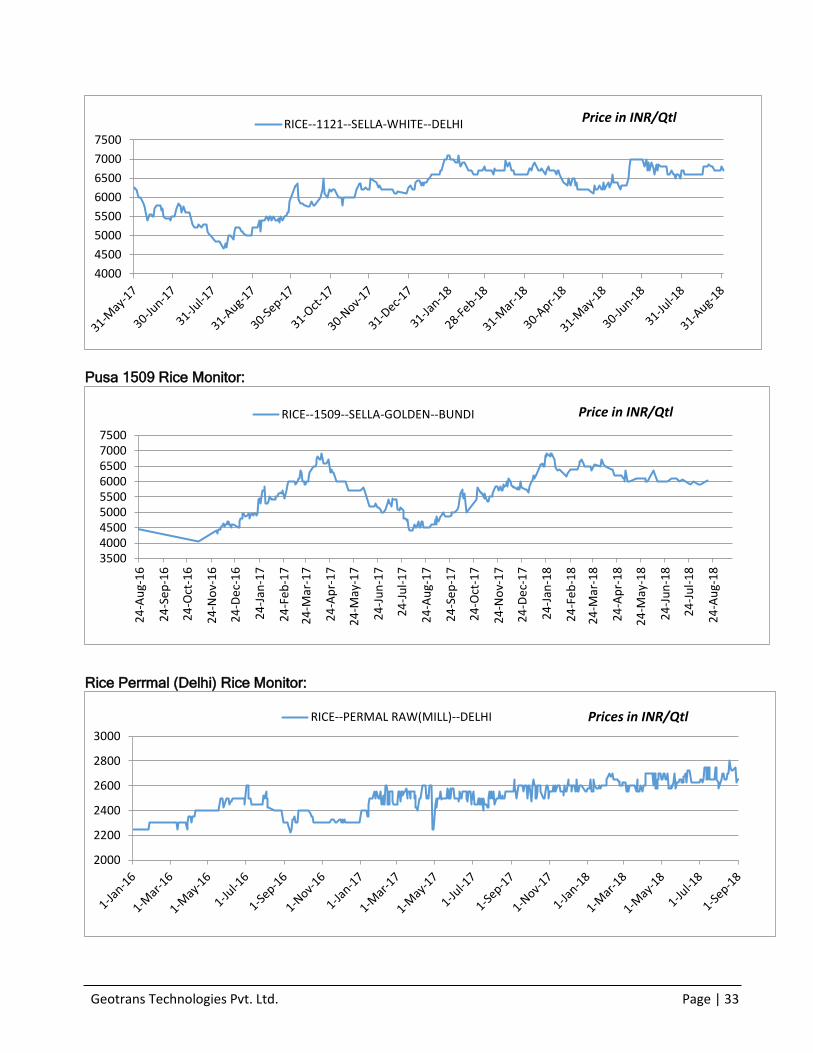
Chapter-7 Price Monitor
Pusa 1121 Rice Monitor:
450050005500600065007000750080008500
Prices in INR/Qtl1121--SELLA-GOLDEN--Delhi
4500
5000
5500
6000
6500
7000
7500Prices in INR/QtlRICE--1121--SELLA-WHITE--BUNDI
Geotrans Technologies Pvt. Ltd. Page | 33
Pusa 1509 Rice Monitor:
Rice Perrmal (Delhi) Rice Monitor:
4000
4500
5000
5500
6000
6500
7000
7500
Price in INR/QtlRICE--1121--SELLA-WHITE--DELHI
350040004500500055006000650070007500
24
-Au
g-1
6
24
-Se
p-1
6
24
-Oct
-16
24
-No
v-1
6
24
-De
c-1
6
24
-Jan
-17
24
-Fe
b-1
7
24
-Mar
-17
24
-Ap
r-1
7
24
-May
-17
24
-Ju
n-1
7
24
-Ju
l-1
7
24
-Au
g-1
7
24
-Se
p-1
7
24
-Oct
-17
24
-No
v-1
7
24
-De
c-1
7
24
-Jan
-18
24
-Fe
b-1
8
24
-Mar
-18
24
-Ap
r-1
8
24
-May
-18
24
-Ju
n-1
8
24
-Ju
l-1
8
24
-Au
g-1
8
Price in INR/QtlRICE--1509--SELLA-GOLDEN--BUNDI
2000
2200
2400
2600
2800
3000
Prices in INR/QtlRICE--PERMAL RAW(MILL)--DELHI
Geotrans Technologies Pvt. Ltd. Page | 34
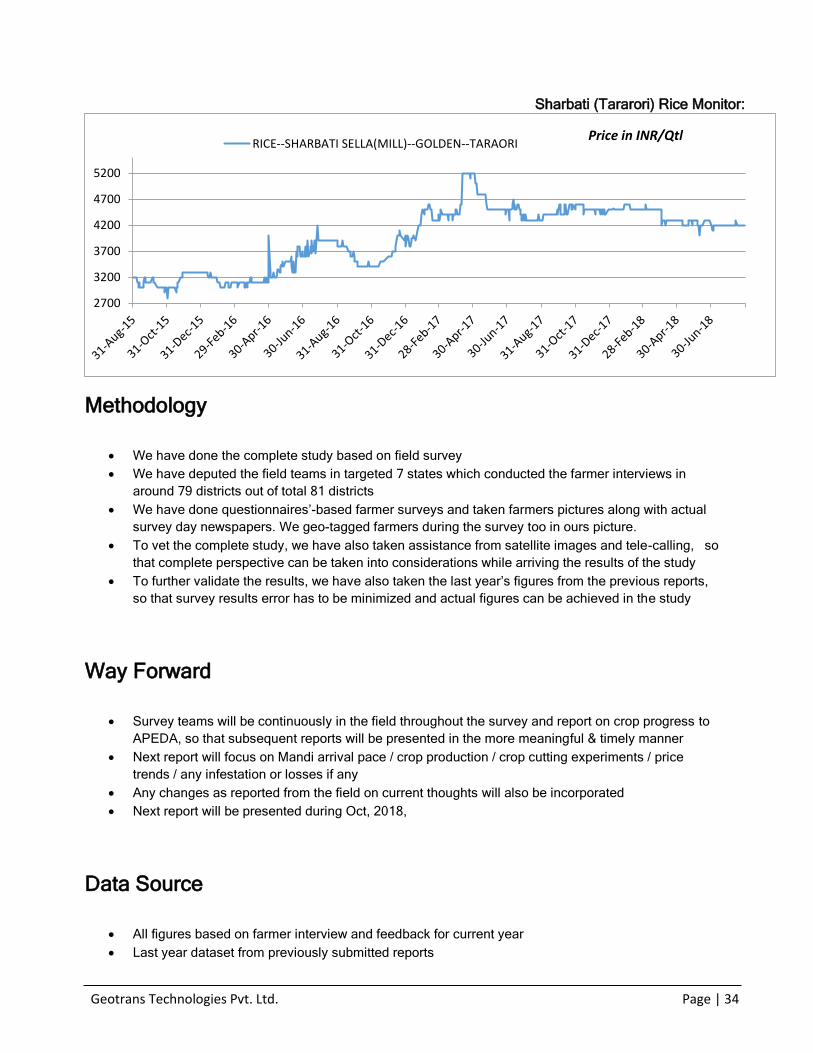
Sharbati (Tararori) Rice Monitor:
Methodology
• We have done the complete study based on field survey
• We have deputed the field teams in targeted 7 states which conducted the farmer interviews in
around 79 districts out of total 81 districts
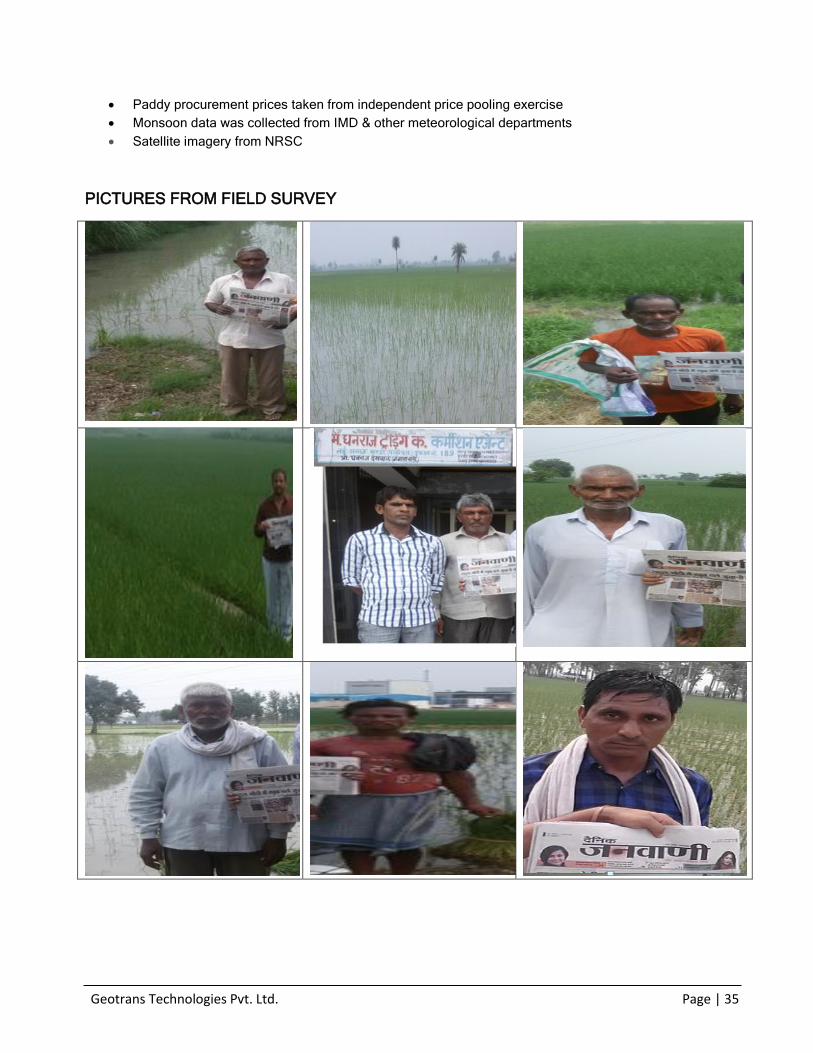
• We have done questionnaires’-based farmer surveys and taken farmers pictures along with actual
survey day newspapers. We geo-tagged farmers during the survey too in ours picture.
• To vet the complete study, we have also taken assistance from satellite images and tele-calling, so
that complete perspective can be taken into considerations while arriving the results of the study
• To further validate the results, we have also taken the last year’s figures from the previous reports,
so that survey results error has to be minimized and actual figures can be achieved in the study
Way Forward
• Survey teams will be continuously in the field throughout the survey and report on crop progress to
APEDA, so that subsequent reports will be presented in the more meaningful & timely manner
• Next report will focus on Mandi arrival pace / crop production / crop cutting experiments / price
trends / any infestation or losses if any
• Any changes as reported from the field on current thoughts will also be incorporated
• Next report will be presented during Oct, 2018,
Data Source
• All figures based on farmer interview and feedback for current year
• Last year dataset from previously submitted reports
2700
3200
3700
4200
4700
5200
Price in INR/QtlRICE--SHARBATI SELLA(MILL)--GOLDEN--TARAORI
Geotrans Technologies Pvt. Ltd. Page | 35
• Paddy procurement prices taken from independent price pooling exercise
• Monsoon data was collected from IMD & other meteorological departments
• Satellite imagery from NRSC
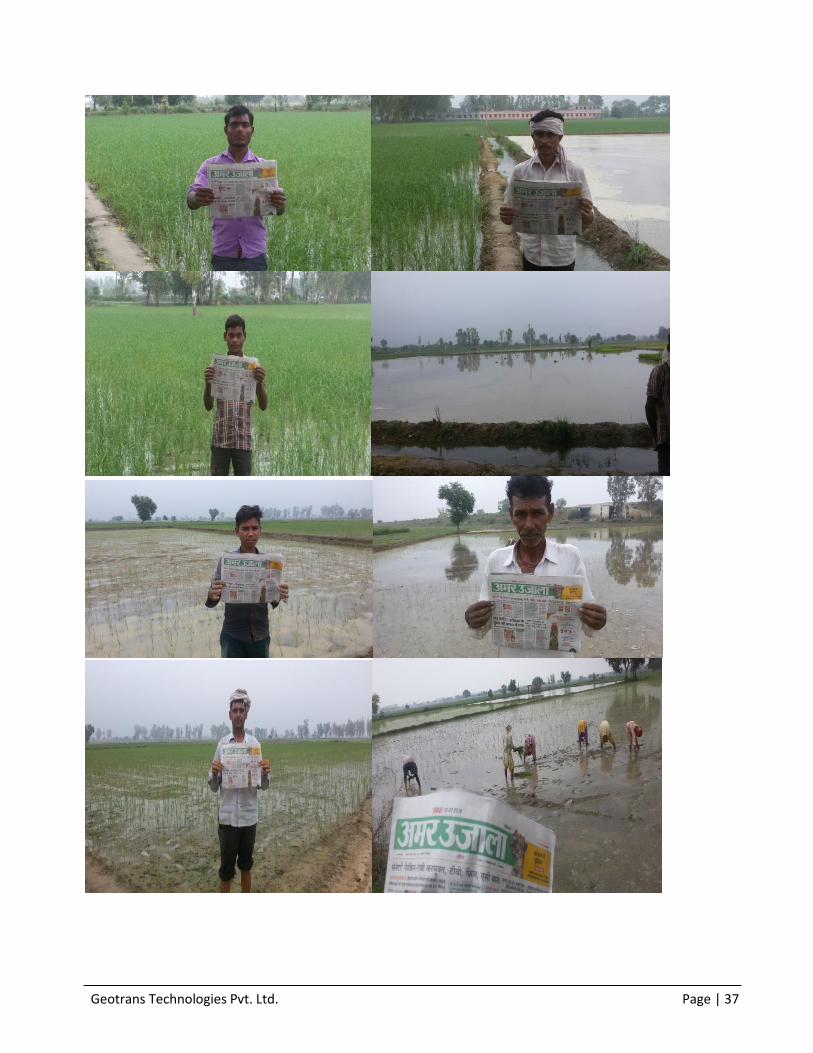
PICTURES FROM FIELD SURVEY

Geotrans Technologies Pvt. Ltd. Page | 36
Geotrans Technologies Pvt. Ltd. Page | 37
