repeated genomic signatures of adaptation to urbanisation
TRANSCRIPT
1
Repeated genomic signatures of adaptation to urbanisation in a songbird
across Europe
Pablo Salmón1,2 †, Arne Jacobs2 †, Dag Ahrén1, Clotilde Biard3, Niels J. Dingemanse4, Davide M.
Dominoni2, Barbara Helm2,5, Max Lundberg1, Juan Carlos Senar6, Philipp Sprau4, Marcel E.
Visser5,7 and Caroline Isaksson1 *
1 Department of Biology, Lund University. 2 Current address: Institute of Biodiversity, Animal Health and Comparative Medicine,
University of Glasgow, Glasgow, G128QQ, UK 3 Sorbonne Université, UPEC, Paris 7, CNRS, INRA, IRD, Institut d'Écologie et des Sciences de
l'Environnement de Paris, iEES Paris, F-75005 Paris, France. 4 Department of Biology, Ludwig Maximilians University Munich, Germany. 5 GELIFES - Groningen Institute for Evolutionary Life Sciences, University of Groningen, The
Netherlands. 6 Museu de Ciències Naturals de Barcelona, Barcelona, Spain. 7 Department of Animal Ecology, Netherlands Institute of Ecology (NIOO-KNAW),
Wageningen, Netherlands.
*Correspondence to Caroline Isaksson, [email protected]
† Both authors contributed equally
.CC-BY-ND 4.0 International licensewas not certified by peer review) is the author/funder. It is made available under aThe copyright holder for this preprint (whichthis version posted May 7, 2020. . https://doi.org/10.1101/2020.05.05.078568doi: bioRxiv preprint

2
Abstract
Urbanisation is currently increasing worldwide, and there is now ample evidence of
phenotypic changes in wild organisms in response to this novel environment, but the extent to
which this adaptation is due to genetic changes is poorly understood. Current evidence for
evolution is based on localised studies, and thus lacking replicability. Here, we genotyped great
tits (Parus major) from nine cities across Europe, each paired with a rural site, and provide
evidence of repeated polygenic responses to urban habitats. In addition, we show that selective
sweeps occurred in response to urbanisation within the same genes across multiple cities. These
genetic responses were mostly associated with genes related to neural function and development,
demonstrating that genetic adaptation to urbanisation occurred around the same pathways in
wildlife populations across a large geographical scale.
.CC-BY-ND 4.0 International licensewas not certified by peer review) is the author/funder. It is made available under aThe copyright holder for this preprint (whichthis version posted May 7, 2020. . https://doi.org/10.1101/2020.05.05.078568doi: bioRxiv preprint

3
Main
Urban development is rapidly expanding across the globe, and although urbanisation is
regarded a major threat for wildlife (Hendry, Gotanda, and Svensson 2017), its potential role as
an evolutionary driver of adaptation has not been explored until recently (Johnson and Munshi-
South 2017; J. C. Mueller et al. 2013; Harris and Munshi-South 2017; Rivkin et al. 2019). Some
species have phenotypically adapted to the many urban challenges, such as higher levels of
noise, artificial light at night, air pollution, altered food sources and habitat fragmentation
(Alberti et al. 2017). Indeed, there is now evidence that some of these adaptations may have a
genetic basis (Campbell-Staton et al. 2020), in line with the finding that such micro-evolutionary
adaptations can occur within short timescales, particularly in response to human activities (Bosse
et al. 2017; Hendry, Farrugia, and Kinnison 2008). However, the short evolutionary timescale,
the dependence of evolution on local factors, and the polygenic nature of many phenotypic traits,
make detecting evolutionary signals difficult (Hendry, Farrugia, and Kinnison 2008; Pritchard,
Pickrell, and Coop 2010). Thus, we still lack important knowledge on the signals of adaptation,
and thereby of the actual magnitude of the evolutionary change induced by urbanisation on
wildlife populations.
The majority of available studies on the genetic bases of urban adaptation have either
focused on a limited number of markers and genes (J. C. Mueller et al. 2013) or focused on a
narrow geographical scale (Harris and Munshi-South 2017; Campbell-Staton et al. 2020; Perrier
et al. 2018). As a result, an important gap remains in the understanding of the prevalence of
convergent evolution among cities (Rivkin et al. 2019), limiting the inferences that can be made
on the genomic response to urbanisation. A robust approach to address this gap is the use of
paired urban and rural sites at a large spatial scale in combination with high throughput genomic
tools. Such a strong replicated approach can help to simultaneously detect subtle allele frequency
shifts and identify genomic regions repeatedly involved in parallel evolutionary adaptation or
under divergent selection across distant urban habitats. This approach provides a powerful
framework to test the repeatability of the genomic adaptation to urbanisation.
In this study, we present a multiple location analysis of the evolutionary response to
urbanisation, using the great tit (Parus major). This widely-distributed passerine bird is a model
species in urban, evolutionary and ecological research (e.g. Boyce and Perrins 1987;
.CC-BY-ND 4.0 International licensewas not certified by peer review) is the author/funder. It is made available under aThe copyright holder for this preprint (whichthis version posted May 7, 2020. . https://doi.org/10.1101/2020.05.05.078568doi: bioRxiv preprint
4
Charmantier et al. 2008; 2017; Pettifor, Perrins, and McCleery 1988; Bouwhuis et al. 2009;
Krebs 1971; Salmón et al. 2017; Sprau, Mouchet, and Dingemanse 2017; Senar et al. 2017;
Isaksson et al. 2009) , with demonstrated phenotypic changes in response to urban environments
in several populations (Charmantier et al. 2017; Sprau, Mouchet, and Dingemanse 2017; Senar et
al. 2017; Caizergues, Grégoire, and Charmantier 2018). Additionally, genomic resources are well
developed for this species (Kim et al. 2018) and it is known that across its European range, the
species presents low genetic differentiation (Perrier et al. 2018; Laine et al. 2016; Lemoine et al.
2016; Spurgin et al. 2019). In order to examine and test the repeatability in the genomic
responses to urbanisation in a broad geographical scale we analysed nine paired urban and rural
great tit populations across Europe (Figs. 1a and 1b; Table S1). All urban sites used in the study
were located in built-up areas or parks within the city boundaries, while rural sites were always
natural or semi-natural forests containing only a few isolated houses. Additionally, we quantified
the relative degree of urbanisation for each site (urbanisation score: PCurb, from principal
component analysis, PCA; see Methods and Materials, Table S1; Fig. 1b). We combine two
complementary approaches, the detection in urban habitats of parallel allele frequency shifts
across many loci and the search for independent and repeated selective sweeps (i.e. a strong
increase in haplotype frequency at one or few loci). Furthermore, we use functional enrichment
analyses of genes putatively under selection to infer which particular phenotypes, known and
unknown, are associated with genes under selection in urban great tits, providing an outline of
genes to target in future ecological and functional studies.
Results and Discussion
Genetic diversity and population structure across European urban and rural populations
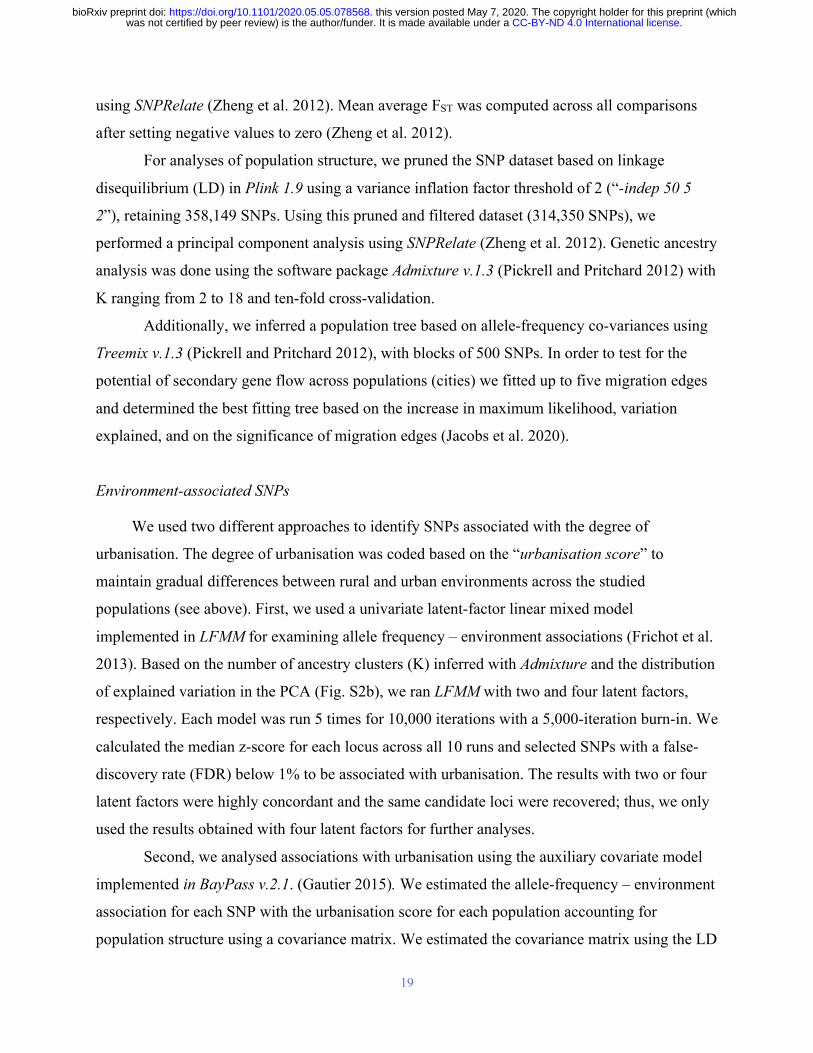
A total of 192 individuals were genotyped at 526,528 filtered SNPs, with 10-16
individuals per site (Table S1). The genetic diversity between each urban-rural pairing was
relatively low, with genome-wide differentiation (FST) ranging between 0.004 to 0.050 (Fig. S1c;
Table S1). This is in line with previous studies of the species (Perrier et al. 2018; Laine et al.
2016; Lemoine et al. 2016; Spurgin et al. 2019). In addition, the levels of heterozygosity were
similar between urban and rural populations, although slightly lower in some of the urban
populations (see Table S1 for details; Wilcoxon test: W=30, P = 0.377). This indicates that the
colonisation of urban environments is likely not a result of strong bottlenecks and its associated
.CC-BY-ND 4.0 International licensewas not certified by peer review) is the author/funder. It is made available under aThe copyright holder for this preprint (whichthis version posted May 7, 2020. . https://doi.org/10.1101/2020.05.05.078568doi: bioRxiv preprint
5
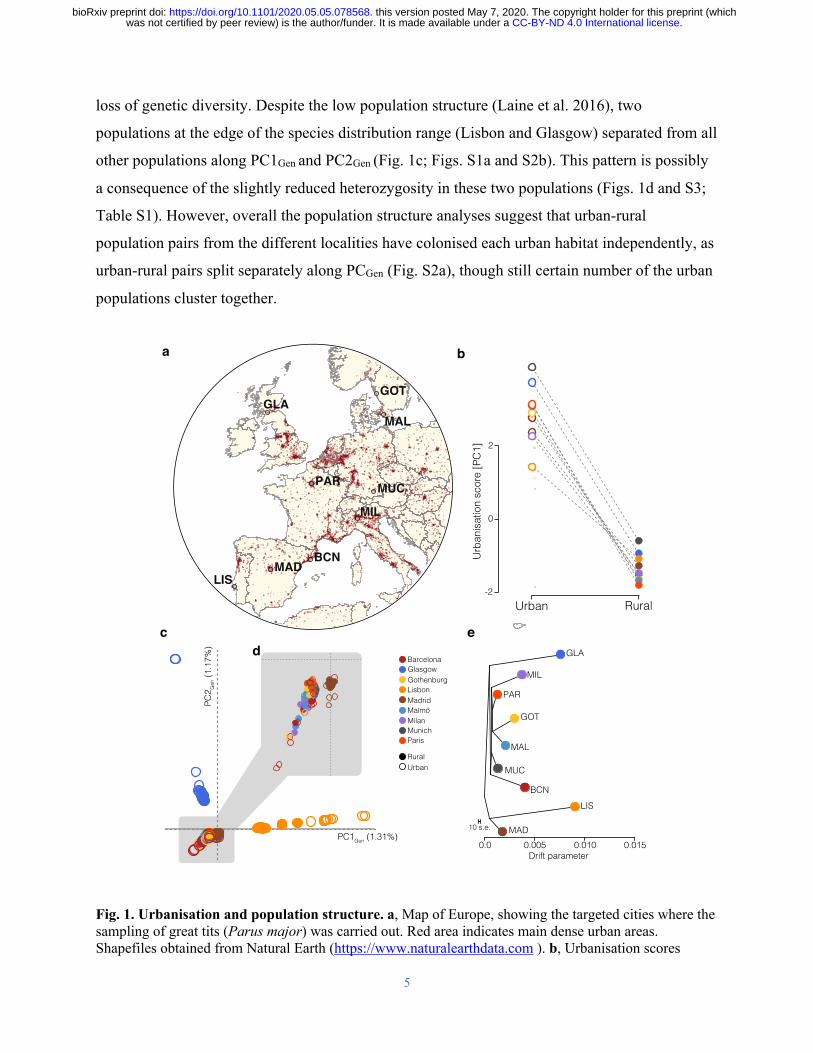
loss of genetic diversity. Despite the low population structure (Laine et al. 2016), two
populations at the edge of the species distribution range (Lisbon and Glasgow) separated from all
other populations along PC1Gen and PC2Gen (Fig. 1c; Figs. S1a and S2b). This pattern is possibly
a consequence of the slightly reduced heterozygosity in these two populations (Figs. 1d and S3;
Table S1). However, overall the population structure analyses suggest that urban-rural
population pairs from the different localities have colonised each urban habitat independently, as
urban-rural pairs split separately along PCGen (Fig. S2a), though still certain number of the urban
populations cluster together.
Fig. 1. Urbanisation and population structure. a, Map of Europe, showing the targeted cities where the sampling of great tits (Parus major) was carried out. Red area indicates main dense urban areas. Shapefiles obtained from Natural Earth (https://www.naturalearthdata.com ). b, Urbanisation scores
1$�(FO �����
1$� (
FO�����
FG
0$'%&1
/,6
0,/
3$5 08&
*/$0$/
*27
-JTCPO
#BSDFMPOB(MBTHPX(PUIFOCVSH
.BESJE
.BMNÚ
.JMBO
.VOJDI1BSJT
3VSBM6SCBO
��3VSBM6SCBO
�
�
6SCBO
JTBUJPOTD
PSF<1$�>
D E
%SJGU QBSBNFUFS
H
������������������."%
-*4
(05
.*-
1"3
.6$
(-"
."-
#$/
�� T�F�
.CC-BY-ND 4.0 International licensewas not certified by peer review) is the author/funder. It is made available under aThe copyright holder for this preprint (whichthis version posted May 7, 2020. . https://doi.org/10.1101/2020.05.05.078568doi: bioRxiv preprint

6
(principal component, PCurb) for all nine urban-rural pairings. c, d, Principal component (PCGen) plot showing the main axes of population structure for European great tits; dots represent individual birds. d, Zoomed view into the population cluster highlighted by the grey-shaded area. e, Maximum-likelihood tree showing the relationship between tits across sampling localities. BCN: Barcelona; GLA: Glasgow; GOT: Gothenburg; LIS: Lisbon; MAD: Madrid; MAL: Malmö; MIL: Milan; MUC: Munich; PAR: Paris.
Identification of key SNPs associated with urbanisation
Despite the overall lack of genome-wide differentiation between urban-rural pairings, the
selective pressures associated with urbanisation might have led to detectable genomic signatures
of local adaptation. We used two complementary approaches, LFMM (Latent Factor Mixed
Models) and an additional Bayesian approach (using BayPass), to narrow down genomic regions
with consistent and strong allele frequency shifts associated with urbanisation. Testing for
genotype-environment associations with LFMM (using PCurb as a continuous habitat descriptor,
Fig. 1b) revealed 2,758 SNPs associated with urbanisation (0.52% of the full SNP dataset, false-
discovery rate (FDR) < 1%; Fig. 2a). These SNPs were widely distributed across the genome and
did not cluster in specific regions. Larger chromosomes contained more urbanisation-associated
SNPs (R2 = 0.97; Fig. 2c), highlighting the polygenic nature of urban adaptation. A PCA based
on these SNPs clearly separated urban and rural populations along PC1LFMM (Proportion of
variance explained (PVE) by PC1 = 1.98%; Fig. S4a), showing highly parallel allele frequency
changes in those loci across European cities. BayPass identified 70 urbanisation-associated SNPs
(Bayes factor ≥ 20; Fig. 2b), of which 34 were shared with the LFMM analysis. These shared
SNPs, which we term “core urbanisation SNPs” (Fig. 2d; Table S2), are likely involved in the
local adaptation of great tits to urban habitats, and indeed, they strongly discriminated urban and
rural individuals across Europe (PVE by PC1GWAS= 11.7%; Figs. 2e and S4b).
The importance of habitat (i.e. urban versus rural) was further underpinned by a
univariate linear model. Using the first principal component axis of urbanisation-associated
SNPs (PC1GWAS), habitat explained 73% of the total associated variance in allele-frequency
divergence (h2PC1 GWAS, Habitat = 0.73, P < 0.001). In comparison, both the effect of locality, which
corresponds to the distinct evolutionary history of local populations (h2PC1 GWAS, Locality = 0.20, P
< 0.001), and the interaction of locality and habitat, which describes differences in the direction
of allele-frequency change across cities (h2PC1 GWAS, Habitat × Locality = 0.13, P = 0.001), explained
much lower proportions of the variance than the habitat term on itself. Interestingly, the
.CC-BY-ND 4.0 International licensewas not certified by peer review) is the author/funder. It is made available under aThe copyright holder for this preprint (whichthis version posted May 7, 2020. . https://doi.org/10.1101/2020.05.05.078568doi: bioRxiv preprint

7
trajectories of minor allele frequency changes for the individual “core urbanisation SNPs” were
highly repeatable across populations (Fig. S5). Thus, the directionality and/or magnitude in allele
frequency of the 34 identified SNPs showed a highly parallel pattern across all urban populations
(Fig. 2f), suggesting that in this species, local adaptation to urban habitats has occurred through
repeated shifts in allele frequency of the same loci. This finding implies an important role of
standing genetic variation in urban adaptation of great tits, as putatively adaptive alleles were
shared across large parts of Europe (Spurgin et al. 2019).
Fig. 2. Genome-wide association with urbanisation. a and b, Manhattan plots showing signals of genome-wide association with urbanisation across all populations for the a, LFMM and b, BayPass analyses, respectively (see in methods “Environment-associated SNPs”). The red dotted line and the blue line in the LFMM Manhattan-plot show the 0.1 and 1% FDR significance thresholds. The red dotted line in the BayPass plot shows the significance threshold for a Bayes factor of 20 deciban (dB); alternating colors denote chromosomes. c, Correlation between the number of SNPs associated with urbanisation per chromosome in the LFMM analyses and the respective chromosome length. The strong correlation indicates a polygenic basis of urban adaptation. d, Correlation between association signals in LFMM and BayPass. The red dotted lines show the respective significance thresholds (BayPass: 20db; LFMM: 1%
05101520
-log 1
0(p)
LFMM
chromosomes
-200204060
Bayesfactor
(dB)
1 1a 2 3 4 4a 5 6 7 8 910 Z
BayPass
RuralUrban RuralUrban
-0.1
0.0
0.1
0.2
Principa
lcom
pone
nt1(11.7%
)
0
0 5 10 15
20
40
-log10(p)
Bayesfactor
(dB)
a
b
c
●
●●●●●●●●●
●
●
●●●●●●●●●●
●
●
●
●
●●
●●●
●
R2 = 0.97P < 0.001
0
100
200
300
400
500
0.0 5.0e+07 1.0e+08 1.5e+08Chromosome length [bp]
Num
bero
fassoc
iatedSN
Psd e
f
0.2
0.4
0.6
Minor
allelefre
quen
cy
.CC-BY-ND 4.0 International licensewas not certified by peer review) is the author/funder. It is made available under aThe copyright holder for this preprint (whichthis version posted May 7, 2020. . https://doi.org/10.1101/2020.05.05.078568doi: bioRxiv preprint

8
FDR). SNPs associated with urbanisation in both analyses are highlighted in yellow (“core urbanisation SNPs”, N=34). e, Main axis of variation in a PCAGWAS based on “core urbanisation SNPs”. Grey circles show individuals and yellow dots and lines, show the mean ± s.d. for urban and rural populations. f, Reaction norm plot showing the difference in the mean minor allele frequency for “core urbanisation SNPs” between all urban and rural populations combined. See Fig. S5 for allele frequency trajectories by locality and SNP.
Signatures of selection in urban populations
Next, we performed a genome-wide scan of differentiation and selective sweep analyses
to identify putative signatures of divergent selection between urban and rural populations. We
first estimated genetic differentiation (FST) in 200 kb sliding windows and 50 kb steps across the
genome. While the genome-wide level of differentiation was low in all populations, we detected
highly variable landscapes of genetic differentiation between adjacent urban and rural
populations, with multiple genomic peaks of increased genetic differentiation (FST > 99th
percentile) spread across the genome (Fig. S6). 85 genomic windows were significantly
differentiated in at least three urban-rural pairs.
Genetic differentiation can be driven by a myriad of processes, including background
selection (selection against deleterious variants) or divergent selection (e.g. associated with local
adaptation) in urban and/or rural populations (Burri 2017). To narrow down these processes, we
determined whether the outlier windows were putatively under selection in urban populations by
estimating population branch statistics (PBS) for each urban population in the same genome-
wide windows. In this study, positive PBS values show an extended genetic distance of the urban
population compared to the adjacent rural population and outgroup in a specific genomic
window, indicative of positive selection in the urban population at that site (Yi et al. 2010). We
used the rural population from Lisbon as the outgroup for estimating PBS, except for Lisbon, for
which we used the rural population from Glasgow. We tested the effect of outgroup on PBS
values but found that these were generally significantly correlated for each city (average
spearman’s r = 0.525 ± 0.087 s.d., Fig S7 and S8). Between 25% and 50% of differentiated
genomic regions (FST) showed signs of selection based on PBS (top 1% of empirical PBS
distribution) in urban populations (Fig. 3). Taking into consideration the nature of the
urbanisation phenomenon, we might expect that the distinct genomic backgrounds would give
rise to independent selective sweeps across localities, i.e. the result of locality-specific selection
pressures. Yet, the shared genetic variation in this species across Europe(Spurgin et al. 2019)
.CC-BY-ND 4.0 International licensewas not certified by peer review) is the author/funder. It is made available under aThe copyright holder for this preprint (whichthis version posted May 7, 2020. . https://doi.org/10.1101/2020.05.05.078568doi: bioRxiv preprint

9
might lead to the re-use of shared adaptive variants across geographically distant populations.
PBS values were highly variable across locations and showed generally low correlations among
each other (|r| < 0.28) suggesting that putative selective sweeps are geographically limited, i.e.
locality-specific. Nonetheless, 75 genomic windows with elevated PBS values were shared
across more than three urban populations (maximum of five localities, Fig 3). At the gene-level,
we detected multiple genes in or close to windows putatively under selection (within ≤ 100kb)
across urban populations, of which five genes showed signs of selection in five out of nine urban
populations (Table S3).
Fig. 3. Shared signals of selection across European urban great tit populations. Population branch statistics (PBS) across the genome for each population in 200 kb sliding windows with 50 kb steps. Windows above the 99th percentile of the empirical PBS distribution (red dashed line) were selected as putatively under selection in urban populations. Only positive values were plotted here for visualisation
0.060.040.020.00
0.050.040.030.020.010.00
0.150.20
0.100.050.00
0.150.100.050.00
0.0750.100
0.0500.0250.000
0.0750.100
0.0500.0250.000
0.0750.1000.125
0.0500.0250.000
0.0750.100
0.0500.0250.000
0.0750.100
0.0500.0250.000
1 1A 2 3 4 4A 5 6 7 8 9 1010 Z
GLA
GOT
MAL
PAR
MUC
MIL
Populationbranchstatistic[PBS
urban]
Chromosomes
BCN
MAD
LIS
.CC-BY-ND 4.0 International licensewas not certified by peer review) is the author/funder. It is made available under aThe copyright holder for this preprint (whichthis version posted May 7, 2020. . https://doi.org/10.1101/2020.05.05.078568doi: bioRxiv preprint

10
purposes. Full distributions can be found in Fig. S7 and S8. BCN: Barcelona; GLA: Glasgow; GOT: Gothenburg; LIS: Lisbon; MAD: Madrid; MAL: Malmö; MIL: Milan; MUC: Munich; PAR: Paris.
To complement the above analyses and to strengthen the inference of urban selective
sweeps under divergent selection, we also used haplotype-based statistics, which are more robust
to the effect of low recombination and linked selection (Tang, Thornton, and Stoneking 2007).
We compared haplotype-homozygosity between each urban and its respective rural population
(Rsb score) but only focused on absolute values as the ancestral states of haplotypes were not
known (Meier et al. 2018). Weak Spearman pairwise-correlations of the haplotype-based Rsb
scores for each SNP (Fig. S9 and S10) across localities indicate that selective sweeps are mostly
locality-specific, as suggested by the weak correlations of PBS.
Nonetheless, we identified several genes with recurrent signals of selection across a
broad geographical scale (> 3 urban populations). The Rsb statistics revealed signatures of
selective sweeps in or close to 568 genes in more than three localities (4-8 urban populations),
many of which were also detected using the PBS statistic (“candidate genes under selection”;
Fig. 3d; Table S3). Comparing genes associated with signatures of selection by PBS and Rsb
statistics, we identified 79 genes that showed signs of selection in at least three populations for
both summary statistic (Table S3). Of these, 4 genes were putatively under selection in more
than half of all urban populations (> 5 populations, maximum of 6) based on PBS scores, and
also showed signs of selection in 5 to 8 populations (median = 5 ± 1.69 s.d.) based on Rsb scores
(Table S3). The recurrent signals of selection on these genes suggest the existence of genetic
parallelism in the underlying response to urbanisation at the gene level and indicate that these
genes might potentially be strong candidates in the adaptation to urban habitats.
Evolutionary drivers of genetic divergence and signatures f selection
To test if signatures of selection were caused by divergent selection, or alternatively by
background selection in low recombination regions (Burri 2017), we evaluated the correlation of
signatures of selection with patterns of linkage disequilibrium (LD). First, we tested the
correlation between genetic diversity (LD measured as r2 and summarized in 200 kb sliding
windows with 50 kb steps per population and summarised as PC1 across all urban populations)
with measures of selection (PBS and Rsb summarised as PC1 across populations). Overall, the
.CC-BY-ND 4.0 International licensewas not certified by peer review) is the author/funder. It is made available under aThe copyright holder for this preprint (whichthis version posted May 7, 2020. . https://doi.org/10.1101/2020.05.05.078568doi: bioRxiv preprint

11
correlation between genetic differentiation (PBS-PC1) and genetic diversity in urban populations
(LD-PC1) was relatively weak but significant (R2 = -0.002; P = 9.7 x 10⁻¹¹), with low diversity
regions (high LD) showing weaker signatures of selection, i.e. low PBS scores (Fig. 4a-c). This
suggests that broad signatures of selection in urban habitats, positive PBS-PC1, are likely not
caused by background selection in low recombination regions but rather divergent selection
(Burri et al. 2015). We detected similar correlation patterns in most populations when we
assessed the correlation of urban genetic diversity (LD-PC1) with PBS scores by locality, i.e.
each independent city, rather than across all populations together (Fig. S11). However, in some
localities, such as in Malmö (MAL) and Gothenburg (GOT), we detected a positive correlation
between selection and genetic diversity (PBS ~ LD-PC1), suggesting the existence of spatially
varying impacts of background selection on the genomic landscape of differentiation in great tits
(Fig. S11). Similarly, the correlation between haplotype-homozygosity (Rsb-PC1) and genetic
diversity (LD-PC1) was very weak but significant (all chromosomes: R2 = 0.0115; P < 2.2 x 10-
16, without Z chromosome: R2 = 0.0021; P = 6.9 x 10⁻¹⁰), with outlier windows not being strongly
associated with low diversity regions (high LD) (Fig. 4d). This is expected, as the comparative
nature of the haplotype-based Rsb score accounts for overall reduced diversity in shared low-
recombination regions. Nonetheless, detailed recombination rate analyses and whole-genome
data will be needed in the future to thoroughly understand the effect of recombination, linked
selection and divergent selection on the landscape of divergence in European great tits.
Furthermore, we assessed patterns of linkage disequilibrium around individual
“candidate genes under selection” by locality (Figs. 4a and b). Low recombination regions or
shared selective sweeps in urban and rural individuals would result in reduced genetic diversity
in all populations (i.e. both urban and rural), as the recombination landscape in songbirds is
generally highly conserved (Burri et al. 2015; Delmore et al. 2018). Yet, LD patterns around
candidate genes differed strongly between chromosomes, suggesting effects of different
evolutionary drivers (Fig. 4a and b), with most candidate regions not being located inside
conserved low diversity regions (strongly correlated LD peaks) that might be indicative of a low
recombination region. However, we found that one shared candidate gene (CDH18) that showed
signatures of selection in five populations based on Rsb and PBS, was located inside a highly
conserved LD peak on chromosome 2 (Fig. 4a, Table S3). This location potentially represents
the centromere, and thus we cannot fully exclude the impact of background selection on the
.CC-BY-ND 4.0 International licensewas not certified by peer review) is the author/funder. It is made available under aThe copyright holder for this preprint (whichthis version posted May 7, 2020. . https://doi.org/10.1101/2020.05.05.078568doi: bioRxiv preprint

12
repeated signature of selection. However, the fact that CDH18 only seems to show signatures of
selection in urban populations but not rural populations suggests a role of divergent selection and
adaptation to urban habitats.
Fig. 4. Signatures of selection and LD. a, b Patterns of LD and PBS around candidate genes associated with urbanisation on chromosome 2 and the Z chromosome. The positions of candidate genes are highlighted by red dashed lines. Patterns of LD for urban populations are shown in black and those for rural populations in grey. c, Correlation between PBS-PC1 and LD-PC1 (for urban populations) based on
0.30.40.50.6
CHD18 CHD18
0.30.40.50.6
0.30.40.50.6
0.30.40.50.6
0.30.40.50.6
0.30.40.50.6
0.30.40.50.6
0.30.40.50.6
0.30.40.50.6
0.000
0.050
0.000
0.050
0.000
0.050
0.000
0.050
0.000
0.050
0.000
0.050
0.000
0.050
0.000
0.050
0.000
0.050
0 50 100 150 0 50 100 150
PTPRD PTPRDVPS13A VPS13A
GLA
GOT
MAL
PARMUC
MIL
BCNMAD
LIS
0.40
0.50
0.400.45
0.40
0.50
0.40
0.50
0.40
0.50
0.40
0.50
0.40
0.50
0.40
0.50
0.40
0.50
Position chr. Z
0.000.020.04
0.000.020.04
0.000.020.04
0.000.020.04
0.000.020.04
0.000.020.04
0.000.020.04
0.000.020.04
0.00
0 20 40 600 20 40 60
0.020.04
b
Position chr. 2
LD [r2] PBS LD [r2] PBS
-0.2
-0.1
0.0
R2 = -0.002P = 9.732e-11
0.0 0.5 1.0 1.5
0.1
LD-PC1 [urban]
PBS-PC
1
a
c d
-2.5
0.0
R2 = 0.0115P < 2.2e-16
0.0 0.5 1.0 1.5
2.5
5.0
LD-PC1 [urban]
Rsb-PC
1
.CC-BY-ND 4.0 International licensewas not certified by peer review) is the author/funder. It is made available under aThe copyright holder for this preprint (whichthis version posted May 7, 2020. . https://doi.org/10.1101/2020.05.05.078568doi: bioRxiv preprint

13
200 kb sliding windows. d, Correlation between Rsb-PC1 and LD-PC1 (urban) based on the same 200 kb sliding windows. Note that windows with high Rsb values but low values of LD-PC1 are located on the Z chromosome. See text for details. BCN: Barcelona; GLA: Glasgow; GOT: Gothenburg; LIS: Lisbon; MAD: Madrid; MAL: Malmö; MIL: Milan; MUC: Munich; PAR: Paris.
Furthermore, LD was increased chromosome-wide in some urban populations compared
to rural populations (e.g. chromosome Z, Fig. 4b), potentially suggesting an overall reduced
genetic diversity and increased drift on those chromosomes. Nonetheless, local LD-peaks were
still present around the “candidate genes under selection” in urban populations compared to
rural populations (e.g. genes PTPRD and VPS13A in chromosome Z in Glasgow and Barcelona;
Fig 4b, Fig. S12). The same genes also showed signs of selective sweeps in urban populations
from localities without differences in baseline LD (e.g. chromosome Z in Milan; Figs. 4b),
further supporting a scenario of divergent selection rather than increased drift due to locally
reduced effective population size. Indeed, in birds, patterns of genetic differentiation at early
stages of divergence, as presumably during colonisation of urban areas, have been found to be
driven by selection rather than recombination (Burri 2017; Delmore et al. 2018). Thus, it is most
likely that divergent selection rather than linked selection or drift explains the observed recurrent
signals of selection in shared genes.
Interestingly, many of the SNPs putatively under selection were located on the Z-
chromosome, which in birds is the sex-chromosome in the homogametic sex (males) (Figs. 3 and
4b). The strong urban association and selection signatures on this chromosome are in line with
the “Fast-Z” evolution (Dean et al. 2015) , which could be, at least partially, explained by a
reduced recombination and effective population size on this particular chromosome. However,
because many of these variants show similar allele frequency shifts between habitats across
localities (Fig. 2f) and show signatures of selection in urban but not rural populations,
recombination differences on their own cannot be the main driving factor of divergence in this
particular chromosome.
Convergent evolution of gene functions in response to urbanisation
While the majority of genes showing signs of selection were unique to one or two cities,
supporting the scenario of independent selective events, a significant proportion of genes were
.CC-BY-ND 4.0 International licensewas not certified by peer review) is the author/funder. It is made available under aThe copyright holder for this preprint (whichthis version posted May 7, 2020. . https://doi.org/10.1101/2020.05.05.078568doi: bioRxiv preprint

14
putatively under selection in multiple cities. Indeed, permutation analyses indicated that one
would not expect, by chance, the same gene under selection in three or more cities (c21 =77.947,
P < 2.2 x 10⁻¹⁶). However, 11 individual genes showed signs of selective sweeps in more than
half of the studied urban populations (five to six) based on PBS, and also in more than three
populations (three to eight) based on the Rsb statistic (Fig 5a, Table S3). Additionally, 107 genes
were putatively under selection in three or four urban populations based on PBS and also showed
signs of selection based on Rsb in more than three populations (three to seven) (Table S3). These
results corroborate and reinforce evidence for repeatability at the genomic level in the response
to urbanisation between distant urban populations. Furthermore, 14 of these 79 genes putatively
under selection were also associated with urbanisation-associated SNPs (see LFMM analyses).
Many of the genes associated with urbanisation and under recurrent selective sweeps in
urban populations have previously been linked with behavioural divergence, suggesting adaptive
phenotypic shifts related to behaviour. For instance, the PTPRD gene (chr. Z), which showed
signs of selection in seven urban populations and was associated with urbanisation (Figs. 5b, Fig
S12), encodes for the receptor-type tyrosine-protein phosphatase delta, an enzyme suggested to
be involved in neural development of the hippocampus (Uetani et al. 2000), a brain region linked
to spatial memory, bird navigation and flight performance (Mehlhorn, Haastert, and Rehkämper
2010; Gazda et al. 2018). The CDH18 gene (chr. 2) is part of a superfamily of membrane
proteins involved in synaptic adhesion and was revealed as a candidate gene in phonological
alterations in humans (Peter et al. 2016). Furthermore, VPS13A (chr. Z) gene variants in humans
are linked to chorea-acanthocytosis (Ishida et al. 2009), a neurodegenerative disorder that affects
movement and, this gene has recently shown to be associated with migratory behaviour in a
songbird (Toews et al. 2019).
.CC-BY-ND 4.0 International licensewas not certified by peer review) is the author/funder. It is made available under aThe copyright holder for this preprint (whichthis version posted May 7, 2020. . https://doi.org/10.1101/2020.05.05.078568doi: bioRxiv preprint

15
Fig. 5. Candidate genes and biological pathways associated with urbanisation. a, Map showing the spatial distribution of some top shared candidate genes putatively under selection in urban populations across Europe. b, Enrichment of associated genes in significantly enriched gene ontology (GO) groups by GO category in the LFMM and BayPass analysis (see Table S4 for a detailed list). The colour of bars represents the false-discovery rate (FDR) from the gene ontology overrepresentation analyses. BCN: Barcelona; GLA: Glasgow; GOT: Gothenburg; LIS: Lisbon; MAD: Madrid; MAL: Malmö; MIL: Milan; MUC: Munich; PAR: Paris.
Thus, our selection analyses suggest that natural selection repeatedly acts on behavioural
traits and sensory and cognitive performance, all previously shown to be among the most
widespread differences between urban and rural wildlife populations (Sih and Del Giudice 2012;
Sol, Lapiedra, and González-Lagos 2013). These findings were furthermore supported by the GO
terms analysis of the 2,758 urbanisation-associated SNPs (LFMM analysis), linked to 984 genes
(1,501 SNPs in genic regions). Accordingly, most of the GO terms were related to neural
functioning and development (e.g., GO:0016358, FDR = 4.30 x 10⁻⁶), cell-adhesion (e.g.,
GO:0098742, FDR = 3.43 x 10⁻⁶) and sensory perception (e.g., GO:0050954, FDR = 3.42 x 10⁻³;
Fig. 4, Table S4). These GO terms were mainly clustered into two interacting networks, one
related to sensory recognition and the other to neural development and cell adhesion (Fig. S13).
These findings reinforce the previous idea on the importance of cognitive and behavioural
changes as key responses to urbanisation in birds and in particular in great tits. Indeed, song
structure and escape or distress behaviour have been previously shown to differ between urban
35
40
45
50
55
60
-10 0 10 20 30Longitude
BCNMAD
LIS
GLA
GOT
MAL
MUCPAR
MILLatit
ude
PTPRDCDH18GNAQFOCADGLIS3MLLT3VPS13AHACD4
PTPRDCDH18GNAQGLIS3
PTPRDGNAQVPS13A
PTPRDCDH18
PTPRDCDH18GNAQFOCADHACD4
PTPRDFOCADMLLT3HACD4
GLIS3GNAQFOCADMLLT3VPS13AHACD4
PTPRDCDH18GNAQFOCADGLIS3MLLT3
VPS13AHACD4
a b
Proc
esse
sFu
nctio
nsC
ompo
nent
s
Enrichment
0.020.06
FDR
0 1 2 3 4
cell-cell adhesion via plasma-membrane adhesion moleculessynapse organization
regulation of synapse structure or activitydendrite development
regulation of membrane potentialsensory perception of mechanical stimulus
second-messenger-mediated signallingpositive regulation of cell projection organization
regulation of neuron projection developmentregulation of cell morphogenesis
dynein light chain bindingspectrin binding
cell adhesion molecule bindingextracellular matrix structural constituent
transmembrane receptor protein kinase activitygrowth factor binding
collagen bindingdynein light intermediate chain binding
glutamate receptor activitydynein intermediate chain binding
synaptic membraneneuron to neuron synapse
postsynaptic specializationglutamatergic synapse
neuron spineaxon part
sarcolemmapresynapse
neuromuscular junctionreceptor complex
.CC-BY-ND 4.0 International licensewas not certified by peer review) is the author/funder. It is made available under aThe copyright holder for this preprint (whichthis version posted May 7, 2020. . https://doi.org/10.1101/2020.05.05.078568doi: bioRxiv preprint

16
and rural great tit populations across Europe (Senar et al. 2017; Slabbekoorn and den Boer-
Visser 2006; Møller and Ibáñez-Álamo 2012). Nonetheless, whether this is the result of a genetic
response to selection or phenotypic plasticity is to a large extent still unknown. Only a few
studies have previously explored the genetic patterns underlying urban adaptation in birds,
finding evidence of divergence in behaviour-related genes at multiple European populations
using either a candidate gene approach (J. C. Mueller et al. 2013) or a low-density SNP along
transects within a city (Perrier et al. 2018). Furthermore, similar pathways showed divergence
across three neighboring urban areas in a recently established urban-dwelling avian species in
South America (Jakob C. Mueller et al. n.d.). Overall, our study supports these earlier
observations regarding adaptive genetic changes in behavioural and neural development,
suggesting that these processes play an important role in urban adaptation. Detailed functional
genomic and phenotypic analyses are now needed to understand the role of these genes in the
adaptive divergence of urban and rural great tits and other songbirds.
Conclusions
Our study demonstrates genetic signals of repeated local adaptation to urban habitats in a
common songbird across multiple European cities. We found that a combination of parallel
polygenic allele frequency shifts and recurrent but independent selective sweeps are associated
with adaptation to urban environments. Our results strongly suggest that a few genes with known
neural developmental and behavioural functions experienced recurrent but independent selective
sweeps only in the urban populations. This suggests a strong consistency in the processes
associated with urbanisation, despite the fact that underlying haplotypes are not shared. Thus, our
study exemplifies repeated evolutionary adaptation to urban environments on a continental scale
and highlights behavioural and neurosensory adjustments as important phenotypic adaptations in
urban habitats.
.CC-BY-ND 4.0 International licensewas not certified by peer review) is the author/funder. It is made available under aThe copyright holder for this preprint (whichthis version posted May 7, 2020. . https://doi.org/10.1101/2020.05.05.078568doi: bioRxiv preprint

17
Methods
Sample collection and DNA extraction
During the years 2013-2015, 20 or more individual great tits were sampled at paired urban-
rural sites from nine European cities (Figure 1a; Table S1). We sampled a total of 192
individuals (aged > 1 year old) with 10-16 individuals per site (Table S1). Sexes were balanced
between pairs (urban-rural) in the dataset (GLMM; pair: c21 = 0.505, P= 0.477). Each of the
paired sampling sites (urban or rural, hereinafter populations) was sampled within the same
season. Barcelona and Munich were sampled during winter period, however, in both cases only
known birds (recaptures) were included in the study, thus, all birds can be considered resident.
All urban populations were located within the city boundaries, the areas are characterized with
significant proportion of human-built structures such as houses and roads with managed parks as
the only green space. Rural populations were chosen to contrast the urban locations, regarding
degree of urbanisation and were always natural/semi-natural forests and contained only a few
isolated houses. Each urban and rural population were separated with a distance above the mean
adult and natal dispersal distance of this species (i.e. see Table S1) (Paradis et al. 1998).
Blood samples (approx. 25 µl) were obtained either from the jugular or brachial vein and
stored at 4 ºC in ethanol or SET buffer and subsequently frozen at -20 ºC. In each case,
procedures were identical for the paired rural and urban populations. DNA was extracted from
approximately 5 µl samples of red blood cells in 195 µl of phosphate-buffered saline using
Macherey-Nagel NucleoSpin Blood Kits (Bethlehem, PA, USA) and following the
manufacturer’s instructions or manual salt extraction (ammonium acetate). The quantity and
purity of the extracted genomic DNA was high and measured using a Nanodrop 2000
Spectrophotometer (Thermo Fisher Scientific) and Qubit 2.0 Fluorometer (Thermo Fisher
Scientific).
Urbanisation score
To quantify the degree of urbanisation at each site we used the UrbanizationScore image-
analysis software, based on aerial images from Google Maps (Google Maps 2017) and following
the methods previously described in different studies assessing the effect of urbanisation on wild
bird populations (Seress et al. 2014). Briefly, each sampling site was represented by a 1 km x 1
.CC-BY-ND 4.0 International licensewas not certified by peer review) is the author/funder. It is made available under aThe copyright holder for this preprint (whichthis version posted May 7, 2020. . https://doi.org/10.1101/2020.05.05.078568doi: bioRxiv preprint

18
km rectangular area around the capture locations. The content in each rectangle was evaluated
dividing the image in 100 m x 100 m cells and considering three land-cover characteristics in
each: proportion of buildings, vegetation (including cultivated fields) and paved surfaces. The
different land-cover measures obtained per site were used in a principal component analysis to
estimate an urbanisation score variable (PCurb) for each of the urban or rural populations per
locality, see Supplementary Table S1. The PCurb values were transformed to obtain negative
values in the less urbanized and positive in the more urbanized sites. We used the average of the
urbanisation estimates if birds were captured in more than one location within each site (>2 km
apart, mean ± s.d.: 931.22 ± 1,005.26 m). All quantifications were done in triplicates by the same
person (P.S.) and the estimates were highly repeatable, (intra class correlation coefficient, ICC =
0.993, 95% CI = 0.997-0.987, P < 0.001).
SNP genotyping
All 192 individuals were successfully genotyped using a custom made AffymetrixÓ great
tit 650K SNP chip at Edinburgh Genomics (Edinburgh, United Kingdom). SNP calling was
done following the “Best Practices Workflow” in the software Axiom Analysis Suite 1.1.0.616
(AffymetrixÓ) and all the individuals passed the default quality control steps provided by the
manufacturer (dish quality control values > 0.95) and previous studies using the same SNP chip
(6, 17). A total of 544,610 SNPs were then exported to a variant-calling format (VCF) and Plink
and furthered filter and assigned to chromosomes using the great tit reference genome
(GCA_001522545.2 Parus major v1.1; NCBI Annotation Release 101). 155 SNPs were not
found in the new assembly and 17,927 SNPs were not in chromosomic regions; thus, these SNPs
were removed from further analysis leaving a total of 526,528 SNPs.
Genetic diversity and Population Structure
We calculated the genome-wide genetic diversity as expected heterozygosity (He) for each
population using Plink 1.9 (Purcell et al. 2007), and tested if genetic diversity significantly
differed between urban-rural populations from the same location using t-tests in R and overall
across urban-rural pairings using a Wilcoxon rank sum test in R (R Core Team 2018).
Furthermore, we estimated pairwise FST between all population-pairs (urban-rural per locality)
.CC-BY-ND 4.0 International licensewas not certified by peer review) is the author/funder. It is made available under aThe copyright holder for this preprint (whichthis version posted May 7, 2020. . https://doi.org/10.1101/2020.05.05.078568doi: bioRxiv preprint
19
using SNPRelate (Zheng et al. 2012). Mean average FST was computed across all comparisons
after setting negative values to zero (Zheng et al. 2012).
For analyses of population structure, we pruned the SNP dataset based on linkage
disequilibrium (LD) in Plink 1.9 using a variance inflation factor threshold of 2 (“-indep 50 5
2”), retaining 358,149 SNPs. Using this pruned and filtered dataset (314,350 SNPs), we
performed a principal component analysis using SNPRelate (Zheng et al. 2012). Genetic ancestry
analysis was done using the software package Admixture v.1.3 (Pickrell and Pritchard 2012) with
K ranging from 2 to 18 and ten-fold cross-validation.
Additionally, we inferred a population tree based on allele-frequency co-variances using
Treemix v.1.3 (Pickrell and Pritchard 2012), with blocks of 500 SNPs. In order to test for the
potential of secondary gene flow across populations (cities) we fitted up to five migration edges
and determined the best fitting tree based on the increase in maximum likelihood, variation
explained, and on the significance of migration edges (Jacobs et al. 2020).
Environment-associated SNPs
We used two different approaches to identify SNPs associated with the degree of
urbanisation. The degree of urbanisation was coded based on the “urbanisation score” to
maintain gradual differences between rural and urban environments across the studied
populations (see above). First, we used a univariate latent-factor linear mixed model
implemented in LFMM for examining allele frequency – environment associations (Frichot et al.
2013). Based on the number of ancestry clusters (K) inferred with Admixture and the distribution
of explained variation in the PCA (Fig. S2b), we ran LFMM with two and four latent factors,
respectively. Each model was run 5 times for 10,000 iterations with a 5,000-iteration burn-in. We
calculated the median z-score for each locus across all 10 runs and selected SNPs with a false-
discovery rate (FDR) below 1% to be associated with urbanisation. The results with two or four
latent factors were highly concordant and the same candidate loci were recovered; thus, we only
used the results obtained with four latent factors for further analyses.
Second, we analysed associations with urbanisation using the auxiliary covariate model
implemented in BayPass v.2.1. (Gautier 2015). We estimated the allele-frequency – environment
association for each SNP with the urbanisation score for each population accounting for
population structure using a covariance matrix. We estimated the covariance matrix using the LD
.CC-BY-ND 4.0 International licensewas not certified by peer review) is the author/funder. It is made available under aThe copyright holder for this preprint (whichthis version posted May 7, 2020. . https://doi.org/10.1101/2020.05.05.078568doi: bioRxiv preprint

20
pruned SNP dataset in the core model using default parameters: 20 pilot runs of 1,000 iterations,
a run length of 50,000 iterations, sampling every 25th iteration, and a burn-in of 5,000 iterations.
The resulting covariance matrix was used as input for five replicated runs of the auxiliary
covariate model using the above settings. The strength of association is given in the test by
estimated Bayes factor (measured in deciban; dB). We calculated the median Bayes Factor
across all five replicated runs and considered all SNPs with a deciban unit (dB) > 20 as
urbanisation associated. This is the strictest criterion and is considered as “decisive evidence” for
the association (Gautier 2015).
Patterns of genetic differentiation (FST, PBS)
To identify genomic regions distinguishing adjacent urban and rural great tits, we
estimated the genetic differentiation (Weir & Cockerham’s FST (Weir and Cockerham 1984)) for
each urban and rural pair for each SNP using vcftools. We subsequently summarised and plotted
FST values in 200 kb sliding windows with 50 kb steps using the windowscanr R-package. To
identify genomic regions putatively under selection in urban but not rural populations, we also
calculated the population branch statistic (PBS) for each urban pair. We used the rural LIS
(Lisbon) population as the outgroup as it is the genetically most distinct rural population, except
for the PBS estimation for the urban LIS population, for which we used the rural GLA (Glasgow)
population as the outgroup. We used the following formula from Zhang et al. (Zhang et al.
2020): PBSurb = (Turb-rur + Turb-out – Trur-out) / 2, where T = -log(1- FST ). Turb-rur is derived from FST
between adjacent rural and urban populations, Turb-out from FST between the focal urban and
outgroup population, and Trur-out from FST between the rural and outgroup population. For
visualisation purposes, only positive PBS values, those showing putative signs of selection in the
focal urban population, were plotted along the genome.
Haplotype-based selection analysis
To identify genomic regions showing signs of (incomplete) selective sweeps in urban-rural
population pairs, we scanned the genome for regions of extended haplotype homozygosity
(EHHS) in urban compared to rural populations. We firstly used fastPHASE (Scheet and
Stephens 2006) to reconstruct haplotypes and impute missing data independently for each
chromosome using the default parameters, except that each individual was classified by its
.CC-BY-ND 4.0 International licensewas not certified by peer review) is the author/funder. It is made available under aThe copyright holder for this preprint (whichthis version posted May 7, 2020. . https://doi.org/10.1101/2020.05.05.078568doi: bioRxiv preprint

21
population (“-u” option). We used 10 random starts of the EM algorithm (“-T” option) and 100
haplotypes (“-H” option). The fastPHASE output files were analysed using rehh 2.0 (Gautier,
Klassmann, and Vitalis 2017). In addition, we used “rehh” to calculate Rsb statistics per focal
SNP. The Rsb score is the standardized ratio of integrated EHHS (iES, which is a site-specific
extended haplotype homozygosity) between two populations, is calculated using the following
formula in rehh (Tang, Thornton, and Stoneking 2007; Gautier, Klassmann, and Vitalis 2017):
!"# = &!'()!"#$ −+,-%&'()!"#$.%&'()!"#$
, with LRiESTang representing the unstandardized log ratio of the iESTang (urban) and iESTang
(rural) computed in the urban and rural populations (Gautier, Klassmann, and Vitalis 2017), and
medLRiES,Tang and .LRiES,Tang representing the median and standard deviation of LRiESTang,
respectively. This statistic measures the extent of haplotype homozygosity between two
populations and follows the rationale that if a SNP is under selection in one population compared
to the other, the region around this locus will show an unusually high level of haplotype
homozygosity compared to the neutral distribution. As the we don’t know the ancestral and
derived state of each SNP, we focused on the absolute Rsb values. In accordance to Gautier and
colleagues (Gautier, Klassmann, and Vitalis 2017), significant genomic regions were selected
based on a threshold of |Rsb| ≥ 4. Because recombination rates can be assumed to be conserved
between closely-related urban and rural populations, the cross-population comparative nature of
the Rsb statistic provides an internal control that cancels out the effect of heterogeneous
recombination across the genome (Tang, Thornton, and Stoneking 2007).
To determine the repeatability of selection across urban-centres, we implemented a
resampling approach to assess the likelihood of genes showing signs of selection in two, three,
four or more populations. We resampled with replacement n genes (n = number of genes with
signatures of selection in each urban population) for each population from the list of all SNP-
linked genes using the resample function in R, assessed the amount of overlap between
populations (from two to 8 populations) and repeated the sampling 100,000 times for each
comparison. We then calculated the mean and 95% confidence interval (CI) for each comparison
and compared the number of observed shared candidate genes to the expected number of
.CC-BY-ND 4.0 International licensewas not certified by peer review) is the author/funder. It is made available under aThe copyright holder for this preprint (whichthis version posted May 7, 2020. . https://doi.org/10.1101/2020.05.05.078568doi: bioRxiv preprint

22
candidate genes. The expected number of genes showing signs of selection in three or more
populations was zero, thus we focused on genes showing signs of selection (Rsb, PBS) in three or
more populations. This highlights the fact that it is unlikely that genes repeatedly show signs of
selection in three or more urban populations by chance alone.
Parallelism analyses of urbanisation-associated SNPs
To determine the explanatory power of urbanisation associated SNPs and parallelism in
allele frequency changes across populations, we performed a principal component analysis based
on different candidate subsets, i) all LFMM candidate SNPs (PCLFMM and ii) those overlapping
between the LFMM and BayPass analyses (“Core urbanisation SNPs”, PCGWAS, see above),
using SNPrelate. Furthermore, we ran a univariate linear model for each of the first three
principal components (i.e. “PC (PC1) ∼ Habitat + Locality + Habitat × Locality”) to quantitatively
test the effect of parallel (significant “Habitat” effect, urban-rural) and non-parallel (significant
“Habitat × Locality”) on allele-frequency changes across populations. We used the “EtaSq”
function implemented in BaylorEdPsych (Beaujean and Beaujean, n.d.) to extract the effect sizes
(partial h2) for the model terms in each linear model.
Patterns of linkage disequilibrium (LD) across the genome
To estimate the impact of variation in recombination rate and linked selection in low-
recombination regions on patterns of divergence (i.e. regions showing signs of selective sweeps),
we estimated patterns of LD (r2) across the genome using Plink 1.9 (Purcell et al. 2007). We
focused on long-distance LD by calculating LD for pairs of SNPs within 2,000 to 200,000bp of
each other for each population (each rural and urban population per locality). To reduce the
computational load, we randomly sampled 5% of the dataset for each locality and plotted them
for chromosomes containing candidate genes showing signs of selective sweeps in four or more
cities (chromosome 2, chromosome Z). Furthermore, to investigate more large-scale patterns of
correlation between selection and LD, we estimated a PCA based on LD scores in 200 kb sliding
windows (50 kb steps) and used PC1 (LD-PC1) as a proxy for the distribution-wide LD pattern
across the genome. We then estimated the PCA for PBS and estimated the correlation between
.CC-BY-ND 4.0 International licensewas not certified by peer review) is the author/funder. It is made available under aThe copyright holder for this preprint (whichthis version posted May 7, 2020. . https://doi.org/10.1101/2020.05.05.078568doi: bioRxiv preprint

23
LD-PC1 and PBS-PC1. We also estimated the correlation between LD-PC1 and PBS by locality
to investigate local differences. We performed the same analyses for sliding window Rsb scores.
Functional characterization of candidate SNP
We obtained the gene annotations for all candidate SNPs from the great tit reference
genome annotation (GCA_001522545.2 Parus_major1.1; NCBI Annotation Release 101). We
used all genes containing SNPs associated with urbanisation (LFMM and BayPass) (N = 1,501
SNPs within genes). To analyse the enrichment of functional classes, we identified
overrepresented gene ontologies (biological processes, molecular functions and cellular
components) using the WebGestalt software tool (Wang et al. 2017). The gene background was
set using annotated great tit genes (Annotation release 101) containing SNPs from the SNP chip
and with H. sapiens orthologues. H. sapiens genes were used as a reference set as human genes
are better annotated with GO terms than those of any avian system (e.g. chicken) (Bosse et al.
2017; Laine et al. 2016). We focused on non-redundant gene ontology (GO) terms to account for
correlations across the GO graph topology and GO terms as implemented in WebGestalt (Wang
et al. 2017). A FDR < 0.05 was used as a threshold for significantly enriched GO terms.
Furthermore, we searched the public record for functions of individual candidate genes. We also
used GOrilla (Eden et al. 2009) to visualize the connections of GO terms associated with LFMM
candidate genes and Cytoscape v.3.6.1 (Shannon et al. 2003) to visualize the GO network and
identify all enriched GO terms (biological processes, P < 0.001), including redundant terms.
Candidate genes associated with signatures of selection were those that were either
overlapping with PBS outlier windows or within 100 kb up- or down-stream of a SNP with an
absolute Rsb score above 4. Overlap between genomic regions/SNPs and genes was assessed
using bedtools.
References
Alberti, Marina, Cristian Correa, John M. Marzluff, Andrew P. Hendry, Eric P. Palkovacs, Kiyoko M. Gotanda, Victoria M. Hunt, Travis M. Apgar, and Yuyu Zhou. 2017. ‘Global Urban Signatures of Phenotypic Change in Animal and Plant Populations’. Proceedings of the National Academy of Sciences of the United States of America 114 (34): 8951–56. https://doi.org/10.1073/pnas.1606034114.
Beaujean, A. Alexander, and Maintainer A. Alexander Beaujean. n.d. ‘Package “BaylorEdPsych”’. Bosse, Mirte, Lewis G. Spurgin, Veronika N. Laine, Ella F. Cole, Josh A. Firth, Phillip Gienapp, Andrew G. Gosler,
et al. 2017. ‘Recent Natural Selection Causes Adaptive Evolution of an Avian Polygenic Trait’. Science (New York, N.Y.) 358 (6361): 365–68. https://doi.org/10.1126/science.aal3298.
.CC-BY-ND 4.0 International licensewas not certified by peer review) is the author/funder. It is made available under aThe copyright holder for this preprint (whichthis version posted May 7, 2020. . https://doi.org/10.1101/2020.05.05.078568doi: bioRxiv preprint

24
Bouwhuis, S., B. C. Sheldon, S. Verhulst, and A. Charmantier. 2009. ‘Great Tits Growing Old: Selective Disappearance and the Partitioning of Senescence to Stages within the Breeding Cycle’. Proceedings. Biological Sciences 276 (1668): 2769–77. https://doi.org/10.1098/rspb.2009.0457.
Boyce, Mark S., and C. M. Perrins. 1987. ‘Optimizing Great Tit Clutch Size in a Fluctuating Environment’. Ecology 68 (1): 142–53. https://doi.org/10.2307/1938814.
Burri, Reto. 2017. ‘Interpreting Differentiation Landscapes in the Light of Long-Term Linked Selection’. Evolution Letters 1 (3): 118–31. https://doi.org/10.1002/evl3.14.
Burri, Reto, Alexander Nater, Takeshi Kawakami, Carina F. Mugal, Pall I. Olason, Linnea Smeds, Alexander Suh, et al. 2015. ‘Linked Selection and Recombination Rate Variation Drive the Evolution of the Genomic Landscape of Differentiation across the Speciation Continuum of Ficedula Flycatchers’. Genome Research 25 (11): 1656–65. https://doi.org/10.1101/gr.196485.115.
Caizergues, Aude E., Arnaud Grégoire, and Anne Charmantier. 2018. ‘Urban versus Forest Ecotypes Are Not Explained by Divergent Reproductive Selection’. Proceedings of the Royal Society B: Biological Sciences 285 (1882): 20180261. https://doi.org/10.1098/rspb.2018.0261.
Campbell-Staton, Shane C., Kristin M. Winchell, Nicolas C. Rochette, Jason Fredette, Inbar Maayan, Rena M. Schweizer, and Julian Catchen. 2020. ‘Parallel Selection on Thermal Physiology Facilitates Repeated Adaptation of City Lizards to Urban Heat Islands’. Nature Ecology & Evolution 4 (4): 652–58. https://doi.org/10.1038/s41559-020-1131-8.
Charmantier, Anne, Virginie Demeyrier, Marcel Lambrechts, Samuel Perret, and Arnaud Grégoire. 2017. ‘Urbanization Is Associated with Divergence in Pace-of-Life in Great Tits’. Frontiers in Ecology and Evolution 5. https://doi.org/10.3389/fevo.2017.00053.
Charmantier, Anne, Robin H. McCleery, Lionel R. Cole, Chris Perrins, Loeske E. B. Kruuk, and Ben C. Sheldon. 2008. ‘Adaptive Phenotypic Plasticity in Response to Climate Change in a Wild Bird Population’. Science 320 (5877): 800–803. https://doi.org/10.1126/science.1157174.
Dean, Rebecca, Peter W. Harrison, Alison E. Wright, Fabian Zimmer, and Judith E. Mank. 2015. ‘Positive Selection Underlies Faster-Z Evolution of Gene Expression in Birds’. Molecular Biology and Evolution 32 (10): 2646–56. https://doi.org/10.1093/molbev/msv138.
Delmore, Kira E., Juan S. Lugo Ramos, Benjamin M. Van Doren, Max Lundberg, Staffan Bensch, Darren E. Irwin, and Miriam Liedvogel. 2018. ‘Comparative Analysis Examining Patterns of Genomic Differentiation across Multiple Episodes of Population Divergence in Birds’. Evolution Letters 2 (2): 76–87. https://doi.org/10.1002/evl3.46.
Eden, Eran, Roy Navon, Israel Steinfeld, Doron Lipson, and Zohar Yakhini. 2009. ‘GOrilla: A Tool for Discovery and Visualization of Enriched GO Terms in Ranked Gene Lists’. BMC Bioinformatics 10 (February): 48. https://doi.org/10.1186/1471-2105-10-48.
Frichot, Eric, Sean D. Schoville, Guillaume Bouchard, and Olivier François. 2013. ‘Testing for Associations between Loci and Environmental Gradients Using Latent Factor Mixed Models’. Molecular Biology and Evolution 30 (7): 1687–99. https://doi.org/10.1093/molbev/mst063.
Gautier, Mathieu. 2015. ‘Genome-Wide Scan for Adaptive Divergence and Association with Population-Specific Covariates’. Genetics 201 (4): 1555–79. https://doi.org/10.1534/genetics.115.181453.
Gautier, Mathieu, Alexander Klassmann, and Renaud Vitalis. 2017. ‘Rehh 2.0: A Reimplementation of the R Package Rehh to Detect Positive Selection from Haplotype Structure’. Molecular Ecology Resources 17 (1): 78–90. https://doi.org/10.1111/1755-0998.12634.
Gazda, Malgorzata A., Pedro Andrade, Sandra Afonso, Jolita Dilyte, John P. Archer, Ricardo J. Lopes, Rui Faria, and Miguel Carneiro. 2018. ‘Signatures of Selection on Standing Genetic Variation Underlie Athletic and Navigational Performance in Racing Pigeons’. Molecular Biology and Evolution 35 (5): 1176–89. https://doi.org/10.1093/molbev/msy030.
Gienapp, Phillip, Veronika N. Laine, A. C. Mateman, Kees van Oers, and Marcel E. Visser. 2017. ‘Environment-Dependent Genotype-Phenotype Associations in Avian Breeding Time’. Frontiers in Genetics 8: 102. https://doi.org/10.3389/fgene.2017.00102.
Harris, Stephen E., and Jason Munshi-South. 2017. ‘Signatures of Positive Selection and Local Adaptation to Urbanization in White-Footed Mice (Peromyscus Leucopus)’. Molecular Ecology 26 (22): 6336–50. https://doi.org/10.1111/mec.14369.
Hendry, Andrew P., Thomas J. Farrugia, and Michael T. Kinnison. 2008. ‘Human Influences on Rates of Phenotypic Change in Wild Animal Populations’. Molecular Ecology 17 (1): 20–29. https://doi.org/10.1111/j.1365-294X.2007.03428.x.
.CC-BY-ND 4.0 International licensewas not certified by peer review) is the author/funder. It is made available under aThe copyright holder for this preprint (whichthis version posted May 7, 2020. . https://doi.org/10.1101/2020.05.05.078568doi: bioRxiv preprint

25
Hendry, Andrew P., Kiyoko M. Gotanda, and Erik I. Svensson. 2017. ‘Human Influences on Evolution, and the Ecological and Societal Consequences’. Philosophical Transactions of the Royal Society of London. Series B, Biological Sciences 372 (1712). https://doi.org/10.1098/rstb.2016.0028.
Isaksson, C., J. Sturve, B. C. Almroth, and S. Andersson. 2009. ‘The Impact of Urban Environment on Oxidative Damage (TBARS) and Antioxidant Systems in Lungs and Liver of Great Tits, Parus Major’,. Environmental Research 109 (1): 46–50. https://doi.org/10.1016/j.envres.2008.10.006.
Ishida, Chiho, Takao Makifuchi, Shinji Saiki, Genjiro Hirose, and Masahito Yamada. 2009. ‘A Neuropathological Study of Autosomal-Dominant Chorea-Acanthocytosis with a Mutation of VPS13A’. Acta Neuropathologica 117 (1): 85–94. https://doi.org/10.1007/s00401-008-0403-1.
Jacobs, Arne, Madeleine Carruthers, Andrey Yurchenko, Natalia V. Gordeeva, Sergey S. Alekseyev, Oliver Hooker, Jong S. Leong, et al. 2020. ‘Parallelism in Eco-Morphology and Gene Expression despite Variable Evolutionary and Genomic Backgrounds in a Holarctic Fish’. PLOS Genetics 16 (4): e1008658. https://doi.org/10.1371/journal.pgen.1008658.
Johnson, Marc T. J., and Jason Munshi-South. 2017. ‘Evolution of Life in Urban Environments’. Science (New York, N.Y.) 358 (6363). https://doi.org/10.1126/science.aam8327.
Kim, J. M., A. W. Santure, H. J. Barton, J. L. Quinn, E. F. Cole, M. E. Visser, B. C. Sheldon, M. A.M. Groenen, K. van Oers, and J. Slate. 2018. ‘A High-Density SNP Chip for Genotyping Great Tit (Parus Major) Populations and Its Application to Studying the Genetic Architecture of Exploration Behaviour’. Molecular Ecology Resources 18 (4): 877–891. https://doi.org/10.1111/1755-0998.12778.
Krebs, John R. 1971. ‘Territory and Breeding Density in the Great Tit, Parus Major L.’ Ecology 52 (1): 2–22. https://doi.org/10.2307/1934734.
Laine, Veronika N., Toni I. Gossmann, Kyle M. Schachtschneider, Colin J. Garroway, Ole Madsen, Koen J.F. Verhoeven, Victor De Jager, et al. 2016. ‘Evolutionary Signals of Selection on Cognition from the Great Tit Genome and Methylome’. Nature Communications 7: 1–9. https://doi.org/10.1038/ncomms10474.
Lemoine, Mélissa, Kay Lucek, Charles Perrier, Verena Saladin, Frank Adriaensen, Emilio Barba, Eduardo J. Belda, et al. 2016. ‘Low but Contrasting Neutral Genetic Differentiation Shaped by Winter Temperature in European Great Tits’. Biological Journal of the Linnean Society 118 (3): 668–85. https://doi.org/10.1111/bij.12745.
Mehlhorn, Julia, Burkhard Haastert, and Gerd Rehkämper. 2010. ‘Asymmetry of Different Brain Structures in Homing Pigeons with and without Navigational Experience’. The Journal of Experimental Biology 213 (Pt 13): 2219–24. https://doi.org/10.1242/jeb.043208.
Meier, Joana Isabel, David Alexander Marques, Catherine Elise Wagner, Laurent Excoffier, and Ole Seehausen. 2018. ‘Genomics of Parallel Ecological Speciation in Lake Victoria Cichlids’. Molecular Biology and Evolution 35 (6): 1489–1506. https://doi.org/10.1093/molbev/msy051.
Møller, A. P., and J. D. Ibáñez-Álamo. 2012. ‘Escape Behaviour of Birds Provides Evidence of Predation Being Involved in Urbanization’. Animal Behaviour 84 (2): 341–48. https://doi.org/10.1016/j.anbehav.2012.04.030.
Mueller, J. C., J. Partecke, B. J. Hatchwell, K. J. Gaston, and K. L. Evans. 2013. ‘Candidate Gene Polymorphisms for Behavioural Adaptations during Urbanization in Blackbirds’. Molecular Ecology 22 (13): 3629–3637. https://doi.org/10.1111/mec.12288.
Mueller, Jakob C., Martina Carrete, Stefan Boerno, Heiner Kuhl, José L. Tella, and Bart Kempenaers. n.d. ‘Genes Acting in Synapses and Neuron Projections Are Early Targets of Selection during Urban Colonization’. Molecular Ecology n/a (n/a). Accessed 21 April 2020. https://doi.org/10.1111/mec.15451.
Paradis, Emmanuel, Stephen R. Baillie, William J. Sutherland, and Richard D. Gregory. 1998. ‘Patterns of Natal and Breeding Dispersal in Birds’. Journal of Animal Ecology 67 (4): 518–536. https://doi.org/10.1046/j.1365-2656.1998.00215.x.
Perrier, Charles, Ana Lozano del Campo, Marta Szulkin, Virginie Demeyrier, Arnaud Gregoire, and Anne Charmantier. 2018. ‘Great Tits and the City: Distribution of Genomic Diversity and Gene–Environment Associations along an Urbanization Gradient’. Evolutionary Applications 11 (5): 593–613. https://doi.org/10.1111/eva.12580.
Peter, Beate, Ellen M. Wijsman, Alejandro Q. Nato Jr, University of Washington Center for Mendelian Genomics, Mark M. Matsushita, Kathy L. Chapman, Ian B. Stanaway, et al. 2016. ‘Genetic Candidate Variants in Two Multigenerational Families with Childhood Apraxia of Speech’. PLOS ONE 11 (4): e0153864. https://doi.org/10.1371/journal.pone.0153864.
Pettifor, R. A., C. M. Perrins, and R. H. McCleery. 1988. ‘Individual Optimization of Clutch Size in Great Tits’. Nature 336 (6195): 160–62. https://doi.org/10.1038/336160a0.
.CC-BY-ND 4.0 International licensewas not certified by peer review) is the author/funder. It is made available under aThe copyright holder for this preprint (whichthis version posted May 7, 2020. . https://doi.org/10.1101/2020.05.05.078568doi: bioRxiv preprint

26
Pickrell, Joseph K., and Jonathan K. Pritchard. 2012. ‘Inference of Population Splits and Mixtures from Genome-Wide Allele Frequency Data’. PLoS Genetics 8 (11): e1002967. https://doi.org/10.1371/journal.pgen.1002967.
Pritchard, Jonathan K., Joseph K. Pickrell, and Graham Coop. 2010. ‘The Genetics of Human Adaptation: Hard Sweeps, Soft Sweeps, and Polygenic Adaptation’. Current Biology: CB 20 (4): R208-215. https://doi.org/10.1016/j.cub.2009.11.055.
Purcell, Shaun, Benjamin Neale, Kathe Todd-Brown, Lori Thomas, Manuel A. R. Ferreira, David Bender, Julian Maller, et al. 2007. ‘PLINK: A Tool Set for Whole-Genome Association and Population-Based Linkage Analyses’. American Journal of Human Genetics 81 (3): 559–75. https://doi.org/10.1086/519795.
R Core Team. 2018. ‘R: A Language and Environment for Statistical Computing.’ R Foundation for Statistical Computing, Vienna, Austria.
Rivkin, L. Ruth, James S. Santangelo, Marina Alberti, Myla F. J. Aronson, Charlotte W. de Keyzer, Sarah E. Diamond, Marie-Josée Fortin, et al. 2019. ‘A Roadmap for Urban Evolutionary Ecology’. Evolutionary Applications 12 (3): 384–98. https://doi.org/10.1111/eva.12734.
Salmón, P., J.F. Nilsson, H. Watson, S. Bensch, and C. Isaksson. 2017. ‘Selective Disappearance of Great Tits with Short Telomeres in Urban Areas’. Proceedings of the Royal Society B: Biological Sciences 284 (1862). https://doi.org/10.1098/rspb.2017.1349.
Scheet, Paul, and Matthew Stephens. 2006. ‘A Fast and Flexible Statistical Model for Large-Scale Population Genotype Data: Applications to Inferring Missing Genotypes and Haplotypic Phase’. American Journal of Human Genetics 78 (4): 629–44. https://doi.org/10.1086/502802.
Senar, Juan Carlos, Laszlo Z. Garamszegi, Vallo Tilgar, Clotilde Biard, Gregorio Moreno-Rueda, Pablo Salmón, J. M. Rivas, et al. 2017. ‘Urban Great Tits (Parus Major) Show Higher Distress Calling and Pecking Rates than Rural Birds across Europe’. Frontiers in Ecology and Evolution 5. https://doi.org/10.3389/fevo.2017.00163.
Seress, Gábor, Ágnes Lipovits, Veronika Bókony, and László Czúni. 2014. ‘Quantifying the Urban Gradient: A Practical Method for Broad Measurements’. Landscape and Urban Planning 131: 42–50. https://doi.org/10.1016/j.landurbplan.2014.07.010.
Shannon, Paul, Andrew Markiel, Owen Ozier, Nitin S. Baliga, Jonathan T. Wang, Daniel Ramage, Nada Amin, Benno Schwikowski, and Trey Ideker. 2003. ‘Cytoscape: A Software Environment for Integrated Models of Biomolecular Interaction Networks’. Genome Research 13 (11): 2498–2504. https://doi.org/10.1101/gr.1239303.
Sih, Andrew, and Marco Del Giudice. 2012. ‘Linking Behavioural Syndromes and Cognition: A Behavioural Ecology Perspective’. Philosophical Transactions of the Royal Society of London. Series B, Biological Sciences 367 (1603): 2762–72. https://doi.org/10.1098/rstb.2012.0216.
Slabbekoorn, Hans, and Ardie den Boer-Visser. 2006. ‘Cities Change the Songs of Birds’. Current Biology 16 (23): 2326–31. https://doi.org/10.1016/j.cub.2006.10.008.
Sol, Daniel, Oriol Lapiedra, and Cesar González-Lagos. 2013. ‘Behavioural Adjustments for a Life in the City’. Animal Behaviour, Including Special Section: Behavioural Plasticity and Evolution, 85 (5): 1101–12. https://doi.org/10.1016/j.anbehav.2013.01.023.
Sprau, Philipp, Alexia Mouchet, and Niels J. Dingemanse. 2017. ‘Multidimensional Environmental Predictors of Variation in Avian Forest and City Life Histories’. Behavioral Ecology 28 (1): 59–68. https://doi.org/10.1093/beheco/arw130.
Spurgin, Lewis G., Mirte Bosse, Frank Adriaensen, Tamer Albayrak, Christos Barboutis, Eduardo Belda, Andrey Bushuev, et al. 2019. ‘The Great Tit HapMap Project: A Continental-Scale Analysis of Genomic Variation in a Songbird’. BioRxiv, February, 561399. https://doi.org/10.1101/561399.
Tang, Kun, Kevin R. Thornton, and Mark Stoneking. 2007. ‘A New Approach for Using Genome Scans to Detect Recent Positive Selection in the Human Genome’. PLoS Biology 5 (7): e171. https://doi.org/10.1371/journal.pbio.0050171.
Toews, David P. L., Scott A. Taylor, Henry M. Streby, Gunnar R. Kramer, and Irby J. Lovette. 2019. ‘Selection on VPS13A Linked to Migration in a Songbird’. Proceedings of the National Academy of Sciences 116 (37): 18272–74. https://doi.org/10.1073/pnas.1909186116.
Uetani, Noriko, Kunio Kato, Hiro Ogura, Kazuya Mizuno, Kano Kawano, Katsuhiko Mikoshiba, Hidetaka Yakura, Masahide Asano, and Yoichiro Iwakura. 2000. ‘Impaired Learning with Enhanced Hippocampal Long-Term Potentiation in PTPδ-Deficient Mice’. The EMBO Journal 19 (12): 2775–85. https://doi.org/10.1093/emboj/19.12.2775.
.CC-BY-ND 4.0 International licensewas not certified by peer review) is the author/funder. It is made available under aThe copyright holder for this preprint (whichthis version posted May 7, 2020. . https://doi.org/10.1101/2020.05.05.078568doi: bioRxiv preprint

27
Wang, Jing, Suhas Vasaikar, Zhiao Shi, Michael Greer, and Bing Zhang. 2017. ‘WebGestalt 2017: A More Comprehensive, Powerful, Flexible and Interactive Gene Set Enrichment Analysis Toolkit’. Nucleic Acids Research 45 (W1): W130–37. https://doi.org/10.1093/nar/gkx356.
Weir, B. S., and C. Clark Cockerham. 1984. ‘Estimating F-Statistics for the Analysis of Population Structure’. Evolution 38 (6): 1358–70. https://doi.org/10.2307/2408641.
Yi, Xin, Yu Liang, Emilia Huerta-Sanchez, Xin Jin, Zha Xi Ping Cuo, John E. Pool, Xun Xu, et al. 2010. ‘Sequencing of 50 Human Exomes Reveals Adaptation to High Altitude’. Science 329 (5987): 75–78. https://doi.org/10.1126/science.1190371.
Zhang, Shao-jie, Guo-Dong Wang, Pengcheng Ma, Liang-liang Zhang, Ting-Ting Yin, Yan-hu Liu, Newton O. Otecko, et al. 2020. ‘Genomic Regions under Selection in the Feralization of the Dingoes’. Nature Communications 11 (1): 1–10. https://doi.org/10.1038/s41467-020-14515-6.
Zheng, Xiuwen, David Levine, Jess Shen, Stephanie M. Gogarten, Cathy Laurie, and Bruce S. Weir. 2012. ‘A High-Performance Computing Toolset for Relatedness and Principal Component Analysis of SNP Data’. Bioinformatics (Oxford, England) 28 (24): 3326–28. https://doi.org/10.1093/bioinformatics/bts606.
Acknowledgements: We are truly thankful to J. Pérez-Tris, J. Ignacio Aguirre de Miguel, M.
Morganti, ringers from La Herreria and Lago di Pusiano, V. Encarnação, A. Mouchet and Pardal
family. We also thank V.N. Laine, A. Herrera-Dueñas and A.C. Mateman for their help during
data extraction and formatting and laboratory work and M. Bosse for comments on an early
version of the manuscript. Funding: was provided by the Swedish Research Council C0361301
and Marie Curie Career Integration Grant FP7-CIG ID:322217 (to C.I.), Ministry of Economics
and Competiveness (CGL-2016-79568-C3-3-P to J.C.S). Authors contribution: C.I. and P.S.
conceived the study. P.S. collected and coordinated the sample collection with additions from
C.B., N.D., D.M.D., B.H., J.C. and Ph.S. The data analysis was carried out by A.J. and P.S. with
help from M.L., D.A. and M.E.V. C.I., A.J. and P.S. drafted the initial manuscript with input
from all the other authors. Competing interest: all the authors declare not having any competing
interest.
.CC-BY-ND 4.0 International licensewas not certified by peer review) is the author/funder. It is made available under aThe copyright holder for this preprint (whichthis version posted May 7, 2020. . https://doi.org/10.1101/2020.05.05.078568doi: bioRxiv preprint

1
Supplementary Materials for
Repeated genomic signatures of adaptation to urbanisation in a songbird across
Europe
Pablo Salmón†, Arne Jacobs†, Dag Ahrén, Clotilde Biard, Niels J. Dingemanse, Davide Dominoni, Barbara Helm,
Max Lundberg, Juan Carlos Senar, Philipp Sprau, Marcel Visser and Caroline Isaksson.
† Both authors contributed equally
Correspondence to: [email protected]
.CC-BY-ND 4.0 International licensewas not certified by peer review) is the author/funder. It is made available under aThe copyright holder for this preprint (whichthis version posted May 7, 2020. . https://doi.org/10.1101/2020.05.05.078568doi: bioRxiv preprint
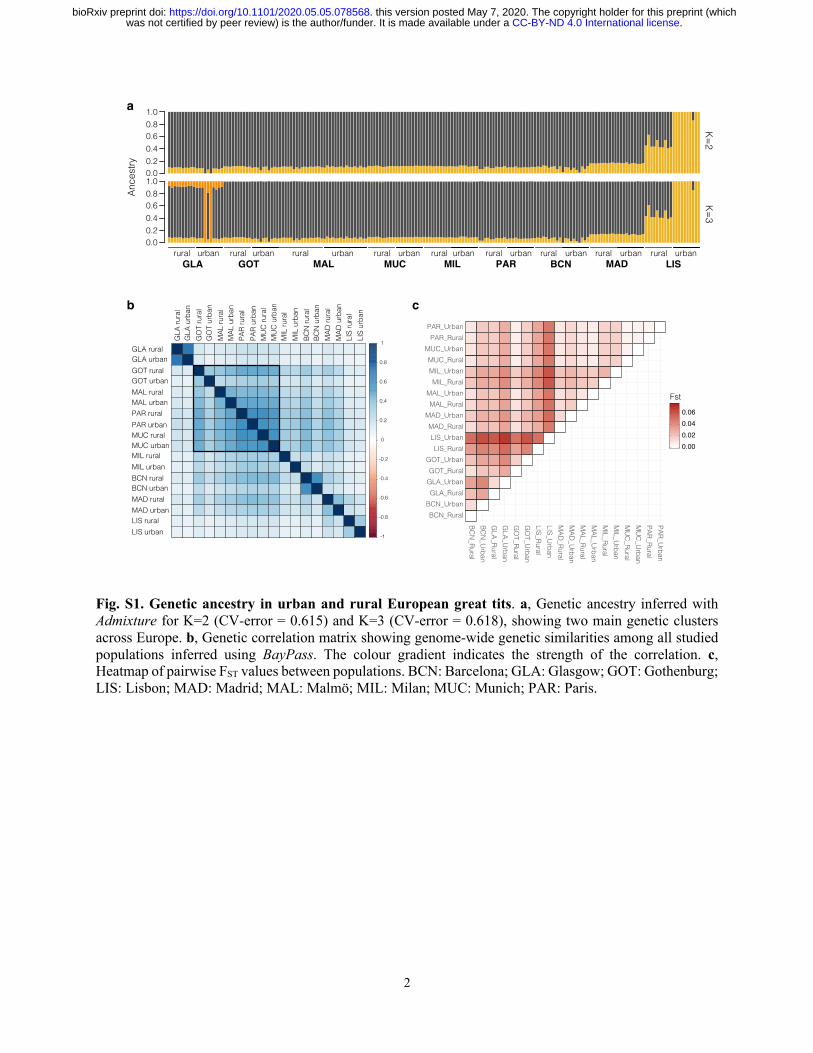
2
Fig. S1. Genetic ancestry in urban and rural European great tits. a, Genetic ancestry inferred with Admixture for K=2 (CV-error = 0.615) and K=3 (CV-error = 0.618), showing two main genetic clusters across Europe. b, Genetic correlation matrix showing genome-wide genetic similarities among all studied populations inferred using BayPass. The colour gradient indicates the strength of the correlation. c, Heatmap of pairwise FST values between populations. BCN: Barcelona; GLA: Glasgow; GOT: Gothenburg; LIS: Lisbon; MAD: Madrid; MAL: Malmö; MIL: Milan; MUC: Munich; PAR: Paris.
*27VSCBOSVSBM VSCBOSVSBM SVSBM VSCBO VSCBOSVSBM VSCBOSVSBM VSCBOSVSBM VSCBOSVSBM VSCBOSVSBMVSCBOSVSBM
0$/*/$ 08& 0,/ 3$5 %&1 0$' /,6
������������������
������������������
"ODF
TUSZ
,��,��
D
��
����
����
����
����
�
���
���
���
���
�(-" SVSBM(-" VSCBO(05 SVSBM(05 VSCBO."- SVSBM."- VSCBO1"3 SVSBM1"3 VSCBO.6$ SVSBM.6$ VSCBO.*- SVSBM.*- VSCBO#$/ SVSBM#$/ VSCBO."% SVSBM."% VSCBO-*4 SVSBM-*4 VSCBO
(-"
SVSBM
(-"
VSCB
O(05SVSBM
(05VSCB
O."-
SVSBM
."-
VSCB
O1"
3SVSBM
1"3VSCB
O.6$
SVSBM
.6$
VSCB
O.*-
SVSBM
.*-
VSCB
O#$
/SVSBM
#$/
VSCB
O."%
SVSBM
."%
VSCB
O-*4SVSBM
-*4VSCB
OE F
#$/@3VSBM#$/@6SCBO(-"@3VSBM(-"@6SCBO(05@3VSBM(05@6SCBO
-*4@3VSBM-*4@6SCBO."%@3VSBM."%@6SCBO."-@3VSBM."-@6SCBO.*-@3VSBM.*[email protected][email protected]$@6SCBO1"3@3VSBM1"3@6SCBO
#$/@3VSBM
#$/@6
SCBO(-"@3VSBM
(-"@6
SCBO(05@3VSBM
(05@6
SCBO-*4@3VSBM-*4@6
SCBO."%
@3VSBM."%
@6SCBO
."-@3VSBM
."-@6
SCBO.*-@3VSBM
.*-@6
SCBO.6$@3VSBM
.6$@6
SCBO1"3@3VSBM1"3@6
SCBO
����������������
'TU
.CC-BY-ND 4.0 International licensewas not certified by peer review) is the author/funder. It is made available under aThe copyright holder for this preprint (whichthis version posted May 7, 2020. . https://doi.org/10.1101/2020.05.05.078568doi: bioRxiv preprint

3
Fig. S2. Population structure of European great tits. a, Principal component plots displaying the divergence of great tit populations along eigenvectors 3–12 (PCGen). b, Percentage of total variance explained by the first 12 principal components. The dashed grey line indicates the number of eigenvectors used for population structure correction in LFMM based on the flattening of the distribution (K=2-4).
����
���
���
���
��� ��� ���
���
���
���
���� ��� ��� ��� ���
����
���
���
���
���� ��� �������
����
���
���
����� ���� ���� ����
����
����
���
���
���� ���� ���� ��� ��� ��� ���3&��
3&��
3&�
-JTCPO
#BSDFMPOB(MBTHPX(PUIFOCVSH
.BESJE
.BMNÚ
.JMBO
.VOJDI1BSJT
3VSBM6SCBO
3&� 3&�
3&�
3&�
3&��
3&�
3&�
Ɣ
Ɣ
Ɣ
ƔƔ
Ɣ ƔƔ
Ɣ ƔƔ Ɣ
���
���
���
���
���
���
� � ��3& D[HV
9DULDQFHH[SODLQHG>SHUFHQW@
D
E
.CC-BY-ND 4.0 International licensewas not certified by peer review) is the author/funder. It is made available under aThe copyright holder for this preprint (whichthis version posted May 7, 2020. . https://doi.org/10.1101/2020.05.05.078568doi: bioRxiv preprint

4
Fig. S3. Treemix maximum-likelihood trees. a, Allele frequency based unrooted maximum-likelihood Treemix trees including one, two, three, four and five migration edges. The colour of the arrows shows the migration weight for gene flow events between branches. b, Proportion of variance explained by models with zero to five migration edges. Note the reduced rate of increase after adding one migration event.
%SJGU QBSBNFUFS
."%(-"
#$/
.JHSBUJP
OXFJHI
U
�
���
��� ����� ����� ����� �����
-*4
.6$
(051"3
.*-."-
%SJGU QBSBNFUFS��� ����� ����� ����� �����
.*-
(05
."%
-*4
(-"
#$/
1"3
.6$
."-
%SJGU QBSBNFUFS��� ����� ����� ����� �����
."%
08&
-*4
(-"
#$/
.*-
1"3
(05
.6$
."-
%SJGU QBSBNFUFS��� ����� ����� �����
."%
1"3
(05
-*4
."-
.*-
.6$
(-"
#$/
%SJGU QBSBNFUFS��� ����� ����� �����
."%
-*4
(-"
#$/
.*-
1"3
(05
.6$
."-
Ɣ
Ɣ Ɣ ƔƔ Ɣ
�����
�����
�����
� � � � � �/VNCFS PG mUUFE NJHSBUJPO FWFOUT
7BSJB
ODFPG
SFMBUFEO
FTTFY
QMBJOF
E
D
E
.CC-BY-ND 4.0 International licensewas not certified by peer review) is the author/funder. It is made available under aThe copyright holder for this preprint (whichthis version posted May 7, 2020. . https://doi.org/10.1101/2020.05.05.078568doi: bioRxiv preprint

5
Fig. S4. PCA based on LFMM and “Core urbanisation SNPs”. The first two principal component axis are shown (Percentage of total variance explained), based on a, LFMM candidate SNPs (N=2,758) and b, shared “core urbanisation SNPs” between LFMM and BayPass (N=34).
������������
���
���
���
���
���
���
1SJODJQB
MDPN
QPOF
OU������
1SJODJQBM DPNQPOFOU � �����
1SJODJQB
MDPN
QPOF
OU������
1SJODJQBM DPNQPOFOU � ������
����
����
���
���
���
���� ��� ��� ���
D E
-JTCPO
#BSDFMPOB(MBTHPX(PUIFOCVSH
.BESJE
.BMNÚ
.JMBO
.VOJDI1BSJT
3VSBM6SCBO
.CC-BY-ND 4.0 International licensewas not certified by peer review) is the author/funder. It is made available under aThe copyright holder for this preprint (whichthis version posted May 7, 2020. . https://doi.org/10.1101/2020.05.05.078568doi: bioRxiv preprint

6
Fig. S5. Differences in allele frequency between urban and rural populations in the “core urbanisation SNPs”. Minor allele frequency (MAF) trajectories between urban and rural populations for all “core urbanisation SNPs” (N = 34). The Affx-number in the header shows the name for each SNP on the Affymetrix SNP-chip used for the genotyping of all individuals in this study.
"GGY¦��������� "GGY¦��������� "GGY¦��������� "GGY¦���������
"GGY¦��������� "GGY¦��������� "GGY¦��������� "GGY¦��������� "GGY¦��������� "GGY¦���������
"GGY¦��������� "GGY¦��������� "GGY¦��������� "GGY¦��������� "GGY¦��������� "GGY¦���������
"GGY¦��������� "GGY¦��������� "GGY¦��������� "GGY¦��������� "GGY¦��������� "GGY¦���������
"GGY¦��������� "GGY¦��������� "GGY¦��������� "GGY¦��������� "GGY¦��������� "GGY¦���������
"GGY¦��������� "GGY¦��������� "GGY¦��������� "GGY¦��������� "GGY¦��������� "GGY¦���������
SVSBMVSCBO
����
����
����
����
����
����
����
����
����
����
����
����
����
����
����
����
����
����
����
����
����
����
����
����
.JOPS
BMMFMF
GSFRV
FODZ
-JTCPO
#BSDFMPOB(MBTHPX(PUIFOCVSH
.BESJE
.BMNÚ
.JMBO
.VOJDI1BSJT
SVSBMVSCBO SVSBMVSCBO SVSBMVSCBO
SVSBM SVSBMVSCBOVSCBO
.CC-BY-ND 4.0 International licensewas not certified by peer review) is the author/funder. It is made available under aThe copyright holder for this preprint (whichthis version posted May 7, 2020. . https://doi.org/10.1101/2020.05.05.078568doi: bioRxiv preprint

7
Fig. S6. FST Manhattan plots. Manhattan plots showing the FST values (200 kb sliding windows with 50 kb steps) between urban and rural individuals across the genome for each population pair (urban-centre). The red dashed line shows the 99th percentile of the FST distribution for each population pair.
.CC-BY-ND 4.0 International licensewas not certified by peer review) is the author/funder. It is made available under aThe copyright holder for this preprint (whichthis version posted May 7, 2020. . https://doi.org/10.1101/2020.05.05.078568doi: bioRxiv preprint

8
Fig. S7. PBS Manhattan plots with LIS rural as outgroup. Manhattan plots showing the window-based PBS score (200 kb windows with 50 kb steps) between urban and rural individuals across the genome for each population pair (urban-centre). PBS scores were calculated using the rural population from Lisbon as an outgroup., PBS for Lisbon was calculated using GLA rural as the outgroup. The dashed lines show the 99th percentile of the PBS distribution.
.CC-BY-ND 4.0 International licensewas not certified by peer review) is the author/funder. It is made available under aThe copyright holder for this preprint (whichthis version posted May 7, 2020. . https://doi.org/10.1101/2020.05.05.078568doi: bioRxiv preprint

9
Fig. S8. PBS Manhattan plots with GLA rural as outgroup. Manhattan plots showing the window-based PBS score (200 kb windows with 50 kb steps) between urban and rural individuals across the genome for each population pair (urban-centre). PBS scores were calculated using the rural population from Glasgow as an outgroup. PBS scores are shown for all population pairs except Glasgow and Lisbon. The dashed lines show the 99th percentile of the PBS distribution.
.CC-BY-ND 4.0 International licensewas not certified by peer review) is the author/funder. It is made available under aThe copyright holder for this preprint (whichthis version posted May 7, 2020. . https://doi.org/10.1101/2020.05.05.078568doi: bioRxiv preprint
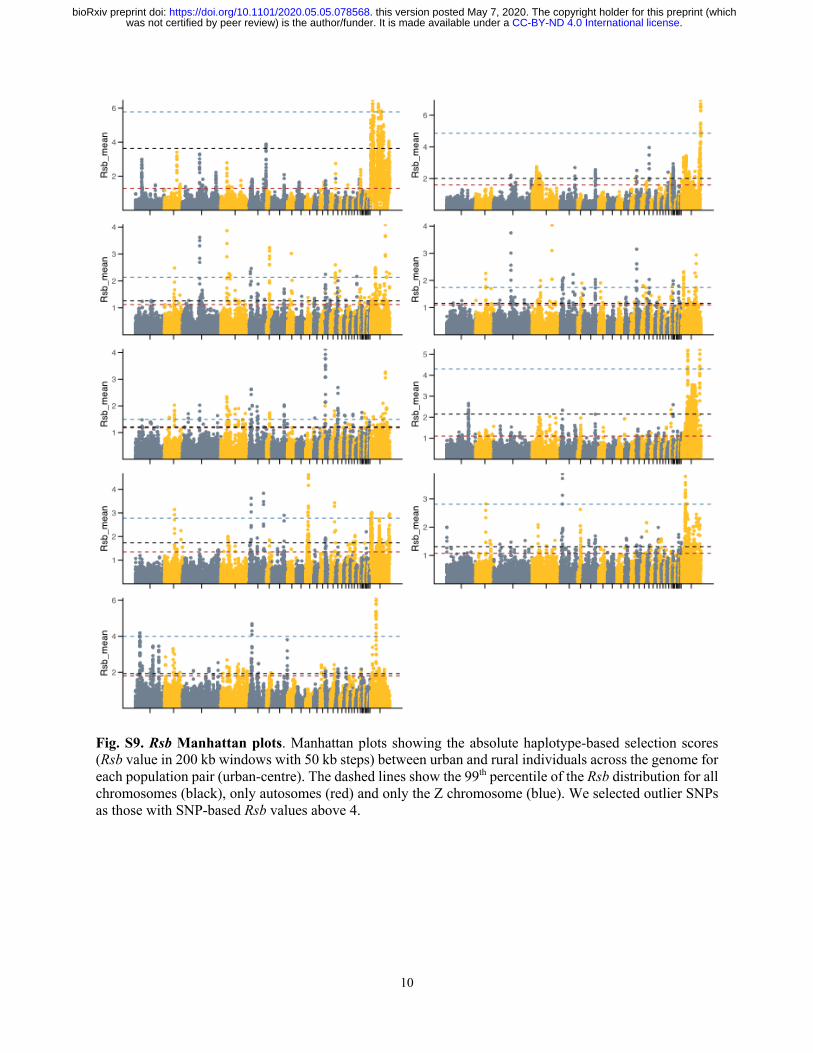
10
Fig. S9. Rsb Manhattan plots. Manhattan plots showing the absolute haplotype-based selection scores (Rsb value in 200 kb windows with 50 kb steps) between urban and rural individuals across the genome for each population pair (urban-centre). The dashed lines show the 99th percentile of the Rsb distribution for all chromosomes (black), only autosomes (red) and only the Z chromosome (blue). We selected outlier SNPs as those with SNP-based Rsb values above 4.
.CC-BY-ND 4.0 International licensewas not certified by peer review) is the author/funder. It is made available under aThe copyright holder for this preprint (whichthis version posted May 7, 2020. . https://doi.org/10.1101/2020.05.05.078568doi: bioRxiv preprint

11
Fig. S10. Correlation plot of absolute Rsb values across populations. Shown are spearman correlations between absolute SNP-based Rsb values across all population pairs. Spearman correlations were uniformly low across populations, ranging from 0.08 to 0.013.
.CC-BY-ND 4.0 International licensewas not certified by peer review) is the author/funder. It is made available under aThe copyright holder for this preprint (whichthis version posted May 7, 2020. . https://doi.org/10.1101/2020.05.05.078568doi: bioRxiv preprint

12
Fig. S11. Correlation of PBS and LDurb-PC1 for each population. LD was calculated and summarised across all urban populations.
.CC-BY-ND 4.0 International licensewas not certified by peer review) is the author/funder. It is made available under aThe copyright holder for this preprint (whichthis version posted May 7, 2020. . https://doi.org/10.1101/2020.05.05.078568doi: bioRxiv preprint

13
Fig. S12. Signatures of selection around the PTPRD gene. Rsb scores for each SNP around and within the PTPRD gene (grey box) on the Z chromosome by locality, including loess smoothed values (span = 0.2). The upper and lower dashed lines show significance thresholds for signs of selection, respectively. BCN: Barcelona; GLA: Glasgow; GOT: Gothenburg; LIS: Lisbon; MAD: Madrid; MAL: Malmö; MIL: Milan; MUC: Munich; PAR: Paris.
-5
0
5
2.7e+07 2.8e+07 2.9e+07 3.0e+07
Rsb
GLA
-5
0
5
2.7e+07 2.8e+07 2.9e+07 3.0e+07
Rsb
GOT
-5
0
5
2.7e+07 2.8e+07 2.9e+07 3.0e+07
Rsb
MAL
-5
0
5
2.7e+07 2.8e+07 2.9e+07 3.0e+07
Rsb
PAR
-5
0
5
2.7e+07 2.8e+07 2.9e+07 3.0e+07
Rsb
MUC
-5
0
5
2.7e+07 2.8e+07 2.9e+07 3.0e+07
Rsb
MIL
-5
0
5
2.7e+07 2.8e+07 2.9e+07 3.0e+07
Rsb
BCN
-5
0
5
2.7e+07 2.8e+07 2.9e+07 3.0e+07chromosome Z
Rsb
MAD
-5
0
5
2.7e+07 2.8e+07 2.9e+07 3.0e+07chromosome Z
Rsb
LIS
.CC-BY-ND 4.0 International licensewas not certified by peer review) is the author/funder. It is made available under aThe copyright holder for this preprint (whichthis version posted May 7, 2020. . https://doi.org/10.1101/2020.05.05.078568doi: bioRxiv preprint
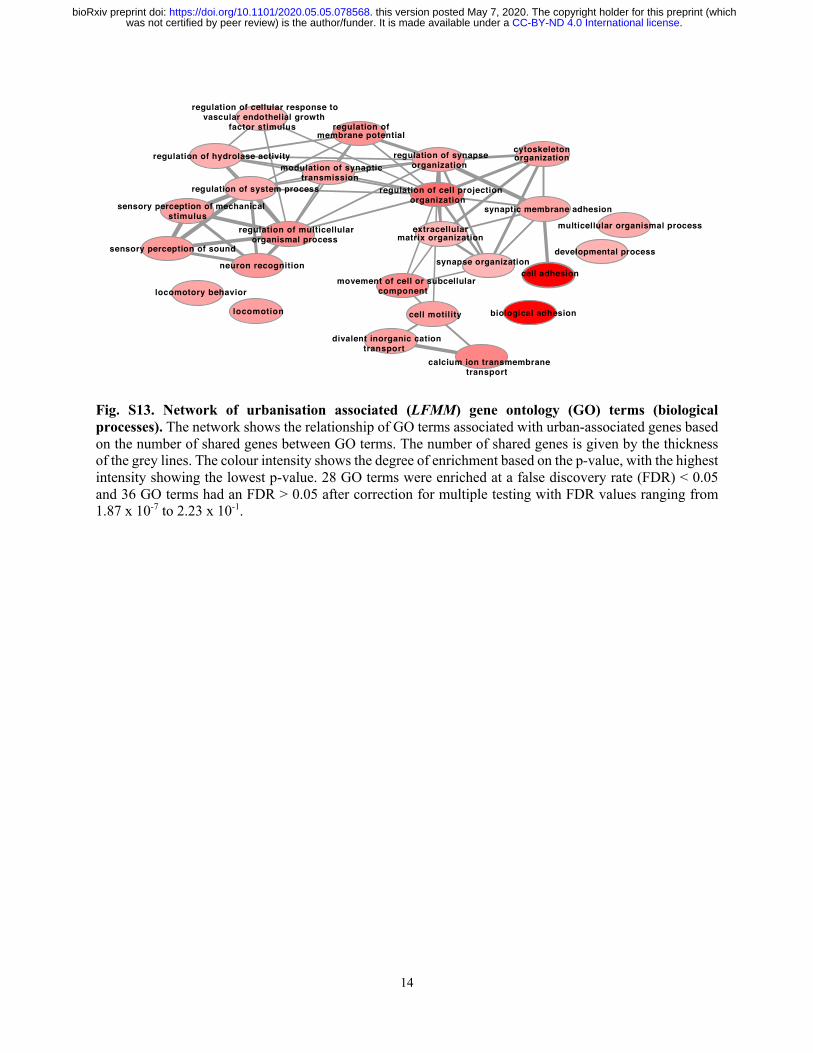
14
Fig. S13. Network of urbanisation associated (LFMM) gene ontology (GO) terms (biological processes). The network shows the relationship of GO terms associated with urban-associated genes based on the number of shared genes between GO terms. The number of shared genes is given by the thickness of the grey lines. The colour intensity shows the degree of enrichment based on the p-value, with the highest intensity showing the lowest p-value. 28 GO terms were enriched at a false discovery rate (FDR) < 0.05 and 36 GO terms had an FDR > 0.05 after correction for multiple testing with FDR values ranging from 1.87 x 10⁻⁷ to 2.23 x 10⁻¹.
QHXURQ UHFRJQLWLRQ
ORFRPRWRU\ EHKDYLRUPRYHPHQW RI FHOO RU VXEFHOOXODU
FRPSRQHQW
GLYDOHQW LQRUJDQLF FDWLRQWUDQVSRUW
ORFRPRWLRQ
F\WRVNHOHWRQRUJDQL]DWLRQ
GHYHORSPHQWDO SURFHVV
PXOWLFHOOXODU RUJDQLVPDO SURFHVV
UHJXODWLRQ RI V\QDSVHRUJDQL]DWLRQ
UHJXODWLRQ RI FHOO SURMHFWLRQRUJDQL]DWLRQ
H[WUDFHOOXODUPDWUL[ RUJDQL]DWLRQ
V\QDSWLF PHPEUDQH DGKHVLRQ
VHQVRU\ SHUFHSWLRQ RI VRXQG
UHJXODWLRQ RI V\VWHP SURFHVV
UHJXODWLRQ RI K\GURODVH DFWLYLW\
UHJXODWLRQ RIPHPEUDQH SRWHQWLDO
PRGXODWLRQ RI V\QDSWLFWUDQVPLVVLRQ
UHJXODWLRQ RI FHOOXODU UHVSRQVH WRYDVFXODU HQGRWKHOLDO JURZWK
IDFWRU VWLPXOXV
UHJXODWLRQ RI PXOWLFHOOXODURUJDQLVPDO SURFHVV
VHQVRU\ SHUFHSWLRQ RI PHFKDQLFDOVWLPXOXV
V\QDSVH RUJDQL]DWLRQ
FHOO PRWLOLW\
FDOFLXP LRQ WUDQVPHPEUDQHWUDQVSRUW
ELRORJLFDO DGKHVLRQ
FHOO DGKHVLRQ
.CC-BY-ND 4.0 International licensewas not certified by peer review) is the author/funder. It is made available under aThe copyright holder for this preprint (whichthis version posted May 7, 2020. . https://doi.org/10.1101/2020.05.05.078568doi: bioRxiv preprint

1
Table S1. Locality (city name), year of sampling, season, centred geographical coordinates per site (urban/rural populations), urbanisation degree (PCUrb, positive values indicate higher urbanisation intensity), number of genotyped individuals (n), expected heterozygosity (He), pairwise genetic differentiation (FST) and distance between the urban and rural populations for each of the studied localities. Cities are sorted in alphabetical order.
Urban Rural
City Year Season Coordinates PCUrb n He Coordinates PCUrb n He FST Distance (km)
Barcelona 2015 Winter 41°23'24.0"N 2°11'24.0"E 2.00 10 0.341
41°42'00.0"N 2°21'36.0"E -2.29 10 0.348 0.012 5
Glasgow 2015 Breeding 55°52'48.0"N 4°15'36.0"W 2.96 10 0.337
56°07'12.0"N 4°35'24.0"W -1.71 10 0.344 0.013 33
Gothenburg 2015 Breeding 57°41'24.0"N 11°56'24.0"E 2.13 10 0.342
57°30'00.0"N 12°00'36.0"E -2.39 10 0.350 0.016 25
Lisbon 2014 Post-Breeding
38°44'24.0"N 9°10'48.0"W 0.65 10 0.321
38°51'36.0"N 8°49'48.0"W -1.86 10 0.333 0.050 33
Madrid 2014 Breeding 40°26'24.0"N 3°43'48.0"W 1.60 10 0.344
40°34'12.0"N 4°09'36.0"W -2.05 10 0.348 0.013 39
Malmö 2013 Breeding 55°36'00.0"N 12°59'24.0"E 2.32 16 0.356
55°39'00.0"N 13°34'12.0"E -2.44 16 0.355 0.009 37
Milan 2014 Post-Breeding
45°31'48.0"N 9°12'36.0"E 1.49 10 0.342 45°49'12.0"N
9°17'24.0"E -2.24 10 0.343 0.026 34
Munich 2015 Winter 48°07'48.0"N 1°34'12.0"E
3.39 10 0.350 47°58'12.0"N 11°14'24.0"E
-1.36 10 0.351 0.004 30
Paris 2014 Breeding 48°52'12.0"N 2°10'48.0"E 2.36 10 0.351
48°18'00.0"N 2°39'36.0"E -2.58 10 0.351 0.004 70
Notes: Expected heterozygosity is significantly lower in urban compared to rural great tits in Glasgow, Gothenburg Barcelona, Madrid and Lisbon based on t-tests (P < 0.05).
.CC-BY-ND 4.0 International licensewas not certified by peer review) is the author/funder. It is made available under aThe copyright holder for this preprint (whichthis version posted May 7, 2020. . https://doi.org/10.1101/2020.05.05.078568doi: bioRxiv preprint

1
Table S2. Genes associated with “core urbanisation SNPs”.
Gene symbol Gene name/ Description Selection
(N. localities)
FARP1 FERM, ARH/RhoGEF and pleckstrin domain protein 1 1
CELF2 CUGBP Elav-like family member 2 0
IQGAP2 IQ motif containing GTPase activating protein 2 1
RNF38 ring finger protein 38 2
DACH1 dachshund family transcription factor 1 0
DHCR24 24-dehydrocholesterol reductase 0
SV2C synaptic vesicle glycoprotein 2C 1
AVL9 AVL9 cell migration associated 0
CADM2 cell adhesion molecule 2 0
GABRG3 gamma-aminobutyric acid type A receptor gamma3 subunit 0
DNAI1 dynein axonemal intermediate chain 1 2
NTRK2 neurotrophic receptor tyrosine kinase 2 4
ABCB1 ATP binding cassette subfamily B member 1 0
ELP6 elongator acetyltransferase complex subunit 6 0
ADAMTS12 ADAM metallopeptidase with thrombospondin type 1 motif 12 3 Notes: Selection (N.localities) – Number of urban populations (localities) a particular gene is under selection in based on the haplotype-based selection analysis (Rsb value)
.CC-BY-ND 4.0 International licensewas not certified by peer review) is the author/funder. It is made available under aThe copyright holder for this preprint (whichthis version posted May 7, 2020. . https://doi.org/10.1101/2020.05.05.078568doi: bioRxiv preprint

2
Table S3. Genes putatively under selection in at least four cities based on PBS and/or Rsb. The number gives the number of cities in which a gene was detected to be under selection based on the given summary statistic.
Gene symbol Gene name/Description PBS Rsb PTPRD Protein Tyrosine Phosphatase, Receptor Type D 6 8
GNAQ G protein subunit alpha q 6 5
FOCAD Focadhesin 5 8
CDH18 Cadherin 18 5 5
HACD4 3-hydroxyacyl-CoA dehydratase 4 5 4
GLIS3 GLIS family zinc finger 3 4 7
MLLT3 MLLT3 super elongation complex subunit 4 6
PIP5K1B Phosphatidylinositol-4-phosphate 5-kinase type 1 beta
4 6
PRUNE2 Prune homolog 2 with BCH domain 4 5
VPS13A Vacuolar protein sorting 13 homolog A 4 5
ARID3C AT-rich interaction domain 3C 4 4
DCTN3 Dynactin subunit 3 4 4
DNAI1 Dynein axonemal intermediate chain 1 4 4
ENHO Energy homeostasis associated 4 4
FXN Frataxin 4 4
GALT Galactose-1-phosphate uridylyltransferase 4 4
LOC107215801 Uncharacterized 4 4
LOC107215987 Uncharacterized 4 4
RPP25L Ribonuclease P/MRP subunit p25 like 4 4
SIGMAR1 Sigma non-opioid intracellular receptor 1 4 4
TJP2 Tight junction protein 2 4 4
CEP78 Centrosomal protein 78 4 3
FOXB2 Forkhead box B2 4 3
FREM1 FRAS1 related extracellular matrix 1 4 3
ITGA2 Integrin subunit alpha 2 4 3
LOC107198290 Uncharacterized 4 3
LOC107216175 Uncharacterized 4 3
LOC107216192 Molybdopterin synthase sulfur carrier subunit-like 4 3
LOC107216193 Molybdopterin synthase catalytic subunit 4 3
LOC107216195 Uncharacterized 4 3
LOC107216233 Uncharacterized 4 3
LOC107216234 Uncharacterized 4 3
LOC107216235 Uncharacterized 4 3
SNAPC3 Small nuclear RNA activating complex polypeptide 3
4 3
LOC107198252 Killer cell lectin-like receptor subfamily B member 1B allele B
3 7
.CC-BY-ND 4.0 International licensewas not certified by peer review) is the author/funder. It is made available under aThe copyright holder for this preprint (whichthis version posted May 7, 2020. . https://doi.org/10.1101/2020.05.05.078568doi: bioRxiv preprint

3
LOC107198253 Butyrophilin subfamily 1 member A1-like 3 7
LOC107198254 C-type lectin domain family 2 member B-like 3 7
LOC107198255 E3 ubiquitin-protein ligase TRIM7-like 3 7
LOC107215749 Uncharacterized 3 7
LOC107215825 Glutamine-rich protein 2-like 3 7
PRR16 Proline rich 16 3 7
SLC1A1 SLC1A1 3 7
AP3B1 AP3B1 3 6
LOC107198413 Uncharacterized 3 5
LOC107216267 Uncharacterized 3 5
AKT3 AKT serine/threonine kinase 3 3 4
CCDC171 Coiled-coil domain containing 171 3 4
COL4A6 COL4A6 3 4
KDM4C Lysine demethylase 4C 3 4
LOC107198356 Uncharacterized 3 4
LOC107215808 Interferon kappa-like 3 4
LOC107216174 Phosphodiesterase 4D 3 4
NFIB Nuclear factor I B 3 4
PSIP1 PC4 and SFRS1 interacting protein 1 3 4
.CC-BY-ND 4.0 International licensewas not certified by peer review) is the author/funder. It is made available under aThe copyright holder for this preprint (whichthis version posted May 7, 2020. . https://doi.org/10.1101/2020.05.05.078568doi: bioRxiv preprint
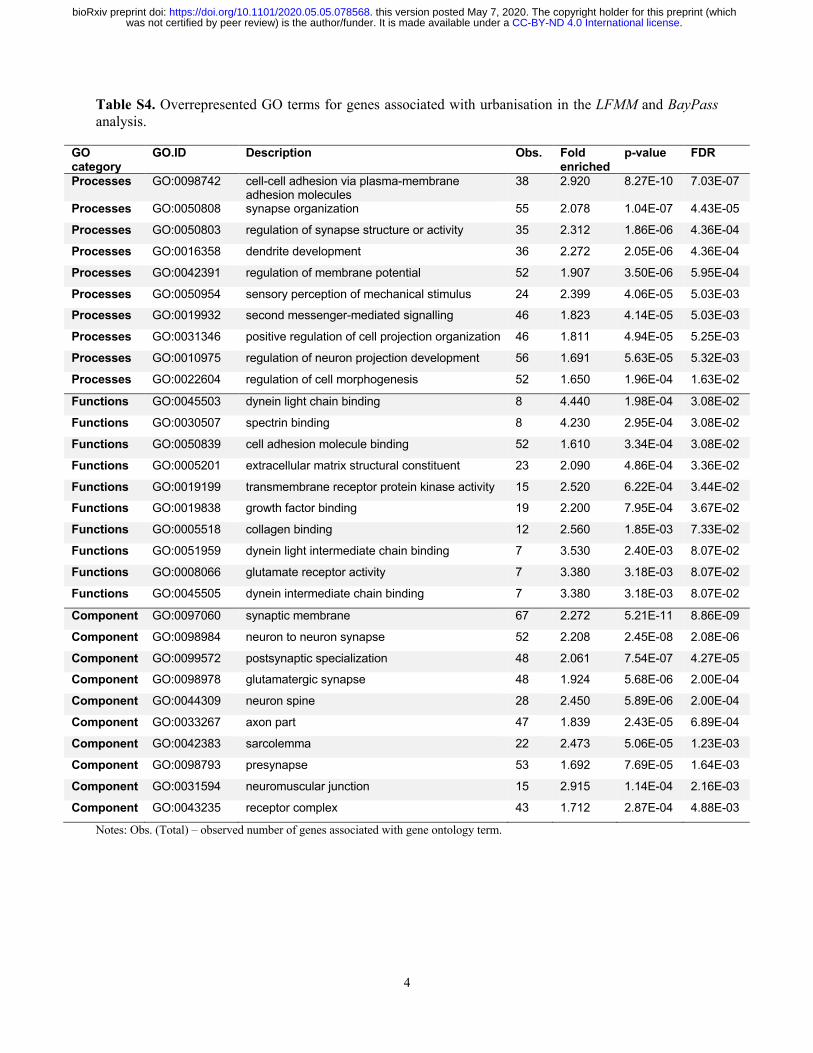
4
Table S4. Overrepresented GO terms for genes associated with urbanisation in the LFMM and BayPass analysis.
GO category
GO.ID Description Obs. Fold enriched
p-value FDR
Processes GO:0098742 cell-cell adhesion via plasma-membrane adhesion molecules
38 2.920 8.27E-10 7.03E-07
Processes GO:0050808 synapse organization 55 2.078 1.04E-07 4.43E-05
Processes GO:0050803 regulation of synapse structure or activity 35 2.312 1.86E-06 4.36E-04
Processes GO:0016358 dendrite development 36 2.272 2.05E-06 4.36E-04
Processes GO:0042391 regulation of membrane potential 52 1.907 3.50E-06 5.95E-04
Processes GO:0050954 sensory perception of mechanical stimulus 24 2.399 4.06E-05 5.03E-03
Processes GO:0019932 second messenger-mediated signalling 46 1.823 4.14E-05 5.03E-03
Processes GO:0031346 positive regulation of cell projection organization 46 1.811 4.94E-05 5.25E-03
Processes GO:0010975 regulation of neuron projection development 56 1.691 5.63E-05 5.32E-03
Processes GO:0022604 regulation of cell morphogenesis 52 1.650 1.96E-04 1.63E-02
Functions GO:0045503 dynein light chain binding 8 4.440 1.98E-04 3.08E-02
Functions GO:0030507 spectrin binding 8 4.230 2.95E-04 3.08E-02
Functions GO:0050839 cell adhesion molecule binding 52 1.610 3.34E-04 3.08E-02
Functions GO:0005201 extracellular matrix structural constituent 23 2.090 4.86E-04 3.36E-02
Functions GO:0019199 transmembrane receptor protein kinase activity 15 2.520 6.22E-04 3.44E-02
Functions GO:0019838 growth factor binding 19 2.200 7.95E-04 3.67E-02
Functions GO:0005518 collagen binding 12 2.560 1.85E-03 7.33E-02
Functions GO:0051959 dynein light intermediate chain binding 7 3.530 2.40E-03 8.07E-02
Functions GO:0008066 glutamate receptor activity 7 3.380 3.18E-03 8.07E-02
Functions GO:0045505 dynein intermediate chain binding 7 3.380 3.18E-03 8.07E-02
Component GO:0097060 synaptic membrane 67 2.272 5.21E-11 8.86E-09
Component GO:0098984 neuron to neuron synapse 52 2.208 2.45E-08 2.08E-06
Component GO:0099572 postsynaptic specialization 48 2.061 7.54E-07 4.27E-05
Component GO:0098978 glutamatergic synapse 48 1.924 5.68E-06 2.00E-04
Component GO:0044309 neuron spine 28 2.450 5.89E-06 2.00E-04
Component GO:0033267 axon part 47 1.839 2.43E-05 6.89E-04
Component GO:0042383 sarcolemma 22 2.473 5.06E-05 1.23E-03
Component GO:0098793 presynapse 53 1.692 7.69E-05 1.64E-03
Component GO:0031594 neuromuscular junction 15 2.915 1.14E-04 2.16E-03
Component GO:0043235 receptor complex 43 1.712 2.87E-04 4.88E-03
Notes: Obs. (Total) – observed number of genes associated with gene ontology term.
.CC-BY-ND 4.0 International licensewas not certified by peer review) is the author/funder. It is made available under aThe copyright holder for this preprint (whichthis version posted May 7, 2020. . https://doi.org/10.1101/2020.05.05.078568doi: bioRxiv preprint