repco home finance initiating coverage capital (nov... · repco home finance initiating coverage. 2...
TRANSCRIPT

REPCO Home Finance
1
November 29, 2013
Find Spark research on Bloomberg (SPAK <go>), Thomson First Call, Reuters Knowledge and Factset
REPCO Home Finance
Initiating Coverage

2
REPCO Home Finance CMP
Rs. 309
Target
Rs. 375
Rating
BUY
Find Spark research on Bloomberg (SPAK <go>), Thomson First Call, Reuters Knowledge and Factset
Stock performance (%)
1m 3m 12m
REPCO 7% 35% N/A
Sensex 0% 14% 9%
Bankex 1% 25% -7%
Date 29 Nov, 2013
Market Data
SENSEX 20535
Nifty 6092
Bloomberg REPCO IN
Shares o/s 62mn
Market Cap Rs. 19bn
52-wk High-Low Rs. 313-158
3m Avg. Daily Vol Rs. 5mn
Index member BSE 500
Latest shareholding (%)
Promoters 37.4
Institutions 18.6
Public 44.0
Initiating Coverage
Jyothi Kumar Varma
+91 44 4344 0033
Abhinesh Vijayaraj
+91 44 4344 0006
Navin Babu
+91 44 4344 0165
Catch them young, watch them grow
Financial summary
Year NII (Rs. mn) PAT(Rs. mn) ROE (%) ROA (%) ABV P/ABV(x)
FY13 1,401 800 17.1% 2.4% 96 3.2
FY14E 1,925 1,212 17.5% 2.9% 113 2.7
FY15E 2,493 1,579 19.2% 2.9% 134 2.3
We see REPCO Home Finance as a multi-year growth play on the theme of low-ticket size, more profitable self-
employed customer segment of housing finance in Southern & Western India. We believe the business has legs
to sustain >25% growth rate with an improving ROE profile (from ~17% to 21% by FY18E) translating into a
strong compounding story in 3-5 year horizon with potential to be a double bagger in a 3-year time frame. Holds
promise of further structural improvements in leverage, ROE and therefore multiples as company demonstrates
its performance overtime in line with peers and wins stake-holder confidence. Initiate coverage with BUY rating
and a TP of Rs. 375 valuing business at 2.7X FY15E ABV.
Key sector thoughts:
• Housing finance to self-employed segment and small ticket size loans remains under penetrated despite regulators
favouring lower ticket size loans by allowing lower risk weights, PSL status and refinancing options at low rates.
• Recently announced cap of 2% in Rural Housing Fund (RHF) refinance window of NHB makes lending sub-optimal
(Rs. 0.2mn to Rs.1.5mn) or not feasible for HFCs operating in the <Rs. 0.2mn segment and may be reversed.
• Under-ownership of houses is higher in Southern and Western India and has increased further in the last decade
Things that we like in REPCO
• In right geographies & preferred lower ticket size market: Presence of close to 90% by branches and 96% by loan
book in Southern and Western geographies. Ticket sizes of REPCO are almost 1/3rd lower than LICHF and close to
half of the ticket size of HDFC at Rs. 1mn.
• Volume driven growth: Loan book growth of 2.5X between FY10-13 has come with healthy 1.8X growth in customers
• Focus on Self- Employed Segment: minimal reliance on DSA channel: 50% of home loan book from self-
employed segment compared to 10-20% of other large players. Owns customers as it does not rely on DSA model.
• Margin buffers to cope with loss of RHF: Upgrade from rating agencies from A+ to AA-; potential liability
diversification to NCD/CP market; securitization (PSL benefit) and increase in proportion of LAP book to 18% by
FY16E from 14% in FY13 would help in absorbing some margin pressure without resorting to rate hike
• Similar ROAs as peers; leverage key difference: Has similar ROA profile as peers but inability to leverage without
impairing rating differentiates it from them. Winning stakeholder confidence and given that GOI ownership of parent
REPCO Bank should help in addressing this issue helping it in improving ROE’s structurally over time. Removal of cap
of 2% on RHF by NHB can add 1.5-2% to structural ROE’s .
3
REPCO Home Finance CMP
Rs. 309
Target
Rs. 375
Rating
BUY
Find Spark research on Bloomberg (SPAK <go>), Thomson First Call, Reuters Knowledge and Factset
Table of Contents
Section Page
Introduction
•Factsheet 4 Click
Industry section
•Housing loans to Self-employed class 6 Click
•Low ticket size loans 7 Click
•Ownership trends in key geographies 8 Click
•Urban Housing ownership 9 Click
•NHB refinance schemes 10 Click
•Lending cap on RHF scheme 11 Click
Company section
•Key valuation drivers 13 Click
•Markets & segments 14 Click
•Margin Sustenance 15-16 Click
•Financial Leverage 17 Click
•Valuation 18 Click
•Crystal gazing 19 Click
•Risks 20 Click
•Financial Summary 21 Click

4
REPCO Home Finance CMP
Rs. 309
Target
Rs. 375
Rating
BUY
Find Spark research on Bloomberg (SPAK <go>), Thomson First Call, Reuters Knowledge and Factset
Factsheet
Corporate Factsheet
Background REPCO is a housing finance company headquartered in Chennai, Tamil Nadu. It was incorporated in April 2000 as a wholly owned
subsidiary of the REPCO Bank Limited, a Government of India enterprise. REPCO BANK was registered in 1969 as a Cooperative Society
with Jurisdiction over the State of Tamil Nadu, Andhra Pradesh, Karnataka, Kerala and Union Territory of Pondicherry for the purpose of
promoting the rehabilitation activities for repatriates from neighbouring countries mainly from Sri Lanka and Burma. It is 80% held by GOI
and other state governments.
Presence REPCO is operating through 82 branches and 20 satellite centres in Tamil Nadu, Andhra Pradesh, Kerala, Karnataka, Maharashtra,
Gujarat, Odisha, West Bengal and Pondicherry.
Management depth Mr. R Varadarajan (Managing Director)
Mr. R Varadarajan began his career with Syndicate Bank and worked in various capacities for around 23 years, and thereafter joined
Repco Bank as General Manager in the year 2000. He became Executive Director during 2006 and took charge as MD in 2010.
Mr. P Natarajan (Executive Director)
Mr. P Natarajan has nearly 30 years of experience in banking services, and previously he was a general manager at REPCO bank.
Mr. V Raghu (Executive Director)
Mr. V Raghu has an MBA & a masters degree in economics, and has prior work experience with NHB & RBI.
Management tenure Mr. R Varadarajan has been with the HFC for 13 years, and played a key role in the initial public offering of REPCO .
Business REPCO derives majority of its business from the four southern states.
Corporate Structure REPCO was incorporated as a wholly owned subsidiary of Repatriates Co-operative Finance and Development Bank Limited. REPCO
bank currently holds 37% stake in the company.
Loan book mix Home loans to Individuals – 84%
Loan against property (Mortgage) – 16%
Key Success Factors Owned Customer base, Operating in relatively niche market and sound underwriting
Capital History IPO in March 2013 raised Rs. 2.3bn
Auditors R Subramanian & Co., Chartered Accountants.

REPCO Home Finance
5
Industry Section

REPCO Home Finance
6
...and number of other challenges
Source: Spark Capital Research
Salary class Non-Salaried Class
Templatization of Lending process
Pooling of customers
Intensity of KYC checks
NPA volatility
Post Disbursement follow-up
Difference in originating fee structures also reflect the same*
Source: Spark Capital Research, * Industry interaction
SE form 50% of work force but only 10-15% of home loans
Source: NSSO, Spark Capital Research
SE segment typically has higher GNPA to salary segment...
Source: Company, Spark Capital Research
# 1. Competition lesser in self employed space (SE); Pricing is better
0.00%
1.00%
2.00%
3.00%
4.00%
5.00%
Dec-11 Mar-12 Jun-12 Sep-12 Dec-12 Mar-13 Jun-13 Sep-13
Salaried segment GNPA Non Salaried segment GNPA
Salaried, 16%
Self employed, 51%
Casual labour, 34%
0
20
40
60
80
100
Sa
lari
ed
Se
lf-e
mp
.
Sa
lari
ed
Se
lf-e
mp
.
Sa
lari
ed
Se
lf-e
mp
.
Sa
lari
ed
Se
lf-e
mp
.
HFC1 HFC2 Bank1 Bank2
Fee
pai
d (
Rs.
tho
usa
nd
s)
Loan amount (Rs.mn) 0.5 1 2 5 10
Favourable Unfavourable
REPCO Home Finance
7
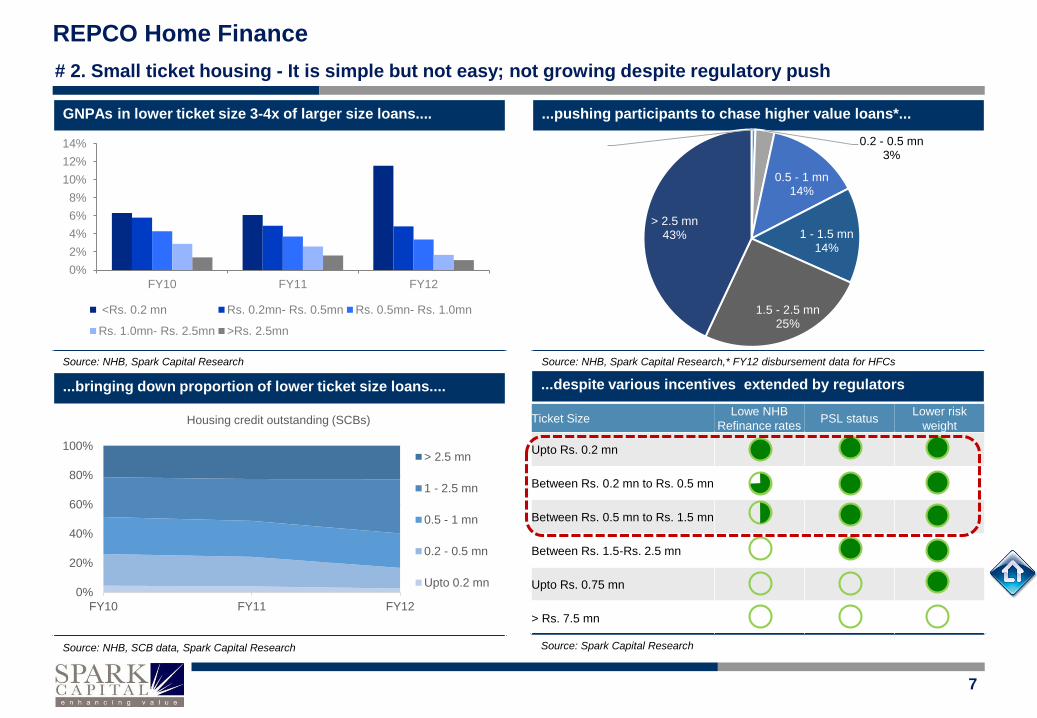
...despite various incentives extended by regulators
Source: Spark Capital Research
Ticket SizeLowe NHB
Refinance ratesPSL status
Lower risk
weight
Upto Rs. 0.2 mn
Between Rs. 0.2 mn to Rs. 0.5 mn
Between Rs. 0.5 mn to Rs. 1.5 mn
Between Rs. 1.5-Rs. 2.5 mn
Upto Rs. 0.75 mn
> Rs. 7.5 mn
...pushing participants to chase higher value loans*...
Source: NHB, Spark Capital Research,* FY12 disbursement data for HFCs
GNPAs in lower ticket size 3-4x of larger size loans....
Source: NHB, Spark Capital Research
...bringing down proportion of lower ticket size loans....
Source: NHB, SCB data, Spark Capital Research
0%
20%
40%
60%
80%
100%
FY10 FY11 FY12
Housing credit outstanding (SCBs)
> 2.5 mn
1 - 2.5 mn
0.5 - 1 mn
0.2 - 0.5 mn
Upto 0.2 mn
1% 0.2 - 0.5 mn3%
0.5 - 1 mn14%
1 - 1.5 mn14%
1.5 - 2.5 mn25%
> 2.5 mn43%
# 2. Small ticket housing - It is simple but not easy; not growing despite regulatory push
0%
2%
4%
6%
8%
10%
12%
14%
FY10 FY11 FY12
<Rs. 0.2 mn Rs. 0.2mn- Rs. 0.5mn Rs. 0.5mn- Rs. 1.0mn
Rs. 1.0mn- Rs. 2.5mn >Rs. 2.5mn
REPCO Home Finance
8
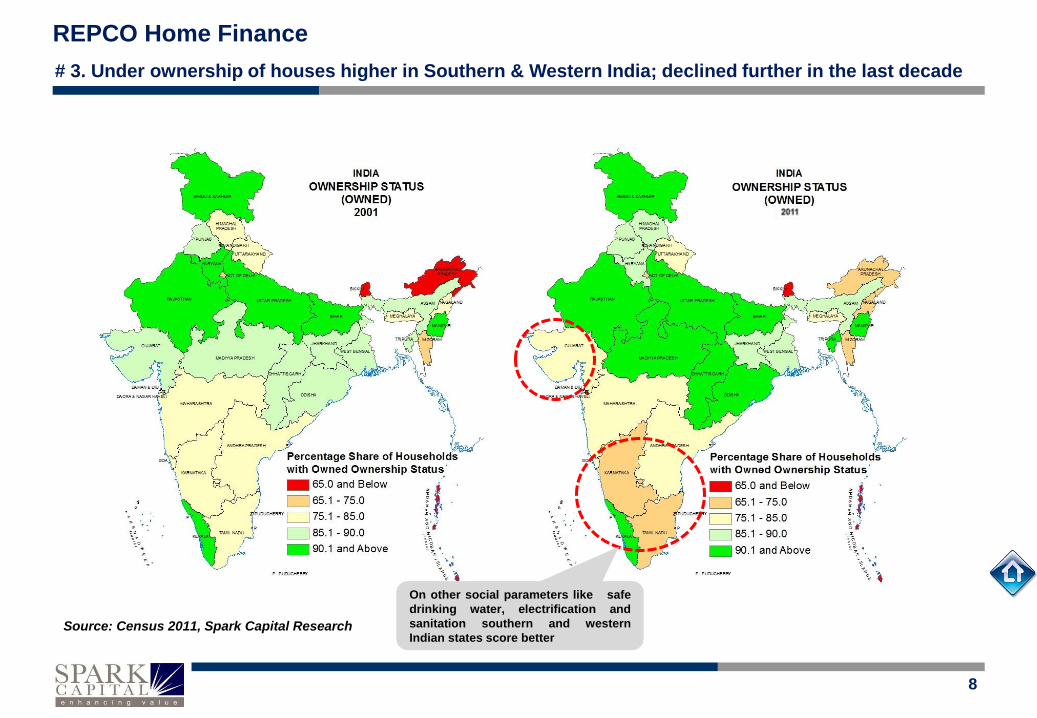
# 3. Under ownership of houses higher in Southern & Western India; declined further in the last decade
On other social parameters like safe
drinking water, electrification and
sanitation southern and western
Indian states score betterSource: Census 2011, Spark Capital Research
REPCO Home Finance
9
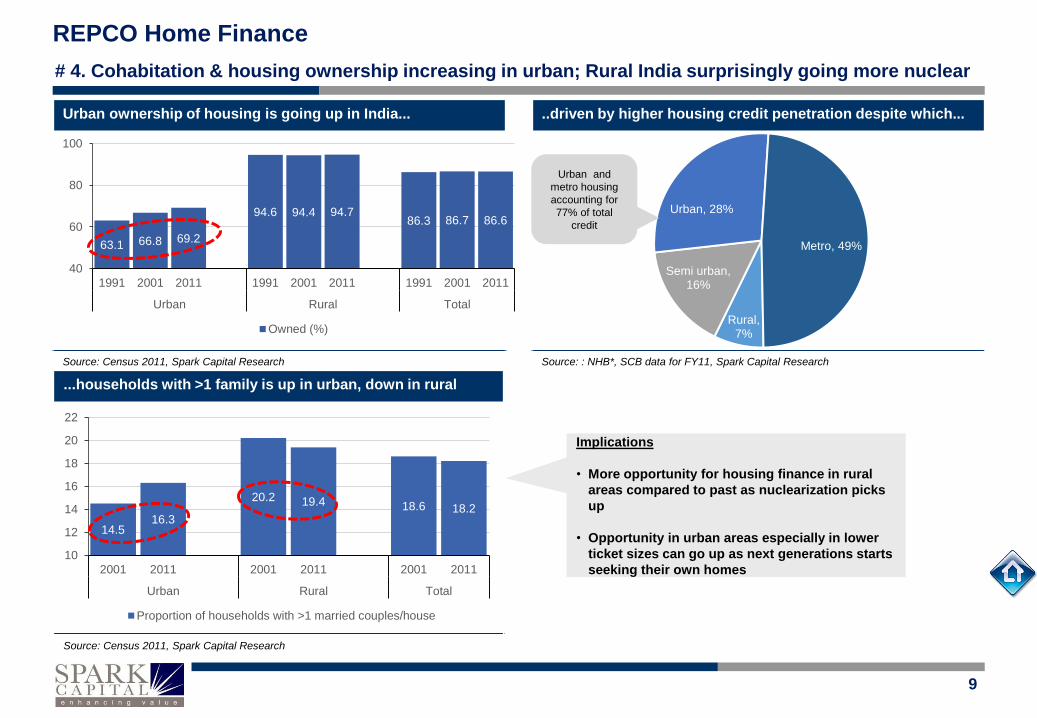
Urban ownership of housing is going up in India...
Source: Census 2011, Spark Capital Research
..driven by higher housing credit penetration despite which...
Source: : NHB*, SCB data for FY11, Spark Capital Research
...households with >1 family is up in urban, down in rural
Source: Census 2011, Spark Capital Research
Rural, 7%
Semi urban, 16%
Urban, 28%
Metro, 49%
Urban and
metro housing
accounting for
77% of total
credit
63.1 66.8 69.2
94.6 94.4 94.786.3 86.7 86.6
40
60
80
100
1991 2001 2011 1991 2001 2011 1991 2001 2011
Urban Rural Total
Owned (%)
14.516.3
20.2 19.4 18.6 18.2
10
12
14
16
18
20
22
2001 2011 2001 2011 2001 2011
Urban Rural Total
Proportion of households with >1 married couples/house
# 4. Cohabitation & housing ownership increasing in urban; Rural India surprisingly going more nuclear
Implications
• More opportunity for housing finance in rural
areas compared to past as nuclearization picks
up
• Opportunity in urban areas especially in lower
ticket sizes can go up as next generations starts
seeking their own homes

REPCO Home Finance
10
Scheme Location Ticket Size Customer type Covenants
Liberalized Refinance Scheme
(LRS)Any Upto Rs. 1.5mn Any
Golden Jubilee Rural Housing
Refinance Scheme (GJRHRS)Rural Upto Rs. 1.5mn Any
Rural Housing Fund (RHF) Rural Upto Rs. 1.5mn Weaker Sections 2% above max refinance rate
Special Refinance for Urban Low
Income HousingUrban Upto Rs. 1.0mn
Annual HH Income of
< Rs. 0.2mn2.75% above max refinance rate;
Refinance Scheme for Women Urban Upto Rs. 2.5mnWomen ownership
(Sole/Joint ownership
Windows of NHB refinancing to HFCs
Source: NSSO, Spark Capital Research
# 5. HFCs are key takers of NHB refinance schemes; especially in Rural Housing Fund
40% NHB disbursements* is to rural o/w >50% is through RHF
Source: NHB Data, Spark Capital Research * FY12 data
Since inception ~80% of disbursements in RHF to HFCs
Source: NHB data, Company, Spark Capital Research
Interest rate Cap introduced
recently (Sep 05, 2013)
If interest rate cap reduces viability
of refinance in this scheme, it would
curtail disbursements through this
window
Urban, 61%
GJRHF, 18%
RHF, 21% Non-HFC institutions,
19%
Repco, 11%
Other HFCs, 70%
Other, 81%

REPCO Home Finance
11
Lending rate cap on RHF creates sub-optimal ROE; may push HFCs to look at other avenues
Source: Spark Capital Research
Favourable refinance rates but constrained by ticket size
Source: NHB, Spark Capital Research * rates as of FY12
S. No Particulars MMFS GRUH REPCO SUHF
1 Eligible Refinance rate 6.5% 7.5% 7.5% 7.5%
2 Int cost as % of assets ( assuming 85% of B/S is debt ) 5.5% 6.4% 6.4% 6.4%
3 Opex to Assets (Only 33% of opex taken except for MMFS) 7.0% 0.3% 0.3% 0.3%
4 Credit costs 0.3% 0.3% 0.3% 0.3%
5 Min rate to cover opex, cc and COF (2+3+4) 12.8% 7.0% 7.0% 7.0%
6 Max lending rate possible (Eligible refinance rate + 2.0%) 9.5% 9.5% 9.5% 9.5%
7 Int income as % of assets (assuming 97% of B/S is loans) 9.3% 9.3% 9.3% 9.3%
8 Pre-Tax ROA(7-5) -3.5% 2.3% 2.3% 2.3%
9 Post Tax ROA ( Tax rate of 25%) -3.5% 1.8% 1.8% 1.8%
10 Assets/ Equity (15% equity) 6.7 6.7 6.7 6.7
11 ROE (9*10) -23.4% 11.7% 11.7% 11.7%
Ticket Size Rate of Refinance through RHF*
Upto Rs. 0.2mn 6.5%
Between Rs. 0.2mn to Rs. 0.5 mn 7.0%
Between Rs. 0.5mn to Rs. 1.5 mn 7.5%
# 6. With a lending cap of 2% RHF scheme unviable/sub-optimal for most HFCs; may push NHB to rethink
GRUH, REPCO and SUHF ticket sizes match RHF requirement
Source: Spark Capital Research
0.0
0.5
1.0
1.5
2.0
2.5
FY
10
FY
11
FY
12
FY
13
FY
10
FY
11
FY
12
FY
13
FY
10
FY
11
FY
12
FY
13
FY
10
FY
11
FY
12
FY
13
FY
10
FY
11
FY
12
FY
13
GRUH REPCO SUF LICHF HDFC
Incre
me
nta
l Le
nd
ing
in R
s.
mn
With 2% cap on RHF funding,
lending is unviable or suboptimal.
If off-take in RHF decreases NHB
may rethink on the lending rate
cap

12
REPCO Home Finance CMP
Rs. 309
Target
Rs. 375
Rating
BUY
Find Spark research on Bloomberg (SPAK <go>), Thomson First Call, Reuters Knowledge and Factset
Company Section
13
REPCO Home Finance CMP
Rs. 309
Target
Rs. 375
Rating
BUY
Find Spark research on Bloomberg (SPAK <go>), Thomson First Call, Reuters Knowledge and Factset
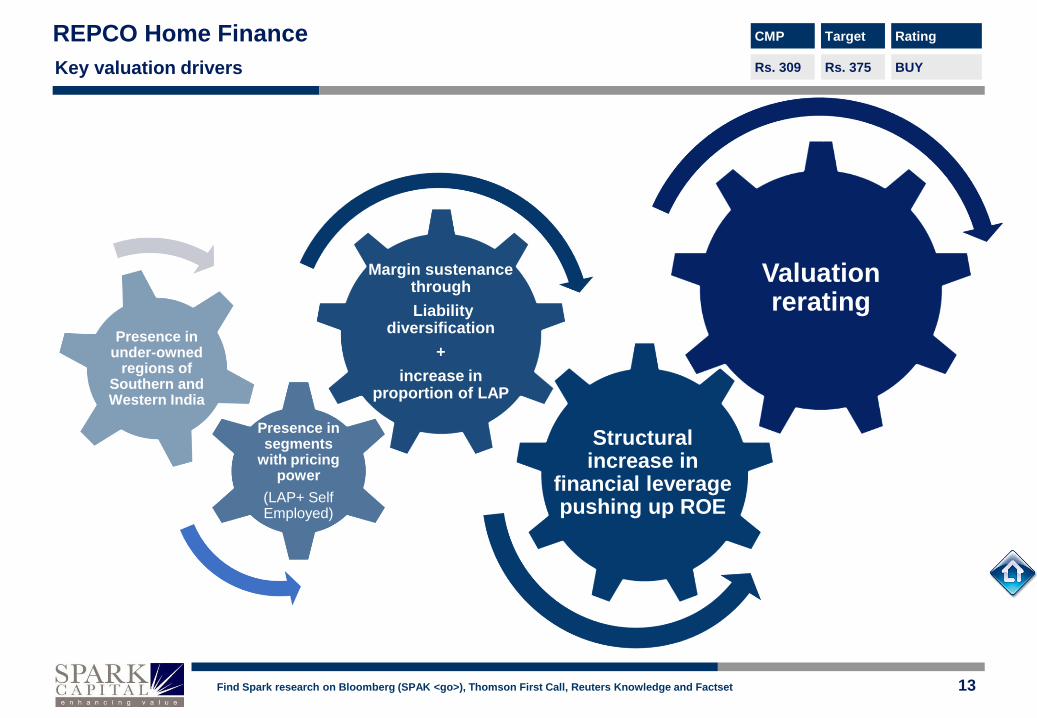
Margin sustenance through
Liability diversification
+
increase in proportion of LAP
Presence in segments
with pricing power
(LAP+ Self Employed)
Presence in under-owned
regions of Southern and Western India
Structural increase in
financial leverage pushing up ROE
Key valuation drivers
Valuation rerating

14
REPCO Home Finance CMP
Rs. 309
Target
Rs. 375
Rating
BUY
Find Spark research on Bloomberg (SPAK <go>), Thomson First Call, Reuters Knowledge and Factset
No reliance on DSA imply “Owned Customers”; Better pricing
Source: Spark Capital Research, Company
0%
15%
20%
0%
5%
10%
15%
20%
25%
30%
35%
40%
REPCO HDFC LICHF
Sale through DSA Channel
# 1. Right markets, profitable segments & “Owned customers” base
2.5X growth in loan book; 1.8X increase in customers
Source: Company,NHB, Spark Capital Research, *HFC & SCB date not available for FY13
91% of branches and 96% of loan book in under-owned states
Source: Spark Capital Research
Housing loan book with pricing power >50% of the book*
Source: Spark Capital Research, * Indicative range only, excluded developer book from
ambit
51%66%
16%
12%15%
13%
0%
20%
40%
60%
80%
100%
Branches Loan Book
TN Karnataka AP Maharashtra Guj Kerala WB Odisha
58%
18%
42%
82%
0%
20%
40%
60%
80%
100%
REPCO Other large HFCs
LAP+ Self-Employed Housing loans Housing Loan to Salaried class
2.0
1.5
2.5
1.4
1.1
1.8
1.0
1.2
1.4
1.6
1.8
2.0
2.2
2.4
2.6
SCB Large HFC REPCO
Loan Book growth Growth in customers

15
REPCO Home Finance CMP
Rs. 309
Target
Rs. 375
Rating
BUY
Find Spark research on Bloomberg (SPAK <go>), Thomson First Call, Reuters Knowledge and Factset
Rating improvement from A+ to AA -to push down borrowing
costs...
Source: Spark Capital Research
# 2. Liability diversification, rating benefit and increase in LAP book….
...and help in market related borrowings at lower rates
Source: Spark Capital Research
Higher yield LAP book to increase from 14% to 18% by FY15
Source: Spark Capital Research
Securitization window yet to be explored
As sizable portion of the loans originated by
REPCO qualify for PSL, securitization window
can give funding at lower than bank base rates
10.30%
10.10%
9.9%
10.0%
10.1%
10.2%
10.3%
10.4%
0
1
2
3
4
5
A rating AA rating
Capital Consumed for loan of Rs. 100
Differential in indicative lending rates
13% 12%20%
24%18%
10%
63%68% 65%
0%
20%
40%
60%
80%
100%
FY13 FY14E FY15E
NHB-non RHF Refinance RHF Refinance Banks CPs & NCD
14%
16%
18%
10%
12%
14%
16%
18%
20%
FY13 FY14E FY15E

16
REPCO Home Finance CMP
Rs. 309
Target
Rs. 375
Rating
BUY
Find Spark research on Bloomberg (SPAK <go>), Thomson First Call, Reuters Knowledge and Factset
….alleviating some pain from lower borrowing from RHF refinance window
Despite 50bps loss in pre-tax ROA due to loss of RHF refinance* owing to 2% cap , we see Sufficient levers like increase in LAP,
utilizing securitization window which can reduce the impact to 20bps without resorting to any hike in rates
Source: Spark Capital Research, *Assuming it is replaced by bank borrowing
Given that almost 100% of the customers are “owned customers” pricing power would be better which can help in absorbing the loss; In case NHB
revokes the 2% cap on RHF, the above changes in liability and loan book composition can push up pretax ROA’s by almost 30bps.
50 3
18
9
20
0
10
20
30
40
50
Impact of loss of RHFfunding
Change to NCD/CP Securitization Increase in LAP portion Effective loss
Imp
act
on
Pre
-Tax R
OA
in
bp
s

17
REPCO Home Finance CMP
Rs. 309
Target
Rs. 375
Rating
BUY
Find Spark research on Bloomberg (SPAK <go>), Thomson First Call, Reuters Knowledge and Factset
S. No Particulars FY14E FY15E FY16E FY17E FY18E FY19E
1 Loan Growth 29.5% 29.3% 28.0% 28.0% 27.0% 27.0%
2 ROA 2.9% 2.9% 2.7% 2.6% 2.6% 2.5%
3 Equity 15.9% 14.8% 13.7% 12.8% 12.0% 11.3%
4 Leverage 6.14 6.55 7.05 7.58 8.11 8.61
5 ROE 17.6% 19.2% 19.0% 19.3% 20.7% 21.3%
6 Capital Adequacy 23.7% 22.1% 20.5% 19.1% 17.9% 16.9%
7 ABV 113 134 158 187 222 265
Improving leverage to result in ROE improvement from 18% to 21% by FY18E
Removing cap on RHF refinance window can push up ROA structurally by 1.4-2%*
Souce: Spark Capital, *1.4% assuming 15% of liabilities are funded through Rural Housing Finance scheme
S. No Particulars FY14E FY15E FY16E FY17E FY18E FY19E
1 Loan Growth 29.5% 29.3% 28.0% 28.0% 27.0% 27.0%
2 ROA 2.9% 2.9% 2.7% 2.8% 2.8% 2.7%
3 Equity 15.9% 14.8% 13.7% 13.0% 12.3% 11.7%
4 Leverage 6.14 6.55 7.05 7.52 7.94 8.34
5 ROE 17.6% 19.2% 19.0% 20.9% 22.0% 22.5%
6 Capital Adequacy 23.7% 22.1% 20.5% 19.3% 18.4% 17.5%
7 ABV 113 134 158 190 229 276
# 3. Financial Leverage to push up ROE; Regulatory capital consumption low
ROE to steadily increase to ~21% by
FY18
Notably regulatory capital ( Tier-1) would
still be ~17% well above the mandatory
requirement
Stock to get rerated in case NHB removes
the lending Cap

18
REPCO Home Finance CMP
Rs. 309
Target
Rs. 375
Rating
BUY
Find Spark research on Bloomberg (SPAK <go>), Thomson First Call, Reuters Knowledge and Factset
REPCO** SUHF GRHF
Net Interest income 4.22% 4.91% 4.95%
Total Income 4.22% 4.91% 4.95%
Opex 0.73% 1.04% 0.99%
Pre-Provisioning Profit 3.49% 3.87% 3.96%
Provisions 0.28% 0.49% 0.36%
PBT 3.21% 3.38% 3.60%
Tax 0.81% 0.96% 1.03%
PAT 2.41% 2.42% 2.58%
Assets/Equity 7.1 /6.1 12.4 11.3
RoE 24%/ 17% 30.1% 29.2%
Credit Rating A+/AA- AA+ AA+
Similar ROA’s but higher leverage give higher ROEs for peers
Source: Spark Capital Research , *FY13 numbers; ** REPCO adjusted for Capital raise
#4. Higher potential leverage over time can drive multiples higher
GRHF clear outlier in valuations
Source: Spark Capital Research, Bloomberg Estimates
GRHF trading at 5X-1yr fwd multiple in similar space
Source: Company, Spark Capital Research
REPCO
GRHFHDFC
LICHF
DEWH0
1
2
3
4
5
6
7
15 17 19 21 23 25 27 29
P/A
BV
Return on Equity (%)
1.5 x
-
50.0
100.0
150.0
200.0
250.0
300.0
350.0
Nov-09 Nov-10 Nov-11 Nov-12 Nov-13
7.5 x
6.0 x
4.5 x
3.0 x
• Group support enables better rating, higher leverage ergo
higher ROE for the businesses in peer group
• As REPCO demonstrates good credit record over a
period, it can improve or sustain rating even at higher
leverage
• Government of India holds 73% of the parent REPCO
bank which can be used to leverage over a period of time

19
REPCO Home Finance CMP
Rs. 309
Target
Rs. 375
Rating
BUY
Find Spark research on Bloomberg (SPAK <go>), Thomson First Call, Reuters Knowledge and Factset
Crystal gazing returns
An out-performer
with possible returns of 2x.
In 3 years, we see
REPCO to demonstrate
its capability of growing
>25% comfortably in the
more profitable self-
employed segment of the
market with further
improvement in branch
strength
A probable
rerating
Steady
compounding effect
of ROEs
Consistent
RoAs of 2.5%, with
RoEs of 18-21%
NIMs of 4%
with stable
asset quality
Accretion to
book value
As stake
holders gain
confidence
FY15E FY16E FY17E FY18E
PAT (Rs. mn) 1,579 1,865 2,253 2,872
ROA 2.9% 2.7% 2.6% 2.6%
ROE 19.2% 19.0% 19.3% 20.7%
FY15E FY16E FY17E FY18E
Book Value per
share (Rs.)144 170 203 242
Adj Book Value
per share (Rs.)134 158 187 222
P/B multiple FY18E ABV Price target
3.0x 222 666
2.0x 222 444
20
REPCO Home Finance CMP
Rs. 309
Target
Rs. 375
Rating
BUY
Find Spark research on Bloomberg (SPAK <go>), Thomson First Call, Reuters Knowledge and Factset
Risks & Other Issues
ESOP given below market price; Shared MD with REPCO
bank
REPCO has given ~0.93mn (~1.3% of capital base) ESOPs at a fixed
price of Rs. 78 per share to all the employees of REPCO. Although these
stocks were to be awarded in Aug-2012, SEBI required these to be
awarded only after 6 months of IPO.
These options would be given out to employees over the next three years
(~0.24mn given in Q2FY14) with a vesting period of one year. Rewarding
employees with ESOPs below market price is an uncommon practice.
While we are not votaries of such a practice we take comfort from the fact
that the scheme is extended to all the employees of REPCO and
secondly, fixed pay of the top management is the lowest with ED pay
~Rs. 2.2mn for FY13. We add potential dilution and impact on operating
costs in our assumptions. Further, ~100,000 options has been set aside
in lieu of a civil suit which the ex-MD of REPCO is facing in Honourable
High Court of Madras.
REPCO bank and REPCO home finance share a MD .
Other Risks
TN and Chennai Concentration in loan book
High concentration risk as 2/3rd s of the book comes from Tamil Nadu and
1/4th of the book is from Chennai. Any sharp correction in these markets
can mean growth can take a hit. We do not expect NPA to be concern,
however growth can take a back seat
Management tenure
The current management tenure is for the next three years. In the event
of the current management not taking an extension, management change
is a key risk for investors looking beyond 3 years horizon.

21
REPCO Home Finance CMP
Rs. 309
Target
Rs. 375
Rating
BUY
Find Spark research on Bloomberg (SPAK <go>), Thomson First Call, Reuters Knowledge and Factset
Financial Summary
Abridged Financial Statements Key Metrics
Rs.mn FY12 FY13 FY14E FY15E FY12 FY13 FY14E FY15E
Profit & Loss Growth ratios
Net Interest Income 1,165 1,401 1,925 2,493 ABV per share 14% 62% 17% 19%
Other Income 1 3 194 219 Loan Assets 35% 26% 30% 29%
Total Income 1,166 1,403 2,119 2,712 Borrowings 37% 23% 24% 29%
Operating Expenses 194 243 332 438 NII 19% 20% 37% 29%
Pre-Provisioning Operating Profit 972 1,160 1,788 2,273 PAT 9% 30% 51% 30%
Provisions 155 92 163 168 EPS 9% -3% 51% 30%
PBT 816 1,068 1,625 2,105 Asset-Liability Profile
PAT 614 800 1,212 1,579 Leverage (x) 8.1 6.1 5.1 5.5
Balance Sheet Leverage (x) (Incl Off B/S) 8.1 6.1 5.1 5.5
Networth 3,033 6,345 7,470 8,964 Core Tier 1- CAR 16.4% 26.7% 24.3% 21.6%
Paid Up Capital 464 622 622 624 Profitability and Efficiency
Reserves 2,568 5,724 6,848 8,339 Net Interest Margin 4.8% 4.4% 4.7% 4.7%
Others Capital Instruments ROA 2.5% 2.4% 2.9% 2.9%
Borrowings 24,860 30,647 38,007 49,098 ROE 22.6% 17.1% 17.5% 19.2%
Total Liabilities & Networth 28,527 37,926 46,947 60,629 Cost/Income 17% 17% 17% 16%
Advances 28,041 35,448 45,917 59,348 Dupont Analysis
Fixed Assets 33 45 60 766 NII/Total Assets 4.7% 4.2% 4.5% 4.6%
Net Current Assets 293 2,101 721 8,853 TI/Total Assets 4.7% 4.2% 5.0% 5.0%
Total Assets 28,527 37,926 46,947 60,629 Opex/Total Assets 0.8% 0.7% 0.8% 0.8%
Off Balance Sheet Assets PPOP/Total Assets 3.9% 3.5% 4.2% 4.2%
Total AUM 28,527 37,926 46,947 60,629 Provisions/Total Assets 0.6% 0.3% 0.4% 0.3%
PAT/Total Assets 2.5% 2.4% 2.9% 2.9%
Shares outstanding (mn) 46 62 62 62 Valuation
Current market price (Rs.) 309 309 309 309 Book Value per share (Rs.) 65 102 120 144
Market capitalization (Rs. mn) 13,793 18,462 18,462 18,540 Adj Book Value per share (Rs.) 60 96 113 134
Earnings per share (Rs.) 13.2 12.9 19.5 25.3 P/ABV (x) 5.2 3.2 2.7 2.3
Dividend per share (Rs.) 1.10 1.10 1.20 1.20 P/E (x) 23.4 24.0 15.8 12.2

REPCO Home Finance
22
Spark Disclaimer
Spark Capital Advisors (India) Private Limited (Spark Capital) and its affiliates are engaged in investment banking, investment advisory and institutional equities. Spark Capital is registered with
SEBI as a Stock Broker and Category 1 Merchant Banker.
This document does not constitute or form part of any offer or solicitation for the purchase or sale of any financial instrument or as an official confirmation of any transaction. This document is
provided for assistance only and is not intended to be and must not alone be taken as the basis for an investment decision. Nothing in this document should be construed as investment or
financial advice, and nothing in this document should be construed as an advice to buy or sell or solicitation to buy or sell the securities of companies referred to in this document.
Each recipient of this document should make such investigations as it deems necessary to arrive at an independent evaluation of an investment in the securities of companies referred to in this
document (including the merits and risks involved), and should consult its own advisors to determine the merits and risks of such an investment. This document is being supplied to you solely
for your information and may not be reproduced, redistributed or passed on, directly or indirectly, to any other person or published, copied, in whole or in part, for any purpose. This report is not
directed or intended for distribution to or use by any person or entity who is a citizen or resident of or located in any locality, state, country or other jurisdiction, where such distribution,
publication, availability or use would be contrary to law, regulation or which would subject Spark Capital and/or its affiliates to any registration or licensing requirement within such jurisdiction.
The securities described herein may or may not be eligible for sale in all jurisdictions or to a certain category of investors. Persons in whose possession this document may come are required to
inform themselves of and to observe such applicable restrictions. This material should not be construed as an offer to sell or the solicitation of an offer to buy any security in any jurisdiction
where such an offer or solicitation would be illegal.
Spark Capital makes no representation or warranty, express or implied, as to the accuracy, completeness or fairness of the information and opinions contained in this document. Spark Capital ,
its affiliates, and the employees of Spark Capital and its affiliates may, from time to time, effect or have effected an own account transaction in, or deal as principal or agent in or for the
securities mentioned in this document. They may perform or seek to perform investment banking or other services for, or solicit investment banking or other business from, any company
referred to in this report.
This report has been prepared on the basis of information, which is already available in publicly accessible media or developed through an independent analysis by Spark Capital. While we
would endeavour to update the information herein on a reasonable basis, Spark Capital and its affiliates are under no obligation to update the information. Also, there may be regulatory,
compliance or other reasons that prevent Spark Capital and its affiliates from doing so. Neither Spark Capital nor its affiliates or their respective directors, employees, agents or representatives
shall be responsible or liable in any manner, directly or indirectly, for views or opinions expressed in this report or the contents or any errors or discrepancies herein or for any decisions or
actions taken in reliance on the report or the inability to use or access our service in this report or for any loss or damages whether direct or indirect, incidental, special or consequential
including without limitation loss of revenue or profits that may arise from or in connection with the use of or reliance on this report.
Spark Capital and/or its affiliates and/or employees may have interests/positions, financial or otherwise in the securities mentioned in this report. To enhance transparency, Spark Capital has
incorporated a disclosure of interest statement in this document. This should however not be treated as endorsement of views expressed in this report:
Absolute Rating Interpretation
Buy Stock expected to provide positive returns of >15% over a 1-year horizon
Add Stock expected to provide positive returns of >5% – <15% over a 1-year horizon
Reduce Stock expected to provide returns of <5% – -10% over a 1-year horizon
Sell Stock expected to fall >10% over a 1-year horizon
Recommendation History
Date CMP Target price Rating

REPCO Home Finance
23
Analyst Certification of Independence
The views expressed in this research report accurately reflect the analyst’s personal views about any and all of the subject securities or issuers; and no part of the research
analyst’s compensations was, is or will be, directly or indirectly, related to the specific recommendation or views expressed in the report.
Additional Disclaimer for US Institutional Investors
This research report prepared by Spark Capital Advisors (India) Private Limited is distributed in the United States to US Institutional Investors (as defined in Rule 15a-6 under the Securities
Exchange Act of 1934, as amended) only by Decker & Co, LLC, a broker-dealer registered in the US (registered under Section 15 of Securities Exchange Act of 1934, as amended). Decker &
Co accepts responsibility on the research reports and US Institutional Investors wishing to effect transaction in the securities discussed in the research material may do so through Decker & Co.
All responsibility for the distribution of this report by Decker & Co, LLC in the US shall be borne by Decker & Co, LLC. All resulting transactions by a US person or entity should be effected
through a registered broker-dealer in the US. This report is not directed at you if Spark Capital Advisors (India) Private Limited or Decker & Co, LLC is prohibited or restricted by any legislation
or regulation in any jurisdiction from making it available to you. You should satisfy yourself before reading it that Decker & Co, LLC and Spark Capital Advisors (India) Private Limited are
permitted to provide research material concerning investment to you under relevant legislation and regulations;
Disclosure of interest statement Yes/No
Analyst ownership of the stock No
Group/directors ownership of the stock No
Broking relationship with the company covered No
Investment banking relationship with the company covered No