reno msa industry trends-january 2018ekayconsultants.com/reno index 3-18-industry only.pdf · reno...
TRANSCRIPT

RENO MSA INDUSTRY TRENDS-JANUARY 2018
Eugenia Larmore Brian Bonnenfant (775) 232-7203 (775) 784-1771 [email protected] [email protected]
Construction Index January 2018 Provides historical and current trends for the construction industry in the Reno MSA region.
Business Activity Index January 2018 Provides historical and current trends for business activity in the Reno MSA region.
SF Housing Index January 2018 Provides historical and current trends for single-family housing activity in the Reno MSA region.
0.26%
% Change
Taxable
Sales
Taxable
Gaming
Revenue
Nonfarm
Employment
Airport
Passengers
Airport
Cargo
Month to
Month0.13% 0.57% 0.39% 0.69% -0.18%
1.82%
% Change
Taxable
Sales
Taxable
Gaming
Revenue
Nonfarm
Employment
Airport
Passengers
Airport
Cargo
Year to
Year1.68% 1.45% 2.71% 9.78% -3.40%
0.93%
% Change
Construction
Employment
Commercial
Building
Permit
Valuation
Commercial
Building
Permits
Residential
Building
Permit
Valuation
Residential
Building
Permit
Units
Month to
Month0.65% 1.66% -1.18% 1.80% 1.87%
7.12%
% Change
Construction
Employment
Commercial
Building
Permit
Valuation
Commercial
Building
Permits
Residential
Building
Permit
Valuation
Residential
Building
Permit
Units
Year to
Year14.71% -4.16% -27.87% 40.73% 52.57%
-1.54%
% Change
Nonfarm
Employment
SF Homes
Sold
Median
Price of SF
Homes
Housing
Opportunity
Index
Month to
Month0.39% 1.18% 0.76% -28.87%
-0.97%
% Change
Nonfarm
Employment
SF Homes
Sold
Median
Price of SF
Homes
Housing
Opportunity
Index
Year to
Year2.71% 3.27% 7.25% -42.43%
Published March 2018
Business Activity, Construction, and Housing indexes provide a simplified look at important industry trends within the Reno MSA
economy.
Please note weights for all indices were updated in March to include data through December 2017 to ensure each index is based on the most current
and long-term historical data available.
Reno MSA Industry Indexes – January 2018 2
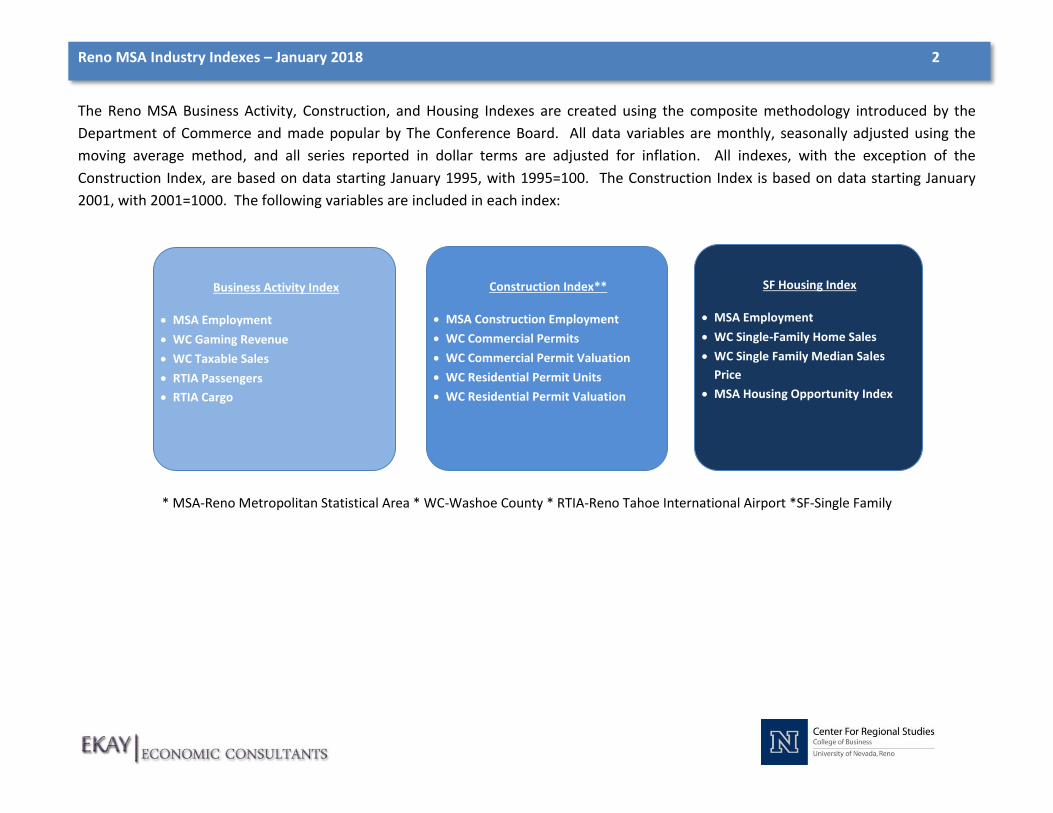
Construction Index**
MSA Construction Employment
WC Commercial Permits
WC Commercial Permit Valuation
WC Residential Permit Units
WC Residential Permit Valuation
Business Activity Index
MSA Employment
WC Gaming Revenue
WC Taxable Sales
RTIA Passengers
RTIA Cargo
SF Housing Index
MSA Employment
WC Single-Family Home Sales
WC Single Family Median Sales
Price
MSA Housing Opportunity Index
The Reno MSA Business Activity, Construction, and Housing Indexes are created using the composite methodology introduced by the
Department of Commerce and made popular by The Conference Board. All data variables are monthly, seasonally adjusted using the
moving average method, and all series reported in dollar terms are adjusted for inflation. All indexes, with the exception of the
Construction Index, are based on data starting January 1995, with 1995=100. The Construction Index is based on data starting January
2001, with 2001=1000. The following variables are included in each index:
* MSA-Reno Metropolitan Statistical Area * WC-Washoe County * RTIA-Reno Tahoe International Airport *SF-Single Family
Reno MSA Industry Indexes – January 2018 3
Series
Latest Period-
January 2018
Prev. Period-
December 2017
Change Prev.
Period
Prev. Year-
January 2017
Change Prev.
Year
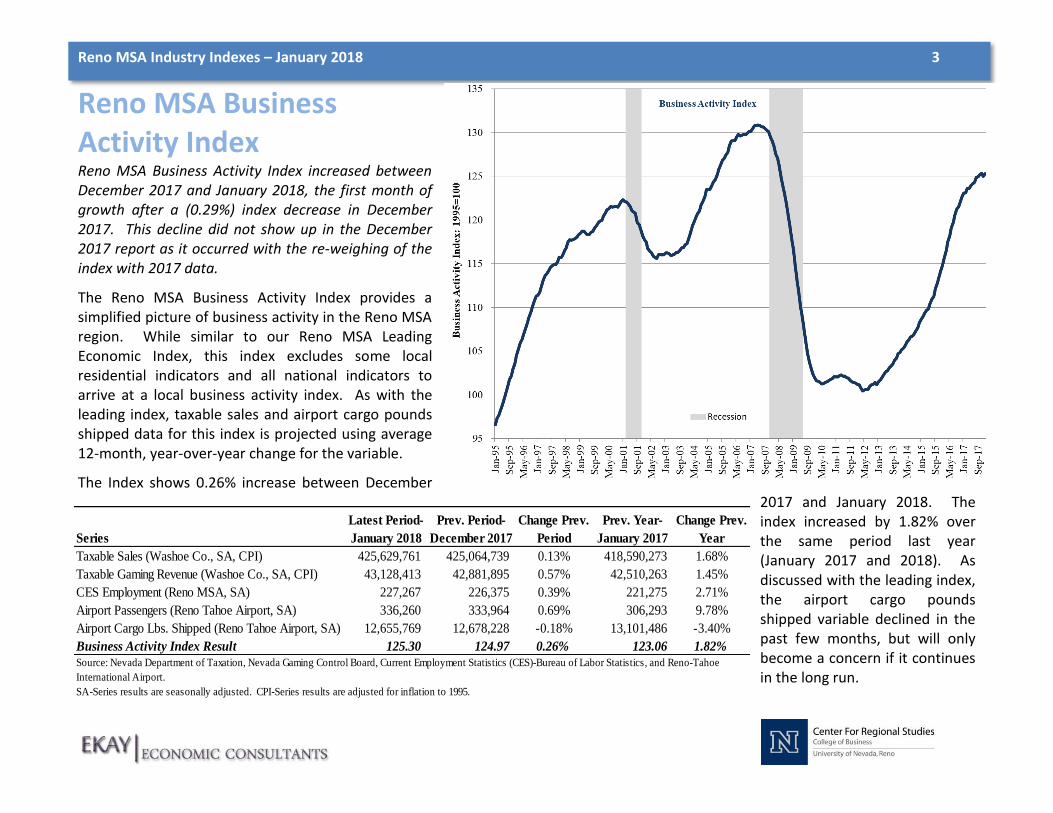
Taxable Sales (Washoe Co., SA, CPI) 425,629,761 425,064,739 0.13% 418,590,273 1.68%
Taxable Gaming Revenue (Washoe Co., SA, CPI) 43,128,413 42,881,895 0.57% 42,510,263 1.45%
CES Employment (Reno MSA, SA) 227,267 226,375 0.39% 221,275 2.71%
Airport Passengers (Reno Tahoe Airport, SA) 336,260 333,964 0.69% 306,293 9.78%
Airport Cargo Lbs. Shipped (Reno Tahoe Airport, SA) 12,655,769 12,678,228 -0.18% 13,101,486 -3.40%
Business Activity Index Result 125.30 124.97 0.26% 123.06 1.82%
SA-Series results are seasonally adjusted. CPI-Series results are adjusted for inflation to 1995.
Source: Nevada Department of Taxation, Nevada Gaming Control Board, Current Employment Statistics (CES)-Bureau of Labor Statistics, and Reno-Tahoe
International Airport.
Reno MSA Business Activity Index Reno MSA Business Activity Index increased between December 2017 and January 2018, the first month of growth after a (0.29%) index decrease in December 2017. This decline did not show up in the December 2017 report as it occurred with the re-weighing of the index with 2017 data.
The Reno MSA Business Activity Index provides a simplified picture of business activity in the Reno MSA region. While similar to our Reno MSA Leading Economic Index, this index excludes some local residential indicators and all national indicators to arrive at a local business activity index. As with the leading index, taxable sales and airport cargo pounds shipped data for this index is projected using average 12-month, year-over-year change for the variable.
The Index shows 0.26% increase between December 2017 and January 2018. The index increased by 1.82% over the same period last year (January 2017 and 2018). As discussed with the leading index, the airport cargo pounds shipped variable declined in the past few months, but will only become a concern if it continues in the long run.
Reno MSA Industry Indexes – January 2018 4
Series
Latest Period-
January 2018
Prev. Period-
December 2017
Change Prev.
Period
Prev. Year-
January 2017
Change
Prev. Year
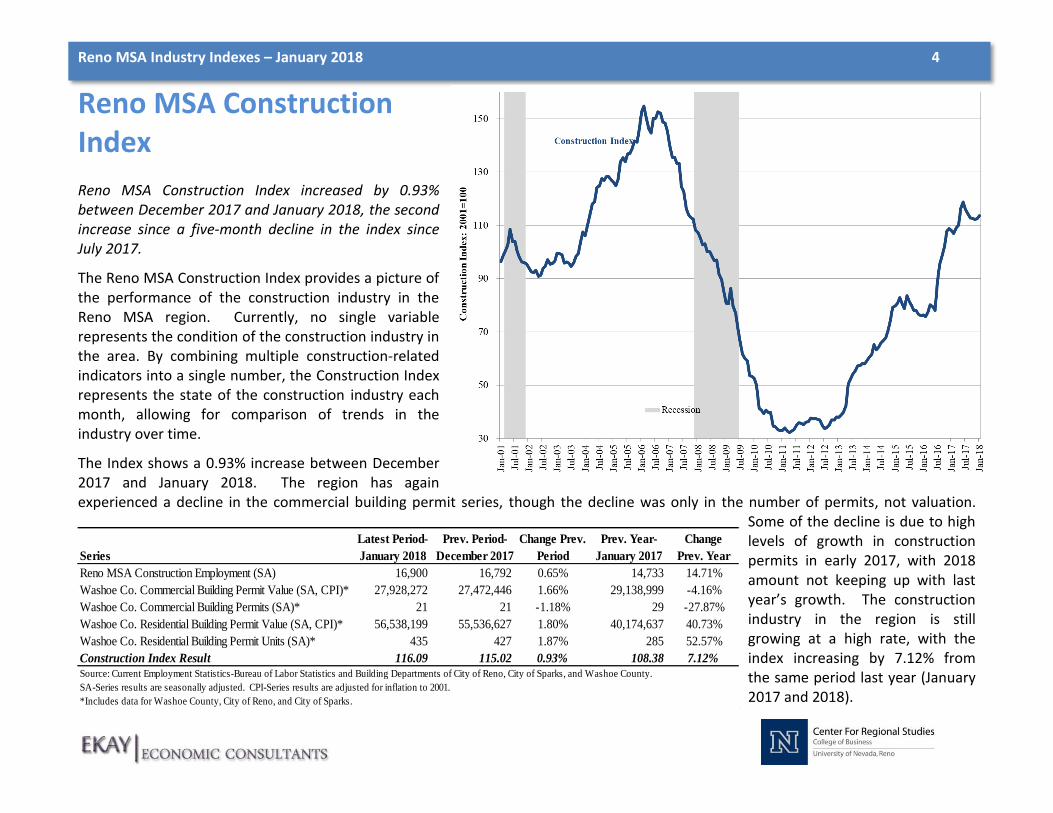
Reno MSA Construction Employment (SA) 16,900 16,792 0.65% 14,733 14.71%
Washoe Co. Commercial Building Permit Value (SA, CPI)* 27,928,272 27,472,446 1.66% 29,138,999 -4.16%
Washoe Co. Commercial Building Permits (SA)* 21 21 -1.18% 29 -27.87%
Washoe Co. Residential Building Permit Value (SA, CPI)* 56,538,199 55,536,627 1.80% 40,174,637 40.73%
Washoe Co. Residential Building Permit Units (SA)* 435 427 1.87% 285 52.57%
Construction Index Result 116.09 115.02 0.93% 108.38 7.12%
SA-Series results are seasonally adjusted. CPI-Series results are adjusted for inflation to 2001.
*Includes data for Washoe County, City of Reno, and City of Sparks.
Source: Current Employment Statistics-Bureau of Labor Statistics and Building Departments of City of Reno, City of Sparks, and Washoe County.
Reno MSA Construction Index Reno MSA Construction Index increased by 0.93% between December 2017 and January 2018, the second increase since a five-month decline in the index since July 2017.
The Reno MSA Construction Index provides a picture of the performance of the construction industry in the Reno MSA region. Currently, no single variable represents the condition of the construction industry in the area. By combining multiple construction-related indicators into a single number, the Construction Index represents the state of the construction industry each month, allowing for comparison of trends in the industry over time.
The Index shows a 0.93% increase between December 2017 and January 2018. The region has again experienced a decline in the commercial building permit series, though the decline was only in the number of permits, not valuation.
Some of the decline is due to high levels of growth in construction permits in early 2017, with 2018 amount not keeping up with last year’s growth. The construction industry in the region is still growing at a high rate, with the index increasing by 7.12% from the same period last year (January 2017 and 2018).
Reno MSA Industry Indexes – January 2018 5
Series
Latest Period-
January 2018
Prev. Period-
December 2017
Change Prev.
Period
Prev. Year-
January 2017
Change
Prev. Year
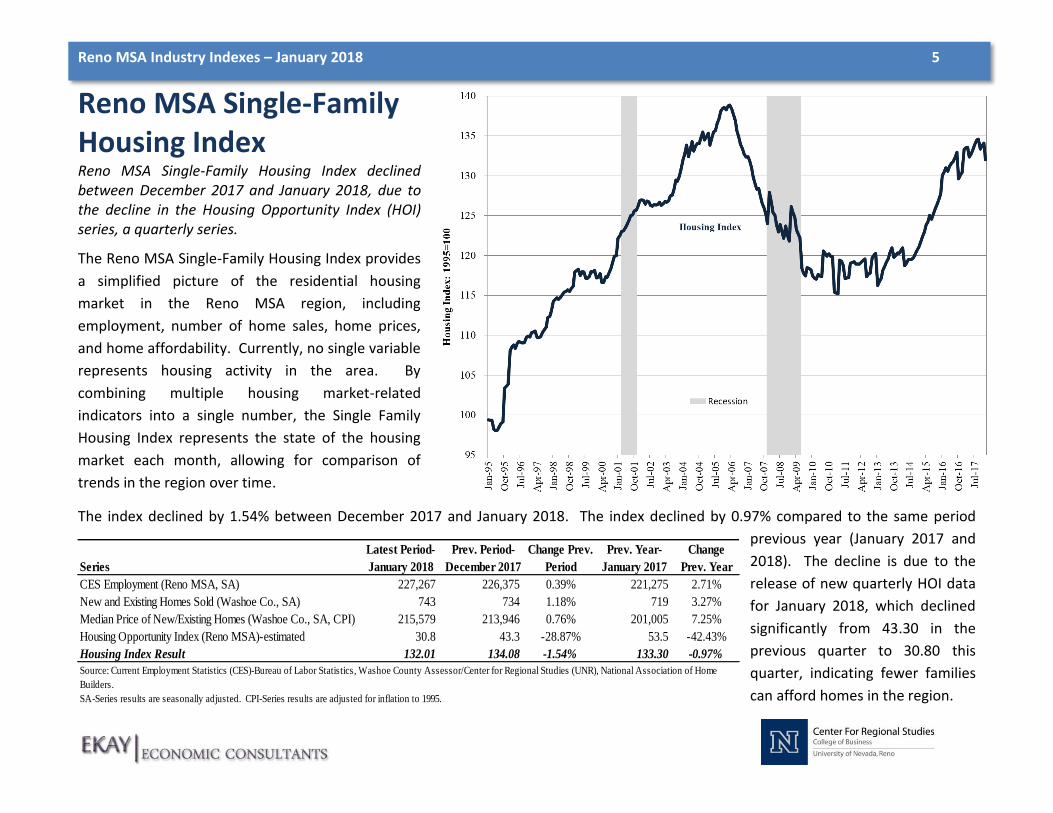
CES Employment (Reno MSA, SA) 227,267 226,375 0.39% 221,275 2.71%
New and Existing Homes Sold (Washoe Co., SA) 743 734 1.18% 719 3.27%
Median Price of New/Existing Homes (Washoe Co., SA, CPI) 215,579 213,946 0.76% 201,005 7.25%
Housing Opportunity Index (Reno MSA)-estimated 30.8 43.3 -28.87% 53.5 -42.43%
Housing Index Result 132.01 134.08 -1.54% 133.30 -0.97%
SA-Series results are seasonally adjusted. CPI-Series results are adjusted for inflation to 1995.
Source: Current Employment Statistics (CES)-Bureau of Labor Statistics, Washoe County Assessor/Center for Regional Studies (UNR), National Association of Home
Builders.
Reno MSA Single-Family Housing Index Reno MSA Single-Family Housing Index declined between December 2017 and January 2018, due to the decline in the Housing Opportunity Index (HOI) series, a quarterly series.
The Reno MSA Single-Family Housing Index provides
a simplified picture of the residential housing
market in the Reno MSA region, including
employment, number of home sales, home prices,
and home affordability. Currently, no single variable
represents housing activity in the area. By
combining multiple housing market-related
indicators into a single number, the Single Family
Housing Index represents the state of the housing
market each month, allowing for comparison of
trends in the region over time.
The index declined by 1.54% between December 2017 and January 2018. The index declined by 0.97% compared to the same period
previous year (January 2017 and
2018). The decline is due to the
release of new quarterly HOI data
for January 2018, which declined
significantly from 43.30 in the
previous quarter to 30.80 this
quarter, indicating fewer families
can afford homes in the region.