renewable jet fuel in the european union ·
TRANSCRIPT
Faculty of GeosciencesCopernicus Institute of
Sustainable Development
Renewable Jet Fuel in the European Union
Scenarios and Preconditions for Renewable Jet Fuel Deployment towards 2030
AuthorsSierk de Jong (Copernicus Institute of Sustainable Development, Utrecht University)Ric Hoefnagels (Copernicus Institute of Sustainable Development, Utrecht University)Joost van Stralen (Energy Research Centre of the Netherlands (ECN))Marc Londo (Energy Research Centre of the Netherlands (ECN))Raphael Slade (Centre for Environmental Policy, Imperial College London)André Faaij (Energy and Sustainability Research Institute, University of Groningen)Martin Junginger (Copernicus Institute of Sustainable Development, Utrecht University)
Please cite as: de Jong S, Hoefnagels R, van Stralen J, Londo M, Slade R, Faaij A, Junginger M, Renewable Jet Fuel in the European Union – Scenarios and Preconditions for Renewable Jet Fuel Deployment towards 2030. (2017).
AcknowledgementsThis report was funded by the EIT Climate-KIC as part of the Fuel Supply Chain Development and Flight Operations (RENJET) project, deliverable ‘A Quantified Roadmap for Aviation Fuels to 2030 (Utrecht, Amsterdam, London, 2016)’.
Author organizations
RENJET project partners
Colophon
Cover photo: Plane KLM, ©KLM
Design and lay-out:
C&M [9217], Faculty of Geosciences, Utrecht University

THE NEED FOR RENEWABLE JET FUELS
At COP21 in Paris it was agreed to limit global temperature rise to maximum 2 oC. Although international aviation is not covered by the Paris agreement at COP21, the sector has the ambition to cap aviation CO2 emissions from 2020 onwards and halve CO2 emissions by 2050 compared to a 2005 baseline. As part of a basket of measures, the International Civil Aviation Organization recently agreed to introduce a Global Market-Based Measure. This measure proposes to offset any annual increase in the CO2 emissions from international aviation beyond 2020 through the Carbon Offsetting and Reduction Scheme for International Aviation (CORSIA). The European Union (EU) recently proposed to continue to include intra-EU flights in the EU Emission Trading Scheme (ETS). While the CORSIA and EU ETS allow the aviation sector to offset CO2 emissions outside the industry using carbon offsets, structural solutions within the industry are needed to achieve sustainable growth. Besides expected efficiency gains and operational improvements, Renewable Jet Fuel (RJF), a drop-in fuel derived from renewable energy sources (e.g. biomass), is considered an important measure to structurally reduce CO2 emissions in aviation in the coming decades.
This report quantifies the required emission reductions of the EU aviation sector to achieve carbon-neutral growth up to 2030. It explores the role of RJF in reducing aviation CO2 emissions and available feedstock and technology options to produce RJF towards 2030. Four possible RJF deployment scenarios (varying in the level of RJF deployment) are formulated and evaluated in terms of cost and impact on the EU bioenergy portfolio. The report concludes with key preconditions for RJF deployment in the EU towards 2030.
THE ROLE OF RENEWABLE JET FUEL IN COVERING THE EMISSION GAP OF THE AVIATION INDUSTRY
Despite anticipated efficiency and operational improvements, the difference between the projected EU aviation emissions and carbon-neutral growth (the ‘Emission Gap’) was quantified to be 232 million tonne (Mt) CO2 over the period 2020-2030. Besides carbon offsets, the use of RJF can help to cover this Emission Gap. Life-cycle emission reductions of RJF vary significantly depending on the production pathway. Some production pathways achieve life-cycle emission reductions of up to 95% compared to fossil jet fuels.
AVAIL ABLE OPTIONS TO PRODUCE RENEWABLE JET FUELS TODAY AND IN THE FUTURE
Current volumes of RJF are mainly produced from waste oils using the Hydroprocessed Esters and Fatty Acid (HEFA) pathway. Although the technology is commercially available, its scale-up potential
Executive summary
III | Scenarios and Preconditions for Renewable Jet Fuel Deployment towards 2030
is constrained by the availability of sustainable feedstocks. There are other technologies capable of converting more abundant sources of (lignocellulosic) biomass to RJF, such as Fischer-Tropsch, Pyrolysis, Hydrothermal Liquefaction, Alcohol-to-Jet, and Direct Sugars to Hydrocarbons. For many of these technologies, (a part of) the process is yet to be demonstrated on a commercial scale. Moreover, high production costs impede the autonomous uptake of RJF.
The aviation sector will need to compete over the available biomass supply with other end user applications (e.g. electricity, heat, road transport, marine, biochemicals, and biomaterials). The EU biomass potential is sufficient to cover the projected bioenergy demand up to 2030, but the surplus is decreasing as a result of higher demand from all biomass demand sectors.
FUTURE DEPLOYMENT SCENARIOS FOR RENEWABLE JET FUELS IN THE EU
Four RJF deployment scenarios were examined to obtain insight in possible trajectories and required preconditions for deployment of RJF in the EU towards 2030. The scenarios were assessed in a European bioenergy model, which contains current bioenergy policies and covers various biomass demand sectors (electricity, heat, and biofuels), feedstocks, and conversion technologies.
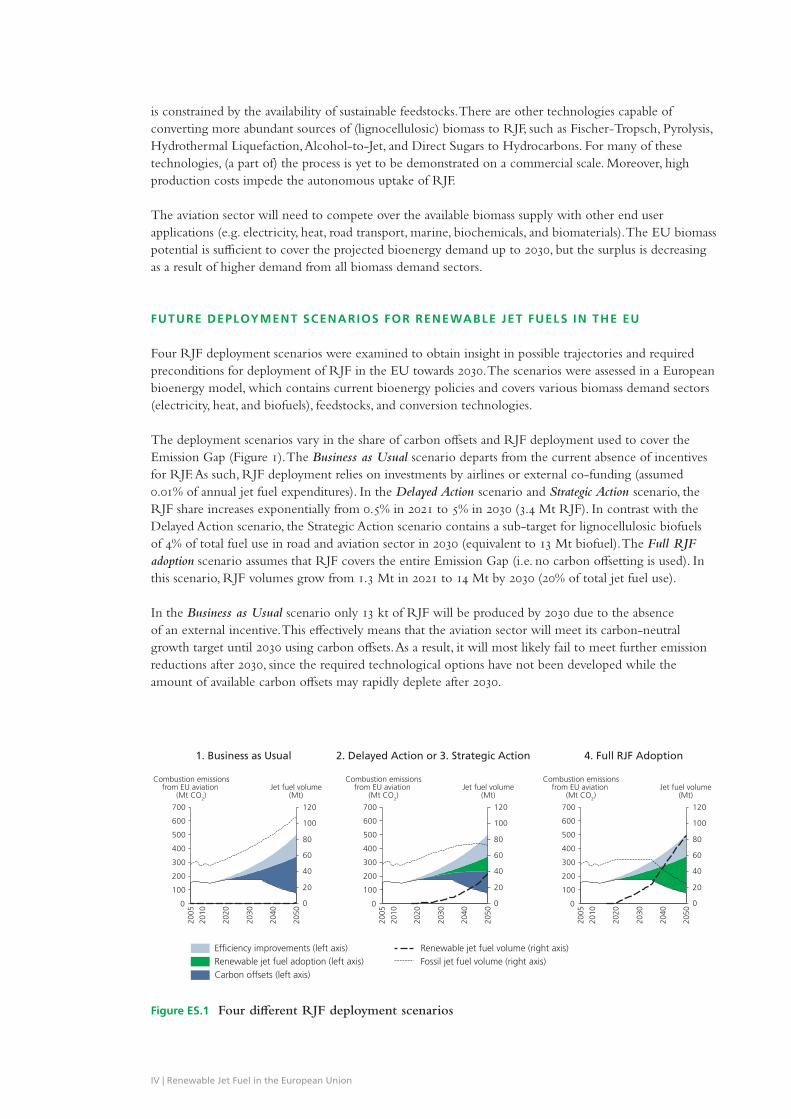
The deployment scenarios vary in the share of carbon offsets and RJF deployment used to cover the Emission Gap (Figure 1). The Business as Usual scenario departs from the current absence of incentives for RJF. As such, RJF deployment relies on investments by airlines or external co-funding (assumed 0.01% of annual jet fuel expenditures). In the Delayed Action scenario and Strategic Action scenario, the RJF share increases exponentially from 0.5% in 2021 to 5% in 2030 (3.4 Mt RJF). In contrast with the Delayed Action scenario, the Strategic Action scenario contains a sub-target for lignocellulosic biofuels of 4% of total fuel use in road and aviation sector in 2030 (equivalent to 13 Mt biofuel). The Full RJF adoption scenario assumes that RJF covers the entire Emission Gap (i.e. no carbon offsetting is used). In this scenario, RJF volumes grow from 1.3 Mt in 2021 to 14 Mt by 2030 (20% of total jet fuel use).
In the Business as Usual scenario only 13 kt of RJF will be produced by 2030 due to the absence of an external incentive. This effectively means that the aviation sector will meet its carbon-neutral growth target until 2030 using carbon offsets. As a result, it will most likely fail to meet further emission reductions after 2030, since the required technological options have not been developed while the amount of available carbon offsets may rapidly deplete after 2030.
0
100
200
300
400
500
600
700
2010
Combustion emissionsfrom EU aviation
(Mt CO2)
2040
2030
2050
2020
2005
1. Business as Usual
0
20
40
60
80
100
120
Jet fuel volume(Mt)
Combustion emissionsfrom EU aviation
(Mt CO2)Jet fuel volume
(Mt)
Combustion emissionsfrom EU aviation
(Mt CO2)Jet fuel volume
(Mt)
Renewable jet fuel volume (right axis)Fossil jet fuel volume (right axis)
0
100
200
300
400
500
600
700
2040
2020
2050
2030
2005
2010
2. Delayed Action or 3. Strategic Action
0
20
40
60
80
100
120
0
100
200
300
400
500
600
700
2030
2010
2040
2005
2050
2020
4. Full RJF Adoption
0
20
40
60
80
100
120
Efficiency improvements (left axis)
Carbon offsets (left axis)Renewable jet fuel adoption (left axis)
Figure ES.1 Four different RJF deployment scenarios
IV | Renewable Jet Fuel in the European Union
In contrast, model results show that the Full RJF Adoption scenario requires an extremely high rate of feedstock mobilization (particularly lignocellulosic biomass) and capacity deployment; lignocellulosic biofuel production capacity increases from nearly zero to 26 Mt/yr over the course of 15 years. It takes multiple decades to introduce new technologies, deploy production capacity and mobilize sufficient feedstock. As even more substantial RJF volume growth is required after 2030 to reach the industry’s target in 2050, it is cardinal to have a long-term vision with a prominent role for early action such that significant volume growth can be achieved towards the middle of this century.
The Delayed Action scenario uses carbon offsets to buy time to gradually integrate RJF in the feedstock-technology portfolio. In this scenario, HEFA RJF represents nearly 90% of the total RJF supply in 2030. This does not only instigate a shift of waste oils from the road to the aviation sector, but also creates a lock-in effect on the longer term, as the potential of sustainable oil feedstocks is limited while alternative technologies remain undeveloped. Such a system could give rise to major scale-up difficulties in the period beyond 2030.
By introducing a sub-target for lignocellulosic biofuels, the Strategic Action scenario presents a growth trajectory which gradually introduces lignocellulosic biofuels while phasing out food-based biofuels (particularly biodiesel). Almost half of RJF supply is produced from lignocellulosic feedstocks through a varied technology portfolio (i.e. Fischer-Tropsch, pyrolysis, Hydrothermal Liquefaction and Alcohol-to-Jet), thus providing a more scalable and potentially cheaper alternative to RJF production from waste oils. Moreover, imports are significantly reduced; particularly palm oil and food-based ethanol. More investments are directed to building production capacity, hence supporting the development of a more EU-focused advanced biofuels industry, including the macro-economic benefits that may accompany such development.
Significant funds are required to achieve large-scale deployment RJF. In all scenarios, a price premium on RJF exists and is likely to remain beyond 2030 (irrespective of feedstock-technology combination), unless fossil jet fuel prices increase strongly or production costs reduce drastically. The total expenses of the introduction of RJF in the EU in the Strategic Action scenario were quantified to be 10.4 billion € (Figure 2). These funds only cover the price differential between RJF and fossil jet fuel, thus excluding the research and development funds required for technology development. The corresponding price premium over fossil jet fuel (762 €/t RJF) and emission mitigation cost (242 €/t CO2 avoided), averaged over 2020-2030, are relatively high compared to other mitigation options. However, the cost per passenger departing from an EU airport (0.9-4.1 €/passenger, depending whether all flights or only domestic flights are targeted) is modest and presents only a small supplement to the cost of carbon offsets (0.4-1.5 €/passenger) over this time period.
WHAT IS REQUIRED FOR DEPLOYMENT OF RENEWABLE JET FUEL IN THE EU?
The pace of RJF deployment in the period towards 2030 is decisive for the achievement of long-term climate targets. The development trajectory should make sense from a technical, environmental, economic point of view while providing sufficient scale-up potential beyond 2030. From the assessed scenarios, the Strategic Action scenario adheres reasonably well to these requirements. The key preconditions for RJF deployment towards 2030 in the EU are presented below:
A structural financing mechanism to bridge the price premium over fossil jet fuel is essential to foster renewable jet fuel deployment A price premium on RJF is likely to remain beyond 2030. A structural financing mechanism is therefore cardinal to establish a stable end market and stimulate the deployment of RJF. Due to the relatively high price premium over fossil jet fuel (762 €/t RJF) and emission mitigation cost (242 €/t CO2 avoided), a level playing field with other bioenergy sectors on the basis of these indicators (in e.g. the Renewable Energy Directive or EU Emission Trading System) will likely be inadequate to stimulate
V | Scenarios and Preconditions for Renewable Jet Fuel Deployment towards 2030

RJF uptake. Supplementary measures, such as guaranteed feed-in tariffs, are therefore necessary. Using public investments for such measures may be justified on the grounds of potential environmental and macro-economic benefits of RJF deployment (e.g. emission reduction, health impact, employment, energy security). Alternatively, fund raising may be coupled to the expenses for carbon offsets at a global (CORSIA), EU (EU-ETS), national or airport/airline level. A modest surcharge of a 0.9-4.1 €/passenger (roughly twice the cost of carbon offsets), aggregated in a ‘RJF deployment fund’, is estimated to be sufficient to support 5% RJF deployment in 2030.
Renewable jet fuel deployment requires substantial research, development and demonstration efforts and high feedstock mobilization rates Building a new industry takes time. Given the growing urgency of emission reductions, it is important to combine early actions with a long-term strategic vision. The HEFA technology based on sustainable oils will likely remain the only commercially available option to produce RJF on the short term. On the medium term, commercialization of technologies based on lignocellulosic biomass should be stimulated to unlock underutilized biomass feedstocks and scale up RJF volumes. On the long term, processes based on other feedstocks, such as algae or CO2, may provide even better alternatives. Research and development support and de-risking mechanisms (e.g. loan guarantees, CAPEX grants or a sub-target for lignocellulosic biofuels) should be in place to create a stable environment in which technologies can be developed and commercialized. At the same time, efficient cultivation, mobilization and transportation of sustainable feedstocks is essential to satisfy all demand sectors, especially after 2030.
Robust sustainability standards are key to guarantee sustainable production and global use of renewable jet fuelSustainable practice is a prerequisite for the widespread use of RJF. The transparency, stability, consistency and flexibility of sustainability frameworks are key to their success. Transparency and stability should give actors in the supply chain (e.g. investors, feedstock suppliers, technology developers) certainty about the compliance of long-term investments with sustainability standards of biofuel support schemes. Sustainability frameworks based on clear sustainability indicators (e.g. emission reduction) can incorporate more flexibility to correct unforeseen adverse sustainability effects than frameworks using categorization on the basis of fuel/feedstock categories. It is important to discourage unsustainable practice, but also award positive environmental or socio-economic impacts. Certification procedures should be internationally consistent yet flexible to capture region-specific contexts. Furthermore, cross-sectoral consistency with adjacent markets (e.g. road biofuels) is encouraged.
CumulativeEmission Gap
232 Mt CO2
Average costper passenger
0.9-4.1 €/pax
Deployment of renewable jet fuel according to the Strategic Action scenario (2020-2030)
Average RJFpremium
762 €/t
EU RJF productioncapacity in 2030
3.4 Mt/yr
Total expenses
10.4 billion €
Figure ES.2 Key performance indicators of the Strategic Action scenario (2020-2030)
VI | Renewable Jet Fuel in the European Union
1. The need for renewable jet fuels 12. The role of renewable jet fuel in covering the Emission Gap of the aviation industry 33. Available options to produce renewable jet fuels today and in the future 74. Future deployment scenarios for renewable jet fuels in the EU 125. Strategic Action for a more sustainable aviation sector 176. What is required for deployment of renewable jet fuel in the EU? 21
About RENJET 23References 24
Contents
VII | Scenarios and Preconditions for Renewable Jet Fuel Deployment towards 2030

VIII | Renewable Jet Fuel in the European Union
The current share of global CO2 emissions ascribed to aviation is 2%. However, this share may increase considerably due to rapid industry growth.1 At the same time, there are limited options to decarbonize the sector.2 Although international aviation is not covered by the Paris agreement at COP21, the sector has the ambition to cap aviation CO2 emissions from 2020 onwards and halve CO2 emissions by 2050 compared to a 2005 baseline.3 In line with this commitment, the general assembly of the International Civil Aviation Organization (ICAO) recently agreed to the introduction of a global Market-based Measure. This measure prescribes that any annual increase in CO2 emissions beyond 2020 from international aviation between participating states need to be offset through the Carbon Offsetting and Reduction Scheme for International Aviation (CORSIA).4 Following the ICAO agreement, the European Union (EU) recently proposed to continue to include intra-EU flights (including domestic flights) in the EU Emission Trading Scheme (ETS).5
While the CORSIA and EU ETS allows the aviation sector to offset CO2 emissions outside the industry using carbon offsets, stakeholders agree that structural solutions within the industry are needed to achieve sustainable growth.4,6,7 Besides expected efficiency gains and operational improvements, Renewable Jet Fuel (RJF), a drop-in fuel derived from renewable energy sources (e.g. biomass), is considered an important measure to reduce CO2 emissions in aviation in the coming decades.3,8,9 Several (European) airlines have recognized the need for RJF adoption, as illustrated by a number of recent RJF offtake agreements10-12, investments in technology providers13,14, and the broader commitment of airlines associated with the Sustainable Aviation Fuel Users Group (SAFUG) to accelerate and commercialize RJF.9
Governments are gradually incorporating support for RJF in their policies. Whereas RJF is already incorporated in the United States Renewable Fuel Standard 215, it is currently not significantly incentivized on an EU level (as EU ETS only provides a minor incentive).16,17 In 2011, the European Advanced Biofuels Flightpath Initiative was launched to realize 2 million tonnes of RJF uptake in 2020
On why emission reductions in aviation are necessary and what measures exist to achieve this
1 The need for renewable jet fuels
READING GUIDE
Chapter 2 quantifies the CO2 Emission Gap of the EU aviation sector and presents the life-cycle emission performance of various RJF production pathways. Chapter 3 provides insight in the current and future availability of feedstocks and the fuel readiness level and cost performance of RJF conversion technologies. In chapter 4, three RJF deployment scenarios (varying the level of RJF deployment) are introduced and evaluated in terms of feedstock-technology portfolio and cost. Based on the findings of chapter 4, a Strategic Action scenario is formulated chapter 5. The chapter discusses the results and implications of such scenario. Chapter 6 lists the required preconditions for deployment of RJF towards 2030.
1 | Scenarios and Preconditions for Renewable Jet Fuel Deployment towards 2030

(approximately 4% of the EU jet fuel consumption).7 Despite these efforts, RJF production volumes in the EU (or globally) are currently negligible as a result of low production capacity and high prices.18 It is therefore unlikely that the Flightpath target will be achieved by 2020. An EU biofuel strategy for the period 2021-2030, including RJF, is currently under development (Renewable Energy Directive II).19
Choices made towards 2030 will be essential for the decarbonization of aviation, especially given the urgency to reduce emissions to achieve the targets of COP21. Therefore, this report examines four RJF deployment scenarios towards 2030 and identifies key preconditions for the introduction of RJF in the EU. The scenarios are evaluated in the context of the EU bioenergy system to capture the interaction with other biomass demand sectors (e.g. road biofuels). The insights may be used as an input for a European roadmap for the deployment of RJF.
2 | Renewable Jet Fuel in the European Union
The Emission Gap in aviation grows rapidly towards 2030 and beyond; carbon offsets and the introduction of RJF should cover this gapThe aviation industry is growing rapidly. While global air traffic is projected to grow by 4.9% annually up to 2040, jet fuel consumption is expected to grow by 3.5-4.6%.2 The current share of global CO2 emissions ascribed to the aviation sector (both domestic and international) is 2%, but this may increase to 22% by 2050 if mitigation efforts fall behind those of other sectors.1 At the same time, the aviation industry has committed itself to capping CO2 emissions from 2020 onwards and halving CO2 emissions in 2050 with respect to 2005 levels.20 Despite the anticipated efficiency gains and operational improvements, an Emission Gap between the projected CO2 emissions and industry target remains.
Figure 2.1 shows that the Emission Gap for EU aviation sector is projected to grow from 34 million tonne (Mt) CO2/yr by 2030 to 264 Mt CO2/yr by 2050, adding up to a cumulative gap of 3.2 billion tonne CO2 over the period 2020-2050. The Emission Gap for global aviation was estimated to be roughly 18 billion tonne CO2 over the same period.1 Although the industry target is ambitious, it lies above an emission pathway in which all sectors reduce their CO2 emissions by an equal share (indicated by RCP 2.6). The RCP 2.6 pathway will likely lead to a temperature rise ranging from 0.9 to 2.3 oC (mean 1.6). Concerted action is hence required to cover this Emission Gap.
In the vision of intergovernmental and industry organizations (e.g. ATAG, IATA and ICAO), the Emission Gap may be closed by decreasing the carbon intensity of its fuel or achieving emission reductions outside the aviation industry by acquiring carbon offsets through the CORSIA or EU ETS. Although propulsion systems using e.g. electricity and hydrogen may be promising options towards the end of this century, renewable jet fuel (RJF), a drop-in fuel derived from biomass, is the most technically and economically feasible option in the coming decades to decrease the carbon intensity of aviation fuel.8 Although carbon offsets are a cheaper CO2 abatement option compared to RJF24, they have clear limitations. First, the global availability of carbon offsets of an acceptable environmental integrity level is limited and has been quantified to be just sufficient to achieve carbon-neutral growth in the aviation sector in the period 2020-2035.25 After this period, the cost may rise while the supply becomes tighter as we move towards a zero CO2 emissions society (as required for a 2 oC target).26 Secondly, offsetting does not provide a structural solution to the emission growth in the industry. Hence, the introduction of RJF is likely necessary as an additional measure to achieve deep carbon reductions over the long term.
RJF can reduce life-cycle emissions significantly depending on the production pathwayThis report focuses on the CO2 combustion emissions only, as these are the most important direct greenhouse gas emissions of the aviation industry. Under the assumption of carbon neutrality of biomass*, the combustion CO2 emissions of RJF attributed to the aviation sector are zero. According to the IPCC Guidelines for National Greenhouse Gas Inventories, other emissions in the life-cycle of fossil jet fuel (e.g. extraction and oil refining) or RJF (e.g. cultivation, production) are allocated to other sectors (e.g. agriculture).27 As a result, a full substitution of fossil jet fuel by RJF could lead to zero
On how much CO2 emission reduction is required in aviation and how RJF can reduce CO2 emissions
2 The role of renewable jet fuel in covering the Emission Gap of the aviation industry
3 | Scenarios and Preconditions for Renewable Jet Fuel Deployment towards 2030

CO2 emissions allocated to the aviation sector, irrespective of the feedstock-technology combination, production context or management practice used to produce the RJF.
Nonetheless, it is important to examine the life-cycle greenhouse gas performance of RJF production to avoid indirect adverse sustainability impacts. Figure 2.2 shows that different RJF conversion pathways yield a wide range of life-cycle greenhouse gas emission reductions.24 Most pathways yield greenhouse gas emissions reductions exceeding 60% compared to fossil jet fuel. However, some fail to reach a 50% reduction threshold due to high greenhouse gas emissions associated with feedstock cultivation (e.g. fertilizer) or hydrogen consumption. RJF based on residues and lignocellulosic crops generally show higher greenhouse gas emission reductions than RJF from food crops. The Fischer-Tropsch technology structurally yields high greenhouse gas reductions. As hydrogen consumption is a key contributor to the overall life-cycle greenhouse gas emissions, alternative technologies to produce hydrogen (e.g. electrolysis based on renewable energy) could further improve the greenhouse gas performance. Pathways producing relatively high-purity streams of CO2 (e.g. Fischer-Tropsch or fermentation-based) are particularly suited for the application of a bioenergy and carbon capture and storage (BECCS) add-on to achieve negative emission performance.24 Moreover, new feedstocks and technologies available on the medium to long term (e.g. carbon sequestering perennial crops or carbon capture and use (CCU) pathways) may provide even deeper emission reductions. Furthermore, the fossil jet fuel benchmark will likely increase over
* Carbon neutrality assumes that combustion CO2 emissions from RJF are sequestered by the biomass and hence
zero. Although this assumption is embedded in many policies, its validity is debated, especially for feedstocks
with long rotation times such as forestry biomass.55
0
100
200
300
400
500
600
700
2005 2010
Com
bust
ion
emis
sion
s fr
omEU
avi
atio
n (M
t C
O2)
2015 2020 205020352030 204520402025
Emission gap for EU aviation
Emission GapEfficiency gains and operational improvements
Industry TargetRCP 2.6 scenario
Figure 2.1 The Emission Gap for the EU aviation sector. Combustion CO2 emissions are calculated based on the jet fuel consumption in the EU, i.e. all jet fuel delivered at EU-28 airports.21 In line with the EU Emission Trading Scheme an emission factor of 3.15 tonne CO2/tonne jet fuel was used.22 This factor only captures the CO2 emissions from combustion; neither the CO2 emissions from other life-cycle stages nor non-CO2 impacts are included (see Box 1). This figure assumes a 3.8% annual revenue tonne kilometers (RTK) growth (extrapolated for the period 2025-2050) and 1.5% annual efficiency improvements (tonne jet fuel/RTK), leading to a CO2 emission increase of 2.3% per annum.3,23 The industry target line follows carbon-neutral growth after 2020 and assumes a decline starting in 2035 to reach 50% emission reductions in 2050. The dashed line indicates the Representative Concentration Pathway (RCP) 2.6, which represents a pathway likely leading to a temperature rise ranging from 0.9 to 2.3 oC (mean 1.6), relative to pre-industrial times.1 The RCP 2.6 pathway for aviation is determined by keeping the share of global CO2 emissions of the aviation sector constant after 2020. The global RCP 2.6 pathway was translated to a European pathway using the projected industry target emissions on a global (Cames et al.)1 and EU level (own calculations).
4 | Renewable Jet Fuel in the European Union

time as the trend towards the utilization of more sour (high sulfur) and heavy oil continues.28,29 It should be noted that even though technological performance is relatively universal, emissions from feedstock cultivation are highly circumstantial, as management practices and feedstock yield may vary significantly within and between geographies.30
A robust global sustainability framework is required to avoid adverse sustainability effectsIt is cardinal to develop a robust sustainability framework for the production of RJF to avoid adverse direct and indirect effects. Box 1 provides an overview of key environmental impacts related to RJF. SAFUG, a group of airlines representing 33% of global jet fuel demand, has committed to using only RJF from biomass sources that meet minimum sustainability requirements.9 According to these requirements, RJF should achieve ‘significant’ life-cycle greenhouse gas emission reductions, positively affect socio-economic conditions, and avoid (indirect) land use change or adverse impacts on food and water supply, biodiversity and ecosystems. Although these requirements have not been quantified, it shows the commitment of the sector to build on prior experience with sustainability issues gained with e.g. road biofuels.
Given the international character of the aviation sector, the widespread adoption of RJF necessitates the development of a global meta-standard for sustainable production of RJF. The sustainability framework and should be internationally recognized yet flexible to capture regional specific situations. Global coverage is particularly important if RJF is to be included and/or incentivized as part of a global Market-Based Measure.24
40
55
0
10
20
30
40
50
60
70
80
90
100
47
Use
d C
ooki
ng o
il
6
Foss
il je
t fu
el
88
RED (-35%)
Suga
r ca
ne
44
Wel
l-to-
Wak
e G
HG
em
isio
ns(g
CO
2eq
/MJ
RJF)
Fore
stry
res
idue
s
RED (-60%)
RED (-50%)
26
Cor
n
40
Fore
stry
res
idue
s (in
-situ
)
55
Fore
stry
res
idue
s (e
x-si
tu)
27
Fore
stry
res
idue
s (in
-situ
)
Cor
n st
over
22
13
Cam
elin
a
Fore
stry
res
idue
s (e
x-si
tu)
20 18
Suga
r ca
ne
Downstream distributionHydrogen
ConversionUpstream transport
Combustion emissionsProduction of fossil jet fuel
Pre-processingFeedstock cultivation
HydroprocessedEsters and Fatty
Acids
Fischer-Tropsch HydrothermalLiquefaction
Pyrolysis Alcohol-to-Jet
Direct Sugarsto Hydrocarbons
Life-ycle greenhouse gas performance of different renewable jet fuel conversion pathways
Figure 2.2 Life-cycle greenhouse gas emissions in gCO2eq/MJ jet fuel for fossil jet fuel and RJF produced using various conversion pathways.24 The results were calculated in a United States context (except for sugarcane which was calculated in a Brazilian context) using the Greenhouse gasses, Regulated Emissions and Energy use in Transportation (GREET). Energy allocation was applied. The potential contribution from greenhouse gas emissions from (indirect) land use change was excluded. Hydrogen is produced from natural gas, except for the in-situ Hydrothermal Liquefaction and Pyrolysis where it is produced from biogenic process gases. The emission thresholds indicate the thresholds for biofuels utilized by the EU Renewable Energy Directive I.
5 | Scenarios and Preconditions for Renewable Jet Fuel Deployment towards 2030

BOX 1: IMPORTANT ENVIRONMENTAL IMPAC TS REL ATED TO RJF
There are various sustainability effects which affect the ability of RJF to decrease the contribution of aviation to global warming. As most of these transcend the domain of RJF, learnings should be drawn from other bioenergy sectors like road biofuels and bioelectricity. Wider sustainability concerns should be addressed and quantified on a case-specific basis.
Direct Land Use Change (LUC) greenhouse gas emissions are caused by changes to terrestrial carbon stock as a result of changing former land use to cultivate biomass for biofuel purposes. Direct LUC-related greenhouse gas emissions may be positive (net emissions) or negative (net sequestration) depending on the context. For example, feedstock cultivation may increase the terrestrial carbon stock relative to the reference vegetation (e.g. perennial grasses grown on marginal lands), thus acting as a carbon sink. Changing land use for biomass cultivation or diverting feedstocks from other markets for biofuel production purposes might instigate land use changes elsewhere to compensate for the lost land/product functions, causing indirect LUC emissions. Although there seems to be a general consensus that LUC effects should not be overlooked, they are highly case-specific, challenging to quantify and surrounded by considerable uncertainties.56,57
Non-CO2 emissions caused by jet fuel combustion such as water vapor, NOx, soot, sulfate aerosols, contrails and contrail-induced cirrus formation increase the radiative forcing by a factor 2-5 relative to the impact of CO2 combustion emissions alone.58 As the cumulative non-CO2 impacts of RJF are expected to be relatively similar to fossil jet fuel, the impact of RJF on climate change mitigation is likely to be lower than the life-cycle emission reduction suggests.59 On the contrary, RJF has shown to reduce certain non-CO2 emissions, especially SOx and particulate matter emissions, thus having a positive impact on air quality and health, especially around airports.60,61
Carbon debt is the temporal imbalance between the time of emission and sequestration of the carbon. Due to this imbalance, it might take years or even decades before displacing fossil fuels outweighs the CO2 emissions from RJF production (as captured by the greenhouse gas payback period). This effect is highly dependent on the type of feedstock, management practices and calculation assumptions (e.g. decay times, reference scenario).52 Nonetheless, this effect increases the urgency of RJF adoption, as the CO2 emission savings are not immediate.
Wider sustainability concerns, such as water use, land use, air quality, health effects, socio-economic factors, displacement effects, food security, and biodiversity, should be quantified on a case-specific basis to avoid adverse sustainability effects.
6 | Renewable Jet Fuel in the European Union
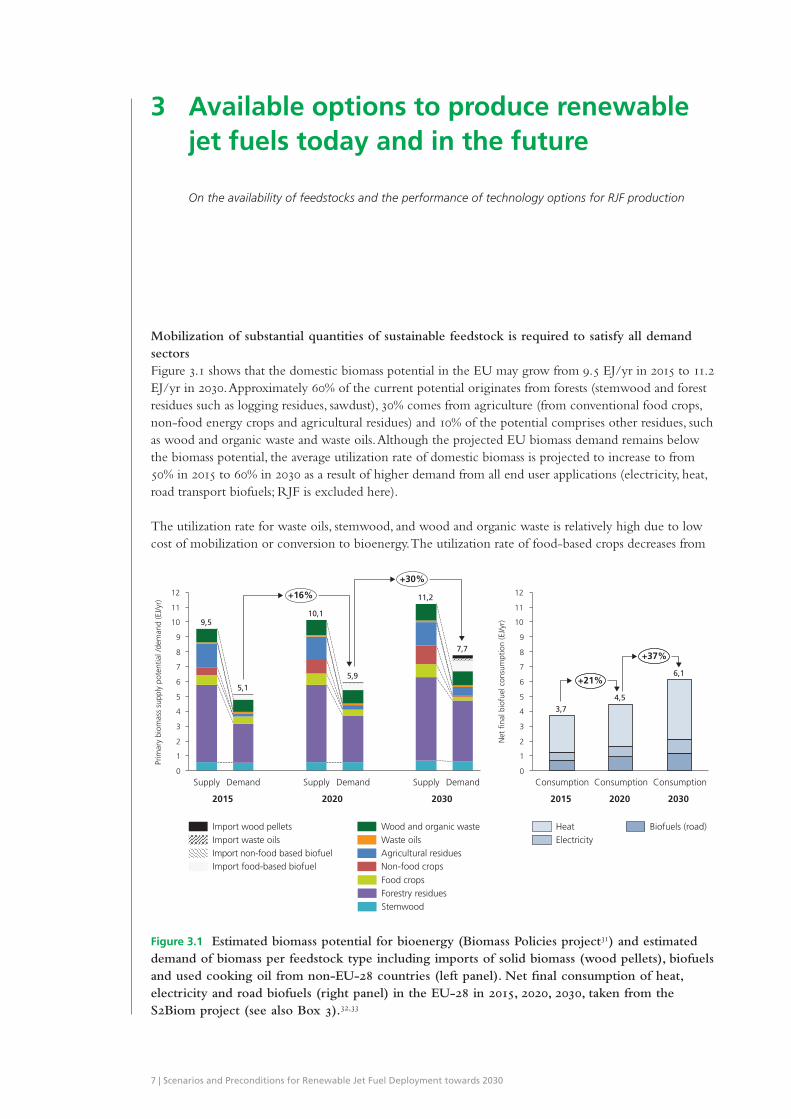
Mobilization of substantial quantities of sustainable feedstock is required to satisfy all demand sectorsFigure 3.1 shows that the domestic biomass potential in the EU may grow from 9.5 EJ/yr in 2015 to 11.2 EJ/yr in 2030. Approximately 60% of the current potential originates from forests (stemwood and forest residues such as logging residues, sawdust), 30% comes from agriculture (from conventional food crops, non-food energy crops and agricultural residues) and 10% of the potential comprises other residues, such as wood and organic waste and waste oils. Although the projected EU biomass demand remains below the biomass potential, the average utilization rate of domestic biomass is projected to increase to from 50% in 2015 to 60% in 2030 as a result of higher demand from all end user applications (electricity, heat, road transport biofuels; RJF is excluded here).
The utilization rate for waste oils, stemwood, and wood and organic waste is relatively high due to low cost of mobilization or conversion to bioenergy. The utilization rate of food-based crops decreases from
On the availability of feedstocks and the performance of technology options for RJF production
3 Available options to produce renewable jet fuels today and in the future
9
12
0
8
11
4
3
5
7
6
2
1
10
Prim
ary
biom
ass
supp
ly p
oten
tial /
dem
and
(EJ/
yr)
9,5 10,1
7,7
11,2
Supply Supply
5,9
Demand
5,1
+30%
+16%
Supply Demand Demand
Import waste oils
Import food-based biofuelImport non-food based biofuel
Import wood pellets
Agricultural residuesWaste oilsWood and organic waste
Non-food crops
Food crops
Stemwood Forestry residues
Biomass potential and demand in the EU (excl. RJF demand)(2015-2030)
7
10
11
12
9
4
1
8
6
5
3
2
0
3,7
Net
fina
l bio
fuel
con
sum
ptio
n (E
J/yr
)
+21%
Consumption
6,1
Consumption
4,5
Consumption
+37%
Biofuels (road)HeatElectricity
Net final bioenergy consumption inthe EU (excl. RJF demand) (2015-2030)
2015 2020 2030 2015 2020 2030
Figure 3.1 Estimated biomass potential for bioenergy (Biomass Policies project31) and estimated demand of biomass per feedstock type including imports of solid biomass (wood pellets), biofuels and used cooking oil from non-EU-28 countries (left panel). Net final consumption of heat, electricity and road biofuels (right panel) in the EU-28 in 2015, 2020, 2030, taken from the S2Biom project (see also Box 3).32,33
7 | Scenarios and Preconditions for Renewable Jet Fuel Deployment towards 2030
71% in 2015 to 26% 2030, because the share of food-based crops in the EU transport fuel mix was capped to 7%, as a result of the adoption of the iLUC directive (EU 2015/1513).34 On the contrary, the double counting of biofuels derived from waste and residues towards the EU targets up to 2020 incentivizes the production and import of these biofuels. This measure has particularly lead to a high strain on the supply of waste oils, since these feedstocks are relatively easy to convert to fuels, but available in limited quantities only.
The potential of agricultural and forest residues remains largely unexploited, even though this could provide vast amounts of biomass while having a relatively low impact on the environment. Due to this reason, the EU aims to stimulate the utilization of biofuels from waste and lignocellulosic feedstocks (‘advanced biofuels’). Whereas the iLUC directive (EU 2015/1513) sets an indicative target of 0.5% for advanced biofuels in 201734, the proposal of the Renewable Energy Directive II contains a mandatory target of 3.6% in 2030 for advanced biofuels while capping the contribution of biofuels from food crops, waste oils and molasses.19 This proposal has not been included in this analysis.
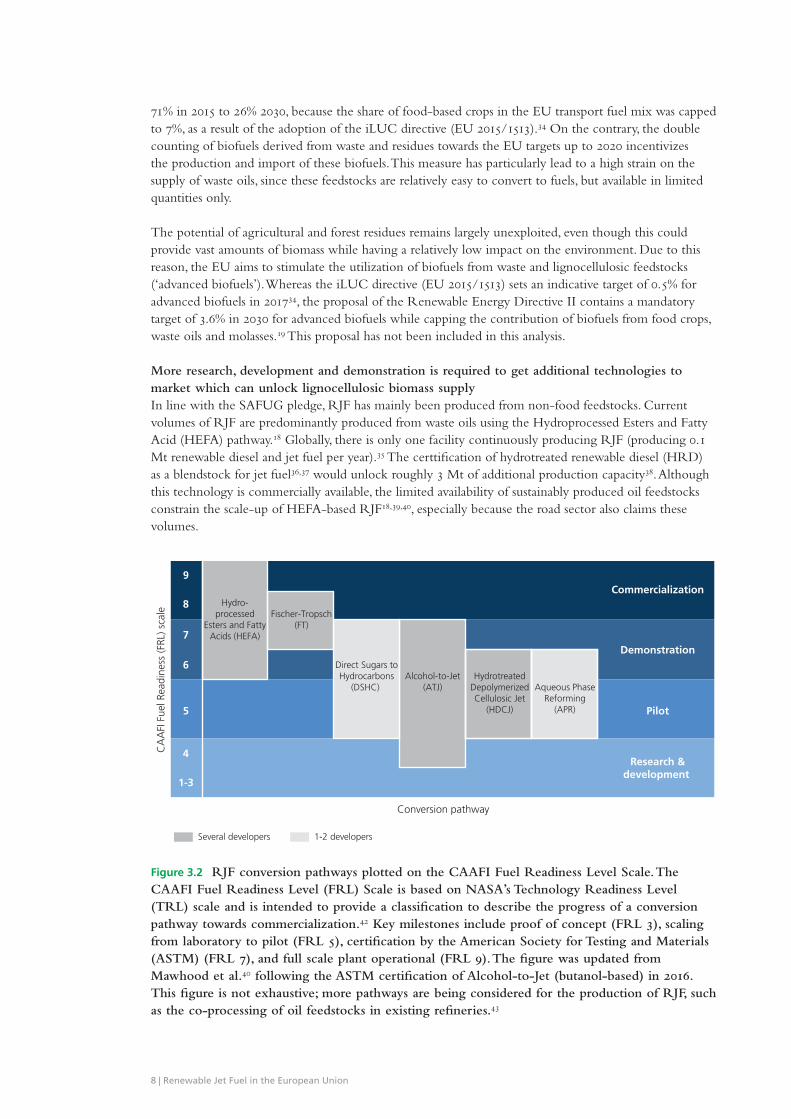
More research, development and demonstration is required to get additional technologies to market which can unlock lignocellulosic biomass supplyIn line with the SAFUG pledge, RJF has mainly been produced from non-food feedstocks. Current volumes of RJF are predominantly produced from waste oils using the Hydroprocessed Esters and Fatty Acid (HEFA) pathway.18 Globally, there is only one facility continuously producing RJF (producing 0.1 Mt renewable diesel and jet fuel per year).35 The certtification of hydrotreated renewable diesel (HRD) as a blendstock for jet fuel36,37 would unlock roughly 3 Mt of additional production capacity38. Although this technology is commercially available, the limited availability of sustainably produced oil feedstocks constrain the scale-up of HEFA-based RJF18,39,40, especially because the road sector also claims these volumes.
Commercialization
Demonstration
Pilot
Research &development
Hydro-processed
Esters and FattyAcids (HEFA)
Fischer-Tropsch(FT)
Direct Sugars toHydrocarbons
(DSHC) Alcohol-to-Jet
(ATJ)Hydrotreated
DepolymerizedCellulosic Jet
(HDCJ)
Aqueous PhaseReforming
(APR)
9
8
7
4
5
6
1-3
CA
AFI
Fue
l Rea
dine
ss (F
RL) s
cale
Conversion pathway
Several developers 1-2 developers
Renewable jet fuel conversion pathways on the CAAFI Fuel Readiness Level (FRL) scale
Figure 3.2 RJF conversion pathways plotted on the CAAFI Fuel Readiness Level Scale. The CAAFI Fuel Readiness Level (FRL) Scale is based on NASA’s Technology Readiness Level (TRL) scale and is intended to provide a classification to describe the progress of a conversion pathway towards commercialization.42 Key milestones include proof of concept (FRL 3), scaling from laboratory to pilot (FRL 5), certification by the American Society for Testing and Materials (ASTM) (FRL 7), and full scale plant operational (FRL 9). The figure was updated from Mawhood et al.40 following the ASTM certification of Alcohol-to-Jet (butanol-based) in 2016. This figure is not exhaustive; more pathways are being considered for the production of RJF, such as the co-processing of oil feedstocks in existing refineries.43
8 | Renewable Jet Fuel in the European Union

There are other technologies capable of converting more abundant sources of (lignocellulosic) biomass to RJF, such as Fischer-Tropsch synthesis, Pyrolysis, Hydrothermal Liquefaction (HTL), Alcohol-to-Jet (ATJ), and Direct Sugars to Hydrocarbons (DSHC), see Box 2. For many of these technologies (a part
BOX 2: DIFFERENT RENEWABLE JET FUEL CONVERSION TECHNOLOGIES
Renewable jet fuel conversion pathwaysIn principle, biomass-based RJF can be produced from oils (e.g. oil crops, used cooking oil, tallow), lignocellulosic biomass (e.g. corn stover, forestry residues, municipal solid waste), or biomass containing sugar or starch. The main conversion pathways to produce RJF from these feedstocks are shown in Figure 3.3. The conversion pathways can be subdivided into thermochemical, biochemical or hybrid pathways (combining the former two). Thermochemical pathways include Fischer-Tropsch, Hydroprocessed Esters and Fatty Acids (HEFA) and Hydrotreated Depolymerized Cellulosic Jet (HDCJ). HDCJ includes liquefaction technologies like pyrolysis and Hydrothermal Liquefaction (HTL). These technologies use high temperatures and/or pressures to produce a product which is generally a mixture of paraffinic and/or aromatic hydrocarbons. Biochemical pathways utilize enzymes, micro-organisms or bacteria to convert its sugars to specific molecules like ethanol or butanol (in case of Alcohol-to-Jet), or more complex molecules like farnesene (in case of Direct Sugars to Hydrocarbons (DSHC). Generally these molecules still require upgrading to RJF, for which thermochemical processes like hydroprocessing are used. As most pathways do not necessarily produce all the compounds present in fossil jet fuel, blend walls ranging from 10% (DSHC) to 50% (HEFA) are included in the ASTM specification of the RJF type. There are pathways which are able to produce a full drop-in, such as Fischer-Tropsch (ASTM certified) and ATJ (not yet ASTM certified). The figure below is not exhaustive; other feedstock-technology combinations (e.g. solar energy-based technologies) have also shown to be able to produce jet fuel-ranged hydrocarbons.
Figure 3.3 Renewable jet fuel conversion pathways, adapted from Mawhood et al.40
Pre-treatment
Gasification
Pyrolysis/liquefaction
Fermentation toalcohols
Fermentation tohydrocarbons
Fischer-Tropschsynthesis
Dehydration &oligomerization
Oil feedstocks
Lignocellulosicfeedstocks
Sugar feedstocks
Hydroprocessing& distillation
Hydroprocessing& distillation
Distillation
Hydroprocessing& distillation
Hydroprocessing& distillation
Hydroprocessed esters and
fatty acids (HEFA)
Hydrotreated depolymerizedcellulosic jet (HDCJ)
Direct sugars to hydrocarbons
(DSHC) Fischer-Tropsch (FT)
Alcohol to Jet (ATJ)
Legend
Overview of renewable jet fuel conversion pathways
Renewable jet fuel (RJF)Hydrolysis Starch feedstocks
9 | Scenarios and Preconditions for Renewable Jet Fuel Deployment towards 2030
of) the production process is yet to be demonstrated on a commercial scale.40 Figure 3.2 shows that two conversion pathways have reached the commercialization stage (HEFA and Fischer-Tropsch). However, progress in Fischer-Tropsch technology is mainly based on fossil fuel (coal and natural gas). DSHC and ATJ (butanol-based) have acquired certification by the American Society of Testing and Materials (ASTM) which is required before fuel can be used in commercial aircraft. Several others are still awaiting scale-up and ASTM certification. Although acquiring ASTM certification may require considerable test volumes and funding, it presents just one of the hurdles of technology developers towards commercialization (besides e.g. upscaling or financing).41
Moving up the technologies up the FRL requires considerable efforts and funding. Assuming a progression rate of 3-5 years per FRL, several technologies can be expected to progress by up to two levels between now and 2025, provided that they are actively developed. Such development is cardinal in light of the RJF volumes needed to cover the Emission Gap. Relative to other products (e.g. road biofuels), RJF generally requires higher quality standards and a more lengthy certification process. As such, a clear market perspective for technology developers and facility operators is needed (established by e.g. policy) to justify development efforts towards RJF production.
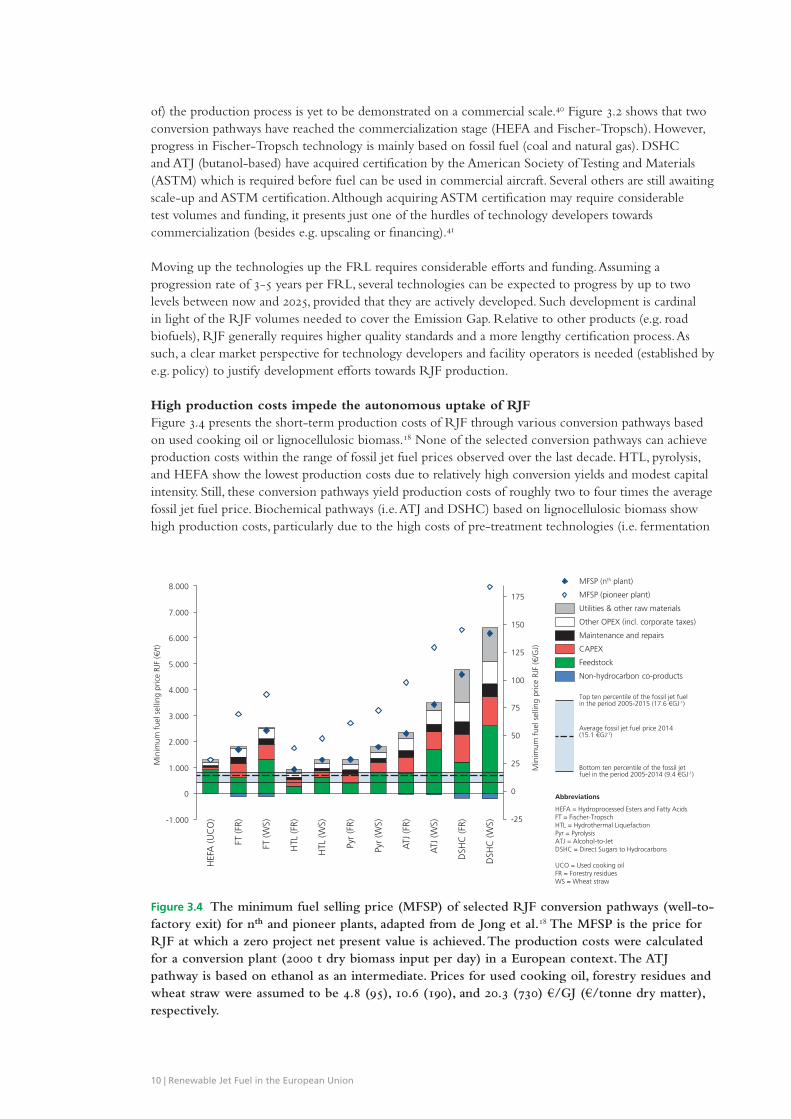
High production costs impede the autonomous uptake of RJFFigure 3.4 presents the short-term production costs of RJF through various conversion pathways based on used cooking oil or lignocellulosic biomass.18 None of the selected conversion pathways can achieve production costs within the range of fossil jet fuel prices observed over the last decade. HTL, pyrolysis, and HEFA show the lowest production costs due to relatively high conversion yields and modest capital intensity. Still, these conversion pathways yield production costs of roughly two to four times the average fossil jet fuel price. Biochemical pathways (i.e. ATJ and DSHC) based on lignocellulosic biomass show high production costs, particularly due to the high costs of pre-treatment technologies (i.e. fermentation
Figure 3.4 The minimum fuel selling price (MFSP) of selected RJF conversion pathways (well-to-factory exit) for nth and pioneer plants, adapted from de Jong et al.18 The MFSP is the price for RJF at which a zero project net present value is achieved. The production costs were calculated for a conversion plant (2000 t dry biomass input per day) in a European context. The ATJ pathway is based on ethanol as an intermediate. Prices for used cooking oil, forestry residues and wheat straw were assumed to be 4.8 (95), 10.6 (190), and 20.3 (730) €/GJ (€/tonne dry matter), respectively.
3.000
1.000
-1.000
125
75
150
0
50
0
8.000
7.000
175
100
-25
6.000
25
5.000
2.000
4.000
Min
imum
fue
l sel
ling
pric
e RJ
F (€
/t)
HTL
(WS)
Min
imum
fue
l sel
ling
pric
e RJ
F (€
/GJ)
Pyr
(WS)
HTL
(FR)
FT (W
S)
HEF
A (U
CO
)
ATJ
(FR)
ATJ
(WS)
DSH
C (F
R)
FT (F
R)
DSH
C (W
S)
Pyr
(FR)
MFSP (nth plant)
Non-hydrocarbon co-products
MFSP (pioneer plant)
Feedstock
CAPEX
Maintenance and repairs
Other OPEX (incl. corporate taxes)
Utilities & other raw materials
HEFA = Hydroprocessed Esters and Fatty AcidsFT = Fischer-TropschHTL = Hydrothermal LiquefactionPyr = PyrolysisATJ = Alcohol-to-JetDSHC = Direct Sugars to Hydrocarbons
UCO = Used cooking oilFR = Forestry residuesWS = Wheat straw
Average fossil jet fuel price 2014(15.1 €GJ-1)
Top ten percentile of the fossil jet fuelin the period 2005-2015 (17.6 €GJ-1)
Bottom ten percentile of the fossil jetfuel in the period 2005-2014 (9.4 €GJ-1)
Abbreviations
Minimum fuel selling price of renewable jet fuel conversion pathways for pioneer and nth plants
10 | Renewable Jet Fuel in the European Union
or sugar extraction). Furthermore, these pathways may face high opportunity cost when producing RJF, as they produce a high-valued intermediate (i.e. ethanol, butanol or farnasene). Fischer-Tropsch shows high capital intensity, but moderate overall production cost. It should be noted that the actual RJF price may be higher than the production costs presented here, since profit margins or cost incurred with downstream logistics (i.e. certification, transport and blending operations) are excluded.The nth plant economics presented in Figure 3.4 assumes the technologies to be mature and deployed commercially. However, as was established in the previous section, the first-of-a-kind commercial facility (‘pioneer plant’) has yet to be built for many RJF conversion pathways. When technological immaturity is incorporated in the cost assessment, Figure 3.4 shows that pioneer facilities yield higher production costs (as indicated by the open diamonds) due to uncertainty regarding technology performance and capital cost.
Increasing RJF volumes requires structural support and de-risking mechanismsAs the HEFA technology is commercially deployed today, it is currently the most feasible option from a cost and technology point of view. However, the limited availability of sustainable oils impedes significant scale-up of this technology (until e.g. algae oils become commercial). Other technology options, such as HTL, pyrolysis and Fischer-Tropsch, are promising, but have not yet been demonstrated on a commercial scale. Figure 3.4 shows that all technologies are likely to produce RJF at a price premium over fossil jet fuel, both on the short term (pioneer facilities) and on the medium term (nth plant facilities).
Even though the fossil jet fuel price may rise in the future and feedstock and conversion costs may be reduced through upscaling, technological learning-by-doing and integration.18,44-46 A price premium is likely to stay for at least the coming decade. Hence, increasing RJF volumes requires a structural support mechanism to cover the price premium to ensure a clear market perspective for producers. Furthermore, investors and technology developers need a de-risked environment to commercialize novel technologies. Such environment requires stable support measures and sustainability criteria.47 Moreover, successful showcases of RJF production in the EU may enable technological learning and boost investor confidence, hence drawing in investments into the sector.
11 | Scenarios and Preconditions for Renewable Jet Fuel Deployment towards 2030

Offsets and RJF may be used in varying shares to cover the Emission GapSection 2 showed that the Emission Gap in aviation may be covered by carbon offsets (through CORSIA or EU ETS) and/or the uptake of RJF. Section 3 discussed feedstock and technology options to produce RJF in the EU. This section explores three different scenarios towards 2030 which vary in the contribution of RJF to emission reductions in aviation21:
• The Business as Usual (BAU) scenario departs from current market circumstances in which EU-wide policies for RJF are absent and the price premium for RJF needs to be covered by airlines or external (public or private) co-funding. The BAU scenario assumes that 0.01% of annual jet fuel expenditure is used to cover the RJF premium. This scenario shows a mere increase from 5 kt* RJF consumption in 2015 to 13 kt RJF consumption in 2030.
• The Delayed Action scenario represents a strategy in which carbon offsets are used to buy time to gradually increase RJF volumes. It assumes a RJF share of 0.5% in 2021, exponentially growing to 5% in 2030 (3.4 Mt RJF). The production ramp-up of RJF (in terms of volume and annual growth rate) compares well with the early adoption of road biofuels in the EU during 1995-2005.48 Additional policy measures beyond the BAU (e.g. carbon tax, policy support, moderate blending target) are required to instigate this growth.
• The Full RJF Adoption scenario assumes that RJF covers the entire Emission Gap. In this scenario, RJF volumes will need to grow from 1.3 Mt in 2021 to 14 Mt by 2030, the latter of which is of the same order of the current volume of road biofuels produced in Europe.48 Such growth trajectory would require very ambitious policy targets.
The emission wedge for each scenario is visualized in Figure 4.1. The resulting RJF deployment scenarios were inserted in the RESolve-biomass model (see Box 3). This model covers different biomass demand sectors (electricity, heat, and biofuels), feedstocks, and technologies. The RJF production technologies discussed in section 3 were added to the model to explore the emerging feedstock-technology portfolio, analyze the interaction with other biomass demand sectors, and identify key preconditions to the implementation of RJF. The resulting feedstock-technology portfolio over time is shown in Figure 4.2.
Taking no action causes RJF volumes to remain nearly zero up to 2030 (and probably beyond)The BAU scenario shows that the production of biofuels for the road sector grows gradually over 2020-2030. However, the production of RJF is limited to 13 kt (0.6 PJ) in 2030. RJF is produced mainly as a co-product of HEFA and pyrolysis processes. However, due to the lack of demand from the aviation sector, many processes are used to produce diesel and gasoline instead of the full slate of biofuels. Hence, without joint action from stakeholders to cover the premium and create a demand for RJF, barely any RJF volumes will be produced and research, development and demonstration activities in the direction
On the implications of different strategies to cover the Emission Gap
4 Future deployment scenarios for renewable jet fuels in the EU
* In this report one tonne of jet fuel (renewable and fossil) equals 43.15 GJ, 331 gallons or 1253 liters.
12 | Renewable Jet Fuel in the European Union

of RJF will not be stimulated. This effectively means that the aviation sector will meet its carbon-neutral growth target until 2030 using carbon offsets. As a result, it will most likely completely fail to meet further carbon-neutral growth after 2030, since the required technological options and production facilities have not been developed and the amount of available carbon offsets may rapidly deplete after 2030 as total global CO2 emissions will need to reduce significantly to honor the COP21 agreements.
BOX 3: RESOLVE-B IOMASS MODEL
The RESolve-Biomass model is a European bioenergy model hosted by the Energy Research Centre of the Netherlands (ECN).62 It covers different biomass demand sectors (electricity, heat, and biofuels), feedstocks, and technologies. Biomass demand from the chemical and marine sector was excluded. For a certain demand, the model optimizes the technology portfolio and biomass supply such that the overall system costs (well-to-pump) are minimized. Key model constraints include the technology and feedstock scale-up rate, biomass availability (both domestic and import), pace of production capacity phase-out, blend walls, and a cap on food-based biofuels (7%). Time-dependent geospatial feedstock cost-supply data were adopted from the Biomass Policies project.31 Demand for (bio)energy in EU-28 was taken from the S2BIOM project.32,33 Price developments of fossil energy carriers were aligned with PRIMES estimates.49 Whereas bioenergy demand for heat and electricity purposes was established on a country level32,33, the demand for road biofuels was set to 9.4% of energy demand in the EU road transport sector in 2020 (including double counting for non-food biofuels), growing to 10% in 2030 (excluding double counting). The model contains technology-specific introduction years and learning rates. Learning effects are modelled endogenously; higher deployment of a technology leads to higher cost reductions through learning-by-doing.
The techno-economic data of HEFA, Fischer-Tropsch, pyrolysis, HTL and ATJ discussed in chapter 3 were added to RESolve. Hydrotreated Vegetable Oil (also commonly referred to as Renewable Diesel (HRD) or Green Diesel) was added as a blendstock for RJF.36 In line with the SAFUG pledge, food-based feedstocks were excluded for the production of RJF.9 All three aforementioned scenarios were run up to 2030; all scenarios include the same assumptions regarding biomass demand from other end markets.
0
100
200
300
400
500
600
700
2010
Combustion emissionsfrom EU aviation
(Mt CO2)
2040
2030
2050
2020
2005
Business as Usual
0
20
40
60
80
100
120
Jet fuel volume(Mt)
Combustion emissionsfrom EU aviation
(Mt CO2)Jet fuel volume
(Mt)
Combustion emissionsfrom EU aviation
(Mt CO2)Jet fuel volume
(Mt)
Renewable jet fuel volume (right axis)Fossil jet fuel volume (right axis)
0
100
200
300
400
500
600
700
2040
2020
2050
2030
2005
2010
Delayed Action
0
20
40
60
80
100
120
0
100
200
300
400
500
600
700
2030
2010
2040
2005
2050
2020
Full RJF Adoption
0
20
40
60
80
100
120
Efficiency improvements (left axis)
Carbon offsets (left axis)Renewable jet fuel adoption (left axis)
Three different renewable jet fuel deployment scenarios (2005-2006)
Figure 4.1 Combustion emission (left axis) and fuel volume (right axis) profile in aviation for the BAU, Delayed Action and Full RJF Adoption scenario. The Emission Gap was calculated using the same assumptions as in Figure 2.1. The adoption of RJF is assumed to decrease combustion CO2 emissions by 100% based on the carbon neutrality of biomass.
13 | Scenarios and Preconditions for Renewable Jet Fuel Deployment towards 2030
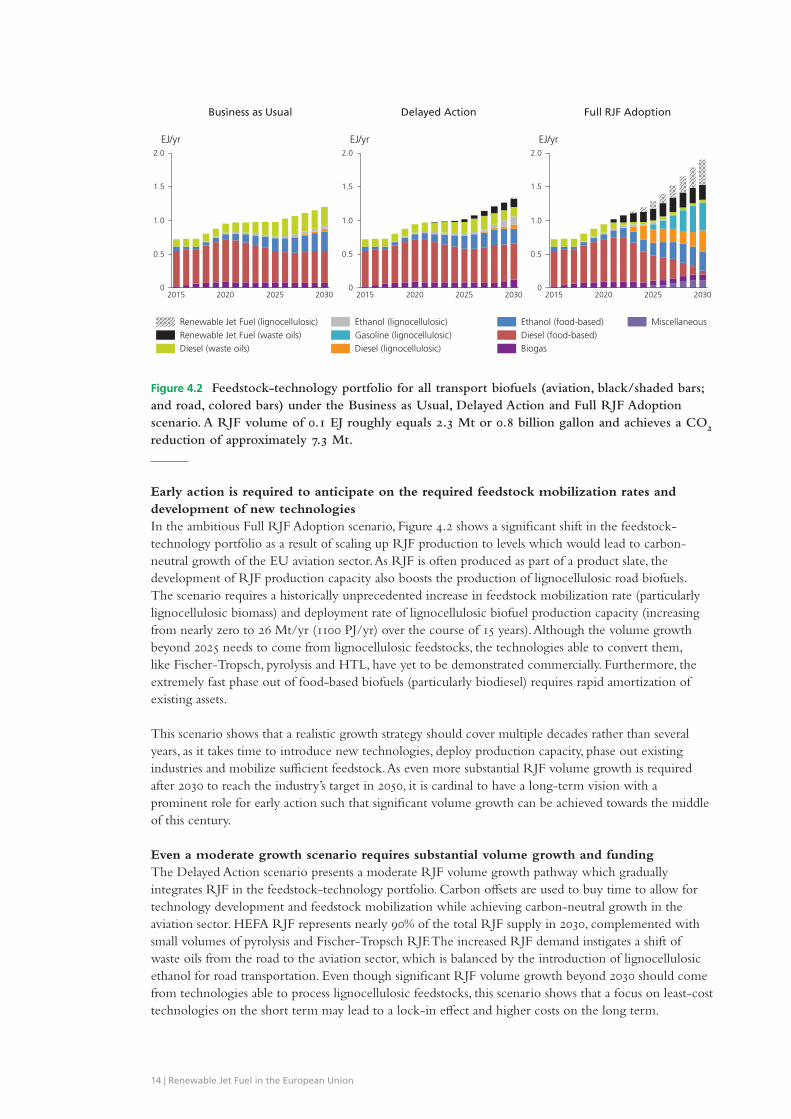
Early action is required to anticipate on the required feedstock mobilization rates and development of new technologiesIn the ambitious Full RJF Adoption scenario, Figure 4.2 shows a significant shift in the feedstock-technology portfolio as a result of scaling up RJF production to levels which would lead to carbon-neutral growth of the EU aviation sector. As RJF is often produced as part of a product slate, the development of RJF production capacity also boosts the production of lignocellulosic road biofuels. The scenario requires a historically unprecedented increase in feedstock mobilization rate (particularly lignocellulosic biomass) and deployment rate of lignocellulosic biofuel production capacity (increasing from nearly zero to 26 Mt/yr (1100 PJ/yr) over the course of 15 years). Although the volume growth beyond 2025 needs to come from lignocellulosic feedstocks, the technologies able to convert them, like Fischer-Tropsch, pyrolysis and HTL, have yet to be demonstrated commercially. Furthermore, the extremely fast phase out of food-based biofuels (particularly biodiesel) requires rapid amortization of existing assets.
This scenario shows that a realistic growth strategy should cover multiple decades rather than several years, as it takes time to introduce new technologies, deploy production capacity, phase out existing industries and mobilize sufficient feedstock. As even more substantial RJF volume growth is required after 2030 to reach the industry’s target in 2050, it is cardinal to have a long-term vision with a prominent role for early action such that significant volume growth can be achieved towards the middle of this century.
Even a moderate growth scenario requires substantial volume growth and fundingThe Delayed Action scenario presents a moderate RJF volume growth pathway which gradually integrates RJF in the feedstock-technology portfolio. Carbon offsets are used to buy time to allow for technology development and feedstock mobilization while achieving carbon-neutral growth in the aviation sector. HEFA RJF represents nearly 90% of the total RJF supply in 2030, complemented with small volumes of pyrolysis and Fischer-Tropsch RJF. The increased RJF demand instigates a shift of waste oils from the road to the aviation sector, which is balanced by the introduction of lignocellulosic ethanol for road transportation. Even though significant RJF volume growth beyond 2030 should come from technologies able to process lignocellulosic feedstocks, this scenario shows that a focus on least-cost technologies on the short term may lead to a lock-in effect and higher costs on the long term.
Figure 4.2 Feedstock-technology portfolio for all transport biofuels (aviation, black/shaded bars; and road, colored bars) under the Business as Usual, Delayed Action and Full RJF Adoption scenario. A RJF volume of 0.1 EJ roughly equals 2.3 Mt or 0.8 billion gallon and achieves a CO2 reduction of approximately 7.3 Mt.
Business as Usual Delayed Action Full RJF Adoption
2.0
1.5
1.0
0.5
0
EJ/yr
2015 2020 2025 2030
Diesel (lignocellulosic)
Ethanol (lignocellulosic)Gasoline (lignocellulosic)Renewable Jet Fuel (waste oils)
Renewable Jet Fuel (lignocellulosic)
Diesel (waste oils)
Miscellaneous
BiogasDiesel (food-based)Ethanol (food-based)
2.0
1.5
1.0
0.5
0 20302020 2025
EJ/yr
2015
2.0
1.5
0
0.5
1.0
EJ/yr
2015 20252020 2030
EU feedstock-technology portfolio under three different renewable jet fuel deployment scenarios (2015-2030)
14 | Renewable Jet Fuel in the European Union
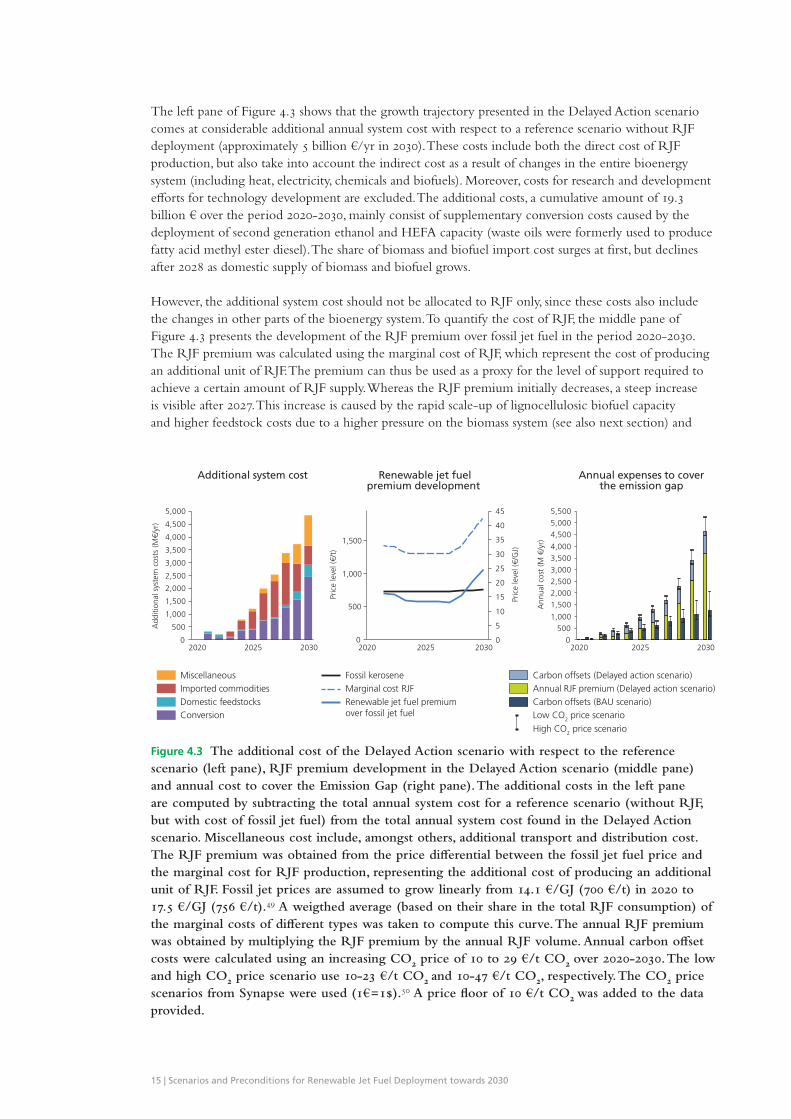
The left pane of Figure 4.3 shows that the growth trajectory presented in the Delayed Action scenario comes at considerable additional annual system cost with respect to a reference scenario without RJF deployment (approximately 5 billion €/yr in 2030). These costs include both the direct cost of RJF production, but also take into account the indirect cost as a result of changes in the entire bioenergy system (including heat, electricity, chemicals and biofuels). Moreover, costs for research and development efforts for technology development are excluded. The additional costs, a cumulative amount of 19.3 billion € over the period 2020-2030, mainly consist of supplementary conversion costs caused by the deployment of second generation ethanol and HEFA capacity (waste oils were formerly used to produce fatty acid methyl ester diesel). The share of biomass and biofuel import cost surges at first, but declines after 2028 as domestic supply of biomass and biofuel grows.
However, the additional system cost should not be allocated to RJF only, since these costs also include the changes in other parts of the bioenergy system. To quantify the cost of RJF, the middle pane of Figure 4.3 presents the development of the RJF premium over fossil jet fuel in the period 2020-2030. The RJF premium was calculated using the marginal cost of RJF, which represent the cost of producing an additional unit of RJF. The premium can thus be used as a proxy for the level of support required to achieve a certain amount of RJF supply. Whereas the RJF premium initially decreases, a steep increase is visible after 2027. This increase is caused by the rapid scale-up of lignocellulosic biofuel capacity and higher feedstock costs due to a higher pressure on the biomass system (see also next section) and
Figure 4.3 The additional cost of the Delayed Action scenario with respect to the reference scenario (left pane), RJF premium development in the Delayed Action scenario (middle pane) and annual cost to cover the Emission Gap (right pane). The additional costs in the left pane are computed by subtracting the total annual system cost for a reference scenario (without RJF, but with cost of fossil jet fuel) from the total annual system cost found in the Delayed Action scenario. Miscellaneous cost include, amongst others, additional transport and distribution cost. The RJF premium was obtained from the price differential between the fossil jet fuel price and the marginal cost for RJF production, representing the additional cost of producing an additional unit of RJF. Fossil jet prices are assumed to grow linearly from 14.1 €/GJ (700 €/t) in 2020 to 17.5 €/GJ (756 €/t).49 A weigthed average (based on their share in the total RJF consumption) of the marginal costs of different types was taken to compute this curve. The annual RJF premium was obtained by multiplying the RJF premium by the annual RJF volume. Annual carbon offset costs were calculated using an increasing CO2 price of 10 to 29 €/t CO2 over 2020-2030. The low and high CO2 price scenario use 10-23 €/t CO2 and 10-47 €/t CO2, respectively. The CO2 price scenarios from Synapse were used (1€=1$).50 A price floor of 10 €/t CO2 was added to the data provided.
0
500
1,000
1,500
2,000
2,500
3,000
3,500
4,000
4,500
5,000
203020252020
Add
ition
al s
yste
m c
osts
(M
€/yr
)
ConversionDomestic feedstocksImported commoditiesMiscellaneous
Additional system cost
Fossil kerosene
Renewable jet fuel premiumover fossil jet fuel
Marginal cost RJF
Renewable jet fuelpremium development
0
500
1,000
1,500
2,000
2,500
3,000
3,500
4,000
4,500
5,000
5,500
2020 2030
Ann
ual c
ost
(M €
/yr)
2025
Annual expenses to coverthe emission gap
Low CO2 price scenario
Annual RJF premium (Delayed action scenario)Carbon offsets (Delayed action scenario)
High CO2 price scenario
Carbon offsets (BAU scenario)
0
5
10
15
20
25
30
35
40
45
1,500
500
1,000
0
Pric
e le
vel (
€/t)
Pric
e le
vel (
€/G
J)
20302020 2025
15 | Scenarios and Preconditions for Renewable Jet Fuel Deployment towards 2030
the consumption of novel feedstocks (particularly perennial crops). These effects outweigh the cost reductions achieved by learning effects.
The right pane of Figure 4.3 shows the annual cost to cover the Emission Gap in the Delayed Action scenario relative to the BAU scenario. It confirms that offsetting is a cheaper mitigation measure than the introduction of RJF on the short term. However, funds for compensation are used to achieve emission reductions outside the sector, instead of driving innovation within the sector. In the BAU scenario carbon offsets worth 1.0-2.1 billion € (depending on the carbon price) need to be purchased in 2030 to reach carbon-neutral growth in the EU aviation sector alone. Although the introduction of RJF raises overall cost to 3.7-5.2 billion € in 2030, the expenditures on carbon offsets decrease by 250-500 million €, which is spent on the development of RJF instead. These early investments will be required if RJF capacity is to be developed to structurally achieve substantial carbon reductions in the aviation sector over the course of this century.
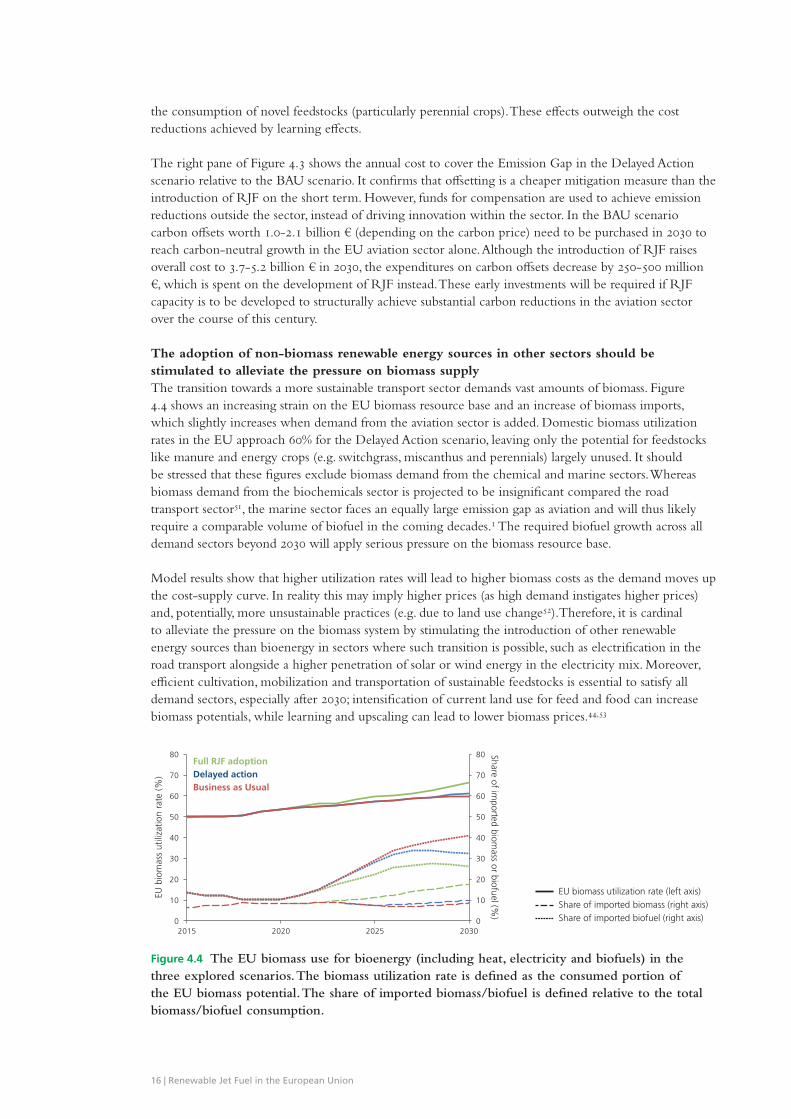
The adoption of non-biomass renewable energy sources in other sectors should be stimulated to alleviate the pressure on biomass supplyThe transition towards a more sustainable transport sector demands vast amounts of biomass. Figure 4.4 shows an increasing strain on the EU biomass resource base and an increase of biomass imports, which slightly increases when demand from the aviation sector is added. Domestic biomass utilization rates in the EU approach 60% for the Delayed Action scenario, leaving only the potential for feedstocks like manure and energy crops (e.g. switchgrass, miscanthus and perennials) largely unused. It should be stressed that these figures exclude biomass demand from the chemical and marine sectors. Whereas biomass demand from the biochemicals sector is projected to be insignificant compared the road transport sector51, the marine sector faces an equally large emission gap as aviation and will thus likely require a comparable volume of biofuel in the coming decades.1 The required biofuel growth across all demand sectors beyond 2030 will apply serious pressure on the biomass resource base.
Model results show that higher utilization rates will lead to higher biomass costs as the demand moves up the cost-supply curve. In reality this may imply higher prices (as high demand instigates higher prices) and, potentially, more unsustainable practices (e.g. due to land use change52).Therefore, it is cardinal to alleviate the pressure on the biomass system by stimulating the introduction of other renewable energy sources than bioenergy in sectors where such transition is possible, such as electrification in the road transport alongside a higher penetration of solar or wind energy in the electricity mix. Moreover, efficient cultivation, mobilization and transportation of sustainable feedstocks is essential to satisfy all demand sectors, especially after 2030; intensification of current land use for feed and food can increase biomass potentials, while learning and upscaling can lead to lower biomass prices.44,53
0
10
20
30
40
50
60
70
80
2015 2020 2025 20300
10
20
30
40
50
60
70
80
EU b
iom
ass
utili
zatio
n ra
te (%
)
Share of imported biom
ass or biofuel (%)
Full RJF adoption Delayed action
Business as Usual
Biomass use in the EU (2015-2030)
Share of imported biofuel (right axis)Share of imported biomass (right axis)EU biomass utilization rate (left axis)
Figure 4.4 The EU biomass use for bioenergy (including heat, electricity and biofuels) in the three explored scenarios. The biomass utilization rate is defined as the consumed portion of the EU biomass potential. The share of imported biomass/biofuel is defined relative to the total biomass/biofuel consumption.
16 | Renewable Jet Fuel in the European Union

Strategic Action is required to be able to cover the Emission Gap beyond 2030The BAU scenario shows that RJF will not develop without action from stakeholders involved. Funds from the aviation sector will be spent on carbon offsets, without driving innovation to find a structural solution for their own sector. The Full RJF Adoption scenario indicates that increasing RJF volume substantially requires decades as technology development and feedstock mobilization takes time. As shown in the Delayed Action scenario, carbon offsets can be used to allow for delayed introduction of RJF such that there is enough time for the market to develop.
Nonetheless, the Delayed Action scenario steers towards a system in which RJF supply relies predominantly on technologies using waste oil feedstocks, the share of imported biomass and biofuel is high, and the pressure on particular feedstocks drives up system cost. Moreover, such system could give rise to major scale-up difficulties in the period beyond 2030 as even deeper emission reductions in aviation and other sectors (e.g. marine) need to be established to reach a 2 oC target. Hence, to avoid lock-in effects and prepare for the scale-up of biofuel volumes, an additional scenario was formulated. The Strategic Action scenario is similar to the Delayed Action scenario, with the exception that a sub-target for lignocellulosic biofuels was added. The sub-target grows exponentially from 0.5% in 2021
On how strategic action now can pave the way for renewable jet fuel scale-up beyond 2030
5 Strategic Action for a more sustainable aviation sector
Figure 5.1 The feedstock-technology portfolio of the Strategic Action scenario. The portfolio in 2030 for the Delayed Action scenario was added for comparison. In the Strategic Action scenario, a sub-target for lignocellulosic biofuels of 4% (relative to the fuel use in road and aviation sector) is added to the Delayed Action scenario.
0.2
0.8
1.4
0.6
0
1.0
0.4
1.2
2015 2020
EJ/yr
2025 2030 2030
Miscellaneous
Renewable Jet Fuel (waste oils)Renewable Jet Fuel (lignocellulosic)
Diesel (lignocellulosic)
Diesel (food-based)Biogas
Ethanol (food-based)
Gasoline (lignocellulosic)Ethanol (lignocellulosic)Diesel (waste oils)
Strategic Actionscenariotion
DelayedAction
scenario
EU feedstock-technology portfolio under the Strategic Action scenario (2015-2030)
17 | Scenarios and Preconditions for Renewable Jet Fuel Deployment towards 2030

to 4% in 2030 (relative to the total fuel use in the road and aviation sector). This target is defined in such a way that burden sharing between the road and aviation sector is allowed; it may be achieved by producing road and/or aviation biofuels. Food-based biofuels are still capped at 7%.
Strategic Action prepares the energy system for substantial scale-up of volumes of transport biofuels beyond 2030Figure 5.1 shows that the biofuel supply in the Strategic Action scenario is based on a higher share of lignocellulosic feedstocks (34% versus 15% in the Delayed Action scenario in 2030). Food-based biofuels are gradually phased out (particularly biodiesel from oil seeds and imported palm oil), while lignocellulosic biofuel capacity is increasingly deployed towards 2030. RJF deployment also boosts the production of other biofuels, as RJF is often just a part of a product slate.
Almost half of RJF supply is produced from lignocellulosic feedstocks through a varied technology portfolio (i.e. Fischer-Tropsch, pyrolysis, Hydrothermal Liquefaction and Alcohol-to-Jet), providing a more scalable alternative to waste oils. Moreover, lignocellulosic biofuels can potentially achieve higher life-cycle greenhouse gas emission reductions and lower costs than oil-based biofuels (see Figure 2.2 and Figure 3.4). However, as most of these technologies are still in an early development phase, significant research, development and demonstration is required to get these technologies to market between 2020 and 2030.
Strategic Action builds a more resilient biofuel industry in the EU and instigates cost reductions on the long termThe three graphs in Figure 5.2 compare the cost performance of the Strategic Action scenario with the Delayed Action scenario. It is shown that the Strategic Action scenario still comes at substantial additional cost relative to a Reference scenario (without RJF deployment or a sub-target for lignocellulosic biofuels). In 2030, the total additional cost in the Strategic action scenario exceeds the Delayed Action scenario by 0.6 billion € in 2030. However, compared to the Delayed Action scenario, more funds are
Figure 5.2 A comparison of the additional cost (left pane), RJF premium development (middle pane) and annual carbon offset purchases and RJF premium (right pane) in the Delayed Action scenario and the Strategic Action scenario. The underlying assumptions are similar to those listed under Figure 4.3. The additional cost (left pane) are calculated relative to a reference scenario which does not include RJF deployment.
-3,000-2,000-1,000
01,0002,0003,0004,0005,000
6,0007,0008,000
Add
ition
al s
yste
m c
osts
(M
€/yr
)
2020 2025 2030
Delayed action (solid colors)Strategic action (transparant colors)
0
5
10
15
20
25
30
0
600
400
800
1,000
1,200
200
Pric
e pr
emiu
m (
€/G
J)
203020252020
Pric
e pr
emiu
m (
€/t)
Strategic Action scenarioDelayed Action scenario
Renewable jet fuelpremium development
Additional system cost
0
500
1,000
1,500
2,000
2,500
3,000
3,500
4,000
4,500
5,000
5,500
2030
Ann
ual c
ost
(M€/
yr)
2020 2025
Annual expenses to coverthe emission gap
Annual marginal RJF premium (Strategic Action scenario)
Carbon offsets (Delayed Action scenario)Annual marginal RJF premium (Delayed Action scenario)Carbon offsets (Strategic Action scenario)
ConversionDomestic feedstocksImported commoditiesMiscellaneous
Low CO2 price scenario
High CO2 price scenario
18 | Renewable Jet Fuel in the European Union

allocated to building production capacity (+2.3 billion €/yr) and mobilizing and transporting domestic feedstocks (+1.2 billion €/yr) in the EU, while less funds are spent on importing commodities from non EU-28 countries (-3.1 billion €/yr). Although import of lignocellulosic biomass and biofuels increases in the Strategic Action scenario, import of palm oil and food-based ethanol decreases. Hence, the choice for a sub-target on lignocellulosic biofuels instigates the development of a more EU-focused advanced biofuels industry, including the macro-economic benefits that may accompany such development.
The additional costs given in the left pane of Figure 5.2 are caused by additional RJF production, but should not all be allocated to RJF production only, since also additional volumes of lignocellulosic road biofuels are produced. Instead, the middle and right pane focus on the RJF premium only. In the Strategic Action scenario, the RJF premium initially shows a rapid increase followed by a mild reduction towards 2030. The initial increase is caused by the introduction of new technologies. The consequent decrease in RJF premium is caused by learning effects, which will most likely lead to a further cost reductions beyond 2030 as new technologies have high learning potential. Even though total annual costs to cover the premium are higher than the Delayed Action scenario at first, they are lower in 2030 as the RJF premium declines while volumes rise. As a result, the cumulative expenses to cover the emission gap over the period 2020-2030 (medium CO2 price scenario) is lower in the Strategic Action scenario (15.3 billion €) than in the Delayed Action scenario (15.5 billion €). About two-thirds are invested in RJF deployment; one-third is used to buy carbon offsets. In sum, the Strategic Action scenario requires a large investment up front, which is offset by cost reduction once substantial volumes are introduced. However, this scenario relies on successful research and development and very rapid deployment of the lignocellulosic biofuel capacity.
The introduction of RJF can be supported against modest cost while carbon offsets can be used to effectively reduce CO2 emissionsIt is likely that a price premium for RJF will remain beyond 2030. Hence, a structural solution is required to cover the cost. These costs are significant and cannot be carried by one single party. It therefore remains a complex question who should stimulate the deployment of RJF and which stakeholders are to carry the costs of RJF deployment.
Table 2 shows the RJF premium (17.6 €/GJ, 762 €/t) and emission mitigation cost per unit RJF (242 €/t CO2 avoided), averaged over 2020-2030. Both costs are high compared to mitigation options in the road, heat and electricity sector.54 Moreover, the price of carbon offsets per tonne CO2 avoided is a mere one-tenth of the mitigation costs of RJF. As a result, the inclusion of aviation in a common CO2
market (e.g. EU ETS) or transport-wide biofuel incentive (e.g. Renewable Energy Directive) will likely stimulate other mitigation options rather than supporting RJF. In other words, even a level playing field with other sectors will likely prove insufficient to support the production of RJF. A sub-target for EU aircraft operators seems undesirable as it may instigate carbon leakage effects due to the sector’s highly competitive and international character.
Hence, supplementary incentives for RJF are necessary to stimulate its uptake. To this end, the Renewable Energy Directive II proposal allows RJF to count 1.2 times towards the EU blending targets from 2020-2030.19 However, it remains to be explored whether such multiplier is adequately stimulating the deployment of RJF capacity. Contrary to allocating costs per unit of RJF or CO2 avoided, the costs of introducing RJF can also be expressed on a per-passenger basis. Due to the large denominator, the costs per passenger are 0.9-4.1 €, depending on which passengers are targeted (all, intra-EU or domestic passengers, see Table 2). Moreover, the cost of introducing RJF on a per-passenger basis are roughly twice the cost of a carbon offset, due to low RJF blending ratios in the Strategic Action scenario (0.5% in 2021, growing to 5.0% in 2030, see Table 1). These costs are not only valid on an EU level, but also (approximately) apply for countries, airports or airlines aiming for a similar blend ratio. Similar results are obtained when allocating costs on an RTK basis. In sum, on a per-passenger or per-RTK basis, the initial scale-up of RJF can be supported against modest additional cost while carbon offsets can be used to effectively reduce CO2 emissions on the short term.
19 | Scenarios and Preconditions for Renewable Jet Fuel Deployment towards 2030
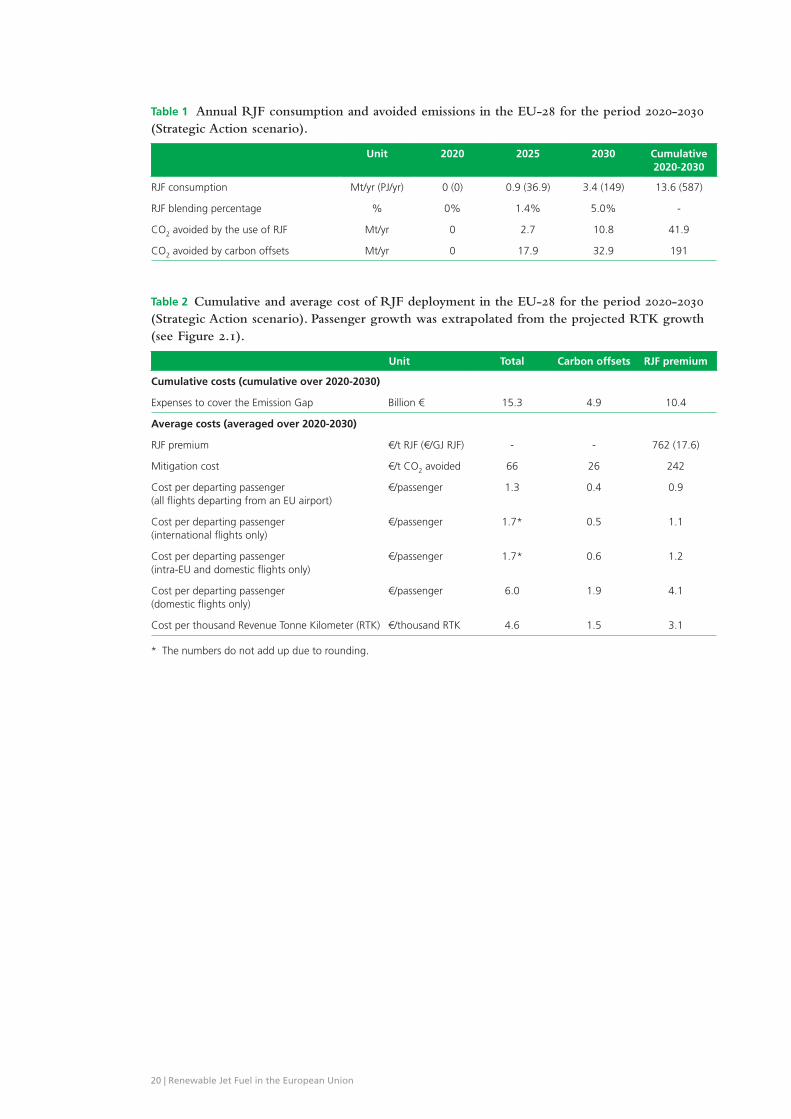
Table 1 Annual RJF consumption and avoided emissions in the EU-28 for the period 2020-2030 (Strategic Action scenario).
Unit 2020 2025 2030 Cumulative 2020-2030
RJF consumption Mt/yr (PJ/yr) 0 (0) 0.9 (36.9) 3.4 (149) 13.6 (587)
RJF blending percentage % 0% 1.4% 5.0% -
CO2 avoided by the use of RJF Mt/yr 0 2.7 10.8 41.9
CO2 avoided by carbon offsets Mt/yr 0 17.9 32.9 191
Table 2 Cumulative and average cost of RJF deployment in the EU-28 for the period 2020-2030 (Strategic Action scenario). Passenger growth was extrapolated from the projected RTK growth (see Figure 2.1).
Unit Total Carbon offsets RJF premium
Cumulative costs (cumulative over 2020-2030)
Expenses to cover the Emission Gap Billion € 15.3 4.9 10.4
Average costs (averaged over 2020-2030)
RJF premium €/t RJF (€/GJ RJF) - - 762 (17.6)
Mitigation cost €/t CO2 avoided 66 26 242
Cost per departing passenger(all flights departing from an EU airport)
€/passenger 1.3 0.4 0.9
Cost per departing passenger (international flights only)
€/passenger 1.7* 0.5 1.1
Cost per departing passenger (intra-EU and domestic flights only)
€/passenger 1.7* 0.6 1.2
Cost per departing passenger (domestic flights only)
€/passenger 6.0 1.9 4.1
Cost per thousand Revenue Tonne Kilometer (RTK) €/thousand RTK 4.6 1.5 3.1
* The numbers do not add up due to rounding.
20 | Renewable Jet Fuel in the European Union
It is important that the aviation industry contributes to emission reductions to limit global warming. As the industry growth rates outpaces the gains from efficiency and operational improvements, the cumulative Emission Gap in 2020-2030 between projected CO2 emissions from the EU aviation industry and carbon-neutral growth was quantified to be 232 Mt CO2. While the Carbon Offsetting and Reduction Scheme for International Aviation (CORSIA) and the EU Emission Trading Scheme provide a way to reduce CO2 emissions outside the sector, the use of Renewable Jet Fuels (RJF) is necessary to structurally close the Emission Gap.
Current volumes of RJF are low. The pace of RJF development in the period towards 2030 is decisive for the achievement of long-term climate targets. The scenarios covered in the previous chapters explored how the Emission Gap in aviation can be closed in the EU in the period 2020-2030 by a combination of carbon offsets and RJF deployment. The scenarios are meant to identify key preconditions for a RJF scale-up trajectory which makes sense from a technical, environmental, economic point of view while avoiding lock-in effects and providing sufficient scale-up potential beyond 2030.
From the assessed scenarios, the Strategic Action scenario adheres reasonably well to these requirements. This scenario presents a strategy in which carbon offsets are used to buy time to gradually increase RJF volumes. It assumes a RJF share of 0.5% in EU jet fuel use in 2021 (0.3 Mt RJF), exponentially growing to 5% in 2030 (3.4 Mt RJF). To avoid lock-in effects and prepare for the scale-up of biofuel volumes beyond 2030, this scenario contains a sub-target for lignocellulosic biofuels of 4% of total fuel use in road and aviation sector in 2030 (13 Mt biofuel). The key preconditions for such trajectory are presented below.
Precondition 1: A structural financing mechanism to bridge the price premium is essential to foster renewable jet fuel deploymentA price premium on RJF exists and is likely to remain beyond 2030 (irrespective of feedstock-technology combination), unless fossil jet fuel prices increase strongly or production costs reduce drastically. The BAU scenario showed negligible RJF volumes are produced without external incentives. A structural financing mechanism is therefore cardinal to establish a stable end market and stimulate the deployment of RJF.
The total costs of the gradual introduction of RJF in the EU in the Strategic Action scenario were quantified to be 10.4 billion € over 2020-2030 . These funds only cover the price differential between RJF and fossil jet fuel, thus excluding the research and development efforts required for technology development. The average price premium over fossil jet fuel (17.6 €/GJ, 762 €/t RJF) and emission mitigation cost (242 €/t CO2 avoided) of RJF over 2020-2030 are relatively high compared to other mitigation options. As a result, a common CO2 market (e.g. EU ETS) or transport-wide biofuel incentive (e.g. Renewable Energy Directive) will likely stimulate other mitigation options. Hence, even a level playing field with other bioenergy sectors will likely be inadequate to stimulate RJF uptake.
On which preconditions need to be met to stimulate renewable jet fuel scale-up
in the EU up to 2030
6 What is required for deployment of renewable jet fuel in the EU?
21 | Scenarios and Preconditions for Renewable Jet Fuel Deployment towards 2030

Supplementary measures, such as guaranteed feed-in tariffs, are therefore necessary. It should be explored whether public investments in such measure are justified on the grounds of potential environmental and macro-economic benefits of RJF deployment (e.g. emission reduction, health impact, employment, energy security, rural development, resilience of the aviation industry). Alternatively, fund raising may be coupled to the expenditures on carbon offsets at a global (CORSIA), EU (EU-ETS), national or airport/airline level. The per-passenger cost of introducing RJF (0.9- 4.1 €/departing passenger) present only a modest supplement to the cost of carbon offsets (0.4-1.5 €/departing passenger) in the Strategic Action scenario. As such, a modest surcharge, aggregated in a ‘RJF deployment fund’, is sufficient to support 5% RJF deployment in 2030. Furthermore, investments in RJF will also boost the production of other biofuels or biobased chemicals, as RJF is often just a part of the product slate.
Precondition 2: Renewable jet fuel deployment requires substantial research, development and demonstration efforts and high feedstock mobilization ratesAlthough the HEFA technology is commercially available, its scale-up potential is constrained by the availability of sustainable oil feedstocks. Further scale-up of RJF depends on the commercialization of lignocellulosic biofuel technologies which perform well economically and environmentally and are able to process abundantly available and sustainable feedstocks. As there is no silver bullet, a varied technology portfolio is necessary for significant production of sustainable RJF volumes. However, building a new industry takes time. Given the growing urgency of emission reductions, it is important to combine early actions with a long-term vision.
The HEFA technology based on sustainable oils will likely remain the only commercially available option to produce RJF on the short term. On the medium term, the commercialization of technologies based on lignocellulosic biomass should be stimulated to scale up RJF volumes. On the long term, processes based on other feedstocks, such as algae or CO2, may provide even better alternatives. Research and development support and de-risking mechanisms (e.g. loan guarantees, CAPEX grants, or a sub-target for lignocellulosic biofuels) should be in place to create a stable environment in which technologies can be developed and commercialized. Furthermore, a clear market perspective is needed to justify development efforts towards RJF production (e.g. ASTM certification). At the same time, efficient cultivation, mobilization and transportation of sustainable feedstocks is essential to satisfy all demand sectors, especially after 2030. Most of these efforts transcend the domain of RJF; synergies with other bioenergy sectors (e.g. road biofuels, biobased chemicals) as well as existing sectors (e.g. agro- and forest industry, petrochemical industry) can and should be leveraged.
Precondition 3: Robust sustainability standards are key to guarantee sustainable production and global use of renewable jet fuelSustainable practice is a prerequisite for the widespread use of RJF. Sustainability standards and schemes, both voluntary and regulatory, are an effective instrument to monitor the production of RJF with respect to sustainability and socio-economic indicators such as land use, biodiversity, resource efficiency, life-cycle greenhouse gas emissions, food competition and labor conditions.
The transparency, stability, consistency and flexibility of such framework are key to their success. Transparency and stability should give actors in the supply chain (e.g. investors, feedstock suppliers, technology developers) clear guidelines on sustainable practice while providing certainty about the compliance of long-term investments with sustainability standards of biofuel support schemes. At the same time, sufficient flexibility to correct unforeseen adverse sustainability effects should be incorporated. To this end, frameworks based on clear sustainability indicators (e.g. emission reduction) may be preferred over categorization on the basis of fuel/feedstock categories. It is important to discourage unsustainable practice, but also award positive environmental or socio-economic impacts (e.g. negative life-cycle emissions or job creation). Moreover, given the international character of the aviation sector, certification procedures should be internationally consistent yet flexible to capture region-specific contexts. Cross-sectoral consistency with adjacent markets (e.g. road biofuels) is recommended. Also, crosslinks with existing national/regional frameworks facilitate a swift implementation.
22 | Renewable Jet Fuel in the European Union

The Renewable Jet Fuel Supply Chain Development and Flight Operations (RENJET) project was funded by the EIT Climate-KIC. The core project partners (University of Utrecht, Imperial College London, SkyNRG, KLM, and Schiphol Airport) aim to lay the basis for a self-sustaining network of regional renewable jet fuel supply chains based on sustainable (European) feedstock sources.
Publicly available RENJET outputs• de Jong S, Hoefnagels R, Faaij A, Slade R, Mawhood B and Junginger M, The feasibility of
short-term production strategies for renewable jet fuels – a comprehensive techno-economic comparison. Biofuel, Bioprod Biorefining 9:778-800 (2015).
• Meijerink O, Investments in Renewable Jet Fuels, implications for the supply chain development (Master Thesis). (2015).
• Mawhood R, Gazis E, de Jong S, Hoefnagels R and Slade R, Production pathways for renewable jet fuel: a review of commercialization status and future prospects. Biofuel, Bioprod Bioref 10(4) (2016).
• Gazis E, Mawhood B, Slade R, de Jong S and Hoefnagels R, Stakeholder analysis of the Renewable Jet Fuels innovation system (available upon request). (2016).
• Koks Z, Technological development of Fast Pyrolysis and Hydrothermal Liquefaction – A combined approach of innovation systems and technological learning to assess future development (Master Thesis). (2016).
• Wicke B, Kluts I and Lesschen J-P, Sustainable supply potential of herbaceous energy crops from pastureland productivity developments in Europe (available on request). (2016).
• Tzanetis K, Posada J and Ramirez A, Hydrothermal liquefaction of biomass and biocrude-oil upgrading for renewable jet fuel production: Effects of reaction conditions on the economic and GHG emissions performance. Forthcoming.
• de Jong S, Antonissen K, Hoefnagels R, Lonza L, Wang M, Faaij A and Junginger M, Life-cycle analysis of greenhouse gas emissions from renewable jet fuel production. Biotechnology for Biofuels (in press).
• de Jong S, Hoefnagels R, Wetterlund E, Pettersson K, Faaij A and Junginger M, Cost optimization of biofuel production – the impact of scale, integration, transport and supply chain configurations. Forthcoming.
About RENJET
23 | Scenarios and Preconditions for Renewable Jet Fuel Deployment towards 2030
1. Cames M, Graichen J, Siemons A and Cook V, Emission reduction targets for international aviation and shipping. (2015).
2. International Civil Aviation Organization, Present and future trends in aircraft noise and emissions (Assembly 38th Session No. Working paper). (2013).
3. Air Transport Action Group, A sustainable flightpath towards reducing emissions – Position paper presented at UNFCCC Climate Talks, Doha. (2012).
4. International Civil Aviation Organisation, Draft Assembly Resolution text on a Global Market-based Measure (GMBM) Scheme. (2016).
5. European Commission, The EU tackles growing aviation emissions. http://europa.eu/rapid/press-release_IP-17-189_en.htm (2017) [February 4 2017].
6. International Air Transport Association, IATA 2015 Report on Alternative Fuels. (2014).7. European Commission, 2 million tons per year: A performing biofuels supply chain for EU aviation
August 2013 Update. (2013).8. Daggett DL, Hendricks RC, Walther R and Corporan E, Alternate Fuels for use in Commercial
Aircraft. (2007).9. Sustainable Aviation Fuel Users Group, Our Commitment to Sustainable Options. http://www.safug.
org/safug-pledge/[December 9 2015].10. KLM, KLM to operate biofuel flights out of Los Angeles. http://news.klm.com/klm-to-operate-
biofuel-flights-out-of-los-angeles (2016) [November 26 2016].11. United Airlines, Alternative fuels. https://www.united.com/web/en-US/content/company/
globalcitizenship/environment/alternative-fuels.aspx. (2016) [October 26 2016].12. Bloomberg, Gevo Rises on Deal to Supply Renewable Jet Fuel to Lufthansa. https://www.bloomberg.
com/news/articles/2016-09-07/gevo-climbs-on-agreement-to-supply-jet-fuel-to-lufthansa-airline (2016) [October 26 2016] .
13. United Airlines, United Airlines Purchases Stake in Fulcrum BioEnergy with $30 Million Investment. http://newsroom.united.com/2015-06-30-United-Airlines-Purchases-Stake-in-Fulcrum-BioEnergy-with-30-Million-Investment (2015) [August 7 2015].
14. Cathay Pacific, Cathay Pacific invests in sustainable biojet fuel developer. https://www.cathaypacific.com/cx/en_HK/about-us/press-room/press-release/2014/Cathay-Pacific-invests-in-sustainable-biojet-fuel-developer.html (2014) [October 26 2016].
15. Environmental Protection Agency, Regulation of fuels and fuel additives: Changes to renewable fuel standard program; Final Rule. (2010).
16. European Parliament, Directive 2009/28/EC: On the promotion of the use of energy from renewable sources. (2009).
17. European Commission, An aviation strategy for Europe. (2015).18. de Jong S, Hoefnagels R, Faaij A, Slade R, Mawhood B and Junginger M, The feasibility of
short-term production strategies for renewable jet fuels – a comprehensive techno-economic comparison. Biofuel, Bioprod Biorefining 9:778-800 (2015).
19. European Commission, Proposal for a directive of the European Parliament and of the council on the promotion of the use of energy from renewable sources (recast). (2016).
References
24 | Renewable Jet Fuel in the European Union
20. IATA, Carbon-Neutral Growth by 2020. http://www.iata.org/pressroom/pr/Pages/2009-06-08-03.aspx (2009) [October 18 2016].
21. Eurostat, Complete energy balances – annual data (nrg_110a). Total Petroleum Products for inland navigation, domestic aviation, international aviation and international marine bunkers. http://appsso.eurostat.ec.europa.eu/nui/show.do?dataset=nrg_110a&lang=en (2016) [June 27 2016].
22. Kousoulidou M and Lonza L, Biofuels in aviation: Fuel demand and CO2 emissions evolution in Europe toward 2030. Transp Res Part D Transp Environ 46:166-181 (2016).
23. Chèze B, Gastineau P and Chevallier J, Forecasting world and regional aviation jet fuel demands to the mid-term (2025). Energy Policy 39(9):5147-5158 (2011).
24. de Jong S, Antonissen K, Hoefnagels R, Lonza L, Wang M, Faaij A and Junginger M, Life-cycle analysis of greenhouse gas emissions from renewable jet fuel production. Biotechnology for Biofuels (in press).
25. Bailis R, Broekhoff D and Lee CM, Supply and sustainability of carbon offsets and alternative fuels for international aviation. (2016).
26. van Vuuren DP, Deetman S, van Vliet J, van den Berg M, van Ruijven BJ and Koelbl B, The role of negative CO2 emissions for reaching 2 C-insights from integrated assessment modelling. Clim Change 118(1):15-27 (2013).
27. Maurice LQ, Hockstad L, Hohne N, Hupe J, Lee DS and Rypdal K, Mobile Combustion. IPCC Guidelines for National Greenhouse Gas – Volume 2 Energy – Chapter 3 Mobile Combustion. (2006).
28. Stratton RW, Wong HM and Hileman JI, Life Cycle Greenhouse Gas Emissions from Alternative Jet Fuels. (2010).
29. Abella JP, Model to Investigate Energy and Greenhouse Gas Implications of Refining Petroleum. Environ Sci Technol 46:13037-13047 (2012).
30. Kendall A and Yuan J, Comparing life cycle assessments of different biofuel options. Curr Opin Chem Biol 17(3):439-443 (2013).
31. Elbersen B, Staritsky I, Hengeveld G, Jeurissen L and Lesschen J-P, Outlook of spatial biomass value chains in EU28. D2.3 Biomass Policies project. (2012).
32. Mozaffarian H, Londo M, Pantaleo M and Carolien Kraan, Market analysis for lignocellulosic biomass as feedstock for bioenergy, biobased chemicals & materials in Europe: A quantitative estimate of biomass demand in 2020 and 2030. Deliverable 7.2 S2Biom project. (2015).
33. van Stralen J, Kraan C, Uslu A, Londo M and Mozaffarian H, Integrated assessment of biomass supply chains and conversion routes under different scenarios. D7.3 S2Biom project. (2016).
34. European Parliament, Directive (EU) 2015/1513: amending Directive 98/70/EC relating to the quality of petrol and diesel fuels and amending Directive 2009/28/EC on the promotion of the use of energy from renewable sources. (2015).
35. Sherbacrow B, Paramount, CA GreenJet Refinery. https://www.smgov.net/uploadedFiles/Departments/Airport/Sustainability/20150126_AltAir_Presentation.pdf(2015) [October 30 2016].
36. Boeing, Environmental Report – Green Diesel. http://www.boeing.com/aboutus/environment/environment_report_14/sb_4_2_1_green_diesel.html(2014) [October 30 2016].
37. Boeing, Boeing Conducts World’s First Flight with “Green Diesel” as Aviation Biofuel. http://boeing.mediaroom.com/2014-12-03-Boeing-Conducts-Worlds-First-Flight-with-Green-Diesel-as-Aviation-Biofuel [February 27 2015].
38. Radich T, The Flight Paths for Biojet Fuel. (2015).39. Spöttle M, Alberici S, Toop G, Peters D, Gamba L, Ping S et al., Low ILUC potential of wastes and
residues for biofuels. (2013).40. Mawhood R, Gazis E, de Jong S, Hoefnagels R and Slade R, Production pathways for renewable
jet fuel: a review of commercialization status and future prospects. Biofuel, Bioprod Bioref 10(4) (2016).
41. Gazis E, Mawhood B, Slade R, de Jong S and Hoefnagels R, Stakeholder analysis of the Renewable Jet Fuels innovation system (available upon request). (2016).
42. Commercial Aviation Alternative Fuels Initiative, Fuel Readiness Level (FRL). http://www.caafi.org/information/pdf/frl_caafi_jan_2010_v16.pdf (2010) [July 28 2016].
25 | Scenarios and Preconditions for Renewable Jet Fuel Deployment towards 2030
43. Rumizen M, Certification-Qualification Breakout. http://www.caafi.org/information/pdf/CQ_Breakout_Session.pdf (2014) [October 1 2016].
44. de Wit M, Junginger M, Lensink S, Londo M and Faaij A, Competition between biofuels: Modeling technological learning and cost reductions over time. Biomass and Bioenergy 34(2):203-217 (2010).
45. Intergovernmental Panel on Climate Change, Special Report on Renewable Energy Sources and Climate Change Mitigation. (2011).
46. de Jong S, Hoefnagels R, Wetterlund E, Pettersson K, Faaij A and Junginger M, Cost optimization of biofuel production – the impact of scale, integration, transport and supply chain configurations. Forthcoming.
47. Meijerink O, Investments in Renewable Jet Fuel, implications for the supply chain development (Master Thesis). (2015).
48. Eurostat, Supply, transformation and consumption of renewable energies – annual data. http://appsso.eurostat.ec.europa.eu/nui/show.do?dataset=nrg_107a&lang=en (2015) [October 19 2016].
49. Capros P, Vita A De, Tasios N, Papadopoulos D, Siskos P, Apostolaki E et al., EU Energy, Transport and Emissions. Trends to 2050. Reference scenario 2013. (2013).
50. Luckow P, Stanton EA, Fields S, Ong W, Biewald B, Jackson S et al., Spring 2016 National Carbon Dioxide Price Forecast. (2016).
51. Mozaffarian H, Londo M, Pantaleo M and Kraan C, Policy Brief: Market analysis for biobased products. D10.17d S2Biom Project. (2016).
52. Daioglou V, Greenhouse gas emission-curves for advanced biofuel supply chains. The role of biomass in climate change mitigation (PhD thesis). Utrecht, The Netherlands p. 46-67 (2016).
53. Slade R, Saunders R, Gross R and Ausilio Bauen, Energy from biomass: the size of the global resource An assessment of the evidence that biomass can make a major contribution to future global energy supply. (2011).
54. Gerssen-Gondelach SJ, Saygin D, Wicke B, Patel MK and Faaij APC, Competing uses of biomass: Assessment and comparison of the performance of bio-based heat, power, fuels and materials. Renew Sustain Energy Rev 40(April):964-998 (2014).
55. Holtsmark B, Harvesting in boreal forests and the biofuel carbon debt. Clim Change 112(2):415-428 (2012).
56. Wicke B, Verweij P, van Meijl H, van Vuuren DP and Faaij AP, Indirect land use change: review of existing models and strategies for mitigation. Biofuels 3(1):87-100 (2012).
57. Plevin RJ, Jones AD, Torn MS, Group R, Division ES and Berkeley L, The greenhouse gas emissions from indirect land use change are uncertain, but potentially much greater than previously estimated. Environ Sci Technol 44(21):8015-8021 (2010).
58. Lee DS, Fahey DW, Forster PM, Newton PJ, Wit RCN, Lim LL et al., Aviation and global climate change in the 21st century. Atmos Environ 43(22 – 23):3520-3537 (2009).
59. Stratton RW, Wolfe PJ and Hileman JI, Impact of Aviation Non-CO 2 Combustion Effects on the Environmental Feasibility of Alternative Jet Fuels. Environ Sci Technol 45:10736-10743 (2011).
60. Beyersdorf A and Anderson B, An overview of the NASA Alternative Aviation Fuel Experiment (AAFEX). TAC-2 Proceedings (2009).
61. Elgowainy A, Han J, Wang M, Carter N, Stratton R and Hileman J, Life-Cycle Analysis of Alternative Aviation Fuels in GREET. (2012).
62. Stralen J Van, Longa FD, Ros J and Uslu A, Functional description of biomass allocation within the RESolve model kit. (2012).
26 | Renewable Jet Fuel in the European Union