renewable energy policies and market developments
TRANSCRIPT

March 2003
ECN-C--03-029
Renewable Energy Policies and Market Developments
A.L. van Dijk L.W.M. Beurskens
M.G. Boots M.B.T. Kaal T.J. de Lange
E.J.W. van Sambeek M.A. Uyterlinde
ECN-C--03-029 2
Acknowledgement The REMAC 2000 project was co-funded by the European Commission/DG research under the programme ‘Energy, Environment and Sustainable Development’ contract No ERK5-CT2000-80124, with additional support from the Swiss Government. This report is registered under ECN project number 7.4114. The REMAC 2000 research team • Project co-ordinator:
Claudio Casale CESI (Italy) • Researchers:
Paolo Frankl; Andrea Masini; Emanuela Menichetti Ecobilancio Italia (Italy) Stefan Nowak; Marcel Gutschner; Giordano Favaro NET (Switzerland) Annemarije van Dijk; Theo de Lange; Chris Westra ECN (The Netherlands) Philippe Menanteau CNRS / IEPE (France)
• Chairman of the Advisory Board: Roberto Vigotti ENEL Green Power (Italy)
The contributors to this report: Renewable Energy Policy and Market Developments • Lead author and editor:
Annemarije van Dijk • Contributions:
2.1, 2.5 Luuk Beurskens 3 Annemarije van Dijk, Emiel van Sambeek 4.1 Marcel Kaal 4.2 Martine Uyterlinde 4.3, 4.4 Theo de Lange 4.5 Maroeska Boots
• Case studies by REMAC 2000 project team The Netherlands Annemarije van Dijk, Emiel van Sambeek Italy Raffaella Bosurgi1, Claudio Casale Spain Emanuela Menichetti, Paolo Frankl Germany Giordano Favaro, Marcel Gutschner Switzerland Giordano Favaro, Marcel Gutschner The report and case studies are available at: www.renewable-energy-policy.info/remac
Abstract This report presents reviews and an analysis of the policy support for the stimulation of renewable electricity in the current energy market, as well as an overview of the main new developments influencing the renewable energy market. It has been written as part of the analysis phase of the project REMAC 2000, which has led to the publication of a roadmap for the acceleration of the RE market. REMAC 2000 aims to promote a sustainable growth of the renewable energy market. For such a sustainable growth, important success factors are not only effectiveness of policy, but also security for investors, which is essential for building up a sector and developing the renewable energy market. Consistency of regulations and policies at different levels and between policy fields form a condition for security, as does the active involvement of market stakeholders. Further, the increasing role of trade within the energy and renewable energy sector leads to a priority for international coherence of policies and markets. To guarantee a sustainable growth of the renewable energy sector, a broad perspective of policy makers and planners is required- to include a long timeframe, a comprehensive view of related policy fields and authorities involved, and an orientation that looks beyond national borders.
1 (ENEL, Green Power).
ECN-C--03-029 3
CONTENTS 1. INTRODUCTION 6 2. PROMOTIONAL SCHEMES 8
2.1 Main drivers for renewable energy policy 8 2.1.1 Shifting priorities 8 2.1.2 Economic drivers 8 2.1.3 Environmental drivers 9 2.1.4 Social drivers 9 2.1.5 Impacts of shifting priorities on the renewable energy market 9
2.2 Policy instruments for the promotion of renewable energy 10 2.2.1 Categorisation of policy instruments along the value chain 10 2.2.2 Policy instruments in the renewable energy market 12
2.3 Description of direct instruments 12 2.3.1 RD&D support 12 2.3.2 Investment support 13 2.3.3 Feed-in tariffs 13 2.3.4 Bidding procedures 13 2.3.5 Quota 14 2.3.6 Negotiated agreements 14 2.3.7 Stimulation of RE consumption by price reduction 14 2.3.8 Green certificates 14
2.4 Policy and market framework 15 2.4.1 Regulations and procedures 15 2.4.2 Indirect measures 15 2.4.3 Voluntary approaches 15 2.4.4 Public awareness and attitude 15
2.5 Trends in promotional schemes 16
3. ANALYSIS OF PROMOTIONAL SCHEMES 17 3.1 Introduction to the analysis 17 3.2 Analysis by evaluation criteria 17
3.2.1 Effectiveness 17 3.2.2 Cost Effectiveness 18 3.2.3 Certainty for industry 19 3.2.4 Market efficiency 21 3.2.5 Transparency 22 3.2.6 Transaction cost and administrative capacity 22 3.2.7 Equity 23 3.2.8 Market conformity 24
3.3 Analysis by policy instrument 24 3.3.1 Financial measures for renewable energy 24 3.3.2 RD&D support 25 3.3.3 Investment support 25 3.3.4 Feed-in tariffs 27 3.3.5 Bidding Procedures 28 3.3.6 Quota 29 3.3.7 Negotiated Agreements 30 3.3.8 Stimulation of RE consumption by price reduction 31 3.3.9 Green certificates 32
3.4 Policy and market framework 32 3.4.1 Regulations and procedures 32 3.4.2 Indirect measures 33 3.4.3 Voluntary approaches 33 3.4.4 Public awareness and attitude 33
4 ECN-C--03-029
4. NEW MARKET DRIVERS 35 4.1 Marketing strategies for electricity from renewable sources 35
4.1.1 Customers of green electricity 35 4.1.2 Suppliers of electricity from renewable sources 36 4.1.3 Influence of marketing on the renewable energy market 37
4.2 Distributed energy generation 37 4.2.1 What is distributed generation? 37 4.2.2 Characterisation of DG developers 38 4.2.3 The role and regulation of network access 38 4.2.4 Main policy developments 39 4.2.5 Relevance for renewable energy market development 39
4.3 The impact of the EC Directive on the promotion of Renewable Electricity 40 4.3.1 What is the EC Directive about? 40 4.3.2 Impact of the Directive 41
4.4 The impact of liberalisation and harmonisation of electricity markets 41 4.5 Flexible mechanisms 42
4.5.1 Introduction 42 4.5.2 Joint Implementation and Clean Development Mechanism 43 4.5.3 Carbon emissions trading 43 4.5.4 Impact of the flexible mechanisms on renewable energy implementation 44 4.5.5 Green certificates and flexible mechanisms 44 4.5.6 Outlook 46
5. SYNTHESIS 47
REFERENCES 49 APPENDIX A CASE STUDIES 51
A.1 Case study objectives and methodology 51 A.2 Execution of case studies 51 A.3 Case study documents 52
APPENDIX B BACKGROUND INFORMATION 54 B.1 Transaction costs 54 B.2 Modeling RE trade in the European market 55
B.2.1 REBUS 55 B.2.2 ADMIRE REBUS 57
ECN-C--03-029 5
1. INTRODUCTION
Energy from renewable sources is expected to play a major role in the global future energy provision. In the current phase of technology and market development, policy support for renewable energy forms the basis for its market position. Specific policy support will remain necessary in the coming twenty years to improve the technologies and bring renewable energy supply and demand to a level of maturity at which the sector can compete on a level market with other energy sources. This report presents reviews and an analysis of the policy support for the stimulation of renewable electricity in the current energy market, as well as an overview of the main new developments influencing the renewable energy market. This report is one of the results of the project REMAC 2000. The objective of REMAC 2000 is to develop a roadmap for RE market acceleration2. The project has been organised in three phases: review and analysis of the RE market, synthesis of findings and elaboration of a roadmap. The broad scope of REMAC 2000 allows an overall view and integrated approach, taking into account three different perspectives on RE market development: technical, energy market, and policy framework. Separate reports have been written on these different analysis aspects (WP1, WP2 and WP3). The market and policy framework section of the analysis (WP3) resulted in two reports. The report: ‘Review and Analysis of Market Models’ discusses and analyses the energy and market models for applicability for policy design in the future; and this report, ‘Renewable Energy Policies and Market Developments’, contains the qualitative discussion on policies and market developments for renewable energy. The technical analysis, energy market analysis, and policy framework analysis, together with expert opinions from the two REMAC expert stakeholder discussions held in April and September 2002, provided input for the synthesis and finally for the REMAC 2000 roadmap. The REMAC project team consisted of CESI (Italy- co-ordinator), Ecobilancio Italia (Italy), NET (Switzerland), CNRS-IEPE (France) and ECN (The Netherlands). For the ‘Policies and Market Developments’ section of the analysis, ECN was work package leader and main author, while all parties contributed to the underlying discussion which was extrapolated to the synthesis and finally to the definition of the roadmap. Ecobilancio Italia (Italy) and NET (Switzerland) contributed case studies for the analysis within this section. The analysis presented in this report is based on literature review, expert opinions, and specific information on experiences in five country case studies. This report begins with an introduction to renewable energy policy in Chapter 2, which presents the main drivers for stimulating renewable energy, a categorisation and overview of the main policy instruments and an indication of trends in the implementation of these instruments. The policy context, which is formed by many diverse factors such as legislation, procedures and awareness, is taken into account as a factor that influences the success of policy instruments. The policy instruments are analysed in Chapter 3, using a set of success criteria for a sustainable renewable energy market acceleration. The criteria include effectiveness, cost effectiveness, and security provided for the renewable energy industry. In the second part of this analysis, specific emphasis has been placed on ACTUAL experiences with policy instruments and their impact on the RE market. The five country-specific case studies were used to gather information on not only targets, but also impacts of renewable energy policies. 2 The following acronyms and terms are used throughout this report: RE: renewable energy, RES: renewable energy
sources; RES-E electricity from renewable energy sources. The REMAC study has focussed on electricity. In some cases, the term renewable energy should be interpreted in a narrower sense as electricity from renewable sources.

6 ECN-C--03-029
New developments within the renewable energy market are described and analysed in Chapter 4. These new developments include: • Using marketing strategies to promote green electricity. • The implications of the shift from centralised to distributed generation; • The expected impact of the EC Directive; • The effect of liberalisation of the energy market; • The open issues and the link between the schemes for green electricity certificates and the
carbon emissions trading. Finally, Chapter 6 brings together the above analysis in a brief synthesis. For the envisioned sustainable growth of the renewable energy sector, important success factors are not only effectiveness of policy, but also security for investors, which is essential for building up a sector and developing the renewable energy market. Consistency of regulations and policies at different levels and between policy fields form a condition for security, as does the active involvement of market stakeholders. Further, the increasing role of trade within the energy and renewable energy sector leads to a priority for international coherence of policies and markets.
ECN-C--03-029 7
2. PROMOTIONAL SCHEMES
2.1 Main drivers for renewable energy policy
2.1.1 Shifting priorities There are many different reasons to support renewable energy. The drivers for active support for the implementation of renewable energy differ per country and have shifted over time. The oil crisis in the 1970’s lead to a policy priority for alternative energy sources for energy security. Later, increasing environmental awareness and concern about sustainability of conventional energy use formed the main driver for the promotion of renewable energy. Nowadays, the motivation to stimulate renewable energy follows mainly from policy priorities firstly in the field of environment related to climate change and secondly for the security of energy supply The European Commission explicitly mentions its motivations to actively support the development of renewable energy in Europe in the White Paper on Renewable Energy (EC, 1997). It is clear that there are many different drivers behind renewable energy, which cover not only economic and environmental arguments, but also social motivations. The mentioned potential positive impacts of renewable energy have a general validity at whichever scale: local national, regional, or global. However, it is obvious that the drivers for support at national or local governments will follow from priorities at these levels. Below, the drivers for renewable energy are described in the three groups: economic, environmental and social drivers.
2.1.2 Economic drivers Economical Optimisation: Economic optimisation of the energy supply a major rationale to take renewable energy options into account. Especially for energy supply in areas with difficult access or for the case of small off-grid energy supply, renewable energy sources are often cheaper than the connection to a power grid. Further, many forms of renewable energy can be deployed for decentralised energy supply, which can decrease the need for extension of the grid capacity and thus save capital. Security of Supply: Due to its large energy consumption relative to the fossil fuel reserves located in the European area3, European external dependency on fossil fuel import is high. The use of the renewable energy sources that are available in Europe reduces this dependency on imports and thereby increases the security of the energy supply. As a consequence, the European society will become less vulnerable to price changes of fossil fuels, thus increasing its own socio-economic stability. The importance given to security of supply has increased over the last years as the realisation has grown that dependence on fuel supply from politically unstable areas is not desirable. Leading European Industry: With an encouraging policy, the European companies may increase their market share and be able to take large parts of future world-wide business opportunities in the renewable energy sector, thus stimulating the European economy.
3 The primary energy consumption of Europe amounts to one fifth of the global consumption. However, the part of
the fossil fuel reserve located in Europe is rather small (2% of oil, 4% of gas and 12% of coal, as part of the proven global reserves in 1998 (BP-Amoco, 1999)).

8 ECN-C--03-029
2.1.3 Environmental drivers Reducing Emissions: in the case of renewable energy (except biomass), there are no direct emissions from the energy conversion. Generally, the energy is generated from wave, wind or solar energy, and does not cause any emissions. In the case of biomass or waste, emissions do exist, but these are limited according to legislation, similar to fossil fuel or waste combustion. Reducing Climate Change: the emissions from biomass and waste are considered to alleviate the environmental pressure because of the closed short carbon cycle. Toxic emissions emerge in the same quantity or even larger quantities compared to fossil fuels, but at least no additional CO2 is brought into the atmosphere. The CO2 has been captured before, and would also be released through alternative routes as natural biodegradation or dumping.
2.1.4 Social drivers Employment: both direct and indirect employment will be generated when the share of renewable energy is increased. This relates not only to the manufacturing of the plant or installation, but also to its maintenance and the fuel provision (the latter only in the case of biomass). Possibly, the increased use of renewable energy options will enlarge the renewable industry. But at the same time, the net labour gain could be nullified by the shrinking conventional power industry. It is very difficult to assess the impact of renewable energy policy and labour, but it is assumed that the overall effect on the European labour market will be positive with a proceeding penetration of renewable energy sources. Public support: the subject of renewable energy is alive in Europe. A significant number of people is asking for more attention to the development of alternative energy sources as being part of a sustainable way of life. Social-economic cohesion: the renewable energy sector has potential to be applied in geographic areas in which other sectors can not. With the development of economic activities incited by the business of renewable energy production, such as cultivation of energy crops in remote areas, or capturing of solar energy in Southern countries, development can occur in areas that formerly were economically less attractive. Such economic developments help establish new trade and pan-European cohesion.
2.1.5 Impacts of shifting priorities on the renewable energy market The environmental benefits of renewable energy are currently one of the main drivers for the support of the sector. As ‘environment’ is increasingly being interpreted as ‘climate’ from a policy perspective, the driver environmental benefits is losing force, because renewable energy technologies have to compete against energy efficiency measures. For a secure continuation of support of renewable energy renewable energy targets should therefore be disconnected from CO2 reduction targets. From a national perspective, local development through employment creation has been a driver. This is especially obvious in the case of Spain, where more than 70% (estimate) of government support to renewable energy is provided by European Commission regional development programmes. This driver is also likely to decrease in relevance. Firstly the source of support for renewable energy is likely to decrease with the entrance of new countries to the EU. Secondly, if an international system of tradable green certificates is set up in order to have a cost effective distribution of technology deployment, national benefits can no longer be stimulated directly. National governments may then look for other sectors than renewable energy through which to achieve local development.
ECN-C--03-029 9
The above leads to the conclusion that for continuation of renewable energy support, it is essential that other values of renewable energy are recognised and stimulated.4 One driver that has gained renewed importance in recent years is security of supply. Therefore it is important to increase the knowledge base of the potential contribution of renewable energy to security of supply. Which steps should be taken in order to contribute to security of supply through renewable energy technologies, what are the costs of these measures, and what can the different renewable energy sources contribute under which circumstances? Renewable energy is too often regarded as an isolated policy field. Integration of renewable energy into all related policy fields such as environment, spatial planning, economic affairs, employment, will broaden the basis for long term sustainability of support for renewable energy.
2.2 Policy instruments for the promotion of renewable energy
2.2.1 Categorisation of policy instruments along the value chain This paragraph provides a categorisation of policy instruments5. Such a categorisation is necessary for the understanding of options to support renewable energy, and for the analysis of these options. The categorisation is somewhat theoretical, as in reality policy instruments are implemented as part of a policy scheme, in which a set of policies and the policy framework are interrelated. A first distinction is that between direct and indirect policy instruments. The direct approaches are aimed at the renewable energy sector, whereas indirect instruments are aimed mainly at barrier removal ‘outside’ this sector and at improving the framework for renewable energy. The direct approaches form the core of the analysis within this report. After a categorisation in this paragraph, a description of the direct approaches is given in Paragraph 2.3. Indirect instruments are discussed together with the policy framework in Paragraph 2.4. The direct policy instruments, which aim to directly influence the renewable energy sector and market, can be divided into financial and non-financial measures. The financial measures provide financial incentives to market parties to increase their role in the renewable energy sector. Non-financial measures on the other hand, aim to reach this market impact through agreements with important stakeholders or through obligations. Penalties may play a role in the enforcement of such agreements or obligations. A crosscutting distinction between instruments is the targeted stage of the value chain. Focussing on the government support for the market for electricity from renewable energy sources, the value chain can be simplified to the following stages: Research and Development, Investment in RETs, Production of electricity, and Consumption of electricity. The table below provides a (theoretical) categorisation of policy instruments, also showing examples of possible policy measures within these categories.
4 This point was also made by several participants of the REMAC Stakeholders Meeting in April 2002. 5 A policy instrument is the tool used to implement policy- the term is used both for the theoretical principles, and
for the practical implementation. In this report the terms ‘policy measures’, and ‘policy schemes’ are also used. The term policy measures is used for the practical implementation of one or a set of policy instruments, while a policy scheme is a broad definition of both the framework in which the policy is implemented, as well as the instruments that are used.

10 ECN-C--03-029
Table 2.1 Categorisation of the main instruments for the direct stimulation of renewable energy deployment into type and position in the development chain
Financial measures (subsidies/loans/grants/fiscal measures)
Non-financial measures
RD&D - Fixed government RD&D subsidies - Grants for demonstration, development, test
facilities, etc. - Zero (or low) interest loans
Investments - Fixed government investment subsidy - Bidding system on the investment subsidy/grant - Subsidy on switching to renewable energy
production or on the replacement of old renewable energy installations
- Zero (or low) interest loans - Tax advantage for renewable energy investments - Tax advantage on (interest on) loans for renewable
energy investments
- negotiated agreements between producers and government
Production - feed-in tariffs at a fixed level set by the authorities - bidding system on the feed-in tariffs necessary to
operate on a profitable base - tax advantage on the income generated by renewable
energy
- quota obligation on production
Consumption - tax advantage on the consumption of renewable energy
- quota obligation on consumption
The theoretical categorisation in Table 2.1 has been used to establish a set of unambiguous categories of policy instruments: • RD&D support • Investment support
Following common practice, the term ‘investment support’ will be used for fixed investment subsidies, grants and for fiscal measures on investment. Investment subsidies based on competitive bidding will be named specifically.
• Feed-in tariffs The term feed-in tariff is used both for a fixed tariff and for a premium on top of fluctuating electricity prices. Feed-in support schemes rely on regulatory measures for cost allocation, but also often include government funded subsidies on the production.
• Bidding procedures Bidding procedures form an interesting scheme for either investment support or for production support. These schemes are commonly also based on regulatory measures for cost allocation, and can therefore be a non-financial measure for government.
• Quota A quota system, also commonly known as Renewable Portfolio Standard, can be categorised as a non-financial measure. A quota can be set on production or consumption.
• Negotiated agreements • Stimulation of RE consumption by price reduction
Stimulation of consumption through price incentives can be achieved by lowering the price to consumers of Renewable Energy, which is a direct policy instrument, or be increasing the price for non-renewable energy relative to that from renewable sources, which is an indirect form of stimulation.
A number of policy schemes make use of a combination of the above mentioned support instruments- for example combining a quota system with financial support on investments.

ECN-C--03-029 11
Green Certificates do not form a separate instrument, but can be used for the marketing and monitoring of green electricity and financial flows within various policy schemes. Apart from these direct policy instruments aimed at the support of renewable energy, it must be stated that the policy and regulatory context and indirect measures are often as crucial for the deployment of renewable energy technologies.
2.2.2 Policy instruments in the renewable energy market A market is defined by supply and demand. The supply and cost of renewable energy are defined in the investment and production phase of a renewable energy project. The demand for renewable energy, on the other hand, is stimulated by instruments targeting consumption. A second distinction can be made between price and quantity. One group of instruments has an impact on the price for renewable energy or is trying to facilitate the market for renewable energy against premium prices. Another group is of regulatory nature and is prescribing a minimum quantity of renewable energy to be produced or consumed. The possible ways of market stimulation can thus be divided in four groups: 1. Stimulating the supply by pricing mechanisms as the main support scheme. 2. Stimulating the demand by price related incentives as the main support scheme. 3. Stimulating the supply by quantity related measures as the main support scheme. 4. Stimulating the demand by quantity related measures as the main support scheme. Examples of the main instruments that are being applied in different EU countries are presented in a matrix of these groups in Figure 2.1 below.
supply
Feed-in tariff Germany, Austria, Spain, France, Greece, Portugal, Finland
Competitive Bidding Ireland
Obligation for producers Italy
demand
Price support of the demand Netherlands
Quota-Obligation for consumers or suppliers UK, Austria (small hydro), Belgium
price quantity
Figure 2.1 Functioning of the renewable energy market by supply and demand, price and quantity
2.3 Description of direct instruments
2.3.1 RD&D support Direct support for research, development and demonstration is widely used to stimulate the development and market uptake of those renewable energy sources that are far from commercial implementation. R&D is generally supported through national programmes, and the EU has additional short, medium and long term research programmes for different technologies. Technology development impacts the energy market indirectly through decreased investment or

12 ECN-C--03-029
production costs. Demonstration projects are commonly supported through financial support for investment combined for example with demands on monitoring. The market impact of such instruments will be similar to those of investment support.
2.3.2 Investment support Investment subsidies can help overcome the barrier of a high initial investment. This type of subsidy is commonly used to stimulate the sales of less economical RE technologies. Investment subsidies are usually 20-50% of eligible investment costs. Some EU countries support renewable electricity by means of the fiscal system. These schemes may take different forms. These forms range from rebates on general energy taxes, rebates from special emission taxes, proposals for lower VAT rates, tax exemption for green funds, to fiscal attractive depreciation schemes.
2.3.3 Feed-in tariffs Feed-in tariffs are a form of support for renewable electricity production. The term feed-in tariff is used both for a regulatory, minimum guaranteed price per unit of produced electricity to be paid to the producer, but also for a premium on market electricity prices. Regulatory measures are usually applied to impose an obligation on electricity utilities to pay the (independent) power producer a price as specified by the government. The tariff may be supplemented with subsidies from the state. The level of the tariff is commonly set for a number of years to give investors security on income for a substantial part of the project lifetime. Many different adaptations of the instrument are applied. A feed-in tariff can be based on the avoided cost of the utility that has the purchase obligation, or on the end price to the consumer. However, the level of the tariff need not have any direct relation with either cost or price, but can be chosen at a level to motivate investors for green power production.
2.3.4 Bidding procedures Bidding procedures can be used to select beneficiaries for investment support or production support (such as through feed-in-tariffs), or for other limited rights- such as sites for wind energy. Potential investors or producers have to compete through a competitive bidding system. The criteria for judgement of the bids are set before each bidding round. For example in Spain, wind energy projects compete not only on basis of costs, but also on the basis of their technical quality, socio-economic impact, and geographic & environmental concerns. The government decides on the desired level of electricity from each of the renewable sources, their growth rate over time, and the level of long-term price security offered to RE generators over time. The bidding is accompanied by an obligation on the part of electricity providers to purchase a certain amount of electricity from renewable sources at a premium price. The difference between the premium and market price is reimbursed to the electricity provider, and is financed through a non-discriminatory levy on all domestic electricity consumption. In each bidding round the most cost-effective offers will be selected to receive the subsidy. The mechanism therefore leads to the lowest cost options. In order to maintain a differentiation in RE supply, the bidding may be differentiated in bands of different technologies and RE sources. This means that wind projects compete against other wind projects but not against, for example, biomass projects. The marginal accepted bid sets the price for the whole technology band.
ECN-C--03-029 13
2.3.5 Quota An instrument that is commonly expected to gain momentum in the future is the quota system, or a Renewable Portfolio Standard. The government sets the framework within which the market has to produce, sell, or distribute a certain amount of energy from renewable sources. The obligation is imposed on consumption (often through distribution companies) or production. Governments may choose to establish ‘technology bands’ in order to protect technologies from strong competition by lower cost options. The quota are usually tradable between companies to avoid market distortions. A tradable green certificate is needed for this system.
2.3.6 Negotiated agreements Negotiated agreements are a popular policy instrument in the field of environmental policy. The implementation of the agreements can be either voluntary or obligatory. Voluntary agreements are commonly preferred to gain involvement and commitment of main actors, without the necessity of regulations.
2.3.7 Stimulation of RE consumption by price reduction The price of energy from renewable sources to consumers consists of price of production, transmission and supply costs, and taxes. Taxes form a substantial part of energy prices for consumers in Europe, commonly a higher amount than the cost difference between renewable and non-renewable energy. A reduction in taxes for renewable energy sources can therefore make a large difference in price comparison between renewable and non-renewable energy for energy consumers.
2.3.8 Green certificates Green certificates by themselves are not a policy measure, but they serve as an instrument to accredit the production of renewable electricity. Green Certificates are commonly used in the Quota System, but they have also been used as an instrument to accredit and monitor production and sales, and to facilitate trade within several policy schemes such as voluntary agreements or stimulation of demand. The certificates provide an accounting system to register production, authenticate the source of electricity, and to verify whether demand has been met. Demand may be voluntary, based on the customer’s willingness to pay for green electricity, or it can be imposed by the government. In the latter case, penalties are applied if the demand obligation is not met. The term green certificate is commonly used to describe the system where separation occurs of electricity as a physical commodity, and its ‘green quality’ emanating from the use of renewable sources. The ‘green quality’ is incorporated in the green certificate, which is issued at the moment of production, and which can be traded separately from the physical commodity. The green certificate system therefore greatly facilitates the trade. According to the EC Directive on renewable energy, all countries are obliged to have a system in place for ‘Guarantees of Origin’ for all renewable energy production by October 2003. These Guarantees of Origin do not have to be tradable. If they are made to be tradable, they will have the function of a green certificate. In countries with a green certificate system already in place, it is likely that the system will be used for Guarantees of Origin. A prototype green certificate and trading system for Europe has already been established: RECS (Renewable Energy CertificateTrading System) independent from the ‘Guarantees of Origin’ and from governments. This system has members ranging from utilities to power brokers and wind turbine owners’ associations. So far national groups within RECS have been established in
14 ECN-C--03-029
Denmark, Norway, The Netherlands, Germany, Italy, Belgium, Austria and France. These national bodies have committed themselves to financing independent certificate issuing bodies (Ibs). The national IB’s will join an Association (AIB) to ensure compatible certification systems. Values for the green certificates have are expected to differ per country (from €0.013-0.036 for Denmark to €0.05 for Belgium and UK).
2.4 Policy and market framework The policy and market framework forms the context in which renewable energy is implemented- it consists of regulations and permit procedures, but also factors such as electricity market structure, public awareness and attitude towards renewable energy. The policy and market framework also includes indirect policy instruments. These indirect instruments target policy fields other than renewable energy, for instance environmental impact or employment. Although they are not directly aimed at stimulating renewable energy, indirect instruments do have an impact on the renewable energy sector.
2.4.1 Regulations and procedures Regulations and procedures set requirements and define rights, and therefore play a major role in the definition of renewable energy projects, the preparation phase, and also during operation. Permits for construction and regulation concerning the requirements and rights to access to the grid, or the allocation of costs are examples of vital regulatory framework conditions. The regulations governing the energy market from the framework within which renewable energy projects operate. This framework is partially still biased towards large scale centralised production, thereby decreasing the viability of renewable energy options. These issues are discussed in Paragraph 4.2 on distributed energy generation. On the other hand, regulations are essential for the functioning of many stimulating policies for renewable energy, and to support the existence of a market for renewable energy of any substantial size on the near to medium term. Permits are a part of the regulatory framework. The procedures to acquire permits are commonly seen as one of the major barriers to renewable energy implementation, and a re therefore mentioned separately.
2.4.2 Indirect measures The regulations targeted outside the renewable energy sector from another essential part of the policy framework. These indirect measures, for instance to stimulate efficient use of energy or to reduce emissions from industry, have been a major incentive for renewable energy implementation although they were not specifically meant as such.
2.4.3 Voluntary approaches In this report, we define voluntary approaches as purely market driven. Examples are: voluntary purchase of electricity from renewable sources, voluntary financing of renewable energy projects – from purchase of PV to equity shares of large projects. Government can influence such voluntary initiatives by creating a beneficial legislative and regulatory environment. Voluntary approaches are sometimes stimulated through financial measures (such as tax reduction or subsidies).

ECN-C--03-029 15
2.4.4 Public awareness and attitude The attitude of the general public is an important aspect of the policy framework. A supportive public opinion towards renewable energy is beneficial to policy implementation supporting renewable energy, and the continuity of such policy. A supportive public opinion will influence the market- either directly through the creation of a larger demand, or indirectly though stimulating demand and supply by the commercial sector with PR motivation. Also, the public plays an important role in consultation processes in many permitting procedures. To create a positive attitude towards renewable energy, and to allow a demand driven market to develop, awareness is a first step. Awareness of environmental problems, climate change, or other drivers behind renewable energy would form part of this. In a liberalised market consumers will have a choice in defining their energy supply. Awareness of this choice, and transparent information on the supplied fuel mix will become increasingly important in the future. Measures to create awareness are awareness and promotion campaigns, creation of institutions that provide access to information, and education on renewable energy.
2.5 Trends in promotional schemes Although the political environment is continuously fluctuating, a few structural developments can be noticed in the international setting for policymaking. The constant concern of international security of supply of energy, the increasing experience with renewable energy supply and the improving performance of the technologies have led to the current situation, where energy policy is inseparably connected to the integration of renewable options. Over the past years, a lot of experience has been gained with a spectrum of policy instruments for the stimulation of renewable energy, legislation and regulation regarding renewables. (Haas and Wohlgemuth, 2001) The earliest incentives to promote renewable energy were subsidies on investment. This type of support is still used, both at local and at national level, although currently for a smaller number of technologies. Another early development (around 1990) regards fiscal measures on production or consumption. Although in the early 1990s a few examples existed of a support of the production of electricity, feed-in tariffs have become more and more popular in recent years. They include a guaranteed kilowatt-hour price set by the authorities, and a guaranteed kilowatt-hour price for projects under a competitive bidding system. The aspect of competition by stimulating voluntary demand fits very well in the economical climate of liberalisation, which has been initiated since the end of the 1990s. In this period the mechanism of green pricing became increasingly popular, as well as other market-oriented phenomena, such as green tariffs, certificate systems and trading. At present, renewable electricity options benefit from a wide range of support mechanisms, where the traditional support measures still exist next to newer incentives. This is the current situation: a changing setting from technology push to market pull. These trends call for a careful outlook to the future of renewable energy in Europe. Observing the discussion regarding a Europe-wide energy tax and the calls from several countries for labelling of conventional and renewable electricity, the polluter-pays principle (e.g. through an ecotax system) could possibly be brought into service. In case this will be achieved, it can be regarded as a success of the free market, where the non-financial advantages of renewable energy sources become valuable and turn these sources into components of a competitive energy supply, bringing together consumption and sustainability.
16 ECN-C--03-029
3. ANALYSIS OF PROMOTIONAL SCHEMES
3.1 Introduction to the analysis In this chapter, we analyse the success of policy instruments. In general terms, success can be defined as contributing to a sustainable growth of the renewable energy market. In order to be able to objectify the analysis, we have made a ‘breakdown’ of the definition of success into a set of criteria. These success criteria concern aspects such as the impact of a certain policy instrument on volumes of implementation, but also the sustainability of the impacts. The following list of criteria, or success factors, has been used: • Effectiveness, • Cost effectiveness, • Certainty for industry, • Market efficiency (static and dynamic), • Transparency, • Transaction cost and administrative capacity, • Equity (fair distribution of benefits), • Market conformity. First, in Paragraph 3.2, the evaluation criteria are discussed, and the policy instruments are compared with each other per criteria. This analysis is carried out according to intrinsic design features of instruments. For each comparison, policy instruments are selected that stand out in their score for the discussed success factor. This first analysis gives insight into the consequences of the basic principles behind the policy instruments. However, most policy instruments can be designed and implemented in several ways, impacting the potential and actual score on the different success criteria. Therefore, a second analysis round has been carried out per policy instrument. This analysis, which provides insight into case specific features and experiences, is presented in Paragraph 3.3. Input on actual experiences and success of policy instruments is not generally available. Case studies on renewable energy policy instruments in The Netherlands, Germany, Italy, Spain and Switzerland have been carried out to provide such information for this analysis. The case study documents themselves are provided on the ECN-REMAC webpage: www.renewable-energy-policy.info/remac The impacts of the policy and market framework on the renewable energy market is briefly discussed in Paragraph 3.4.
3.2 Analysis by evaluation criteria
3.2.1 Effectiveness The most straightforward measure for success of any policy instrument is whether it has had the required effect. Effectiveness is normally defined as the degree to which a measure contributes to attaining a specified goal or target. This definition is too broad for our purpose. Firstly because the goals may differ per country (e.g. high national employment or environmental impact reduction) and secondly because a less ambitious policy target would be easier to obtain, giving no indication on the influence of the measure on the result. Therefore, in the context of this analysis, effectiveness is regarded in a quantitative sense on the measurement of the amount of renewable energy. This leads to a definition of effectiveness: effective policies achieve a larger amount of capacity (kW) added or amount of renewable energy that is generated (kWh).

ECN-C--03-029 17
It should be noted that effectiveness does not imply anything about the way in which a target is achieved, it merely relates to the quantitative impact. For instance, certain very costly measures may be very effective to attain certain policy goals, but make the overall policy process rather expensive. The table below gives an overview of effectiveness of several policy instruments by inherent design features. However, it is very difficult to separate the inherent features from design features or the context of the policy. The two most crucial factors in this sense are the height of financial support and the certainty (future perspective) for industry.
Table 3.1 Effectiveness of policy instruments Policy instrument Effectiveness Feed-in tariffs Feed-in tariffs can be regulated, and costs distributed. This makes
relatively high levels of support possible, with a long term certainty. Feed-in tariffs provide no guarantee for attaining policy targets.
Quota Quota obligations are most effective in reaching policy targets for RES-E, as they put a clear obligation on an actor in the electricity chain to produce, buy, supply or trade a certain amount of RES-E, with a penalty in case this actor fails to meet this obligation. The obligation to individual actors is set to meet the overall policy target.
Subsidies and fiscal measures
For subsidies and fiscal measures no guarantee about their effectiveness can be given. High impact is possible, the total effect on volumes depend on the level of subsidy/fiscal incentive and the available and continuity of budgets.
Competitive bidding Tendering systems can be very effective in stimulating new capacity as the amount of capacity to be tendered is set at forehand. The total volume installed or generated will not surpass the size of the tender. It is important that the bidding system is designed in such a way that at least sufficient bids are solicited to ‘fill’ the tender.
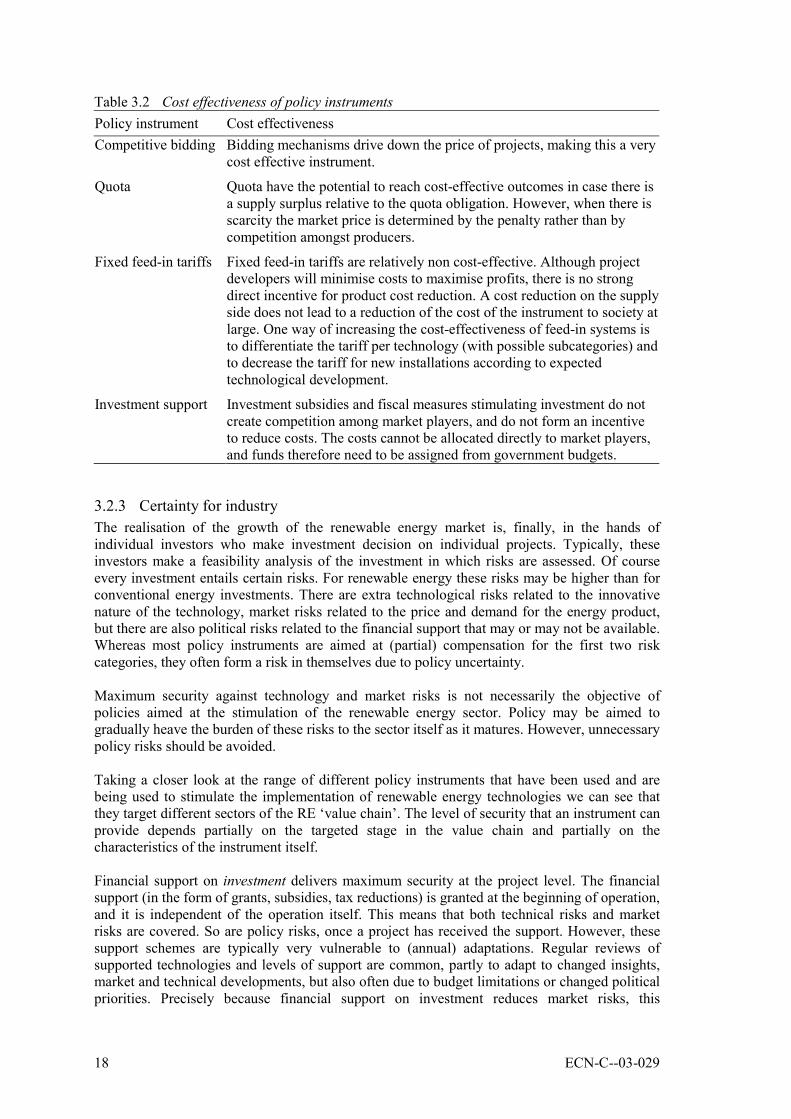
3.2.2 Cost Effectiveness Cost effectiveness is a measure of the amount of result (relative to a target) per € spent. In the definition used for this analysis, the cost effectiveness is regarded in terms of costs for government or implementing agencies. The costs for society as a whole are covered by the criteria on market efficiency. In the case of promoting renewable energy cost-effectiveness can be expressed both in terms of kW/€ (capacity) or kWh/€ (production). Which measure is to be chosen depends on the formulation of the policy goal. It is very difficult to give a quantitative analysis of cost effectiveness, because even when the data on results and on expenditures are known, the relationship between these two is not certain. On the one hand, part of the expenditures may have been used by so-called ‘freeriders’- who would also have implemented the technology if the policy instrument had not been in place, but nevertheless make use of it. On the other hand, the existence of policy support measures may have an attention effect on the market that reaches a broader market than the target group. These considerations show that the real cost effectiveness can only be analysed in close contact with the market. The actual costs to government or implementing agencies depends on the design of the instruments, which can in most cases, allocate costs to market parties.
18 ECN-C--03-029
Table 3.2 Cost effectiveness of policy instruments Policy instrument Cost effectiveness Competitive bidding Bidding mechanisms drive down the price of projects, making this a very
cost effective instrument.
Quota Quota have the potential to reach cost-effective outcomes in case there is a supply surplus relative to the quota obligation. However, when there is scarcity the market price is determined by the penalty rather than by competition amongst producers.
Fixed feed-in tariffs Fixed feed-in tariffs are relatively non cost-effective. Although project developers will minimise costs to maximise profits, there is no strong direct incentive for product cost reduction. A cost reduction on the supply side does not lead to a reduction of the cost of the instrument to society at large. One way of increasing the cost-effectiveness of feed-in systems is to differentiate the tariff per technology (with possible subcategories) and to decrease the tariff for new installations according to expected technological development.
Investment support Investment subsidies and fiscal measures stimulating investment do not create competition among market players, and do not form an incentive to reduce costs. The costs cannot be allocated directly to market players, and funds therefore need to be assigned from government budgets.
3.2.3 Certainty for industry The realisation of the growth of the renewable energy market is, finally, in the hands of individual investors who make investment decision on individual projects. Typically, these investors make a feasibility analysis of the investment in which risks are assessed. Of course every investment entails certain risks. For renewable energy these risks may be higher than for conventional energy investments. There are extra technological risks related to the innovative nature of the technology, market risks related to the price and demand for the energy product, but there are also political risks related to the financial support that may or may not be available. Whereas most policy instruments are aimed at (partial) compensation for the first two risk categories, they often form a risk in themselves due to policy uncertainty. Maximum security against technology and market risks is not necessarily the objective of policies aimed at the stimulation of the renewable energy sector. Policy may be aimed to gradually heave the burden of these risks to the sector itself as it matures. However, unnecessary policy risks should be avoided. Taking a closer look at the range of different policy instruments that have been used and are being used to stimulate the implementation of renewable energy technologies we can see that they target different sectors of the RE ‘value chain’. The level of security that an instrument can provide depends partially on the targeted stage in the value chain and partially on the characteristics of the instrument itself. Financial support on investment delivers maximum security at the project level. The financial support (in the form of grants, subsidies, tax reductions) is granted at the beginning of operation, and it is independent of the operation itself. This means that both technical risks and market risks are covered. So are policy risks, once a project has received the support. However, these support schemes are typically very vulnerable to (annual) adaptations. Regular reviews of supported technologies and levels of support are common, partly to adapt to changed insights, market and technical developments, but also often due to budget limitations or changed political priorities. Precisely because financial support on investment reduces market risks, this

ECN-C--03-029 19
instrument category is usually targeted at new technologies with high technical risks that need maximum shelter from market conditions (such as PV). Support instruments on operation reduce the market risks of operation, but do not cover technical risks. Examples are feed-in tariffs, or quota on production with green certificates. These instruments are very different in nature. Feed-in tariffs can be established and designed in many different manners. Tariffs established by government decision provide more security in the project development phase than tariffs established through tenders in a bidding procedure. The design of instruments also largely impacts security on return on investments: the tariffs can be set at a fixed level, or the support can be a fixed premium on top of grey electricity prices. The most popular among investors is the fixed feed-in tariff, as this offers the most security against changing market conditions. An essential aspect of the impact of this kind of support measure is the duration of the income level. Long term certainty, at least for the project economic lifetime which is commonly 10 years, is necessary. Support instruments targeting the demand for green energy reduce only part of the market risks and do not provide security against technical risks. The demand for green energy can be stimulated in several ways: decreasing the price difference with grey electricity, increasing the (perceived) value of the green energy product, or setting a target that may or may not be obligatory. Examples of instruments that target demand in these ways are respectively: • A ‘greening of the energy taxation’ making non-renewable energy more expensive. ‘Green
energy taxes’ are commonly used in Europe. Depending on the level of the taxes, this does stimulate the market for renewable energy, especially of technologies that are close to competitive production, or as an additional instrument. Green taxation does generally offer a long term improvement in the market framework, as taxes are only very rarely abolished or reduced.
• Decreasing the price of energy from renewable sources. • Awareness and information campaigns that advertise the value of renewable energy,
Awareness campaigns have the lowest impact on security of income for renewable energy technology operators. However, this type of instrument does impact the framework within which the renewable energy market develops. Awareness and public support also provide political arguments for policy support, and are therefore beneficial to continuity of policy. Awareness and information also form a basis for the demand-driven renewable energy market which is the expected future.
• Agreements or quota on the consumption of renewable energy. Agreements or quota provide more security on market size depending on enforcement. However, security on a certain level of consumption does not imply either a certain demand or a certain price for individual producers of renewable energy. Quota systems with tradable obligations introduce competition between technologies and between plants with lowest production costs. In order to meet demand, green electricity (or its green quality in the form of certificates) may be imported if this is allowed under the policy design. Therefore the security for investors in renewable energy technologies is highest for technologies with lowest production costs, and at the most attractive locations (especially for wind energy) within the market area. Concerning the continuity of the implementation of policy instruments, stimulation of demand is the ideal instrument, as it with increasing obligations and decreasing production costs, the ‘supported market’ can gradually dissolve into the competitive general electricity market.
The risks that are created by policies and the policy framework are related to insecurity of eligibility to support and success of permit procedures, and insecurity of whether and how much financial support will be available for the project concerned throughout the project lifetime. Because renewable energy projects usually have long lead times (between 2 and 5 years), insight into future developments of policy measures is important to reduce the risks for investors. However, policy support is a political issue, and therefore is prone to adaptations over
20 ECN-C--03-029
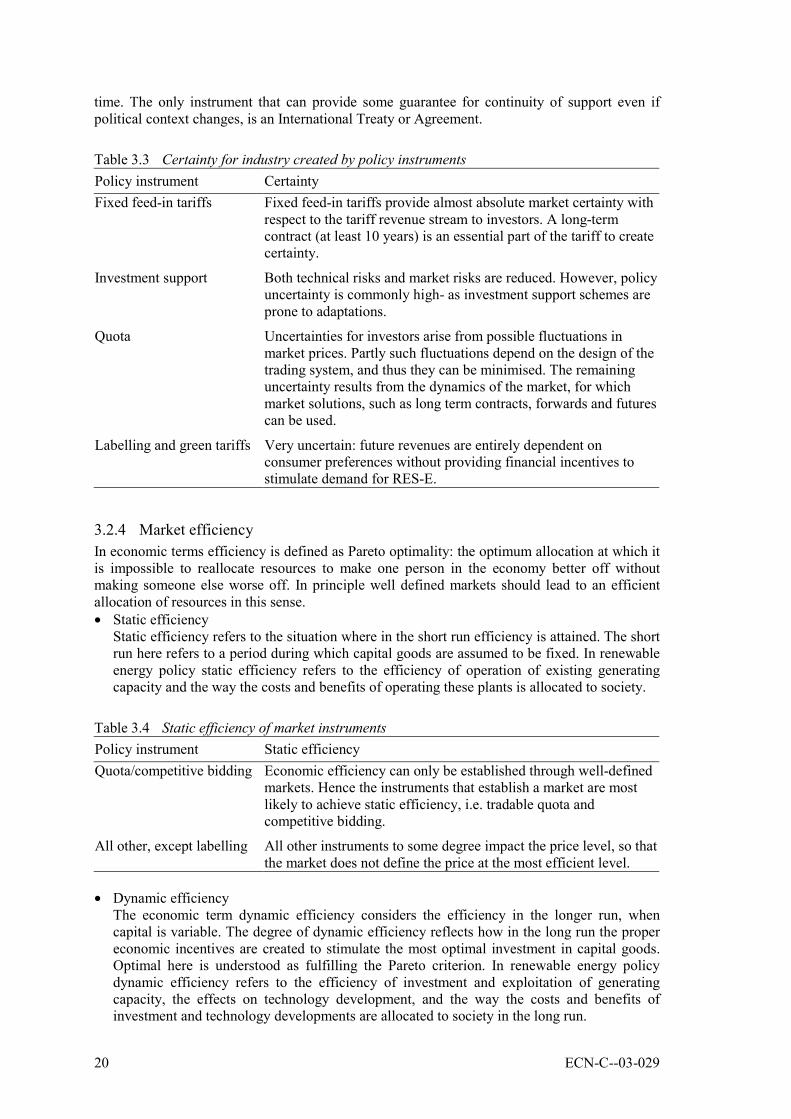
time. The only instrument that can provide some guarantee for continuity of support even if political context changes, is an International Treaty or Agreement.
Table 3.3 Certainty for industry created by policy instruments Policy instrument Certainty Fixed feed-in tariffs Fixed feed-in tariffs provide almost absolute market certainty with
respect to the tariff revenue stream to investors. A long-term contract (at least 10 years) is an essential part of the tariff to create certainty.
Investment support Both technical risks and market risks are reduced. However, policy uncertainty is commonly high- as investment support schemes are prone to adaptations.
Quota Uncertainties for investors arise from possible fluctuations in market prices. Partly such fluctuations depend on the design of the trading system, and thus they can be minimised. The remaining uncertainty results from the dynamics of the market, for which market solutions, such as long term contracts, forwards and futures can be used.
Labelling and green tariffs Very uncertain: future revenues are entirely dependent on consumer preferences without providing financial incentives to stimulate demand for RES-E.
3.2.4 Market efficiency In economic terms efficiency is defined as Pareto optimality: the optimum allocation at which it is impossible to reallocate resources to make one person in the economy better off without making someone else worse off. In principle well defined markets should lead to an efficient allocation of resources in this sense. • Static efficiency
Static efficiency refers to the situation where in the short run efficiency is attained. The short run here refers to a period during which capital goods are assumed to be fixed. In renewable energy policy static efficiency refers to the efficiency of operation of existing generating capacity and the way the costs and benefits of operating these plants is allocated to society.
Table 3.4 Static efficiency of market instruments Policy instrument Static efficiency Quota/competitive bidding Economic efficiency can only be established through well-defined
markets. Hence the instruments that establish a market are most likely to achieve static efficiency, i.e. tradable quota and competitive bidding.
All other, except labelling All other instruments to some degree impact the price level, so that the market does not define the price at the most efficient level.
• Dynamic efficiency
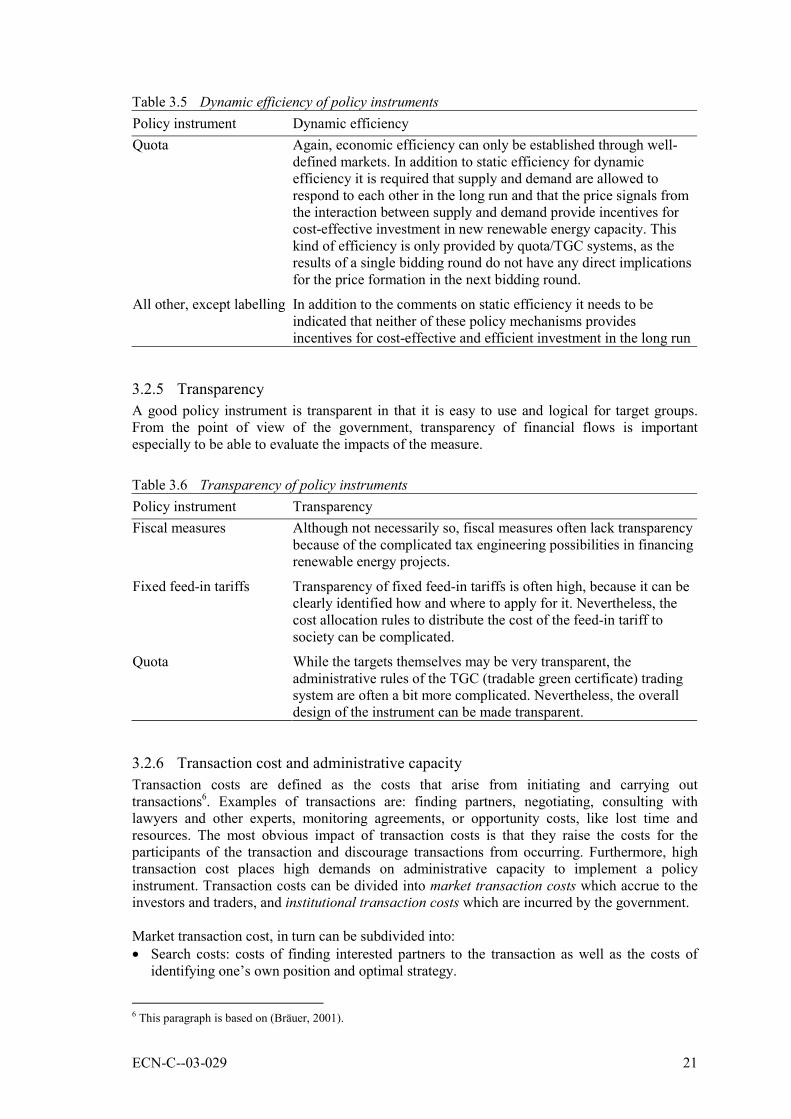
The economic term dynamic efficiency considers the efficiency in the longer run, when capital is variable. The degree of dynamic efficiency reflects how in the long run the proper economic incentives are created to stimulate the most optimal investment in capital goods. Optimal here is understood as fulfilling the Pareto criterion. In renewable energy policy dynamic efficiency refers to the efficiency of investment and exploitation of generating capacity, the effects on technology development, and the way the costs and benefits of investment and technology developments are allocated to society in the long run.
ECN-C--03-029 21
Table 3.5 Dynamic efficiency of policy instruments Policy instrument Dynamic efficiency Quota Again, economic efficiency can only be established through well-
defined markets. In addition to static efficiency for dynamic efficiency it is required that supply and demand are allowed to respond to each other in the long run and that the price signals from the interaction between supply and demand provide incentives for cost-effective investment in new renewable energy capacity. This kind of efficiency is only provided by quota/TGC systems, as the results of a single bidding round do not have any direct implications for the price formation in the next bidding round.
All other, except labelling In addition to the comments on static efficiency it needs to be indicated that neither of these policy mechanisms provides incentives for cost-effective and efficient investment in the long run
3.2.5 Transparency A good policy instrument is transparent in that it is easy to use and logical for target groups. From the point of view of the government, transparency of financial flows is important especially to be able to evaluate the impacts of the measure.
Table 3.6 Transparency of policy instruments Policy instrument Transparency Fiscal measures Although not necessarily so, fiscal measures often lack transparency
because of the complicated tax engineering possibilities in financing renewable energy projects.
Fixed feed-in tariffs Transparency of fixed feed-in tariffs is often high, because it can be clearly identified how and where to apply for it. Nevertheless, the cost allocation rules to distribute the cost of the feed-in tariff to society can be complicated.
Quota While the targets themselves may be very transparent, the administrative rules of the TGC (tradable green certificate) trading system are often a bit more complicated. Nevertheless, the overall design of the instrument can be made transparent.
3.2.6 Transaction cost and administrative capacity Transaction costs are defined as the costs that arise from initiating and carrying out transactions6. Examples of transactions are: finding partners, negotiating, consulting with lawyers and other experts, monitoring agreements, or opportunity costs, like lost time and resources. The most obvious impact of transaction costs is that they raise the costs for the participants of the transaction and discourage transactions from occurring. Furthermore, high transaction cost places high demands on administrative capacity to implement a policy instrument. Transaction costs can be divided into market transaction costs which accrue to the investors and traders, and institutional transaction costs which are incurred by the government. Market transaction cost, in turn can be subdivided into: • Search costs: costs of finding interested partners to the transaction as well as the costs of
identifying one’s own position and optimal strategy.
6 This paragraph is based on (Bräuer, 2001).
22 ECN-C--03-029
• Negotiation costs: the costs for coming to an agreement. Negotiating terms may for example take time, visits to the site of a project, and hiring lawyers to draft contracts.
• Approval costs arise when the negotiated exchange must be approved by a government agency. Modifications could be imposed on the deal.
• Monitoring costs are the efforts the participants must make to observe the transaction as it occurs, and to verify adherence to the terms of the transaction.
• Enforcement costs: the expenses to insist on compliance once discrepancies are discovered. • Adjustment costs: costs of changing strategies, due to a change in regulations or new
scientific discoveries. Institutional transaction costs include: • Developing the instrument in question, • Enacting it by legislature, • Establishing of an administrative infrastructure, • Implementing, monitoring and enforcing the policy by administrative agencies and the
courts, • Fighting political opposition against the instrument; campaigning for social acceptance. Note that the market transaction costs concern the individual investor while the institutional transaction costs concerns society at large. Institutional transaction cost have direct implications for the required administrative capacity on the part of the government, and have to be carefully weighted before selecting a policy instrument. Considering the different sources of transaction costs on the government and the investor side there are no conclusive figures on the relative size of transaction cost for the policy instruments considered in this research. Also it needs to be realised that transaction cost are very much related to the administrative form that is chosen for the implementation of an instrument and that transaction cost are not always directly linked to the choice of the instrument. Nevertheless, most types of policy instrument are relatively more prone to certain types of transaction cost. A table indicating transaction costs related to different policy instrument categories is presented in the Annex. Subsidy and fiscal instruments are most prone to transaction costs arising from search cost, approval cost, monitoring cost and the establishment and the operation of the administrative infrastructure. Trading based instruments such as consumption or production quota, are relatively transparent and therefore have relatively few transaction costs. Their main transaction cost originates from the technical and administrative infrastructure needed for the registration, and verification of certificates. In trading based instruments the size of the market is of course important for the level of transaction costs. The larger the market volume, the lower the transaction costs. Competitive bidding and regulatory measures and agreements have relatively higher cost of developing the instrument, as well as negotiating and approval cost. Both types of instruments are more tailor-made policy solutions, either for a specific target group (agreements) or for a specific government target (bidding). The tuning to these needs provides for extra transaction costs. In reaching an agreement between government and industry negotiating costs play a role.
3.2.7 Equity From a government point of view and for the long term sustainability of renewable energy support, a ‘fair’ distribution of both costs and benefits of renewable energy implementation is important. Policy instruments can be designed to steer on the distribution of costs and/or benefits, for example over various stakeholder categories, or geographically. Good insight and foresight into the market and its developments is necessary to achieve such equity. Equity

ECN-C--03-029 23
aspects of policy instruments are not inherent to the policy instrument itself, but depend very much on its design.
3.2.8 Market conformity Market conformity is a success factor for the contribution of a policy to a sustainable development of the supported technology or sector. Because direct policy support (in the form of subsidies, feed-in tariffs etc.) is transitional to the development of a fully demand driven mature market, it is important that the sector learns to cope with market conditions. The danger of policies which do not stimulate market conformity is that developments of the sector and of technology focus too much on these policies, making the transition to functioning in a competitive market much more abrupt. In a liberalising energy market, the international dimensions of market conformity are becoming ever more important. Especially the possibility to harmonise a policy scheme for international trade will be essential for long term applicability.
Table 3.7 Market conformity of policy instruments Policy instrument Market conformity Quota Providing that a TGC trading system underlies the quota
obligation, this is the most market conform policy instrument, as it allows a market for green certificates to arise. Moreover, the trading of TGCs prevents a disturbing impact on the electricity market from the integration of RES-E.
Competitive bidding for subsidy Although the bidding for subsidy can be market conform the allocation of the cost to society is not. Therefore this is not a completely market conform solution.
Fiscal measures and subsidies targeted at production and investment
These fiscal measures and subsidies have the potential to distort the market because they cannot be established in a market conform way. Subsidies usually leave room for inefficient investments, unless eligibility for subsidies is determined on a competitive basis, e.g. through tendering. Fiscal measures essentially have the same effect.
3.3 Analysis by policy instrument
3.3.1 Financial measures for renewable energy Financial support instruments can target either investment, production, or consumption. Before the support schemes are discussed separately, it is useful to make a number of general remarks based on the point in the implementation chain targeted by the support. If financial support schemes are targeted at investment, this is not automatically beneficial for the production of energy. Firstly, investment support may reduce the financial incentive to optimise energy production. Secondly, if operation and maintenance costs are higher than revenues from energy production, it is rational to stop production. Support schemes aimed at investments however, do impact installed capacity as they lower the barrier for investors and decrease the investment risks. Support schemes targeted at production form an incentive to optimise energy production, and will also increase feasibility of operation. Support schemes on production require long term government commitment. Especially where the government itself is giving financial support (i.e. costs are not allocated directly to society) this can be politically difficult.
24 ECN-C--03-029
Support schemes aimed at consumption stimulate production, generally of the lowest cost option. These may be abroad, and prefer technologies that are closest to commercial operation. The stimulation of consumption does not automatically lead to increased investments. Investments will only be stimulated on the short term if the support for consumption is directly linked to investment obligations or is limited to new production facilities. On the longer term, investments are stimulated, depending on the total market supply and demand.
3.3.2 RD&D support The impacts of RD&D support on the market for renewable energy are indirect- through influence on investments costs or operational costs, and through increasing awareness and confidence in a technology of potential investors. In the REMAC project, RD&D is the topic of WP1. Some brief comments related to policy instrument success factors are mentioned below. Effectiveness Per definition, it is very difficult to measure the impacts of R&D support on the size of the market, because the R&D itself can only have effect on actual hardware or operational cost after a certain number of years, and also because there is not a direct relationship between research effort and price reduction. However, it is obvious that R&D necessary to improve the competitiveness of most renewable energy technologies, and that support for such research is positive and necessary for the development of technologies that are far from commercial implementation. Nevertheless, the commercial sector itself also has a capacity and responsibility to invest in R&D. Because of the low predictability and long-term effects of R&D, stimulation of R&D activities requires continuity and predictability of support. The effectiveness of R&D is also strongly dependent on the uptake of research results by industry- therefore it is important to establish early co-operation with industry. Although the effectiveness of R&D programmes may be hard to measure, it can be stated that the existence of R&D support programme form an essential part of the development of renewable energy technologies. R&D is necessary to keep a broad range of technology options open for future application. The effectiveness of pilot and demonstration projects can be measured by the direct effect on installed capacity. The indirect effects on the market such as the creation of awareness and increased trust in new technologies are much more difficult to assess. Demonstration and pilot projects form a majority of large grid connected PV installations throughout the world. In Switzerland, pilot and demonstration projects form half of the installed capacity of PV.
3.3.3 Investment support Financial support for investment is the most common instrument for the support of renewable energy. This type of measure usually exists next to other support instruments. Also, there are many local initiatives that offer financial support on investment. Investment subsidies and fiscal support measures usually range between 20-50% of investment costs. The sum of different subsidies do amount to higher support levels. Examples of highest investment support levels are commonly found for PV. Effectiveness Financial support for investment can be very effective, but it is important that the instrument is designed well. The impact depends largely on the height of the support, and on whether the support is crucial to the economic viability of the technology. The effectiveness of the instruments is reduced by ‘free riders’ who would also have invested without the financial support. For renewable energy technologies, the effect of free riders is

ECN-C--03-029 25
relatively low (for example compared to many energy efficiency technologies), due to the fact that most technologies are not close to commercial implementation without additional support. However, the impact of ‘free riders’ both on the effectiveness and cost-effectiveness of financial support instruments is a major drawback of this type of policy instrument. In the case of the Law 308/82 in Italy, for example, the effectiveness of the law is doubted because the investment subsidies were granted after the investments and projects had been realised. The number of ‘freeriders’ can be reduced by selective targeting of technologies and markets that need support. Although free riders negatively impact the effectiveness of policy, the actions to prevent free riding must be not be counter-effective. The lengthy administrative procedures which are designed to reduce the number of free riders are commonly known to form a major barrier to the use of policy instruments. The effectiveness of support on investment can be measured in direct effects such as increase in installed capacity, but there are also indirect effects such as awareness creation. Information (campaigns) on subsidies are known to attract stakeholders who were not familiar with the (current) feasibility of renewable energy options, and also to contribute to public awareness and public support. Finally the effectiveness of investment support depends on the certainty that can be given for the duration of the instrument in combination with (expected) project lead time. Cost effectiveness The cost effectiveness of financial support instruments on investment depends partly on the number of free riders, but also on the characteristics of the instrument itself. Two inherent characteristics of support on investment make this type of instruments less cost effective than other categories. Firstly the main characteristic of financial support on investment is that it can only influence the installation, but does not stimulate generation or demand of renewable electricity. This can lead to low quality installations, or in extreme cases, implementation of the technology in unsuitable locations or layouts. This is especially the case where the investment costs for the investor are low relative to potential energy production.(due to high investment support). For example, in Japan, it is known that the high investment subsidies on PV have lead to widespread application of PV panels on North-facing roofs. Secondly support on investment does not lead to competition to lower the investment costs. The costs of financial support instrument on investment to government are the major limiting factor on the use of this instrument. In general, if the subsidised technology becomes too widespread, the subsidy may have to be abolished because of the high costs. Administrative capacity Subsidies can be granted to individual projects (for large subsidies- to avoid free-riding) However, the administrative costs of an individual evaluation per project can only pay itself back in the case of large projects. An example from the case studies: in Italy, the effectiveness of Law 90/91 was reduced significantly because of the complex administrative procedures and the long period before assignment of grants. Equity Equity issues play a role in subsidy allocation: larger companies are often better equipped and better informed to apply for subsidies. Certainty for industry Because of the high costs to government, certainty on long term continuity of the instrument is generally low with financial support on investments. This can be particularly sensitive if the total subsidy budget is subject to annual government appropriation. For fiscal measures the moment of partial remuneration of invested money is later. This may lead to a lower perceived security.

26 ECN-C--03-029
Administration costs Administration costs of subsidies or fiscal measures are low if the measures are generic. If fiscal measures can make use of the existing tax control institutes, administration costs are reduced further. On the other hand, if lengthy administrative procedures or even individual project assessment is included in the procedures, costs are increased.
3.3.4 Feed-in tariffs Policy schemes using feed-in tariffs have had a substantial impact on the renewable energy market in the last few years. Part of this success is due to the characteristics of the feed-in instrument, but a large part also follows from price levels and design aspects. Feed-in-tariffs have been implemented in many different designs. A common design feature of feed-in-tariffs is a differentiation per technology. It is also possible to set different tariffs depending on the time or season of feeding electricity to the grid. For example in a number of provinces in Austria, the feed-in tariffs per technology are divided into four groups, namely high (day), low (night and weekend), winter (October until end of March) and summer (April until end of September). Further, a possible design feature of feed-in tariffs is a development over time depending on the moment of investment. Introducing a lower tariff for new investments further in the future aims to stimulate technology development. Effectiveness The effectiveness of the feed-in tariff system is generally perceived to be high. The most important factors for the effectiveness of the instruments are the term for which the tariff is guaranteed, and the level of financial incentive. A long term guaranteed tariff offers investors security on returns on investment- the main investment criteria. For this reason, feed-in tariffs are commonly set over a substantial period. In Germany the tariffs are set at twenty years from installation. In the Italian case the premium price is set at eight years, but a feed-in-level based on avoided costs remains applicable after that period. In Spain the feed-in tariff is fixed for a minimum of five years. Cost effectiveness The levels of guaranteed prices and the basis on which they are established varies considerably from country to country. The costs of feed-in tariffs are commonly allocated over market players, so that cost-effectiveness for government is high. Good contacts with market parties are necessary to gain insight into actual costs. This is necessary to set a tariff that does stimulate investments, but at minimum support level. Using a developing tariff is important for cost effectiveness over a longer period of new investments. Predicting development of costs over time is very difficult, however. A developing tariff, aimed at stimulation of technological and organisational development, is used in Germany. The German case also shows that regular modifications of feed-in levels are needed to adapt to developing insights and knowledge. Certainty for industry A feature of the feed-in tariff system that is especially valued by investors, is the security it can offer on income throughout the project lifetime. This implies that the impact of a feed-in system is largely dependent on the duration of the feed-in contracts, and also that fixed feed-in levels are more popular amongst investors than premiums. Obviously, the security for industry is lower if the incentive is designed as a premium rate on top of the market price for electricity rather than a fixed tariff. As with all production support schemes, the support should be fixed over a period of time long that is long enough to cover at least the critical payback period for investors. Because of the programmatic nature of the instrument, a long-term guarantee is generally feasible for a feed-in-tariff, as opposed to investment subsidies for example, which are more politically sensitive.
ECN-C--03-029 27
The booming renewable energy industry in Germany and Spain follows the introduction of guaranteed feed-in tariffs that are high enough to stimulate investments. The duration of the tariff in Germany is 20 years or longer, while that in Spain is only 5 years.
Equity The allocation of costs and benefits of feed-in schemes depends completely on the design of the instrument. A ‘fair’ distribution is difficult, as is shown by the German case. One of the main objections to the German Electricity Feed-In Law of 1990 was the unequal distribution of costs. The obligation to purchase renewable energy at premium prices weighed heavily on those operators in areas with high energy production from renewables. In 1998, a regional limit of 5% renewable electricity was set to protect the grid operators against high financial loads. If the renewable electricity production surpasses this threshold in a supply area, the operator is exempted from the obligation to purchase and refund. In the New Renewable Energy Law of 2000, the 5% cap was abolished. Instead, a system that allows transmission grid operators to share costs among themselves was introduced. Market conformity A feed-in- tariff protects the renewable energy market from most market risks- especially if a fixed tariff is set. A gradual imposing of market risks can be introduced by using a developing tariff, aimed at stimulation of technological and organisational development, such as is used in Germany. A feed-in tariff does not prepare market parties for aspects of competing in a free market such as price setting in a liberalised energy market with spot price markets, or coping with specific demands of green energy consumers.
3.3.5 Bidding Procedures Effectiveness The bidding mechanism can be effective if the awarded projects are indeed carried out. The UK experience has demonstrated that complementary policy conditions such as planning also need to be well arranged, to ensure actual implementation of the accepted bids. Under the NFFO many wind projects that were awarded the tender were not implemented due to problems in placement procedures. In Ireland, the 2002 bidding round for the Alternative Energy Requirement (AER) includes the requirement that all bids must already have planning permission to build and operate the proposed plant. The costs of the scheme are relatively predictable and the maximum is known, making it relatively easily acceptable from a political point of view. However, if the competition in the bidding rounds leads to very low prices, the effectiveness will be reduced. Cost effectiveness The competition within a tender ensures that the support decreases with cost reduction following technical or organisational development. Experiences in the UK and Ireland have demonstrated competitive bidding mechanisms to be most effective in driving down the price of renewable energy projects. Certainty for industry The certainty for industry in bidding procedures is low. Firstly, it is uncertain whether applying projects or offers will be approved, because this depends on the competition. Especially projects with a high preparation time form a high risk. Secondly, there is generally no consistency between tenders, because experiences are used to develop the each following bidding round to meet government requirements, and to adapt to changing circumstances. It is a high risk therefore for project developers to start project preparation when the tender conditions are not yet known. Because the government does not commit itself to future tenders, it is very easy to NOT issue a new tender. Political risk should be included in the support level.

28 ECN-C--03-029
Equity The criteria for bidding rounds can be designed in detail to meet objectives. For example in Spain, wind energy projects compete not only on basis of costs, but also on the basis of their technical quality, socio-economic impact, and geographic & environmental concerns. Market conformity A market created in a bidding round could be similar to the general market for electricity production, but generally the instrument is designed in such a way to maximise national priorities such as cost effectiveness or support of certain technologies. The market conformity of the NFFO in the UK was low because of the large difference in conditions compared to other countries. Competitive offers generated by the NFFO were only ‘affordable’ for established companies (with a large market base in other countries with larger profit margins).
3.3.6 Quota The quota system is commonly seen as a transitional policy instrument towards competition on the whole market. The market for renewable energy created by the quota system, or RPS, is a protected part of the total market, which can gradually merge into the total energy market. Quota can be imposed on production or consumption. In practice, these systems do not differ significantly on their score on the evaluation criteria. A large difference between quota systems is the direct allocation of quota to certain parties, or the use of tradable certificates to optimise cost effectiveness of the realisation of the quota. Effectiveness The effectiveness of a quota system depends strongly on the height of the penalty on con-compliance. Further, quota do not stimulate investments above those necessary to meet the quota. The effectiveness of quota on consumption on inducing additional installation depends also on the boundary of the market- if imports are allowed, it is likely that the impacts of the instrument on investments are smaller. Security on the continuation and levels of support and penalties over a long period strongly increase the effectiveness of the instrument. Cost effectiveness Trade of the obligations under a quota increases the cost effectiveness of obtaining the obligation. If tradable green certificates are used for such trade, the level of ambition of the target or obligation is reflected in the price of the green certificates. Green certificate trading stimulates competition between renewable energy producers, which will lead to declining costs of renewable electricity generation. Such a system is cost effective though its operational principle. Further, the costs of quota systems are commonly allocated to utilities, so that cost to government is reduced further. The total costs of implementation of a quota system, whether to the public or private sector are not known in advance. If the quota is imposed on demand, the price of the supply will be higher following the demand set by the quota, especially if the demand must be met by a limited (e.g. national) supply. Quota on supply can be defined per technology (group). This is commonly imposed to guarantee a technology mix, allowing technologies that are currently less cost effective to participate. The guarantee of a market for less cost effective options implies that the overall cost effectiveness of the system is lower. The more detailed the specification of the quota, the less freedom the market has to choose the most cost effective options. Quota on demand do not specify technologies- and therefore generally lead to a selection of the cheapest options under the obligation. Difference may occur where consumers are willing to pay more for certain preferred renewable energy options, and the system is designed in such a way that they have a
ECN-C--03-029 29
choice between technology mixes (e.g. through labels or brands). However, the expected effects of consumer willingness to pay more for more expensive options are estimated to be small. Effects on technology choice Green certificate systems will lead to a stronger demand for the lowest cost technology at the lowest risk. To ensure a technology mix, this effect may be (partially) compensated by limiting the eligible technologies (for example in the Netherlands, where hydro has been excluded from the green certification), dividing quota into technology bands or, in the case of voluntary demand marketing ‘attractive’ packages of green electricity. Certainty for industry The critical issues in the design of a green certificate trading system with an obligation are the definition of renewables to be used, the timing aspects of the obligation, the penalty for not reaching the target and the parties bearing the demand obligation. With regard to the timing aspect, the targets, the window for meeting the obligations and the time validity of the certificates should be determined. Moreover, the number of years that the demand obligation will be in force affects the uncertainty faced by renewable energy project developers. Static efficiency Regarding quota systems with tradable green certificates- these certificates are the major factor impacting efficiency. Green certificates can be traded, banked and consumed like any other commodity. In several EU Member States they are predominantly traded through bilateral contracts, but it is expected that both a spot market, and a forward and options market to hedge against price risks, will develop for green certificates. Forward prices will provide a powerful price signal for the development of new renewable energy projects. Dynamic economic efficiency Diffusion of renewable technology is enhanced, however, only for those technologies eligible for green certificates. Equity The main reason to use tradable green certificates is to realise a fair distribution of costs over market parties for the realisation of imposed renewable energy targets. Without trade, costs are higher per unit for companies that find it more difficult to meet the obligation. Also, newcomers and established companies will not face the same obligations or markets conditions under which to operate. Transparency Systems using green certificates are relatively transparent through the possibility of monitoring the production, sales and imports of green certificates.
3.3.7 Negotiated Agreements Effectiveness The effectiveness of negotiated agreements depends highly on the commitment of the parties involved. Most Voluntary Agreements are non-binding (Metz et al; 2001), so that ambitious goals are not likely to be obtained. Experiences in the Netherlands with the agreements under MAP were positive: the effectiveness was perceived to be very high, especially in terms of awareness. The direct access of the executing parties- utilities- to the customers, contributed to the effectiveness of the instrument. Cost effectiveness No general remarks can be made on cost-effectiveness of voluntary agreements, as this depends fully on the design of the agreement, and the agreed distribution of costs for implementing
30 ECN-C--03-029
measures under the agreement. Implementation of measures by parties who can fit the activities easily into ‘business as usual’, can be cost effective. However, exactly where such uptake of tasks by market parties fits well with the business practise and facilities, it is very difficult to gain insight into the costs of additional activities. Market efficiency The market efficiency of voluntary agreements is high, as the market itself decides which measures to take at which moment in time, and will optimise for lowest costs. In the Netherlands, the implementing agencies themselves have stated that they used all the lowest cost options in the first years of the MAP period, leaving the less economically feasible projects for the later period. Transparency One of the weak points of Voluntary Agreements can be that the transparency is low, due to decentralisation of responsibilities. The implementing organisations may have a low motivation to stimulate transparency, since it could even be to their own disadvantage. In The Netherlands, the lack of transparency of the MAP was partly caused by lack of monitoring following from the government belief in delegating responsibility and commitment to the market. Transaction costs The transaction costs of negotiated agreements are generally considered to be low compared to other instruments, especially where the stakeholders are involved and motivated to comply with the agreement, thereby saving on enforcement and monitoring activities. Also the possibility to use existing organisational structures is found to have a positive effect on transaction costs. Equity The consensus element in the approach implies that the stakeholders can distribute costs and benefits amongst themselves as they deem fair, which is likely to match the market situation. However, if the agreement includes only a section of the market, the involved parties may use the agreement to steer the developments to their own benefit and so increase their own competitive position (Metz, 2001). Market development Voluntary agreements often contain components to develop the market. Of course this also depends on the design of the instrument, but it has proved to be one of the major effects of the voluntary agreements both in the Netherlands and in Switzerland. Under the MAP, the utilities played a major role in increasing awareness and implementing local action plans for their customers, for example for insulation, high-efficiency boilers as well as the stimulation of renewables.
3.3.8 Stimulation of RE consumption by price reduction A positive differentiation in taxation of energy consumption between energy from renewable and non-renewable sources is equivalent to a price reduction for renewable energy for the consumers. Effectiveness In Netherlands in 2002, the taxation system on energy combined with a stimulation of renewable energy consumption, allowed prices from renewable electricity to approach or match that of grey electricity for the household sector. This created a large demand for energy from renewables, but due to the uncertainty of continuity of the instrument and international competition, it did not lead to a matching increase in installed capacity.

ECN-C--03-029 31
Equity Financing mechanisms through taxes (premium tariffs) on energy consumption distributes costs over the energy users according to the principle ‘the polluter pays’. However, the burden of environmental costs is not distributed over the international market. Especially the position of large energy users operating on an international market may be negatively influenced by high national energy taxes. This is why most countries differentiate energy taxation over sectors or level of energy consumption. An international energy tax, such as under discussion at EU level, would increase equity for large consumers, and would simultaneously allow governments to more effectively use the instrument to direct consumption towards renewable energy.
3.3.9 Green certificates Systems where green certification is used for trade between producers and suppliers have only recently been introduced in the Netherlands, Italy, Austria (small hydro), Flanders and Wallonia and the UK. Green certificates operate as a trading tool within a policy scheme. The main reasons to use green certificates are: the increased economic efficiency of the system, the more equitable distribution of costs, and the transparency created on production and consumption of renewable energy, as well as on prices. As discussed above under the quota system, precisely the selection of lowest cost and lowest-risk technologies may form the disadvantage of the system if government policy is to protect certain technologies or the national market for instance.
3.4 Policy and market framework
3.4.1 Regulations and procedures Although regulations and procedures are necessary for the existence of the greater part of the renewable energy market, they are often not designed in an optimal manner for the stimulation of renewable energy. In fact, regulations and procedures are commonly mentioned amongst the main barriers to renewable energy implementation where they create uncertainty in the project preparation phase and require extensive additional effort (time and money). One major reason for the problems with regulations and procedures is the lack of coherency between different authorities are involved at different levels (municipality, region) and for different policy fields (environment, spatial planning, energy). Such lack of coherency causes large delays and uncertainty for project developers. For example in The Netherlands, depending on the region, a farm scale biomass digester producing electricity may be classified as a power plant, and therefore not be allowed in rural areas. Another example in Italy: targets set for the integration of solar (both PV and thermal) systems in the built environment often are not consistent with building regulations. This lack of coherency and consistency means that decision have to be taken at project level, causing delays, higher costs, and increased uncertainty for project development. Also the number of authorities needed for a permit in itself may form a disincentive for renewable energy implementation, e.g. to deliver electricity to the grid in Italy the consent of more than 10 authorities is needed. Public consultation also commonly increases lead-time for months or even years. Improving coherency between policy fields and authority levels and streamlining procedures is necessary to accelerate renewable energy implementation.

32 ECN-C--03-029
3.4.2 Indirect measures Renewable energy implementation is directly related to many different policy field, the most important of which: energy, environment, spatial planning. The renewable energy market profits from these links on the one hand, where indirect measures targeted at other policy fields improves the conditions for RE. On the other hand, because there are so many links with other policy fields, an overview is commonly lacking, and the number of stakeholders is also very large. Energy policy sets a large part of the context in which the renewable energy market operates. A very important influence on the demand for renewable energy, is the price difference with energy from conventional sources. Positive impacts of energy policy on the renewable energy market are related to energy efficiency and energy price regulation. Taxation of energy consumption are an important source of government tax income, and also serve to stimulate energy efficiency. As discussed above, when energy from renewable sources is exempted from such taxes, this forms a price incentive on green electricity. On the other hand, ‘conventional’ energy policy also creates disturbances in the market for renewable energy. Although the conventional energy market is commonly perceived to be a commercial market, the supply and consumption of (energy from) fossil fuels and nuclear energy is strongly influenced by policies and policy framework Coherence of policies is lacking where subsidies on fossil fuels and nuclear energy co-exist with stimulation of energy efficiency measures and renewable energy. On the supply side, the production of fossil fuels and nuclear energy is heavily subsided. Coal production received €6300 million in 2001 within the EU, while nuclear technology has received an average of € 2200 million per year in the period 1974-1998, mainly for power plant construction (EC, 2002). These subsidies make competition of renewable energy more difficult. A second field with which renewable energy has a strong link is that of environmental policy. Renewable energy has especially profited from policy for environmental protection and energy efficiency. A strong example of this is the use of biomass for energy - which has become much more attractive since the conditions for landfill or disposal of biomass waste on land have become stricter. A second example is the building standard in the Netherlands, where the Energy Performance Coefficient (EPC) is used as an indicator for the energy quality of new buildings. The standards set by the EPC have become so tight that a number of renewable energy technologies (such as solar thermal collectors) are cost effective in meeting the standards.
3.4.3 Voluntary approaches In several European countries (e.g. The Netherlands, UK, Germany) green electricity is available to customers on a voluntary basis. The customers of this green electricity are prepared to pay a premium on their electricity price (in The Netherlands, due to the fiscal system, there is no or only a small price difference). Their utility guarantees that the same amount of electricity for which they pay a premium price has been produced at a renewable basis. This is monitored by an independent organisation, often NGOs such as the World Wildlife Fund. Green electricity pricing is a voluntary market initiative of the electricity sector. Private individuals can also contribute to renewable energy development by financing investments. Within the private sector, several means have been developed to stimulate investment in renewable electricity, such as green funds or shareholder programmes. Marketing aspects of renewable energy are discussed in Paragraph 4.1.
3.4.4 Public awareness and attitude The success of any of the range of policy instruments depends on how the community picks them up and uses them. Policy makers do not always take sufficiently into account the context
ECN-C--03-029 33
into which the policies need to function, and that the main barriers to policy realisation are often in this area. Awareness and attitude play a role in two stages-firstly of the benefits of renewable energy, and secondly of the instruments used to promote this. Public awareness and attitude towards renewable energy are of essential importance for the implementation of policy measures. Awareness and promotion campaigns, increasing access to information, and education can help build a positive policy environment. Although the general attitude towards renewable energy may be positive, the sector does still suffer from the NIMBY syndrome. Especially the installation of wind turbines has had much opposition from parties for landscape protection or individuals with concerns about noise. It has been proved that appreciation of the benefits of wind turbines is higher, and the perception of negative impacts is decreased when people are more closely involved. Involvement of stakeholders, local inhabitants or groups is essential where decisions to implement a technology are influenced locally or where a project relies on local participation. An example of structural involvement of stakeholders is Denmark, where stimulation of co-operative formation for wind energy in the 1980s has lead to a large community level participation in wind energy, so that local inhabitants profited from wind parks in their surroundings. In Switzerland, Suisseole involves NGO’s in the field of environment and landscape during the development of wind projects. Apart from a general environmental awareness, and specific awareness of benefits of renewable energy technologies, the awareness of the choices that the market can make is essential for the uptake of policies. Especially for voluntary approaches, awareness of the instruments available, and trust in the mechanisms is essential. Transparency of the market is an essential step towards the growth of a competitive position of renewable energy on the energy market.
ECN-C--03-029 34
4. NEW MARKET DRIVERS
4.1 Marketing strategies for electricity from renewable sources In this chapter voluntary market driven approaches will be discussed, where customers pay a higher price for electricity from renewable sources. This also includes the case where governments stimulate the voluntary approaches e.g. through fiscal measures such as tax reduction or subsidies, reducing the financial barriers. Electricity from renewables has been offered as a product to customers since 1995, first in the Netherlands and later on also in other European countries (e.g. Finland, Sweden, UK, and Germany). The next paragraph will deal with the role of marketing in increasing the share of green power sold to the customers. First the groups will be determined which can be targeted to sell green power to, and what properties and motives distinguish these groups. Secondly the marketing strategies from suppliers will be examined. After that we will look further into the role marketing can play on the demand for green generating technologies and finally if the demand side approach will lead to a better chance for certain technologies.
4.1.1 Customers of green electricity The customers of green electricity can roughly be divided into two segments: the retail customers (business-to-consumer) and the wholesale customers (business-to-business) 7. First of all the retail customers. For the retail market, both rational motives and the so-called ‘intangibles’ play a role in consumption decisions. Therefore retail customers are generally susceptible to marketing. In most countries the voluntary market for renewable energy is a niche market. This means it is a small market segment for a specified group of customers. A survey in the USA pointed out five segments based on their environmental engagement (Wüstenhagen, 2000). Firstly the customers who are highly motivated and well informed about environmental matters. The opposites of this subgroup are those people who are not interested in the environment. The rest of the retail customers float in between these opposites and can be mobilised for the environmental cause. Reasons why members of this group may choose green electricity are: value for money (lower prices for the service package), convenience (these customers may be willing to pay a price premium), or dissatisfaction with current services. One of the key questions is whether customers are willing to pay a price premium for energy from renewable sources. Although voluntary premiums do not make up a significant part of the current market for renewable energy, the results from various surveys in the US, the UK, Germany and the Netherlands indicate that retail customers show an average willingness to pay a significant premium (Nyfer, 1999). Barriers to converting such a basic willingness to pay into concrete consumption of renewable energy at premium prices have been identified as follows: 1. a lack of faith in the system, 2. immobility of the consumers, 3. free riding. 1. To help overcome the distrust customers might have in their utilities green credentials,
marketing can play a significant role: branding (create a strong brand) and alliances with green brands like Greenpeace and the World Wildlife Fund may help overcome their lack of faith. A well-established green labelling system could also support the marketing campaign
7 This paragraph is based on (Byrnes, 1999; Diesendorf, 1996; Wüstenhagen, 2000).

ECN-C--03-029 35
for green power. It will help to build trust with consumers. The current abundance of labels in a small market leads to confusion rather than transparency, and decreases faith in the system.
2. As to the second barrier, immobility, it can be stated that the product should require little sacrifice from the average consumer. Especially the effort needed to switch should be minimal. Additionally the premium should not be prohibitive and reliability and service quality should be assured (Bloemers, 2001). Lower prices also failed to entice consumers indicating that it’s not a simple matter of price. Electricity retailers need to understand the preferences of their potential customers to create value. There are different segments, green power being one of them, but also striking differences between nations where customers in Germany were more willing to pay a green premium compared to Spain and the UK where the ‘pain free’ offering was more popular. Also discount offerings proved to be more appealing to German and Spanish customers because in the UK customers mistrust cost savings and fear poor services. And in Spain for example customers like the ‘safety offering’ that had no appeal in Germany and the UK (Kalkman, 2002).
3. Free riders profit from the actions of others without having to contribute. Creating personal
benefits, for example by handing out WNF calendars or coupons for green shops can counter the free riding. Visibility is an excellent way to counter free riding because people can show they’re contributing.
The latter argument leads us to the wholesale market. Compared to the retail market, the business-to-business segment is a more rational market. Therefore visibility can be an enormous drive to engage in an environmental friendly power deal. One could imagine that if a company endeavours an image of corporate responsibility, green power labels could make them trustworthy to their customers. A label could furthermore enable retail customers to extend their influence beyond their own consumption. In America the introduction of a green-e-logo was very successful and in the Netherlands there are many companies (for example Shell, Natuurbest zuivel and several zoos), who use green power to support the company image. Also companies who want to present themselves as ethical enterprises will want to use a green power buy as a signal to their stakeholders. The introduction of a label could stimulate this kind of behaviour. The most sensitive group of companies in this regard are those who have a distinct public image. This group usually delivers their products and services directly to consumers. Especially those who want to radiate a progressive or feel-good image (like the Body Shop). If the companies in a branch reach a critical mass it could be that competing companies can no longer afford to NOT buy green power. A marketing strategy targeting that is may gain momentum in the future is selling renewable energy as part of a product or service in an integrated product policy. Such integrated product policies currently take many environmental impacts of the product into account, but not the energy needed to produce the product, or to deliver the service. Summarising, the following marketing strategies will accelerate the market for renewable energy through voluntary markets: • Create a strong brand combined with appealing communication that supports the positioning, • Transparency and trustworthiness (e.g. through alliances with environmental organisations), • A price premium that is not prohibitive, • Assuring reliability and quality of service, • Sell renewable electricity not as energy only, but as a service, • Continuous innovation (for example in the field of convenience) to meet the needs of the
segments for which the environment may not be sufficient argument.

36 ECN-C--03-029
4.1.2 Suppliers of electricity from renewable sources The suppliers of green electricity can be roughly divided into incumbents and new entrants. These new entrants have a huge advantage where it concerns their positioning. Often they do not have anything else but green power on offer so their corporate image is very clear. Incumbents generally have a backlog compared to new entrants, because the core business (fossil fuels or nuclear) is commonly associated with a negative environmental image. Not many incumbents have chosen to set up a separate spin out company for the renewables activities, though, because offering green energy boosts the corporate image, and many customers of ‘grey’ energy also appreciate it if their supplier supports renewable energy. The incumbents have the advantage that they know their customers, they are percieved to be trustworthy and they can organise a switch to green at minimum effort for the customer. Recent data shows that a significant part of the 680.000 customers in the Netherlands who opted for green (October 2001) stayed loyal to their utility. On the basis of these figures the conclusions might be drawn that incumbents benefit the most from the market the new entrants have helped to make.
4.1.3 Influence of marketing on the renewable energy market Generally speaking green energy is a way for utilities, retailers and companies to enhance their corporate image. This trend is undeniable and as a result the demand for renewable generating technology will increase. Labels and marketing in general are important to create transparency in the renewable energy market and to guide and stimulate the consumer to pay for the added values of renewable energy. When the market grows and trade increases, an international label will become increasingly important for the transparency of the market. Governments can influence the success of market driven approaches by creating a beneficial legislative and regulatory environment, or at least not prohibiting these market mechanisms to develop. Marketing can have an impact: not only on the quantity of the demand for renewable generating technology but also which technologies will prevail. When the market for renewable energy products grows more mature these customers will ‘churn’: customers choose products that fit with their identity, and the market undergoes a process of segmentation. To gain loyalty of the segments of their choice it is inevitable that retailers create strong brands. In the current situation origin and source are already ways that providers use to differentiate their product from other offers. This is more in anticipation of a more mature market on one side and on the other side incumbents try to reinforce their overall positioning. As the market is at the moment immature customers have to be won over for green power first. Segmentation of the current market would lead to niches in a niche market.
4.2 Distributed energy generation
4.2.1 What is distributed generation? The term distributed generation (DG) summarises the grid-connected or stand-alone generation of electricity using small, modular technologies close to the point of consumption (ADL, 1999). Therefore DG includes not only electricity generated from renewable sources, but also cogeneration technologies such as gas turbines or reciprocating engines, and new technologies such as fuel cells. DG can be located near end-users within an industrial area, or inside a building and in this sense DG differs fundamentally from the traditional model of centralised electricity generation and delivery. DG is emerging because of its flexibility to increase

ECN-C--03-029 37
generation capacity, its environmental benefits, and due to advancements in technology development. The prospects of DG depend to a great extent on local market regulations and infrastructures. The current liberalisation of the European electricity market is changing market conditions and thus provides both threats and opportunities for DG. This chapter will provide a short overview of the issues that influence the further penetration of DG, mainly focusing on renewables. Technical issues will not be discussed. It draws partly on results from the EU-funded Decent project, in which more than 25 DG projects in 12 different EU Member States were analysed (Joerss, 2001).
4.2.2 Characterisation of DG developers Although decentralised electricity generation in the EU consists of a large variety in technologies and regulatory frameworks, some general observations on the market actors can be made. Due to the relatively recent market introduction of most technologies, DG developers and operators are often not linked to established utilities, but work as independent power producers. Compared to other market actors, such as utilities, grid operators, fuel suppliers, and traders, these developers often have disadvantages in knowledge, experience and capacity. This can lead to a weak negotiation position when it comes to the terms and conditions of access to and use of the grid. DG operators can be confronted with market power from utilities or grid operators, in particular when the unbundling – separation between network operation and supply – has not been fully completed. Another characteristic of DG developers and operators – in spite of numerous exceptions – is that a large share of actors are prepared to accept a low profitability. Although most projects are eligible for public support schemes, payback periods may still be ten years or longer. This implies that without financial support such as investment subsidies, feed-in tariffs or production subsidies, most DG projects would not even be viable.
4.2.3 The role and regulation of network access What all DG technologies have in common, is that due to their decentralised character, they will need (to negotiate on) access to and use of the transmission and distribution networks. Even for installations operating in island-mode, access to the grid is often required as back-up power. Non-discriminatory access to the electricity market is therefore fundamental to ensure that DG can compete with other sources of electricity on an equal basis. Consequently, the provision, pricing and regulation of transmission and distribution network services is very important for the penetration of DG in the current EU electricity market. As the structure of the European electricity markets has been developed from a centralised paradigm, DG developers and operators often have to face additional barriers. More specifically, negotiating interconnection to the network, can be a lengthy process, involving issues such as the technical terms of interconnection, contractual matters including liabilities and the allocation of costs for feasibility studies, necessary grid reinforcements and line extensions. In particular the allocation of these costs can increase the costs for DG developers considerably. In some countries this is regulated, which facilitates the negotiation, but it remains important who bears the costs for a line extension or a grid upgrade. If the network is considered a public good, costs of the grid upgrade can be borne by the grid operator, and socialised among all users. Once interconnected, the next step for a DG operator is to feed in the produced electricity to the distribution grid. In a liberalised market environment the grid operators charge grid use fees to power producers. At the moment most projects still sell their power under regulated tariffs to the grid operator. However, it is anticipated that the relevance of grid use fees for DG will rise with
38 ECN-C--03-029
ongoing liberalisation and the replacement of fixed feed-in tariff schemes by green certificate schemes. Finally, it may be a barrier to DG operators to trade the produced electricity on the power market. First, when an operator is only a small player, the transaction costs may be high. Secondly, balancing production with demand is a difficult task for intermittent producers. In both cases aggregation of DG developers in co-operations may be a necessary step. When systems operators grant priority dispatch to eligible generators, the DG operator is relieved from the need to establish and maintain contacts to power customers and to balance production with demand. The placement of DG at the end-users’ site can provide several benefits to the network operator. The transmission and distribution network is used to a lesser extent, which reduces transmission and distribution losses, avoids investments in the grid, and reduces transmission congestion. In many countries, there is still a discussion on the size of these benefits and how they can be quantified and allocated.
4.2.4 Main policy developments There is no specific DG policy in any EU Member State nor at EU level. The market position of DG is particularly influenced by policies promoting or supporting renewables (and CHP), by the ongoing liberalisation of the electricity-market, and related developments such as the Florence regulatory process, which aims at harmonising transmission pricing for cross-border electricity trading. The adoption of the Directive on Promotion of Renewable Energy in October 2001 was an important milestone in renewable electricity policy. The EU targets for the penetration of renewable energy set in this Directive and the Kyoto targets for GHG emissions reductions strengthen the trend towards decentralisation. More ambitious renewable energy and GHG targets can be expected after 2010. The EU Green Paper on Security of Supply also calls for expansion of renewable energy sources. Both the ongoing regulatory changes due to liberalisation and the high dependence on financial support schemes lead to uncertainties for DG developers and operators, which can constitute important barriers to further DG development. In many EU Member States, policies concerning the regulation of the power market, the transition to a liberalised market environment and/or support schemes for DG installations are subject to intensive political discussion and frequent change. The eligibility of DG operators for support schemes or the regulatory regime may change over time, and the time horizons for active support policies are sometimes limited to a few years. Therefore banks are often reluctant to provide financing to those DG technologies that are still relatively new to the financing market.
4.2.5 Relevance for renewable energy market development The European electricity sector is currently being reshaped by liberalisation and internationalisation of electricity markets, and decentralisation of electricity technologies and services. Distributed and centralised generation are complementary, and therefore the system should not bias one of these. Distributed generation can only compete with centralised generation on a level playing field if the market rules, terms of access to the grid, operational standards and network regulations are neutral to centralised and distributed generation. The current market structure and liberalisation trajectory, however, are skewed in favour of centralised generation. This raises the cost of electricity from decentralised generation. The regulatory changes due to the liberalisation process provide an opportunity for creating a level playing field for centralised and decentralised generation and will therefore be crucial to the development of the future market for renewable energy.

ECN-C--03-029 39
4.3 The impact of the EC Directive on the promotion of Renewable Electricity
4.3.1 What is the EC Directive about? In October 2001, the European Parliament and the council of the European Union adopted Directive 2001/77/EC on the promotion of electricity produced from renewable energy sources in the internal electricity market8. This directive sets the framework for renewable electricity policy in the Member States for the next decade. One of the most essential features of the EC Directive on the promotion of electricity produced from renewable energy is the setting of indicative targets for the fixing of national indicative targets for electricity produced from renewable energy sources (‘RES-E’). In addition the directive leaves open the possibility of setting binding targets if the non-binding approach does not yield satisfactory results. The table below shows the indicative targets as given in the EC Directive.
Table 4.1 EC Directive indicative targets RES-E TWh 1997 RES-E% 1997 RES-E% 20109 Belgium 0.86 1.1 6.0 Denmark 3.21 8.7 29.0 Germany 24.91 4.5 12.5 Greece 3.94 8.6 20.1 Spain 37.15 19.9 29.4 France 66.00 15.0 21.0 Ireland 0.84 3.6 13.2 Italy 46.46 16.0 25.0 Luxembourg 0.14 2.1 5.7 Netherlands 3.45 3.5 9.0 Austria 39.05 70.0 78.1 Portugal 14.30 38.5 39.0 Finland 19.03 24.7 31.5 Sweden 72.03 49.1 60.0 United Kingdom 7.04 1.7 10.0 Community 338.41 13.9% 22% The definition of renewable electricity is rather broad, including the biodegradable part of waste incineration. Some countries may however apply a more narrow definition, introducing a potential problem in creating an EU-wide harmonised market. Governments are allowed to continue their own support scheme for at least 7 years. This is (in principle) shorter than the transition period proposed by Germany, France and Spain with a view to shielding their respective support schemes based on feed-in tariffs. On the other hand, these countries succeeded in preventing the immediate introduction of a cost-effective Community-wide approach, which would be more consistent with the goal to create a common
8 This paragraph is based on (EC, 2001) and (Voogt, 2001). 9 The percentage contributions of RES-E in 1997 and 2010 are based on the national production of RES-E divided
by the gross national electricity consumption. In the case of internal trade of RES-E (with recognised certification or origin registered) the calculation of these percentages will influence 2010 figures by Member State but not the Community total.
40 ECN-C--03-029
internal electricity market: Member States are obliged to issue guarantees of origin10, but not to introduce a green certificate trading system. The commission is to monitor the situation and present a report on experience gained with the application of national schemes. ‘If necessary, the commission should, in the light of the conclusions of this report, make a proposal for a Community framework with regard to support schemes for electricity produced from renewable energy sources’. Another feature is that better access is to be provided to electricity distribution networks, including streamlining and expediting procedures at the appropriate administrative level. What are commitments to monitoring and can EU place sanctions? The connection costs of new producers should be objective, transparent and non-discriminatory and due account should be taken of the benefit embedded generators bring to the grid. To the extent that reliability and safety of the grid system and associated guarantees are affected, financial compensation may be included.
4.3.2 Impact of the Directive Given the Member States different views the Directive can be regarded as the best possible compromise that could be reached. It still does not tackle the fundamental differences in approach that the different countries prefer. Essentially it leaves the discussion open on whether to stimulate the supply (feed-in tariffs) or the demand (obligations on supply, or financial incentives to increase demand) of renewable electricity. Its big merit is putting renewable energy in an irreversible way on the national agendas and enforcing Member States governments to put their national policies in a European perspective. The Directive leads to a growing awareness of being part of a European market. As the Directive is providing a framework and guidelines it must be seen as a facilitating measure to reach a harmonised European market for renewable energy. On the short term this will not result in additional capacity or an acceleration of the implementation of renewable energy. On the longer term however, a harmonised market will certainly lead to an accelerated implementation of renewable energy in a cost-effective way. The Directive is not making any technology choices. No renewable energy options are excluded and no options are privileged. From October 2003 Guarantees of Origin must be given for all electricity produced by renewable sources. It is not stated that these guarantees will be tradable, or that they need to be accepted by other EU countries. However, the existence of uniform Guarantees of Origin will provide an extra argument against national ‘protectionist’ measures. This may cause large trade volumes between countries with large differences in support measures for RE, especially between countries with an obligation and countries without an obligation. The current lack of coherence between support systems in different countries is therefore causing market distortions that the EC Directive does not remove. The Directive may even amplify the negative effects of this lack of coherence. The main conclusion is that national policies will prevail in the coming years but the directive will prove to be essential in setting the rules according to which the future game has to be played and therefore it substantially contributes to accelerating the renewable energy market on the longer term.
10 A guarantee of origin shall specify the energy source from which the electricity was produced and specify the date
and place of production.
ECN-C--03-029 41
4.4 The impact of liberalisation and harmonisation of electricity markets Liberalisation of the energy market offers chances but also increases risks for implementation of renewable energy technologies. While on the one hand, independent power producers (often green power producers) are given a chance, on the other hand liberalisation of the energy market is often pointed out as a development that might frustrate green power on its way to maturity. One of the commonly assumed effects of liberalisation is that by introducing competition the prices will fall, making it harder for green generators to compete. Investments in energy generating capacity will also be influenced by liberalisation of energy production. Without environmental regulations in place, competition will lead to a development away from renewables and towards fossil fuels, wherever gas-fired power stations are the most economically attractive option for the development of new capacity. (Metz 2001) Liberalisation may also lead to a focus on short-term benefits, making it more difficult for renewable energy technologies with a long payback time to compete. Therefore it is necessary to make a distinction between the regular electricity market and the market for green electricity. This green electricity market may also be liberalised in order to introduce the advantages of liberalisation in the green electricity market. One of the main concerns in European renewable electricity policy is to create a fully harmonised and liberalised market for renewable electricity. Such a market would lead to lower costs for realising the national targets. One of the main barriers however, is formed by the different national policy schemes, which are preventing a level playing field for international trade. An interesting example is the Dutch situation. The Netherlands is the only European Member State that stimulates the demand for renewable electricity by means of fiscal measures. Also imported electricity from renewable resources can make use of these fiscal advantages. A relative high support (as is the present situation) would lead to large quantities of imported renewable electricity, as it is more attractive for foreign producers to sell to a Dutch party, rather than to sell it on the national market. A relative low support however could lead to export of renewable electricity from the Netherlands to countries that are willing to pay a higher price. As this relative height not only depends on the own support level, but also on the level of support in other countries, it is difficult for the national government to decide on the absolute height of the support level for the longer term. Every change in a national incentive scheme would immediately lead to changes in import and export between countries and subsequently to a large uncertainty in the realisation of national targets. This, on its turn would lead to the need for other Member States to adapt their incentive schemes, thus starting the whole process again. Apart from the fact that most EU Member States do not facilitate import and export of renewable electricity at all, this example shows that still many barriers need to be overcome in order to create a future level playing field. To improve this situation national policies need to be harmonised. The introduction of a guarantee of origin is only a very first step. If Member States continue to stick to their national incentive schemes, this might turn out to be the main bottleneck for an accelerated implementation of renewable electricity. As stated before, the main aim of the EC Directive is the establishment of a harmonised renewable energy market in order to facilitate the realisation of the EU targets on renewable energy. But what would be the characteristics of such a market? In the REBUS research project, co-ordinated by ECN, some main characteristics of a harmonised EU-wide renewable energy market have been analysed.
42 ECN-C--03-029
4.5 Flexible mechanisms
4.5.1 Introduction The Kyoto Protocol incorporates several distinct mechanisms providing enough flexibility to subscribed nations to comply with their GHG emissions reduction within the agreed period 2008-2012. These mechanisms have been introduced in order to reduce the abatement costs of the Annex I countries (industrial countries) as well as to encourage the sustainable development of non-Annex I countries (developing countries) by means of technology transfers and institutional capacity building. The instruments described below, if coherently implemented and coupled with credible international institutions, may provide enough integrity to the market as to succeed in attaining the end goal of the United Nations Framework Convention on Climate Change (UNFCCC).
4.5.2 Joint Implementation and Clean Development Mechanism Joint Implementation (JI) refers to the opportunity of an Annex I country to meet (part of) its Kyoto commitment through investments in GHG abatement projects in another Annex I country. Such investments result in the generation of so-called ‘credits’ or ‘Emission Reduction Units’ (ERUs). Depending on the agreements made on ‘credit-sharing’ between the parties involved, these ERUs are fully or partially added to the amount of assigned GHG emissions of the investing country, while they are subtracted from the assigned amount of the host country. The amount of credits generated is usually an estimate of the emission reductions achieved by a JI project relative to a ‘baseline’ situation. The latter refers to the estimated level of GHG emissions that would occur without the JI project. JI projects will start generating credits in 2008, although the projects themselves may begin earlier. Definite crediting of ERUs will only occur after annual reporting requirements and other obligations have been met (Art. 6 of the Kyoto Protocol). In order to gain experience with emission abatement projects abroad, several countries have participated over the past years in a test phase of such projects called ‘Activities Implemented Jointly’ (Van Harmelen et al., 1997; OECD, 1999). The Clean Development Mechanism (CDM) is defined in Article 12 of the Kyoto Protocol. Its main objectives are a) to encourage the sustainable development of non-Annex I countries by means of institutional capacity building and technology transfers, and b) to enable Annex I countries to meet part of their Kyoto commitments cost-effectively by means of abatement projects in non-Annex I countries. This instrument was adopted rather unexpectedly at Kyoto since it had not been part of any formal proposal during the 30-month negotiation period prior to the conference. CDM is still very much under development and will be subject to the authority and guidance of the CoP, which has the responsibility to ‘elaborate modalities and procedures to ensure transparency, efficiency and accountability through independent auditing and verification of project activities’. CDM has much in common with JI as both mechanisms enable Annex I countries to meet (part of) their Kyoto targets by means of cross-border investments in GHG abatement projects. The most important difference, however, is that the host countries of JI are Annex I countries, whereas those of CDM projects are non-Annex I countries (i.e. mainly non-industrialised countries which are not committed to reduce their GHG emissions). Another difference is that JI credits can be accrued from 2008, whereas CDM credits can be earned much earlier, i.e. already from 2000. CDM credits generated before 2008 can be banked in order to use them during the first budget period 2008-2012. This provides CDM projects a significant advantage compared to JI projects as if may have a substantial impact on the average costs of CDM versus JI credits.

ECN-C--03-029 43
4.5.3 Carbon emissions trading Within the context of the Kyoto Protocol, Emissions Trading (ET) refers to the ability of Annex I countries to exchange part of their emission commitment and, hence, to redistribute in effect the division of allowed emissions between them (Grubb et al., 1999). In contrast to Joint Implementation and the Clean Development Mechanism, ET is not a project related instrument but rather a facilitating mechanism to enhance market efficiency with regard to reducing GHG emissions. Those countries – or companies – that can more cheaply or easily reduce emissions should be able to sell these abatements to those which face higher costs in meeting emission reductions. In fact, an optimal system of ET minimises overall abatement costs by ensuring that emission reductions take place where marginal costs are lowest. In the Kyoto Protocol, Emissions Trading is treated briefly in Art. 17. It mainly urges the Conference of the Parties (CoP) to define ‘the relevant principles, modalities, rules and guidelines, in particular for verification, reporting and accountability for Emissions Trading’. In addition, it states that ET ‘shall be supplemental to domestic actions’. Hence, the unresolved issue of defining supplementary is also relevant here. In October 2001, the European Commission adopted a proposal for a directive establishing a framework for greenhouse gas emissions trading within the European Community in order to meet its Kyoto obligations in an efficient way. Member States will grant a greenhouse gas permit that sets an obligation to specified installations or sites. Moreover, they allocate allowances, which can be traded between companies. In the preliminary phase 2005-2007 the objective is to gain experience with emissions trading. In this period allowances should be allocated for free and a lower common level of penalty for non-compliance applies.
4.5.4 Impact of the flexible mechanisms on renewable energy implementation Compared with other GHG mitigation strategies most renewable energy sources are and will not be economically efficient at all. Strategies like increasing energy efficiency, switching from coal to gas, and co-generation are much cheaper. If renewable energy sources would have to compete with these strategies only on base of costs for avoided GHG emission they will not be applied in the near future. On the contrary, it would give a strong disincentive to new investment in renewable energy sources and possibly also give disincentives on some of the existing renewable energy installations. However, renewable energy technologies also have other values next to avoiding CO2 emissions. Decentralised generation, security of supply and local employment impacts play a role in decision making. For small off-grid systems, renewable energy systems are often more cost-effective than those based on fossil fuels. The entrance of this type of systems under the CDM is a subject of discussion under the topic ‘small projects’, but it seems likely that small renewable energy systems will be awarded carbon credits under CDM. Although the main reason to opt for the Renewable Technology may not be CO2 emission reduction, the CDM can contribute to the implementation of the technologies. The ‘ERU’ financing will make more projects financially feasible. In quantitative terms, little is known about the effect of the Kyoto flexible mechanisms on renewable energy deployment. Usually, the order of the perspective is reverse, i.e. how much should or do renewable energy technologies contribute to greenhouse gas emission reduction? In several studies this has been quantified for individual countries and for the EU (e.g. Hendriks et al., 2001). However, in this type of studies it is often unclear if the contribution of renewable energy technologies to greenhouse gas emission reduction is calculated given existing support for renewable energy or without any support. If, for example, the renewable energy targets in the RES-E directive are taken as a minimum, it can be expected that the resulting carbon emissions price is higher than in the case where there is no prerequisite on RES-E levels.
44 ECN-C--03-029
4.5.5 Green certificates and flexible mechanisms Whereas green certificates represent ‘qualities’ of electricity such as avoided GHG emissions, avoided acid rain, security of supply or local employment impacts, the flexible mechanisms only deal with GHG emission reduction equivalents. It is therefore not straightforward what the implications are when both green certificates and ERUs are traded on an international market. International trade in green certificates may contribute to more efficiency in GHG mitigation, and so have a positive effect on the global level: fighting climate change. However, with regard to the national and local goals of renewable energy deployment (such as counter acid rain, stimulate decentralised generation, security of supply or local employment impacts) it may be counter-productive. This leads to the conclusion that the main (or even only) driving force for international trade in green certificates is the capability of renewable energy sources to reduce GHG emissions. Immediately, two basic problems emerge. First, renewable electricity production is currently not the most cost-effective way of reducing GHG emissions. Second, renewable electricity production generates GHG ‘credits’ while trading in part deals with ‘allowances’. Power producers with an assigned CO2 cap (through grandfathering, i.e. allocating credits or allowances free of charge) can build up their own capacity for renewable electricity generation in order to replace some fossil generation. This would raise its surplus of allowances, which could be traded. The revenues can be used for financing the renewable production capacity. However, any new independent power producer does not receive assigned CO2 allowances, i.e. building up renewable electricity generation capacity would create extra allowances, although they would not have access to the emissions trading market. Only participants in the emissions trading scheme could apply renewable electricity production in their GHG mitigation strategy. This example illustrates the key question: is the carbon credit incorporated in the green certificate? A system of green certificates has been implemented in the Netherlands, however there is no CO2 emissions trading scheme as yet, although the latter is likely to play a role in the future. In the current situation it is unclear whether the CO2 reduction related to renewable energy production, is accounted for in the green certificates issued. For the price-making of green certificates on the market it is however of great importance, since it should be clear what you are buying and selling. When the electricity supplier buys a green certificate from the producer at a low price, suggesting that the CO2 credit is not involved, and subsequently sells green electricity to the consumer at a high price, using CO2 reduction as a marketing motif, the consumer is deceived and the supplier profits, while the producer is not properly rewarded. In order to establish a transparent market in green certificates, it is important to know what is exactly traded. Are you also buying the implicit CO2 reduction with the green certificate? How can you be sure you are not paying for CO2 reduction already established and paid for? How can we prevent that the CO2 reduction realised is twice accounted for meeting the target? In the currently implemented Dutch green certificate scheme, there is no reference made to potential carbon. Moreover, there is no reference made to green certificates in the Dutch proposals for emissions trading. Therefore, we may conclude that green certificates and CO2 credits or permits are regarded as completely separated issues, i.e. that both instruments serve their specific targets and that the carbon credit is not included in the green certificate. In a sense, this is quite convenient since problems related to determining the carbon content of a certificate are then avoided. The criteria for import of green certificates effective in 2002 may give further indications of the CO2 status of green certificates. First, the foreign renewable energy can only be issued with Dutch green certificates if it has not been subsidised before. Since one may argue that the renewable energy projects awarded in the EruPT (a JI programme) tender are already subsidised (by the Dutch government), it is reasonable to conclude that the renewable energy produced by

ECN-C--03-029 45
these projects and imported to the Netherlands will not receive green certificates. This is however a hypothetical example because electricity from EruPT projects does not fulfil the reciprocity condition for import of renewable energy. This conclusion would definitely hold if the green certificates represent also the CO2 credit of renewable energy production. However, if the green certificate only intends to represent the other advantages of renewable energy (the non-CO2 values), the imported electricity could be eligible for green certificates. After all, the EruPT subsidy then only concerns the pure CO2 equivalents. Second, the Minister also indicated that for the issuing of green certificates to foreign renewable energy, reservation of import capacity is necessary. This suggests that green certificates will only be issued for renewable energy production abroad when its equivalent of physical electricity is also imported. As long as this is indeed the case there is not a real problem with the carbon balance of the country, since the imported renewable energy substitutes domestic consumption and contributes to the CO2 reduction in the Netherlands. It means that this reduction is linked to the physical electricity flow and not to the certificate, i.e. the green certificate does not include the carbon credit. When taking the Dutch trading schemes for green certificates and for carbon into consideration, the conclusion is that, for the delivery of renewable energy to consumers, the energy supplier needs no CO2 permits. Consequently, the systems imply a complete separation of green certificates and CO2 markets. This means that the costs of CO2 reduction will be reflected in the spot price of electricity and that the price of green certificates only reflects the additional cost of renewable energy development (Morthorst, 2001). However, we are now in a transition period where the green certificate scheme is already implemented in the Netherlands, while the carbon trading scheme is not (and will not be until at least a couple of years). In this transition period the certificate value might include the CO2 reduction value. Although the buyer of the certificate, e.g. the electricity supply company, cannot use the CO2 credit of a green certificate since there is no obligation or permit system for CO2 as yet, he has the opportunity to ‘sell’ the CO2 credit to the renewable energy consumer. In that case, the renewable energy consumer pays more than is actually necessary. It is important that stakeholders in the market for green certificates agree on what they are trading.
4.5.6 Outlook This brief overview suggests that renewable energy cannot rely solely on the flexible mechanisms of the Kyoto Protocol. Renewable energy sources cannot compete with other carbon emission reduction strategies within an emissions trading environment. JI and CDM can help develop renewable energy projects, but will not suffice to reach overall renewable energy targets. In order to stimulate new investment in renewable energy sources, other policy instruments directed specifically to renewable energy should be applied. Therefore in the short and medium term, when climate change policies such as the flexible mechanisms are implemented, specific renewable energy policies remain necessary. Green certificate trading is likely to become an important renewable energy policy instrument in the near future. Whenever targets for renewable energy and CO2 reduction and instruments of green certificates and CO2 emissions trading are combined, two separate markets with two individual targets will co-exist in a number of countries. In that case it is essential to clarify whether green certificates incorporate the carbon value of the renewable energy source it represents. When the carbon credit is included in the green certificate, problems arise with respect to determining the carbon value (how much CO2 reduction is equivalent with the kWh of the green certificate?). However, it would likely induce an international market for green certificates. If the carbon credit is not included in the green certificate, indeed two separate markets (one for carbon and one for green certificates) exist. Since the remaining non-CO2 values are mainly of local or regional importance, there will hardly be an international market for green certificates in that case.
46 ECN-C--03-029
5. SYNTHESIS
The main conclusion on reviewing the policy instruments is that there is no one best policy instrument to stimulate all renewable energy technologies for all different technologies in time and for all local circumstances. Policy instruments need to be adapted to the state of technology development and market and policy framework. A synthesis of knowledge on technology developments, policy developments in the energy market and effects of national and international policy development, both on renewable energy and on related fields is necessary to design appropriate policies. This chapter makes a first step in the synthesis of policy analysis and new market developments for renewable energy. The final synthesis of the findings and analysis of the REMAC 2000 project is presented in the REMAC roadmap.11 From the reviews and analysis in Chapters 2 and 3 we conclude that a set of different policy instruments is necessary to reach policy objectives in an acceptable manner. The choice for certain policy instruments has to take into account the development stage and other characteristics of the technology, actors and structure of the (renewable) energy market, the availability of budgets, and the policy context. The choice also depends largely on the drivers behind renewable energy. The political priority given to certain drivers will lead to a focus on certain criteria. REMAC 2000 aims to promote a sustainable growth of the renewable energy market. For such a sustainable growth, important success factors are not only effectiveness of policy which can have an instantaneous but short-lived effect, but also security for investors, which is essential for building up a sector and developing the renewable energy market. Security for investors, given the transitional nature of financial support to the renewable energy sector, must be defined at an appropriate level for each technology and adapted over time. An appropriate level of security does not necessarily cover all technical and market risks for market players. Direct support for the renewable energy sector should be designed to stimulate the market to develop and mature. However, policy risks should minimised. A crucial factor to effective policy implementation is consistency of regulations and policies at different levels and between policy fields. We have seen that renewable energy is related to many different policy fields, and is strongly impacted by indirect policies. For the implementation of actual installations, the sector is dependent on a range of departments and levels of authority that may apply different policies and regulations with different objectives. Coherence and continuity are essential to stimulate renewable energy investments. The renewable energy sector itself is another important actor to stimulate coherence and continuity of policy. The presence of strong stakeholders in a certain country influences the success of policy implementation. Groups with linked or opposed interests, and of course the consumer or the citizen are actors influencing the success of policies. Although a strong public awareness is essential for setting political priorities, the only instrument that can provide some guarantee for continuity of support at national level even if political context changes, is the International Treaty or Agreement. Security for investors not only requires a reliable and consistent national framework, but a stable international market. Chapter 4 shows that the international dimension of policies and market regulations is becoming ever more important. Two main developments lead to a growing need for international coherence. Firstly, the energy market is becoming increasingly an international market, increasing the need for transparent international trade conditions, and
11 www.renewable-energie-policy.info/remac

ECN-C--03-029 47
compatible markets. Secondly, the developments of technology and markets are gradually leading to an increased use of more market conform policy instruments. The development towards the use of regulatory measures to stimulate renewable energy decreases the possibility of governments to steer the market, and increases the role of private parties and trade. Cost effectiveness will receive a stronger focus, leading to a stronger orientation on an international market. Large differences between markets will cause unstable trade patterns and thereby form a major risk for investors. Therefore national governments need to re-evaluate their main drivers for renewable energy in an international perspective. Although the liberalisation of the energy market does offer opportunities for renewable energy, it may also create barriers if no specific measures are taken. Liberalisation will lead to less certainty for electricity prices- investments with higher risk and lower predictability of production may be considered less attractive. Therefore it is necessary to make a distinction between the regular electricity market and the market for green electricity. This green electricity market may also be liberalised in order to introduce the advantages of liberalisation in the green electricity market. Another effect of ongoing liberalisation and privatisation processes in the electricity sector is that marketing is gaining in importance. Many companies selling (renewable) energy do not have much experience with marketing strategies and do not have sufficient capacity in this field. In order to reach both the retail and wholesale market, branding and marketing must receive increased attention. One possible marketing strategy is to sell renewable electricity not as energy only, but as a service. The current sales of electricity from renewable energy sources through voluntary markets still depend heavily on additional financial support. Voluntary markets for electricity from renewable sources are expected to gain momentum as the renewable energy sector develops into a mature market. On the road towards such a mature market, the impacts of policies can be improved if the above mentioned synthesis is taken into account. To guarantee a sustainable growth of the renewable energy sector, a broad perspective of policy makers and planners is required- to include a long timeframe, a comprehensive view of related policy fields and authorities involved, and an orientation that looks beyond national borders.
48
REFERENCES
ADL (1999): Distributed Generation: Policy Framework for Regulators.
Bloemers, R., F. Magnani, and M. Peters (2001): Paying a green premium. McKinsey Quarterly nr.3.
Boots, M.G., G.J. Schaeffer, C. de Zoeten, et al. (2000): The role of an integrated tradable green certificate system in a liberalising market, INTRACERT: INCEPTION REPORT. ECN-C--00-85, ECN.
BP-Amoco Statistics (1999): http://www.bpamoco.com/
Bräuer, W., I. Kühn (2001): RECerT Work Package 3, Cost Benefit Analysis. ZEW, July 2001
Byrnes, et al (1999): Evidence from utility green pricing programmes, Journal of environmental planning and management.
Diesendorf (1996): How can a competitive market for electricity be made compatible with the reduction of greenhouse gas emissions?. Ecological Economics.
European Commission (2001): Directive 2001/77/EC on the promotion of electricity produced from renewable energy sources in the internal electricity market.
European Commission (2002): Inventory of public aid granted to different energy sources. COM.
European Commission, Energy for the Future: Renewable Sources of Energy. White Paper for a Community Strategy and Action Plan, (COM(97)599 final).
Grubb, M., C. Vrolijk and D. Brack (1999): The Kyoto Protocol; a guide and assessment. Published by the Royal Institute of International Affairs, Energy and Environmental Programme, London.
Haas, R., N. Wohlgemuth and C. Huber (2001) ‘Financial incentives to promote renewable energy systems in European electricity markets: a survey’. Int. J. Global Energy Issues, Vol. 15, Nos. ½, pp.5-24.
Haas, R., T. Faber, J. Green, et al. (2001): Review Report on Promotion strategies for electricity from renewable energy sources in EU countries. GREEN ELECTRICITY, EU 5th Framework.
Harmelen, A.K. van, S.N.M. van Rooijen, C.J. Jepma, W. van de Gaast (1997): Joint Implementation met Midden- en Oost-Europa; Mogelijkheden en beperkingen bij de realisatie van de Nederlandse CO2 reductiedoelstelling in de periode 2000-2010. ECN-C--97-078. ECN, the Netherlands.
Hendriks, C., D. de Jager, J. de Beer, M. van Brummelen, K. Blok and M. Kerssemeeckers (2001): Economic evaluation of emission reduction of greenhouse gases in the energy supply sector in the EU; bottom-up analysis. Ecofys. http://europa.eu.int/comm/environment/enveco/climate_change/sectoral_objectives.htm
Joerss (2001): Barriers and Success Factors for Decentralised Generation in the EU – Working Paper in the DECENT project.
Kalkman, J., and M. Peters (2002): Branding electrons. McKinsey Quarterly nr. 1.
Metz, B., O. Davidson, R. Swart and J. Pan (editors) (2001); Climate change 2001, Mitigation, contribution of Working Group III to the Third Assessment Report of the Intergovernmental Panel on Climate Change. IPCC 2001.

ECN-C--03-029 49
Morthorst, P.E. (2001): Interactions of a tradable green certificate market with a tradable permits market. Energy Policy 29 (2001) 345-353.
Nyfer (1999), Een keurmerk voor groene energie. Breukelen, oktober 1999.
OECD (1999). Experience with emission baselines under the AIJ pilot phase. OECD information paper. Paris.
Stettler, J., M. Storr, G. Salmon, T. Ecces and V. Ahuha (2001): Power Generation in the 21st century. Dresdner Kleinwort Wasserstein.
Voogt, M.H., M.A. Uyterlinde, M. de Noord, K. Skytte, L.H. Nielsen, M. Leonardi, M. Whiteley and M. Chapman (2001): Renewable energy burden sharing - REBUS - Effects of burden sharing and certificate trade on the renewable electricity market in Europe, ECN-C--01-030, Petten, the Netherlands.
Wüstenhagen, R., Ökostrom – von der Nische zum Massenmarkt, Hochschulverlag AG an der ETH, Zürich, 2000.

50 ECN-C--03-029
APPENDIX A CASE STUDIES
A.1 Case study objectives and methodology The objective of the case studies is to provide insight into the experiences with different types of policy instruments. For the analysis of these experiences objective information should be gathered both on the design of the instrument and on the experiences of each instrument according to a list of objective success criteria (as discussed in the following chapter). Quantitative information has been be sought, to allow comparisons between instruments, technologies and countries. The implementation and effectuation of policies is influenced by a whole range of external factors and actors. The case studies therefore also show the context of the renewable energy support schemes, including a description of the energy market, the most important laws, and relevant external factors and indirect policies for renewable energy implementation. The analysis is based on experiences within over a certain timeframe. The context of the promotional scheme(s) should be clear within this timeframe. The period covered for the case studies is 1990-2000, with later experiences where this information was available. Five countries with experience with different promotional schemes were selected for the case studies: Germany, Italy, the Netherlands, Spain and Switzerland. For Germany and Spain, the focus is on the feed-in system. The feed-in system is also discussed for the Italian situation. The Italian case provides information on the green certificate system. For the Netherlands the case study looks into the experiences with different certificate systems, the fiscal support system, and Voluntary Agreements. In Switzerland, the Energy 2000 Action Plan has had a multi-facetted approach, including both regulatory measures and investment promotion, as well as a strong focus on awareness and stakeholder involvement. The market driven labels for PV are also interesting for the Swiss situation.
A.2 Execution of case studies The case studies are contributions by NET Ltd (Germany, Switzerland), Ecobilancio Italia, (Italy, Spain) and ECN (Netherlands). During the execution of the work it was found that information on evaluation of policy measures, and on their impact on renewable energy implementation is generally not available. For most policy measures, evaluation of the impact of the measure has not taken place, or has not been published (for general use). Information on actual experiences with implementation of policy instruments in such cases, would only be available through direct contacts with public and private decision makers. Such interviews have been carried out for the purpose of the execution of the case studies to a limited extent. Although the initial design of the case studies was aimed at a quantitative analysis, the experiences with data gathering lead to a changed priority towards a qualitative evaluation. Data availability and quality of information on monitoring and evaluation of actual experiences with different policy instruments lead to this shift in analysis focus. Issues hindering an adequate quantitative analysis are: • Quantitative information on experiences is hardly available. • Quantitative or qualitative information is generally available at an aggregated level (e.g. for
both energy efficiency and renewable energy, not specifying between different technologies).
• It is not possible to distinguish between the impacts of different measures which are valid simultaneously.

ECN-C--03-029 51
• It is not possible to perform a quantitative analysis of impacts of policy instruments on installation of renewable energy technologies. A causal relationship cannot be deducted due to the large range in project lead times, and the commonly short period of effective implementation of a policy.
The case studies however do provide valuable information for a qualitative analysis of promotional schemes. This information, and other information on experiences with policy instruments gathered within REMAC12, has been used for the analysis of policy instruments according to the list of success factors in Chapter 4.
A.3 Case study documents The following case study documents have been written for the REMAC study. The Netherlands Annemarije van Dijk, Emiel van Sambeek Italy Raffaella Bosurgi13, Claudio Casale Spain Emanuela Menichetti, Paolo Frankl Germany Giordano Favaro, Marcel Gutschner Switzerland Giordano Favaro, Marcel Gutschner These documents are available for downloading from the REMAC project website: http://www.renewable-energy-policy.info/remac
12 An overview of energy markets and policy measures, together with quantitative data on renewable energy
production is provided in REMAC WP2 (Ecobilancio Italia). 13 (ENEL, Green Power)

52
ECN
-C--0
3-02
9
APP
END
IX B
B
AC
KG
RO
UN
D IN
FOR
MA
TIO
N
B.1
Tr
ansa
ctio
n co
sts
Tabl
e B
.1
Ove
rvie
w of
the
diffe
rent
tran
sact
ion
costs
of p
olic
y in
stru
men
ts
Search costs
Approval costs
Monitoring costs
Administrative infrastructure
Negotiating cost
Development of instrument
Adjustment cost
Implementation, monitoring and enforcement
1 fis
cal m
easu
res f
or in
vest
men
t
2
fisca
l mea
sure
s for
pro
duct
ion
3 fis
cal m
easu
res f
or c
onsu
mpt
ion
4 su
bsid
ies o
n in
vest
men
t
5
com
petit
ive
bidd
ing
for s
ubsi
dy
6 su
bsid
ies o
n pr
oduc
tion:
fixe
d fe
ed-in
tarif
fs
7 su
bsid
ies o
n pr
oduc
tion:
diff
eren
tiate
d an
d de
velo
ping
feed
-in ta
riffs
8
subs
idie
s on
cons
umpt
ion
9 re
gula
tory
mea
sure
s or a
gree
men
ts fo
r inv
estm
ent
10
regu
late
d fr
amew
ork
for p
rodu
ctio
n m
arke
t: qu
ota
11
regu
late
d fr
amew
ork
for c
onsu
mpt
ion
mar
ket:
quot
a
12
re
gula
ted
fram
ewor
k fo
r con
sum
ptio
n m
arke
t: la
belli
ng o
r gre
en ta
riffs

ECN-C--03-029 53
B.2 Modeling RE trade in the European market
B.2.1 REBUS The aim of the EU co-financed REBUS (Renewable Energy Burden Sharing) project was to develop a model to analyse the effects of burden sharing and certificate trade on the renewable electricity market in Europe. A consortium of European energy research institutes has carried out the REBUS project: ECN, ESD, RISØ and SERVEN. The core of the REBUS model is a database with detailed cost/potential curves for each EU Member State (and Norway) containing costs and realisable potentials for all renewable electricity options. For the definition of ‘renewable’ the definition as given in the EC Directive on renewable electricity has been taken. The cost/potential curves have been based on the best available data sources from national and EU studies and databases. This was complemented by knowledge from several technology and renewable energy policy experts, to obtain the latest insights in potential developments for each individual technology. By adding the individual cost/potential curves of the different Member States, a cost/potential curve for the EU or for the reciprocal countries can be constructed. Knowing the overall target of the countries included in the cost/potential curve, the following information can be obtained: 1. The equilibrium price where the demand (target) meets the supply indicates the lowest costs
for reaching the total target by allowing trade between the countries (e.g. by a system of Tradable Green Certificates). This price is given by the last option needed to meet the target.
2. Insight in what renewable energy options in the different countries will most probable penetrate in order to reach the overall target against the lowest costs (all options that have a price below the equilibrium price).
3. Insight in what countries will become net importer or exporter of green electricity (or certificates).
Outcome of the REBUS project Based on the expected total consumption of electricity in the EU in 2010 (specified in the European Union Energy Outlook till 2020) and the distribution of targets as included in the EC Directive, the EU target equals 662 TWh.
EU cost/potential curve for RES-E in 2010
3456789
101112
300 400 500 600 700 800
TWh
[eur
o ct
/kW
h]
Figure B.1 Final RES-E cost curve for the EU for 2010
The costs of realising renewable electricity targets in the EU The EU curve can be used to determine the total costs of meeting the targets as proposed in the EU Draft Directive. Referring to Figure A.1, these total costs are given by the area enclosed by the fixed demand curve of 662 TWh and the EU cost potential curve. The total costs are equal to
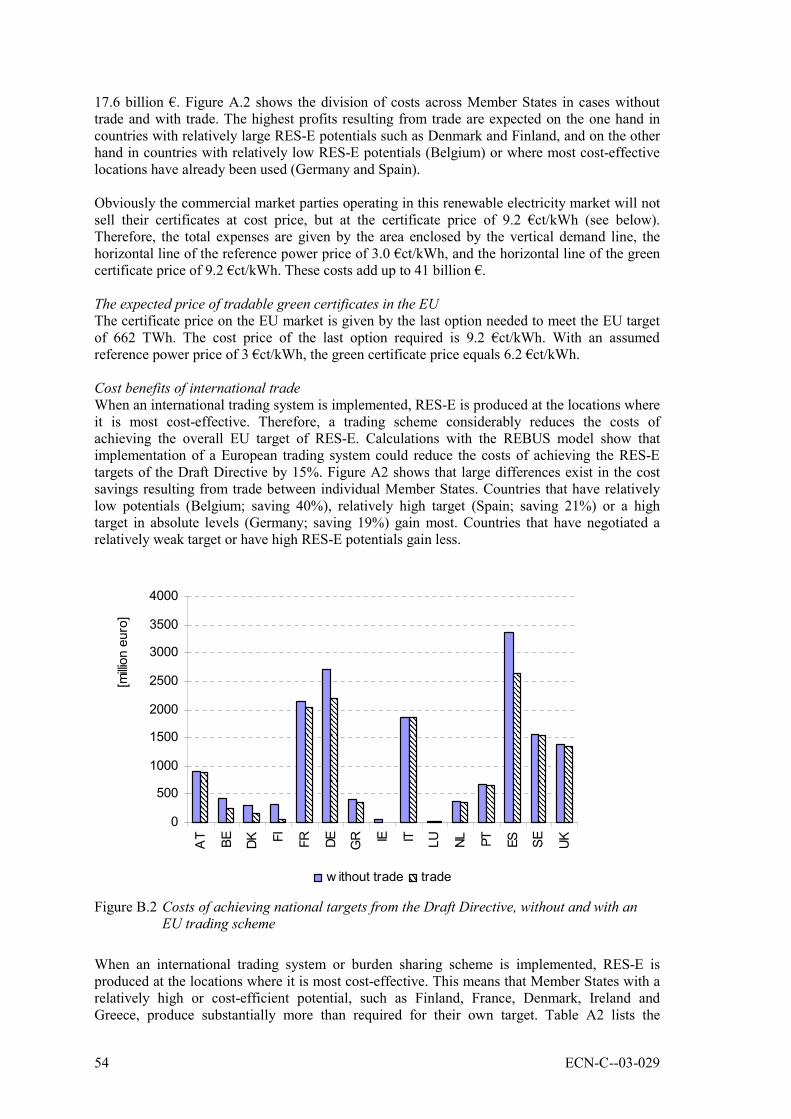
54 ECN-C--03-029
17.6 billion €. Figure A.2 shows the division of costs across Member States in cases without trade and with trade. The highest profits resulting from trade are expected on the one hand in countries with relatively large RES-E potentials such as Denmark and Finland, and on the other hand in countries with relatively low RES-E potentials (Belgium) or where most cost-effective locations have already been used (Germany and Spain). Obviously the commercial market parties operating in this renewable electricity market will not sell their certificates at cost price, but at the certificate price of 9.2 €ct/kWh (see below). Therefore, the total expenses are given by the area enclosed by the vertical demand line, the horizontal line of the reference power price of 3.0 €ct/kWh, and the horizontal line of the green certificate price of 9.2 €ct/kWh. These costs add up to 41 billion €. The expected price of tradable green certificates in the EU The certificate price on the EU market is given by the last option needed to meet the EU target of 662 TWh. The cost price of the last option required is 9.2 €ct/kWh. With an assumed reference power price of 3 €ct/kWh, the green certificate price equals 6.2 €ct/kWh. Cost benefits of international trade When an international trading system is implemented, RES-E is produced at the locations where it is most cost-effective. Therefore, a trading scheme considerably reduces the costs of achieving the overall EU target of RES-E. Calculations with the REBUS model show that implementation of a European trading system could reduce the costs of achieving the RES-E targets of the Draft Directive by 15%. Figure A2 shows that large differences exist in the cost savings resulting from trade between individual Member States. Countries that have relatively low potentials (Belgium; saving 40%), relatively high target (Spain; saving 21%) or a high target in absolute levels (Germany; saving 19%) gain most. Countries that have negotiated a relatively weak target or have high RES-E potentials gain less.
0
500
1000
1500
2000
2500
3000
3500
4000
AT BE DK FI FR DE GR IE IT LU NL PT ES SE UK
[milli
on e
uro]
w ithout trade trade
Figure B.2 Costs of achieving national targets from the Draft Directive, without and with an EU trading scheme
When an international trading system or burden sharing scheme is implemented, RES-E is produced at the locations where it is most cost-effective. This means that Member States with a relatively high or cost-efficient potential, such as Finland, France, Denmark, Ireland and Greece, produce substantially more than required for their own target. Table A2 lists the
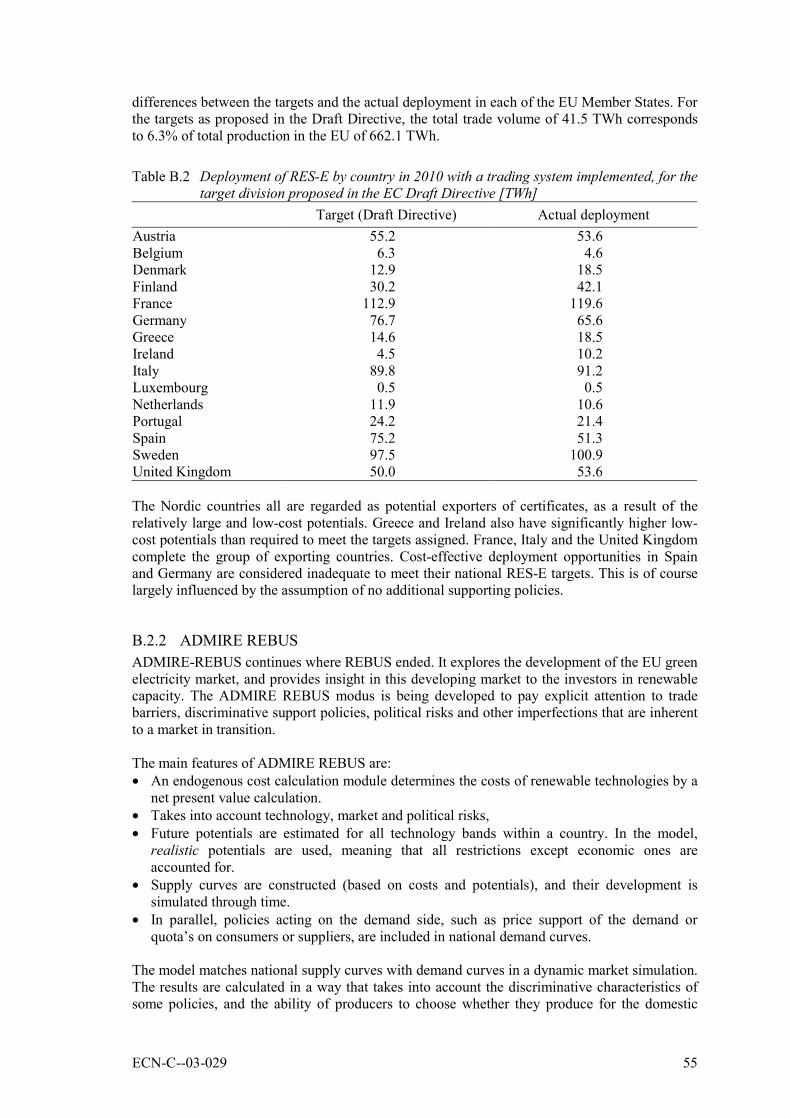
ECN-C--03-029 55
differences between the targets and the actual deployment in each of the EU Member States. For the targets as proposed in the Draft Directive, the total trade volume of 41.5 TWh corresponds to 6.3% of total production in the EU of 662.1 TWh.
Table B.2 Deployment of RES-E by country in 2010 with a trading system implemented, for the target division proposed in the EC Draft Directive [TWh]
Target (Draft Directive) Actual deployment Austria 55.2 53.6 Belgium 6.3 4.6 Denmark 12.9 18.5 Finland 30.2 42.1 France 112.9 119.6 Germany 76.7 65.6 Greece 14.6 18.5 Ireland 4.5 10.2 Italy 89.8 91.2 Luxembourg 0.5 0.5 Netherlands 11.9 10.6 Portugal 24.2 21.4 Spain 75.2 51.3 Sweden 97.5 100.9 United Kingdom 50.0 53.6 The Nordic countries all are regarded as potential exporters of certificates, as a result of the relatively large and low-cost potentials. Greece and Ireland also have significantly higher low-cost potentials than required to meet the targets assigned. France, Italy and the United Kingdom complete the group of exporting countries. Cost-effective deployment opportunities in Spain and Germany are considered inadequate to meet their national RES-E targets. This is of course largely influenced by the assumption of no additional supporting policies.
B.2.2 ADMIRE REBUS ADMIRE-REBUS continues where REBUS ended. It explores the development of the EU green electricity market, and provides insight in this developing market to the investors in renewable capacity. The ADMIRE REBUS modus is being developed to pay explicit attention to trade barriers, discriminative support policies, political risks and other imperfections that are inherent to a market in transition. The main features of ADMIRE REBUS are: • An endogenous cost calculation module determines the costs of renewable technologies by a
net present value calculation. • Takes into account technology, market and political risks, • Future potentials are estimated for all technology bands within a country. In the model,
realistic potentials are used, meaning that all restrictions except economic ones are accounted for.
• Supply curves are constructed (based on costs and potentials), and their development is simulated through time.
• In parallel, policies acting on the demand side, such as price support of the demand or quota’s on consumers or suppliers, are included in national demand curves.
The model matches national supply curves with demand curves in a dynamic market simulation. The results are calculated in a way that takes into account the discriminative characteristics of some policies, and the ability of producers to choose whether they produce for the domestic

56 ECN-C--03-029
market or wish to trade their production. Because of the different levels and conditions of national support schemes, there will not be a single market equilibrium for the EU, but rather different submarkets emerge with local equilibria. The simulations will be done for several target years up to 2020. For several policy scenarios such as: • Continuation of present support policies. • Clustered Europe: those countries that are currently using or planning to introduce a quota-
based TGC system will open their markets for each other. • Harmonised Europe: provides a reference point by assuming that a harmonised market is
established for new capacity by 2010.