renewable energy markets and the clean power plan (part...
TRANSCRIPT

Renewable Energy Markets and the
Clean Power Plan (Part I)
Thomas Vitolo, Synapse
David Wooley, Keyes, Fox & Wiedman
Ed Holt, Ed Holt & Associates

The Influence of Clean Power Plan Compliance Pathway Choice on Renewable Energy Construction
Renewable Energy Markets 2016
www.synapse-energy.com | ©2016 Synapse Energy Economics Inc. All rights reserved.
October 17, 2016
Dr. Thomas Vitolo
@TommyVitolo

3
Synapse Energy Economics
• Founded in 1996 by CEO Bruce Biewald
• Leader for public interest and government clients in providing rigorous analysis of the electric power sector
• Staff of 30 includes experts in energy and environmental economics and environmental compliance
www.synapse-energy.com | ©2016 Synapse Energy Economics Inc. All rights reserved. Tommy Vitolo
The Clean Power Plan(abridged)

Clean Power Plan and Section 111(d)
www.synapse-energy.com | ©2016 Synapse Energy Economics Inc. All rights reserved. 5
Who? Applies to existing fossil fuel-fired generators that were in operation or under construction by January 8, 2014 and that meet certain size and production requirements
What? Covered units must reduce emissions of carbon dioxide (CO2) by the amount determined by EPA to reflect the Best System of Emission Reductions (BSER) for the source category
When? Compliance targets must be met on average over an 8-year interim compliance period as well as in the final compliance year: 2030
Where? Applies to units in 47 states and several Tribal lands (Vermont and Washington D.C. have no covered units; Hawaii, Alaska, Puerto Rico, and Guam will be brought into the program when more data is available on the units in those states/territories)
Why? To reduce emissions of CO2 from the electricity sector in order to reduce the contribution to global climate change
Tommy Vitolo

6
Timeline for Compliance
• First date for compliance pushed back from 2020 to 2022
• Two additional years to complete final State Plans
• States still expected to demonstrate progress during an interim period
through 2029 and must meet the final compliance targets by 2030
www.synapse-energy.com | ©2016 Synapse Energy Economics Inc. All rights reserved. Tommy Vitolo
EPA may extended
EPA holding these dates firm

CPP Compliance Options(abridged)

Two Forms of Compliance
www.synapse-energy.com | ©2016 Synapse Energy Economics Inc. All rights reserved. 8
Rate-based
Compliance is determined on a pounds per megawatt hour basis at the unit level or on a state-wide weighted average basis
Mass-based
Compliance is determined on a total tons of CO2 emitted basis (EPA has done the translation from rate to mass for each state)
Tommy Vitolo
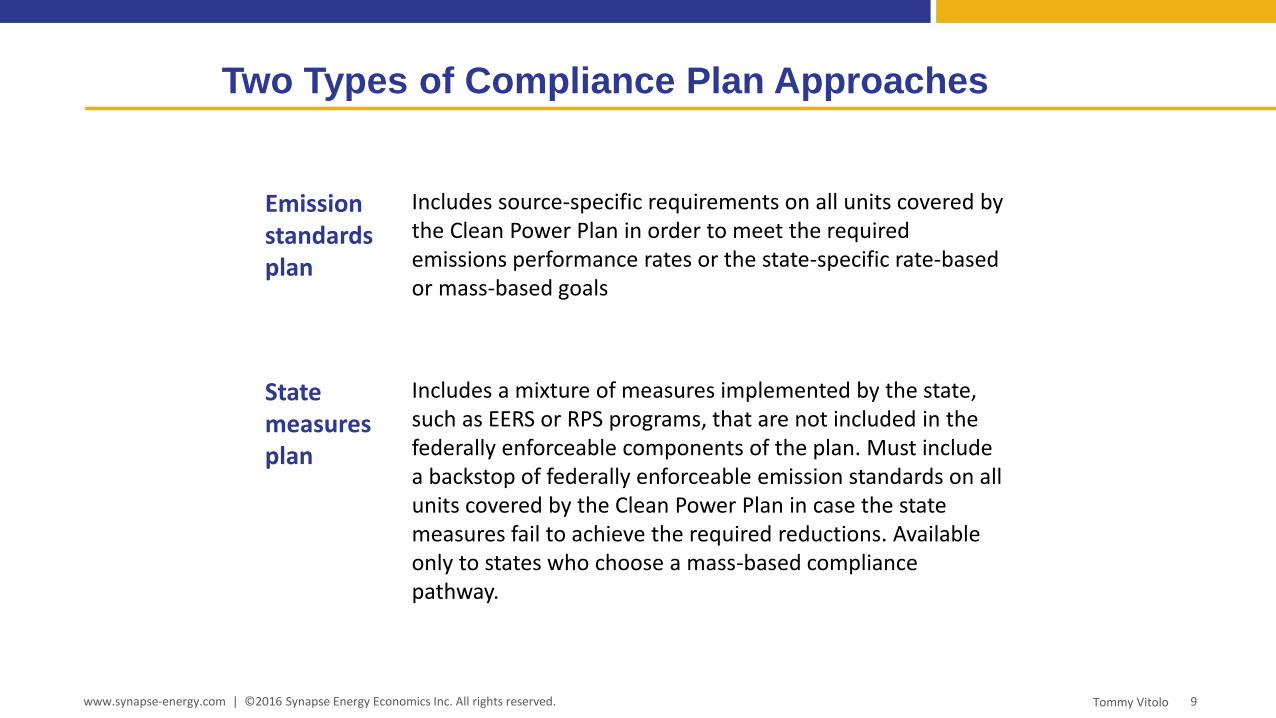
Two Types of Compliance Plan Approaches
www.synapse-energy.com | ©2016 Synapse Energy Economics Inc. All rights reserved. 9
Emission standards plan
Includes source-specific requirements on all units covered by the Clean Power Plan in order to meet the required emissions performance rates or the state-specific rate-based or mass-based goals
Statemeasures plan
Includes a mixture of measures implemented by the state, such as EERS or RPS programs, that are not included in the federally enforceable components of the plan. Must include a backstop of federally enforceable emission standards on all units covered by the Clean Power Plan in case the state measures fail to achieve the required reductions. Available only to states who choose a mass-based compliance pathway.
Tommy Vitolo

Mo
del
Ru
les
10
Potential Compliance Pathways
www.synapse-energy.com | ©2016 Synapse Energy Economics Inc. All rights reserved. Tommy Vitolo

11
Emission Trading for Compliance
• Emissions trading is a long-established mechanism for complying with environmental regulations
• Acid Rain program, Regional Haze, NOx Budget Trading program, CSAPR, CAIR, RGGI in the Northeast, AB 32 in California
• EPA provides a “panoply” of tools to facilitate the use of emissions trading programs in the Clean Power Plan
• Both of EPA’s proposed model rules (rate and mass) include emission budget trading programs
• Trading options limited by compliance pathway
www.synapse-energy.com | ©2016 Synapse Energy Economics Inc. All rights reserved. Tommy Vitolo
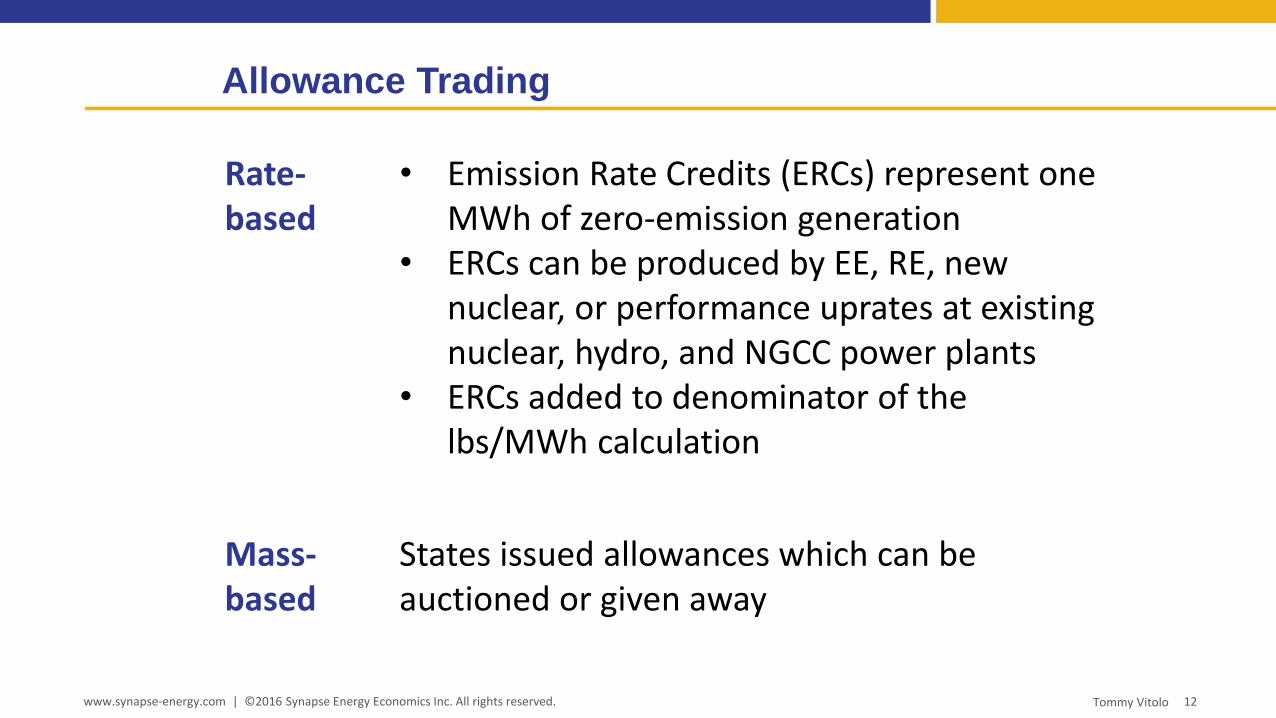
Allowance Trading
www.synapse-energy.com | ©2016 Synapse Energy Economics Inc. All rights reserved. 12
Rate-based
• Emission Rate Credits (ERCs) represent one MWh of zero-emission generation
• ERCs can be produced by EE, RE, new nuclear, or performance uprates at existing nuclear, hydro, and NGCC power plants
• ERCs added to denominator of the lbs/MWh calculation
Mass-based
States issued allowances which can be auctioned or given away
Tommy Vitolo
13
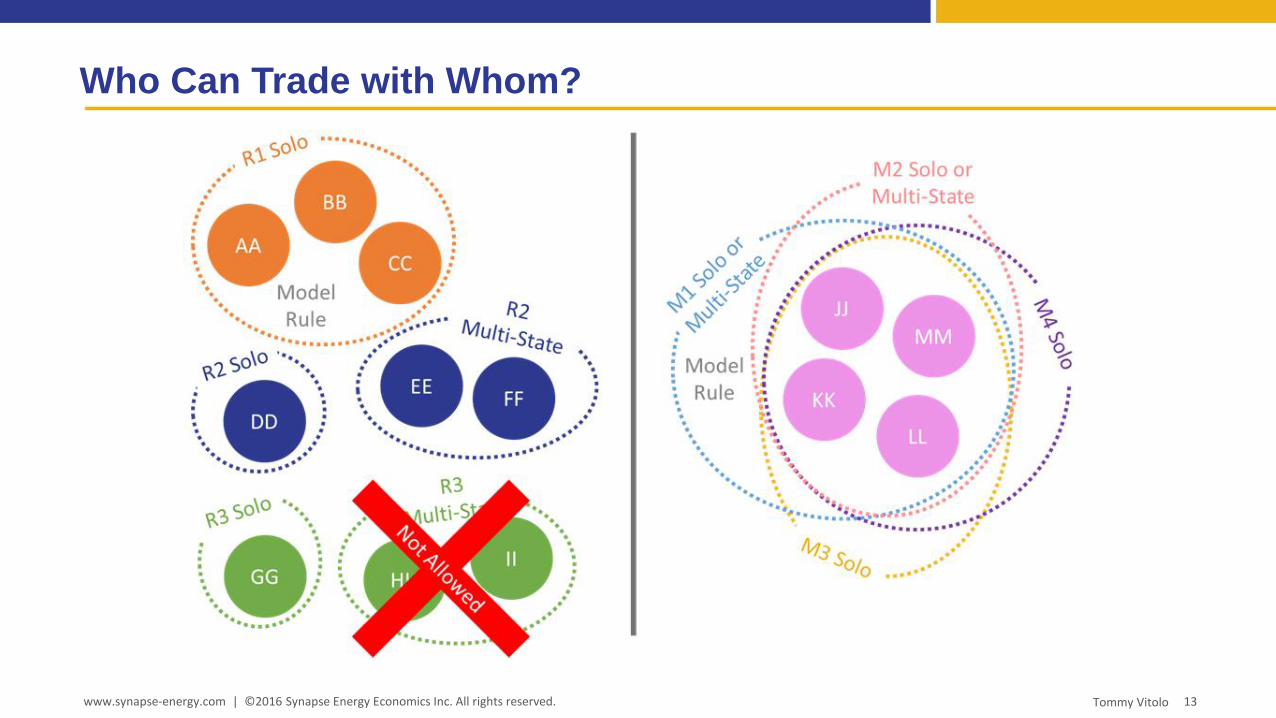
Who Can Trade with Whom?
www.synapse-energy.com | ©2016 Synapse Energy Economics Inc. All rights reserved. Tommy Vitolo
CPP Compliance Pathway Implications on RE Construction

15
USA Wind and Solar w/ & w/out CPP
www.synapse-energy.com | ©2016 Synapse Energy Economics Inc. All rights reserved. Tommy Vitolo
0
100
200
300
400
500
600
700
800
900
2016 2018 2020 2022 2024 2026 2028 2030 2032 2034 2036 2038 2040
Win
d a
nd
So
lar
Gen
erat
ion
(T
Wh
)
AEO 2016 Reference
AEO 2016 No CPP
16
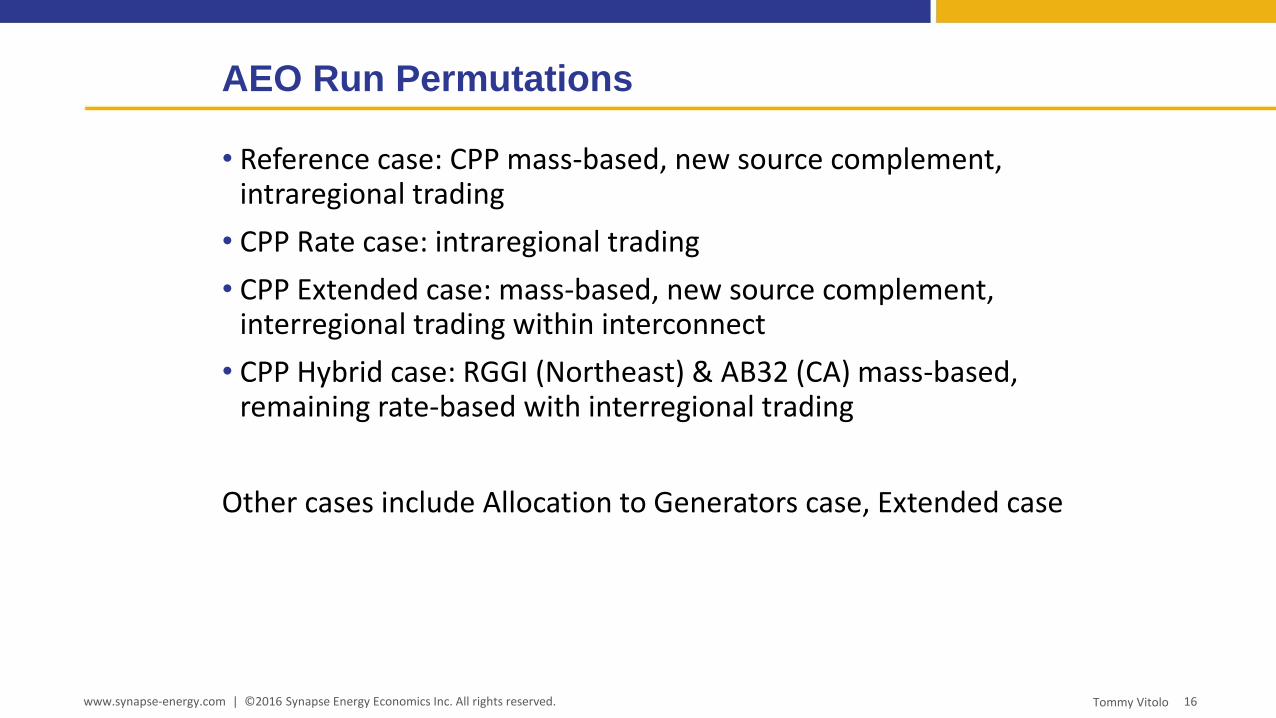
• Reference case: CPP mass-based, new source complement, intraregional trading
• CPP Rate case: intraregional trading
• CPP Extended case: mass-based, new source complement, interregional trading within interconnect
• CPP Hybrid case: RGGI (Northeast) & AB32 (CA) mass-based, remaining rate-based with interregional trading
Other cases include Allocation to Generators case, Extended case
www.synapse-energy.com | ©2016 Synapse Energy Economics Inc. All rights reserved. Tommy Vitolo
AEO Run Permutations
17www.synapse-energy.com | ©2016 Synapse Energy Economics Inc. All rights reserved. Tommy Vitolo
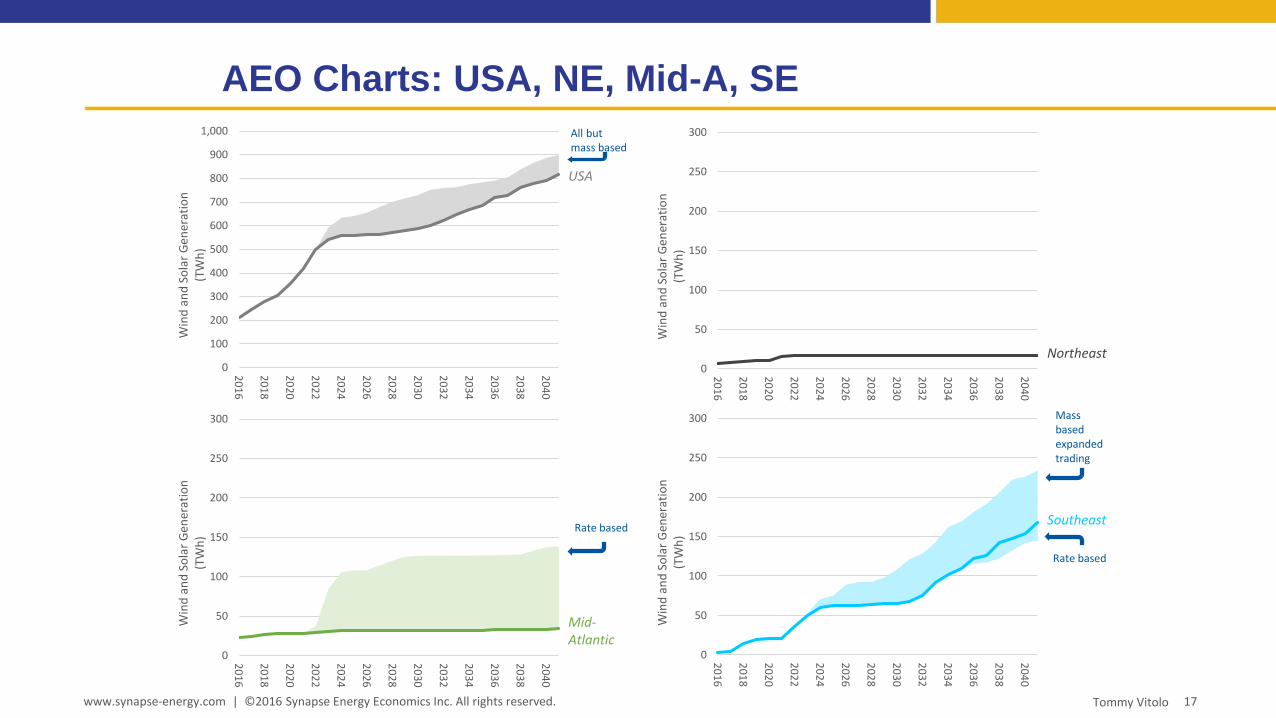
AEO Charts: USA, NE, Mid-A, SE
0
100
200
300
400
500
600
700
800
900
1,000
20
16
20
18
20
20
20
22
20
24
20
26
20
28
20
30
20
32
20
34
20
36
20
38
20
40
Win
d a
nd
So
lar
Gen
erat
ion
(T
Wh
)
USA
All but mass based
0
50
100
150
200
250
300
20
16
20
18
20
20
20
22
20
24
20
26
20
28
20
30
20
32
20
34
20
36
20
38
20
40
Win
d a
nd
So
lar
Gen
erat
ion
(T
Wh
)
Northeast
0
50
100
150
200
250
300
20
16
20
18
20
20
20
22
20
24
20
26
20
28
20
30
20
32
20
34
20
36
20
38
20
40
Win
d a
nd
So
lar
Gen
erat
ion
(T
Wh
)
Mid-Atlantic
Rate based
0
50
100
150
200
250
300
20
16
20
18
20
20
20
22
20
24
20
26
20
28
20
30
20
32
20
34
20
36
20
38
20
40
Win
d a
nd
So
lar
Gen
erat
ion
(T
Wh
)
Southeast
Mass based expanded trading
Rate based

18www.synapse-energy.com | ©2016 Synapse Energy Economics Inc. All rights reserved. Tommy Vitolo
AEO Charts: West, Upper MW, TX, Lower MW
0
50
100
150
200
250
300
20
16
20
18
20
20
20
22
20
24
20
26
20
28
20
30
20
32
20
34
20
36
20
38
20
40
Win
d a
nd
So
lar
Gen
erat
ion
(T
Wh
)
Upper Midwest
Rate based
0
50
100
150
200
250
300
20
16
20
18
20
20
20
22
20
24
20
26
20
28
20
30
20
32
20
34
20
36
20
38
20
40
Win
d a
nd
So
lar
Gen
erat
ion
(T
Wh
)
West
Rate based
0
50
100
150
200
250
300
20
16
20
18
20
20
20
22
20
24
20
26
20
28
20
30
20
32
20
34
20
36
20
38
20
40
Win
d a
nd
So
lar
Gen
erat
ion
(T
Wh
)
Lower Midwest
0
50
100
150
200
250
300
20
16
20
18
20
20
20
22
20
24
20
26
20
28
20
30
20
32
20
34
20
36
20
38
20
40
Win
d a
nd
So
lar
Gen
erat
ion
(T
Wh
)
Texas
19
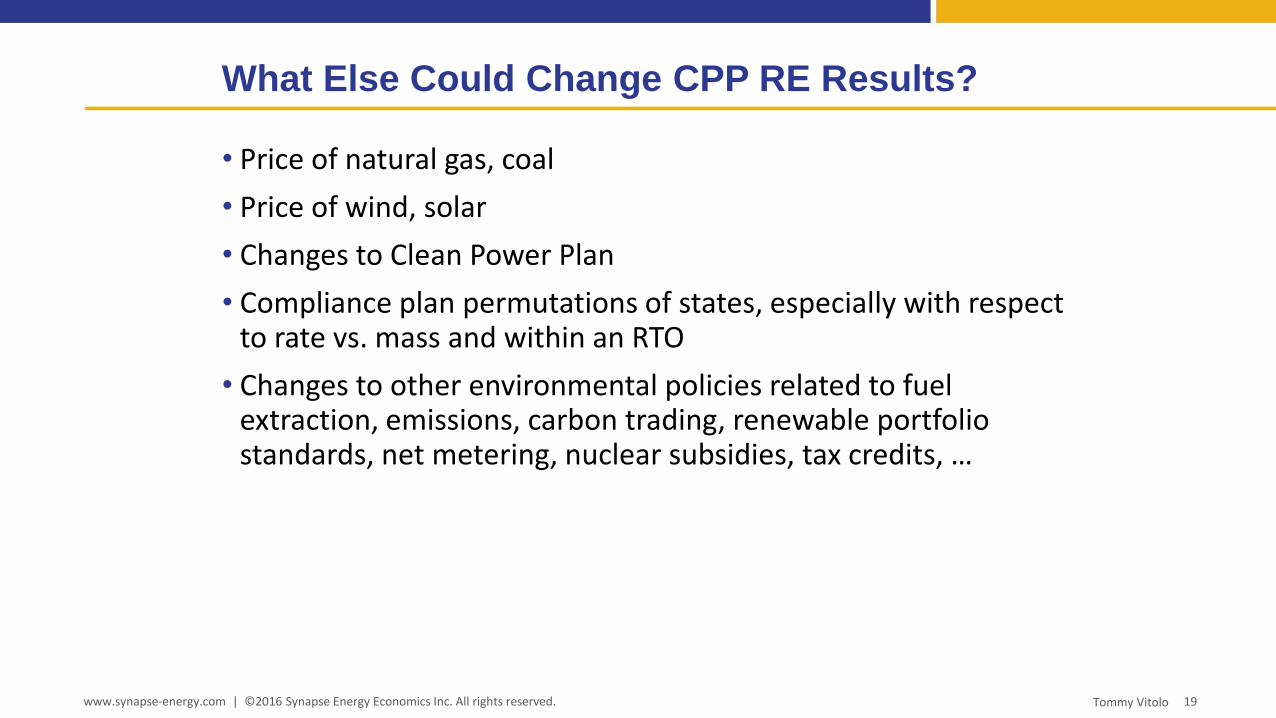
• Price of natural gas, coal
• Price of wind, solar
• Changes to Clean Power Plan
• Compliance plan permutations of states, especially with respect to rate vs. mass and within an RTO
• Changes to other environmental policies related to fuel extraction, emissions, carbon trading, renewable portfolio standards, net metering, nuclear subsidies, tax credits, …
www.synapse-energy.com | ©2016 Synapse Energy Economics Inc. All rights reserved. Tommy Vitolo
What Else Could Change CPP RE Results?

Let’s talk.
www.synapse-energy.com | ©2016 Synapse Energy Economics Inc. All rights reserved. 20Tommy Vitolo
Dr. Tommy Vitolo
617.453.7036
@TommyVitolo

21
Related Media
• Jackson, S., Santen, N., and Biewald, B. “Overview of the Final Clean Power Plan.” For the National
Association of State Utility Consumer Advocates. August 25, 2015.
• Jackson, S. “Overview of the Clean Power Plan.” 2015 Clean Power Plan Summit of Southeastern
Advocates. September 23, 2015. http://www.synapse-energy.com/sites/default/files/Overview-
of-CPP-for-Southeast-Advocates.pdf
• Energy Information Administration. “Annual Energy Outlook 2016.” July 2016.
http://www.eia.gov/forecasts/aeo/
• M. J. Bradley & Associates. “EPA’s Clean Power Plan Summary of IPM Modeling Results.” March 4,
2016. http://www.mjbradley.com/sites/default/files/MJBA_CPP_IPM_Summary.pdf
• PJM Interconnection. “EPA’s Final Clean Power Plan Compliance Pathways Economic and Reliability
Analysis.” September 1, 2016. http://www.pjm.com/~/media/documents/reports/20160901-cpp-
compliance-assessment.ashx
• MISO Policy & Economic Studies Department. “MISO’s Analysis of EPA’s Final Clean Power Plan
Study Report DRAFT.” May 2016.
https://www.misoenergy.org/Library/Repository/Meeting%20Material/Stakeholder/PAC/2016/20
160518/20160518%20PAC%20Item%2002a%20DRAFT%20MISO%20Analysis%20of%20EPA%20Fin
al%20Clean%20Power%20Plan%20Study%20Report.pdf
www.synapse-energy.com | ©2016 Synapse Energy Economics Inc. All rights reserved. Tommy Vitolo

Renewable Energy Markets and the
Clean Power Plan (Part I)
Thomas Vitolo, Synapse
David Wooley, Keyes, Fox & Wiedman
Ed Holt, Ed Holt & Associates

Federal Carbon Pollution Standards & Renewables
David WooleyKeyes & Fox LLP
Oakland, CA
Renewable Energy Markets
Conference
San Francisco
October 17, 2016

Clean Air Act – Clean Power Plan (CPP)
• CPP is, potentially, very good for RE
• It is likely to be up-held in court
• Likely to be succeeded by stronger standards
• But, CPP will not automatically help RE –Advocacy needed now Engage with states to influence implementation
• RE companies need to structure operations in order to access CPP compliance market revenue

Ways CPP Can Help RE
• Increased Utility RE Procurement
• Emission Reduction Credit (ERC) & Allowance awards/trading
• State Allowance Auction Proceeds
• Increased wholesale & retail electric prices
• Helps secure RE policy supports (RPS, NEM)
• CEIP early action credits for wind and solar 2020-2022

We are not there yet
• Financial benefits, over long term, are potentially large
• RE investors will not automatically get a financial reward for lowering CO2 emissions
• Action needed now to secure them
“Allowance allocation may be the single-most important decision states will make ....”

States Will Make Key Decisions
• States will design compliance – in concert with– Air Quality Regulators, Utility Commissions, Utilities– And you
• Poorly designed state plan could:– RATE-BASED: Exclude renewables from ERC eligibilit– MASS BASED:
• Limit award of allowances to utility owned RE systems• Adversely affect existing voluntary RE markets• Deprive Corporate RE buyers of sustainablity claims and green
marketing
– Disqualify behind-the-meter RE from compliance market– Compliance plans that rely exclusively on coal-to-gas shift
could drop ERC and Allowance values to zero
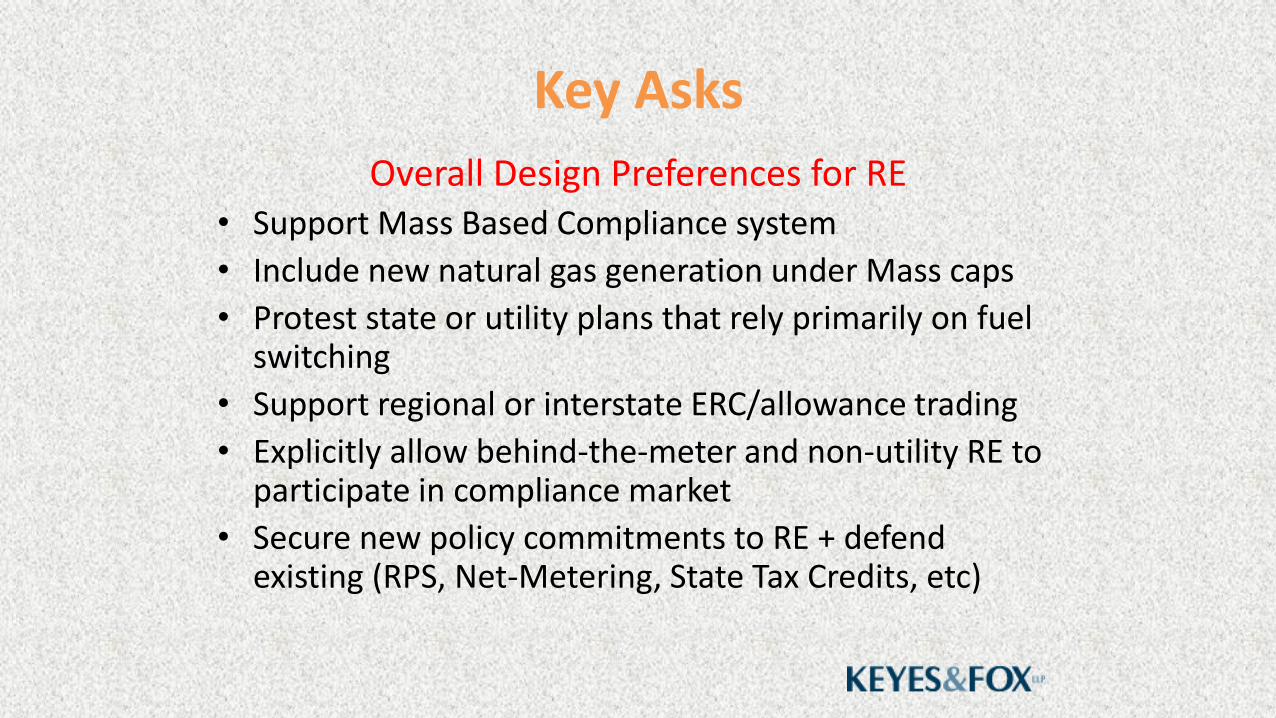
Key Asks
Overall Design Preferences for RE• Support Mass Based Compliance system
• Include new natural gas generation under Mass caps
• Protest state or utility plans that rely primarily on fuel switching
• Support regional or interstate ERC/allowance trading
• Explicitly allow behind-the-meter and non-utility RE to participate in compliance market
• Secure new policy commitments to RE + defend existing (RPS, Net-Metering, State Tax Credits, etc)

Key AsksRate-based Plans
• Make RE Eligible for ERCs
– “A state may … restrict the definition of eligible resource by allowing only some of the technologies identified by EPA to generate ERCs”
• Clear, easy-to-follow, mechanisms to award ERCs
• ERC Tracking System
• Mechanisms to qualify of Independent Verifiers
• Participate in CEIP Early reductions program
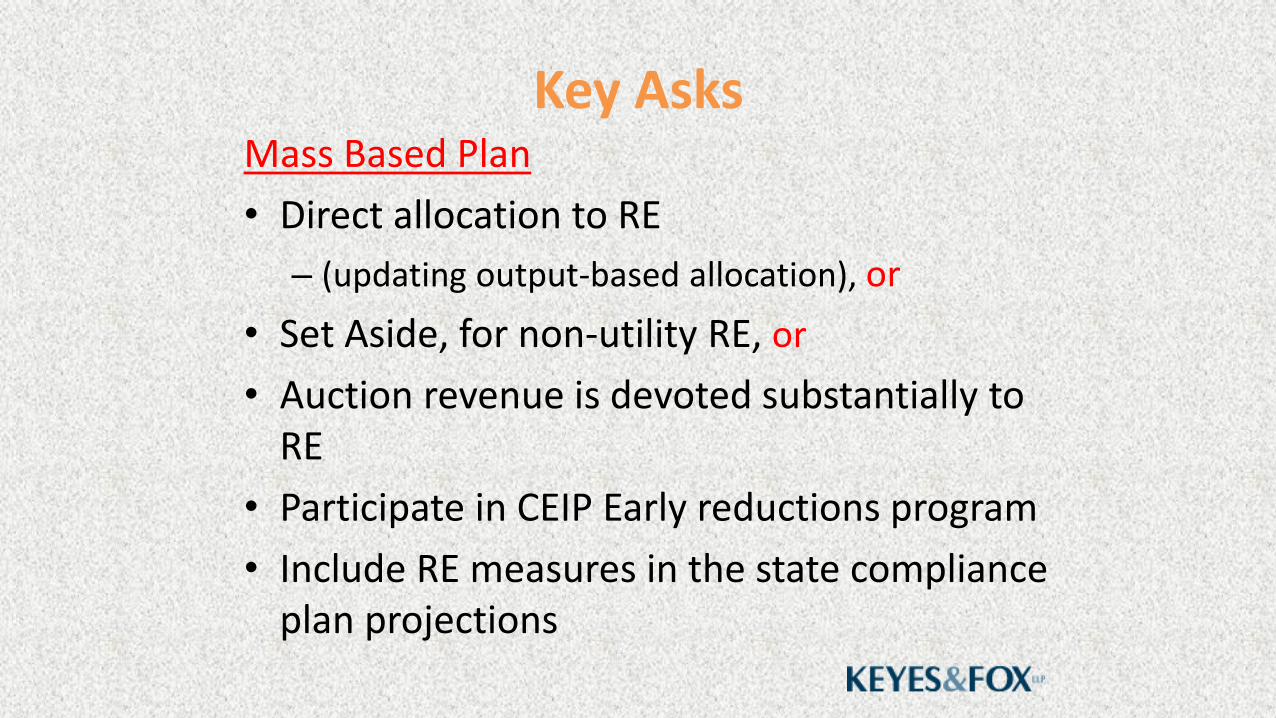
Key AsksMass Based Plan
• Direct allocation to RE
– (updating output-based allocation), or
• Set Aside, for non-utility RE, or
• Auction revenue is devoted substantially to RE
• Participate in CEIP Early reductions program
• Include RE measures in the state compliance plan projections

What’s it Worth?Too Early to Tell
Near Term 2022-2025
• In some states – $0/ton/mWh
• In many states – $1-5/ton
– $.4 to $4/mWh
• Potentially more in states that restrict interstate trading & have steep emission reduction target
Long Term 2025-2030
• Expect allowances to trade between $5 and $20 a ton
– ERCs $1 to $15/mWh
• Potentially higher if CPP is tightened
– Could occur before 2030
– Likely after 2030

Principle Advocacy Venues
• State air quality regulators - Allow utility-scale and behind-the meter RE to count
– Be a stakeholder early in the decision making
– Comment on state implementation plans design
• State utility commissions – resource planning
• Governors’ offices
• Engage utilities on compliance planning
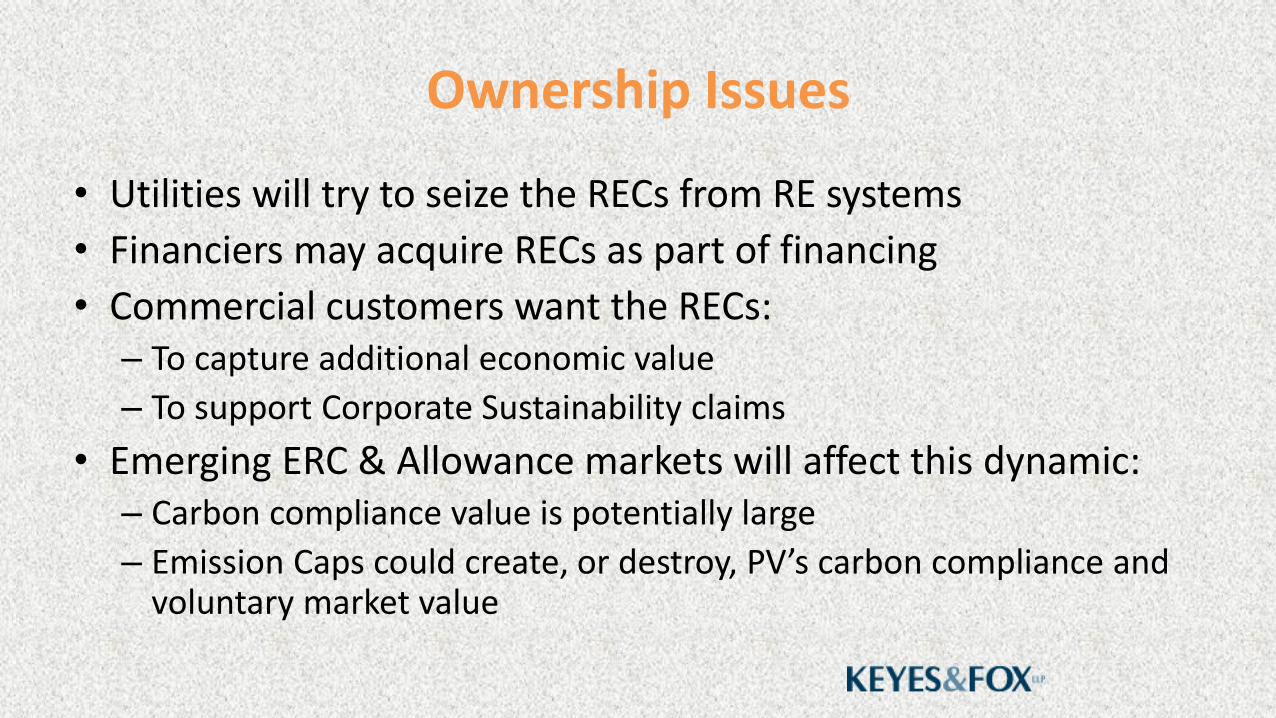
Ownership Issues
• Utilities will try to seize the RECs from RE systems
• Financiers may acquire RECs as part of financing
• Commercial customers want the RECs:– To capture additional economic value
– To support Corporate Sustainability claims
• Emerging ERC & Allowance markets will affect this dynamic:– Carbon compliance value is potentially large
– Emission Caps could create, or destroy, PV’s carbon compliance and voluntary market value
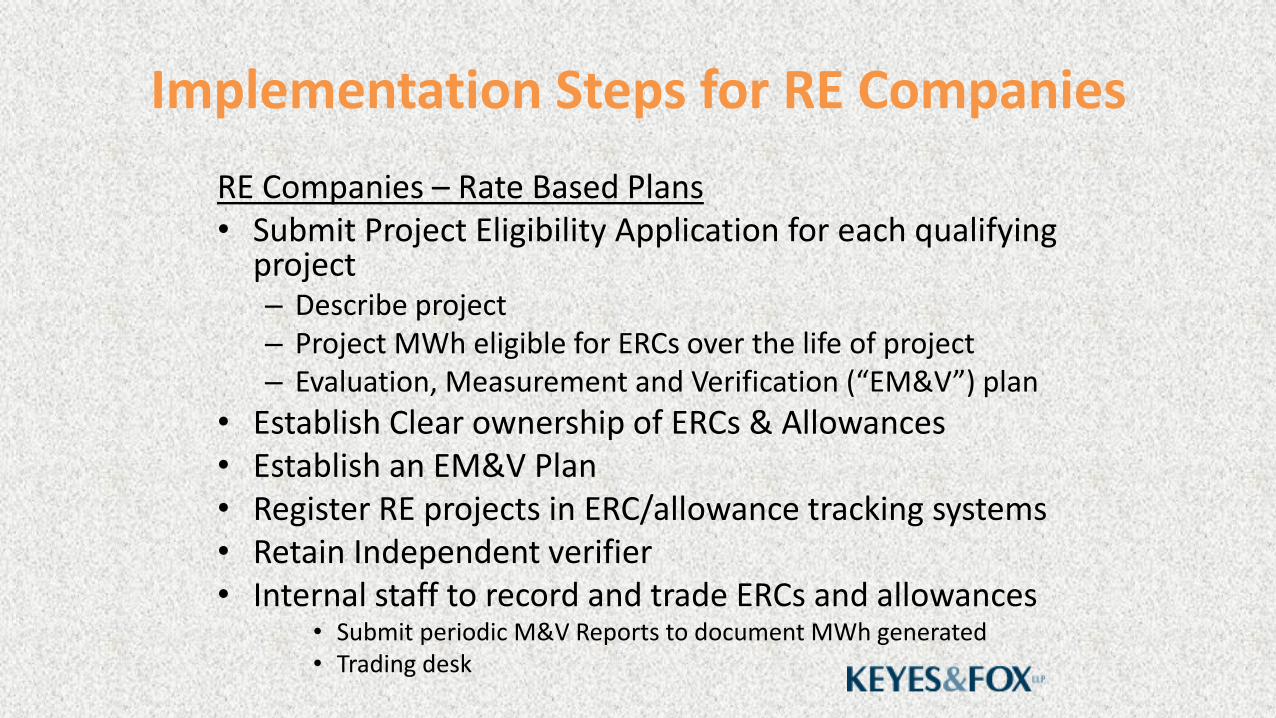
Implementation Steps for RE Companies
RE Companies – Rate Based Plans• Submit Project Eligibility Application for each qualifying
project– Describe project– Project MWh eligible for ERCs over the life of project– Evaluation, Measurement and Verification (“EM&V”) plan
• Establish Clear ownership of ERCs & Allowances• Establish an EM&V Plan• Register RE projects in ERC/allowance tracking systems • Retain Independent verifier• Internal staff to record and trade ERCs and allowances
• Submit periodic M&V Reports to document MWh generated • Trading desk

Conclusion• Renewables can significantly reduce carbon
pollution in the electric sector • Carbon Pollution Standards could help expand RE
if the rules are properly designed to:– Allow solar to count toward carbon emission
reduction compliance– Preserve private property rights to carbon reduction
attributes of solar generation
• Renewable industry must– Be heard on the state implementation plans, and – Set up internal mechanism to manage ERCs and
allowances.
Keyes&FoxDistributed Generation Law
• Interconnection• Net Metering • Permitting• Contracts• Transmission• Rate Design • Utility Regulation• Storage & Demand
Response• Emission & Renewable
Energy Credits
DAVID WOOLEY436 14th Street
Oakland, CA 94706415-271-1135 cell
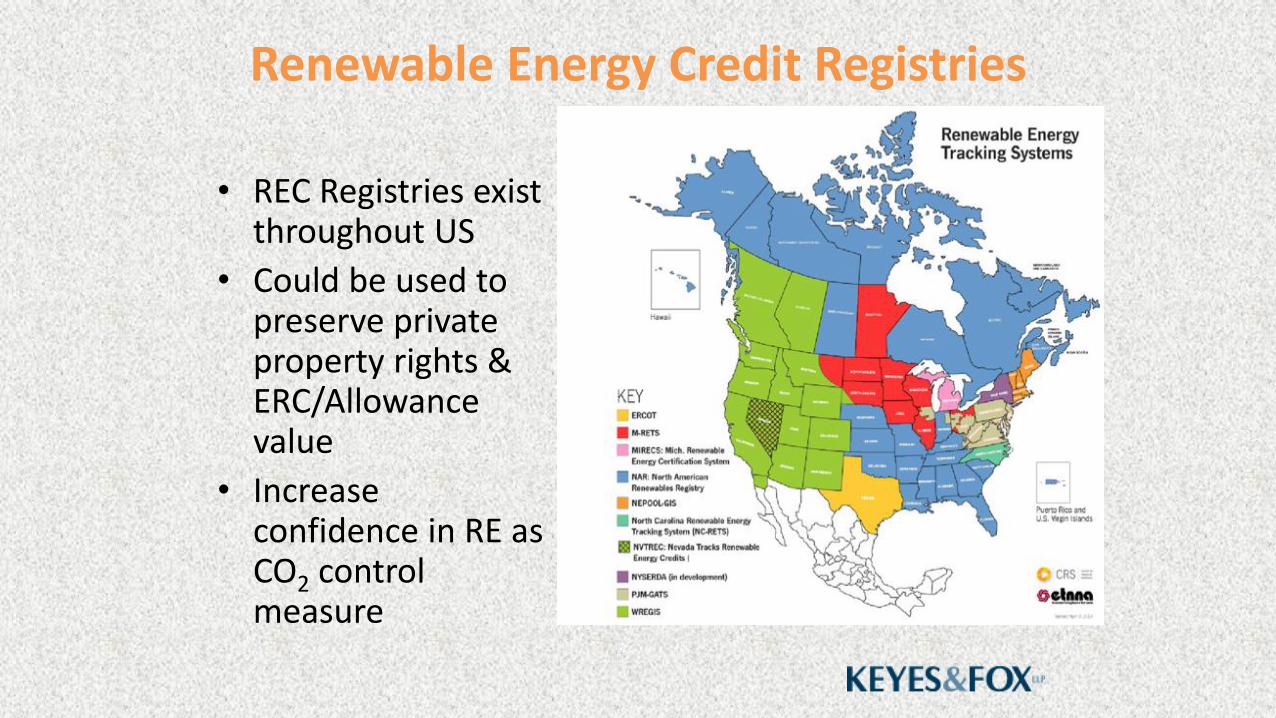
Renewable Energy Credit Registries
• REC Registries exist throughout US
• Could be used to preserve private property rights & ERC/Allowance value
• Increase confidence in RE as CO2 control measure
Renewable Energy Markets and the
Clean Power Plan (Part I)
Thomas Vitolo, Synapse
David Wooley, Keyes, Fox & Wiedman
Ed Holt, Ed Holt & Associates

The Clean Power Plan and Voluntary Renewable Energy Claims
Renewable Energy Markets
San Francisco
17 October 2016
28 Headland Road
Harpswell, ME 04079
Tel. 207.798.4588

Outline
Interactions between VRE and the CPP
VRE and rate-based plans
Buyer’s perspective
VRE and mass-based plans
Buyer’s perspective
Ed Holt & Associates, Inc.
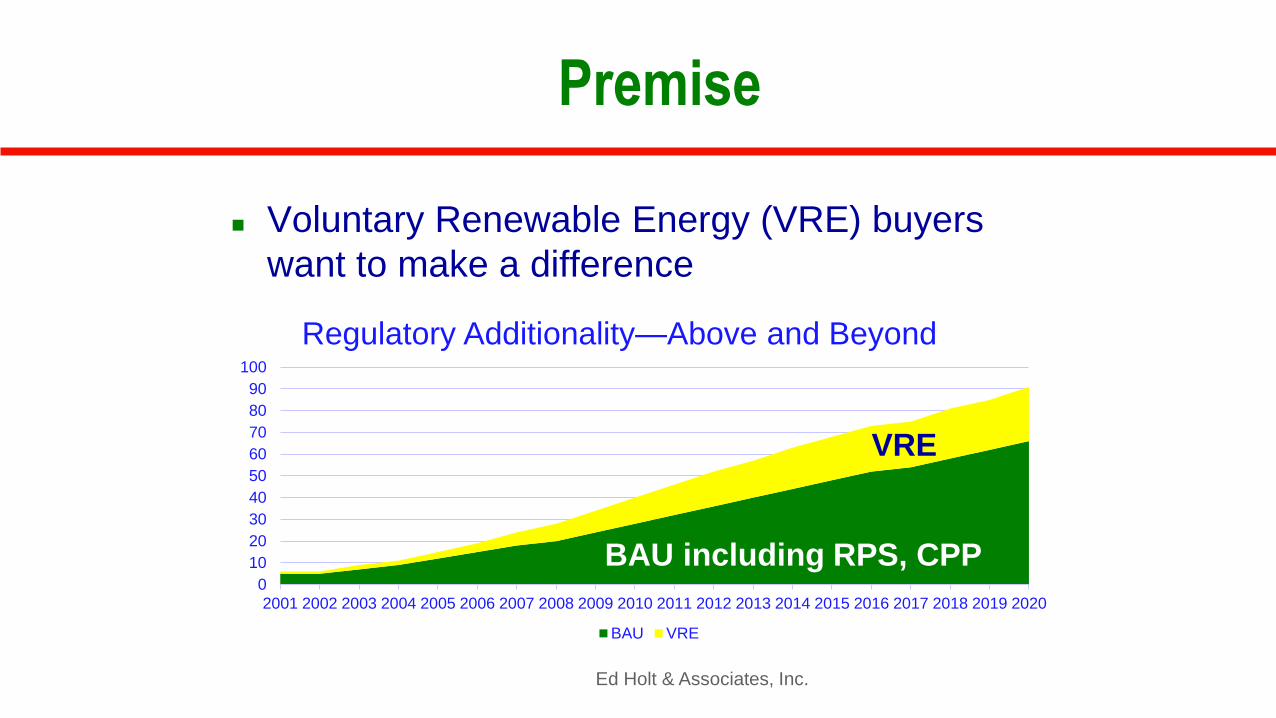
Premise
Voluntary Renewable Energy (VRE) buyers
want to make a difference
Ed Holt & Associates, Inc.
0
10
20
30
40
50
60
70
80
90
100
2001 2002 2003 2004 2005 2006 2007 2008 2009 2010 2011 2012 2013 2014 2015 2016 2017 2018 2019 2020
Regulatory Additionality—Above and Beyond
BAU VRE
BAU including RPS, CPP
VRE
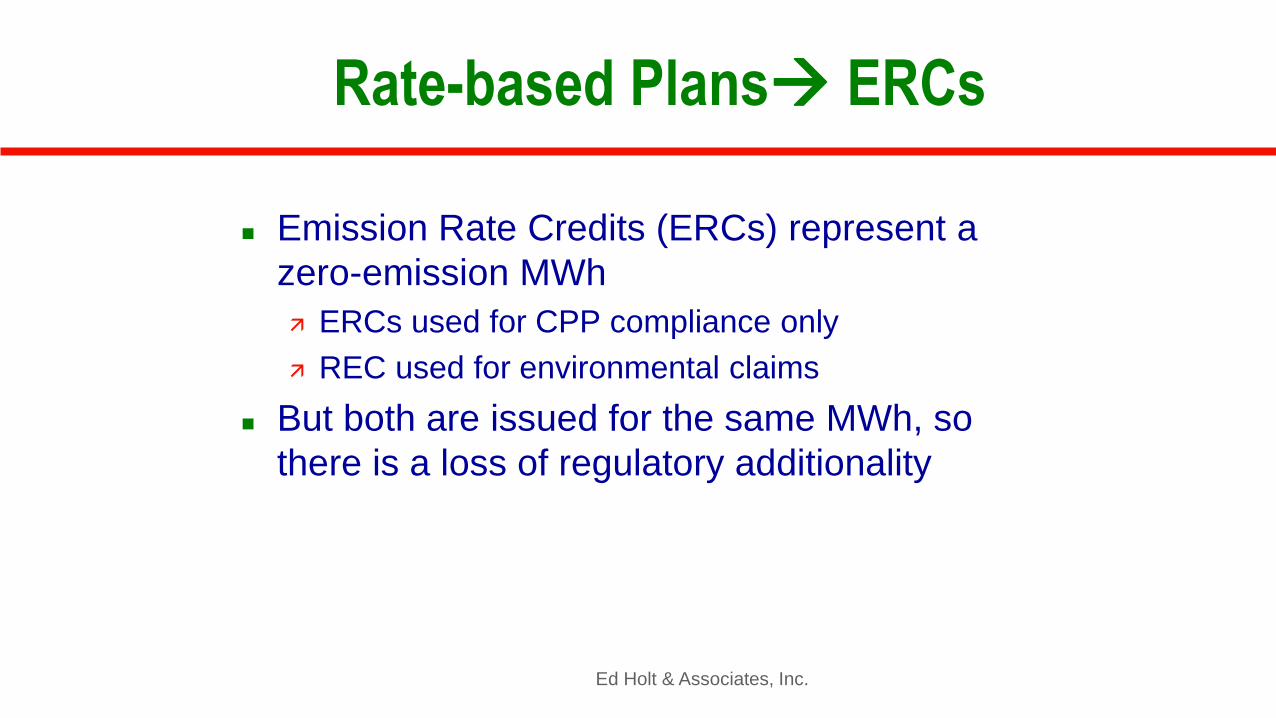
Rate-based Plans ERCs
Emission Rate Credits (ERCs) represent a
zero-emission MWh
ERCs used for CPP compliance only
REC used for environmental claims
But both are issued for the same MWh, so
there is a loss of regulatory additionality
Ed Holt & Associates, Inc.

Ed Holt & Associates, Inc.
Not All RE Will Be Issued ERCs
All generation
certificates
RECs
ERCs: RE, EE,
nuclear, EGU
efficiency, gas
for coal
substitution
RE ERCs from
new capacity
post-2012
Although overlapping,
REC and ERCs still
separate instruments
Generators must
apply for ERCs

Buy around the ERC eligibility RE that began construction pre-2013*
RE generated 2013-2021 (no ERCs issued**)
Buy from generators that don’t apply for ERCs Accompanied by attestation that no ERCs were issued
for the energy produced
Buy (and retire) ERCs to match renewable energy purchases PPA or virtual PPA could specify the purchase of both
RECs and ERCs
Ed Holt & Associates, Inc.
* May be limited by Green-e vintage eligibility
** Exception for CEIP 2020-2021
What Can a Buyer Do About It?
Ed Holt & Associates, Inc.
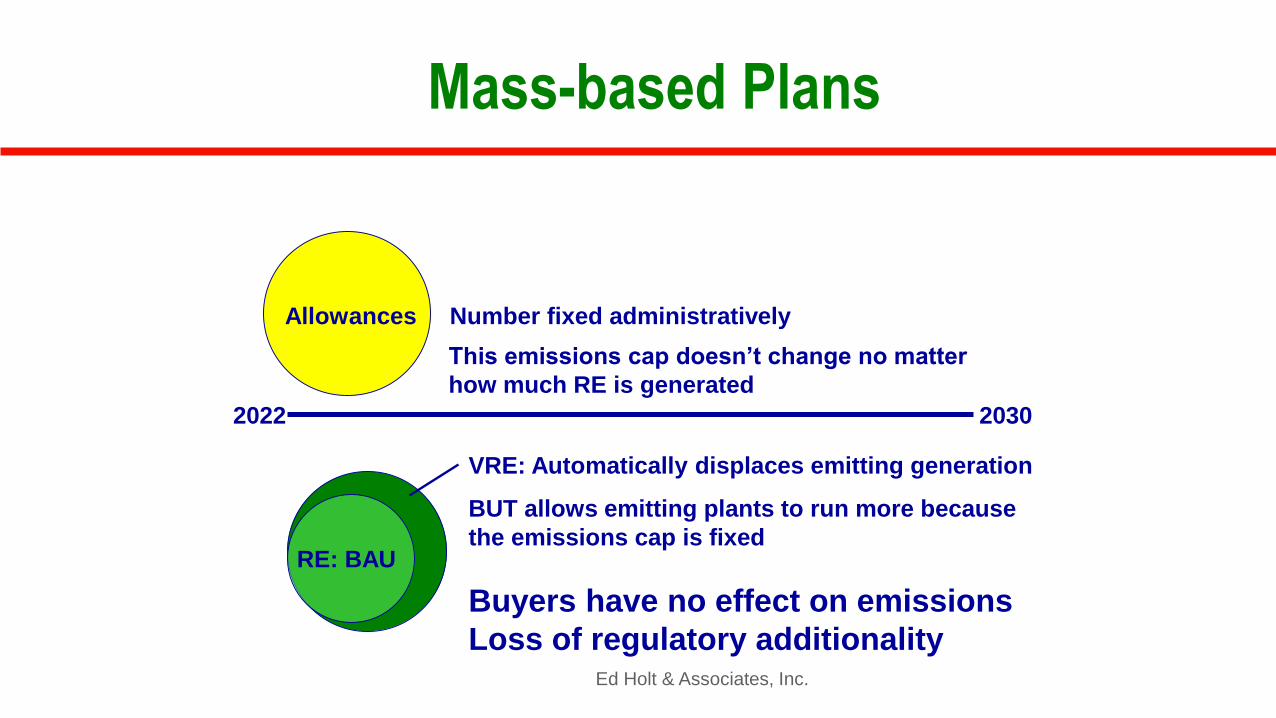
Mass-based Plans
2022 2030
Allowances Number fixed administratively
RE: BAU
VRE: Automatically displaces emitting generation
This emissions cap doesn’t change no matter
how much RE is generated
BUT allows emitting plants to run more because
the emissions cap is fixed
Buyers have no effect on emissions
Loss of regulatory additionality
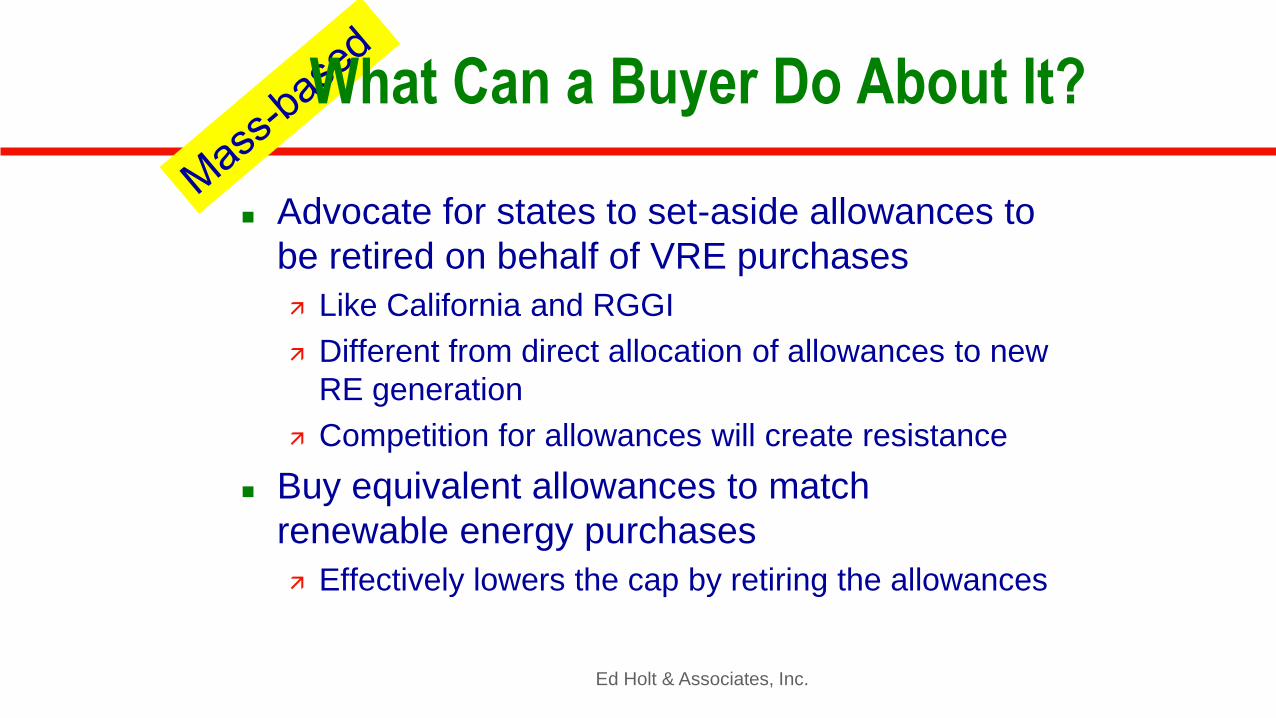
Advocate for states to set-aside allowances to
be retired on behalf of VRE purchases
Like California and RGGI
Different from direct allocation of allowances to new
RE generation
Competition for allowances will create resistance
Buy equivalent allowances to match
renewable energy purchases
Effectively lowers the cap by retiring the allowances
Ed Holt & Associates, Inc.
What Can a Buyer Do About It?

Thank you!
Questions?