renaissance services saog and its subsidiary · pdf filerenaissance services saog and its...
TRANSCRIPT

RENAISSANCE SERVICES SAOG
AND ITS SUBSIDIARY COMPANIES
CONSOLIDATED FINANCIAL STATEMENTS
FOR THE YEAR ENDED 31 DECEMBER 2012
Principal place of business
Renaissance Services SAOG
Renaissance House
Central Business District
Ruwi, Muscat
Sultanate of Oman
Registered office
Renaissance Services SAOG
PO Box 1676
Muttrah
Postal Code 114
Sultanate of Oman

RENAISSANCE SERVICES SAOG AND ITS SUBSIDIARY COMPANIES
CONSOLIDATED FINANCIAL STATEMENTS
FOR THE YEAR ENDED 31 DECEMBER 2012
Contents Page
Report of the Auditors 1 - 2
Consolidated statement of comprehensive income 3 - 4
Consolidated statement of financial position 5
Consolidated statement of changes in equity 6 - 7
Consolidated statement of cash flows 8
Notes to the consolidated financial statements 9 - 53

PricewaterhouseCoopers LLP, Hatat House A, Suites 204-211, Wadi Adai, P. O. Box 3075, Ruwi, Post Code 112, Muscat, Sultanate of Oman, T: +968 2 455 9110, F: +968 2 456 4408, www.pwc.com/middle-east Chartered Accountants Licence No. MH/26, Management Consultants Licence No. ME/161, Commercial Register No. 1307665
Independent auditor’s report to the shareholders of
Renaissance Services SAOG Report on the financial statements We have audited the accompanying consolidated financial statements of Renaissance Services SAOG (the company) and its subsidiaries (the Group) which comprise the consolidated statement of financial position as at 31 December 2012 and the consolidated statements of comprehensive income, changes in equity and cash flows for the year then ended, and a summary of significant accounting policies and other explanatory information. Directors’ responsibility for the financial statements The directors of the company are responsible for the preparation and fair presentation of these consolidated financial statements in accordance with International Financial Reporting Standards, the disclosure requirements of the Capital Market Authority and the Commercial Companies law of 1974, as amended and for such internal control as management determines is necessary to enable the preparation of consolidated financial statements that are free from material misstatement, whether due to fraud or error. Auditor’s responsibility
Our responsibility is to express an opinion on these consolidated financial statements based on our audit. We
conducted our audit in accordance with International Standards on Auditing. Those standards require that we
comply with ethical requirements and plan and perform the audit to obtain reasonable assurance about whether
the consolidated financial statements are free from material misstatement.
An audit involves performing procedures to obtain audit evidence about the amounts and disclosures in the
consolidated financial statements. The procedures selected depend on the auditor’s judgment, including the
assessment of the risks of material misstatement of the consolidated financial statements, whether due to fraud or
error. In making those risk assessments, the auditor considers internal control relevant to the entity’s preparation
and fair presentation of the financial statements in order to design audit procedures that are appropriate in the
circumstances, but not for the purpose of expressing an opinion on the effectiveness of the entity’s internal
control. An audit also includes evaluating the appropriateness of accounting principles used and the
reasonableness of accounting estimates made by management, as well as evaluating the overall presentation of
the financial statements.
We believe that the audit evidence we have obtained is sufficient and appropriate to provide a basis for our audit opinion. Opinion
In our opinion, the accompanying consolidated financial statements present fairly, in all material respects, the financial position of the Group as at 31 December 2012, and its financial performance and its cash flows for the year then ended in accordance with International Financial Reporting Standards.

2
Independent auditor’s report to the shareholders of
Renaissance Services SAOG (continued)
Report on other legal and regulatory requirements
Further, as required by the Rules and Guidelines on Disclosure by Issuers of Securities and Insider Trading
(‘R&G’) issued by the Capital Market Authority (‘CMA’) of the Sultanate of Oman, we report that the
accompanying consolidated financial statements of the Group have been properly prepared, in all material
respects, in accordance with the R&G, with the Rules for Disclosure and Proformas issued by the CMA and with
the Commercial Companies Law of 1974, as amended.
Other matter – prior period consolidated financial statements audited by a predecessor auditor
The consolidated financial statements of the Group for the year ended 31 December 2011, were audited by
another firm of auditors, whose report dated 27 February 2012 expressed an unqualified opinion on those
consolidated financial statements. Our opinion is not qualified in respect of this matter.
PricewaterhouseCoopers LLP 3 March 2013 Muscat, Sultanate of Oman

3
RENAISSANCE SERVICES SAOG AND ITS SUBSIDIARY COMPANIES
CONSOLIDATED STATEMENT OF COMPREHENSIVE INCOME
FOR THE YEAR ENDED 31 DECEMBER 2012
2012 2011
Note RO’000 RO’000
Continuing operations
Revenue 30 257,277 244,374
Operating costs (185,535) (172,684)
Gross profit 71,742 71,690
Administrative expenses (27,630) (27,464)
Profit from operations 44,112 44,226
Finance costs - net 5 (20,840) (17,854)
Other non-operating expenses 6 - (10,645)
Amortisation of intangible assets 9 (19) (33)
Share of (loss)/profit of associate companies 11 (10) 109
(Loss)/gain on investments - net 10 (345) 1
Profit before tax 22,898 15,804
Taxation 7 (7,288) (5,465)
Profit for the year from continuing operations 15,610 10,339
Discontinued operations
Loss for the year from discontinued operations 16 (12,552) (8,048)
Profit for the year 3,058 2,291
Profit attributable to:
Owners of the parent (1,377) (1,000)
Non-controlling interests 4,435 3,291
3,058 2,291
Other comprehensive income/(loss):
Foreign currency translation differences
101 14
Reclassification on discontinuance of hedge accounting
964 -
Effective portion of changes in fair value of cash flow hedges 80 (1,628)
1,145 (1,614)
Total comprehensive income for the year 4,203 677
Attributable to:
Owners of the parent (232) (2,614)
Non-controlling interests 4,435 3,291
Total comprehensive income for the year 4,203 677
Total comprehensive income from:
Continuing operations 16,755 8,725
Discontinued operations (12,552) (8,048)
4,203 677
The notes on pages 9 to 53 form an integral part of these financial statements.
The parent company statement of comprehensive income is presented as a separate schedule attached to the
consolidated financial statements.
Report of the Auditors is set forth on page 1 and 2.

4
RENAISSANCE SERVICES SAOG AND ITS SUBSIDIARY COMPANIES
CONSOLIDATED STATEMENT OF COMPREHENSIVE INCOME
FOR THE YEAR ENDED 31 DECEMBER 2012 (continued)
2012 2011
Note
Earnings per share from continuing and discontinued operations
attributable to owners of the parent during the year (expressed
in Rial Omani)
Basic and diluted earnings per share
From continuing operations 25 0.041 0.020
From discontinued operations (0.046) (0.024)
From profit for the year (0.005) (0.004)
The notes on pages 9 to 53 form an integral part of these financial statements.
The parent company statement of comprehensive income is presented as a separate schedule attached to the
consolidated financial statements.
Report of the Auditors is set forth on page 1 and 2.

5
RENAISSANCE SERVICES SAOG AND ITS SUBSIDIARY COMPANIES
CONSOLIDATED STATEMENT OF FINANCIAL POSITION
AS AT 31 DECEMBER 2012
2012 2011
Note RO’000 RO’000
ASSETS
Non-current assets
Property, plant and equipment 8 456,386 454,838
Intangible assets 9 33,536 38,871
Other long term receivables 14 8,424 -
Investments 11 322 1,919
Deferred tax asset 7 1,835 1,255
500,503 496,883
Current assets
Financial assets at fair value through profit or loss 16 16
Inventories and work-in-progress 13 10,377 8,991
Trade and other receivables 14 81,065 110,453
Cash and bank balances 15 27,853 37,354
119,311 156,814
Assets of disposal group classified as held-for-sale 16 28,381 -
147,692 156,814
Total assets 648,195 653,697
EQUITY
Equity attributable to owners of the parent
Share capital 17 28,209 28,209
Share premium 17 19,496 19,496
Treasury shares 17 (1,704) (1,704)
Legal reserve 17 10,530 10,771
Subordinated loan reserve 17 11,429 5,714
Retained earnings 98,831 105,746
Hedging reserve 17 (815) (1,859)
Exchange reserve 17 222 121
166,198 166,494
Non-controlling interests 28,740 26,673
Total equity 194,938 193,167
LIABILITIES
Non-current liabilities
Term loans 18 268,745 286,886
Mandatory convertible bonds 19 28,466 -
Non-current payables and advances 20 8,268 10,368
Staff terminal benefits 21 5,539 6,657
311,018 303,911
Current liabilities
Trade and other payables 22 57,465 74,516
Bank borrowings 15 & 23 5,332 8,245
Term loans 18 57,689 73,858
120,486 156,619
Liabilities of disposal group classified as held-for-sale 16 21,753 -
142,239 156,619
Total liabilities 453,257 460,530
Total equity and liabilities 648,195 653,697
Net assets per share (RO) 24 0.621 0.622
The financial statements on pages 3 to 53 were authorised for issue in accordance with a resolution of the Board of Directors
on 26 February 2013
…………………. ……………..
Chairman Director
The parent company statement of financial position is presented as a separate schedule attached to the
consolidated financial statements.
Report of the Auditors is set forth on page 1 and 2.
RENAISSANCE SERVICES SAOG AND ITS SUBSIDIARY COMPANIES
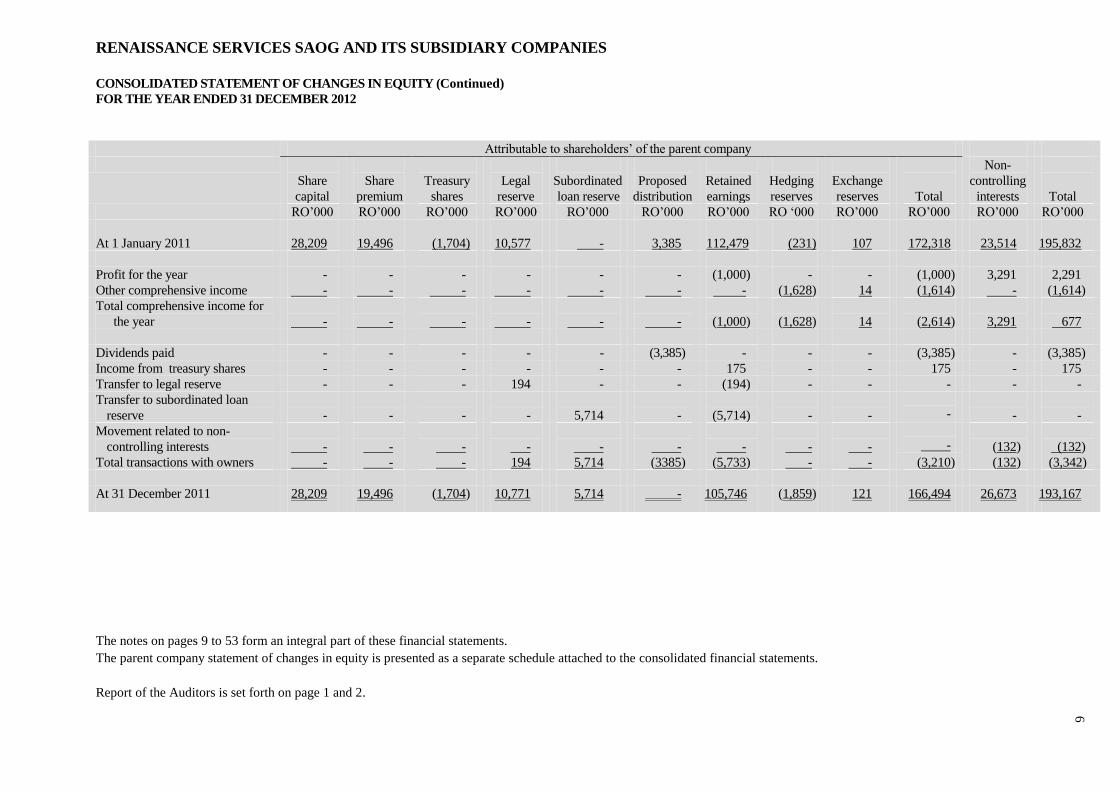
CONSOLIDATED STATEMENT OF CHANGES IN EQUITY (Continued)
FOR THE YEAR ENDED 31 DECEMBER 2012
6
Attributable to shareholders’ of the parent company
Share
capital
Share
premium
Treasury
shares
Legal
reserve
Subordinated
loan reserve
Proposed
distribution
Retained
earnings
Hedging
reserves
Exchange
reserves
Total
Non-
controlling
interests
Total
RO’000 RO’000 RO’000 RO’000 RO’000 RO’000 RO’000 RO ‘000 RO’000 RO’000 RO’000 RO’000
At 1 January 2011 28,209 19,496 (1,704) 10,577 - 3,385 112,479 (231) 107 172,318 23,514 195,832
Profit for the year - - - - - - (1,000) - - (1,000) 3,291 2,291
Other comprehensive income - - - - - - - (1,628) 14 (1,614) - (1,614)
Total comprehensive income for
the year
-
-
-
-
-
-
(1,000)
(1,628)
14
(2,614)
3,291
677
Dividends paid - - - - - (3,385) - - - (3,385) - (3,385)
Income from treasury shares - - - - - - 175 - - 175 - 175
Transfer to legal reserve - - - 194 - - (194) - - - - -
Transfer to subordinated loan
reserve
-
-
-
-
5,714
-
(5,714)
-
-
-
-
-
Movement related to non-
controlling interests
-
-
-
-
-
-
-
-
-
-
(132)
(132)
Total transactions with owners - - - 194 5,714 (3385) (5,733) - - (3,210) (132) (3,342)
At 31 December 2011 28,209 19,496 (1,704) 10,771 5,714 - 105,746 (1,859) 121 166,494 26,673 193,167
The notes on pages 9 to 53 form an integral part of these financial statements.
The parent company statement of changes in equity is presented as a separate schedule attached to the consolidated financial statements.
Report of the Auditors is set forth on page 1 and 2.
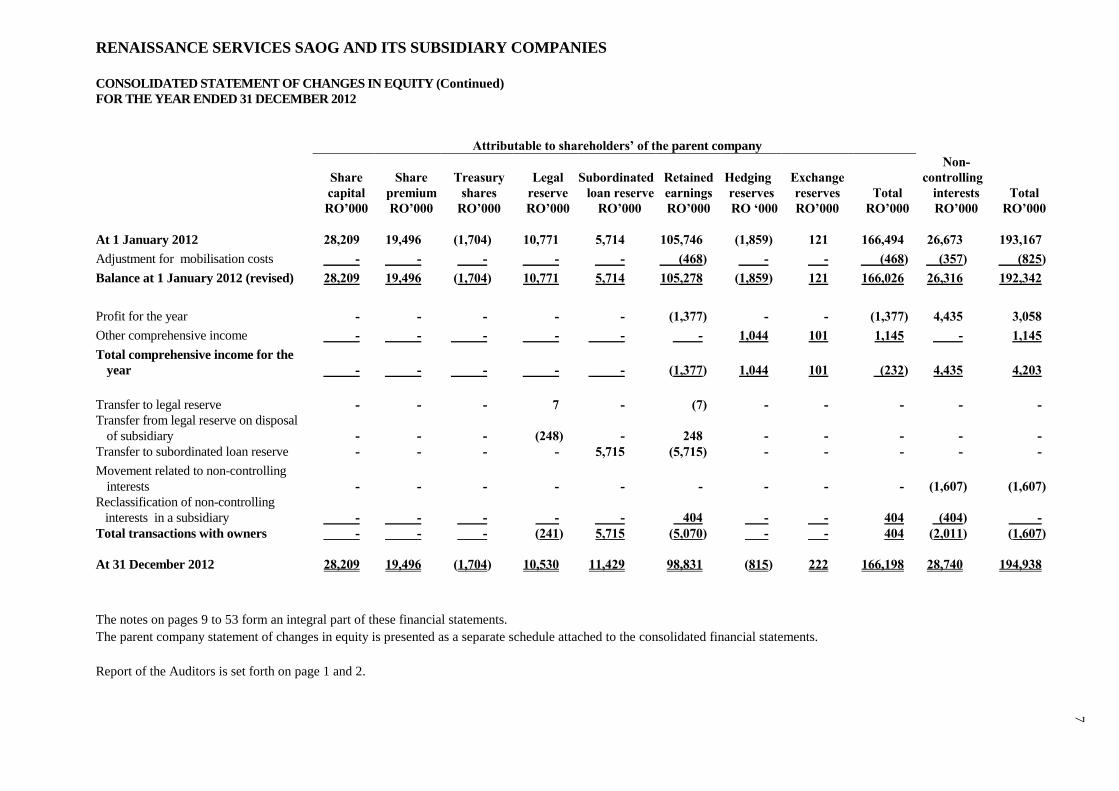
RENAISSANCE SERVICES SAOG AND ITS SUBSIDIARY COMPANIES
CONSOLIDATED STATEMENT OF CHANGES IN EQUITY (Continued)
FOR THE YEAR ENDED 31 DECEMBER 2012
7
Attributable to shareholders’ of the parent company
Share
capital
Share
premium
Treasury
shares
Legal
reserve
Subordinated
loan reserve
Retained
earnings
Hedging
reserves
Exchange
reserves
Total
Non-
controlling
interests
Total
RO’000 RO’000 RO’000 RO’000 RO’000 RO’000 RO ‘000 RO’000 RO’000 RO’000 RO’000
At 1 January 2012 28,209 19,496 (1,704) 10,771 5,714 105,746 (1,859) 121 166,494 26,673 193,167
Adjustment for mobilisation costs - - - - - (468) - - (468) (357) (825)
Balance at 1 January 2012 (revised) 28,209 19,496 (1,704) 10,771 5,714 105,278 (1,859) 121 166,026 26,316 192,342
Profit for the year - - - - - (1,377) - - (1,377) 4,435 3,058
Other comprehensive income - - - - - - 1,044 101 1,145 - 1,145
Total comprehensive income for the
year
-
-
-
-
-
(1,377)
1,044
101
(232)
4,435
4,203
Transfer to legal reserve - - - 7 - (7) - - - - -
Transfer from legal reserve on disposal
of subsidiary
-
-
-
(248)
-
248
-
-
-
-
-
Transfer to subordinated loan reserve - - - - 5,715 (5,715) - - - - -
Movement related to non-controlling
interests
-
-
-
-
-
-
-
-
-
(1,607)
(1,607)
Reclassification of non-controlling
interests in a subsidiary
-
-
-
-
-
404
-
-
404
(404)
-
Total transactions with owners - - - (241) 5,715 (5,070) - - 404 (2,011) (1,607)
At 31 December 2012 28,209 19,496 (1,704) 10,530 11,429 98,831 (815) 222 166,198 28,740 194,938
The notes on pages 9 to 53 form an integral part of these financial statements.
The parent company statement of changes in equity is presented as a separate schedule attached to the consolidated financial statements.
Report of the Auditors is set forth on page 1 and 2.

8
RENAISSANCE SERVICES SAOG AND ITS SUBSIDIARY COMPANIES
CONSOLIDATED STATEMENT OF CASH FLOWS
FOR THE YEAR ENDED 31 DECEMBER 2012
2012 2011
Note RO’000 RO’000
OPERATING ACTIVITIES
Cash receipts from customers 304,030 261,019
Cash paid to suppliers and employees (240,843) (217,924)
Cash generated from operations 63,187 43,095
Net finance costs (22,007) (19,142)
Income tax paid (7,368) (4,669)
Net cash generated from operating activities 33,812 19,284
INVESTING ACTIVITIES
Acquisition of property, plant and equipment (44,453) (82,588)
Acquisition of intangible assets (94) (49)
Investment in an associate - (76)
Proceeds from divestment of a subsidiary 7,794 -
Dividends received 23 198
Net cash used in investing activities (36,730) (82,515)
FINANCING ACTIVITIES
Net (payment)/receipt of term loans (26,876) 75,928
Net receipt from mandatory convertible bonds 28,466 -
Net movement in related party balances (184) 977
Cash dividends paid - (3,385)
Funds paid to non-controlling interests (2,271) (132)
Net cash (used in)/generated from financing activities (865) 73,388
(Decrease)/increase in cash and cash equivalents (3,783) 10,157
Cash and cash equivalents at the beginning of the year 29,109 18,952
Cash and cash equivalents at the end of the year 15 25,326 29,109
Cash and cash equivalents comprise the following:
Cash and bank balances 27,853 37,354
Bank borrowings (5,332) (8,245)
Cash at bank classified as assets held-for-sale 2,981 -
Bank borrowings classified as liabilities held-for-sale (176) -
25,326 29,109
The notes on pages 9 to 53 form an integral part of these financial statements.
The parent company statement of cash flows is presented as a separate schedule attached to the consolidated
financial statements.
Report of the Auditors is set forth on page 1 and 2.
RENAISSANCE SERVICES SAOG AND ITS SUBSIDIARY COMPANIES 9
NOTES TO THE CONSOLIDATED FINANCIAL STATEMENTS
FOR THE YEAR ENDED 31 DECEMBER 2012
1 Legal status and principal activities
Renaissance Services SAOG (the parent company) is incorporated in the Sultanate of Oman as a public joint
stock company. The business activities of Renaissance Services SAOG and its subsidiary companies (together
referred to as the Group) include investments in companies and properties, providing solutions in offshore
support vessel fleet, ship building, purchase and sales of vessels, afloat ship repair, fabrication and maintenance
for the oil & gas and energy services sectors, a leading turnkey contract services provider providing facilities
management, facilities establishment, contract catering, operations and maintenance services, provision of
training services, media publishing, advertising and distribution, manufacturing, general trading and related
activities.
2 Summary of significant accounting policies
2.1 Basis of preparation
(a) The consolidated financial statements have been prepared in accordance with International Financial
Reporting Standards (IFRS) and applicable requirements of the Commercial Companies Law of 1974 and the
disclosure requirements of the Capital Market Authority (CMA).
(b) These financial statements have been prepared in Rial Omani (RO) rounded to the nearest thousand, unless
otherwise stated.
(c) Items included in the financial statements of each of the Group’s entities are measured using the currency
of the primary economic envoirment in which the entity operates (the functional currency). The consolidated
financial statements are presented in Rial Omani (RO), which is the Group’s presentation currency.
(d) The consolidated financial statements are prepared under the historical cost convention modified to include
the measurement at fair value of the following assets:
- Financial assets at fair value through profit or loss;
- Available-for-sale investments; and
- Derivative financial instruments.
(e) The preparation of financial statements in conformity with IFRS requires the use of certain critical
accounting estimates. It also requires management to exercise its judgement in the process of applying the
Group’s accounting policies. The areas involving a higher degree of judgement or complexity, or areas where
assumptions and estimates are significant to the consolidated financial statements are disclosed in note 4.
(f) Standards and amendments effective in 2012 and relevant for the company’s operations:
For the year ended 31 December 2012, the Group has adopted all of the new and revised standards and
interpretations issued by the International Accounting Standards Board (IASB) and the International Financial
Reporting Interpretations Committee (IFRIC) of the IASB that are relevant to its operations and effective for
periods beginning on 1 January 2012.
The adoption of these standards and interpretations has not resulted in material changes to the Group’s
accounting policies and has not affected the amounts reported for the current year.
(g) Standards, amendments and interpretations to existing standards that are not yet effective and have not been
early adopted by the Group:
A number of new standards, amendments and interpretations to existing standards have been published and are
mandatory for the annual accounting periods beginning on or after 1 January 2013 or later periods, but the
Group has not early adopted them. None of these is expected to have a significant effect on the consolidated
financial statements of the Group, except the following set out below:
IAS 1 (Amendments), ‘Presentation of financial statements’, (effective on or after 1 January 2013);
IAS 19 (Amendments), ‘Employee benefits’, (effective on or after 1 January 2013);
IFRS 1 (Amendments), ‘First time adoption’, (effective on or after 1 January2 013);

RENAISSANCE SERVICES SAOG AND ITS SUBSIDIARY COMPANIES 10
NOTES TO THE CONSOLIDATED FINANCIAL STATEMENTS
FOR THE YEAR ENDED 31 DECEMBER 2012
2 Summary of significant accounting policies (continued)
2.1 Basis of preparation (continued)
IFRS 7 (Amendments), ‘Financial instruments: Disclosures’, (effective on or after 1 January 2013);
IFRS 9, (Amendments), ‘Financial instruments’, (effective on or after 1 January 2015);
IFRS 10, ‘Consolidated financial statements’ (effective on or after 1 January 2013);
IFRS 11, ‘Joint arrangements’ (effective on or after 1 January 2013);
IFRS 12, ‘Disclosures of interests in other entities’ (effective on or after 1 January 2013); and
IFRS 13, ‘Fair value measurement’ (effective on or after 1 January 2013).
IAS 27 (Revised 2011), ‘Separate financial statements’ (effective on or after 1 January 2013).
IAS 28 (Revised 2011), ‘Associates and joint ventures’ (effective on or after 1 January 2013).
IAS 32 (Amendments), ‘Financial instruments: Presentation’ (effective on or after 1 January 2014).
2.2 Basis of consolidation
Subsidiaries
Subsidiaries are entities controlled by the Group. Control exists when the Group has the power, directly or
indirectly, to govern the financial and operating policies of an entity so as to obtain benefits from its activities. In
assessing control, potential voting rights that currently are exercisable are taken into account. The financial
statements of subsidiaries are included in the consolidated financial statements from the date that control
commences until the date that control ceases. Losses applicable to the non-controlling interest in a subsidiary are
attributed to the non-controlling interests even if this results in the non-controlling interests having a deficit
balance.
Upon loss of control the Group derecognises the assets and liabilities of the subsidiary, any non-controlling
interests and the other components of equity related to the subsidiary. Any surplus or deficit arising on the loss
of control is recognised in the statement of comprehensive income. If the Group retains any interest in the
previous subsidiary, then such interest is measured at fair value at the date that the control is lost. Subsequently,
it is accounted for as equity accounted investee or as an available for sale financial asset depending on the level
of influence retained.
Special purpose entities (SPEs) are consolidated if, based on the evaluation of the substance of the relationship
of the entity with the Group and the SPEs risks and rewards, the Group concludes that it controls the SPEs.
The financial statements of the subsidiaries are prepared for the same reporting year as the parent company,
using consistent accounting policies.
Associates
Associates are entities over which the Group has significant influence but not control, generally accompanying a
shareholding of between 20% and 50% of the voting rights. Investments in associates are accounted for using the
equity method of accounting and are initially recognised at cost. The Group’s investment in associates (net of
any accumulated impairment loss) includes goodwill identified on acquisition, if any.
The Group’s share of its associates’ post-acquisition profits or losses is recognised in the consolidated statement
of comprehensive income, and its share of post-acquisition movements in reserves is recognised in equity. The
cumulative post-acquisition movements are adjusted against the carrying amount of the investment. When the
Group’s share of losses in an associate equals or exceeds its interest in the associate, including any other
unsecured receivables, the Group does not recognise further losses, unless it has incurred obligations or made
payments on behalf of the associate.
Unrealised gains on transactions between the Group and its associates are eliminated to the extent of the Group’s
interest in the associates. Unrealised losses are also eliminated, unless the transaction provides evidence of an
impairment of the asset transferred.
RENAISSANCE SERVICES SAOG AND ITS SUBSIDIARY COMPANIES 11
NOTES TO THE CONSOLIDATED FINANCIAL STATEMENTS
FOR THE YEAR ENDED 31 DECEMBER 2012
2 Summary of significant accounting policies (continued)
2.2 Basis of consolidation (continued)
Investments in jointly controlled entities
Jointly controlled entities are those entities in which the Group has joint control, established by contractual
agreement and requiring unanimous consent for strategic financial and operating decisions. Investments in the
jointly controlled entities are accounted for under the proportionate consolidation method whereby the Group
accounts for its share of the assets and liabilities, income and expenses in the jointly controlled entity.
Jointly controlled operations
A jointly controlled operation is a joint venture carried on by each venturer using its own assets in pursuit of the
joint operations. The consolidated financial statements include the assets that the Group controls and the
liabilities that it incurs in the course of pursuing the joint operation and the expenses that the Group incurs and
its share of the income that it earns from the joint operation.
Transactions eliminated on consolidation
Intra-group balances and transactions, and any unrealised gains arising from intra-group transactions, are
eliminated in preparing the consolidated financial statements. Unrealised gains arising from transactions with
associates are eliminated to the extent of the Group's interest in the entity, against the investment in the associate.
Unrealised losses are eliminated in the same way as unrealised gains, but only to the extent that there is no
evidence of impairment.
Accounting for business combinations
The Group applies the acquisition method to account for business combinations. The consideration transferred
for the acquisition of a subsidiary is the fair value of the assets transferred, the liabilities incurred to the former
owners of the acquiree and the equity interests issued by the group. The consideration transferred includes the
fair value of any asset or liability resulting from a contingent consideration arrangement. Identifiable assets
acquired and liabilities and contingent liabilities assumed in a business combination are measured initially at
their fair values at the acquisition date. The Group recognises any non-controlling interest in the acquiree on an
acquisition-by-acquisition basis, either at fair value or at the non-controlling interest’s proportionate share of the
recognised amounts of acquiree’s identifiable net assets.
Acquisition-related costs are expensed as incurred.
If the business combination is achieved in stages, the acquisition date carrying value of the acquirer’s previously
held equity interest in the acquiree is re-measured to fair value at the acquisition date; any gains or losses arising
from such re measurement are recognised in profit or loss.
Any contingent consideration to be transferred by the Group is recognised at fair value at the acquisition date.
Subsequent changes to the fair value of the contingent consideration that is deemed to be an asset or liability is
recognised in accordance with IAS 39 either in profit or loss or as a change to other comprehensive income.
Contingent consideration that is classified as equity is not re-measured, and its subsequent settlement is
accounted for within equity.
Goodwill is initially measured as the excess of the aggregate of the consideration transferred and the fair value of
non-controlling interest over the net identifiable assets acquired and liabilities assumed. If this consideration is
lower than the fair value of the net assets of the subsidiary acquired, the difference is recognised in profit or loss.
RENAISSANCE SERVICES SAOG AND ITS SUBSIDIARY COMPANIES 12
NOTES TO THE CONSOLIDATED FINANCIAL STATEMENTS
FOR THE YEAR ENDED 31 DECEMBER 2012
2 Summary of significant accounting policies (continued)
2.2 Basis of consolidation (continued)
Disposal of subsidiaries
When the Group ceases to have control any retained interest in the entity is remeasured to its fair value at the
date when control is ceased, with the change in carrying amount recognised in profit or loss. The fair value is the
initial carrying amount for the purposes of subsequently accounting for the retained interest as an associate, joint
venture or financial asset. In addition, any amounts previously recognised in other comprehensive income in
respect of that entity are accounted for as if the Group had directly disposed of the related assets or liabilities.
This may mean that amounts previously recognised in other comprehensive income are reclassified to profit or
loss.
Non-controlling interests
Non-controlling interests represent the portion of profit or loss and net assets not held by the Group and are
presented in the statement of comprehensive income and within equity in the consolidated statement of financial
position, separately from parent shareholders’ equity. Acquisition of non-controlling interests is accounted for as
transactions with owners in their capacity as owners and therefore no goodwill is recognised as a result of such
transactions. The adjustments to non-controlling interests arising from transactions that do not involve the loss of
control are based in a proportionate amount of net assets of the subsidiary.
2.3 Revenue recognition
(a) Marine charter
Revenue comprises operating lease rent from charter of marine vessels, mobilisation income, and revenue from
provision of on-board accommodation, catering services and sale of fuel and other consumables.
Lease rent income is recognised on a straight line basis over the period of the lease. Revenue from provision of
on-board accommodation and catering services is recognised over the period of hire of such accommodation
while revenue from sale of fuel and other consumables is recognised when delivered. Income generated from the
mobilisation or demobilisation of the vessel to or from the location of charter under the vessel charter agreement
is recognised when the mobilisation or demobilisation service has been rendered.
(b) Ship building, ship repair and oil and gas engineering services
Revenue comprises amounts derived from ship repair, provision of mechanical, electrical and instrumentation
services, fabrication and maintenance services, turbocharger services and marine boiler repairs. Revenue is
recognised under the percentage of completion method and is stated net of discounts and allowances. Percentage
of completion is determined by reference to the proportion that accumulated costs up to the period end bear to
the estimated total costs of the contract. Cost includes all expenditure directly related to specific projects and an
allocation of fixed and variable overheads incurred in the Group’s contractual activities. Where the outcome of a
contract can be assessed with reasonable certainty, a prudent estimate of attributable profit is recognised in the
statement of comprehensive income. Full provision is immediately made for all known or expected losses on
individual contracts, when such losses are foreseen. Revenue arising from contract variations and claims is not
accounted for unless it is probable that the customer will approve the variations/claims and the amount of
revenue arising from the variations/claims can be measured reliably.
(c) Goods sold and services rendered
Revenue from the sale of goods is recognised in the statement of comprehensive income when the significant
risks and rewards of ownership have been transferred to the buyer i.e. delivery of goods, acceptance by the
customer and the amount of revenue can be measured reliably.
Revenue from services rendered is recognised in the statement of comprehensive income in proportion to the
stage of completion of the transaction in the accounting period in which the services are rendered and the right to
receive the consideration is established. No revenue is recognised if there are significant uncertainties regarding
the recovery of the consideration due, associated costs or the possible return of goods.

RENAISSANCE SERVICES SAOG AND ITS SUBSIDIARY COMPANIES 13
NOTES TO THE CONSOLIDATED FINANCIAL STATEMENTS
FOR THE YEAR ENDED 31 DECEMBER 2012
2 Summary of significant accounting policies (continued)
2.3 Revenue recognition (continued)
(d) Maintenance contracts
Income from maintenance contracts is recognised in the statement of comprehensive income on a straight line
basis evenly over the term of the contract.
(e) Commission income
Commission income is recognised when the amount is notified to the Group entities by the principal.
(f) Dividend income
Dividend income is recognised in the statement of comprehensive income on the date that the right to receive
dividend is established.
(g) Sale of vessels
Revenue from sale of vessels is recognised in the statement of comprehensive income when pervasive evidence
exists, usually in the form of an executed sales agreement, that significant risks and rewards of ownership have
been transferred to the buyer, recovery of the consideration is probable, the associated costs and possible return
of goods can be estimated reliably, there is no continuing management involvement with the vessel and the
amount of revenue can be measured reliably.
(h) Tuition fee
Revenue from tuition fee represents the fee value of courses conducted during the year, net of provisions for
drop outs. Fees are billed at different stages of the course; however, income is accrued evenly over the duration
of each course. No revenue is recognised if there are significant uncertainties regarding recovery of the
consideration due or associated losses.
(f) Others
Sale of operating assets and other miscellaneous income like insurance claims, provision write back and other
income are shown as part of revenue and recognised when the right to receive is established.
2.4 Earnings per share
The Group presents basic and diluted earnings per share data for its ordinary shares. Basic earnings per share is
calculated by dividing the profit or loss attributable to ordinary shareholders of the parent company by the
weighted average number of ordinary shares outstanding during the year, adjusted for own shares held. Diluted
earnings per share is calculated by adjusting weighted average number of ordinary shares outstanding to assume
conversion of all dilutive potential ordinary shares.
2.5 Property, plant and equipment
Owned assets
Items of property, plant and equipment are stated at cost or revalued amounts less accumulated depreciation and
impairment losses, if any. Cost of marine vessels includes purchase price paid to third party including
registration and legal documentation costs, all directly attributable costs incurred to bring the vessel into working
condition at the area of planned use, mobilisation costs to the operating location, sea trial costs, significant
rebuild expenditure incurred during the life of the asset and financing costs incurred during the construction
period of vessels. In certain operating locations where the time taken for mobilisation is significant and the
customer pays a mobilisation fee, certain mobilisation costs are charged to profit or loss. Costs for other items of
property, plant and equipments include expenditure that is directly attributable to the acquisition of the asset.
When parts of an item of property, plant and equipment have different useful lives, they are accounted for as
separate items of property, plant and equipment.
RENAISSANCE SERVICES SAOG AND ITS SUBSIDIARY COMPANIES 14
NOTES TO THE CONSOLIDATED FINANCIAL STATEMENTS
FOR THE YEAR ENDED 31 DECEMBER 2012
2 Summary of significant accounting policies (continued)
2.5 Property, plant and equipment (continued)
Subsequent to initial recognition certain assets are carried at revalued amount, being their fair value at the date of
the revaluation less any subsequent accumulated depreciation. The revaluation of these assets is carried out at
regular intervals on an open-market basis to ensure that the carrying amount does not differ materially from the
fair value. Surplus arising on revaluation is recorded in other comprehensive income and presented in the
revaluation reserve in equity.
Subsequent expenditure
Expenditure incurred to replace a component of an item of property, plant and equipment that is accounted for
separately, including major inspection and overhaul expenditure is capitalised. Other subsequent expenditure is
capitalised only when it increases the future economic benefits embodied in property, plant and equipment. All
other expenditure is recognised in the statement of comprehensive income as an expense as incurred.
Depreciation
Depreciation is charged to the statement of comprehensive income on a straight line basis over the estimated
useful lives of items of property, plant and equipment. The estimated useful lives are as follows:
Years
Buildings and improvements 5 - 25
Furniture and fixtures 3 - 5
Plant, machinery and office equipment 1 - 15
Marine vessels revalued (from the date of latest revaluation) 10
Marine vessels and boats acquired 15 - 30
Jetty and land development 25
Floating dock 25
Motor vehicles 3
Freehold land is not depreciated. The cost of certain assets used on specific contracts is depreciated to estimated
residual value over the period of the respective contract, including extensions if any. Depreciation method,
useful lives and residual values are reviewed at each reporting date.
Vessels that are no longer being chartered and are held-for-sale are transferred to inventories at their carrying
value.
Capital work-in-progress
Capital work-in-progress is stated at cost and comprises all costs directly attributable to bringing the assets under
construction ready for their intended use. Capital work-in-progress is transferred to property, plant and equipment
at cost on completion. No depreciation is charged on capital work-in-progress.
2.6 Dry docking costs
The expenditure incurred on vessel dry docking, a component of property, plant and equipment, is amortised over
the period from the date of dry docking, to the date on which the management estimates that the next dry docking is
due.
2.7 Vessel refurbishment costs
Leased assets
Costs incurred in advance of charter to refurbish vessels under long term charter agreements are capitalised
within property, plant and equipment in line with the use of the refurbished vessel. Where there is an obligation
to incur future restoration costs under charter agreements which would not meet the criteria for capitalisation
within property, plant and equipment, the costs are accrued over the period to the next vessel re-fit to match the
use of the vessel and the period over which the economic benefits of its use are realised.
RENAISSANCE SERVICES SAOG AND ITS SUBSIDIARY COMPANIES 15
NOTES TO THE CONSOLIDATED FINANCIAL STATEMENTS
FOR THE YEAR ENDED 31 DECEMBER 2012
2 Summary of significant accounting policies (continued)
2.7 Vessel refurbishment costs (continued)
Owned assets
Cost incurred to refurbish owned assets are capitalised within property, plant and equipment and then depreciated
over the shorter of the estimated economic life of the related refurbishment or the remaining life of the vessel.
2.8 Goodwill
Goodwill that arises with acquisition of subsidiaries is presented within intangible assets. Goodwill is initially
measured at the fair value of consideration transferred plus the recognised amount of any non-controlling interest
in the acquiree plus, if the business combination is achieved in stages, the fair value of pre-existing equity interest
in the acquiree less the net recognised amount (generally fair value) of the identifiable assets acquired and
liabilities assumed. Any negative goodwill is immediately recognised in profit or loss. Following initial
recognition, goodwill is measured at cost less any accumulated impairment losses. Goodwill is reviewed for
impairment, annually, or more frequently if events or changes in circumstances indicate that the carrying value
may be impaired.
For the purpose of impairment testing, goodwill acquired in a business combination is, from the acquisition date,
allocated to each of the Group’s cash-generating units, or Groups of cash-generating units, that are expected to
benefit from the synergies of the combination, irrespective of whether other assets and liabilities of the Group are
assigned to those units or Groups of units. Each unit or group of units to which the goodwill is so allocated:
represents the lowest level within the Group at which the goodwill is monitored for internal management
purposes; and
is not larger than a segment based on the Group’s operating segment format determined in accordance
with IFRS 8 - Operating Segments.
Impairment is determined by assessing the recoverable amount of the cash-generating unit (group of cash-generating
units), to which the goodwill relates. Where the recoverable amount of the cash-generating unit (group of cash-
generating units) is less than the carrying amount, an impairment loss is recognised. Where goodwill forms part of a
cash-generating unit (group of cash-generating units) and part of the operation within that unit is disposed of, the
goodwill associated with the operation disposed of is included in the carrying amount of the operation when
determining the gain or loss on disposal of the operation. Goodwill disposed of in this circumstance is measured
based on the relative values of the operation disposed of and the portion of the cash-generating unit retained.
2.9 Intangible assets
Intangible assets acquired separately are measured on initial recognition at cost. The cost of intangible assets
acquired in a business combination is their fair value as at the date of acquisition. Following initial recognition,
intangible assets are carried at cost less any accumulated amortisation and any accumulated impairment losses. The
useful lives of intangible assets are assessed to be finite.
Intangible assets with finite lives are amortised over the useful economic life and assessed for impairment whenever
there is an indication that the intangible asset may be impaired. The amortisation period and the amortisation method
for an intangible asset with a finite useful life are reviewed at least at each financial year-end. Changes in the
expected useful life or the expected pattern of consumption of future economic benefits embodied in the asset is
accounted for by changing the amortisation period or method, as appropriate, and treated as changes in accounting
estimates. The amortisation expense on intangible assets with finite lives is recognised in the statement of
comprehensive income in the expense category consistent with the function of the intangible asset.

RENAISSANCE SERVICES SAOG AND ITS SUBSIDIARY COMPANIES 16
NOTES TO THE CONSOLIDATED FINANCIAL STATEMENTS
FOR THE YEAR ENDED 31 DECEMBER 2012
2 Summary of significant accounting policies (continued)
2.10 Financial assets
2.10.1 Classification
The Group classifies its financial assets in the following categories: at fair value through profit or loss, loans and
receivables, and available for sale. The classification depends on the purpose for which the financial assets were
acquired. Management determines the classification of its financial assets at initial recognition.
(a) Financial assets at fair value through profit or loss
Financial assets at fair value through profit or loss are financial assets held for trading. A financial asset is
classified in this category if acquired principally for the purpose of selling in the short term. Derivatives are also
categorised as held for trading unless they are designated as hedges. Assets in this category are classified as
current assets if expected to be settled within twelve months, otherwise they are classified as non-current.
(b) Loans and receivables
Loans and receivables are non-derivative financial assets with fixed or determinable payments that are not quoted
in an active market. They are included in current assets, except for maturities greater than 12 months after the end
of the reporting period. These are classified as non-current assets. The Group’s loans and receivables comprise
‘trade and other receivables’ and ‘cash and cash equivalents’ in the statement of financial position (notes 2.14 and
2.15).
(c) Available-for-sale financial assets
Available-for-sale financial assets are non-derivatives that are either designated in this category or not classified
in any of the other categories. They are included in non-current assets unless the investment matures or
management intends to dispose of it within twelve months of the end of the reporting period.
2.10.2 Recognition and measurement
Regular purchases and sales of financial assets are recognised on the trade-date – the date on which the Group
commits to purchase or sell the asset. Investments are initially recognised at fair value plus transaction costs for
all financial assets not carried at fair value through profit or loss. Financial assets carried at fair value through
profit or loss are initially recognised at fair value, and transaction costs are expensed in the consolidated
statement of comprehensive income. Financial assets are derecognised when the rights to receive cash flows
from the investments have expired or have been transferred and the Group has transferred substantially all risks
and rewards of ownership. Available-for-sale financial assets and financial assets at fair value through profit or
loss are subsequently carried at fair value. Loans and receivables are subsequently carried at amortised cost
using the effective interest method.
Gains or losses arising from changes in the fair value of the ‘financial assets at fair value through profit or loss’
category are presented in the consolidated statement of comprehensive income in the period in which they arise.
Dividend income from financial assets at fair value through profit or loss is recognised in the consolidated
statement of comprehensive income as part of other income when the Group’s right to receive payments is
established.
Changes in the fair value of monetary and non-monetary securities classified as available for sale are recognised
in other comprehensive income.
When securities classified as available for sale are sold or impaired, the accumulated fair value adjustments
recognised in equity are included in the statement of comprehensive income as ‘gains and losses from investment
securities’.
Interest on available-for-sale securities calculated using the effective interest method is recognised in the
statement of comprehensive income as part of finance income. Dividends on available-for-sale equity
instruments are recognised in the statement of comprehensive income as part of other income when the Group’s
right to receive payments is established.

RENAISSANCE SERVICES SAOG AND ITS SUBSIDIARY COMPANIES 17
NOTES TO THE CONSOLIDATED FINANCIAL STATEMENTS
FOR THE YEAR ENDED 31 DECEMBER 2012
2 Summary of significant accounting policies (continued)
2.11 Impairment of financial assets
(a) Assets carried at amortised cost
The Group assesses at the end of each reporting period whether there is objective evidence that a financial asset
or group of financial assets are impaired. A financial asset or a group of financial assets are impaired and
impairment losses are incurred only if there is objective evidence of impairment as a result of one or more events
that occurred after the initial recognition of the asset (a ‘loss event’) and that loss event (or events) has an impact
on the estimated future cash flows of the financial asset or group of financial assets that can be reliably estimated.
Evidence of impairment may include indications that the debtors or a group of debtors are experiencing
significant financial difficulty, default or delinquency in interest or principal payments, the probability that they
will enter bankruptcy or other financial reorganisation, and where observable data indicate that there is a
measurable decrease in the estimated future cash flows, such as changes in arrears or economic conditions that
correlate with defaults.
For loans and receivables category, the amount of the loss is measured as the difference between the asset’s
carrying amount and the present value of estimated future cash flows (excluding future credit losses that have not
been incurred) discounted at the financial asset’s original effective interest rate. The carrying amount of the asset
is reduced and the amount of the loss is recognised in the consolidated statement of comprehensive income. If a
loan or held-to-maturity investment has a variable interest rate, the discount rate for measuring any impairment
loss is the current effective interest rate determined under the contract. As a practical expedient, the Group may
measure impairment on the basis of an instrument’s fair value using an observable market price.
If, in a subsequent period, the amount of the impairment loss decreases and the decrease can be related
objectively to an event occurring after the impairment was recognised (such as an improvement in the debtor’s
credit rating), the reversal of the previously recognised impairment loss is recognised in the consolidated
statement of comprehensive income.
(b) Assets classified as available-for-sale
The Group assesses at the end of each reporting period whether there is objective evidence that a financial asset
or a group of financial assets are impaired. For debt securities, the Group uses the criteria referred to in (a) above.
In the case of equity investments classified as available-for-sale, a significant or prolonged decline in the fair
value of the security below its cost is also evidence that the assets are impaired. If any such evidence exists for
available-for-sale financial assets, the cumulative loss – measured as the difference between the acquisition cost
and the current fair value, less any impairment loss on that financial asset previously recognised in profit or loss –
is removed from equity and recognised in profit or loss. Impairment losses recognised in the consolidated
statement of comprehensive income on equity instruments are not reversed through the consolidated statement of
comprehensive income. If, in a subsequent period, the fair value of a debt instrument classified as available for
sale increases and the increase can be objectively related to an event occurring after the impairment loss was
recognised in profit or loss, the impairment loss is reversed through the consolidated statement of comprehensive
income.
2.12 Impairment of non-financial assets
(a) Non-financial assets (other than goodwill)
The carrying amounts of the Group’s non-financial assets are reviewed at each reporting date to determine
whether there is any indication of impairment. If any such indication exists then the asset’s recoverable amount is
estimated. An impairment loss is recognised if the carrying amount of an asset or its cash generating unit exceeds
its recoverable amount. Impairment losses are recognised in the statement of comprehensive income.
RENAISSANCE SERVICES SAOG AND ITS SUBSIDIARY COMPANIES 18
NOTES TO THE CONSOLIDATED FINANCIAL STATEMENTS
FOR THE YEAR ENDED 31 DECEMBER 2012
2 Summary of significant accounting policies (continued)
2.12 Impairment of non-financial assets (continued)
(a) Non-financial assets (other than goodwill) (continued)
The recoverable amount of an asset or its cash generating unit is the greater of its value in use and its fair value
less costs to sell. In assessing value in use, the estimated future cash flows are discounted to their present value
using a pre-tax discount rate that reflects current market assessments of time value of money and risks specific to
the asset. For the purpose of impairment testing, assets are grouped together into the smallest group of assets that
generates cash inflows from continuing use that are largely independent of the cash inflows of other assets or
groups of assets (the cash-generating unit).
Impairment losses recognised in prior periods are assessed at each reporting date for any indications that the loss
has decreased or no longer exists. An impairment loss is reversed if there has been a change in the estimates used
to determine the recoverable amount. An impairment loss is reversed only to the extent that the asset’s carrying
amount does not exceed the carrying amount that would have been determined, net of depreciation or
amortisation, if no impairment loss had been recognised.
2.13 Inventories and work-in-progress
Inventories are valued at the lower of cost and net realisable value. Cost is determined applying the first-in, first-
out and the weighted average methods and includes all costs incurred in acquiring and bringing them to their
present location and condition. Net realisable value signifies the estimated selling price in the ordinary course of
business, less estimated costs of completion and selling expenses.
Construction contracts in progress represent the gross unbilled amount expected to be collected from customers
for contract work performed to date. It is measured at cost plus profit recognised to date less progress billings and
recognised losses. Cost includes all expenditure related directly to specific projects and an allocation of fixed and
variable overheads incurred in the Group’s contract activities based on normal operating capacity.
Construction contracts in progress are presented as part of current assets for all contracts in which costs incurred
plus recognised profits exceed progress billings. If progress billings exceed costs incurred plus recognised profits,
then the difference is presented as billings in excess of valuation in the current liabilities.
2.14 Trade and other receivables
Trade receivables are recognised initially at fair value and subsequently measured at amortised cost using the
effective interest rate method, less provision for impairment. A provision for impairment of trade receivables is
established when there is objective evidence that the company will not be able to collect all amounts due
according to the original terms of receivables. Significant financial difficulties of the debtor, probability that the
debtor will enter bankruptcy or financial reorganisation, and default or delinquency in payments are considered
indicators that the trade receivable is impaired.
2.15 Cash and cash equivalents
Cash and cash equivalents comprise cash at hand, bank balances and short-term deposits with an original
maturity of three months or less.
Bank borrowings that are repayable on demand and form an integral part of the Group's cash management are
included as a component of cash and cash equivalents for the purpose of the statement of cash flows.
2.16 Share capital
Ordinary shares
Ordinary shares are classified as equity. Incremental costs directly attributable to the issue of ordinary shares are
recognised as a deduction from equity, net of any tax effects.
RENAISSANCE SERVICES SAOG AND ITS SUBSIDIARY COMPANIES 19
NOTES TO THE CONSOLIDATED FINANCIAL STATEMENTS
FOR THE YEAR ENDED 31 DECEMBER 2012
2 Summary of significant accounting policies (continued)
2.16 Share capital (continued)
Treasury shares
Own equity instruments which are reacquired (treasury shares) are deducted from equity. No gain or loss is
recognised in statement of comprehensive income on the purchase, sale, issue or cancellation of the
Group’s own equity instruments. Any gain or loss or income related to these shares are directly transferred to
retained earnings and shown in the statement of changes in equity.
2.17 Trade and other payables
Liabilities are recognised for amounts to be paid in the future for goods or services received, whether billed by
the supplier or not.
2.18 Non-current assets classified held-for-sale
Non-current assets (or disposal groups) are classified as assets held-for-sale when their carrying amount is to be
recovered principally through a sale transaction and a sale is considered highly probable. They are stated at the
lower of carrying amount and their fair value less costs to sell.
2.19 Discontinued operations
A discontinued operation is a component of an entity that either has been disposed of, or is classified as held for
sale, and, represents a separate major line of business or geographical area of operations, is part of a single
co-ordinated plan to dispose of a separate major line of business or geographical area of operations or is a
subsidiary acquired exclusively with a view to resale. Results of discontinued operations are presented separately
in the statement of comprehensive income.
2.20 Interest bearing borrowings
Interest bearing borrowings are recognised initially at the fair value of the consideration received less directly
attributable transaction costs. Subsequent to initial recognition interest bearing borrowings are stated at
amortised cost with any difference between cost and redemption value being recognised in the statement of
comprehensive income over the period of the borrowings on an effective interest basis.
2.21 Provisions
A provision is recognised in the statement of financial position when the Group has a legal or constructive
obligation as a result of a past event, and it is probable that an outflow of economic benefit will be required to
settle the obligation. If the effect is material, provisions are determined by discounting the expected future cash
flows at a pre-tax rate that reflects current market assessments of the time value of money and, where
appropriate, the risks specific to the liabilities.
2.22 Onerous contracts
A provision for onerous contracts is recognised when the expected benefits to be derived by the Group from a
contract are lower than the unavoidable costs of meeting its obligations under the contract. The provision is
measured at the present value of the lower of the expected cost of terminating the contract and the expected net
cost of continuing with the contract. Before a provision is established, the Group recognises any impairment loss
on the assets associated with that contract.

RENAISSANCE SERVICES SAOG AND ITS SUBSIDIARY COMPANIES 20
NOTES TO THE CONSOLIDATED FINANCIAL STATEMENTS
FOR THE YEAR ENDED 31 DECEMBER 2012
2 Summary of significant accounting policies (continued)
2.23 Leases
Group as a lessee
Finance leases, which transfer to the Group substantially all the risks and benefits incidental to ownership of the
leased item, are capitalised at the inception of the lease at the fair value of the leased asset or, if lower, at the present
value of the minimum lease payments. Lease payments are apportioned between the finance charges and reduction
of the lease liability so as to achieve a constant rate of interest on the remaining balance of the liability. Finance
charges are charged directly to the statement of comprehensive income.
Capitalised leased assets are depreciated over the estimated useful life of the asset or the lease term, whichever is
less.
Leases where the lessor retains substantially all the risks and benefits of ownership of the asset are classified as
operating leases. Operating lease payments are recognised as an expense in the statement of comprehensive income
on a straight-line basis over the lease term.
Group as a lessor
Leases where the group retains substantially all the risks and benefits of ownership of the asset are classified as
operating leases.
Finance leases, which transfer from the group substantially all of the risks and rewards incidental to ownership of
the leased item, are released as a disposal of asset at the inception of the lease and are presented as receivables
under a finance lease at an amount equal to the net investment in the finance lease.
Lease receivables are apportioned between the finance income and reductions of the receivables under a finance
lease so as to achieve a constant periodic rate of return on the lessor’s net investment in the finance lease.
Finance income earned is recognised in the consolidated statement of comprehensive income.
Lease receivables due within one year are disclosed as current assets.
2.24 Employee benefits
Contributions to a defined contribution retirement plan for Omani employees, in accordance with the Oman
social insurance scheme, are recognised as an expense in the statement of comprehensive income as incurred.
End of service benefits are accrued in accordance with the terms of employment of the Group’s employees at the
balance sheet date, having regard to the requirements of the Oman Labour Law 2003, as amended. Employee
entitlements to annual leave and leave passage are recognised when they accrue to employees and an accrual is
made for the estimated liability arising as a result of services rendered by employees up to the reporting date.
These accruals are included in current liabilities, while that relating to end of service benefits is disclosed as a
non-current liability. The entitlement to these benefits is based upon the employees’ salary and length of service,
subject to completion of a minimum service period. The expected costs of these benefits are accrued over the
period of employment.
For non-Omani companies the end of service benefits are provided as per the respective regulations in their
country.
2.25 Dividends distribution
Dividends are recognised as a liability in the year in which the dividends are approved by the company’s
shareholders.
RENAISSANCE SERVICES SAOG AND ITS SUBSIDIARY COMPANIES 21
NOTES TO THE CONSOLIDATED FINANCIAL STATEMENTS
FOR THE YEAR ENDED 31 DECEMBER 2012
2 Summary of significant accounting policies (continued)
2.26 Directors’ remuneration
The Board of Directors’ remuneration of the parent company is accrued within the limits specified by the Capital
Market Authority and the requirements of the Commercial Companies Law of the Sultanate of Oman.
2.27 Term loans
Term loans are carried on the statement of financial position at the fair value of the consideration received less
directly attributable transaction costs. Installments due within one year are shown as a current liability. Interest
expense is accrued on a time-proportion basis with unpaid amounts included in accounts payable and accruals.
2.28 Interest expense and income
Interest expense on borrowings is calculated using the effective interest rate method. Financing costs are
recognised as an expense in the statement of comprehensive income in the period in which they are incurred.
Borrowing costs comprise interest payable on borrowings. Borrowing costs directly attributable to the
acquisition, construction or production of qualifying assets, which are assets that necessarily take a substantial
period of time to get ready for their intended use or sale, are added to the cost of those assets, until such time as
the assets are substantially ready for their intended use or sale. Investment income earned on the temporary
investment of specific borrowings pending their expenditure on qualifying assets is deducted from the cost of
those assets. All other borrowing costs are recognised as an expense in the year in which they are incurred.
Interest income is recognised in the statement of comprehensive income as it accrues, taking into account the
effective yield on the asset.
2.29 Segment reporting
An operating segment is the component of the Group that engages in business activities from which it may earn
revenues and incur expenses, including revenue and expenses that relate to transaction with any of the Group’s
other components, whose operating results are reviewed regularly by the Group CEO (being the chief operating
decision maker) to make decisions about resources allocated to each segment and assess its performance, and for
which discrete financial information is available.
Segment results that are reported to the Group CEO include items directly attributable to a segment as well as
those that can be allocated on a reasonable basis. Unallocated items comprise mainly corporate assets and head
office expenses.
Segment capital expenditure is the total cost incurred during the year to acquire property, plant and equipment,
and intangible assets other than goodwill.
2.30 Income tax
Income tax is provided for in accordance with the fiscal regulations of the country in which the Group operates.
Income tax on the profit or loss for the year comprises current and deferred taxation. Income tax is recognised in
the statement of comprehensive income except to the extent that it relates to items recognised directly in the
equity or other comprehensive income.
Current tax is the expected tax payable on the taxable income for the year, using tax rates enacted or
substantially enacted at the reporting date, and any adjustment to tax payable in respect of previous years.
Deferred tax is provided using the liability method, providing for temporary differences between the carrying
amounts of assets and liabilities for financial reporting purposes and the amounts used for income tax purposes.
Deferred tax is calculated on the basis of the tax rates that are expected to apply to the year when the asset is
realised or the liability is settled based on tax rates (and tax laws) that have been enacted or substantially enacted
by the reporting date. The tax effects on the temporary differences are disclosed under non-current liabilities as
deferred tax.

RENAISSANCE SERVICES SAOG AND ITS SUBSIDIARY COMPANIES 22
NOTES TO THE CONSOLIDATED FINANCIAL STATEMENTS
FOR THE YEAR ENDED 31 DECEMBER 2012
2 Summary of significant accounting policies (continued)
2.30 Income tax (continued)
A deferred tax asset is recognised only to the extent that it is probable that future taxable profits will be available
against which the unused tax losses and credits can be utilised. The carrying amount of deferred tax assets is
reviewed at reporting date and reduced to the extent that it is no longer probable that the related tax benefit will
be realised.
Deferred tax assets and liabilities are offset if there is a legally enforceable right to offset current tax assets and
liabilities and they relate to income taxes levied by the same tax authority on the same taxable entity, or on
different taxable entities, but they intend to settle current tax assets and liabilities on a net basis or their tax assets
and liabilities will be realised simultaneously.
In determining the amount of current and deferred tax, the Group takes into account the impact of uncertain tax
positions and whether additional taxes and interest may be due. The assessment regarding adequacy of tax
liability for open tax year relies on estimates and assumptions and may involve a series of judgments about
future events. New information may become available that causes the Group to change its judgment regarding
the adequacy of existing tax liabilities; such changes to tax liabilities will impact tax expense in the period that
such a determination is made.
2.31 Foreign currency
Transactions denominated in foreign currencies are translated to the respective functional currencies of the
Group entities at exchange rates ruling at the dates of the transactions. Monetary assets and liabilities
denominated in foreign currencies at the reporting date are retranslated to the functional currency at the
exchange rate ruling at that date. The foreign currency gain or loss on monetary items is the difference between
amortised cost in functional currency at the beginning of the year, adjusted for effective interest and payments
during the year and the amortised cost in foreign currency translated at the exchange rate at the end of the year.
Non-monetary assets and liabilities denominated in foreign currencies that are measured at fair value are
retranslated to the functional currency at the exchange rate at the date that the fair value was determined. Non-
monetary items in a foreign currency that are measured based on historical cost are translated using the exchange
rate at the date of the transaction.
Foreign currency differences arising on retranslation are recognised in profit or loss except for differences
arising in retranslation of a financial liability designated as a hedge of the net investment in a foreign operation,
or qualifying cash flow hedges, to the extent these hedges are effective, which are recognised in other
comprehensive income.
2.32 Foreign operations
The assets and liabilities of foreign operations, including goodwill and fair value adjustments arising on
acquisition, are translated to Rial Omani at exchange rates at the reporting date. The income and expenses of
foreign operations are translated to Rial Omani at exchange rates at the dates of the transactions. Foreign
currency differences are recognised in other comprehensive income and are reflected in the exchange reserve in
equity. When a foreign operation is disposed of, in part or in full, the relevant amount in the exchange reserve is
transferred to statement of comprehensive income as part of the profit or loss on disposal. Foreign exchange
gains and losses arising from a monetary item receivable from or payable to a foreign operation, the settlement
of which is neither planned nor likely in the foreseeable future, are considered to form part of net investment in a
foreign operation and are recognised in other comprehensive income, and are presented within the equity in the
translation reserve.
RENAISSANCE SERVICES SAOG AND ITS SUBSIDIARY COMPANIES 23
NOTES TO THE CONSOLIDATED FINANCIAL STATEMENTS
FOR THE YEAR ENDED 31 DECEMBER 2012
2 Summary of significant accounting policies (continued)
2.33 Derivatives
Derivatives are stated at fair value.
For the purposes of hedge accounting, hedges are classified into two categories: (a) fair value hedges which
hedge the exposure to changes in the fair value of a recognised asset or liability; and (b) cash flow hedges which
hedge exposure to variability in cash flows of a recognised asset or liability or a highly probable transaction.
The Group holds derivative financial instruments to hedge its foreign currency and interest rate risk exposures.
On initial designation of the hedge, the Group formally documents the relationship between the hedging
instrument and hedged item, including the risk management objectives and strategy in undertaking the hedge
transaction, together with the methods that will be used to assess the effectiveness of the hedging relationship.
The Group makes an assessment, both at the inception of the hedge relationship as well as on an ongoing basis,
whether the hedging instruments are expected to be ‘highly effective’ in offsetting the changes in the fair value
or cash flows of the respective hedged items during the period for which the hedge is designated, and whether
the actual results of each hedge are within a range of 80-125 percent. For a cash flow hedge of a forecast
transaction, the transaction should be highly probable to occur and should present an exposure to variations in
cash flows that could ultimately affect reported profit or loss.
Derivatives are recognised initially at fair value, attributable transaction costs are recognised in profit or loss as
incurred. Subsequent to initial recognition, derivatives are measured at fair value, and changes therein are
accounted for as described below.
Cash flow hedges
When a derivative is designated as the hedging instrument in a hedge of the variability in cash flows attributable
to a particular risk associated with a recognised asset or liability or a highly probable forecast transaction that
could affect profit or loss, the effective portion of changes in the fair value of the derivative is recognised in
other comprehensive income and presented in the hedging reserve in equity. Any ineffective portion of changes
in the fair value of the derivative is recognised immediately in profit or loss.
If the hedging instrument no longer meets the criteria for hedge accounting, expires or is sold, terminated,
exercised, or the designation is revoked, then hedge accounting is discontinued prospectively. The cumulative
gain or loss previously recognised in other comprehensive income and presented in the hedging reserve in equity
remains there until the forecast transaction affects profit or loss. When the hedged item is a non-financial asset,
the amount recognised in other comprehensive income is transferred to the carrying amount of the asset when the
asset is recognised. If the forecast transaction is no longer expected to occur, then the balance in other
comprehensive income is recognised immediately in profit or loss. In other cases, the amount recognised in other
comprehensive income is transferred to profit or loss in the same period that the hedged item affects profit or
loss.
Other non-trading derivatives
When a derivative financial instrument is not designated in a hedge relationship that qualifies for hedge
accounting, all changes in its fair value are recognised immediately in profit or loss.
2.34 Determination of fair values
Certain of the Group’s accounting policies and disclosures require the determination of fair value, for both
financial and non-financial assets and liabilities. Fair values have been determined for measurement and/or
disclosure purposes based on the following methods. When applicable, further information about the
assumptions made in determining fair values is disclosed in the notes specific to the asset or liability.
RENAISSANCE SERVICES SAOG AND ITS SUBSIDIARY COMPANIES 24
NOTES TO THE CONSOLIDATED FINANCIAL STATEMENTS
FOR THE YEAR ENDED 31 DECEMBER 2012
2 Summary of significant accounting policies (continued)
2.34 Determination of fair values (continued)
Forward exchange contracts and interest rate swaps
The fair value of forward exchange contracts is based on their quoted price, if available. If a quoted price is not
available, then fair value is estimated by discounting the difference between the contractual forward price and
the current forward price for the residual maturity of the contract using a credit adjusted risk free interest rate
(based on government bonds).
The fair value of interest rate swaps is based on broker quotes. Those quotes are tested for reasonableness by
discounting estimated future cash flows based on the terms and maturity of each contract and using market
interest rates for a similar instrument at the measurement date. Fair values reflect the credit risk of the instrument
and include adjustments to take account of the credit risk of the Group entity and counterparty when appropriate.
Investments
For investments traded in organised financial markets, fair value is determined by reference to Stock Exchange
quoted market bid prices at the close of business on the statement of financial position date. (Level 1)
For unquoted investments, a reasonable estimate of the fair value is determined by reference to the market value
of a similar investment or is based on the expected discounted cash flows. Fair value cannot be reliably measured
for certain unquoted investments. Such investments are measured at cost. (Level 3)
Other interest bearing items
The fair value of interest-bearing items is estimated based on discounted cash flows using market interest rates
for items with similar terms and risk characteristics. (Level 3)
3 Financial risk management
3.1 Financial risks factors
Financial instruments carried on the statement of financial position comprise investments, other long term
receivables, trade receivables, amount due from related parties, cash in hand and at bank, term loans, bank
borrowings, trade and other payables and amount due to related parties.
The Group has exposure to the following risks from its use of financial instruments:
(i) Credit risk
(ii) Liquidity risk
(iii) Market risk
This note presents information about the Group’s exposure to each of the above risks, the Group’s objectives,
policies and processes for measuring and managing risk, and the management of capital. Further quantitative
disclosures are included throughout these financial statements.
The Board of Directors has overall responsibility for the establishment and oversight of the Group’s risk
management framework. The Group’s risk management policies are established to identify and analyse the risks
faced by the Group, to set appropriate risk limits and controls, and to monitor risks and adherence to limits. Risk
management policies and systems are reviewed regularly to reflect changes in market conditions and the
Group’s activities. The Group, through its training and management standards and procedures, aims to develop a
disciplined and constructive control environment in which all employees understand their roles and obligations.

RENAISSANCE SERVICES SAOG AND ITS SUBSIDIARY COMPANIES 25
NOTES TO THE CONSOLIDATED FINANCIAL STATEMENTS
FOR THE YEAR ENDED 31 DECEMBER 2012
3 Financial risk management (continued)
3.1 Financial risks factors (continued)
The Audit Committee oversees how management monitors compliance with the Group’s risk management
policies and procedures, and reviews the adequacy of the risk management framework in relation to the risks
faced by the Group. The Audit Committee is assisted in its oversight role by Internal Audit. Internal Audit
undertakes both regular and ad-hoc reviews of risk management controls and procedures, the results of which are
reported to the Audit Committee.
(a) Credit risk
Credit risk is the risk of financial loss to the Group if a customer or counterparty to a financial instrument fails to
meet its contractual obligations, and arises principally from the receivables from customers and investments.
The carrying amount of financial assets represents the maximum credit exposure. The maximum exposure to credit
risk at the reporting date is as below:
2012 2011
RO’000 RO’000
Other long term receivables 8,424 -
Investments (available-for-sale) 322 322
Financial assets at fair value through profit or loss 16 16
Trade receivables 63,182 77,359
Amount due from related parties 249 470
Cash and bank balances 27,853 37,354
Financial assets of disposal group classified as held-for-sale 12,663 -
112,709 115,521
The Group has a credit policy in place and exposure to credit risk is monitored on an ongoing basis. Credit
evaluations are generally performed on all customers requiring credit over specified amounts. The Group does
not require collateral in respect of financial assets.
The maximum exposure to credit risk is represented by the carrying amount of each financial asset in the
statement of financial position.
With respect to credit risk arising from the other financial assets of the Group, including cash and cash
equivalents, and derivative instruments with positive values, the Group’s exposure to credit risk arises from
default of the counterparty, with a maximum exposure equal to the carrying amount of these instruments.
(b) Liquidity risk
Liquidity risk is the risk that the Group will not be able to meet its financial obligations as they fall due. The Group’s
approach to managing liquidity is to ensure, as far as possible, that it will always have sufficient liquidity to meet its
liabilities when due, under both normal and stressed conditions, without incurring unacceptable losses or risking
damage to the Group’s reputation.
The Group limits its liquidity risk by ensuring that bank facilities are available. Short term loans and overdraft are, on
average, utilized for period of ninety days to bridge the gap between collections of receivables and settlement of
payables during the month.

RENAISSANCE SERVICES SAOG AND ITS SUBSIDIARY COMPANIES 26
NOTES TO THE CONSOLIDATED FINANCIAL STATEMENTS
FOR THE YEAR ENDED 31 DECEMBER 2012
3 Financial risk management (continued)
3.1 Financial risks factors (continued)
(b) Liquidity risk (continued)
The contractual maturities of financial liabilities, including estimated interest payments and excluding the impact of
netting agreements at statement of financial position date is as below:
31 December 2012
Carrying
amount
RO’000
Contractual
cash flows
RO’000
Upto
1 year
RO’000
1 year to
5 years
RO’000
More than
5 years
RO’000
Term loans 326,434 388,984 84,731 285,506 18,747
Non-current payable and advances 846 846 - 846 -
Bank borrowings 5,332 5,332 5,332 - -
Trade and other payables 50,065 50,065 50,065 - -
382,677 445,227 140,128 286,352 18,747
31 December 2011
Carrying
amount
RO’000
Contractual
cash flows
RO’000
Upto
1 year
RO’000
1 year to 5
years
RO’000
More than 5
years
RO’000
Term loans 360,744 434,969 111,504 284,091 39,374
Non-current payable and advances 4,485 4,485 - 4,485 -
Bank borrowings 8,245 8,245 8,245 - -
Trade and other payables 67,143 67,143 67,143 - -
440,617 514,842 186,892 288,576 39,374
(c) Market risk
Market risk is the risk that changes in market prices, such as foreign exchange rates, interest rates and equity prices
will affect the Group’s income or the value of its holdings of financial instruments. The objective of market risk
management is to manage and control market risk exposures within acceptable parameters, while optimising the
return on risk.
The Group also enters into derivative transactions, primarily interest rate swaps and forward currency contracts. The
purpose is to manage the interest rate and currency risks arising from the Group’s operations and its sources of
finance.
(i) Foreign exchange risk
Trade accounts payable include amount due in foreign currencies, mainly US Dollars, Euros, Pounds Sterling, UAE
Dirham and Norwegian Kroner.
At 31 December 2012, if the Rial Omani (RO) has weakened/strengthened by 5% against foreign currencies, with
all other variables held constant, the table below indicates the Group’s foreign exchange exposure on the profit or
loss (due to the fair value of currency sensitive monetary assets and liabilities).

RENAISSANCE SERVICES SAOG AND ITS SUBSIDIARY COMPANIES 27
NOTES TO THE CONSOLIDATED FINANCIAL STATEMENTS
FOR THE YEAR ENDED 31 DECEMBER 2012
3 Financial risk management (continued)
3.1 Financial risks factors (continued)
(c) Market risk (continued)
(i) Foreign exchange risk (continued)
Effect on profit before tax
Increase/decrease in respective
Currency rate to the RO ‘000
2012 +/- 5%
Euro (EUR) 12
Azerbaijan Manat (MNT) 10
UK Pound (GBP) 37
Norwegian Kroner (NOK) 3
Japanese Yen (JPY) 21
Singapore Dollars (SGD) 12
Effect on profit before tax
Increase/decrease in respective
Currency rate to the RO ‘000
2011 +/- 5%
Euro (EUR) 22
Azerbaijan Manat (MNT) 11
Kazakhstan Tenge (KZT) 7
UK Pound (GBP) 33
Norwegian Kroner (NOK) 32
Japanese Yen (JPY) 1
Singapore Dollars (SGD) 23
The Group is also marginally exposed to foreign exchange risk on sales, purchases, receivables and payables arising
primarily from GCC currencies and US Dollar exposures which are pegged to the Omani Rial.
(ii) Interest rate risk
The Group's borrowings are on fixed as well as floating interest rate basis. The Group is exposed to interest rate
risk due to fluctuation in the market interest rate of floating interest rate borrowings.
The following table demonstrates the sensitivity of the statement of comprehensive income to reasonably
possible changes in interest rates, with all other variables held constant.
The sensitivity of the profit or loss is the effect of the assumed changes in interest rates on the Group’s profit for
the year, based on the floating rate financial assets and financial liabilities held at 31 December 2012.
Increase/decrease
in basis points
Effect on profit
for the year
RO’000
2012
Borrowings converted to Rial Omani +15 240
Borrowings converted to Rial Omani -10 (160)
2011
Borrowings converted to Rial Omani +15 (265)
Borrowings converted to Rial Omani -10 177
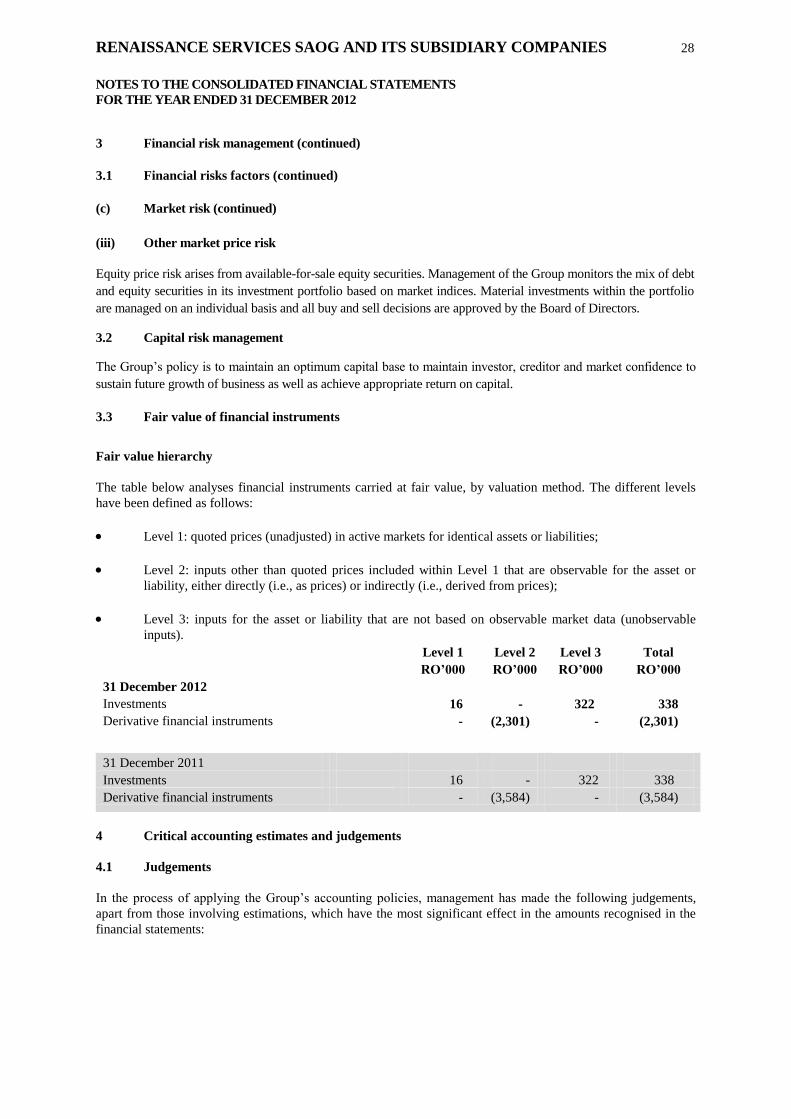
RENAISSANCE SERVICES SAOG AND ITS SUBSIDIARY COMPANIES 28
NOTES TO THE CONSOLIDATED FINANCIAL STATEMENTS
FOR THE YEAR ENDED 31 DECEMBER 2012
3 Financial risk management (continued)
3.1 Financial risks factors (continued)
(c) Market risk (continued)
(iii) Other market price risk
Equity price risk arises from available-for-sale equity securities. Management of the Group monitors the mix of debt
and equity securities in its investment portfolio based on market indices. Material investments within the portfolio
are managed on an individual basis and all buy and sell decisions are approved by the Board of Directors.
3.2 Capital risk management
The Group’s policy is to maintain an optimum capital base to maintain investor, creditor and market confidence to
sustain future growth of business as well as achieve appropriate return on capital.
3.3 Fair value of financial instruments
Fair value hierarchy
The table below analyses financial instruments carried at fair value, by valuation method. The different levels
have been defined as follows:
Level 1: quoted prices (unadjusted) in active markets for identical assets or liabilities;
Level 2: inputs other than quoted prices included within Level 1 that are observable for the asset or
liability, either directly (i.e., as prices) or indirectly (i.e., derived from prices);
Level 3: inputs for the asset or liability that are not based on observable market data (unobservable
inputs).
Level 1
RO’000
Level 2
RO’000
Level 3
RO’000
Total
RO’000
31 December 2012
Investments 16 - 322 338
Derivative financial instruments - (2,301) - (2,301)
31 December 2011
Investments 16 - 322 338
Derivative financial instruments - (3,584) - (3,584)
4 Critical accounting estimates and judgements
4.1 Judgements
In the process of applying the Group’s accounting policies, management has made the following judgements,
apart from those involving estimations, which have the most significant effect in the amounts recognised in the
financial statements:

RENAISSANCE SERVICES SAOG AND ITS SUBSIDIARY COMPANIES 29
NOTES TO THE CONSOLIDATED FINANCIAL STATEMENTS
FOR THE YEAR ENDED 31 DECEMBER 2012
4 Critical accounting estimates and judgements (continued)
4.1 Judgements (continued)
(i) Leases
Management exercises judgments in assessing whether a lease is a finance lease or an operating lease. The
judgement as to which category applies to a specific lease depends on management’s assessment of whether in
substance the risks and rewards of ownership of the assets have been transferred to the lessee. In the instances
where management estimates that the risks and rewards have been transferred, the lease is considered as a
finance lease, otherwise it is accounted for as an operating lease.
The Group's property, plant and equipment include marine crafts such as barges and other vessels of a specialist
nature capable of operating in difficult climatic conditions. Although these vessels are currently leased to a
customer under contracts which contain purchase options, the leases have been judged by management to be
operating leases.
Management have based this judgement on a number of factors that indicate that, in substance the risks and
rewards of owning these vessels remain with the group, including:
the lease periods are generally for a short term (10 years) when compared with the overall estimated
economic life (30 years or more) of the vessels;
the leases do not automatically transfer the ownership of the vessels at the end of the lease term;
the Group is responsible for regular dry-docking and insurance in addition to maintenance of the
vessels;
the customer is unlikely to want to bear the cost and responsibility of owning and maintaining these
specialised vessels and is, therefore, unlikely to exercise options to purchase;
the recent renewal by the customer of one major leasing contract for a secondary period despite the
purchase option being available to the lessee; and
the expectation that the customer would wish to renew its contracts for the leases of the vessels from the
Group due to the Group's proven track record and established support and services infrastructure in the
region of operation.
Management has reached an in-principle agreement with the customer, for the removal of the option to purchase
clauses in the contracts and are concluding formal variations to contracts, which is subject to fulfillment of
certain conditions.
(ii) Classification of investments
Management decides on acquisition of an investment whether it should be classified as, held for trading, carried
at fair value through profit and loss account, or available-for-sale.
The Group classifies investments as trading if they are acquired primarily for the purpose of making a short term
profit.
Classification of investments as fair value through profit and loss account depends on how management monitor
the performance of these investments. When they are not classified as held for trading but have readily available
reliable fair values and the changes in fair values are reported as part of statement of comprehensive income in
the management accounts, they are classified as fair value through profit and loss.
All other investments are classified as available-for-sale.
4.2 Estimates and assumptions
The preparation of financial statements requires management to make estimates and assumptions that affect the
application of accounting policies and reported amounts of assets and liabilities, income and expenses. Actual
results may differ from these estimates.

RENAISSANCE SERVICES SAOG AND ITS SUBSIDIARY COMPANIES 30
NOTES TO THE CONSOLIDATED FINANCIAL STATEMENTS
FOR THE YEAR ENDED 31 DECEMBER 2012
4 Critical accounting estimates and judgements (continued)
4.2 Estimates and assumptions (continued)
Estimates and underlying assumptions are reviewed on an ongoing basis. Revisions to accounting estimates are
recognised in the period in which the estimate is revised and in any future periods affected.
The key assumptions concerning the future and other key sources of estimation uncertainty at the statement of
financial position date, that have a significant risk of causing a material adjustment to the carrying amounts of assets
and liabilities within the next financial year are discussed below.
(a) Impairment of goodwill
The Group determines whether goodwill is impaired at least on an annual basis. This requires an estimation of the
value in use of the cash-generating units to which the goodwill is allocated. Estimating the value in use requires the
Group to make an estimate of the expected future cash flows from the cash-generating unit and also to choose a
suitable discount rate in order to calculate the present value of those cash flows. The net carrying amount of
goodwill at 31 December 2012 was RO 33.278 million (2011- RO 38.688 million).
(b) Impairment of vessels
The Group determines whether its vessels are impaired when there are indicators of impairment as defined in
IAS 36. This requires an estimation of the value in use of the cash-generating unit, which is the vessel owning
and chartering segment. Estimating the value in use requires the Group to make an estimate of the expected
future cash flows from this cash-generating unit and also to choose a suitable discount rate in order to calculate
the present value of those cash flows.
(c) Impairment of accounts receivable
An estimate of the collectible amount of trade accounts receivable is made when collection of the full amount is
no longer probable. For individually significant amounts, this estimation is performed on an individual basis.
Amounts which are not individually significant, but which are past due, are assessed collectively and a provision
applied according to the length of time past due, based on historical recovery rates.
At the statement of financial position date, gross trade accounts receivable were RO 67.131 million (2011-
RO 81.490 million) and the provision for doubtful debts was RO 3.950 million (2011 - RO 4.310 million). Any
difference between the amounts actually collected in future periods and the amounts expected will be recognised
in the statement of comprehensive income.
(d) Impairment of stock and consumables
Inventories are held at the lower of cost and net realisable value. When inventories become old or obsolete, an
estimate is made of their net realisable value. For individually significant amounts this estimation is performed
on an individual basis. Amounts which are not individually significant, but which are old or obsolete, are
assessed collectively and a provision applied according to the inventory type and the degree of ageing or
obsolescence, based on historical selling prices.
At the statement of financial position date, gross inventories were RO 7.014 million (2011 - RO 8.572 million)
with provisions for old and obsolete inventories of RO 1.281 million (2011 - RO 0.906 million). Any difference
between the amounts actually realised in future periods and the amounts expected will be recognised in the
statement of comprehensive income.
(e) Useful lives of property, plant and equipment
The useful lives, residual values and methods of depreciation of property, plant and equipment are reviewed, and
adjusted if appropriate, at each financial year end. In the review process, the Group takes guidance from recent
acquisitions, as well as market and industry trends.
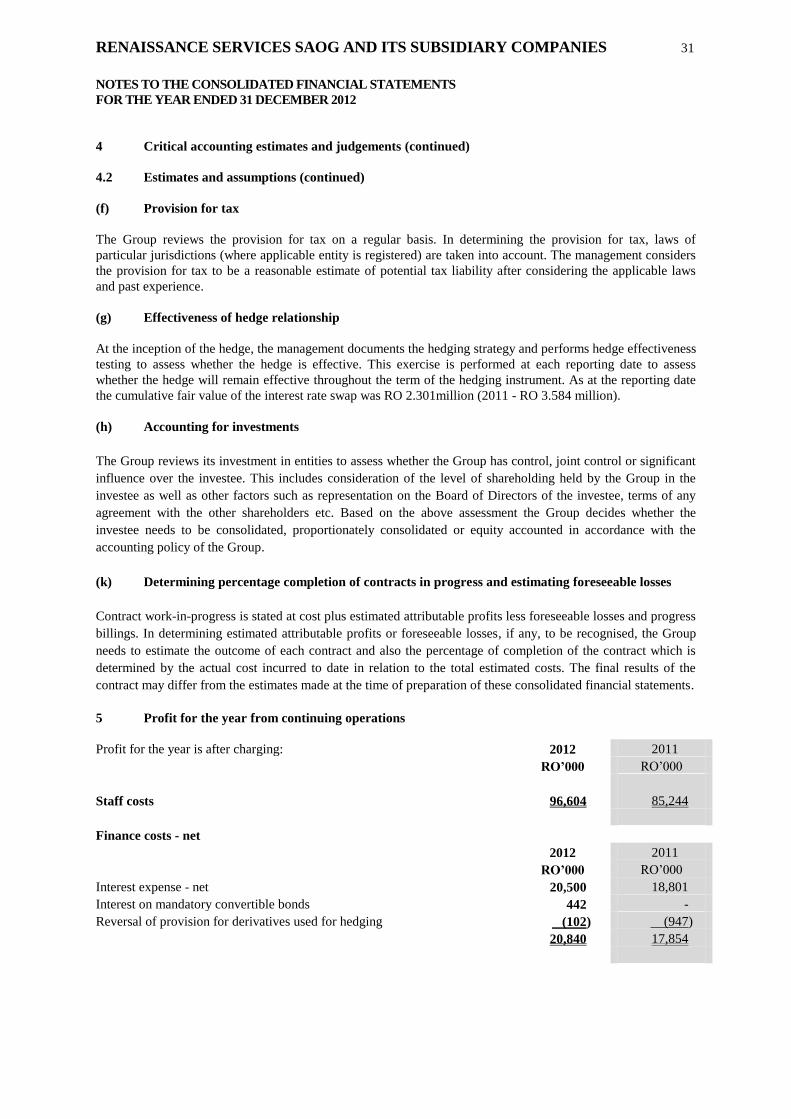
RENAISSANCE SERVICES SAOG AND ITS SUBSIDIARY COMPANIES 31
NOTES TO THE CONSOLIDATED FINANCIAL STATEMENTS
FOR THE YEAR ENDED 31 DECEMBER 2012
4 Critical accounting estimates and judgements (continued)
4.2 Estimates and assumptions (continued)
(f) Provision for tax
The Group reviews the provision for tax on a regular basis. In determining the provision for tax, laws of
particular jurisdictions (where applicable entity is registered) are taken into account. The management considers
the provision for tax to be a reasonable estimate of potential tax liability after considering the applicable laws
and past experience.
(g) Effectiveness of hedge relationship
At the inception of the hedge, the management documents the hedging strategy and performs hedge effectiveness
testing to assess whether the hedge is effective. This exercise is performed at each reporting date to assess
whether the hedge will remain effective throughout the term of the hedging instrument. As at the reporting date
the cumulative fair value of the interest rate swap was RO 2.301million (2011 - RO 3.584 million).
(h) Accounting for investments
The Group reviews its investment in entities to assess whether the Group has control, joint control or significant
influence over the investee. This includes consideration of the level of shareholding held by the Group in the
investee as well as other factors such as representation on the Board of Directors of the investee, terms of any
agreement with the other shareholders etc. Based on the above assessment the Group decides whether the
investee needs to be consolidated, proportionately consolidated or equity accounted in accordance with the
accounting policy of the Group.
(k) Determining percentage completion of contracts in progress and estimating foreseeable losses
Contract work-in-progress is stated at cost plus estimated attributable profits less foreseeable losses and progress
billings. In determining estimated attributable profits or foreseeable losses, if any, to be recognised, the Group
needs to estimate the outcome of each contract and also the percentage of completion of the contract which is
determined by the actual cost incurred to date in relation to the total estimated costs. The final results of the
contract may differ from the estimates made at the time of preparation of these consolidated financial statements.
5 Profit for the year from continuing operations
Profit for the year is after charging: 2012 2011
RO’000 RO’000
Staff costs 96,604 85,244
Finance costs - net
2012 2011
RO’000 RO’000
Interest expense - net 20,500 18,801
Interest on mandatory convertible bonds 442 -
Reversal of provision for derivatives used for hedging (102) (947)
20,840 17,854

RENAISSANCE SERVICES SAOG AND ITS SUBSIDIARY COMPANIES 32
NOTES TO THE CONSOLIDATED FINANCIAL STATEMENTS
FOR THE YEAR ENDED 31 DECEMBER 2012
6 Other non-operating expenses
Other non-operating expenses of 2011 amounting to RO 11.418 million from continuing and discontinued
operations related to exceptional expenses incurred by the group.
7 Income tax
The expense relates to tax payable on the profits earned by the Group calculated in accordance with the taxation
laws and regulations of various countries in which the Group operates.
2012 2011
RO’000 RO’000
Charge for the year 7,288 5,465
Current tax:
Current liability 7,400 7,373
Non-current liability 5,184 4,711
12,584 12,084
Deferred tax asset
1 January 1,255 448
Credited to statement of comprehensive income 580 807
31 December 1,835 1,255
The deferred tax balance at 31 December 2012 comprises capital allowances in excess of depreciation charge of
RO 1.482 million (2011 - RO 0.912 million), short term timing differences of RO 0.203 million (2011 -
RO 0.278 million) and timing differences relating to pension obligations of RO nil (2011 - RO 65,000).
The parent company and its Oman incorporated subsidiaries are subject to income tax at the rate of 12% of
taxable income in excess of RO 30,000 in accordance with the Income Tax Law of the Sultanate of Oman.
The parent company’s assessments for the tax years 2007 to 2012 have not been finalised with the Secretariat
General for Taxation at the Ministry of Finance of the Government of Sultanate of Oman.
The Group believes that its accruals for tax liabilities are adequate for all open tax years based on its assessment
of many factors, including interpretations of tax laws and prior experience.
The parent company has filed an appeal to the Tax Committee and the Courts against certain decisions of the
Department on disallowances made by the Department in the previous assessments. The main issues under the
appeals were taxation of overseas income, taxation of overseas dividend, and disallowances relating to interest
and some specific expenses.
The parent company has established provisions at 31 December 2012 against the tax liabilities, which might
arise relating to taxation of overseas income and disallowance relating to interest and some specific expenses.
As required under the tax laws, the parent company has paid the tax dues relating to those issues and is
continuing to appeal to the higher authorities.

RENAISSANCE SERVICES SAOG AND ITS SUBSIDIARY COMPANIES
NOTES TO THE CONSOLIDATED FINANCIAL STATEMENTS
FOR THE YEAR ENDED 31 DECEMBER 2012 (continued)
33
8 Property, plant and equipment
Freehold
land and
buildings
Marine
vessels
Jetty
and dock
Machinery
and
equipment
Motor
vehicles
Furniture
and fixtures
Capital
work in
progress
Total
RO’000 RO’000 RO’000 RO’000 RO’000 RO’000 RO’000 RO’000
Cost
At 1 January 2012 92,708 419,756 2,055 39,562 3,171 2,744 37,788 597,784
Transfer to current assets - (7,217) - - - - (901) (8,118)
Additions 7,404 30,959 - 2,400 343 245 10,586 51,937
Assets of disposal group classified as held-for-sale (5,316) - (2,015) (12,699) (565) - (189) (20,784)
Transfers 11,170 16,994 - 723 - - (28,887) -
Disposals and adjustments (18,947) (4,564) (40) (9,078) (651) (502) (4,408) (38,190)
At 31 December 2012 87,019 455,928 - 20,908 2,298 2,487 13,989 582,629
Depreciation
At 1 January 2012 31,547 80,932 756 25,337 2,446 1,928 - 142,946
Transfer to current assets - (6,070) - - - - - (6,070)
Charge for the year 4,104 19,969 87 4,315 393 321 - 29,189
Impairment - 847 - - - - - 847
Assets of disposal group classified as held-for-sale (2,479) - (843) (9,090) (475) - - (12,887)
Disposals and adjustments (15,741) (3,540) - (7,478) (610) (413) - (27,782)
31 December 2012 17,431 92,138 - 13,084 1,754 1,836 - 126,243
Net carrying amount
31 December 2012 69,588 363,790 - 7,824 544 651 13,989 456,386

RENAISSANCE SERVICES SAOG AND ITS SUBSIDIARY COMPANIES
NOTES TO THE CONSOLIDATED FINANCIAL STATEMENTS
FOR THE YEAR ENDED 31 DECEMBER 2012 (continued)
34
8 Property, plant and equipment (continued)
Freehold
land and
buildings
Marine
vessels
Jetty
and dock
Machinery
and
equipment
Motor
vehicles
Furniture
and fixtures
Capital
work in
progress
Total
RO’000 RO’000 RO’000 RO’000 RO’000 RO’000 RO’000 RO’000
Cost
At 1 January 2011 89,352 356,190 2,055 34,397 2,947 2,265 20,879 508,085
Transfer from current assets - 8,078 - - - - - 8,078
Additions 2,837 37,149 - 5,571 361 610 35,800 82,328
Transfers 519 18,339 - 9 24 - (18,891) -
Disposals - - - (415) (161) (131) - (707)
At 31 December 2011 92,708 419,756 2,055 39,562 3,171 2,744 37,788 597,784
Depreciation
At 1 January 2011 26,637 64,193 648 21,257 2,087 1,708 - 116,530
Charge for the year 4,910 16,739 108 4,271 509 338 - 26,875
Transfers - - - 8 (8) - - -
Disposals - - - (199) (142) (118) - (459)
At 31 December 2011 31,547 80,932 756 25,337 2,446 1,928 - 142,946
Net carrying amount
31 December 2011 61,161 338,824 1,299 14,225 725 816 37,788 454,838
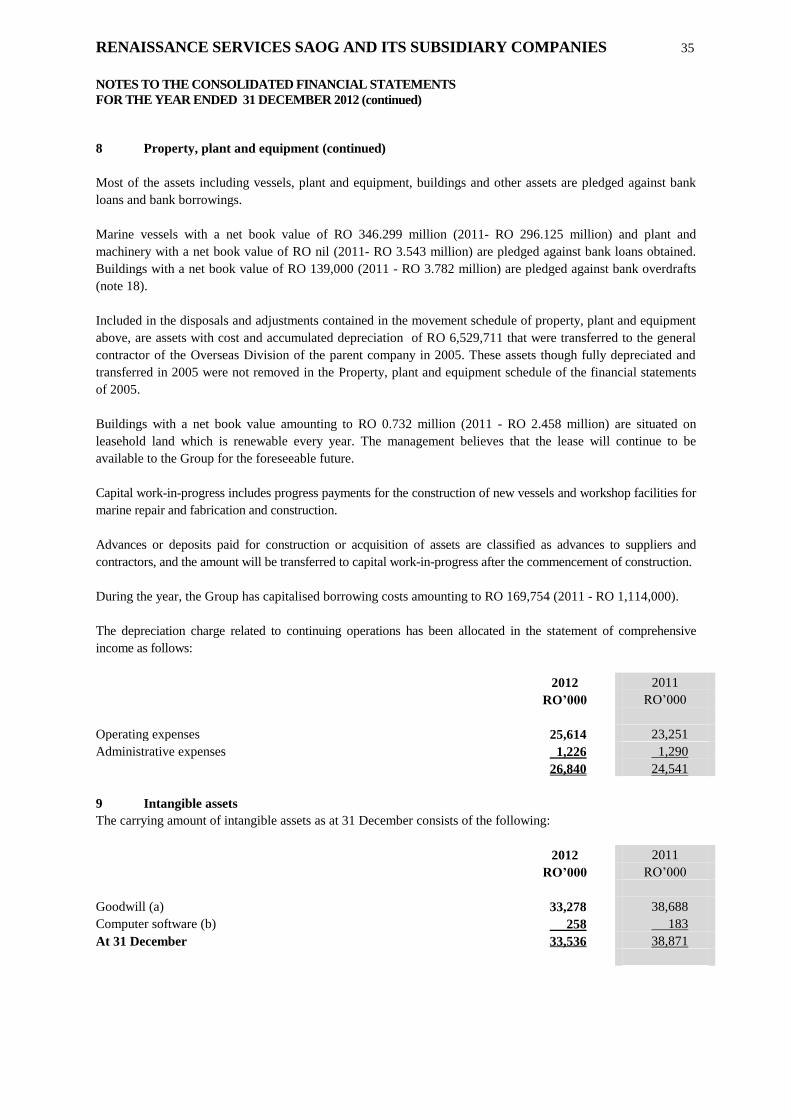
RENAISSANCE SERVICES SAOG AND ITS SUBSIDIARY COMPANIES 35
NOTES TO THE CONSOLIDATED FINANCIAL STATEMENTS
FOR THE YEAR ENDED 31 DECEMBER 2012 (continued)
35
8 Property, plant and equipment (continued)
Most of the assets including vessels, plant and equipment, buildings and other assets are pledged against bank
loans and bank borrowings.
Marine vessels with a net book value of RO 346.299 million (2011- RO 296.125 million) and plant and
machinery with a net book value of RO nil (2011- RO 3.543 million) are pledged against bank loans obtained.
Buildings with a net book value of RO 139,000 (2011 - RO 3.782 million) are pledged against bank overdrafts
(note 18).
Included in the disposals and adjustments contained in the movement schedule of property, plant and equipment
above, are assets with cost and accumulated depreciation of RO 6,529,711 that were transferred to the general
contractor of the Overseas Division of the parent company in 2005. These assets though fully depreciated and
transferred in 2005 were not removed in the Property, plant and equipment schedule of the financial statements
of 2005.
Buildings with a net book value amounting to RO 0.732 million (2011 - RO 2.458 million) are situated on
leasehold land which is renewable every year. The management believes that the lease will continue to be
available to the Group for the foreseeable future.
Capital work-in-progress includes progress payments for the construction of new vessels and workshop facilities for
marine repair and fabrication and construction.
Advances or deposits paid for construction or acquisition of assets are classified as advances to suppliers and
contractors, and the amount will be transferred to capital work-in-progress after the commencement of construction.
During the year, the Group has capitalised borrowing costs amounting to RO 169,754 (2011 - RO 1,114,000).
The depreciation charge related to continuing operations has been allocated in the statement of comprehensive
income as follows:
2012 2011
RO’000 RO’000
Operating expenses 25,614 23,251
Administrative expenses 1,226 1,290
26,840 24,541
9 Intangible assets
The carrying amount of intangible assets as at 31 December consists of the following:
2012 2011
RO’000 RO’000
Goodwill (a) 33,278 38,688
Computer software (b) 258 183
At 31 December 33,536 38,871
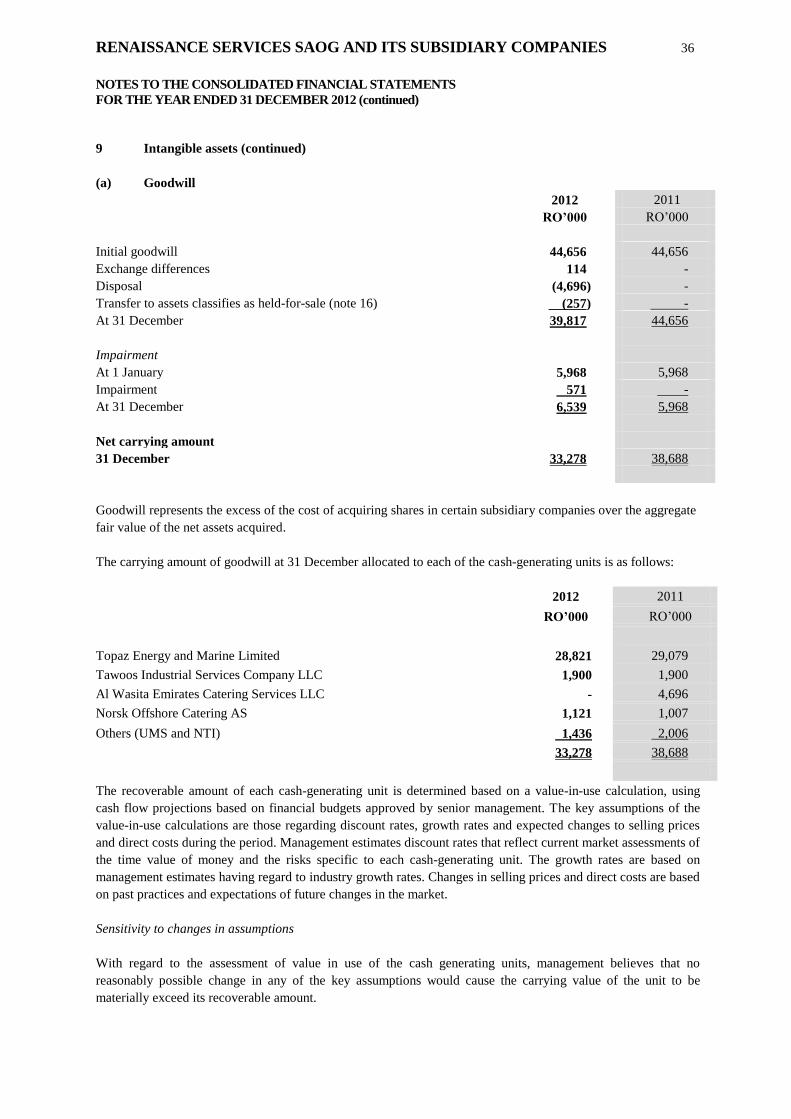
RENAISSANCE SERVICES SAOG AND ITS SUBSIDIARY COMPANIES 36
NOTES TO THE CONSOLIDATED FINANCIAL STATEMENTS
FOR THE YEAR ENDED 31 DECEMBER 2012 (continued)
9 Intangible assets (continued)
(a) Goodwill
2012 2011
RO’000 RO’000
Initial goodwill 44,656 44,656
Exchange differences 114 -
Disposal (4,696) -
Transfer to assets classifies as held-for-sale (note 16) (257) -
At 31 December 39,817 44,656
Impairment
At 1 January 5,968 5,968
Impairment 571 -
At 31 December 6,539 5,968
Net carrying amount
31 December 33,278 38,688
Goodwill represents the excess of the cost of acquiring shares in certain subsidiary companies over the aggregate
fair value of the net assets acquired.
The carrying amount of goodwill at 31 December allocated to each of the cash-generating units is as follows:
2012 2011
RO’000 RO’000
Topaz Energy and Marine Limited 28,821 29,079
Tawoos Industrial Services Company LLC 1,900 1,900
Al Wasita Emirates Catering Services LLC - 4,696
Norsk Offshore Catering AS 1,121 1,007
Others (UMS and NTI) 1,436 2,006
33,278 38,688
The recoverable amount of each cash-generating unit is determined based on a value-in-use calculation, using
cash flow projections based on financial budgets approved by senior management. The key assumptions of the
value-in-use calculations are those regarding discount rates, growth rates and expected changes to selling prices
and direct costs during the period. Management estimates discount rates that reflect current market assessments of
the time value of money and the risks specific to each cash-generating unit. The growth rates are based on
management estimates having regard to industry growth rates. Changes in selling prices and direct costs are based
on past practices and expectations of future changes in the market.
Sensitivity to changes in assumptions
With regard to the assessment of value in use of the cash generating units, management believes that no
reasonably possible change in any of the key assumptions would cause the carrying value of the unit to be
materially exceed its recoverable amount.

RENAISSANCE SERVICES SAOG AND ITS SUBSIDIARY COMPANIES 37
NOTES TO THE CONSOLIDATED FINANCIAL STATEMENTS
FOR THE YEAR ENDED 31 DECEMBER 2012 (continued)
9 Intangible assets (continued)
(a) Goodwill (continued)
For the year ended 31 December 2012, there have been no events or changes in circumstances to indicate that
the carrying values of goodwill of the above cash-generating units may be impaired. National Hospitality
Institute SAOG (NHI) incurred losses continuously and accordingly, goodwill related to NHI was impaired
amounting to RO 0.571 million.
(b) Computer software
2012 2011
RO’000 RO’000
1 January 183 167
Additions 94 49
Amortisation (19) (33)
31 December 258 183
Computer software costs represent expenditure incurred on implementing an ERP solution for the Group.
Amortisation is charged on a straight line basis over a period of five years, from the date of completion.
10 Subsidiaries and associates
(a) The Group and parent company investments in subsidiary and associate companies are as follows:
Ownership interest (%)
2012 2011
Subsidiary companies
Topaz Energy and Marine Limited (TOPAZ) (incorporated in the UAE) 100 100
Tawoos Industrial Services Company LLC (TISCO) 100 100
United Media Services Company LLC (UMS) 100 100
National Training Institute LLC (NTI) 100 100
National Hospitality Institute SAOG (NHI)
Renaissance Energy Limited (REL) (incorporated in the UAE)
46
100
46
100
Associate companies
Dubai Wire FZE (DW) (incorporated in the UAE) 37.65 37.65
Global Fasteners Limited (GFL) (incorporated in the Isle of Man) 43.50 43.50
Skills Development Training Institute LLC (previously known as National
Saudi Training Institute for Development LLC)
(incorporated in KSA)
49
49
The parent company provided a corporate guarantee to a bank to provide financing facilities and working capital
loan to DW and GFL. The corporate guarantees have been provided jointly and severally by both the parent
company and the other shareholder (refer note 27). The outstanding amount of guarantee as at
31 December 2012 was RO 5.25 million (2011 - RO 15.4 million). The Group does not anticipate material
liabilities to arise from outstanding guarantees. During the year investment in these associates was classified as
held-for-sale (refer note 16).

RENAISSANCE SERVICES SAOG AND ITS SUBSIDIARY COMPANIES 38
NOTES TO THE CONSOLIDATED FINANCIAL STATEMENTS
FOR THE YEAR ENDED 31 DECEMBER 2012 (continued)
10 Subsidiaries and associates (continued)
(b) The Group’s subsidiaries have investments in the following subsidiaries:
Ownership interests (%)
2012 2011
Subsidiary Companies of TOPAZ
Nico Middle East Limited (incorporated in Bermuda) 100 100
Topaz Holding Limited (incorporated in the UAE) 100 100
Topaz Energy and Marine Plc (incorporated in the UK) 100 100
Topaz Engineering Limited (incorporated in Bermuda) 100 100
(i) Nico Middle East Limited has a subsidiary BUE Marine Ltd, incorporated in UK, which operates
through its subsidiaries and is engaged principally in charter of marine vessels and vessel management.
(ii) In 2011 Topaz incorporated a new wholly owned subsidiary Topaz Energy and Marine Plc (Topaz
Energy) in the UK with the objective of listing Topaz in the London Stock Market and raising equity capital
from the public markets. At 31 December 2012 Topaz Energy and Marine Plc was dormant.
(c) Subsidiary Companies of TISCO Ownership interests (%)
2012 2011
Rusail Catering and Cleaning Services LLC (RCCS) 100 100
Supraco Limited (incorporated in Cyprus) 100 100
Renaissance Contract Services International LLC (RCSI) 100 100
Al Wasita Catering Services LLC (Al Wasita) 100 100
(i) Al Wasita through its subsidiary (Al Wasita Emirates Catering Services LLC) in UAE provides catering
services. In 2012, the Group disposed Al Wasita Emirates Catering Services LLC (Al Wasita Emirates). The
disposal comprises of the share sale of the company with effective disposal date of 31 March 2012 as per share
purchase agreement (“SPA”) between TISCO, Al Wasita, Yaghnam International Inc. and Ventures Cayman
Limited. Total consideration received was AED 93,831,678 equivalent to RO 9,832,621. The part of sale
proceed was receivable over the period of five years and accordingly it was fair valued at appropriate discount
rate resulting in to fair value loss of RO 314,762 which was recognised in statement of comprehensive income.
(ii) Supraco Limited through its subsidiaries in Norway provides contract catering services.
(iii) RCSI through its subsidiaries in Angola and UAE provides catering and allied services in the
respective countries. RCSI subsidiaries in Iraq, Qatar and Dubai, UAE are dormant as at 31 December 2012.

RENAISSANCE SERVICES SAOG AND ITS SUBSIDIARY COMPANIES 39
NOTES TO THE CONSOLIDATED FINANCIAL STATEMENTS
FOR THE YEAR ENDED 31 DECEMBER 2012 (continued)
10 Subsidiaries and associates (continued)
Ownership interests (%)
2012 2011
(d) Subsidiary companies of UMS
United Press and Publishing Company LLC (UPP) 100 100
Oryx Advertising Company WLL (incorporated in Qatar)
UMS International FZ LLC (incorporated in UAE
49
100
49
-
(e ) Subsidiary company of NHI
Nakshatra Hospitality India Private Limited (NHI India) (incorporated in
India)
100
100
(f) Subsidiary company of NTI
National Training Institute Qatar WLL (NTI Qatar)
(incorporated in Qatar)
100
100
As at 31 December 2012, NHI India and NTI Qatar were dormant.
Except as otherwise stated, the companies are incorporated in Oman.
11 Investments
2012 2011
RO’000 RO’000
Non-current investments
Investment in associate companies (i) (note 16) - 1,597
Available-for-sale investments (ii) 322 322
322 1,919
(i) The movement in the carrying value of the Group’s investments in associates is as follows:
2012 2011
RO’000 RO’000
1 January 1,597 1,343
Investment made during the year - 76
Reclassification from available for sale investments - 69
Share in associates’ (loss)/profits (10) 109
Investment classified as held-for-sale (note 16) 1,587 -
- 1,597
(ii) Available-for-sale investments
Available-for-sale investments represent the cost of investments in the following entities:
Ownership interest (%)
2012 2011
Fund for Development of Youth Projects SAOC 2.33 2.33
Industrial Management Technology & Contracting LLC 1.25 1.25
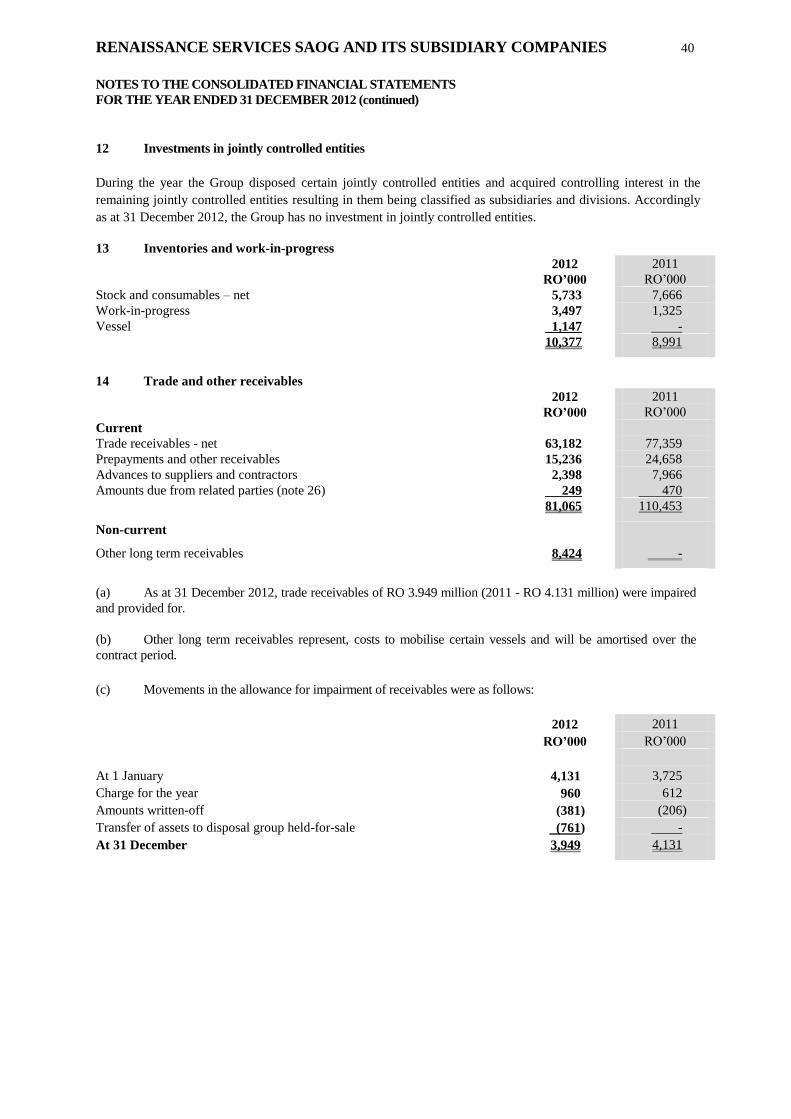
RENAISSANCE SERVICES SAOG AND ITS SUBSIDIARY COMPANIES 40
NOTES TO THE CONSOLIDATED FINANCIAL STATEMENTS
FOR THE YEAR ENDED 31 DECEMBER 2012 (continued)
12 Investments in jointly controlled entities
During the year the Group disposed certain jointly controlled entities and acquired controlling interest in the
remaining jointly controlled entities resulting in them being classified as subsidiaries and divisions. Accordingly
as at 31 December 2012, the Group has no investment in jointly controlled entities.
13 Inventories and work-in-progress
2012 2011
RO’000 RO’000
Stock and consumables – net 5,733 7,666
Work-in-progress 3,497 1,325
Vessel 1,147 -
10,377 8,991
14 Trade and other receivables
2012 2011
RO’000 RO’000
Current
Trade receivables - net 63,182 77,359
Prepayments and other receivables 15,236 24,658
Advances to suppliers and contractors 2,398 7,966
Amounts due from related parties (note 26) 249 470
81,065 110,453
Non-current
Other long term receivables 8,424 -
(a) As at 31 December 2012, trade receivables of RO 3.949 million (2011 - RO 4.131 million) were impaired
and provided for.
(b) Other long term receivables represent, costs to mobilise certain vessels and will be amortised over the
contract period.
(c) Movements in the allowance for impairment of receivables were as follows:
2012 2011
RO’000 RO’000
At 1 January 4,131 3,725
Charge for the year 960 612
Amounts written-off (381) (206)
Transfer of assets to disposal group held-for-sale (761) -
At 31 December 3,949 4,131

RENAISSANCE SERVICES SAOG AND ITS SUBSIDIARY COMPANIES 41
NOTES TO THE CONSOLIDATED FINANCIAL STATEMENTS
FOR THE YEAR ENDED 31 DECEMBER 2012 (continued)
14 Trade and other receivables (continued)
(d) As at 31 December, the ageing of unimpaired trade receivables is as follows:
Past due but not impaired
Total
RO’000
Neither past
due nor
impaired
RO’000
< 30 days
RO’000
30 – 60
days
RO’000
60 – 90
days
RO’000
90 – 120
days
RO’000
>120 days
RO’000
2012 63,182 43,766 7,824 3,205 1,995 2,354 4,038
2011 77,359 50,885 10,537 7,077 3,161 2,083 3,616
(e) Unimpaired receivables are expected, on the basis of past experience, to be fully recoverable. It is not the
practice of the Group to obtain collateral over receivables and the vast majority are, therefore, unsecured.
15 Cash and bank balances
2012 2011
RO’000 RO’000
Cash and bank balances 27,853 37,354
Bank borrowings (note 23) (5,332) (8,245)
Cash and cash equivalents 22,521 29,109
Included in cash and bank balances are fixed deposits of RO 5,201,500 (2011 - RO 17,869,000) maintained with
commercial banks. These are denominated mainly in Rial Omani, US Dollar, and UAE Dirham are short-term in
nature.
16 Non-current assets held for sale and discontinued operations
2012
RO’000
Assets of disposal group (a) 26,794
Investment in associates (note 11) (b) 1,587
28,381
(a) The assets and liabilities related to Topaz Oil and Gas division (part of the Engineering segment) have
been presented as held-for-sale following the approval of the Group’s Board of Directors on 19 December 2012
to sell Adyard Abu Dhabi LLC and Nico Hydrospace Fujairah. The transaction is expected to be completed in
2013.
(i) Assets of disposal group classified as held-for-sale
2012
RO’000
Property, plant and equipment 7,905
Other intangible assets 257
Inventories 5,969
Other current assets 12,663
26,794

RENAISSANCE SERVICES SAOG AND ITS SUBSIDIARY COMPANIES 42
NOTES TO THE CONSOLIDATED FINANCIAL STATEMENTS
FOR THE YEAR ENDED 31 DECEMBER 2012 (continued)
16 Non-current assets held for sale and discontinued operations (continued)
(ii) Liabilities of disposal group classified as held-for-sale
2012
RO’000
Trade and accrued expenses 17,182
Bank overdraft and short term loans 1,937
Other non-current liabilities 2,634
21,753
(iii) Analysis of the result of discontinued operations, and the result recognised on the remeasurement of
assets or disposal group is as follows:
2012 2011
RO’000 RO’000
Revenue 44,477 45,548
Expenses (57,029) (53,596)
Loss before tax of discontinued operations (12,552) (8,048)
Tax - -
Loss after tax of discontinued operations (12,552) (8,048)
(iv) Analysis of the cash flows of discontinued operations is as follows:
2012 2011
RO’000 RO’000
Operating cash flows (4,871) (2,387)
Investing cash flows (205) (2,385)
Financing cash flows 4,858 4,286
Total cash flows (218) (486)
(b) During the year, the Group management decided to sell the investments in associate companies i.e.
Dubai Wire and Global Fastener Limited following the approval of Board on 12 August 2012. The Group
management believes that the sale transaction will be completed within one year from the date of Board
approval. Accordingly, at 31 December 2012, the investments in these associates are classified as assets held for
disposal under IFRS 5. The carrying amount of these investments as at 31 December 2012 was RO 1.587
million.
17 Capital and reserves
(a) Share capital
The authorised share capital of the Parent Company comprises 400,000,000 ordinary shares of RO 0.100 each
(2011- 400,000,000 of RO 0.100 each). At 31 December 2012, the issued and fully paid up share capital
comprised 282,094,452 ordinary shares of RO 0.100 each (2011 - 282,094,452 of RO 0.100 each).
Details of shareholders, who own 10% or more of the parent company's share capital, are as follows:
2012 2011
Number of
shares
‘000
%
Number of
shares
‘000
%
Tawoos LLC 42,538 15.08 42,538 15.08

RENAISSANCE SERVICES SAOG AND ITS SUBSIDIARY COMPANIES 43
NOTES TO THE CONSOLIDATED FINANCIAL STATEMENTS
FOR THE YEAR ENDED 31 DECEMBER 2012 (continued)
17 Capital and reserves (continued)
(b) Legal reserve
The Omani Commercial Companies Law of 1974 requires that 10% of an entity's net profit be transferred to a
non-distributable legal reserve until the amount of legal reserve becomes equal to one-third of the entity's issued
share capital. The legal reserve is not available for distribution. Legal reserve also includes transfer relating to
non-Oman registered subsidiary companies as per the respective regulations in their country of incorporation.
The parent company utilises the share premium for transfers to legal reserve. Transfers to legal reserves made
during the year relates to the legal reserves of certain subsidiaries.
(c) Treasury shares
These are shares held by certain subsidiaries in the parent company at the cost of RO 1,703,826 (2011- RO
1,703,826). Dividend received on these treasury shares have been directly transferred to retained earnings and
shown as movement in the statement of changes in equity. At 31 December 2012, the subsidiaries held
14,554,586 shares (2011- 14,554,586) in the parent company. The market value of these shares at
31 December 2012 was approximately RO 7.394 million (2011 - RO 7.932 million). Treasury shares are pledged
against a bank loan.
(d) Share premium
The Group utilises the share premium for issuing bonus shares and transfers to legal reserve. No such transfers
took place during 2012.
(e) Subordinated loan reserve
As per the subordinated loan agreement, the parent company is required to create a subordinated reserve by
transferring an amount equal to 1/7th
of the outstanding aggregate amount of loan notes out of annual profit after
tax of the parent company from 31 December 2011. In order to meet the objectives of the loan agreement, the
parent company has made a transfer of RO 5.715 millions (2011 - RO 5.714 millions) from retained earnings to
subordinated loan reserve during the year.
(f) Hedging reserve
The hedging reserve comprises the effective portion of the cumulative net change in the fair value of cash flow
hedging instruments related to hedged transactions that have not yet occurred.
(g) Exchange reserve
The exchange reserve comprises of foreign currency differences arising from the translation of the financial
statements of foreign operations.
18 Term loans
1 year 2 -5 More than
31 December 2012 Total or less Years 5 years
RO’000 RO’000 RO’000 RO’000
Parent company - term loans 117,218 24,067 79,763 13,388
Parent company - subordinated loan 40,000 - 30,000 10,000
Subsidiary companies 169,216 33,622 126,336 9,258
326,434 57,689 236,099 32,646

RENAISSANCE SERVICES SAOG AND ITS SUBSIDIARY COMPANIES 44
NOTES TO THE CONSOLIDATED FINANCIAL STATEMENTS
FOR THE YEAR ENDED 31 DECEMBER 2012 (continued)
18 Term loans (continued)
1 year 2 -5 More than
31 December 2011 Total or less Years 5 years
RO’000 RO’000 RO’000 RO’000
Parent company – term loans 140,452 25,898 99,213 15,341
Parent company - subordinated loan 40,000 - 30,000 10,000
Subsidiary companies 180,292 47,960 112,199 20,133
360,744 73,858 241,412 45,474
Included in term loans from bank are the following:
Term loans in parent company
Term loans in parent company amounting to RO 117.218 million (2011- RO 140.452 million) are secured by
charge over certain assets, investment rights on leasehold land, assignment of certain project receivables,
assignment of insurance interests in certain contract assets and guarantees.
Subordinated loan in parent company
In 2011, the parent company has raised a subordinated loan of RO 40,000,000 through an issue of subordinated
loan notes, which is secured by a second charge over the assets of the parent company and its subsidiaries. The
loan has been raised by the parent company for funding its subsidiary company, Topaz for meeting the financing
requirements of the expansion plans in Topaz’s marine and engineering businesses.
The first drawdown of RO 20,000,000 of the loan was made on 6 December 2011 and the second drawdown of
RO 20,000,000 on 28 February 2012. The tenure of the loan is 7 years with repayment of four annual installments
of RO 10,000,000 with effect from November 2014. Pursuant to the subordinated loan agreement, the parent
company is required to restrict dividends, raise additional capital and create a subordinated loan reserve by
transferring an amount equal to 1/7th
of the outstanding aggregate amount of loan notes out of annual profit after
tax of the company from 31 December 2011. The subordinated loan carries a fixed interest rate of 8.5% per
annum. During the year, the parent company has made a transfer of RO 5.715 million (2011 - RO 5.714 million)
from retained earnings to a subordinated loan reserve.
Term loans in subsidiaries
Term loans relating to Topaz
The term loans of Topaz amounting to RO 169.216 million (2011 - RO 175.554 million) are denominated either in
USD or UAE Dirham and are secured by a first preferred mortgage over certain assets of the subsidiaries, the
assignment of marine vessel insurance policies, corporate guarantees, lien on fixed deposits and the assignment of
the marine vessel charter lease income. The equipment finance loan is secured against plant and machinery
acquired with the proceeds of the loan. The property loan is secured by first preferred mortgage over the
underlying property.
The borrowing arrangements include undertakings to comply with various covenants like senior interest cover,
current ratio, debt to EBITDA ratio, gearing ratio, total assets to net worth ratio and equity ratio including an
undertaking to maintain a minimum net worth of Topaz which, at no time, shall be less than RO 115.500 million
(2011- RO 115.385 million). Term loans carry interest rates ranging from 2% to 7.5% per annum (2011- 2% to
7.5% per annum).

RENAISSANCE SERVICES SAOG AND ITS SUBSIDIARY COMPANIES 45
NOTES TO THE CONSOLIDATED FINANCIAL STATEMENTS
FOR THE YEAR ENDED 31 DECEMBER 2012 (continued)
18 Term loans (continued)
Term loans are disclosed in the statement of financial position as:
2012 2011
RO’000 RO’000
Non-current liabilities 268,745 286,886
Current liabilities 57,689 73,858
326,434 360,744
19 Mandatory convertible bonds
During the year the parent company issued 423,141,678 Mandatory Convertible Bonds (MCB) at RO 0.102 each
(including RO 2 baizas for expenses) on 26 July 2012. The Group companies subscribed 132,560,468 bonds out
of the total issue. The bonds carry a coupon rate of 3.75% per annum. The MCB shall be converted at face value
through conversion into equity shares of the parent company at the conversion price. The conversion will be
carried out in three tranches of 33.33% in third and fourth year each and 33.34% in fifth year from the issue date.
The number of outstanding MCBs shall decline upon each conversion into equity shares, so as to fully convert
all the outstanding MCBs at the end of fifth anniversary from the issue date. The conversion price shall be equal
to the average of the closing market price of the shares, as quoted on Muscat Securities Market (MSM), in the 30
days prior to the respective date of conversion, subject to adjustments including rights issue, stock dividend, split
and reverse split of shares divided by the conversion factor (1.7). The bonds are listed on MSM and classified as
liabilities in accordance with the guidance given in IAS-32 ‘Financial instrument: Presentation’.
20 Non-current payables and advances
2012 2011
RO’000 RO’000
Deferred income 2,238 1,172
Income tax payable 5,184 4,711
Other payables and advances 846 4,485
8,268 10,368
21 Staff terminal benefits
Movement in the liability recognised in the statement of financial position is as follows:
2012 2011
RO’000 RO’000
At 1 January 6,657 5,667
Accrued during the year 2,387 1,702
Reclassification from accrued expenses 76 -
Pension obligations relating to a subsidiary (228) 228
Payments during the year (1,637) (940)
Transfer to liabilities of disposal group held-for-sale (1,716) -
At 31 December 5,539 6,657
Significant amount of terminal benefits as at 31 December 2012 comprised of end of service obligations of Topaz
(2012 - RO 2,779,000; 2011 - RO 3,967,000). Principal actuarial assumptions for Topaz at the reporting date are:

RENAISSANCE SERVICES SAOG AND ITS SUBSIDIARY COMPANIES 46
NOTES TO THE CONSOLIDATED FINANCIAL STATEMENTS
FOR THE YEAR ENDED 31 DECEMBER 2012 (continued)
21 Staff terminal benefits (continued)
Normal retirement age : 60-65 years (2011- 60-65 years).
Mortality, withdrawal and retirement: 5% (2011 - 5%) turnover rate. Due to the nature of the benefit,
which is a lump sum payable on exit due to any cause, a combined single decrement rate has been
used for maturity, withdrawal and retirement.
Discount rate: 5.25% (2011 - 5.25% ) p.a.
Salary increases: 3% to 5% (2011 - 3% to 5%) p.a.
The pension scheme of one of Group’s overseas subsidiary covers a total of 349 employees (2011- 300
employees). The pension scheme gives the right to defined future benefits, which are mainly dependent on
number of years worked, salary level at time of retirement and the amount of payment from the national insurance
fund. The obligations are covered through an insurance company. The calculated pension obligations are based
on actuarial valuations.
The actuarial valuations are based on assumptions of demographical factors normally used within the insurance
industry.
22 Trade and other payables
2012 2011
RO’000 RO’000
Trade payables 19,224 25,928
Accrued expenses and other payables 30,579 40,065
Income tax payable 7,400 7,373
Amounts due to related parties (note 26) 262 1,150
57,465 74,516
23 Bank borrowings
Certain of the Group’s bank borrowings are secured by a registered first mortgage over Group’s certain assets,
guarantees and assignment of receivables. Bank borrowings carry interest rates ranging from 3% to 8% per
annum (2011 - 4% to 9% per annum).
24 Net assets per share
Net assets per share is calculated by dividing the net assets at the year end attributable to the shareholders of the
parent company by the number of shares outstanding as follows:
2012 2011
Net assets RO’000 RO’000
Net assets 194,938 193,167
Non-controlling interest (28,740) (26,673)
Net assets attributable to the shareholders of the Parent Company 166,198 166,494
Number of shares
Number of shares at 1 January (‘000) 282,094 282,094
Treasury shares (refer note 17) (‘000) (14,555) (14,555)
Number of shares at 31 December (‘000) 267,539 267,539
Net assets per share (RO) 0.621 0.622

RENAISSANCE SERVICES SAOG AND ITS SUBSIDIARY COMPANIES 47
NOTES TO THE CONSOLIDATED FINANCIAL STATEMENTS
FOR THE YEAR ENDED 31 DECEMBER 2012 (continued)
25 Earnings per share
(a) Basic
Basic earnings per share is calculated by dividing the net profits for the year attributable to the shareholders of
the parent company by the weighted average number of shares in issue during the year excluding ordinary shares
purchased by the Group and held as treasury shares as follows:
2012 2011
Net profit for the year attributable to the shareholders
of the parent company (RO‘000) from continuing operations
10,975
5,403
Net (loss) profit for the year attributable to the shareholders
of the Parent Company (RO‘000) from discontinued operations
(12,352)
(6,403)
Weighted average number of shares
Number of shares at 1 January (‘000) 282,094 282,094
Less: weighted average number of treasury shares (‘000) (14,555) (14,555)
Weighted average number of shares (‘000) 267,539 267,539
Basic earnings per share from continuing operations (expressed in Rial
Omani)
0.041
0.020
Basic loss per share from discontinued operations (expressed in Rial Omani) (0.046) (0.024)
Net loss per share for the year (0.005) (0.004)
(b) Diluted
Diluted earnings per share is calculated by dividing the net profit attributable to the ordinary shareholders of the
parent company for the period by the weighted average number of ordinary shares including dilutive potential
ordinary shares issued on the conversion of convertible bonds. The impact of potential ordinary shares is
antidilutive. Accordingly, dilutive earnings is not required to be disclosed as per the guidance given in IAS – 33
‘Earning Per Share’
26 Related parties
Related parties comprise the shareholders, directors, key management personnel and business entities in which
these related parties have the ability to control or exercise significant influence in financial and operating
decisions.
The Group has balances with these related parties which arise in the normal course of business. Outstanding
balances at year end are unsecured and settlement occurs in cash.
The Group entered into transactions in the ordinary course of business with related parties other affiliates and
parties in which certain members and senior management have a significant influence (other related parties).
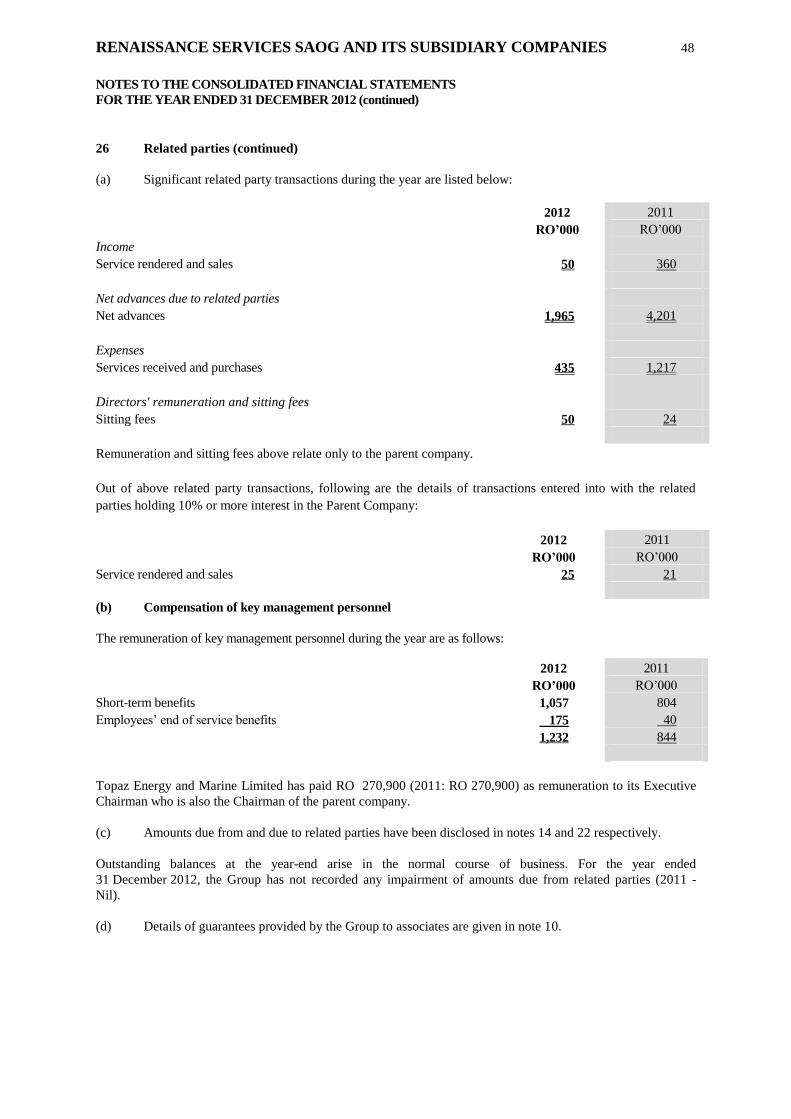
RENAISSANCE SERVICES SAOG AND ITS SUBSIDIARY COMPANIES 48
NOTES TO THE CONSOLIDATED FINANCIAL STATEMENTS
FOR THE YEAR ENDED 31 DECEMBER 2012 (continued)
26 Related parties (continued)
(a) Significant related party transactions during the year are listed below:
2012 2011
RO’000 RO’000
Income
Service rendered and sales 50 360
Net advances due to related parties
Net advances 1,965 4,201
Expenses
Services received and purchases 435 1,217
Directors' remuneration and sitting fees
Sitting fees 50 24
Remuneration and sitting fees above relate only to the parent company.
Out of above related party transactions, following are the details of transactions entered into with the related
parties holding 10% or more interest in the Parent Company:
2012 2011
RO’000 RO’000
Service rendered and sales 25 21
(b) Compensation of key management personnel
The remuneration of key management personnel during the year are as follows:
2012 2011
RO’000 RO’000
Short-term benefits 1,057 804
Employees’ end of service benefits 175 40
1,232 844
Topaz Energy and Marine Limited has paid RO 270,900 (2011: RO 270,900) as remuneration to its Executive
Chairman who is also the Chairman of the parent company.
(c) Amounts due from and due to related parties have been disclosed in notes 14 and 22 respectively.
Outstanding balances at the year-end arise in the normal course of business. For the year ended
31 December 2012, the Group has not recorded any impairment of amounts due from related parties (2011 -
Nil).
(d) Details of guarantees provided by the Group to associates are given in note 10.
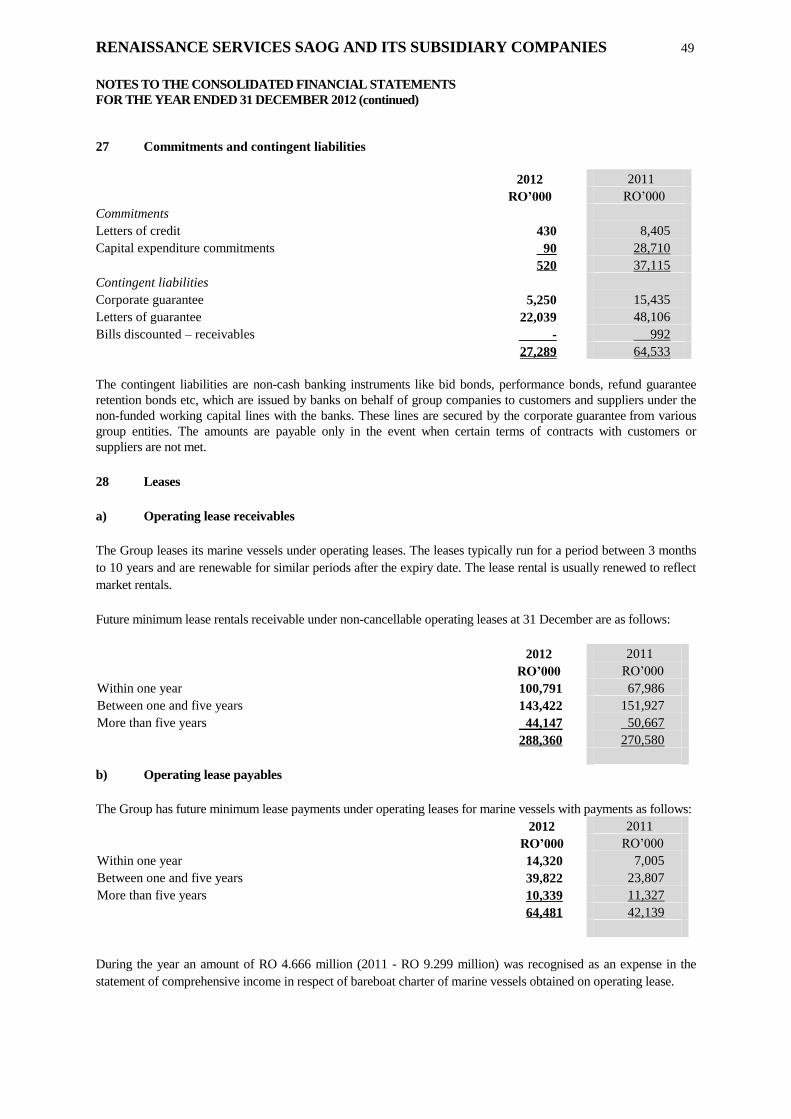
RENAISSANCE SERVICES SAOG AND ITS SUBSIDIARY COMPANIES 49
NOTES TO THE CONSOLIDATED FINANCIAL STATEMENTS
FOR THE YEAR ENDED 31 DECEMBER 2012 (continued)
27 Commitments and contingent liabilities
2012 2011
RO’000 RO’000
Commitments
Letters of credit 430 8,405
Capital expenditure commitments 90 28,710
520 37,115
Contingent liabilities
Corporate guarantee 5,250 15,435
Letters of guarantee 22,039 48,106
Bills discounted – receivables - 992
27,289 64,533
The contingent liabilities are non-cash banking instruments like bid bonds, performance bonds, refund guarantee
retention bonds etc, which are issued by banks on behalf of group companies to customers and suppliers under the
non-funded working capital lines with the banks. These lines are secured by the corporate guarantee from various
group entities. The amounts are payable only in the event when certain terms of contracts with customers or
suppliers are not met.
28 Leases
a) Operating lease receivables
The Group leases its marine vessels under operating leases. The leases typically run for a period between 3 months
to 10 years and are renewable for similar periods after the expiry date. The lease rental is usually renewed to reflect
market rentals.
Future minimum lease rentals receivable under non-cancellable operating leases at 31 December are as follows:
2012 2011
RO’000 RO’000
Within one year 100,791 67,986
Between one and five years 143,422 151,927
More than five years 44,147 50,667
288,360 270,580
b) Operating lease payables
The Group has future minimum lease payments under operating leases for marine vessels with payments as follows:
2012 2011
RO’000 RO’000
Within one year 14,320 7,005
Between one and five years 39,822 23,807
More than five years 10,339 11,327
64,481 42,139
During the year an amount of RO 4.666 million (2011 - RO 9.299 million) was recognised as an expense in the
statement of comprehensive income in respect of bareboat charter of marine vessels obtained on operating lease.
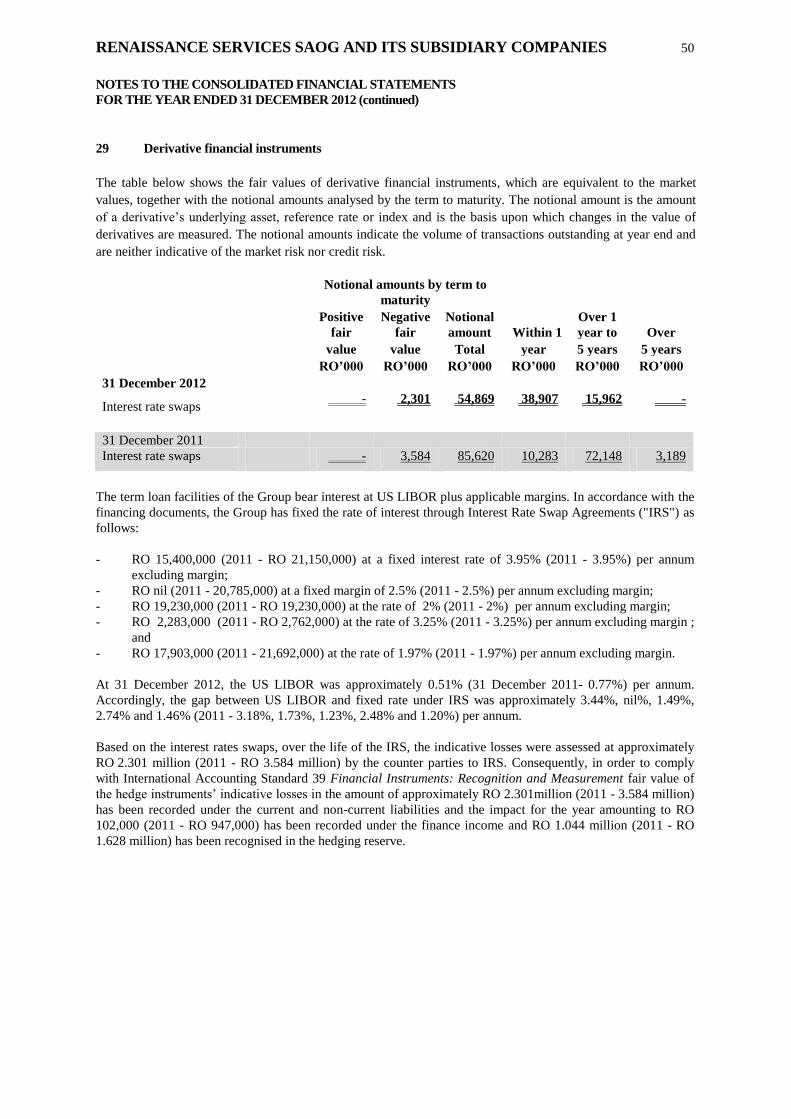
RENAISSANCE SERVICES SAOG AND ITS SUBSIDIARY COMPANIES 50
NOTES TO THE CONSOLIDATED FINANCIAL STATEMENTS
FOR THE YEAR ENDED 31 DECEMBER 2012 (continued)
29 Derivative financial instruments
The table below shows the fair values of derivative financial instruments, which are equivalent to the market
values, together with the notional amounts analysed by the term to maturity. The notional amount is the amount
of a derivative’s underlying asset, reference rate or index and is the basis upon which changes in the value of
derivatives are measured. The notional amounts indicate the volume of transactions outstanding at year end and
are neither indicative of the market risk nor credit risk.
Notional amounts by term to
maturity
Positive Negative Notional
Over 1
fair fair amount Within 1 year to Over
value value Total year 5 years 5 years
RO’000 RO’000 RO’000 RO’000 RO’000 RO’000
31 December 2012
Interest rate swaps
- 2,301 54,869 38,907 15,962 -
31 December 2011
Interest rate swaps
- 3,584 85,620 10,283 72,148 3,189
The term loan facilities of the Group bear interest at US LIBOR plus applicable margins. In accordance with the
financing documents, the Group has fixed the rate of interest through Interest Rate Swap Agreements ("IRS") as
follows:
- RO 15,400,000 (2011 - RO 21,150,000) at a fixed interest rate of 3.95% (2011 - 3.95%) per annum
excluding margin;
- RO nil (2011 - 20,785,000) at a fixed margin of 2.5% (2011 - 2.5%) per annum excluding margin;
- RO 19,230,000 (2011 - RO 19,230,000) at the rate of 2% (2011 - 2%) per annum excluding margin;
- RO 2,283,000 (2011 - RO 2,762,000) at the rate of 3.25% (2011 - 3.25%) per annum excluding margin ;
and
- RO 17,903,000 (2011 - 21,692,000) at the rate of 1.97% (2011 - 1.97%) per annum excluding margin.
At 31 December 2012, the US LIBOR was approximately 0.51% (31 December 2011- 0.77%) per annum.
Accordingly, the gap between US LIBOR and fixed rate under IRS was approximately 3.44%, nil%, 1.49%,
2.74% and 1.46% (2011 - 3.18%, 1.73%, 1.23%, 2.48% and 1.20%) per annum.
Based on the interest rates swaps, over the life of the IRS, the indicative losses were assessed at approximately
RO 2.301 million (2011 - RO 3.584 million) by the counter parties to IRS. Consequently, in order to comply
with International Accounting Standard 39 Financial Instruments: Recognition and Measurement fair value of
the hedge instruments’ indicative losses in the amount of approximately RO 2.301million (2011 - 3.584 million)
has been recorded under the current and non-current liabilities and the impact for the year amounting to RO
102,000 (2011 - RO 947,000) has been recorded under the finance income and RO 1.044 million (2011 - RO
1.628 million) has been recognised in the hedging reserve.

RENAISSANCE SERVICES SAOG AND ITS SUBSIDIARY COMPANIES 51
NOTES TO THE CONSOLIDATED FINANCIAL STATEMENTS
FOR THE YEAR ENDED 31 DECEMBER 2012 (continued)
30 Operating segments
The Group has three reportable segments, as described below, which are the Group’s strategic business units.
The strategic business units offer different products and services, and are managed separately because they
require different technology and marketing strategies. For each of the strategic business units, the Group’s CEO
reviews internal management reports on a regular basis. The following summary describes the operations in each
of the Group’s reportable segments:
Engineering services: includes ship repair and ship building activities.
Marine services: includes vessel chartering to oil and gas off shore companies.
Contract services: includes facilities management, facilities establishment, contract catering and operations and
maintenance services.
Other operations include the provision of training services, media publishing, advertising and distribution,
manufacturing, general trading, investments and related activities.
Information regarding the results of each reportable segment is included below. Performance is measured based
on segment profit before income tax, as included in the internal management reports that are reviewed by the
Group’s CEO (chief operating decision-maker). Segment profit is used to measure performance as management
believes that such information is most relevant in evaluating the results of certain segments relative to other
entities that operate within these industries.

RENAISSANCE SERVICES SAOG AND ITS SUBSIDIARY COMPANIES
NOTES TO THE CONSOLIDATED FINANCIAL STATEMENTS
FOR THE YEAR ENDED 31 DECEMBER 2012 (continued)
52
30 Operating segments (continued)
Information about reportable segments:
Engineering services Marine services Contract services Others Adjustments Total
2012 2011 2012 2011 2012 2011 2012 2011 2012 2011 2012 2011
RO’000 RO’000 RO’000 RO’000 RO’000 RO’000 RO’000 RO’000 RO’000 RO’000 RO’000 RO’000
Total revenues 30,064 37,108 119,260 112,995 102,716 100,974 13,209 11,164 (878) (859) 264,371 261,382
Less: Inter-segment revenue (6,631) (16,245) (297) (493) - (174) (166) (96) - - (7,094) (17,008)
External revenue 23,433 20,863 118,963 112,502 102,716 100,800 13,043 11,068 (878) (859) 257,277 244,374
Net finance (costs)/income (98) (162) (16,865) (13,607) (3,330) (3,203) (396) (853) (151) (29) (20,840) (17,854)
Depreciation and amortisation (961) (1,266) (20,748) (17,028) (4,707) (5,348) (456) (643) 13 (289) (26,859) (24,574)
Reportable segment profit after
income tax (continuing
operations)
(3,912)
(7,015)
10,383
15,649
10,785
8,931
(1,481)
(7,524)
(165)
298
15,610
10,339
Reportable segment loss after
income tax (discontinued
operations)
(12,552)
(8,048)
-
-
-
-
-
-
-
-
(12,552)
(8,048)
Reportable segment assets 17,546 70,534 463,343 410,592 140,111 137,514 59,429 91,667 (60,615) (56,610) 619,814 653,697
Assets of disposal group
classified as held-for-sale
26,794
-
-
-
-
-
1,587
-
-
-
28,381
-
Capital expenditure 525 3,918 37,787 47,354 13,092 18,163 533 370 - 12,523 51,937 82,328
Reportable segment liabilities 13,565 46,333 300,811 207,499 81,109 85,685 164,093 230,417 (128,074) (109,404) 431,504 460,530
Liabilities of disposal group
classified as held-for-sale
21,753
-
-
-
-
-
-
-
-
-
21,753
-

RENAISSANCE SERVICES SAOG AND ITS SUBSIDIARY COMPANIES 53
NOTES TO THE CONSOLIDATED FINANCIAL STATEMENTS
FOR THE YEAR ENDED 31 DECEMBER 2012 (continued)
30 Operating segments (continued)
Geographical segments:
Revenue based on the geographical location of the business activities is as follows:
2012 2011
RO’000 RO’000
Oman 81,188 65,254
Middle East and North Africa (excluding Oman) 54,882 51,976
Caspian 65,710 78,239
Others 55,497 48,906
257,277 244,374
31 Comparative figures
Certain comparative figures for the previous year have been reclassified, where necessary, in order to conform to
the current year’s presentation. Such reclassifications did not result in changes to previously reported total
comprehensive income or equity.
Report of the Auditors is set forth on page 1 and 2.