removing bottleneck from a manufacturing unit a case
TRANSCRIPT

Binod Timilsina
REMOVING BOTTLENECK FROM A MANUFACTURING UNIT: A case studies to BET-KER OY, Ylivieska-84100, Finland
Thesis CENTRAL OSTROBOTHNIA UNIVERSITY OF APPLIED SCIENCES, YLIVIESKA UNIT Degree Programme in Industrial Management March 2012

Abstract
Department Ylivieska
Date 15 March 2012
Author Binod Timilsina
Degree programme Degree programme in Industrial Management
Name of thesis Removing bottleneck from a manufacturing unit: A case studies to BETKER OY, Ylivieska-84100, Finland
Instructors Kyösti Ruotanen, Päivi Hautamäki and Mikko Miettinen
Pages 66 + Appendix
Supervisor Principal lecturer Ossi Päiväläinen Bottlenecks are obstacles, which reduce the entire capacity of the system. Bottlenecks are always present in the system in different forms like constraints of management, people, material, equipment, process, policy, environment etc. Its forms can be different according to the type of business but the methods to identify it can be same. A number of approaches have been developed by several scholars; what ever may be the approach of identifying root cause for the prevailing problem is the only way to get rid of bottlenecks. The aim of this thesis is to identify different types of bottleneck prevailing in Bet-ker Oy and recommending a solution. In the process of identifying bottleneck, I tried my best to utilize all the knowledge gained through learning and practical works done under different subjects in the class and several articles, reports and research work published in different books and internet were followed. I have tried my best to cover all possible theories needed under each topic, so that the reader can get a clear picture of different types of bottlenecks, ways to identify and deduce possible solutions to it.
Key words
Bottleneck, Refractory, Pretreatment, Monolithic, Silo, forecasting, Improvement, Analysis

PREFACE I would like to express my gratitude to all those who gave me the opportunity to complete this final thesis of my studies titled REMOVING BOTTLENECK FROM MANUFACTURING UNIT (A case studies to BET-KER OY, Ylivieska-84100, Finland). The purpose of the thesis is to analyze the manufacturing unit from different perspective of business activities such as manufacturing management, supply chain management and project management, and to give a comprehensive view to eliminate the prevailing bottleneck from the manufacturing unit. The entire thesis is based on the knowledge gained during study, article, report, research work published in different books and internet along with the information provided by Bet-ker Oy. I have tried my best to provide as much details as possible on the topic. I am grateful to all the researchers, writers, publishers and different organization whose work has contributed a lot to complete my thesis. My deepest thanks to thesis supervisor Ossi Päiväläinen for giving the guide line to write the thesis from beginning to end. At the same time I would like to give special thanks to Mikko Miettinen, working life supervisor for providing me the task. Also I am heartily thankful to Kyösti Ruotanen and Päivi Hautamäki for guideline, correction of my work and providing necessary information from the company’s side. During the thesis work I came across the various facts of refractory manufacturing and over all management of a manufacturing unit. I hope this thesis report will be useful in various forms, especially in removing bottleneck from manufacturing unit in some extent. Thank you!

PREFACE TABLE OF CONTENTS 1 INTRODUCTION 1 2 BET-KER OY IN BRIEF 3 3 BOTTLENECK IN MANUFACTURING 5
3.1 Introduction 5 3.2 Types of bottleneck in manufacturing 6 3.2.1 People constraints 6 3.2.2 Material constraints 6 3.2.3 Equipment constraints 7 3.2.4 Process constraints 7 3.2.5 Management constraints 7 3.2.6 Policy constraints 7 3.2.7 Environmental constraints 8
3.3 Approach to find bottleneck 8 3.3.1 Fishbone diagram 8 3.3.2 Failure mode and effect analysis(FMEA) 9 3.3.3 Theory of constraints (TOC) 10 3.3.4 Five why Principle 11 3.3.5 Benchmarking 11
3.4 Some important terms of manufacturing management 12 3.4.1 Capacity planning 12 3.4.2 Process analysis 12 3.4.3 Data collection and simulation 13 3.4.4 What if 13
4 MANUFACTURING MANAGEMENT 14
4.1 Introduction 14 4.2 Refractory materials 16 4.3 Types of refractory materials 16 4.4 Refractory manufacturing 18 4.5 Manufacturing process of Bet-ker Oy 20 4.6 Raw materials used in Bet-ker Oy 22 4.7 Analysis of manufacturing process of Bet-ker Oy 23 4.8 Findings of analysis of manufacturing process 24 4.9 Recommendation to remove bottlenecks 28 4.10 Application of pull materials through system 29 4.11 Advantage & Disadvantage of Pull system of manufacturing 31
5 SUPPLY CHAIN MANAGEMENT 32
5.1 Introduction 32 5.2 Types of bottlenecks in supply chain 34 5.3 Methods to create flow of products 34 5.4 Supply chain of Bet-ker Oy 36

5.5 Analysis of supply chain in Bet-ker Oy 40 5.6 Findings of analysis 42 5.7 Recommendations for improvements 42 5.8 Tools to reduce cost in supply chain 43
5.8.1 Product portfolio planning/Product lifecycle management 43 5.8.2 Recycling the waste and faulty products 43 5.8.3 Lean manufacturing 44 5.8.4 Just in time (JIT) 44 5.8.5 Direct shipment 45 5.8.6 Some other ways to reduce cost of supply chain 45
6 PROJECT MANAGEMENT 46
6.1 Introduction 46 6.2 Types of bottlenecks in project management 49 6.3 Measurement of overall efficiency 50 6.4 Tools to measure overall efficiency 52
6.4.1 Balance score card 52 6.4.2 Earned value analysis 53 6.4.3 Project life cycle 55
6.5 Analysis of works under value added and non-value added 55
7 CONCLUSION 59 7.1 Road map for the improvement 59
REFERENCES 62 APPENDICES

1
1 INTRODUCTION
In the present world of competitive business, cost minimization and efficient management of
manufacturing unit is not an easy task. Always in practice when one problem is solved there
comes other new or may be old problems will reoccur with the passage of time. All these
problems that are constraints of business utilizing various resources in different forms without
adding any value in the system, can be commonly called bottleneck of manufacturing unit.
Identifying and removing the bottleneck is critical to a business. It is an ongoing process
which needs to be carried throughout the year in order to utilize resources of production and
maximize profit of the firm.
The aim and objective of my thesis is to give a general picture of different types of bottlenecks
that can prevail in a manufacturing, ways to finding bottleneck and give possible solution to
each of them. In general the aim and objectives can be listed as follows:
Measuring and controlling the flow of materials
Identify the bottlenecks in the process
Recommending the necessary changes
Speeding up the production (turnaround time) i.e. Increasing the production
I divided the whole thesis work in different chapters with specific goals to be achieved which
are highlighted as below:
1. Bottleneck in manufacturing
Different types of bottleneck in manufacturing unit
Approach to find bottlenecks
2. Manufacturing management
Analyzing current manufacturing process, machinery and equipment
Applying of “Pull materials” through the system
3. Supply chain management

2
Create flow of products to eliminate surplus
4. Project management
Identify and eliminate the activities which are not adding value in the project
5. Conclusion
Recommending a road map for the improvement
The methods of the thesis is entirely based on research work, theoretical part is covered from
the different books followed during the class hours in different subject, article, reports,
research work published in different books and internet. First the theoretical framework is
given during the first chapter entitled “Bottleneck in manufacturing unit” which is followed by
successive chapters as mentioned above. There were specific goals behind each chapter to be
achieved; it was not easy to penetrate each and every task in the manufacturing unit of Bet-Ker
Oy.
To the best of my knowledge, I have tried my best to respond the entire possible bottleneck
prevailing in the system. I hope this will add some value in the manufacturing unit of Bet-Ker
Oy.
3
2 BET-KER OY IN BRIEF
Bet-ker Oy is a private owned company involved in manufacturing of refractory materials
since 1977. Its customers include the steel industry, metal smelting industry, foundries, metal
reheat furnaces and incinerators. The main products of the company are refractory castables
and pre-shapes made out of castables (for ladle, tundish, wear and safety linings), dry installed
inorganic bond coating materials (especially for tundish), spray & gunning mixes for ladles
and furnaces and troughs, repair & finishing materials having plastic rheology. The different
products are manufactured in accordance with customer needs.
The Bet-ker Oy is located in Ylivieska with good connection to road and railway
transportation. It is only 50 km away from the nearest harbor, the port of Rahja at Kalajoki.
The company has several international patents related to refractories technology as well as
licenses abroad.
The monolithic refractory and precast shapes are manufactured in a fully computer controlled
plant. The plant’s annual output capacity is 40,000 metric tons. The mixed materials
manufactured are packed in paper bags, big bags or they are delivered in bulk by silo trucks to
the customer destination.
Various types of sophisticated precast shapes are manufactured according to customers’ needs.
Company has a facility to dry and fire the precast shapes as required. The precast components
sizes and shapes can vary extensively, with weights ranging from 1 to 5,000 kilos.
The main market of the company is Russia, Belorussia, Denmark, Germany, Indonesia and the
biggest customers are Finnish steel manufacturer. The factory produces about 20,000 tons of
monolithic refractory materials and precast shapes a year. The main raw materials are natural
and synthetic silicates, alumina, magnesia, calcined bauxite and reclaimed refractories.
4
The company is spread in the area of 23 159 m2. Presently there are total of 24 employee,
among which 15 workers and 9 officials. The company had a turnover of 10 343 321.60 € in
the year 2010 with share capital of 504 563.78 €.
The different works in the factory includes manufacturing (grinding, mixing, drying etc.)
maintenance/repair, import, export of materials etc. Bet-ker Oy has different departments like
sales, production, research and development working under one managing director.
In general, there are 3 employees working in office, 2 people in maintenance/repair, 2 in
laboratory, 1 in dispatch department/warehouse, 4-5 in element production, 3-4 in mixing/
castable/material production, 2 in crushing, grinding and material transfer and so on.
In most cases customer has the possibilities to quality inspection at the plant, so that proper
attention can be given to customer needs and requirements. The Bet-ker Oy has been awarded
several times by the AAA+ certificate (the best possible) related to company’s economy. In
the year 2010 Bet-ker Oy has also been nominated among seven most advanced companies in
Finland by major Finnish bank and economic magazine (Bet-ker Oy, 2012).
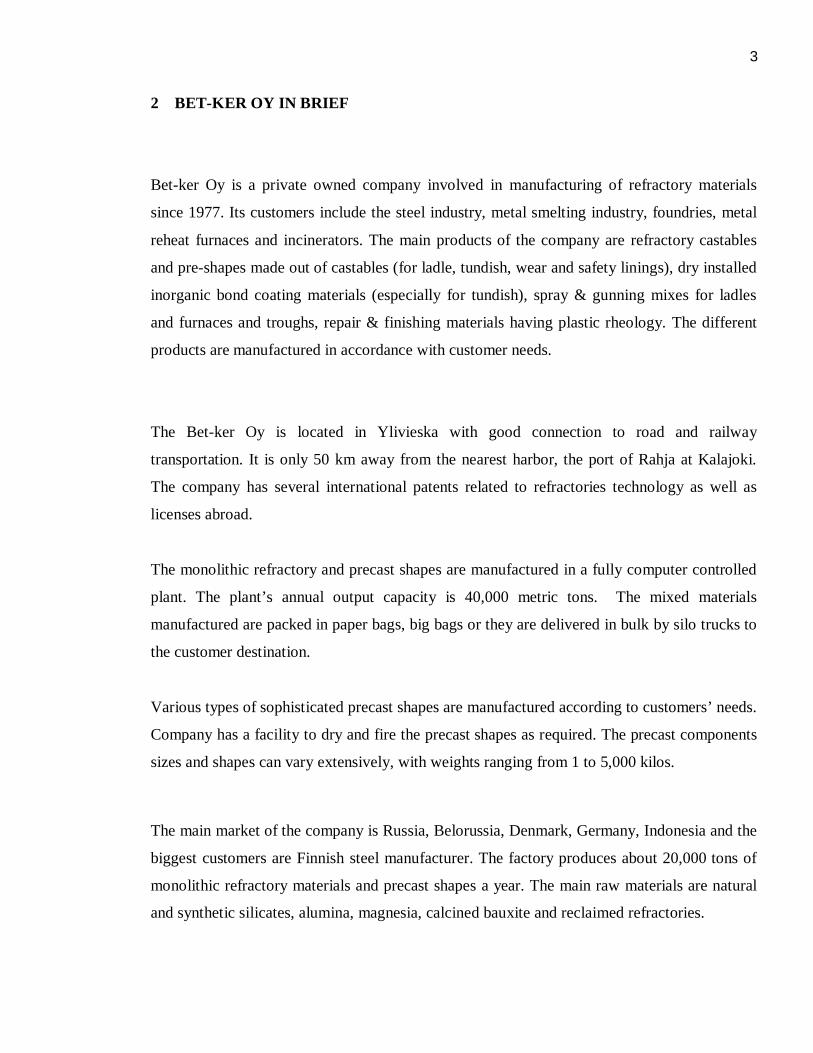
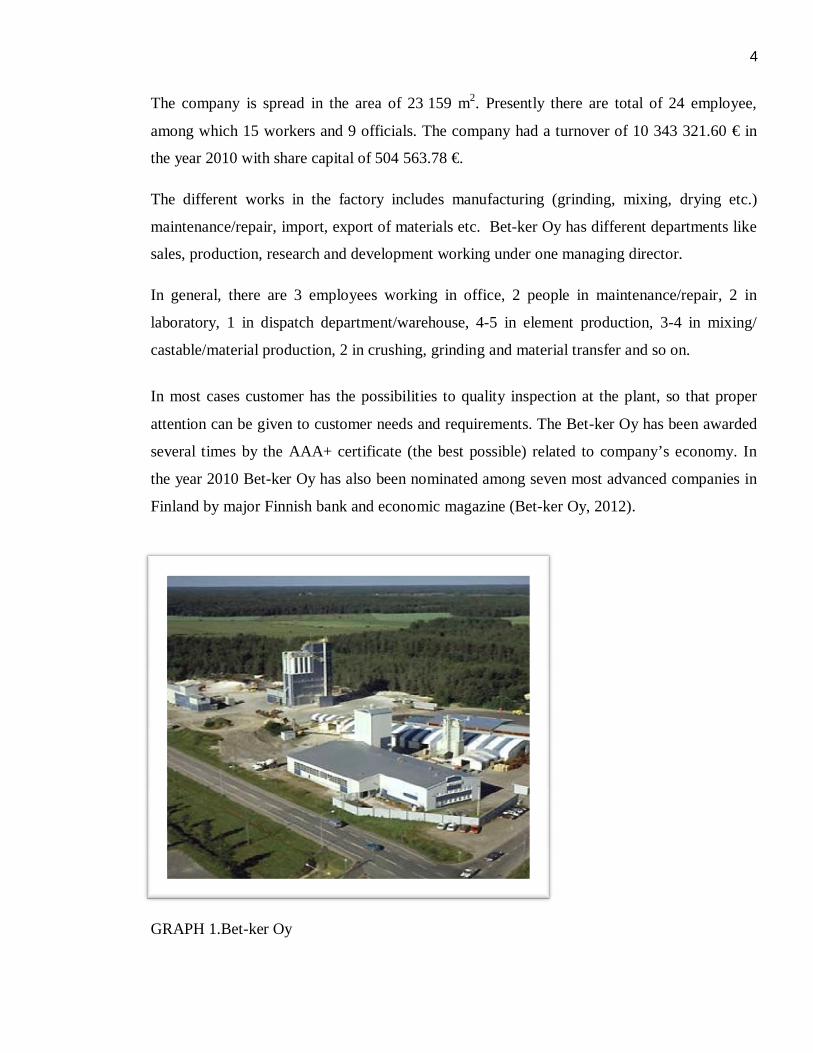
GRAPH 1.Bet-ker Oy

5
3 BOTTLENECK IN MANUFACTURING
3.1 Introduction
An activity which delays the performance of a system and reduces overall efficiency of the
process is known as bottleneck. As for example a manufacturing company has different line of
production; each of them are connected to each other i.e. the work produced from one unit is
the input for other unit and so on. In this case if one line is broken or halted due to some
reason than the other lines of production is directly affected causing lower level of output as a
result of bottleneck.
GRAPH 2. Example of Bottleneck
Here in the above diagram it is seen that the inflow rate is higher than the outflow rate, it may
be due to several reasons from design of the equipment to assemble and operation of the
process, which helps to reduce the overall efficiency of the systems. All these constraints of
the system are known as bottleneck.

6
Thus a bottleneck is an obstacle in the process of manufacturing which restricts the
production. It can vary according to time and changes in production process (Cecil C. Bozarth
& Robert B. Handfield, 2008).
3.2 Types of bottleneck in manufacturing
There can be many different types of bottleneck in manufacturing industry as for example
labor, time, material or machine etc. In general different forms of bottleneck can be described
as below:
3.2.1 People constraints
People are one of the most important factors of the production and difficult to manage in an
effective way. In any manufacturing unit there are different people working together with
different experience, background and educational qualification. Each people have their own
way of motive towards work. So in an manufacturing unit differents constraints of bottleneck
can be due to union problem, illness, unexpected vacancy, hiring and training problems etc.
3.2.2 Material constraints
Production capacity is highly affected by the poor management of inventory, inadquate
forecast, inefficient supplier, poor production planning, inediquate finance, changing product
mix etc. one or all of these factors may cause improper flow of materials resulting reduction
in overall production capacity and increasing lead time(SMC Focus, 2012).

7
3.2.3 Equipment constraints
Equpiment for manufacturing should meet the current demand. The machines and equipment
should be flexible to expand in order to meetfuture demand, but some times due to
inappropriate planning, brakedown of machine, unavailability of spareparts, improper
maintenance, low level of infrastructure machines and equipments becomes a constraint of
manufacturing.
3.2.3 Process constraints
Process constraints in manufacturing unit can be due to quality problems, insufficient
resources, poor plant layout and inflexible process (not able to change according to time and
market demand). The constraints can occure anywhere in the process, supply chain, customer,
supplier etc. Hence anykinds of problems affecting entire output of the system is known as
process constraints (Small business took kit, 2012).
3.2.4 Management constraints
Efficient management means better performance resulting in higher output and profit. Overall
management of a manufacturing unit should comply with aim and objective of the company.
Sometimes the management is not be able to meet the needs of the system and becomes a
constraint causing different problems like demotivation of employee, ineffective flow of
material and information etc.
3.2.5 Policy constraints
Policy of a manufacturing unit should meet the goal of company, it should be clearly defined
what actions are to be taken at what conditions. Generally (not always) the management is not

8
able to define all the issue in specific way, this may leads to a constraint in manufacturing.It is
the most common form of constraint (Lean production, 2012).
3.2.6 Environmental constraint
Operating environment of any business includes competitors activities, rules and regulations
formulated by government, labour law, union law, customer demands & expectation,
economical situation, technological improvement, development in infrastructure etc. at the
same time the firm should bear the social responsibilities. These all factors affecting the
activities of business is called environmental constraints (The times 100 business case studies,
2012).
3.3 Approach to find bottleneck
Bottleneck is the main reason for slowdown of the production in a manufacturing unit. It has
to be identified, analyzed and needs to be resolved on the basis of facts. Once the bottleneck is
identified correctly and efficiently; It helps to reduce production cost increasing overall
efficiency of the system. There can be long term or short term constraints in the system.
Bottleneck can be identified in a process/system by following the simple approach as follows:
3.3.1 Fishbone diagram
“Fishbone diagram is a tool that provides a systematic and graphic way of identifying possible
causes for a problem, using categories to focus and structure the thinking, in order to work
toward determining root causes. Also known as the Ishikadiagram (After Dr. Kaoru Ishikawa,
the Japanese quality control statistician credited with investing it) and cause effect diagram”
(John Kamauf, 2010, 47).According to this approach there should be a cause to see the effect.

9
So under this approach, different data related to the problem are collected. These data are
analyzed precisely in order to find the root cause for that particular problem (Peter D.Mauch,
2010).
GRAPH3. Fishbone diagram (Peter D. Mauch,2012)
3.3.2 Failure mode and effect analysis(FMEA)
“FMEA is a methodology for analyzing potential problems early in the development or
improvement process, by identifying relationship between process and product requirement
and anticipating the potential for unacceptable outputs and their effects, enabling teams to take
action to reduce risk and increase reliability”(John Kamauf, 2010, 82).
FMEA helps to know all different ways for occurrence of failure and estimate its effect and
seriousness, in the same time it also helps to find the possible ways of correction. Generally
FMEA identifies following issues for every process/steps examined:
Potential failure mode
Potential effects of failure

10
Potential cause of failure
Severity
Times of occurrence
Present control methods
Recommend actions
Failure mode and effect analysis focuses on improvement of product functionality, safety and
reduction of external failure cost like warranty cost, service delivery obstacles. It can be used
in several dimensions to eliminate failure modes in a process or system (James R. Evans &
William M. Lindsay, 2008).
3.3.3 Theory of constraints (TOC)
Theory of constraints guides for regular improvements on the system. Any system is consists
of a series of independent sub system working together in a defined way in order to meet fixed
target. In the same way there can be a number of weak places working as constraints in the
system. And TOC focuses on those weak places where improvement is necessary. Theory of
constraints follows following five steps:
Identify the constraints
Exploit the constraints
Elevate the constraints and
Repeat the cycle
Thus the TOC works on speed and volume of production with time and can be an effective
method to find the bottleneck in the system (Eliyahu M. Goldratt& Jeff Cox, 2004).
11
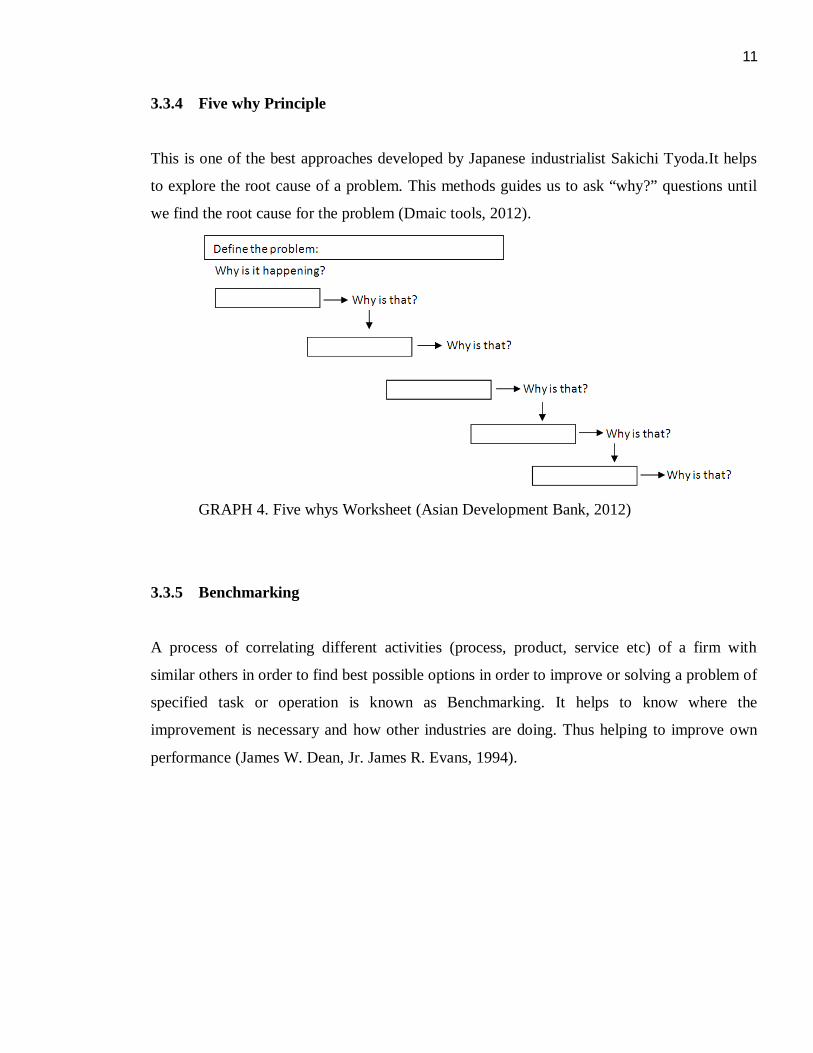
3.3.4 Five why Principle
This is one of the best approaches developed by Japanese industrialist Sakichi Tyoda.It helps
to explore the root cause of a problem. This methods guides us to ask “why?” questions until
we find the root cause for the problem (Dmaic tools, 2012).
GRAPH 4. Five whys Worksheet (Asian Development Bank, 2012)
3.3.5 Benchmarking
A process of correlating different activities (process, product, service etc) of a firm with
similar others in order to find best possible options in order to improve or solving a problem of
specified task or operation is known as Benchmarking. It helps to know where the
improvement is necessary and how other industries are doing. Thus helping to improve own
performance (James W. Dean, Jr. James R. Evans, 1994).

12
3.4 Some important terms of manufacturing management
Manufacturing management includes all activities that lead to an increase in the efficiency of
manufacturing process. Some important terms of manufacturing management are given below:
3.4.1 Capacity planning
Process capacity is maximum capacity output rate measured in units produced per unit of time.
In a manufacturing unit capacity planning means designing plant layout, installing machine
equipments and arranging different factors of production for a specific period of time. The aim
of the capacity planning should be able to meet the present and future demand of the goods or
service produced. The capacity should be flexible in the time frame. Thus the capacity
planning is the process of identifying necessary resources to meet the production plan. It
should be able to calculate the start and end time of the production. Factors like number of
workers, number of machine, waste and scrap, defects and errors, productivity, suppliers,
buyers, government rules and regulations, repair and maintenance etc affects the capacity
planning of any manufacturing unit. The capacity planning can be long as well as short term
and helps a firm to make more profit (Wise GEEK, 2012; Search Enterprise WAN, 2012).
3.4.2 Process analysis
A process is combination of different resources in a specific way to get the desired output
through given input. It is also an approach to identify connections between different resources
within a system. While analyzing a process each and every steps of manufacturing needs to be
described and connected to the next preceding step. It should follow chronological order of
manufacturing from start to end step of manufacturing. Thus the process analysis gives a clear

13
picture of what is to be done and what we are doing (University of Florida, 2012; Changing
Minds, 2012; Process analysis, 2012).
3.4.3 Data collection and simulation
Different data e.g. output rate, production capacity, working hour etc. from manufacturing unit
are collected. The collection of data can be made by survey, inspection, experiments and so
on. Each data collected needs to be simulated and analyzed with the specified standards of
manufacturing. It helps analyst to indentify the problems of manufacturing (Biology
online,2012; Business dictionary, 2012; Business excellence, 2012).
3.4.4 What if
Every time we make certain changes or improvement in the system, there is possibility of
failure i.e. the changes or improvement made may not work as planned. In that case it would
be better if there is some other backup plan. So what if is the condition where alternative
methods need to be determined or planned if something goes wrong or some changes in
manufacturing are not working as planned (John Kamauff, 2010).
14
4 MANUFACTURING MANAGEMENT
4.1 Introduction
Manufacturing management in an organization deals with the design and management of
products, processes, services and supply chain. Its main responsibility is to utilize all the
resources so that a firm can meet the customer demands along with making profit,
organizational growth and be competitive in the market.
In general well designed manufacturing management should be able to answer the following
questions
How total cost can be reduced?
How to reduce working capital?
How to increase profit?
How Maximum utilization of resources can be made?
An answer to these questions helps a company to utilize different available resources
effectively in order to obtain competitive advantage in the market. The competitive dimension
can include cost, product quality, reliability, delivery speed, delivery reliability, demand
changes, flexibility and support before and after sales.
As an operation manager one should be able to segment the market, identify the product or
service requirement, demand pattern and profit margin of each segment. It is also necessary to
determine what the customer wants, in the same time he/she should be able to convert
customers according to the product or service produced.
In the same way an operation manager should be able to make decisions supporting the
mission and the over all strategy of the organization.
In conclusion the fundamental work of operation manager can be described in three steps:

15
In manufacturing management the use of technology such as Material requirement planning
(MRP), Manufacturing resource planning (MRP II), Enterprise resource planning (ERP),
Advanced planning and scheduling (ASP) and e-Procurement etc. is becoming mandatory. An
operational manager should be aware of these technologies and must be able to identify which
of them and what is suitable for his/her organization.
These technologies make operational manager work (Planning, buying, making, moving,
selling etc.) easy. Ultimately it helps a firm to survive, compete and succeed in the market.
Similarly it also helps an operational manager to make a better informed decision in real time
with less risk.
However, the importance of technology in operation management is increasing. Its
implementation is not so easy and at the same time it is costly too. So while implementing a
technology “What-if?” question should be in mind.
Besides these technologies, the knowledge of collaborative planning (redesign and
implementation of planning processes across multiple enterprises using electronic business to
synchronize product flow, optimize resource allocation and reducing inventory) and Advanced
planning and scheduling (integrating demand and supply process to reduce inventory levels,
shorten supply chain cycle times and reduces supply chain cost) are also important in
operation management of a firm.
Thus the implementation of the technology is for proper management of Manufacturing,
Supply Chain management, Financial management, Project management, Human resource
management, Customer relationship management, Data warehouse, Access control over every
factors of manufacturing and customization of resources so that a firm can be more profitable
and competitive in the market (John Kamauff, 2010).

16
4.2 Refractory materials
Refractories are the substances which can withstand high temperature without losing its
physical and chemical properties. These are inorganic, nonmetallic, porous and heterogeneous
materials composed of thermally stable mineral mixed together with a binder and additives.
Refractory material are used in almost all processes involving high temperature, corrosive
environment, insulation furnaces, kilns, incinerators, reactors, jet and rocket engines, parts of
space vehicles such as space shuttle. They are also used to make crucibles (A. Bhatia, 2011).
According to American Society for testing and materials (ASTM), Refractories are “Non-
metallic materials having those chemical and physical properties that make them applicable
for structure or as components of systems, that are exposed to environment to above 1000o F
(811 K; 538o C)”.
Refractory materials are specially manufactured for insulation and protection of industrial
furnaces and vessels due to their extra-ordinary properties such as heat resistant, chemical and
mechanical damage. Materials like oxide of silicon, aluminum, magnesium, calcium,
zirconium and non oxide like carbides, nitrides, borides, silicates and graphite are the main
raw materials for manufacturing of refractories. Different factors like external environment,
temperature and materials in contact determine the composition of refractory materials (The
refractories Institute, 2011).
4.3 Types of refractory materials
There are a number of different types of refractory material commercially available in the
market. They can be divided in four main groups as shown:
Chemical composition
Methods of manufacturing
Physical form
Special use

17
A. Chemical composition: Each refractory material has different composition and shows
distinctive behavior when reacting with slags. On the basis of chemical reaction to slag it
can be divided in to sub groups like acidic, basic and neutral.
Acidic refractories: Refcatories which are attracted by basic slags to be neutralised but
do not show any reaction with acidic slags are called Acidic refractories. These types
of refractories are safe to use in acidic environment. Examples of acidic refractories are
Silica (SiO2), Zirconia (ZrO2) etc.
Basic refractories: Refractories which are attracted by acidic slag to be neutralized but
do not show any reactions with basic slag are called Baisc refractories. These types of
refractories are safe to use in basic environment (e.g. non-ferrous metallurgical
operations). Examples of basic refractories are Magnesia, Doloma, Olivine, Chromite,
Forsterite etc.
Neutral refcartories: Refractories which are neither attracted towards basic nor acidic
slags are known as Neutral refractories. These types of refractories are used in the
environment of neither acidic nor basic. Examples of neutral refractories are carbon
graphite, Chromites, Alumina etc.
B. Methods of manufacturing: On the basis of manufacturing method refractories materials
can be divided into the following groups
Dry pressed
Fused cast
Hand molded
Formed (Normal, Fired or Chemical bonded)
Unformed (Monolithic)

18
C. Physical form: on the basis of physical form refractories are classified into two groups i.e.
Shaped (bricks) and Unshaped (monolithic).
Shaped (bricks) refractories: Refractories which have specific shape when delivered to
end users are known as shaped refractories. The users can not define the shape and size
under this category.
Unshaped (monolithic) refractories: Refractories which do not have any specific shape
and size are known as unshaped refractories. These types of refractories can be
designed according to use.
D. Special use: Under this category refractories are classified on the basis of special use like
in rockets, jets and nuclear power plants. Many refractories like aluminium oxide, silicon
carbide etc are very hard and used abrasives for example aircraft brake linings. More
examples of this type of refractories are cerments, Sialon etc. (A. Bhatia, 2011; The
refractories manufacturers association of Australia, 2011).
4.4 Refractory manufacturing
Commercially used refractories are not readily available in the nature. Refractory is
manufactured by mixing different raw materials available in mineral ores. In general
manufacturing process of manufacturing of refractories material can be described in following
ten steps:
Collection of raw materials
Crushing and Grinding of raw materials
Pretreatment of raw material(Calcinations, Stabilizer addition)
Mixing
Molding
Drying

19
Firing
Cooling
Milling/ Finishing
Final product
The whole manufacturing process can be descried in the following flow chart
GRAPG 5.Manufacturing flow chart of Refractory materials (National programme on
Technology enhanced learning, 2011).

20
4.5 Manufacturing process of Bet-Ker Oy
Raw materials come to Kalajoki Rahja harbor through ship from different countries in bulk
(3000mt and even more), later transported to factory. Truck loads or smaller orders of the raw
materials are directly transported to Ylivieska. Some of the raw materials are crushed, grinded
while others are ready to use.
Once the raw materials arrives to manufacturing unit they are filled to flat silos(storage), some
are crushed/grinded and goes with elevator to seizer and to silos. Powder silos are filled by
puff car and additive containers from big bags. Materials are dosed in scales before filling to
mixer. After mixing time (about60-80seconds) mix is dropped to bags, or goes to product silo.
There are different machines used like Crushing machine, 2 grinding machines (big and small
ball mills), sieving machine, mixers, bridge cranes, different kind of conveyors (scale-, belt-
and screw conveyors and elevators).
GRAPH 6. Packing of refractory in Betker Oy

21
The working of each machines are described as follows:
Big ball mill: Its capacity is about 40 mt / 24 hours.
Small ball mill: Its capacity is about 4-5 mt / 24 hours.
Crushing machine: It can work from 30 mt to 70 mt / working day (working time
about 7 hours), depending on the material.
Production, big factory: It can work from 50 mt to 110 mt / working day (working
time about 7 hours), depending on the product and batch size (110 mt / day can be
produced straight to product silos). Also size of lot affects capacity: if making many
small lots, amount per day is much smaller.
Production, small factory: It can work From 25 mt to 50 mt / working day (working
time about 7 hours), depending on the batch size.
Element production: Big elements: about 7 mt / working day (working time about 7
hours), 2 other molding places: about 2.6 to 2.8 mt in each place / working day
(working time about 7 hours). All elements combined together can produce about 12.4
mt /working day.
Employees don’t change much here, so they know well how the work is supposed to be done.
Employees know more than just one work task, and they can stand in for each others. Work
here is not something that can be learned in school, so if new employees come, they learn
from the other employees, who do the same work.
Production process is fully depending on the orders by customer; only a small amount is
manufactured as ready goods by forecasting in advance. If the machines are working on full
capacity, approximately 110 mt can be produced in one working day.
GRAPH 7. Crushing and Grinding

22
4.6 Raw materials used in Betker Oy
Different kinds of raw materials used in Betker Oy are as described below:
Aggregates: Olivine, magnesium oxide (magnesia), aluminium oxides (aluminas e.g. several
types like white tabular, white fused, brown fused aluminas), calcined bauxite, Chalmette,
fireclay, flint clay, mullite, kyanite, quartz etc.
Reclaimed aggregates (source is used refractory bricks): Magnesia-carboncrog, Fire
claycrog, Magnesia crog, Chrome magnesia crog.
Reclaimed aggregates (source for panel forming alumina castable): alumina-spinel crog.
Other reclaimed aggregates: porcelain crog, ferro chromium slag.
Binders: Silica fumes, Calcium aluminates cements, Calcium silicate cements, Alkali
phosphates, Sodium silicates, Earth-alkali salts, Bentonite, Calcined clays.
Additives: Deflocculates, Dispersing agents, Steel fibers, Polymer fibers, Rheology modifiers,
Retarders, Accelerators.
Main products of Betker Oy are refractory castables and pre-shapes made out of castables (for
ladle, tundish, wear and safety linings), dry installed inorganic bond coating materials
(especially for tundish), spray & gunning mixes for ladles and furnaces and troughs, repair &
finishing materials having plastic rheology.

23
GRAPH 8. Manufacturing of refractory (Betker Oy, 2012)
4.7 Analysis of manufacturing process of Bet-ker Oy
To analyze the manufacturing system was not an easy task because it needs detailed
knowledge of the plant and experiences. I made some questionnaires (see appendix 1) and
asked to answer my questions to different persons in the factory. Personal visit and discussion
was also useful for analyzing the system.
24
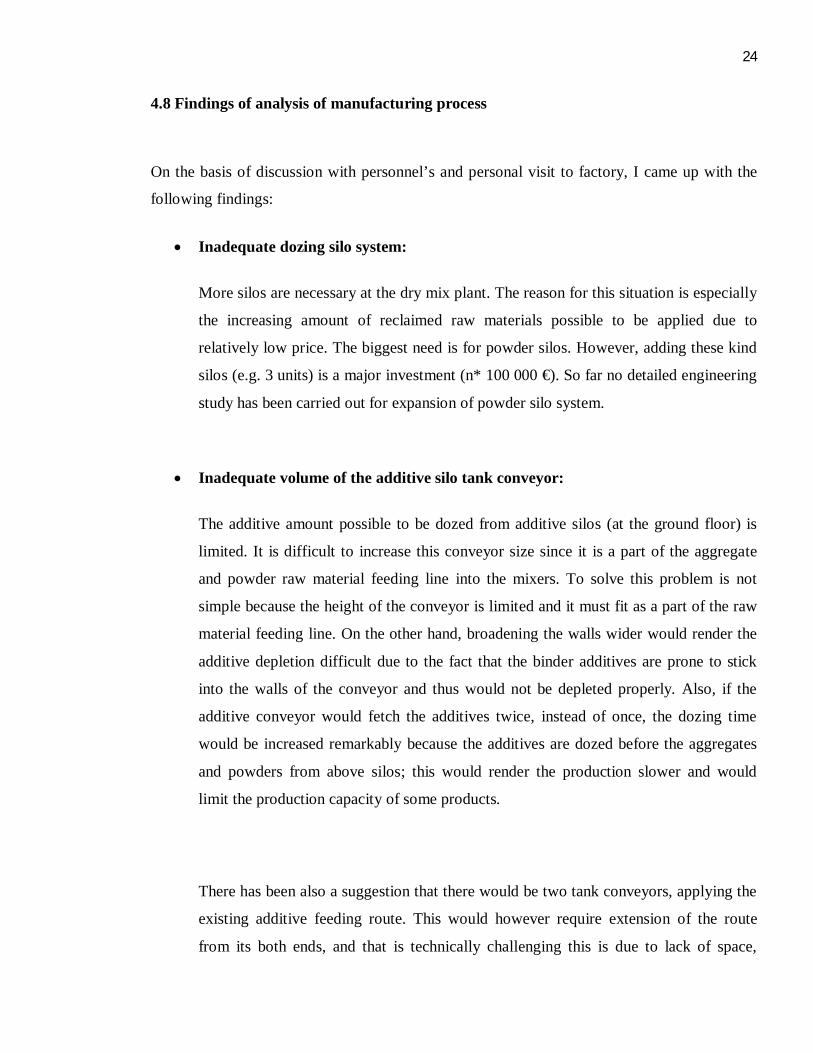
4.8 Findings of analysis of manufacturing process
On the basis of discussion with personnel’s and personal visit to factory, I came up with the
following findings:
Inadequate dozing silo system:
More silos are necessary at the dry mix plant. The reason for this situation is especially
the increasing amount of reclaimed raw materials possible to be applied due to
relatively low price. The biggest need is for powder silos. However, adding these kind
silos (e.g. 3 units) is a major investment (n* 100 000 €). So far no detailed engineering
study has been carried out for expansion of powder silo system.
Inadequate volume of the additive silo tank conveyor:
The additive amount possible to be dozed from additive silos (at the ground floor) is
limited. It is difficult to increase this conveyor size since it is a part of the aggregate
and powder raw material feeding line into the mixers. To solve this problem is not
simple because the height of the conveyor is limited and it must fit as a part of the raw
material feeding line. On the other hand, broadening the walls wider would render the
additive depletion difficult due to the fact that the binder additives are prone to stick
into the walls of the conveyor and thus would not be depleted properly. Also, if the
additive conveyor would fetch the additives twice, instead of once, the dozing time
would be increased remarkably because the additives are dozed before the aggregates
and powders from above silos; this would render the production slower and would
limit the production capacity of some products.
There has been also a suggestion that there would be two tank conveyors, applying the
existing additive feeding route. This would however require extension of the route
from its both ends, and that is technically challenging this is due to lack of space,

25
especially at the additive silo ends. Still another suggestion has been that there would
be a new integral part in the raw material feeding line, replacing the additive conveyor
from this task. Instead, the additive conveyor would be transported next to the current
end station (perhaps into a bit higher position) and the conveyor would be depleted via
a tubular conduit leading to the new part of the feeding line. No detailed engineering
has been performed regarding the capacity increase of additive conveyor system.
Still another solution would be to build up a fourth silo battery for dry ingredients. The
place of this might be the fourth floor, next to the powder silo conveyor box, on its
eastern side, close to the shaft. The amount of silos may be from 4 to 6 units, the
volume of each can be less than 1 m3. The supply of raw materials would be via the
shaft by shaft crane. The raw materials chosen for these silos should be additives dozed
in small quantities because the service via the shaft is quite laborious. The raw
materials would be packed in 15 – 25 kg paper bags and emptied into the silos
manually. An additional crane or conveying system is necessary for the horizontal
movement of raw material pallets after the pallet is lifted from the bottom floor by the
shaft crane up to a required height. Also the weighing system and the conduits for
feeding the weighed raw materials into the main raw material feeding line should be
elaborated. No detailed engineering research has been carried out so far related to this
fourth silo battery option.
The investment in improving additives and some powder dozing systems will cost
probably a few thousand Euros, independent of the way how the investment would be
accomplished.
The suitable raw materials to be dozed from this possible new silo battery would be
e.g. bentonite, clay, sodium silicate, phosphates, and silica fume.
Inadequate milling capacity:
There are two existing ball mills, the bigger one for magnesia and olivine, the smaller
one for bauxite, shamotte and reclaimed alumina. The smaller one is prone for failures
and its capacity is limited if there is more demand for certain products. There are some

26
basic ideas to invest on a third mill which would cost few hundred thousand Euros,
with the supporting equipment and silos included. So far no design of the expanded
milling system has been elaborated.
Some minor arrangements might be carried out with the storage of raw materials, ready mix
products and pre-shapes. The newly erected, big capacity mixer system for producing big pre-
shapes will limit the space in the casting house, especially limiting the storage capacity of
castable mix bags and the dried pre-shapes in the casting house. Arrangements in the two bag
storehouses (cold & hot) are necessary in order to get the better space benefited. If the demand
is increased, some new storage room may be appropriate, too.
Capacities of the machines are not the same. When the process is running, different machines
work one on the other, such as dosing materials for next portion is done while mixing and
packaging previous. There are also different amounts that need to be handled with different
machines, for example there is no need to crush or grind all materials, and in the factory the
amounts of aggregate materials and additives or binders are not same.
The factory is not new, so there are machines that are not of the latest technology. The
machines are replaced when there is a need for example after they broke.
As regards to employees they are satisfied with the work what they are doing, in general there
are not such significant bottlenecks from the employee’s side.

27
In general overall manufacturing unit can be evaluated as follows:
TABLE 1. Overall rating of Bet-ker OY
1= Poor management
2= Needs to change Basis for ratings.
3= It’s ok
4= Good
5= Excellent
Even though the manufacturing process of Bet-ker Oy is running well, during my factory visit
and the information given by the factory personnel there were certain things to be changed or
altered in order to utilize all the resources of manufacturing which are outlined as follows.
Machines are not running in full capacity.
Generally manufacturing is done in 30mt to 40mt batches.
Some ready goods in stock for minor customers.
Limited number of big customers.
Grinding mill for bauxite, chamotte and etc. is too small and the capacity is very poor
Too few silos for different materials in factory (on powder site) and for aggregates in
the storage.
Product sheets are poor there are not any good working tools for marketing
www.betker.fi is not with sufficient information. In fact there exist only a telephone
number and address (Bet-ker Oy, 2012).
Particulars Ratings
Materials 3
Equipment 2
Process 4
Management 4
Policy 3
Environment 3
People 4

28
4.9 Recommendation to remove bottlenecks
In general the bottlenecks in production can be evaluated as a comparison of the amount of
workforce and potential investments in equipment and related software (the amount of
production personnel and the amount of shifts applied, versus investments into production
equipment and storehouse capacity). So far there is only the day shift with some overwork
occasionally. There are evening and night shift at disposal, but of course with extra cost.
During weekends and special holidays there has been no working at the production. So it has
to be evaluated if it is more profitable to use more workforces, or if it is more profitable to
invest on machinery and storehouse.
After analyzing the manufacturing process of Betker Oy the following recommendations are
made for improvement in the manufacturing process.
In production there can be more silos, so there would not be a need to change the raw
materials when changing the product.
Also there is one conveyor which could be bigger because of that some products need to be
manufactured in smaller portions, though there are not so many of this kind of products. Also
there is no adequate space, so that it could be an option to have bigger conveyor without
making more changes. The conveyor can make two trips to the mixer, but a detail study is
necessary to know if this kind of change could be rational or possible.
Machine sizes and capacities are not so much the problem, because when the process is
running, different machines work one on the other, such as dosing materials for next portion
while mixing and packaging last one.
Small ball mill and grinding machine needs to changed at some point, but so far the
production capacity is enough with these machines.
Besides this there are certain important issues which need to be handled soon, some of them
are highlighted below

29
Big potential customer needs to be identified.
Machine equipment needs to be improved.
Overall manufacturing process, machine equipments needs to be examined and
evaluated with the help of internal and external experts.
In the casting department all the mixers should be washed after every casting
operation. Mixers paddles and walls wear a lot if the washing hasn't been done. This
leads to lower maintenance costs and the men in maintenance department needs to do
less maintenance and repairing.
Moulding technique and working methods has to be developed too. Cranes should be
used always when moving moulds full or empty - not with workers physically.
Casting chutes should be made slippery (for example: urethane coatings + nano
coating finishing) or with vibrating so that the casting person have to do only opening
and closing of mixer hatch.
New order in storages materials should be as close as possible to the using place (new
facilities) and storing same materials in several places should be avoided. When there
is enough space in 40 m³ silos, the powders should be blown into them and it should
not be kept in big bags in storage halls.
Website of the company needs to be changed; it should contain more information
(Bet-ker Oy, 2012).
4.10 Application of pull materials through system
The pull production system is a part of lean manufacturing, under which the production is
made on the basis of customer needs rather than demand forecasting. Under this system the
information flows from prevailing market to production. As the pull system works on the basis
of customer and helps a manufacturer to maintain cost effective production of service or goods
required by the end users. Thus the end users are the key player in the pull system of
manufacturing.

30
In the present world of business the customer needs are specific, they are always looking for
quality product with lower price but from the manufacturer perspective it has always been
challenging to meet the customer needs in terms of quality and cost. The proper
implementation of pull system plays a bridge between end customer and manufacturer. Which
means with pull system of manufacturing production inventories are reduced, work in progress
is not exceeding the market demand, which helps manufactures to maintain low cost of
production to a great extent.
Pull system can be implemented in different forms as mentioned below:
Kanban card: A kanban card is a technique which helps to maintain quantity of goods
manufactured or delivered in desired level before the scarcity arises. Kanban card can
have different colors depending upon the priority and its use. Generally in kanban
system move and production cards are used, where move card represents goods
moving from one production unit to another; while production card guides to replace
goods once they are sold or used.
Level scheduling: It is a methodology which helps to maintain regular flow of materials during production. At the same time it helps to meet the changes in demand levels through proper scheduling or production planning.
Quick change over technique: It is a strategy which helps us to reduce setup time for machine and equipments and also it guides us to adopt the changing environment (changes in demand, changes in production methods or specification etc) in short span of time.
Small lot production: This approach helps us to produce small lot production on regular basis. So the flow of materials can be maintained easily.
The main benefits of the pull system is that, it provides flexibility in manufacturing to respond
the customer needs along with the reduction in manufacturing waste, But to implement these
technique a proper forecasting and good coordination between sales and manufacturing
department is necessary (Jack B. Revelle, 2002).

31
4.11 Advantage & Disadvantage of Pull system of manufacturing
The advantages of pull system are as follows
Helps to reduce production cost.
Helps to reduce inventory cost.
Proper utilization of resources.
Acts as delegation to employee, supplier, management etc.
Provides fast response to task.
Helps to meet the customer demands.
Provides better communication between customer, supplier and manufacturer.
Helps to organize work place effectively.
Helps to reduce lead time and work in progress inventory in some extent.
Helps to maintain proper flow of information.
There are certain disadvantages of the pull system of manufacturing some of them are as
follows:
It creates problem in manufacturing if one unit is broken because the production
needs to follow series of task through different shells.
A proper co-ordination and long term relationship is needed between customer,
supplier and manufacturer.
It is not suitable for the products with high variability of demand.
Though it has some drawbacks, the use of pull system of manufacturing helps a firm to be a
key player in the market (Stephen N. Chapman, 2006).

32
5 SUPPLY CHAIN MANAGEMENT
5.1 Introduction
Supply chain management is the active management of supply chain activities and
relationships in order to maximize customer value and achieve a sustainable competitive
advantage. It represents a conscious effort by a firm or group of firms to develop and run
supply chains in the most effective and efficient ways possible (Cecil C. Bozarth& Robert B.
Handfield, 2008).Moving things from here to there is common in our daily lives, whether it is
a movement of goods within your room or between different organizations to fulfilling
customer need. All these activities are covered by supply chain management. Thus the
movement of raw materials to manufacturing unit to the end customer and receiving of
feedback from customer is known as supply chain. In the process of supply chain there is
movement of capital, information, goods, and services from one destination to other. It is a
two way process from suppliers to manufacturer followed by end users and vice versa.
Simply the supply chain can be described by the following diagram but it’s not as simple as
we see.
GRAPH 9. Supply chain Process (Donald Waters, 2003)
33
The different activities in supply chain can be listed as follows
Supplier selection
Inward transportation
Outward transportation
Information management
Manufacturing of products and development of services
Warehousing
Material requirement planning
Master scheduling
Reverse flow of goods, service, capital, information management
A supply chain can be designed and managed in the following steps:
Identify the prevailing & needed resources
Formulate the strategy
Implement the strategy
Evaluate the performance
Keep on improving
Maintain the records of each activities for future reference
Supply chain plays an important role in overall performance of an organization. Awell
organized supply chain management provides better quality of products or service produced,
helps to reduce operating cost, improves customer service, satisfaction, and increases profit.
More than this it helps a firm to be competitive in the market with better performance (Donald
Waters, 2003).

34
5.2 Types of bottlenecks in supply chain
Proper management of supply chain is not an easy task. There can be different obstacles in the
process of supply chain some of then are listed below:
Inefficient management
Poor forecasting
Inadequate facility in warehouse
Obstacles in supplier selection and substitution
Limited supplier
Warehousing and location problem
Availability of resources
Lack of finance
Quality issue
Legal issues
Difficulties in performance measurement
Problem of inventory management
Obstacle in flow of Information
5.3 Methods to create flow of products
The aim of the supply chain management is to provide appropriate raw material to
manufacturer, right product to the end costumer in a reasonable time with a competitive price.
During the process of movement a proper flow of material, capital and information needs to be
maintained.
The movement of product during manufacturing process through a series of operations in a
forward direction until till the final product is delivered to a desired customer is known as flow
of products. It can be better explained with the following diagram.

35
FIGURE 10. Flow of product
In the present world of complex business, requirement of customer is always changing. Hence
all the manufacturer of goods and services faces a lot of challenges to create flow of products.
Still there are some methods to maintain flow of products in the supply chain, which are as
outlined below.
Creating demand
By increasing sells
Implementation of lean production
Removing bottlenecks
When there is demand for a product or if the manufacturer can creates a demand for its
products, there will be an automatic flow of products in several ways but in the market it is
rather easy to fulfill the customer needs than creating demand for the product. Though it’s a
challenging task, if maintained can be a tool for product flow in supply chain.
On the other hand, if a manufactures can boost up its sales by making customer more aware of
the products manufactured, ultimately creates demand for the product, which leads to proper
flow of products in the supply chain.
Once the demand for product or service is created through boosting sales, the principles like
JIT and Lean production plays an important role in flow of products; as the basic objective of
JIT and Lean production is to maintain proper flow of products in the supply chain.
Similarly, with the help of methods mentioned in previous chapter it will not be difficult to
identify the bottlenecks in the system; with proper planning and implementation any obstacle

36
in the supply chain can be eliminated. When an obstacle of the system is removed it leads to
proper flow of products in the supply chain.
5.4 Supply chain of Bet-ker Oy
To analyze the supply chain I made some questionnaires (see appendix 2) and asked different
employee to answer them in details from their perspective. The following description and
findings are based on the information provided to these questions.
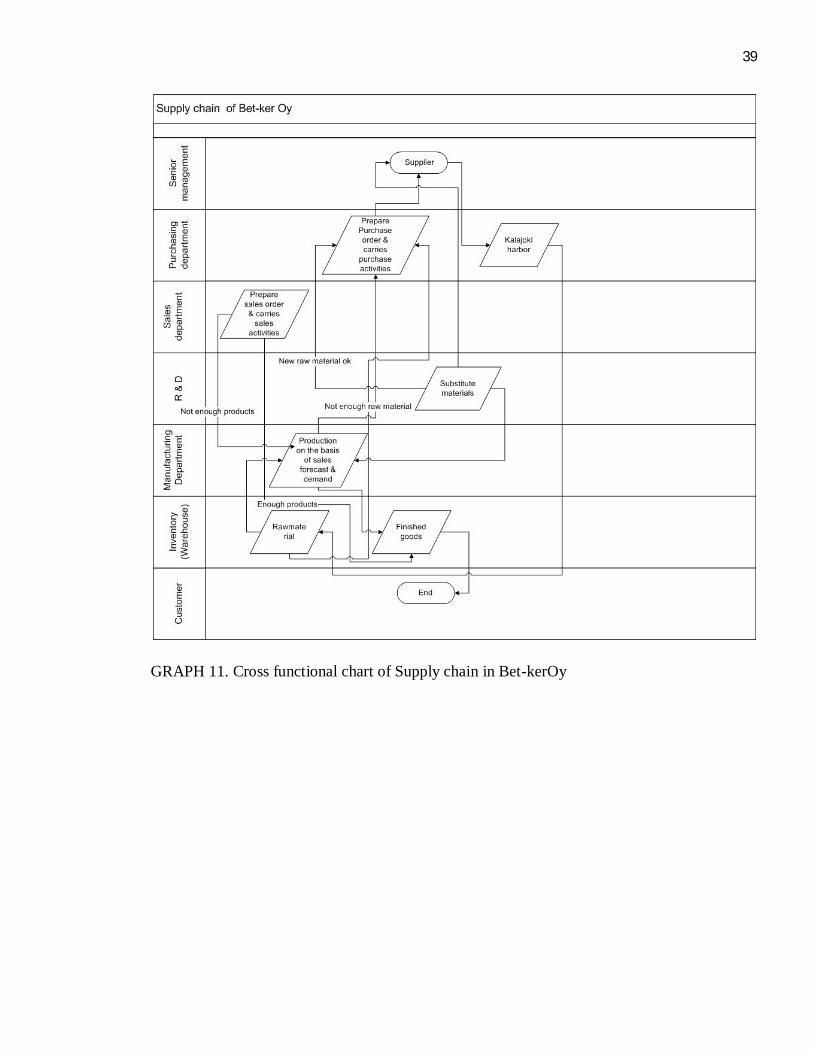
The supply chain of Bet-ker Oy, can be broadly divided in to different groups on the basis of
work done by departments like Purchasing, Sales, Production, R&D, Warehouse. The function
of each department is described below:
Purchases department
Production manager is responsible for planning of the purchases. Production manager
calculates the required amount of materials regarding the sales orders and forecast. Managing
Director however negotiates the prices and the terms of delivery in advance and Secretary
carries out orders on the basis of these agreements and instruction given by production
manager. In case of main contracts (big ship loads), Managing Director negotiates and makes
orders by himself. Production manager also makes orders of raw materials from Finland as
required.
Raw materials are stored in warehouse for about few months (in case of big ship load it can
last for longer) depending on type of raw materials and requirements. Delivery time plays an
important role for making orders of raw materials. Hence the order of raw materials is carried
out from days or weeks to few months in advance.
Most of the raw materials are acquired from China and Norway; other import countries are
European countries and Russia. Only a small part of the raw materials are acquired from
Finland.

37
Aggregate materials in bulk are shipped to Kalajoki Rahja harbor, where Bet-Ker Oy also has
bulk storage. The raw materials are unloaded from ship to storage then later transport to
manufacturing unit as and when necessary. Some of the raw materials are directly transported
to the customers depending upon customers requirements. From Kalajoki to Ylivieska and to
customers, the transportation is handled with private enterprises trucks and tank trucks.
Most often the raw materials with smaller loads i.e. truck loads (24mt to 26mt) come directly
to Ylivieska for example from Helsinki or Oulu harbor.
Sales department
Sales manager and Managing director makes the offers and also negotiates sales with clients.
They also actively visit clients as well as product advisor and development manager. Then
sales orders are prepared in office according customers requirements and incentives offered.
During the process of making a sales order the delivery time is confirmed with production
manager or supervisor.
The invoicing of goods is made at the same as delivery or next day most of the times, latest in
few days.
Production department
Manufacturing is based on the orders and sales forecasts. Very few products are manufactured
in advance and stored in warehouse. The big potential customer has long tern contract, hence
deliveries are known and can be predicted in advance. In case of element production, goods
produced are stored in warehouse so that a bigger load can be transported.
Production plan is based on orders and forecasts and prepared by production manager and
supervisor. During the process of production planning it is important to know which type of
mixture is good to be produced in a row, this helps to make similar types of mixture at the
same time. Some time small quantities are prepared in advance and stored in warehouse if
needed.

38
Research and development department
Development manager often orders samples of substitute or new trail materials which then are
tested in laboratory. Also new batches are always tested in laboratory as well as own products
during the production.
Warehouse
Employee of warehouse carries of reception of materials, sending products and agrees
transports with carriers. Inventories are revised on monthly basis, which helps in production
planning and purchase planning. It also helps to tally the data maintained in the computer
system.
This is how supply chain is carried out in Betker Oy (Bet-kerOy, 2012).
39
GRAPH 11. Cross functional chart of Supply chain in Bet-kerOy

40
5.5 Analysis of supply chain in Bet-ker Oy
In case of Bet-ker Oy, the supply chain is not very complicated as it follows a simple path
from raw materials supplier to manufacturing unit and from manufacturing unit to the desired
customer. As the raw materials supplier and the customers are also limited it does not faces
complex problems; however there are several activities which need significant improvements.
There are no major distinguished bottlenecks in the supply chain e.g. related to raw material
supply. But in some cases the lead time for raw materials can take up to two months. Related
to aggregates shipped by vessel to Kalajoki harbor, a cold winter season has to be taken into
consideration when ordering raw materials. In some winters the harbor is closed for about 1–2
months due to the cold environment. These are the uncertain and unpredictable problems of
supply chains which need to be solved according to time and situation; a proper speculation
and forecasting could be an advantage. At the same time the company has well experience of
such cases well prepared for when to order and for how long time.
On the other hand the product delivery supply chain seems to be fine; there are not any
significant problems. At the same time the delivery of products has been challenging as
regards cost of transportation. Sea transport would be most effective, but requires big
quantities and suitable locations of the customer.
Domestic supply chain has found to be top quality i.e. the company is able to provide
flexibility and quick service, short lead time, strong customer service, while the overseas
operations have been comparatively weak.
41
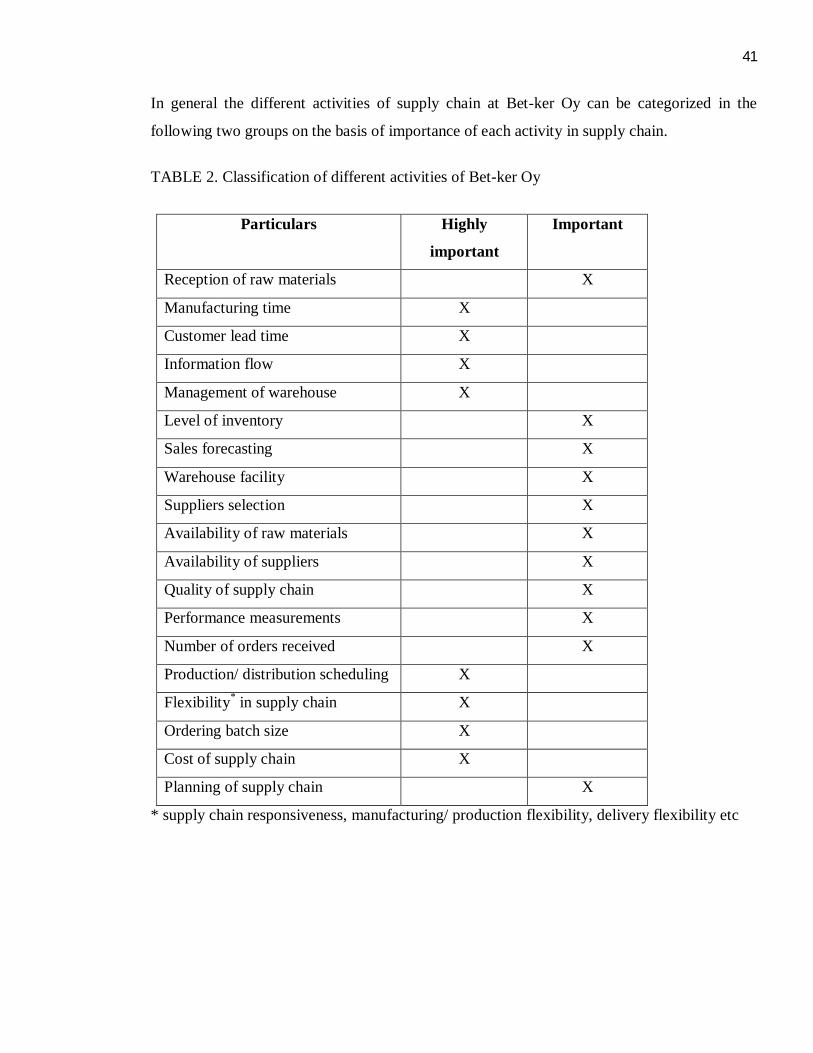
In general the different activities of supply chain at Bet-ker Oy can be categorized in the
following two groups on the basis of importance of each activity in supply chain.
TABLE 2. Classification of different activities of Bet-ker Oy
Particulars Highly
important
Important
Reception of raw materials X
Manufacturing time X
Customer lead time X
Information flow X
Management of warehouse X
Level of inventory X
Sales forecasting X
Warehouse facility X
Suppliers selection X
Availability of raw materials X
Availability of suppliers X
Quality of supply chain X
Performance measurements X
Number of orders received X
Production/ distribution scheduling X
Flexibility* in supply chain X
Ordering batch size X
Cost of supply chain X
Planning of supply chain X
* supply chain responsiveness, manufacturing/ production flexibility, delivery flexibility etc
42
5.6 Findings of analysis
In general all activities and management of the supply chain in Bet-ker Oy are well organized,
according to my research and analysis there are not any huge bottlenecks in the system which
are creating obstacles in the process. However, there were following issues which need
management attention.
More overseas customer needs to be found
There is no significant retail segment for most of the products
Limited availability of warehouse space
Lack of proper supply chain strategy to compete with foreign rivals
5.7 Recommendations for improvements
After analyzing the supply chain of Bet-ker Oy, I came up with the following
recommendations in order to improve overall efficiency of supply chain.
Benchmarking of supply chain of foreign competitors in relation to own
performance
In-depth analysis of supply chain is to be done in order to reduce the cost of
supply chain
Improvement in the warehouse facility
National and international retail segment needs to be identified
Operational improvement objective needs to be formulated
Improvement targets needs to be determined
Regular analysis of supply chain and continuous improvement must be performed

43
5.8 Tools to reduce cost in supply chain
The cost of supply chain includes cost of all the activities that are associated with procurement
of goods and services from collection of raw materials to delivery of final goods or services to
the end customer. Total cost reduction is the greatest challenge of supply chain. The following
tool helps us to reduce the cost of supply chain to some extent.
5.8.1 Product portfolio planning/Product lifecycle management
There always is possibility for improvement and new development in the products. So Product
portfolio planning/Product lifecycle management helps to know the present market needs and
shows the way to find new product in order to sustain and be key player in the market. In fact
it provides the basis for R&D of the company starting from product conception, manufacturing
and decline from the market. In product portfolio planning product rationalization is the key to
cost reduction in supply chain because it helps to identify new products or ways to reduce cost
of production (Michael R. Czinkota, Ilkka A. Ronkainen & Bob Donath, 2004).
5.8.2 Recycling the waste and faulty products
Products’ recycling is also a good approach for cost reduction in supply chain. Under this
approach the products which are recyclable should be collected from the market and also
waste coming from the production needs to be recycled in order to reduce manufacturing and
raw material cost.
In case of Bet-ker Oy, there is a lot of potential in the reclaimed refractory materials in many
senses. Meanwhile there are important projects going on.

44
5.8.3 Lean manufacturing
It is a manufacturing philosophy developed by Toyota, this system of manufacturing is based
on maximizing the value that a customer willing to pay and reducing waste in the process of
manufacturing. It provides the benefits such as
On time production
Optimizing utilization of resources
Reduces the waste
Low cost of production
Continuous improvement
The success of lean manufacturing depends upon the mutual co-operation of the management
and employee (Jack B. Revelle, 2002).
Hence the Lean manufacturing is a toll to reduce cost in supply chain.
5.8.4 Just in time (JIT)
Just in time (JIT) is a classical approach in production planning and inventory management,
under which the goods required for manufacturing are received only just before they are
needed to meet the customer requirements. The main advantages of JIT are
It helps to minimize waste in manufacturing.
Continuous improvement.
Helps to reduce batch size and machine equipment setup time.
Redesign of shop floor layout etc
45
Even though the JIT requires a accurate demand forecasting, is a good tool to reduce cost in
supply chain (Thomas E. Vollmann, William L. Berry & D. Clay Whybark, F. Robert Jacobs,
2005).
5.8.5 Direct shipment
When the manufacturer sends the goods manufactured directly to the end customer it is known
as direct shipment. Under this method the retailers are bypassed in the process of shipment,
but the reverse logistic follows the path through retailer. In order to achieve benefits from
direct shipment manufacturer need to know the value of demand so that the supply chain can
provide right goods on right time with minimum level of inventory (Sunil Chopra & Peter
Meindl 2010).
5.8.6 Some other ways to reduce cost of supply chain
Generally there can be a number of ways to reduce the cost of supply chain some of them are
given below:
Right product in first time
Reduce material use and waste
Benchmark practices and cost against an extensive database of
comparable companies
Define new cost savings and performance matrix
Use of proper manpower and machine equipment
Be aware of lowest rate of different cost drivers in supply chain
Reduce claim
(Tompkins associates, 2012; The journal of commerce, 2012).

46
6 PROJECT MANAGEMENT
6.1 Introduction
“A specified task in a specific time frame with specific aims and objectives to be achieved in a
specified way can be defined as a project. The project can be anything from a simple task (e.g.
birth day celebration) in our daily life to a complicated research and development. “A project
is a temporary endeavor undertaken to create a unique product or service. Temporary means
that every project has a definite beginning and a definite end. Unique means that the product
or service is different in some distinguishing way from all similar products or services”
(William R. Duncan, 1996, 4).
In Bet-ker Oy there are several projects running, some examples are listed below
New product development
Creating new market
Supply chain management
Handling quality issue
Process development
Training and personal development of employee
Work safety handling
Design of process layout etc.
The act of managing recourses (capital, manpower, time, material etc) needed for the
completion of a project is known as project management. According to investopedia “Project
management typically involves a one-time project rather than an ongoing activity, and
resources managed including both human and financial capital”.
Project management is the application of knowledge, skills, tools, and techniques to project
activities in order to meet or exceed stakeholder’s needs and expectations from a project
(William R. Duncan, 1996, page no.6).

47
Basically every project has the similar pattern for development and execution. A project can
be planned as shown below:
GRAPH 12. Steps to crate project plan (William R. Duncan, 1996, 31)
Once the project plan is formulated it is better to make work break down structure (WBS), it is
a process to divide different task in to precise and manageable form. WBS also helps to
control the task, define several work packages with time line along the cost estimation and
budgeting (Thomas W. Grisham, 2010, published by John Wiley & Sons).

48
GRAPH 13. Example of WBS
Similarly, Gantt chart is also a good tool to represent the whole project graphically. It helps to
schedule, co-ordinate and track specific task in a project. In a Gantt chart total estimated time
is shown in the horizontal axis in the forms of days, weeks or months depending on the type of
project while the different tasks are shown in vertical axis (University of Southampton, 2012).
A simple example of Gantt chart is shown below:
GRAPH 14. Example of Gantt chart(University of Southampton, 2012)
49
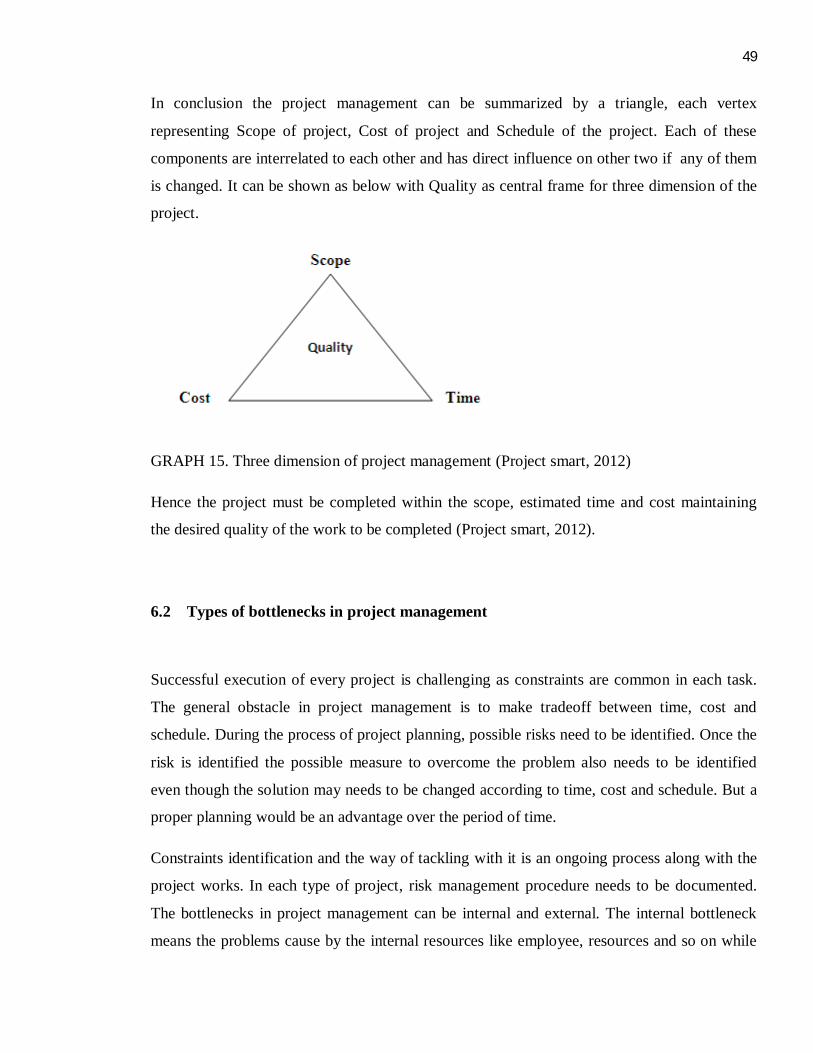
In conclusion the project management can be summarized by a triangle, each vertex
representing Scope of project, Cost of project and Schedule of the project. Each of these
components are interrelated to each other and has direct influence on other two if any of them
is changed. It can be shown as below with Quality as central frame for three dimension of the
project.
GRAPH 15. Three dimension of project management (Project smart, 2012)
Hence the project must be completed within the scope, estimated time and cost maintaining
the desired quality of the work to be completed (Project smart, 2012).
6.2 Types of bottlenecks in project management
Successful execution of every project is challenging as constraints are common in each task.
The general obstacle in project management is to make tradeoff between time, cost and
schedule. During the process of project planning, possible risks need to be identified. Once the
risk is identified the possible measure to overcome the problem also needs to be identified
even though the solution may needs to be changed according to time, cost and schedule. But a
proper planning would be an advantage over the period of time.
Constraints identification and the way of tackling with it is an ongoing process along with the
project works. In each type of project, risk management procedure needs to be documented.
The bottlenecks in project management can be internal and external. The internal bottleneck
means the problems cause by the internal resources like employee, resources and so on while

50
external bottleneck means the problems caused by the external environment like change in
customer needs, change in rules and regulation, increase in the price of raw materials and so
on. The common challenges in a project are
Lack of resources
Not enough time to complete the task
Flow of information
Unclear roles and responsibilities
Unclear working methods or procedure
Right person at right position
Right work at right time
Occurrence of unexpected situation
Commitment by customer
Conflict or misunderstanding within team
Pressure of work i.e. high individual work load
Management problems etc
Hope for the best and be prepared for the worst is the key for identifying, solving and
successful execution of the project.
6.3 Measurement of overall efficiency
“How to say a project is successful project?” Is a common question in the measurement of
overall efficiency of a project. A project is said to be successful if the aim and objective is
achieved within the planned cost, expected time frame and allotted resources with out any
unexpected problems. The over all efficiency of the project is determined by the out come of
the project in relation to inputs in the project (time, cost and resources).
According to the U.S. Accounting general office (GAO), Performance measurement is the
ongoing and reporting of program accomplishments, particularly progress towards pre-
established goals. It is typically conducted by program or agency management. Performance

51
measures may address the type or level of program activities conducted (process), the direct
products and services delivered by a program (outputs), and/or the results of those products
and services (outcomes). A “program” may be any activity, project, function, or policy that
has an identifiable purpose or set of objectives.
The performance measurement provides us guideline for the control & monitor, improvement,
directs towards goals and objective, check the effectiveness of the work or task of an
organization. A well planned and organized performance measurement tool gives the
following information
Are we performing well?
Are we achieving our goals and objectives?
Are our customers or the targeted group happy?
Are our all of the works is under control?
Are our monitoring processes effective?
Do we need further improvements? If yes where?
According to “The performance- Based Management Handbook, Volume two (Establishing an
integrated performance measurement system), September 2001” most of the performance
measure can be grouped in the following six groups:
Effectiveness: It indicates whether the project output is according to desired
standards.
Efficiency: It indicates the utilization of resources with the minimum cost.
Quality: It indicates whether the quality of product or service is according to
customer requirements and expectation.
Timeliness: It indicates whether the work is completed on time or not.
Productivity: It indicates effectiveness of the process. It is calculated by dividing
value added by the process to the value of labor and cost incurred.
Safety: It helps us to measure the overall health and safety issues of the
organization and the working environment of its employee.

52
6.4 Tools to measure overall efficiency
In order to be more profitable it is necessary to utilize all the resources in a proper way. But in
the process of working in real life it is quite often that the assets and resources are not utilized
effectively either by this or that reason. In general the overall efficiency of the project can be
measured with the help of following tools.
6.4.1 Balance score card
Balance score card is a management tool can be used by any type of organization whether it is
private, government, profit motive or non-profit motive organization. It helps an organization
to make a balance, between time, money, resources, mission, vision and objective as well as
control & monitor organization’s performance. It was developed by Dr. Robert Kaplan and Dr.
David Norton in the early 1990s. Balance score card is a management and measurement
approach to analyze organization’s performance in four different dimensions like financial
analysis, customer analysis, internal analysis and learning & growth analysis (The balance
scorecard institute, 2012).

53
GRAPH 16. Balance score card (The balance scorecard institute, 2012)
6.4.2 Earned value analysis
According to user guide for MS project-2003, Earned value analysis is defined as “A method
for measuring project performance. It indicates how much of the budget should have been
spent, in view of the amount of work done so far and the baseline cost for the task,
assignment, or resources.”
Earned value analysis is a performance measurement tool designed to measure current
performance of a project in terms of time cost and schedule. In fact it shows the relationship
between the project plan, works completed and let us know whether we are on the right track
or not. Thus helps to schedule our future.
For proper utilization of earned value analysis, a project needs to be divided in to small tasks
called work breakdown structure (WBS) along with specific budget for each task. And each
task needs to follow certain time schedule. This is considered as planned value while the task

54
completed is called earned value. These two values are compared with each other to know the
present and predicting future results.
The three common terms of earned value analysis method of performance measurement can be
defined as follows:
Budgeted cost of work schedule (BCWS): It is the sum of all allotted budget for
different task in the project, which needs to be completed in a certain time frame.
This is also called Planned value (PV)
Budgeted cost of work performed (BCWP): It is the sum of all budgets of the tasks
completed in an assigned time frame. This is also called earned value (EV)
Actual cost of work performed (ACWP: It is the amount of actual cost incurred
during the completion of task in an assigned time frame. This is also called actual
cost(AC)
By utilizing these values cost performances index (CPI) and schedule performance index (SPI)
can be calculated as
Cost performance index (CPI) = BCWP/ACWP; this ratio gives the measure of success
towards reaching the schedule budget. If the ratio is less than 1, it means that the value
earned from spent budget is less than expected. And if the ratio is equal to 1, the value
earned from the expected budget is equal to expected.
Schedule performance index (SPI) = BCWP/BCWS; this ratio gives the measure of
work progress in relation to plan. If the ratio is less than 1, it means that the work
progress is not as planned. And if the ratio is equal to 1, the work progress is according
to plan (Project management, Denish Lock, 2002).

55
6.4.3 Project life cycle
A project starts with project initiation and ends with handing over of liability. As a life cycle
it can be divided into six phases i.e. project ignition, project definition, project planning,
project execution, project delivery and project end. A successful project follows the path of
normal distribution. Different stages in project lifecycle also can be used as a tool for
management, control and monitor a project (William J. Stevenson, 2009).
GRAPH 17. Project life cycle (William J. Stevenson, 2009)
6.5 Analysis of works under value added and non-value added
The activities for which customer is willing to pay can be referred as value added activities,
while the activities for which customer is not willing to pay comes under non-value added
activities.
Better profit can be achieved through low cost of production, producing quality goods,
responding to customer requirements and so on. All these works add value. In the same time

56
non-value added activities (e.g. long lead time, poor quality goods, high production cost etc.)
or waste needs to be eliminated with best practice of works (Hubpages,2011).
To analyze the project management of Bet-ker Oy, I made some a form (see appendix 3) and
asked different employee to complete it from their perspective. The following description and
findings are based on the information provided to these questions.
Non value added works carried in Bet-ker Oy, are grouped under different activities and
shown in the following table.
TABLE 3. Non-value added works in Bet-ker Oy
Group of Activities Non-value added work
Logistics/Supply chain
management
i. Transportation problem
ii. Delayed or missing information
iii. Arrival of raw material in wrong time
Production/Manufacturing
iii. Misplaced material
iv. Meshed workplace
a. Leads to accidents
b. Causes defects in production
v. Unsafe working environment
a. Lack of safety equipment
b. Lack of knowledge and education
vi. Lack of information
vii. Lack of raw material
viii. Not doing things right at the first time
ix. Breakdown of machines &equipments
a. Anticipatory service missing
x. Long setup time
xi. Lack of planning
a. Wrong production order sequence
b. May cause extra cleaning

57
c. May cause contamination
d. May cause extra raw material loading work into
silos or reload
xii. Too much waste & scrap
xiii. Mistakes in production e.g. Human errors
xiv. Over processing
xv. Unscheduled machine maintenance or repairs
xvi. Long lead time
xvii. Defects in manufacturing
a. Wrong recipe
b. Wrong material in the silo
c. Wrong definition of silo parameters
d. Wrong fine dosing parameters
e. Wrong forward clip in material dosing
f. Defects in process computer programs
xviii. Waiting
xix. Contamination
a. Raw materials
i. Contaminated when received
ii. Contaminated during processing
b. Intermediate products and products
i. Contamination during processing
Quality control
i. Too much or too less sampling
ii. Inadequate documentation
iii. Poor management of in-house reclamations
iv. Poor management of client reclamations
Ware house management
i. Too much or too less inventory
ii. Unorganized warehouse

58
iii. No safety stock /too much safety stock
Management and
administration
1. Lacks in leadership skills
a. Economy
b. R&D, customer service and Engineering
c. Handling personnel
d. Marketing, outsourcing and raw material
purchasing
e. Net-working
f. Language skills
g. Computer & communication skills
h. Lack in encouraging
i. Suitable challenges missing
ii. Tedious work
iii. Bonus is missing
i. Defects in preparing future challenges
i. Legislation
1. Environmental & working
environment related
2. Product related
3. Raw material related
ii. Changes in the customer market
iii. Changes in the supplier market
It is seen that there are number of visible non value added works carried out in Bet-ker Oy, all
these works either this way or that, wasting the resources of the company. So in my opinion by
developing a quality manual for the overall operation of the company would be a good way to
over come non value added works in the system. At the same time more value can be added to
a product or service produced by the application of principles like Just in time manufacturing
(JIT), Lean manufacturing, Six sigma methodology.

59
7 CONCLUSION
Degree of removing bottleneck is directly proportional to the volume of production, which
means once the bottleneck is identified and removed; its direct effect can be seen as increase
in production capacity. What to do when the production is increased? Of course it needs to be
adjusted in the market.
At the same time financial expenses made to remove the bottlenecks also play an important
role. As for example if a machines capacity is 100 units/hr, but due to lack of power it can
only produce 75 units/hr, to run the machines in full capacity there needs an alternative source
of power like diesel generator or some other sources, now the question is will it be profitable
to install the diesel plant to increase the machine in full capacity (100%). Will those extra 25
units/hr is going to cover the cost of operation? Is firm going to make extra profit? If yes it is
worth full to install the diesel plant otherwise it is wise to run the machine in lower capacity.
This means while making investments for process improvement, profitability or importance of
the works needs to consider while making decisions.
7.1 Road map for the improvement
From my research and findings in case of Bet-ker Oy, there are several things that need to be
improved in order to use all the resources of the manufacturing in maximum possible capacity.
As follows the courses of actions are listed on the basis of priority.
Company’s webpage needs to be improved as soon as possible, as it does not
provide any useful information.
Development of quality manual.
Big potential customer needs to be explored.

60
Machine equipment need to be changed e.g. small ball mill machine (grinding
machine) needs to be replaced.
In general manufacturing process, machine equipment need to be examined and
evaluated with the help of internal and external experts.
Benchmarking of supply chain of foreign competitors in relation to own
performance is needed.
In-depth analysis of supply chain is to be done in order to reduce the cost of supply
chain.
Improvement in the warehouse facility.
National and international retail segment needs to be identified.
Operational improvement objective needs to be formulated.
Improvement targets need to be determined.
Regular analysis of supply chain and continuous improvement must be performed.
In fact the entire activities of the Bet-ker Oy need in-depth evaluation first by the upper
management team and later it may hire external experts if necessary. I believe this will help to
increase profitability of the company.
The following table gives a fixed target in view of the improvement in the short run and long
run.
TABLE 4. Improvement work in short and long run
Within six months Within a year In the future
Lab. test sieving database (in
progress). New large pre-
shape mixing unit installation
and testing shall be carried
out (in progress)
Dosing silo capacity increase
possibility should be studied.
New customers should be
found, especially for big pre-
shapes (new mixer and excess
drying capacity existing)
New ball mill needs to be
installed; warehouse or
dosing silo capacity must be
increased. New products
and production methods
needs to be identified.

61
In my opinion these course of action will definitely help Bet-ker Oy to remove present and
future bottlenecks in the system. So the company will be top in the market and among the
competitors. The future growth in terms of profitability and Market share verses Time and cost
can be shown by following graph.
GRAPH 18. Forecast of future growth of Bet-ker Oy with time
Thus with time there will be increase in investments in order to remove bottlenecks from the
system at the same time there will be significant growth in profitability and market share of
the company.

62
REFERENCES
A guide to the project management body of knowledge, William R. Duncan, 1996, published
by Project management institute, USA. Available
at:http://www.unipi.gr/akad_tmhm/biom_dioik_tech/files/pmbok.pdf Accessed: 1 February
2012.
Asian Development Bank, 2012 Available
at:http://www.adb.org/Documents/Information/Knowledge-Solutions/The-Five-Whys-
Technique.pdfAccessed 1 February 2012.
Bet-kerOy, 2012.
Biology online, 2012.Available at: http://www.biology-online.org/dictionary/Data_collection
Accessed: 3 February 2012.
Business dictionary, 2012.Available at: http://www.businessdictionary.com/definition/data-
collection.html Accessed: 3 February 2012.
Business excellence, 2012.Available at: http://www.bexcellence.org/Data-Collection.html
Accessed: 3 February 2012.
Changing Minds, 2012. Available at:
http://changingminds.org/disciplines/hr/job_analysis/process_analysis.htmAccessed: 3
February 2012.
Dmaic tools, 2012Available at:http://www.dmaictools.com/dmaic-analyze/5-why Accessed: 1
February 2012.
Half cost products, 2011. Available
at:http://www.halfcostproducts.com/scm_cost_reduction.htm Accessed: 3 December, 2011.
Hubpages, 2011. Available at:http://kentent.hubpages.com/hub/What-is-value-added-work-
and-non-value-added-work Accessed: 31 January 2012.

63
International project management, Thomas W. Grisham, 2010, published by John Wiley &
Sons.
Introduction to Operations and Supply chain Management, Cecil C. Bozarth& Robert B.
Handfield, 2008, published by Pearson Prentice Hall.
Investopedia, 2012. Available at:http://www.investopedia.com/terms/p/project-
management.asp#axzz1kuHJuVaZ Accessed: 31January 2012.
Lean production, 2012.Available at:http://www.leanproduction.com/theory-of-constraints.html
Accessed: 3 February 2012.
Logistics: An introduction to supply chain management by Donald Waters, 2003, published by
Palgrave Macmillan.
Manager’s guide to Operations Management, John Kamauff, 2010, published by McGraw-
Hill.
Manufacturing planning & Control Systems for Supply chain Management, Thomas E.
Vollmann, William L. Berry, D. Clay Whybark, F. Robert Jacobs, 2005, published by
McGraw-Hill.
Mastering the global markets, Michael R. Czinkota, Ilkka A. Ronkainen& Bob Donath, 2004,
published by Thomson south western.
National programme on Technology enhanced learning, 2011, Available
at:http://nptel.iitm.ac.in/courses/113104058/mme_pdf/Lecture15.pdfAccessed: 22
November2011.
Operations Management, William J. Stevenson, 2009, published by McGraw-Hill/Irwin.

64
Overview of refractory material- A. Bhatia, 2011, Available
at:http://www.pdhonline.org/courses/m158/m158content.pdf Accesses on 17th November
2011.
Process analysis, 2012. Available at:http://www.processanalysis.org/Accessed: 3 February
2012.
Project smart, 2012. Available at:http://www.projectsmart.co.uk/introduction-to-project-
management.html Accessed: 31 January 2012.
Quality management theory and application, Peter D. Mauch, 2010 published by CRC press.
Search EnterpriseWAN, 2012. Available
at:http://searchenterprisewan.techtarget.com/definition/capacity-planning Accessed: 3
February 2012.
Small business took kit, 2012Available at:http://toolkit.smallbiz.nsw.gov.au/part/13/68/287
Accessed: 3 February 2012.
SMC Focus, 2012. Available at:http://www.scmfocus.com/sapplanning/2010/06/27/material-
constraints-in-snp/ Accessed: 3 February 2012.
Supply chain management, Sunil Chopra & Peter Meindl 2010, published by Pearson.
The balance scorecard institute, 2012. Available
at:http://www.balancedscorecard.org/BSCResources/AbouttheBalancedScorecard/tabid/55/De
fault.aspx Accessed 31 January 2012.
The fundamentals of production planning and control, Stephen N. Chapman, 2006 published
by Pearson Prentice Hall.
The goal, Eliyahu M. Goldratt& Jeff Cox,2004, published by The north river press.

65
The journal of commerce, 2012. Available at:http://www.joc.com/2010/10-strategies-reduce-
supply-chain-costs-ltlAccessed: 31 January 2012.
The management and control of quality, James R. Evans & William M. Lindsay, 2008,
published by South western Cengage Learning).
The manufacturing handbook of best practices, Jack B. Revelle, 2002, published by CRC
Press LCC.
The performance- Based Management Handbook, Volume two (Establishing an integrated
performance measurement system), September 2001 Prepared by the Training Resources and
Data Exchange Performance-Based Management Special Interest Group.Available
at:http://www.orau.gov/pbm/pbmhandbook/Volume%202.pdf Accessed: 3 January 2012.
The refractories Institute, 2011. Available
at:http://www.refractoriesinstitute.org/aboutrefractories.htm Accessed: 15 November 2011.
The refractories manufacturers association of Australia, 2011, Available
at:http://refractoriesaustralia.com/refactories.html Accessed: 17 November 2011.
The times 100 business case studies, 2012. Available
at:http://www.thetimes100.co.uk/downloads/theory/environmental_constraints.pdf Accessed:
3 February 2012.
Tompkins associates, 2012. Available
at:http://www.tompkinsinc.com/costreduction/reduction_riddle.asp Accessed: 31 January
2012.
Total quality management, organization and strategy by James W. Dean, Jr. James R. Evans,
1994 published by West Publishing Co.
University of Florida, 2012. Available at:http://oeas.ucf.edu/process_analysis/what_is_pa.htm
Accessed: 3 February 2012.

66
University of Southampton, 2012.Available
at:http://www.soton.ac.uk/~jps7/Aircraft%20Design%20Resources/project%20management/g
anttv1.pdf Accessed: 31 January 2012.
Wise GEEK, 2012. Available at:http://www.wisegeek.com/what-is-capacity-planning.htm
Accessed: 3 February 2012.

APPENDICES
APPENDIX 1/1
In order to analyze the manufacturing process and activities I made following forms and questions and asked different personnel to answer them.
1. Please complete the following form
Process steps inputs Potential problems
Effects of problem
Why problem occurred? Give reason
How many times problem has been noted
Current control methods used
Recommendations For future
Receipt of raw materials
Grinding/Crushing Pretreatment at high temperature
Mixing Molding Drying Firing Cooling & Sorting Quality check Packing
2. Describe the manufacturing process of BETKER OY 3. Describe the working of Bet-Ker Oy 4. What are the different types of machines used in production process? 5. What are the machines capacities for each machine? 6. Is the production capacity of each machine are in relation to each other? If not what
changes you think to make? 7. What would you say about types of man power i.e. qualification; training etc Do you
have sufficient manpower? What changes you feel to make in utilization of employee? 8. Is the entire machine working in full capacity? If not what is the reason behind it? 9. What type of changes in production facility can make a difference in production? Give
your view.

APPENDIX 1/2
10. What are the raw materials used? 11. What are the different types of product manufactured by Bet-Ker Oy? 12. Is your production process is equipped with latest machine equipment and technology?
What changes you would like to make? Why? 13. What types of problem are prevailing in production? What do you think to solve it? 14. What about the management system? Are there any things to change in your opinion? 15. What makes you to motivate for works? 16. What is the policy of your company? 17. How do you define the environment of your manufacturing unit? 18. How do you evaluate your manufacturing unit in general? Please fill out the following
form
1= Poor management 2= Needs to change Guide line for ratings. 3= It’s ok 4= Good 5= Excellent
Particulars Ratings Materials Equipment Process Management Policy Environment People

APPENDIX 2
In order to analyze the Supply chain, I made following forms and questions and asked different personnel to answer them.
1. Describe the supply chain process of Betker Oy? 2. How supply chain is maintained? 3. Describe the working of different departments in your company. 4. What are the costs of supply chain? Is there any means to reduce the cost of supply
chain? 5. What are the prevailing problems in supply chain management in Betker Oy? How to
solve those problems? Give your opinion. 6. What changes can be made in supply chain of Betker Oy? 7. Are you satisfied with the supply chain management of Betker Oy? Give reasons? 8. What are the improvements that can be made in Supply chain process of Betker Oy? 9. What things are good and bad in supply chain in your view? 10. Please fill the following form according to your experience in Betker Oy
Particulars Highly important
Important
Receipt of raw materials Manufacturing time Customer lead time Information flow Management of warehouse Level of inventory Sales forecasting Warehouse facility Suppliers selection Availability of raw materials Availability of suppliers Quality of supply chain Performance measurements Number of orders received Production/ distribution scheduling Flexibility* in supply chain Ordering batch size Cost of supply chain Planning of supply chain
*supply chain responsiveness, manufacturing/ production flexibility, delivery time
Note: Important in terms of reducing cost of production and increasing profit.
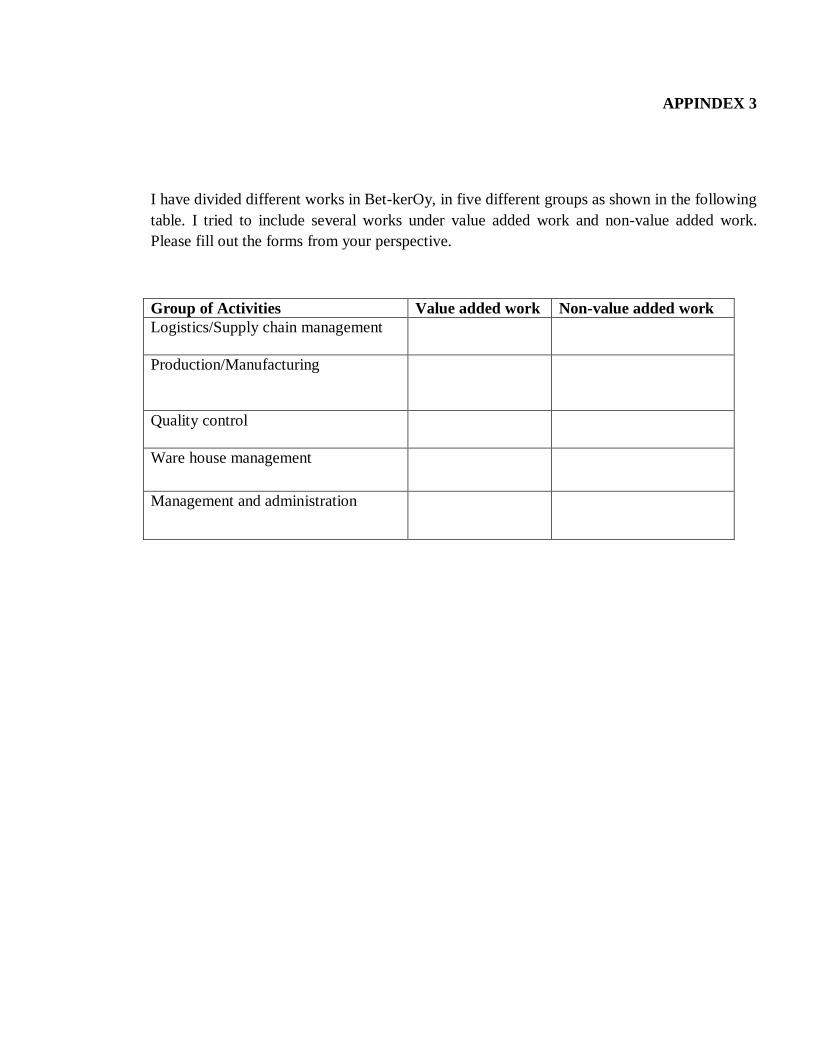
APPINDEX 3
I have divided different works in Bet-kerOy, in five different groups as shown in the following table. I tried to include several works under value added work and non-value added work. Please fill out the forms from your perspective.
Group of Activities Value added work Non-value added work Logistics/Supply chain management
Production/Manufacturing
Quality control
Ware house management
Management and administration