removals of heavy metals from bed sediment of brahmani...
TRANSCRIPT

DEPARTMENT OF CIVIL ENGINEERING, NIT ROURKELA
1 REMOVALS OF HEAVY METALS FROM RIVER BED SEDIMENT
Removals of Heavy Metals from Bed
Sediment of Brahmani River
A PROJECT SUBMITTED IN PARTIAL FULFILLMENT
OF THE REQUIREMENTS FOR THE DEGREE OF
Bachelor of Technology
In
Civil Engineering
BY
MUKUL MAHATO
110CE0044
UNDER THE GUIDANCE OF
Prof. Ramakar Jha
DEPARTMENT OF CIVIL ENGINEERING NATIONAL INSTITUTE OF TECHNOLOGY, ROURKELA
2014

DEPARTMENT OF CIVIL ENGINEERING, NIT ROURKELA
2 REMOVALS OF HEAVY METALS FROM RIVER BED SEDIMENT
CERTIFICATE
This is to certify that the Project Report entitled “Removal of Heavy Metals from Bed
sediment” submitted by Mr. Mukul Mahato in partial fulfillment of the requirements for the
award of Bachelor of Technology Degree in Civil Engineering at National Institute Of
Technology, Rourkela (Deemed University) is an authentic work carried out by them under our
supervision and guidance.
To the best of our knowledge, the matter embodied in this Project Report has not been submitted
to any other University/Institute for the award of any Degree or Diploma.
Date-
Prof. Ramakar Jha
Department of Civil Engineering, Nit Rourkela

DEPARTMENT OF CIVIL ENGINEERING, NIT ROURKELA
3 REMOVALS OF HEAVY METALS FROM RIVER BED SEDIMENT
AKNOWLEDGEMENTS
My heart pulsates with the thrill for tendering gratitude to those persons who helped me in
completion of the project.
The most pleasant point of presenting a thesis is the opportunity to thank those who have
contributed to it. Unfortunately, the list of expressions of thank no matter how extensive is
always incomplete and inadequate. Indeed this page of acknowledgment shall never be able to
touch the horizon of generosity of those who tendered their help to me.
I extend our deep sense of gratitude and indebtedness to our guide Prof. Ramakar Jha
Department Of Civil Engineering, National Institute of Technology, Rourkela for his kind
attitude, invaluable guidance, keen interest, immense help, inspiration and encouragement which
helped us in carrying out our present work.
I am extremely grateful to Prof. Kakoli K Paul member of Civil Engineering Department,
National Institute of Technology, Rourkela, for providing all kinds of possible help throughout
the two semesters for the completion of this project work.
It is a great pleasure for me to acknowledge and express my gratitude to my classmates and
friends for their understanding, unstinted support and endless encouragement during our study.
Lastly, I thank all those who are involved directly or indirectly in the successful completion of
the present project work.
MUKUL MAHATO

DEPARTMENT OF CIVIL ENGINEERING, NIT ROURKELA
4 REMOVALS OF HEAVY METALS FROM RIVER BED SEDIMENT
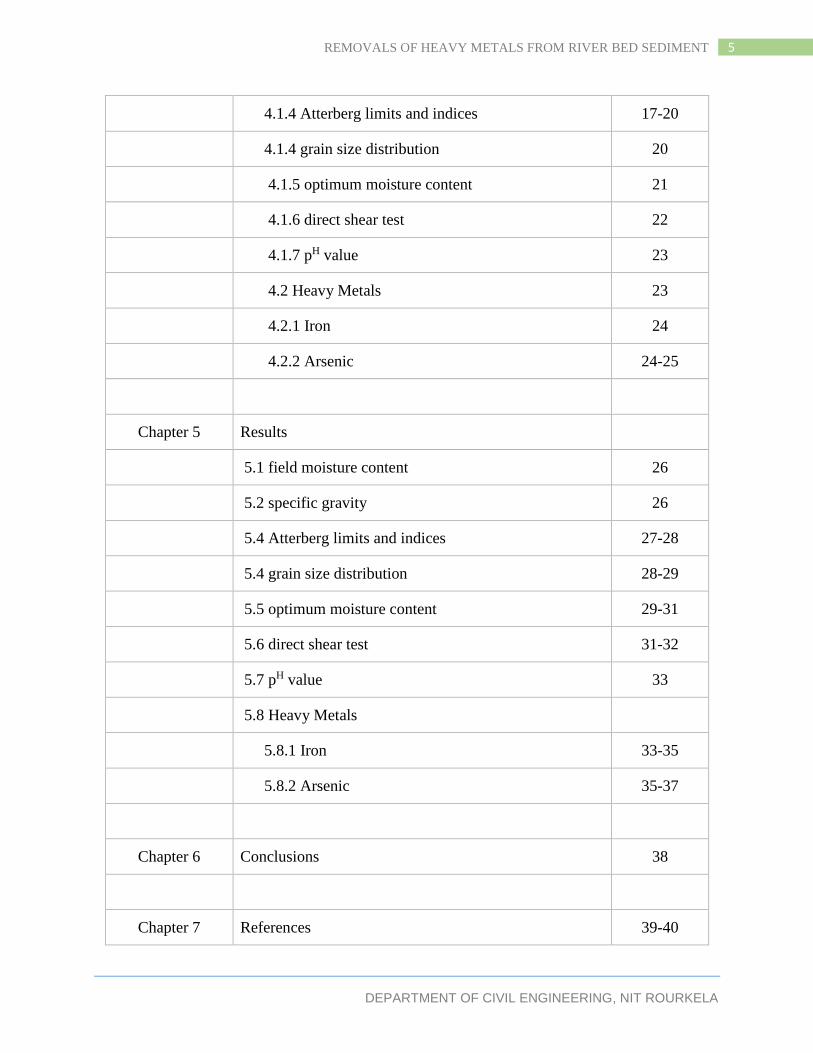
CONTENTS
CHAPTER TITLE PAGE NO
List of figures 6
List of table 7
abstract 8
Chapter - 1 Introduction 9
1.1 Advantages 10
1.2 Objectives 10
Chapter - 2 Literature Review
2.1 General Parameters 11
2.2 Physical Characteristics 11-12
2.3 Chemical Composition 12
Chapter - 3 The Study Area
3.1 River sites 13
3.2 Bed Sediment and Its Characteristics 14
3.3 Adsorption of Heavy Metals 15
Chapter 4 Methodology
4.1 Physical Characteristics 16
4.1.1 field moisture content 16
4.1.2 specific gravity 16-17
DEPARTMENT OF CIVIL ENGINEERING, NIT ROURKELA
5 REMOVALS OF HEAVY METALS FROM RIVER BED SEDIMENT
4.1.4 Atterberg limits and indices 17-20
4.1.4 grain size distribution 20
4.1.5 optimum moisture content 21
4.1.6 direct shear test 22
4.1.7 pH value 23
4.2 Heavy Metals 23
4.2.1 Iron 24
4.2.2 Arsenic 24-25
Chapter 5 Results
5.1 field moisture content 26
5.2 specific gravity 26
5.4 Atterberg limits and indices 27-28
5.4 grain size distribution 28-29
5.5 optimum moisture content 29-31
5.6 direct shear test 31-32
5.7 pH value 33
5.8 Heavy Metals
5.8.1 Iron 33-35
5.8.2 Arsenic 35-37
Chapter 6 Conclusions 38
Chapter 7 References 39-40
DEPARTMENT OF CIVIL ENGINEERING, NIT ROURKELA
6 REMOVALS OF HEAVY METALS FROM RIVER BED SEDIMENT
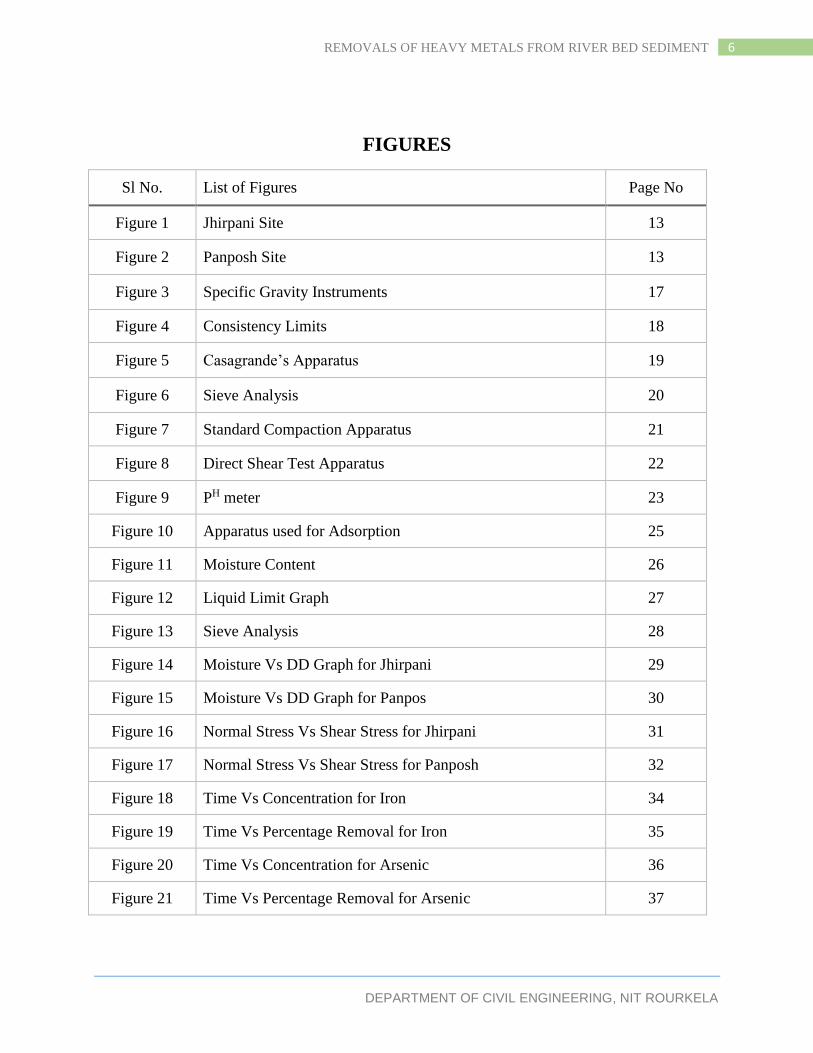
FIGURES
Sl No. List of Figures Page No
Figure 1 Jhirpani Site 13
Figure 2 Panposh Site 13
Figure 3 Specific Gravity Instruments 17
Figure 4 Consistency Limits 18
Figure 5 Casagrande’s Apparatus 19
Figure 6 Sieve Analysis 20
Figure 7 Standard Compaction Apparatus 21
Figure 8 Direct Shear Test Apparatus 22
Figure 9 PH meter 23
Figure 10 Apparatus used for Adsorption 25
Figure 11 Moisture Content 26
Figure 12 Liquid Limit Graph 27
Figure 13 Sieve Analysis 28
Figure 14 Moisture Vs DD Graph for Jhirpani 29
Figure 15 Moisture Vs DD Graph for Panpos 30
Figure 16 Normal Stress Vs Shear Stress for Jhirpani 31
Figure 17 Normal Stress Vs Shear Stress for Panposh 32
Figure 18 Time Vs Concentration for Iron 34
Figure 19 Time Vs Percentage Removal for Iron 35
Figure 20 Time Vs Concentration for Arsenic 36
Figure 21 Time Vs Percentage Removal for Arsenic 37
DEPARTMENT OF CIVIL ENGINEERING, NIT ROURKELA
7 REMOVALS OF HEAVY METALS FROM RIVER BED SEDIMENT
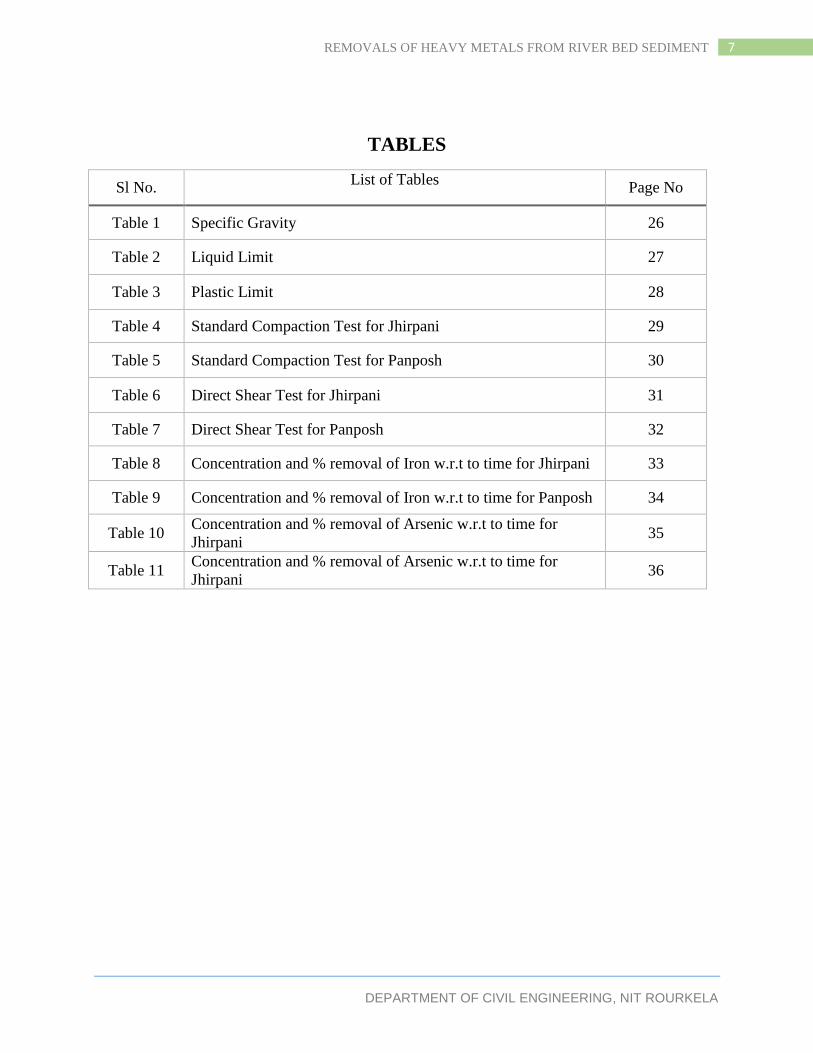
TABLES
Sl No. List of Tables
Page No
Table 1 Specific Gravity 26
Table 2 Liquid Limit 27
Table 3 Plastic Limit 28
Table 4 Standard Compaction Test for Jhirpani 29
Table 5 Standard Compaction Test for Panposh 30
Table 6 Direct Shear Test for Jhirpani 31
Table 7 Direct Shear Test for Panposh 32
Table 8 Concentration and % removal of Iron w.r.t to time for Jhirpani 33
Table 9 Concentration and % removal of Iron w.r.t to time for Panposh 34
Table 10 Concentration and % removal of Arsenic w.r.t to time for
Jhirpani 35
Table 11 Concentration and % removal of Arsenic w.r.t to time for
Jhirpani 36
DEPARTMENT OF CIVIL ENGINEERING, NIT ROURKELA
8 REMOVALS OF HEAVY METALS FROM RIVER BED SEDIMENT
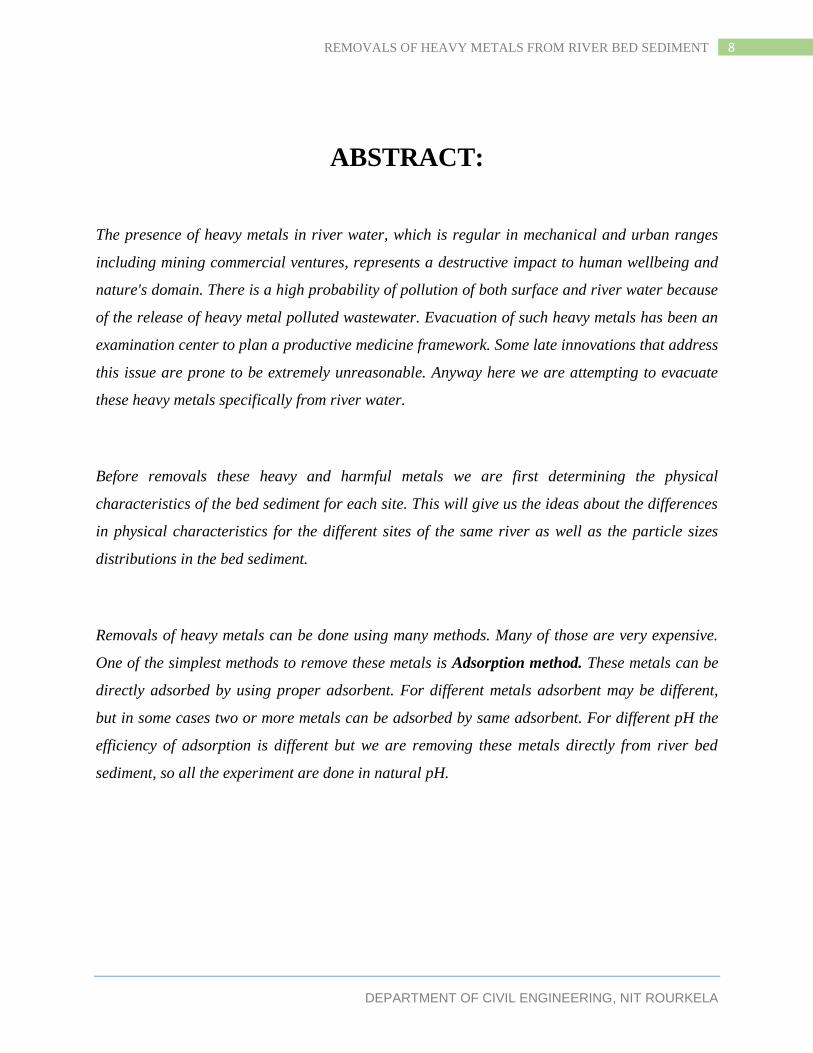
ABSTRACT:
The presence of heavy metals in river water, which is regular in mechanical and urban ranges
including mining commercial ventures, represents a destructive impact to human wellbeing and
nature's domain. There is a high probability of pollution of both surface and river water because
of the release of heavy metal polluted wastewater. Evacuation of such heavy metals has been an
examination center to plan a productive medicine framework. Some late innovations that address
this issue are prone to be extremely unreasonable. Anyway here we are attempting to evacuate
these heavy metals specifically from river water.
Before removals these heavy and harmful metals we are first determining the physical
characteristics of the bed sediment for each site. This will give us the ideas about the differences
in physical characteristics for the different sites of the same river as well as the particle sizes
distributions in the bed sediment.
Removals of heavy metals can be done using many methods. Many of those are very expensive.
One of the simplest methods to remove these metals is Adsorption method. These metals can be
directly adsorbed by using proper adsorbent. For different metals adsorbent may be different,
but in some cases two or more metals can be adsorbed by same adsorbent. For different pH the
efficiency of adsorption is different but we are removing these metals directly from river bed
sediment, so all the experiment are done in natural pH.

DEPARTMENT OF CIVIL ENGINEERING, NIT ROURKELA
9 REMOVALS OF HEAVY METALS FROM RIVER BED SEDIMENT
CHAPTER -1
INTRODUCTION
Numerous dissolved metals have been found in extremely destructive concentrations in river
bound for consumable drinking water because of both regularly happening pollution and also
tainting presented from modern contaminations. The concentration of any of these contaminants
makes some level of wellbeing concerns running from extremely mellow to extreme.
Consistent expanding urbanization and water request in regions of modern movement has
expanded the recurrence of issue metals in river sources. In little amounts, certain heavy metals
are healthfully crucial for a solid life, however a lot of these metals may cause intense or
perpetual danger or harming. Follow components, for example, iron, arsenic, copper, manganese,
and zinc are generally discovered commonly in sustenances we devour or as a feature of a
vitamin supplement. Heavy metals are additionally a piece of the assembling methodology of
numerous normal family things, for example, pesticides, batteries, electroplated metal parts,
material colors and steels.
The metals regularly connected to human harming have connections to taking in inabilities like
growths and passing are normally copper, nickel, cadmium, chrome, arsenic, lead and mercury.
Many of these metals are needed by people in little sums however in bigger, industrious
measurements, these heavy metals get dangerous when they are not metabolized by the body and
gather in the delicate tissues. Heavy metal danger can bring about harmed or diminished mental
and focal apprehensive capacity, easier vitality levels, and harm to blood arrangement, lungs,
kidneys, and other crucial organs.
Different ease-adsorbents, determined from rural squanders, mechanical by-items, regular
materials, or altered biopolymers, have been as of late created and petitioned the evacuation of

DEPARTMENT OF CIVIL ENGINEERING, NIT ROURKELA
10 REMOVALS OF HEAVY METALS FROM RIVER BED SEDIMENT
heavy metals from metal-defiled wastewater by extremely routines. For the most part, there are
three fundamental steps included in toxin sorption onto robust sorbent:
(i) The transport of the poison from the mass answer for the sorbent surface;
(ii) Adsorption on the molecule surface; and
(iii) Transport inside the sorbent molecule.
Specialized appropriateness and expense-adequacy are the key components that assume
significant parts in the determination of the most suitable adsorbent to treat inorganic effluents.
1.1 ADVANTAGES:
1. Removals of toxic elements can be done directly.
2. Provides high quality water, soft and low in minerals
3. It can be easily performed in the laboratory.
4. According to the concentration of these metals, water can be used in irrigation according to
its requirement.
5. This method can be used in the rural areas where people directly drink water from river or
ground.
1.2 OBJECTIVES
1. Bed sediments have been collected from two different sites of Brahmani river located at
Rourkela.
2. Physical properties of the sediments have been determined and shown in
chapter 5 (with tables and graphs).
3. Concentrations of toxic and heavy metals have been determined and shown
in the chapter 5 (with tables and graphs).
4. Removals of these metals have been done using Adsorption methods and
shown in chapter 5 (with tables and graphs).
DEPARTMENT OF CIVIL ENGINEERING, NIT ROURKELA
11 REMOVALS OF HEAVY METALS FROM RIVER BED SEDIMENT
CHAPTER 2
LITERATURE REVIEW
2.1 General Parameters
The metals are considered "Heavy Metals" in the event that they have a particular gravity > 5
g/cm3 in their standard state. There are about sixty known heavy metals and can aggregate about
whether in soils and plants and could have a negative impact on physiological exercises of
plants, bringing on diminishments in plant development, dry matter gathering and yield, Devkota
and Schmidt, 2000 [1]. There are numerous terms used to depict and order metals, including
follow metals, move metals, micronutrients, lethal and heavy metals. A large number of these
definitions are discretionary and these terms have been utilized inexactly as a part of the writing
to incorporate components that don't strictly meet the meaning of the term. Metals are
characterized as a component that has a gleaming brilliance and is a great transmitter of hotness
and power,Mclean and Bledsoe, 1992 [2]. In soil, metals are found in one or a greater amount of
a few "pools" of the dirt, as depicted by Shuman (1991) [3]:
• Dissolved in the dirt result
• Occupying trade locales in inorganic soil constituents
• Specifically adsorbed in inorganic soil constituents
• Associated with insoluble soil natural matter
• Precipitated as unadulterated or blended solids
• introduce in the structure of auxiliary minerals and
2.2 Physical Characteristics
For examining the heavy metals in soils Wu et al. 2007 [4] found that the between-relationship
between heavy metals and dynamic soil parts, (for example, Fe oxides, natural matter, and earth)
is the significant prescient component and they reasoned that the correspondence with aggregate
Fe (counting dynamic and leftover Fe) is the real system. In a study led by Chen et al. 1999 [5] it
was recommended that concentrations of most follow metals in Florida soils are essential
DEPARTMENT OF CIVIL ENGINEERING, NIT ROURKELA
12 REMOVALS OF HEAVY METALS FROM RIVER BED SEDIMENT
controlled by soil properties, Clay, natural C content, and CEC demonstrated critical relationship
with concentrations of most follow metals where the soil pH had noteworthy positive connection
with concentrations of As, Cd, Cr, Cu, Mn, Se, and Zn. Adsorption of metal cations has been
associated with such soil properties as pH, redox potential, mud, soil natural matter, Fe and Mn
oxides, 18 and calcium carbonate content Mclean and Bledsoe, 1992. Heavy metal motion in
soils are mind boggling and affected by various components, for example, the pH, soil natural
matter, soil surface, redox potential, and temperature Alloway, 1991 [6]. Additionally high
calcium fixation in the treated soils can altogether obstruct the metal transport, in light of the fact
that the movement and precipitation of calcium as bicarbonates and hydroxides can stop up soil
pores and increment the soil support limit, compelling the development of the corrosive front
REDDY et al., 2006; DE GIOANNIS et al., 2007c [7].
2.3 Chemical Compositions
The connection between soil pH and heavy metal limit qualities reflects the complex
communication between heavy metals and the different soil properties Gawlik and Bidoglio,
2006 [8]. pH is a measure of the hydrogen particle focus causticity or alkalinity of the soil.
Measured on a logarithmic scale, a soil at pH 4 is 10 times more acidic than a soil at pH 5 and
100 times more acidic than a soil at pH 6. Alkalinity is typically an intrinsic normal for soils, in
spite of the fact that watering system can build the alkalinity of saline soils. Soils made antacid
by calcium carbonate alone once in a while have pH values over 8.5 and are termed 'calcareous'.
Under ordinary conditions the most alluring pH range for mineral soil is 6.0 to 7.0 and 5.0 to 5.5
for natural soil. The cushion pH is a quality utilized for deciding the measure of lime to apply on
acidic soils with a pH short of what 6.6. Builds in soil pH can happen as the consequence of
natural matter deterioration, on the grounds that mineralization and ammonification methods
discharge OH- particles and expend H+ particles, Ritchie and Dolling, 1985 [9]. Colloid and
metal portability, was improved by reductions in result pH and colloid size, and builds in natural
matter, which brought about higher elution of sorbed and solvent metal loads through metal–
organic complex arrangement, Karathanasis et al., 2005 [10].

DEPARTMENT OF CIVIL ENGINEERING, NIT ROURKELA
13 REMOVALS OF HEAVY METALS FROM RIVER BED SEDIMENT
CHAPTER - 3
THE STUDY AREA
3.1 River Site locations
Brahmani River
The Brahmani is a major river in the Odisha state of Eastern India. The Brahmani is formed by
the confluence of the Sankhand South Koel rivers, and flows through the districts of
Sundargarh, Kendujhar, Dhenkanal, Cuttack and Jajapur. Together with the rivers Mahanadi
and Baitarani, it forms a large delta before entering into the Bay of Bengal at Dhamra. The
Brahmani is formed by the confluence of the rivers South Koel and Sankh near the major
industrial town of Rourkela at 22 15'N and 84 47' E.
Figure 1. Jhirpani Site
Figure 2. Panposh site

DEPARTMENT OF CIVIL ENGINEERING, NIT ROURKELA
14 REMOVALS OF HEAVY METALS FROM RIVER BED SEDIMENT
Soil sample was taken from Jhirpani in the month of July 2014. Within a certain area many
samples have been collected. Same work have been done for Panposh site in the month of
November 2014.
3.2 Bed Sediment and Its Characteristics
Bed Sediment of a river is the soil some piece of the river which is discovered simply beneath
the water. It is a characteristically happening material that is broken around techniques of
weathering and disintegration and is consequently transported by the water. By and large, dregs
transported by water happens by fluvial procedure. Shore sands and river channel stores are
normal samples of fluvial transport and statement, however because of low speed of water
stream bed dregs are likewise found in seas and lakes. Dregs is for the most part grouped on the
premise of its grain size and its sytheses. Dregs size is measured on a log2 scale (Phi scale),
which arranges molecule size from "colloid" to "stone".
There are numerous properties which characterizes soil's physical condition like grain size
circulation, ideal dampness content, penetrability, density and so forth. Soil surface is controlled
by the relative extent of the three sorts of soil particles, called soil differentiates:
• sand
• silt, and
• clay
Bigger soil structures are called peds. These are made from the divides when iron oxides,
carbonates, earth, and silica with the natural constituent humus, cover particles and reason them
to follow into bigger, moderately steady auxiliary structures. Soil density (mass density), is a
measure of soil compaction. Soil porosity comprises of the piece of the soil volume possessed by
gasses and water. Soil consistency is the capacity of soil which demonstrates the stick conduct of
soil together. Soil temperatures and colors are portraying toward oneself. The properties of the
bed dregs change through the profundity of a soil profile.
DEPARTMENT OF CIVIL ENGINEERING, NIT ROURKELA
15 REMOVALS OF HEAVY METALS FROM RIVER BED SEDIMENT
3.3 Adsorption of Heavy Metals
Soil defilement or soil contamination is created by the vicinity of human-made (xenobiotic)
chemicals or other adjustment in the regular nature's turf. It is regularly brought about by
industrial action, farming chemicals, or ill-advised transfer of waste. The most well-known
chemicals included are petroleum hydrocarbons, polynuclear fragrant hydrocarbons, (for
example, naphthalene and benzo(a)pyrene), solvents, pesticides, lead, and other heavy metals.
Defilement is corresponded with the level of industrialization and force of concoction utilization.
The worry over soil pollution stems principally from wellbeing dangers, from immediate contact
with the tainted soil, vapors from the contaminants, and from auxiliary tainting of water supplies
inside and underlying the soil. Mapping of defiled soil destinations and the ensuing cleanup are
lengthy and unreasonable undertakings, obliging broad measures of topography, hydrology,
chemistry, machine demonstrating abilities, and GIS in Environmental Contamination, and in
addition an energy about the historical backdrop of industrial chemistry.
Adsorption is a process that happens when a gas or fluid solute aggregates on the surface of a
strong or a fluid (adsorbent), shaping an atomic or nuclear film (the adsorbate). Adsorption is
agent in most regular physical, biotic, and concoction frameworks, and is generally utilized
within industrial provisions, for example, initiated charcoal, manufactured gums and water
purging. Medicines are carried out by dealing with time and focus. A sufficient measure of
adsorbent is utilized and shaked as a part of shaker. Following one hour some amount of the
water is taken out and rest is considered further shaking. Following one hour same strategy is
carried out etc. Following 8 hour the adsorption is very nearly in most extreme condition. After
this is discovered to be steady. Consequently before 8 hour all readings are taken and chart are
plotted between time and focus. From the understanding we can discover the rate evacuations of
the heavy metals.
DEPARTMENT OF CIVIL ENGINEERING, NIT ROURKELA
16 REMOVALS OF HEAVY METALS FROM RIVER BED SEDIMENT
CHAPTER - 4
METHODOLOGY
4.1 PHYSICAL CHARACTERISTICS
Before removals of heavy metals, the physical parameters of the bed sediments have been
determined. Some common and major tests have been done:
4.1.1 Field Moisture Content
Field moisture content shows the quantity or percentage of water that the soil contains. Three
samples were taken and weight of each sample was measured. Then the samples were left in
oven at a constant temperature of 105oC. After 24 hours, completely dried, the weight of each
samples was measured. The moisture content is expressed as
w= (WS/W
W) x100 (1)
Where,
Ww= weight of water in soil mass
Ws = weight of dry soil
w = moisture content
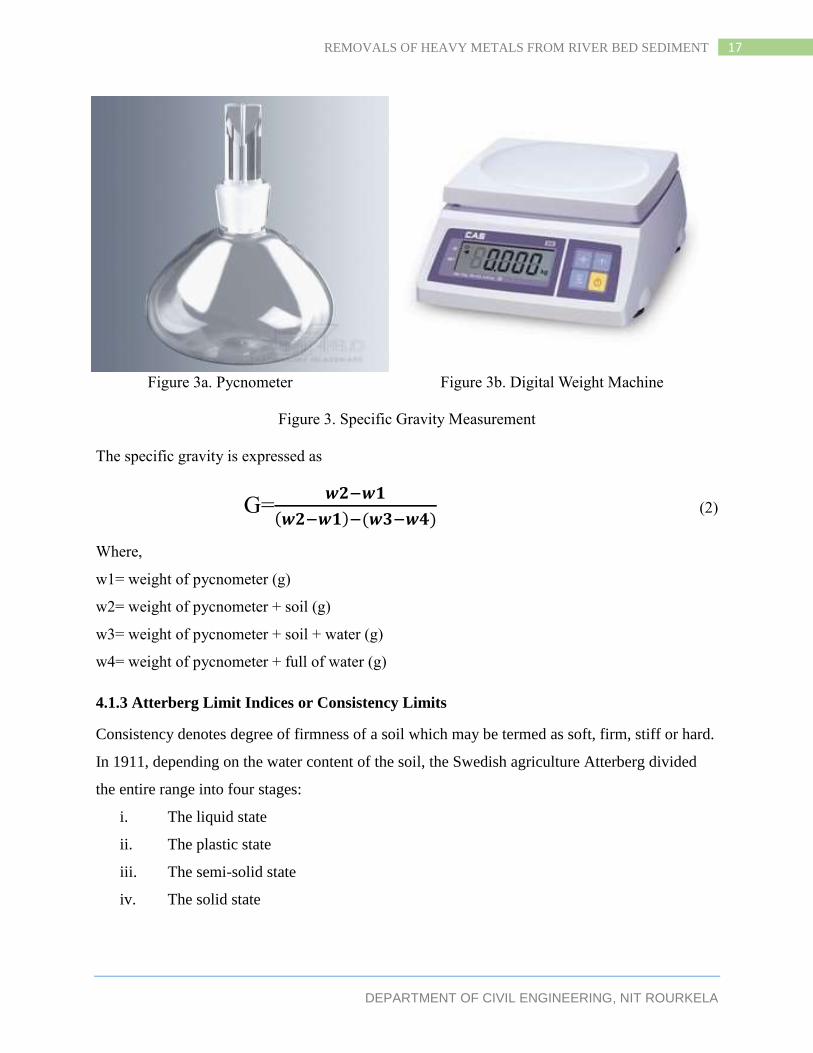
4.1.2 Specific Gravity
Specific gravity is the proportion of the density of a substance to the density (mass of the same
unit volume) of a reference substance. The reference substance is about constantly taken as water
for fluids or air for gasses.. In the wake of sieving the stove dried soil through 425 micron
strainer, 100g of specimen was taken in two diverse pycnometer and specific gravity of each one
examples was measured, as shown in Figure 3a and 3b.
DEPARTMENT OF CIVIL ENGINEERING, NIT ROURKELA
17 REMOVALS OF HEAVY METALS FROM RIVER BED SEDIMENT
Figure 3a. Pycnometer Figure 3b. Digital Weight Machine
Figure 3. Specific Gravity Measurement
The specific gravity is expressed as
G=𝒘𝟐−𝒘𝟏
(𝒘𝟐−𝒘𝟏)−(𝒘𝟑−𝒘𝟒) (2)
Where,
w1= weight of pycnometer (g)
w2= weight of pycnometer + soil (g)
w3= weight of pycnometer + soil + water (g)
w4= weight of pycnometer + full of water (g)
4.1.3 Atterberg Limit Indices or Consistency Limits
Consistency denotes degree of firmness of a soil which may be termed as soft, firm, stiff or hard.
In 1911, depending on the water content of the soil, the Swedish agriculture Atterberg divided
the entire range into four stages:
i. The liquid state
ii. The plastic state
iii. The semi-solid state
iv. The solid state
DEPARTMENT OF CIVIL ENGINEERING, NIT ROURKELA
18 REMOVALS OF HEAVY METALS FROM RIVER BED SEDIMENT
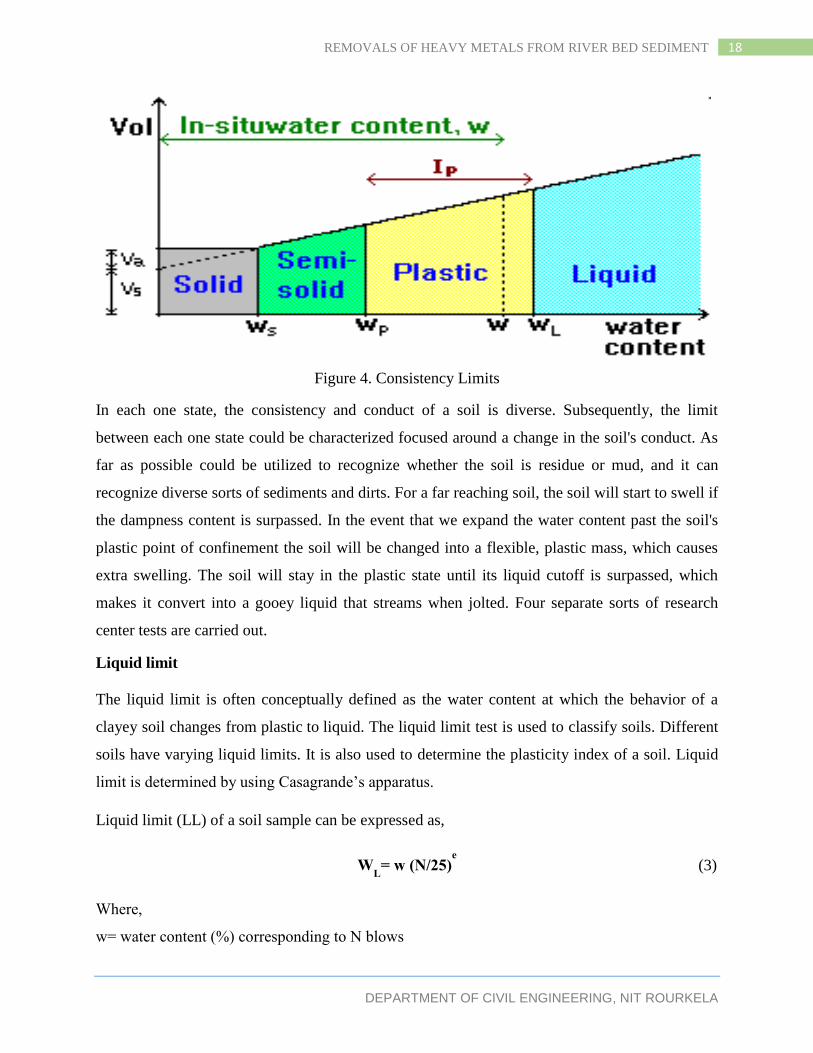
Figure 4. Consistency Limits
In each one state, the consistency and conduct of a soil is diverse. Subsequently, the limit
between each one state could be characterized focused around a change in the soil's conduct. As
far as possible could be utilized to recognize whether the soil is residue or mud, and it can
recognize diverse sorts of sediments and dirts. For a far reaching soil, the soil will start to swell if
the dampness content is surpassed. In the event that we expand the water content past the soil's
plastic point of confinement the soil will be changed into a flexible, plastic mass, which causes
extra swelling. The soil will stay in the plastic state until its liquid cutoff is surpassed, which
makes it convert into a gooey liquid that streams when jolted. Four separate sorts of research
center tests are carried out.
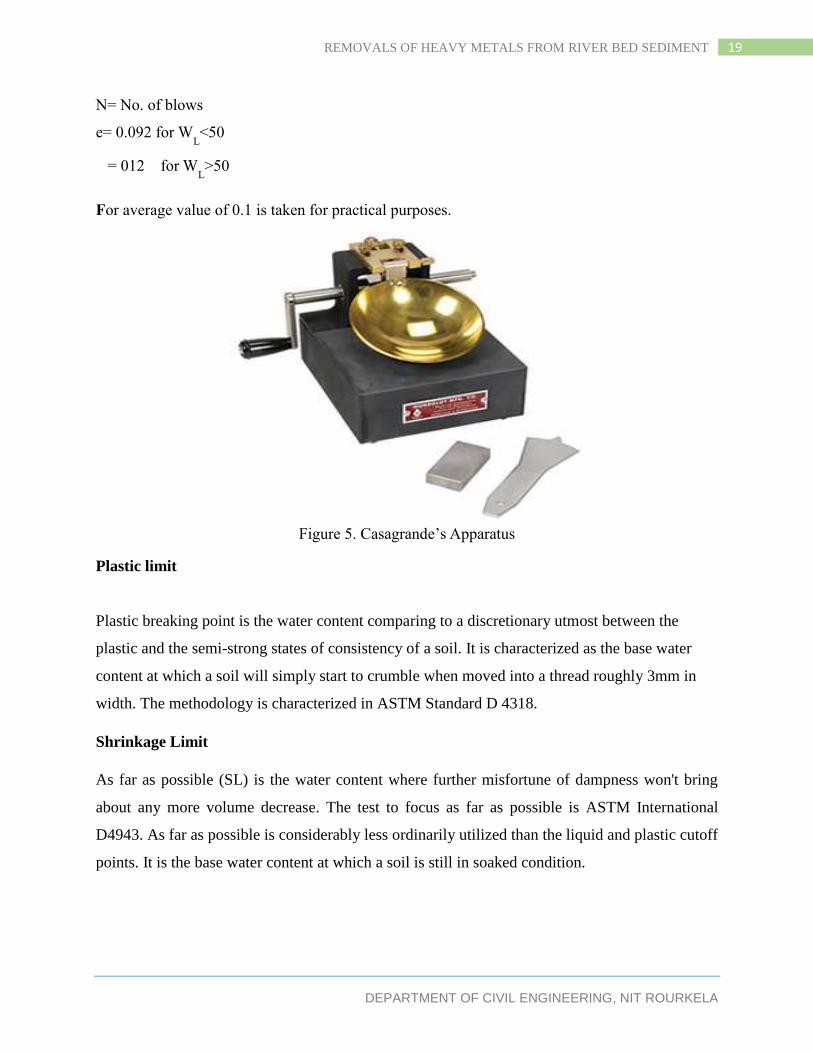
Liquid limit
The liquid limit is often conceptually defined as the water content at which the behavior of a
clayey soil changes from plastic to liquid. The liquid limit test is used to classify soils. Different
soils have varying liquid limits. It is also used to determine the plasticity index of a soil. Liquid
limit is determined by using Casagrande’s apparatus.
Liquid limit (LL) of a soil sample can be expressed as,
WL= w (N/25)
e (3)
Where,
w= water content (%) corresponding to N blows
DEPARTMENT OF CIVIL ENGINEERING, NIT ROURKELA
19 REMOVALS OF HEAVY METALS FROM RIVER BED SEDIMENT
N= No. of blows
e= 0.092 for WL<50
= 012 for WL>50
For average value of 0.1 is taken for practical purposes.
Figure 5. Casagrande’s Apparatus
Plastic limit
Plastic breaking point is the water content comparing to a discretionary utmost between the
plastic and the semi-strong states of consistency of a soil. It is characterized as the base water
content at which a soil will simply start to crumble when moved into a thread roughly 3mm in
width. The methodology is characterized in ASTM Standard D 4318.
Shrinkage Limit
As far as possible (SL) is the water content where further misfortune of dampness won't bring
about any more volume decrease. The test to focus as far as possible is ASTM International
D4943. As far as possible is considerably less ordinarily utilized than the liquid and plastic cutoff
points. It is the base water content at which a soil is still in soaked condition.
DEPARTMENT OF CIVIL ENGINEERING, NIT ROURKELA
20 REMOVALS OF HEAVY METALS FROM RIVER BED SEDIMENT
Plasticity Index
The plasticity index (PI) is a measure of the plasticity of a soil. The plasticity index is the size of
the range of water contents where the soil exhibits plastic properties. The PI is the difference
between the liquid limit and the plastic limit.
Ip = LL-PL (4)
Soils with a high PI tend to be clay, those with a lower PI tend to be silt, and those with a PI of 0
(non-plastic) tend to have little or no silt or clay.
PI and their meanings
(0-3)- Non-plastic
(3-15) - Slightly plastic
(15-30) - Medium plastic
>30 - Highly plastic
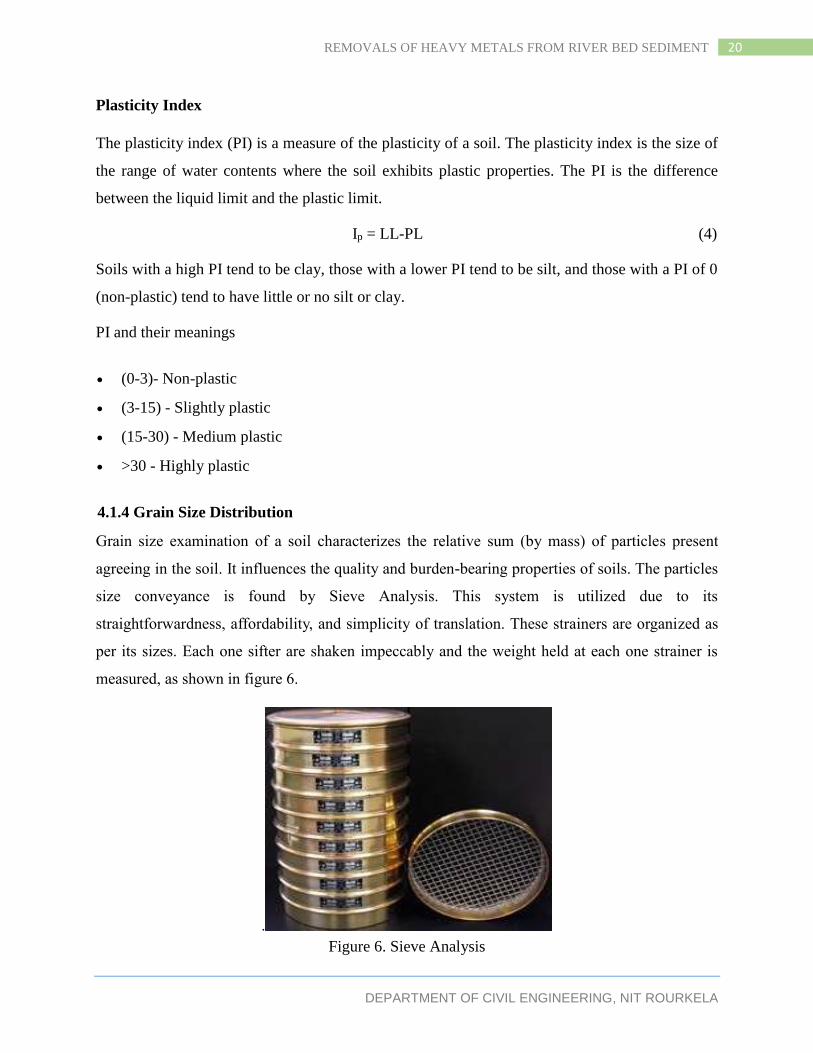
4.1.4 Grain Size Distribution
Grain size examination of a soil characterizes the relative sum (by mass) of particles present
agreeing in the soil. It influences the quality and burden-bearing properties of soils. The particles
size conveyance is found by Sieve Analysis. This system is utilized due to its
straightforwardness, affordability, and simplicity of translation. These strainers are organized as
per its sizes. Each one sifter are shaken impeccably and the weight held at each one strainer is
measured, as shown in figure 6.
.
Figure 6. Sieve Analysis
DEPARTMENT OF CIVIL ENGINEERING, NIT ROURKELA
21 REMOVALS OF HEAVY METALS FROM RIVER BED SEDIMENT
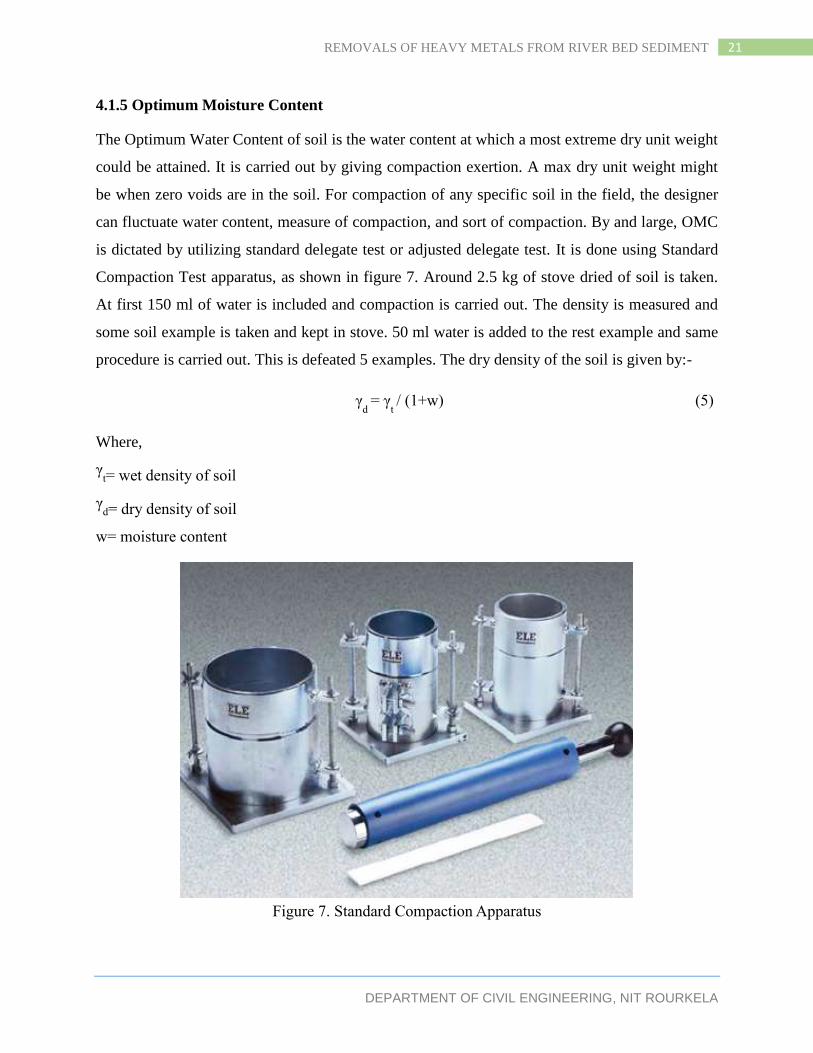
4.1.5 Optimum Moisture Content
The Optimum Water Content of soil is the water content at which a most extreme dry unit weight
could be attained. It is carried out by giving compaction exertion. A max dry unit weight might
be when zero voids are in the soil. For compaction of any specific soil in the field, the designer
can fluctuate water content, measure of compaction, and sort of compaction. By and large, OMC
is dictated by utilizing standard delegate test or adjusted delegate test. It is done using Standard
Compaction Test apparatus, as shown in figure 7. Around 2.5 kg of stove dried of soil is taken.
At first 150 ml of water is included and compaction is carried out. The density is measured and
some soil example is taken and kept in stove. 50 ml water is added to the rest example and same
procedure is carried out. This is defeated 5 examples. The dry density of the soil is given by:-
γd
= γt / (1+w) (5)
Where,
γt= wet density of soil
γd= dry density of soil
w= moisture content
Figure 7. Standard Compaction Apparatus
DEPARTMENT OF CIVIL ENGINEERING, NIT ROURKELA
22 REMOVALS OF HEAVY METALS FROM RIVER BED SEDIMENT
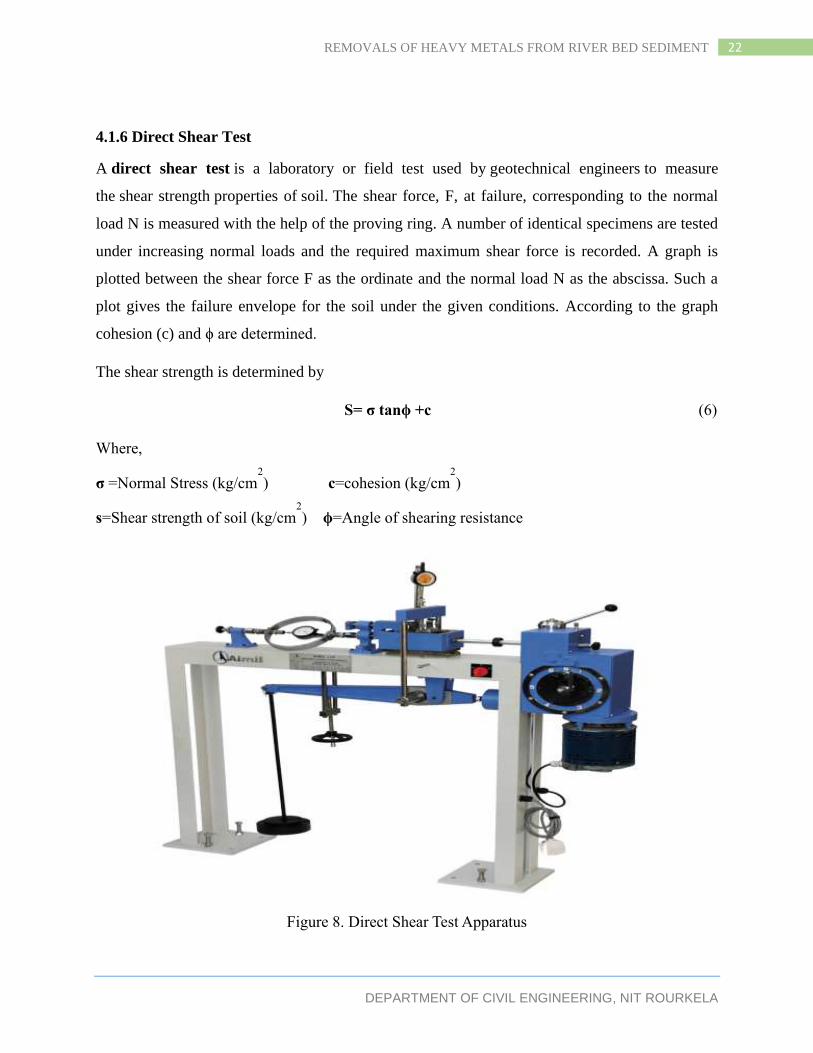
4.1.6 Direct Shear Test
A direct shear test is a laboratory or field test used by geotechnical engineers to measure
the shear strength properties of soil. The shear force, F, at failure, corresponding to the normal
load N is measured with the help of the proving ring. A number of identical specimens are tested
under increasing normal loads and the required maximum shear force is recorded. A graph is
plotted between the shear force F as the ordinate and the normal load N as the abscissa. Such a
plot gives the failure envelope for the soil under the given conditions. According to the graph
cohesion (c) and ϕ are determined.
The shear strength is determined by
S= σ tanϕ +c (6)
Where,
σ =Normal Stress (kg/cm2
) c=cohesion (kg/cm2
)
s=Shear strength of soil (kg/cm2
) ϕ=Angle of shearing resistance
Figure 8. Direct Shear Test Apparatus

DEPARTMENT OF CIVIL ENGINEERING, NIT ROURKELA
23 REMOVALS OF HEAVY METALS FROM RIVER BED SEDIMENT
4.1.7 pH value
The soil pH is a measure of the acridity or basicity in soils. It goes from 0 to 14, with 7 being
unbiased. A pH underneath 7 is acidic or more 7 is fundamental. Impacts of pH on adsorption
and evacuation proficiency of ionizable natural mixes (IOCs) by ecological adsorbents are a zone
of verbal confrontation, due to its double intervention towards adsorbents and adsorbate. Some
soil is taken in a measuring glass and shaken for ½ hours consistently. The example is then left
for 24 hours to get totally settled. After complete settlement the water is gathered and pH is
measured.
Figure 9. pH meter
4.2 HEAVY METALS
Metal toxicity is the dangerous impact of specific metals in specific structures and measurements
on life. A few metals are harmful when they structure noxious solvent mixes. Certain metals
have no natural part, i.e. are not crucial minerals, or are dangerous when in a certain structure.
On account of lead, any measurable sum may have negative wellbeing impacts. Frequently
heavy metals are thought as synonymous, however lighter metals might additionally be
poisonous in specific circumstances, for example, beryllium, and not all heavy metals are
especially lethal, and some are crucial, for example, iron. The definition might additionally
incorporate follow components when acknowledged in anomalous high, dangerous dosages.
Water is additionally a significant supply of these metals. Henceforth, we must deal with the
water quality and check the centralization of these metals. In the event that it is in high fixation
evacuation must be carried out.

DEPARTMENT OF CIVIL ENGINEERING, NIT ROURKELA
24 REMOVALS OF HEAVY METALS FROM RIVER BED SEDIMENT
4.2.1 Iron
Iron is a compound component with the image Fe (from Latin: ferrum) and nuclear number 26. It
is a metal in the first move arrangement. It is the fourth most normal component in the Earth's
covering. A sufficient measure of iron is required to human body. It gives great quality and
wellbeing. Anyway after a certain breaking point of dosages it can result in negative impact
called Iron Poisoning.
Iron harming is an iron over-burden brought on by a vast overabundance of iron admission and
normally alludes to an intense over-burden as opposed to a slow one. The term has been
basically connected with junior kids who expended vast amounts of iron supplement pills, which
take after desserts and are generally utilized, including by pregnant ladies—see over nourishment
(roughly 3 grams is deadly for a 2 year old).
4.2.2 Arsenic
Iron is a compound component with the image Fe (from Latin: ferrum) and nuclear number 26. It
is a metal in the first move arrangement. It is the fourth most regular component in the Earth's
hull. A sufficient measure of iron is required to human body. It gives great quality and wellbeing.
In any case after a certain utmost of dosages it can result in negative impact called Iron
Poisoning.
Iron poisoning is an iron over-burden brought about by an extensive overabundance of iron
admission and generally alludes to an intense over-burden as opposed to a progressive one. The
term has been fundamentally connected with youthful kids who devoured huge amounts of iron
supplement pills, which look like desserts and are generally utilized, including by pregnant
ladies—see over nourishment (more or less 3 grams is deadly for a 2 year old
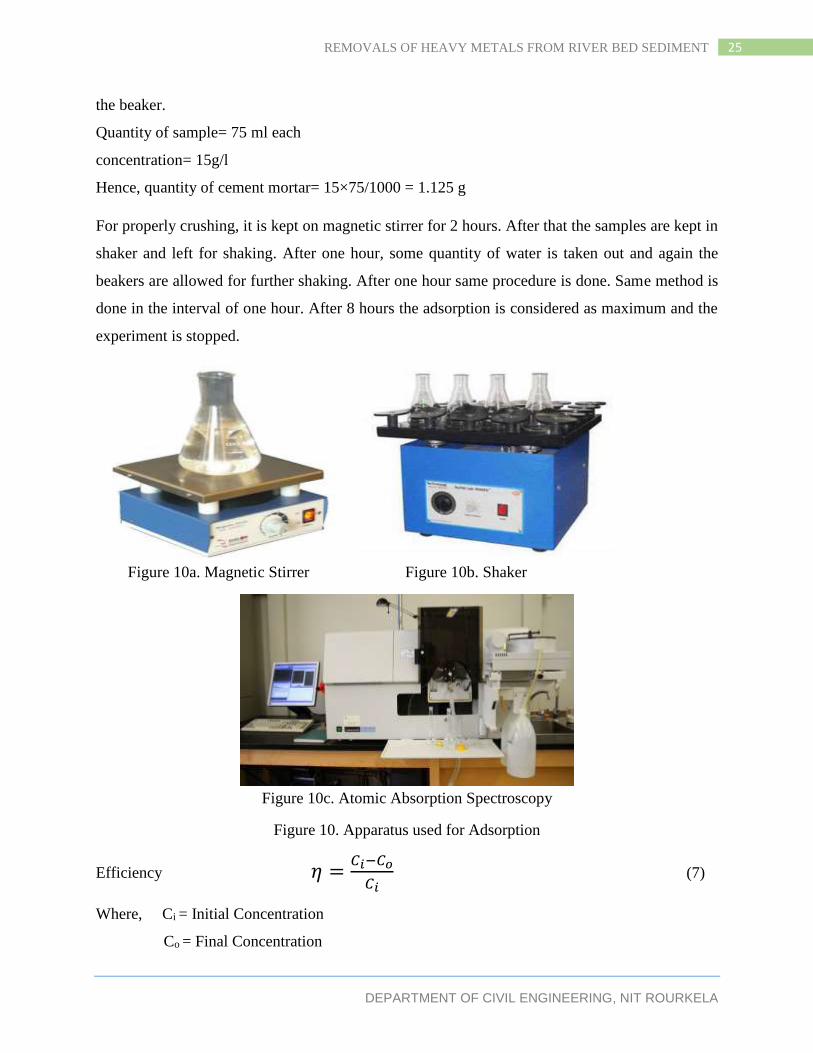
Adsorbent Used:
Cement mortar :- cement mortar is casted and left for settle in air and then for oven dry.
w/c ratio= 0.45
Procedure:
Each soil samples are taken in beakers and cement mortar is crushed properly and entered into
DEPARTMENT OF CIVIL ENGINEERING, NIT ROURKELA
25 REMOVALS OF HEAVY METALS FROM RIVER BED SEDIMENT
the beaker.
Quantity of sample= 75 ml each
concentration= 15g/l
Hence, quantity of cement mortar= 15×75/1000 = 1.125 g
For properly crushing, it is kept on magnetic stirrer for 2 hours. After that the samples are kept in
shaker and left for shaking. After one hour, some quantity of water is taken out and again the
beakers are allowed for further shaking. After one hour same procedure is done. Same method is
done in the interval of one hour. After 8 hours the adsorption is considered as maximum and the
experiment is stopped.
Figure 10a. Magnetic Stirrer Figure 10b. Shaker
Figure 10c. Atomic Absorption Spectroscopy
Figure 10. Apparatus used for Adsorption
Efficiency 𝜂 =𝐶𝑖−𝐶𝑜
𝐶𝑖 (7)
Where, Ci = Initial Concentration
Co = Final Concentration
DEPARTMENT OF CIVIL ENGINEERING, NIT ROURKELA
26 REMOVALS OF HEAVY METALS FROM RIVER BED SEDIMENT
CHAPTER - 5
RESULTS
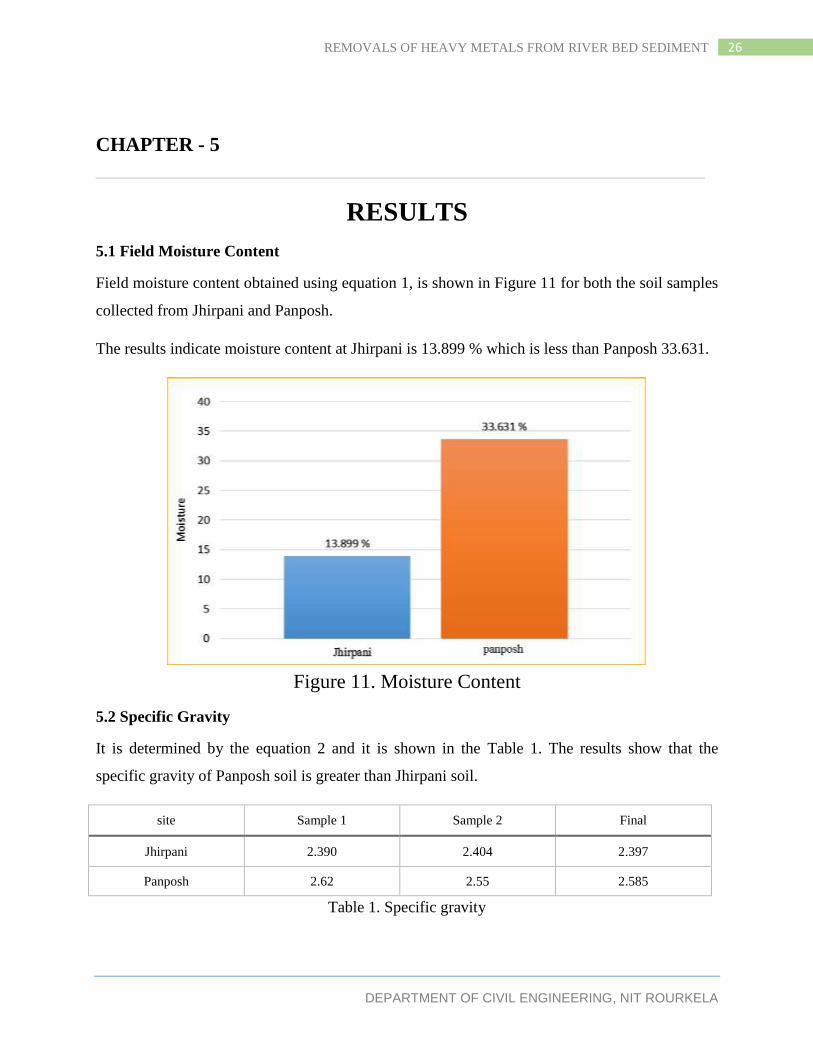
5.1 Field Moisture Content
Field moisture content obtained using equation 1, is shown in Figure 11 for both the soil samples
collected from Jhirpani and Panposh.
The results indicate moisture content at Jhirpani is 13.899 % which is less than Panposh 33.631.
Figure 11. Moisture Content
5.2 Specific Gravity
It is determined by the equation 2 and it is shown in the Table 1. The results show that the
specific gravity of Panposh soil is greater than Jhirpani soil.
site Sample 1 Sample 2 Final
Jhirpani 2.390 2.404 2.397
Panposh 2.62 2.55 2.585
Table 1. Specific gravity
DEPARTMENT OF CIVIL ENGINEERING, NIT ROURKELA
27 REMOVALS OF HEAVY METALS FROM RIVER BED SEDIMENT
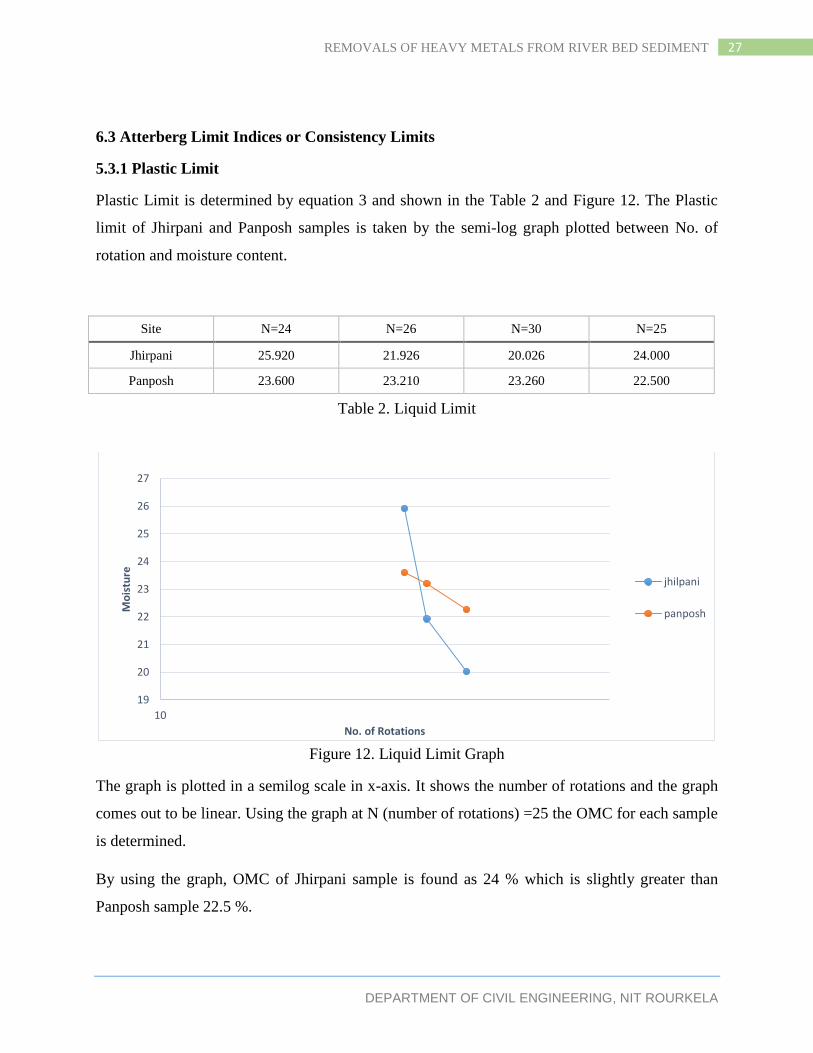
6.3 Atterberg Limit Indices or Consistency Limits
5.3.1 Plastic Limit
Plastic Limit is determined by equation 3 and shown in the Table 2 and Figure 12. The Plastic
limit of Jhirpani and Panposh samples is taken by the semi-log graph plotted between No. of
rotation and moisture content.
Site N=24 N=26 N=30 N=25
Jhirpani 25.920 21.926 20.026 24.000
Panposh 23.600 23.210 23.260 22.500
Table 2. Liquid Limit
Figure 12. Liquid Limit Graph
The graph is plotted in a semilog scale in x-axis. It shows the number of rotations and the graph
comes out to be linear. Using the graph at N (number of rotations) =25 the OMC for each sample
is determined.
By using the graph, OMC of Jhirpani sample is found as 24 % which is slightly greater than
Panposh sample 22.5 %.
19
20
21
22
23
24
25
26
27
10
Mo
istu
re
No. of Rotations
jhilpani
panposh
DEPARTMENT OF CIVIL ENGINEERING, NIT ROURKELA
28 REMOVALS OF HEAVY METALS FROM RIVER BED SEDIMENT
5.3.2 Plastic Limit
Plastic limit is determined by rolling the soil sample in small thread (around 3mm diameter). At
this stage the moisture content by the soil is known as plastic limit and is shown in the table 3.
Site Sample 1 Sample 2 Sample 3 Plastic Limit
Jhirpani - - - -
Panposh 15.67% 14.10% 15.02% 14.93%
Table 3. Plastic limit
5.3.3 Plasticity index
The plasticity is determined by the equation 4. The plasticity index of the Jhirpani sample is
found as 0 while the PI of the Panposh sample is determined as 7.6. Which shows that the
Jhirpani sample is totally free of clay and Panpos sample has small quantity of clay particles.
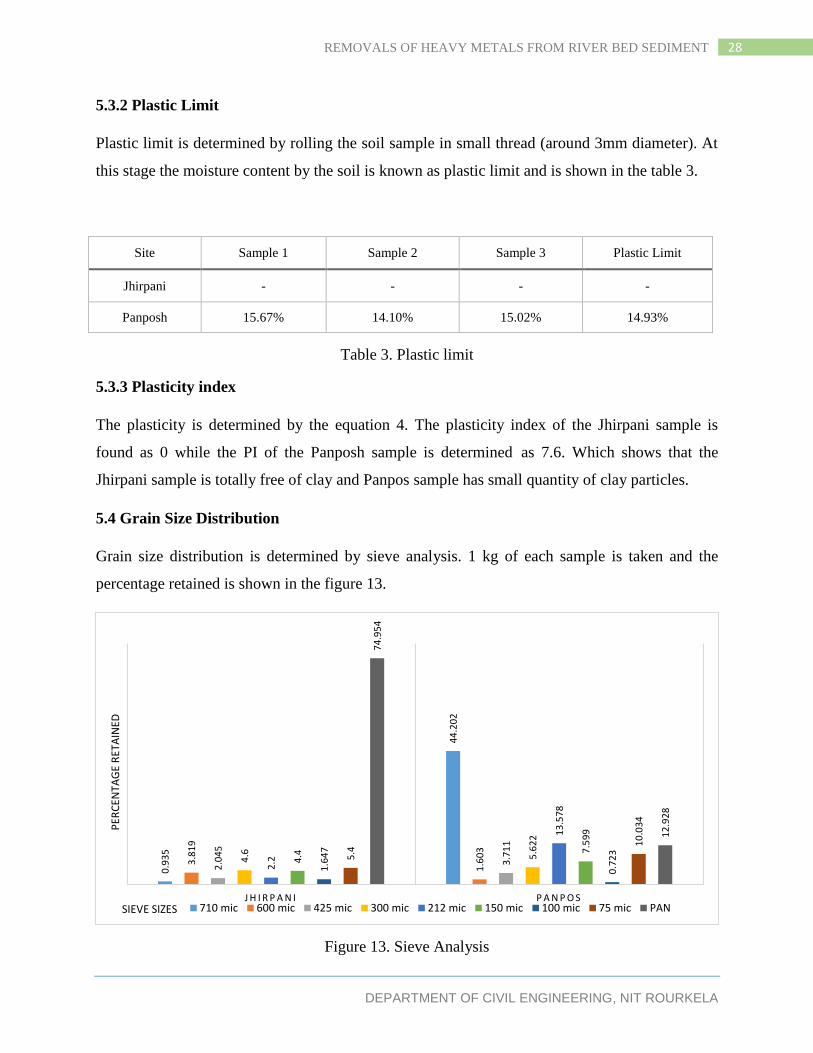
5.4 Grain Size Distribution
Grain size distribution is determined by sieve analysis. 1 kg of each sample is taken and the
percentage retained is shown in the figure 13.
Figure 13. Sieve Analysis
0.9
35
44
.20
2
3.8
19
1.6
03
2.0
45
3.7
11
4.6 5.6
22
2.2
13
.57
8
4.4 7
.59
9
1.6
47
0.7
235.4
10
.03
4
74
.95
4
12
.92
8
J H I R P A N I P A N P O S
PER
CEN
TAG
E R
ETA
INED
SIEVE SIZES 710 mic 600 mic 425 mic 300 mic 212 mic 150 mic 100 mic 75 mic PAN
DEPARTMENT OF CIVIL ENGINEERING, NIT ROURKELA
29 REMOVALS OF HEAVY METALS FROM RIVER BED SEDIMENT
From figure 13 it can be seen that for Jhirpani sample maximum of the soil particles are passing
through 75 micron sieve (around 75%). Hence, the soil is classified as very fine graded silty soil
and for Panpos sample the particles distribution is approximately uniform. Hence, it is classified
as well graded soil.
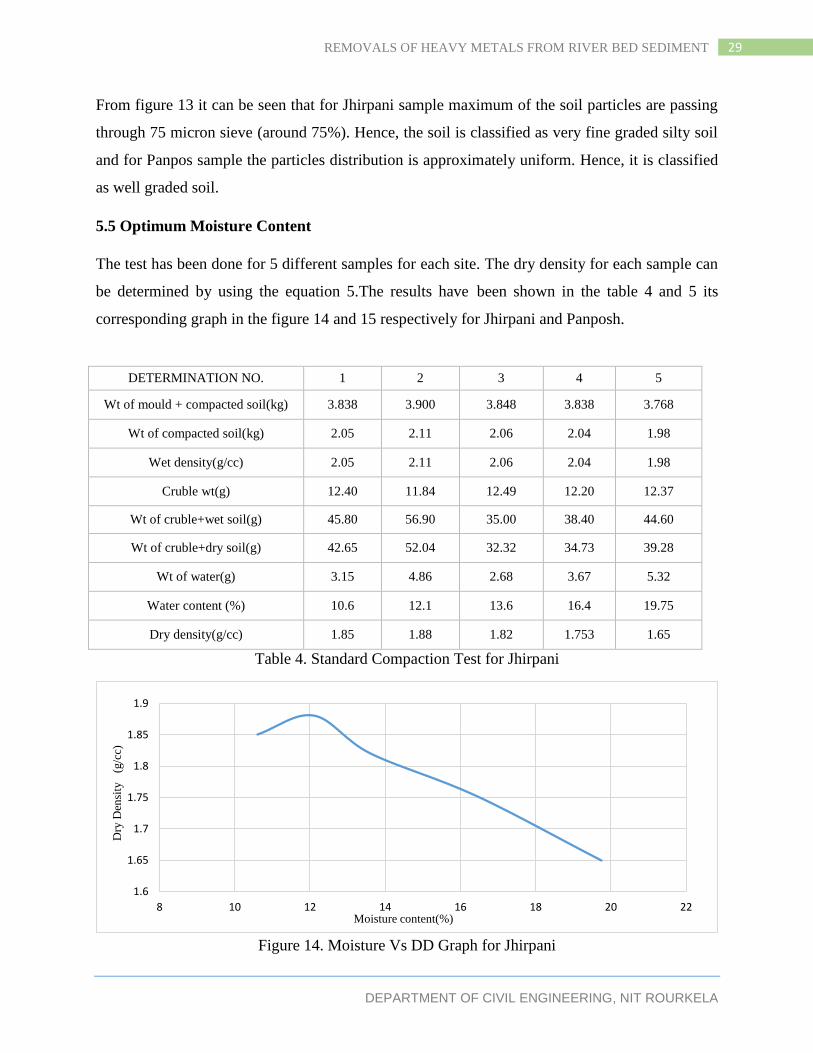
5.5 Optimum Moisture Content
The test has been done for 5 different samples for each site. The dry density for each sample can
be determined by using the equation 5.The results have been shown in the table 4 and 5 its
corresponding graph in the figure 14 and 15 respectively for Jhirpani and Panposh.
Table 4. Standard Compaction Test for Jhirpani
Figure 14. Moisture Vs DD Graph for Jhirpani
1.6
1.65
1.7
1.75
1.8
1.85
1.9
8 10 12 14 16 18 20 22Moisture content(%)
Dry
Den
sity
(g
/cc)
DETERMINATION NO. 1 2 3 4 5
Wt of mould + compacted soil(kg) 3.838 3.900 3.848 3.838 3.768
Wt of compacted soil(kg) 2.05 2.11 2.06 2.04 1.98
Wet density(g/cc) 2.05 2.11 2.06 2.04 1.98
Cruble wt(g) 12.40 11.84 12.49 12.20 12.37
Wt of cruble+wet soil(g) 45.80 56.90 35.00 38.40 44.60
Wt of cruble+dry soil(g) 42.65 52.04 32.32 34.73 39.28
Wt of water(g) 3.15 4.86 2.68 3.67 5.32
Water content (%) 10.6 12.1 13.6 16.4 19.75
Dry density(g/cc) 1.85 1.88 1.82 1.753 1.65

DEPARTMENT OF CIVIL ENGINEERING, NIT ROURKELA
30 REMOVALS OF HEAVY METALS FROM RIVER BED SEDIMENT
First the dry density increases with increase in water content. But after a certain limit it goes to
its maximum dry density and start decreasing by adding further water. The water content, at
which the dry density of a soil is maximum, is known as Optimum Moisture Content of the soil.
Using the graph (figure 14) the OMC is determined as 12.1 % and its corresponding dry density
is 1.88 g/cc.
Table 5 Standard Compaction Test for Panposh
Figure 15. Moisture Vs DD Graph for Panposh
1.7
1.75
1.8
1.85
1.9
1.95
2
6 11 16 21 26
Dry
Den
sity
(g/c
c)
Moisture content(%)
DETERMINATION NO. 1 2 3 4 5
Wt of mould + compacted
soil(kg) 3.869 3.965 4.081 4.081 3.996
Wt of compacted soil(kg) 2.027 2.123 2.239 2.239 2.154
Wet density(g/cc) 2.027 2.123 2.239 2.239 2.154
Cruble wt(g) 12.58 12.16 12.72 12.02 12.42
Wt of cruble+wet soil(g) 32.86 44.13 45.03 41.38 57.98
Wt of cruble+dry soil(g) 31.35 40.67 41.00 37.33 49.67
Wt of water(g) 1.51 3.46 4.03 4.05 8.31
Water content (%) 8.03 12.11 14.22 16.01 22.30
Dry density(g/cc) 1.87 1.89 1.96 1.93 1.76
DEPARTMENT OF CIVIL ENGINEERING, NIT ROURKELA
31 REMOVALS OF HEAVY METALS FROM RIVER BED SEDIMENT
Same methods are done as explained above. Using the graph (figure 15) the OMC of Panpos
Sample is determined as 14.22 % and the maximum dry density is 1.96 g/cc.
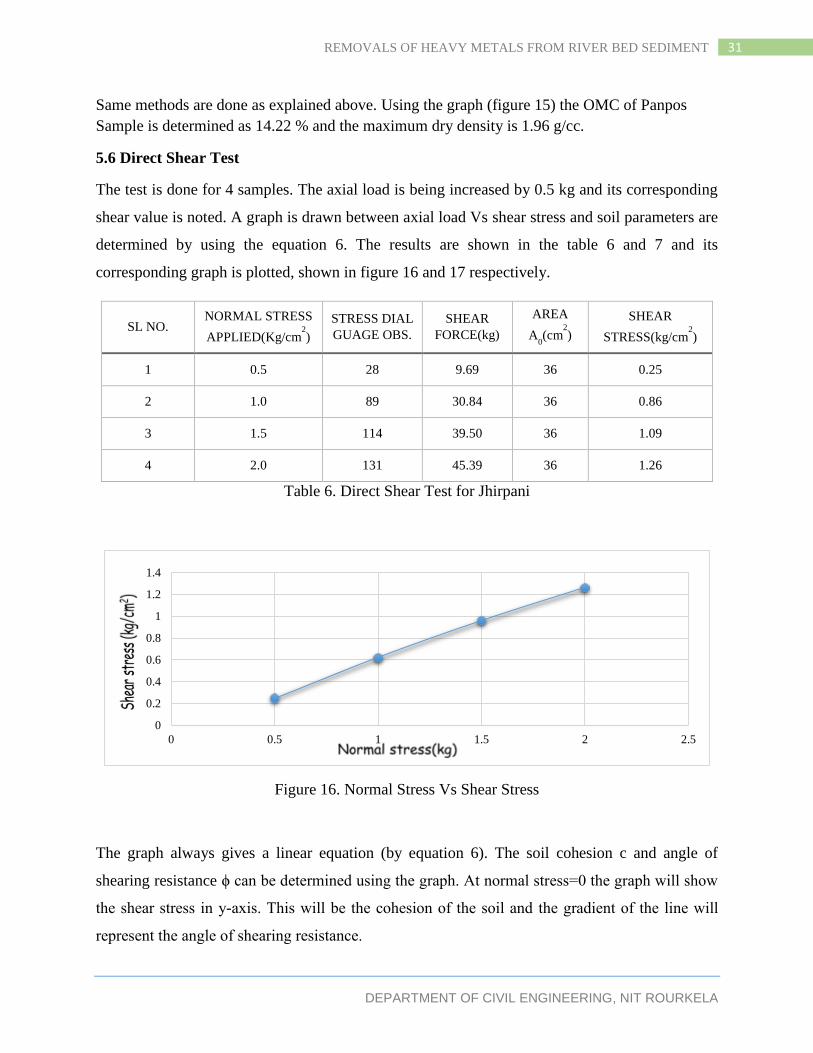
5.6 Direct Shear Test
The test is done for 4 samples. The axial load is being increased by 0.5 kg and its corresponding
shear value is noted. A graph is drawn between axial load Vs shear stress and soil parameters are
determined by using the equation 6. The results are shown in the table 6 and 7 and its
corresponding graph is plotted, shown in figure 16 and 17 respectively.
SL NO. NORMAL STRESS
APPLIED(Kg/cm2)
STRESS DIAL
GUAGE OBS.
SHEAR
FORCE(kg)
AREA
A0(cm
2)
SHEAR
STRESS(kg/cm2)
1 0.5 28 9.69 36 0.25
2 1.0 89 30.84 36 0.86
3 1.5 114 39.50 36 1.09
4 2.0 131 45.39 36 1.26
Table 6. Direct Shear Test for Jhirpani
Figure 16. Normal Stress Vs Shear Stress
The graph always gives a linear equation (by equation 6). The soil cohesion c and angle of
shearing resistance ϕ can be determined using the graph. At normal stress=0 the graph will show
the shear stress in y-axis. This will be the cohesion of the soil and the gradient of the line will
represent the angle of shearing resistance.
0
0.2
0.4
0.6
0.8
1
1.2
1.4
0 0.5 1 1.5 2 2.5

DEPARTMENT OF CIVIL ENGINEERING, NIT ROURKELA
32 REMOVALS OF HEAVY METALS FROM RIVER BED SEDIMENT
From the figure it can be seen that the graph will pass through the origin. Hence from equation 6
at σ=0, S=0 and hence Cohesion of the soil c=0. i.e, the soil is totally free of clay particles. The
sample is found as very fine graded silty soil.
SL
NO.
NORMAL STRESS
APPLIED(Kg/cm2)
STRESS
DIAL
GUAGE
OBS.
SHEAR
FORCE(kg)
AREA
A0(cm2) SHEAR STRESS(kg/cm2)
1 0.5 86 25.56 36 0.71
2 1.0 146.69 43.2 36 1.2
3 1.5 207.81 61.2 36 1.7
4 2.0 259.76 76.5 36 2.125
Table 7. Direct Shear Test for Panposh
Figure 17. Normal Stress Vs Shear Stress
The equation of the line is given by
y = 0.949x + 0.2475
So, at origin i.e, x=0, y=.02475 which is represented by cohesion of the soil.
Hence c=.2475 kg/cm2.
i.e, the soil contains small amount of clay particles.
y = 0.949x + 0.2475
0
0.5
1
1.5
2
2.5
0 0.5 1 1.5 2 2.5
Sh
ear
stre
ss(k
g/c
m2
)
Normal stress (kg/cm2)

DEPARTMENT OF CIVIL ENGINEERING, NIT ROURKELA
33 REMOVALS OF HEAVY METALS FROM RIVER BED SEDIMENT
5.7 Soil pH
The soil pH is directly determined by using pH meter, shown in figure 9.
For Jhirpani sample pH= 7.43
For Panposh Sample pH= 7.62
5.8 Heavy Metals
5.8.1 Iron
All measurement are taken from Atomic Absorption Spectroscopy (AAS). The concentration of
Iron of each site is:
For Jhirpani sample, concentration of Iron = 1.837 mg/l
For Panpos sample, concentration of Iron = 1.437 mg/l
The adsorption is done by using Ordinary Portland Cement paste and the results are shown in the
table 8 and 9 and its corresponding graphs are drawn in figure 18.
Time (hrs) Concentration of Iron(mg/l) Percentage Removal (%)
0 1.837 0
1 1.342 26.95
2 1.323 27.98
3 1.214 33.91
4 1.197 33.84
5 1.172 36.20
6 1.122 38.92
7 1.116 39.25
8 1.022 44.36
Table 8. Concentration and % removal w.r.t to time for Jhirpani

DEPARTMENT OF CIVIL ENGINEERING, NIT ROURKELA
34 REMOVALS OF HEAVY METALS FROM RIVER BED SEDIMENT
Time (hrs) Concentration(mg/l) Percentage Removal (%)
0 1.437 0.00
1 1.044 27.35
2 1.002 30.27
3 0.944 34.31
4 0.882 38.62
5 0.823 42.73
6 0.794 44.89
7 0.753 47.60
8 0.711 49.48
Table 9. Concentration and % removal w.r.t to time for Panposh
Figure 18. Time Vs Concentration for Iron
It can be seen that adsorption of Iron takes maximum within 1 hour. After that adsorption is
slightly increase with time. After 8 hours, it is considered as maximum adsorption condition and
the efficiency is determined by taking of its concentration. Efficiency is determined by using
equation 7.
0
0.2
0.4
0.6
0.8
1
1.2
1.4
1.6
1.8
2
0 1 2 3 4 5 6 7 8 9
Co
nce
ntr
atio
n (
mg/
l)
Time ( Hrs)
jhirpani
panposh

DEPARTMENT OF CIVIL ENGINEERING, NIT ROURKELA
35 REMOVALS OF HEAVY METALS FROM RIVER BED SEDIMENT
Figure 19. Time Vs Percentage Removal for Iron
After 8 hours the percentage removal of iron is 44.36 % for Jhirpani and 49.48 % for Panposh.
This change of percentage removal is due to the pH differences of these two samples. Hence, for
better efficiency of removal large quantity of adsorbent must be used.
5.8.2 Arsenic
For Jhirpani sample, concentration of Arsenic = 30.94 µg/l
For Panpos sample, concentration of Arsenic = 18.73 µg/l
The adsorption is done using the same adsorbent because OPC is very good Adsorber of Arsenic.
The readings are taken and shown in the table 10 and 11 and the corresponding time vs
concentration and time vs percentage removal of graph are plotted.
Hours Concentration(µg/l) Removal (%)
0 30.940 0
1 20.226 34.63
2 15.355 50.37
3 13.452 56.52
4 12.007 61.19
5 11.632 62.40
6 10.877 64.84
7 7.998 74.14
8 7.982 74.20
Table 10. Concentration of Arsenic for Jhirpani
0
10
20
30
40
50
60
0 1 2 3 4 5 6 7 8 9
Per
cen
tage
Rem
ova
l
Time (Hrs)
Jhirpani
Panposh

DEPARTMENT OF CIVIL ENGINEERING, NIT ROURKELA
36 REMOVALS OF HEAVY METALS FROM RIVER BED SEDIMENT
Time (Hrs) Concentration (µg/l) Removal (%)
0 18.73 0.00
1 11.32 39.56
2 10.33 44.84
3 9.65 48.48
4 9.22 49.23
5 8.44 54.94
6 6.93 63.00
7 4.71 74.85
8 2.706 85.55
Table 11. Concentration of Arsenic for Panposh
Figure 20. Time Vs concentration for Arsenic
0
5
10
15
20
25
30
35
0 1 2 3 4 5 6 7 8 9
Co
nce
ntr
atio
n (
ug/
l)
Time (Hrs)
Jhirpani
Panposh
DEPARTMENT OF CIVIL ENGINEERING, NIT ROURKELA
37 REMOVALS OF HEAVY METALS FROM RIVER BED SEDIMENT
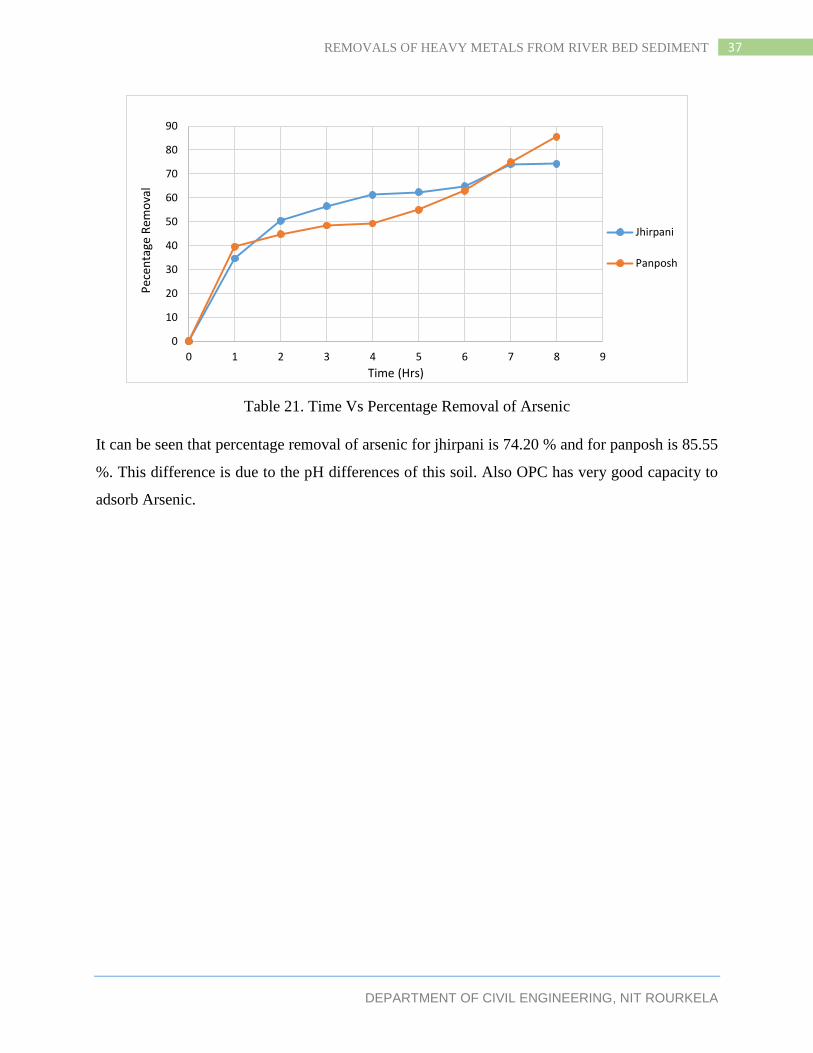
Table 21. Time Vs Percentage Removal of Arsenic
It can be seen that percentage removal of arsenic for jhirpani is 74.20 % and for panposh is 85.55
%. This difference is due to the pH differences of this soil. Also OPC has very good capacity to
adsorb Arsenic.
0
10
20
30
40
50
60
70
80
90
0 1 2 3 4 5 6 7 8 9
Pec
enta
ge R
emo
val
Time (Hrs)
Jhirpani
Panposh
DEPARTMENT OF CIVIL ENGINEERING, NIT ROURKELA
38 REMOVALS OF HEAVY METALS FROM RIVER BED SEDIMENT
CHAPTER - 8
CONCLUSIONS
The distance between Jhirpani and Panposh is around 18 kilometers by river. Still there are many
differences in their bed sediment parameters both in physical and chemical. It can be seen that at
Jhirpani the bed sediment was totally fine graded silt soil but at Panposh site it contains small
amount of clay particles. Hence, additional particles make these differences in physical
properties of bed sediment for same river in small distances.
There are many methods for removal of heavy metals. Adsorption is one of the cheapest method
that can be done anywhere. Hardened Paste of Ordinary Portland cement has been used. Using
this, many metals can be removed. Iron and Arsenic are the common heavy metals and it can be
removed using hardened paste of OPC.
There is a difference between final percentage removal of Iron and Arsenic for the two sites.
This is due to the pH differences. Hence, for different pH the adsorption efficiency will be
different. The pH value, at which the adsorption is maximum, is known as the Optimum pH of
the soil.
DEPARTMENT OF CIVIL ENGINEERING, NIT ROURKELA
39 REMOVALS OF HEAVY METALS FROM RIVER BED SEDIMENT
CHAPTER - 9
REFERENCES
1. Devkota, B. and Schmidt, G. H. (2000): Agriculture, Ecosystems and Environment 78 (2000)
85–91.
2. Mclean and Bledsoe, (1992): Contaminant Persistance and Mobility Factors. Revised: E-11
September 30, 1999.
3. Shuman, L.M. (1991): Chemical forms of micronutrients in soils. p. 113–144. In J.J. Mortvedt
et al. (ed.) Micronutrients in agriculture. SSSA Book Ser. 4. SSSA, Madison, WI.
4. Wu et al. (2007): Soil Biology & Biochemistry: Soil Biology & Biochemistry 41 (2009)
849–857.
5. Chen. M., Ma. L. Q., and Harris. W. G, (2002) :Arsenic Concentrations in Florida Surface
Soils: Influence of Soil Type and Properties: Published in Soil Sci. Soc. Am. J. 66:640–646
(2002).
6. Antoniadis. V, and Alloway. B. J: Availability of Cd, Ni and Zn to ryegrass in sewage
Sludge-Treated Soils at Different Temperatures: The University of Reading, Department of
Soil Science, P.O. Box 233, Reading, RG6 6DW, U.K.
7. Reddy et al., 2006; De Gioannis et al., (2007c): PAHs and chlorinated solvents, from soils
and sediments.
8. Gawlik, B.M and Bidoglio,G. (2006): Background values in European soils and sewage
sludges: Results of a JRC-coordinated study on background values, European Communities,
2006.
9. Ritchie, G.S.P and Dolling P.J, (1985): The Role of Organic Matter in Soil Acidification:
Postprint version. Published in Australian Journal of Soil Research, Volume 23, Issue
4, January 1, 1985, pages 569-576.
10. Karathanasis et al., (2005): The Role of Colloidal Systems in Environment Protection: Edited
by Monzer Fanun; Elsevier Publications.
11. Ayub S., Ali S.I., N.A. Khan, Rao R.A.K...2 (1) (1998): Treatment of wastewater by
agricultural waste Environ. Prot. Control J, pp. 5–8.
DEPARTMENT OF CIVIL ENGINEERING, NIT ROURKELA
40 REMOVALS OF HEAVY METALS FROM RIVER BED SEDIMENT
12. Munaf E., Zein R. 18 (1970): The use of rice husk for removal of toxic metals from
wastewater: Environment .Technology, pp. 359–362.
13. Gregg S. J. and Sing K. S. W. (1991).: Adsorption, surface area and porosity; Academic
Press
14. Jain, C.K, Ali,I : Arsenic: occurrence, toxicity and speciation techniques: Water Research 34
(17), 4303-4312.
15. Jain, C.K : Metal fractionation study on bed sediments of River Yamuna, India: Water
Research 38 (3), 569-578.
16. Kundu Subrata (11/2004): Removal of arsenic using hardened paste of Portland cement:
batch adsorption and column study: Water Research (Impact Factor: 4.66); 38(17):3780-
90.
17. Punimia B C, Jain Ashok K, Arun K Jain Arun K: Soil Mechanics and Foundations: Laxmi
Publication Pvt. Limited.
18. ISO 1985 Liquid Flow in Open Channels - Sediment in Streams and Canals
- Determination of Concentration, Particle Size and Relative Density. International Standard
ISO 4365, International Organization for Standardization, Geneva.
19. ISO 1990 Representation of Results of Particle Size Analysis - Part 1 Graphical
Presentation.International Standard ISO 9276-1, International Organization for
Standardization, Geneva.
20. Degnan, James R., Teeple, Andrew P., Johnston, Craig M., Mark C. Marvin-DiPasquale and
Luce, Darryl. (2009) : Geophysical Bed Sediment Characterization of the Androscoggin
River from the Former Chlor-Alkali Facility Superfund Site, Berlin, New Hampshire, to the
State Border with Maine.