removal of fluoride from mine water via adsorption for
TRANSCRIPT

University of Arkansas, Fayetteville University of Arkansas, Fayetteville
ScholarWorks@UARK ScholarWorks@UARK
Chemical Engineering Undergraduate Honors Theses Chemical Engineering
5-2020
Removal of Fluoride from Mine Water via Adsorption for Land-Removal of Fluoride from Mine Water via Adsorption for Land-
Applied Soil Amendment Applied Soil Amendment
Jacqueline Payne
Mary Johnson
Kevin Le
Michelle Dopp
Courtney Golman
See next page for additional authors
Follow this and additional works at: https://scholarworks.uark.edu/cheguht
Part of the Chemical Engineering Commons
Citation Citation Payne, J., Johnson, M., Le, K., Dopp, M., Golman, C., Damian, A., & Phan, E. (2020). Removal of Fluoride from Mine Water via Adsorption for Land-Applied Soil Amendment. Chemical Engineering Undergraduate Honors Theses Retrieved from https://scholarworks.uark.edu/cheguht/166
This Thesis is brought to you for free and open access by the Chemical Engineering at ScholarWorks@UARK. It has been accepted for inclusion in Chemical Engineering Undergraduate Honors Theses by an authorized administrator of ScholarWorks@UARK. For more information, please contact [email protected].

Author Author Jacqueline Payne, Mary Johnson, Kevin Le, Michelle Dopp, Courtney Golman, Adrian Damian, and Ethan Phan
This thesis is available at ScholarWorks@UARK: https://scholarworks.uark.edu/cheguht/166
The first objective our team had was to completely understand everything that is
currently happening at the Henderson mine. As part of this, I wrote a white paper on the water
use system already in place at the Henderson mine. This paper was a detailed description of
water collection, use, treatment, and disposal practices currently in place. A large part of this was
understanding the High-Density Sludge (HDS) treatment that is currently used to treat the water
at the mine. Having this background knowledge helped us pick our method for treatment and
design a full-scale system.
Next, our group had to determine what method to use for fluoride removal. The methods
we decided to investigate were precipitation, adsorption, reverse osmosis, ion exchange, and
distillation. I wrote the white paper on the precipitation method. This paper was a detailed
description of how the method works, where it’s currently used, and many pros and cons of the
method. This paper ultimately helped us eliminated precipitation as our proposed method
because the HDS water treatment already in place at the mine using precipitation and therefore it
would not be beneficial for us to use it as well.
Once our team decided to pursue adsorption as our fluoride removal method, we had to
design our bench scale column. I helped to design the column dimensions based off of literature
loading capacity values and other example columns. I then helped to consult with Mr. Peech in
order to get the column built correctly. We were then able to use this column to conduct
continuous column tests.
Our team wanted to use some biochars to test for our experiments, so each member did
background research to find potential biochar adsorbents. During my research, I found that rice
hull char could be used for fluoride adsorption and so I wrote a white paper on this topic. The
paper included how rice hulls are pyrolized into char, how they are used, what the loading
capacity usually is, and what the benefits of using rice hull char are. We ended up researching
rice hull char as one of our main adsorbents.
Our team decided to pursue rice hull char and orange peel char as two of our potential
adsorbents. We had to pyrolize these materials ourselves to get them into a charred form. Prior to
operating the pyrolysis machine we were given, we had to draw a P&ID of the system to ensure
we knew exactly what was going on during the pyrolysis process. We also had to write out all
safety hazards involved and what our plan was if anything went wrong during operation of the
pyrolysis unit. I drew the pyrolysis P&ID for our team and helped brainstorm safety hazard
scenarios.
During the research portion of this project, I spent a large amount of time in the lab
helping with experiments such as pyrolysis, batch tests, and continuous column tests. This
included carefully keeping note of all details during the experiment so that we could refer back to
them later if needed.
When writing our final report, I focused on the full-scale design of our project. This
involved many calculations to find loading time, vessel size, etc. For this section I also did
calculations to size the pump for our full-scale facility. When writing our final report, I also
focused on the byproduct generation section. This included calculating the amount of spent bone
char generated and making a plan for how it could be transported and what type of soil it could
be land-applied to as fertilizer.
Our team also had to submit an Environmental Safety Plan (ESP) for our project. For
this, I was in charge of the waste generation section. This included explaining what type of waste
we may have at the competition, how much waste we may have, what type of hazards our waste
may present, and how it can be disposed of.

University of Arkansas Task #4 1
Removal of Fluoride from Mine Water via Adsorption for Land-Applied Soil
Amendment
WERC 2020
Task #4
Moo Pig Sooie
Ralph E. Martin Department of Chemical Engineering

University of Arkansas Task #4 2
University of Arkansas
Fayetteville, AR
Removal of Fluoride from Mine Water via Adsorption for Land-Applied Soil
Amendment
WERC 2020
Task #4
April 1st, 2020
Moo Pig Sooie
Adrian Damian
Courtney Golman
Mary Johnson
Kevin Le
Michelle Dopp
Jacqueline Payne
Ethan Phan
Faculty Advisors: Dr. Michael Ackerson, Dr. W. Roy Penney
Retired Chemical Engineer Advisor: Mr. James Barron
Ralph E. Martin Department of Chemical Engineering

University of Arkansas Task #4 3
University of Arkansas
Fayetteville, AR
University of Arkansas Task #4 4
Title Page……………………………………………………………………………………...….1
Table of Content…………………………………...……………………………………...……...2 Executive Summary ...................................................................................................................... 5
Background Research ................................................................................................................... 7 Introduction .......................................................................................................................................................... 7 Current Treatment Process .................................................................................................................................. 8 Task Overview ...................................................................................................................................................... 8
Potential Treatment Methods .................................................................................................... 10 Precipitation ...................................................................................................................................................... 10 Ion Exchange...................................................................................................................................................... 10 Reverse Osmosis ................................................................................................................................................ 10 Adsorption .......................................................................................................................................................... 12
Adsorbent Background and Proposed Solution ....................................................................... 13 Activated Alumina .............................................................................................................................................. 13 Biochar ............................................................................................................................................................... 13 Bone Char .......................................................................................................................................................... 14 Selected Adsorbent ............................................................................................................................................. 14
Test Data ...................................................................................................................................... 16 Preparation of Adsorbents ................................................................................................................................. 16 Batch Testing ..................................................................................................................................................... 17 Byproduct Studies .............................................................................................................................................. 22
Bench Scale Design ..................................................................................................................... 25
Full-Scale Design ......................................................................................................................... 29
Bone Char Byproduct Application ............................................................................................ 32
Business Plan ............................................................................................................................... 33
Health, Safety, and Environmental Regulations ...................................................................... 35
Conclusion and Recommendations ........................................................................................... 37
Acknowledgments ....................................................................................................................... 38
References .................................................................................................................................... 39
Appendix ...................................................................................................................................... 42

University of Arkansas Task #4 5
Executive Summary
The process of mining minerals and elements from ores and rocks creates acid rock
drainage (ARD). This drainage is water that contains heavy metals and minerals that can be
dangerous for human consumption or damaging to the environment. The mining industry has
employed various water treatment methods to prevent these metals and minerals from being
discharged into water sources such as ponds, lakes, and streams.
Currently, the most used treatment process in the mining industry is a cost-effective high-
density sludge (HDS) process. This method reduces the concentration of metals and elements
with the use of lime/limestone. However, the concentration of fluoride is not reduced to
Environmental Protection Agency (EPA) standards, and so it is necessary to design a fluoride
removal system. Reverse osmosis (RO) was considered as well as precipitation, ion exchange,
and adsorption by media such as biochars, bone char, and activated alumina.
Although RO is perhaps the most obvious solution to reducing fluoride concentrations,
this method was eliminated due to expensive overhead and maintenance costs. Many metals and
compounds present in the mine water will lead to severe scaling and precipitates collecting in the
membrane, requiring constant upkeep and high maintenance costs. Precipitation was eliminated
because it produced a byproduct only suitable for landfilling, and ion exchange was eliminated
due to its high cost and complications with competitive ions. Adsorption was chosen as a viable
option for fluoride removal because of its low cost and environmentally friendly byproduct
generation.
The adsorption media was chosen based on a ranking system designed by our team. This
system provided a way for our team to compare the adsorption capacity, rate of adsorption,
byproduct application, and price per ton for each adsorbent. From this ranking system, Moo Pig
Sooie is presenting a solution of cow bone char as a fluoride adsorbent. This type of biochar can
be bought pre-charred and can be land applied as a fertilizer once the char is spent.
A full-scale facility was designed to treat 1000 gallons per minute (GPM) of mine water
24 hours a day, seven days a week, for eight months out of the year. To achieve this flowrate and
timeline, two packed beds with volumes of 8,900 ft3 each were designed to run in parallel to
ensure loading does not occur until the 168-hour mark, the end of the work week. Once the bone
char is loaded, the spent bone char will be hauled offsite to be land applied in soil that is
University of Arkansas Task #4 6
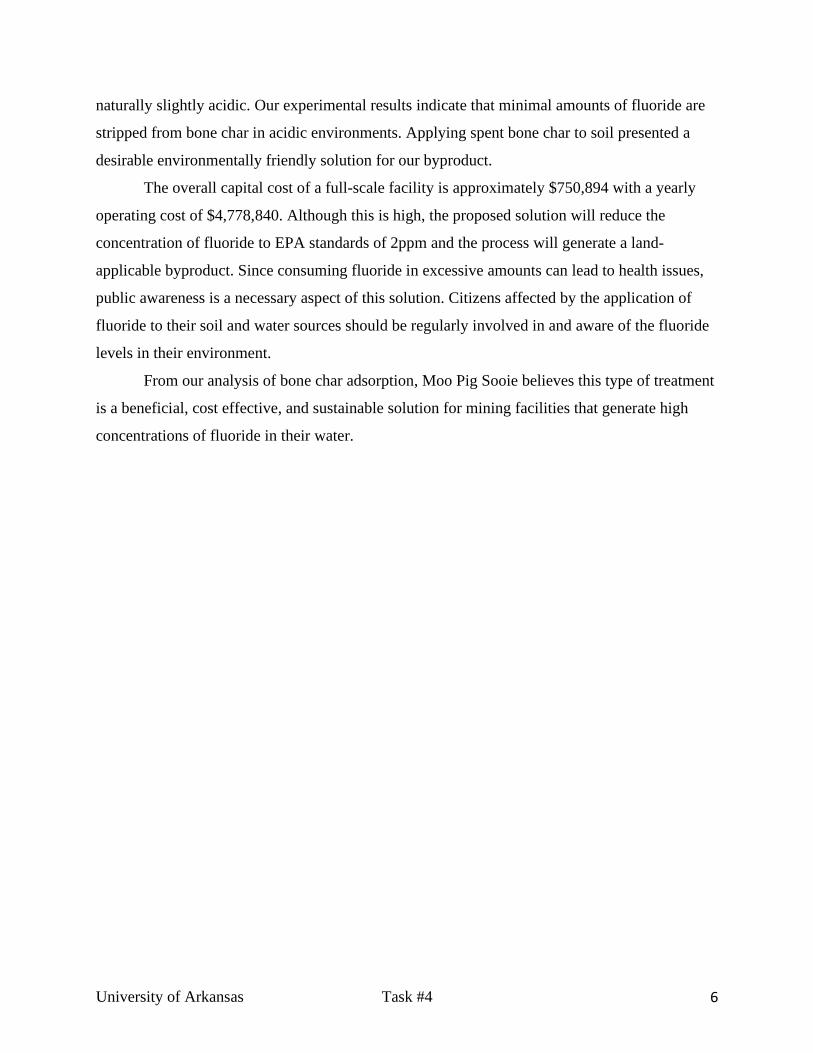
naturally slightly acidic. Our experimental results indicate that minimal amounts of fluoride are
stripped from bone char in acidic environments. Applying spent bone char to soil presented a
desirable environmentally friendly solution for our byproduct.
The overall capital cost of a full-scale facility is approximately $750,894 with a yearly
operating cost of $4,778,840. Although this is high, the proposed solution will reduce the
concentration of fluoride to EPA standards of 2ppm and the process will generate a land-
applicable byproduct. Since consuming fluoride in excessive amounts can lead to health issues,
public awareness is a necessary aspect of this solution. Citizens affected by the application of
fluoride to their soil and water sources should be regularly involved in and aware of the fluoride
levels in their environment.
From our analysis of bone char adsorption, Moo Pig Sooie believes this type of treatment
is a beneficial, cost effective, and sustainable solution for mining facilities that generate high
concentrations of fluoride in their water.

University of Arkansas Task #4 7
Background Research
Introduction
Fluorine is the 13th most abundant element in the world.1 It is vastly dispersed throughout
the environment in soil, water, rocks, and air. Water is the most common source of exposure to
humans due to ingestion. According to the EPA, the primary standard for fluoride in drinking
water is 4.0 mg/L or 4.0 parts per million (ppm), and the secondary standard is 2.0 mg/L.2 While
the secondary standard is not a federally backed concentration level, the EPA requires notice of
discharged water with fluoride concentrations approaching the 2.0 ppm mark.
Fluoride can strengthen tooth enamel and prevent tooth decay. Many cities add fluoride
to their municipal water, at concentrations of 2 ppm or lower. However, exposure to levels above
4 ppm can cause adverse health effects ranging from mild dental fluorosis to skeletal fluorosis.
Mild dental fluorosis can result in tooth decay and tooth discoloration.3 Skeletal fluorosis is the
buildup of fluoride on the bones, which can lead to weakened bones and joint immobility.4 To
lower the likelihood of people experiencing these illnesses, fluoride is a highly regulated element
in drinking waters.
A contributing factor to high concentrations of fluoride in water is the mining of certain
minerals. Moo Pig Sooie focused on the Henderson mine Empire, Colorado, for our study.
Henderson mines molybdenum ore that naturally contains fluoride. Fluoride dissolves from the
ore during processes such as wet grinding and flotation, which concentrate molybdenum mineral
from the ore. The rock that is not removed during these processes is sent to a tailings pond as a
slurry, where the slurry separates from the water as a fine silt.5 This water, concentrated with
many different elements and heavy metals, remains in the tailings pond.5 The tailings pond will
continue to fill until discharge is necessary, typically during months of high precipitation and
snow melt. The discharged water must undergo fluoride removal treatment before being released
into the surrounding freshwater creeks; however, the current treatment process only reduces the
concentration of fluoride in the water to 10 ppm, well above the EPA’s secondary standard.
Because of this, the Henderson mine is a good candidate for a study of post-HDS fluoride
removal.
There is concern that the EPA standards for discharged water will be lowered within the
next ten years. As of today, the state of Colorado requires a water discharge permit from mining
sites but considers the addition of fluoride into water as a form of water fluoridation.6 The
University of Arkansas Task #4 8
Henderson mine is in the county of Clear Creek, which contains 10 water systems that support
the 9,605 residents in the county. 6,7 Currently, the mining process discharges 10 ppm fluoride,
so it is important reduce this concentration and prevent nearby water systems from experiencing
fluoride levels that exceed the EPA’s standards.
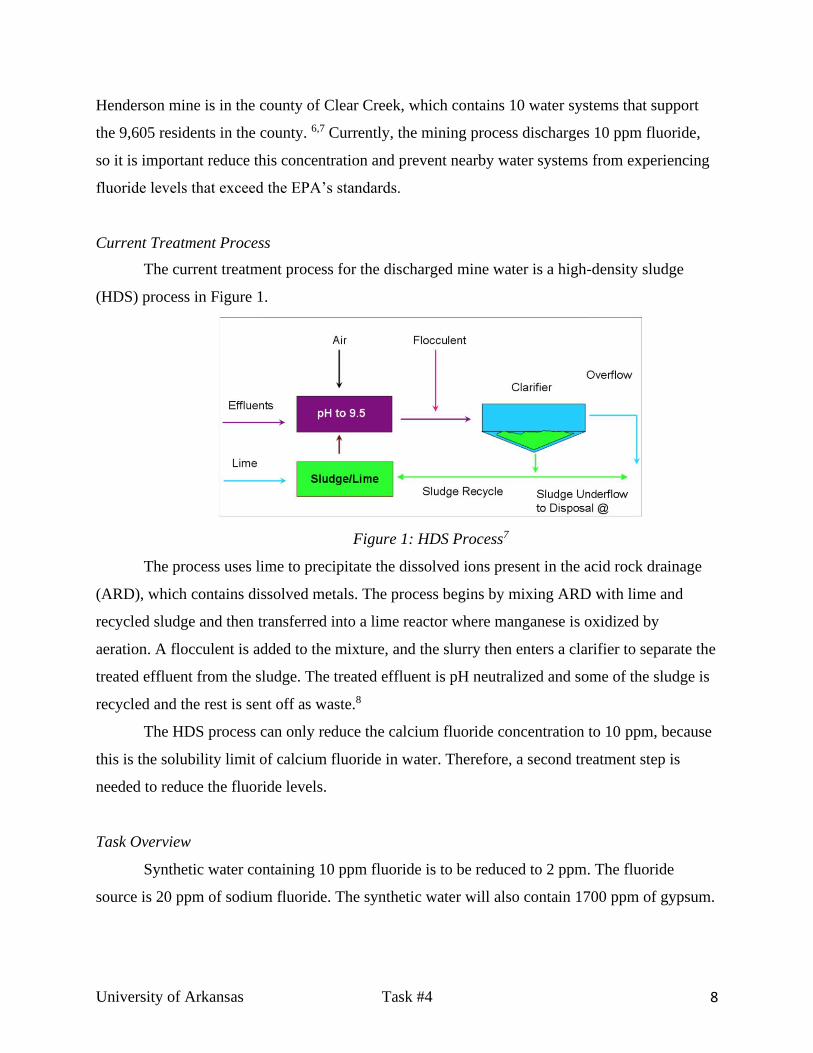
Current Treatment Process
The current treatment process for the discharged mine water is a high-density sludge
(HDS) process in Figure 1.
Figure 1: HDS Process7
The process uses lime to precipitate the dissolved ions present in the acid rock drainage
(ARD), which contains dissolved metals. The process begins by mixing ARD with lime and
recycled sludge and then transferred into a lime reactor where manganese is oxidized by
aeration. A flocculent is added to the mixture, and the slurry then enters a clarifier to separate the
treated effluent from the sludge. The treated effluent is pH neutralized and some of the sludge is
recycled and the rest is sent off as waste.8
The HDS process can only reduce the calcium fluoride concentration to 10 ppm, because
this is the solubility limit of calcium fluoride in water. Therefore, a second treatment step is
needed to reduce the fluoride levels.
Task Overview
Synthetic water containing 10 ppm fluoride is to be reduced to 2 ppm. The fluoride
source is 20 ppm of sodium fluoride. The synthetic water will also contain 1700 ppm of gypsum.

University of Arkansas Task #4 9
The process should produce a low-cost or marketable byproduct. The process should be scaled to
treat 1000 gallons per minute (gpm) of water to support a full-scale water treatment plant.

University of Arkansas Task #4 10
Potential Treatment Methods
Precipitation
Precipitation is a treatment method that allows an insoluble product to settle out of
solution by sedimentation.9 The fluoride compound with the lowest solubility in water is calcium
fluoride, with a solubility limit of 0.016 ppm.9 When calcium sources such as lime or calcium
chloride are added to a solution containing fluoride ions, calcium fluoride will form and
precipitate out of the solution.
This method was not pursued by our team because the currently employed HDS method
already uses lime to precipitate calcium fluoride. The resulting sludge has a water content of 60-
80% and contains low-quality calcium fluoride at 20-40%.10 Additional precipitation would
likely require dilution, and the resulting solids would be impure and only viable for landfilling.
Precipitation was eliminated as a method for reducing fluoride concentration because it does not
produce the environmentally friendly solution that Moo Pig Sooie would prefer.
Ion Exchange
Ion exchange (IE) is a chemical process that exchanges unwanted ions for more desirable
ions with a similar charge. IE is an attractive water treatment method because the IE resin can be
made highly selective towards fluoride ions, requires small volumes of resin, and can last up to
five years.11 However, the efficiency of ion exchange is greatly limited by mineral scaling and
surface clogging, which cause resin fouling11. This is problematic for mine water, which is
saturated with many metals and minerals. The resins would require extra maintenance to control
fouling, and the spent IE resin would need to be landfilled or incinerated.
Reverse Osmosis
Reverse osmosis (RO) is a common filtration system that can be used to remove ions or
compounds from a solution through a pressure gradient within a membrane. It has the capability
of recovering 85 to 95% of brackish or sea water running through a system and turning it into
potable water, while only losing a small percentage to the retentate/concentrate.
According to a report released by R. Alan Shubert, City of El Paso Vice President of
Operations and Technical Services, the Kay Bailey Hutchison Desalination Plant had a total
capital cost of $91 million.12 This facility uses pre-treatment and post-treatment methods that
costs close to $1 million annually.13 The annual cost of labor for this facility is around $400,000
University of Arkansas Task #4 11
and the annual cost of electricity is near $1.5 million.13 This plant can treat 27.5 million gallons
per day (MGD), but on average treats 4.2 MGD19. Since the startup of this desalination plant in
2007, it costs the facility on average $7.83 per 1000 gallons. The cost of water per 1000 gallons
in El Paso, Texas varies between $3 to $5, roughly half the production cost of 1000 gallons from
the desalination plant.14
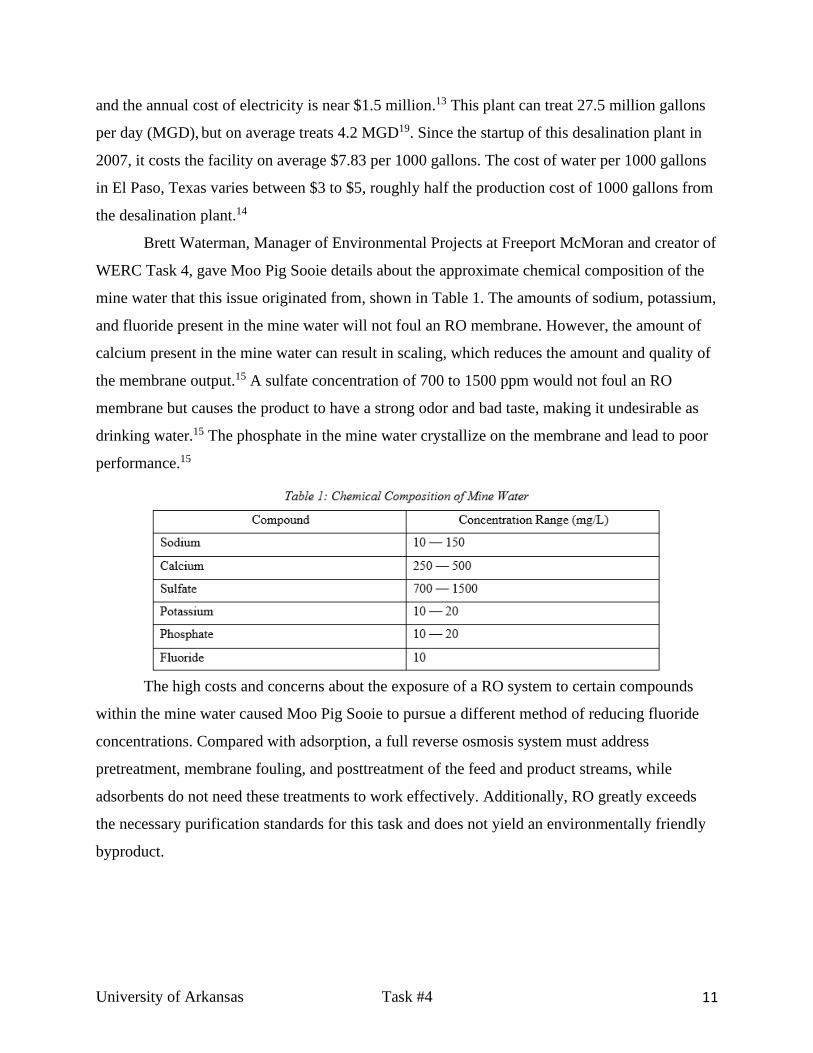
Brett Waterman, Manager of Environmental Projects at Freeport McMoran and creator of
WERC Task 4, gave Moo Pig Sooie details about the approximate chemical composition of the
mine water that this issue originated from, shown in Table 1. The amounts of sodium, potassium,
and fluoride present in the mine water will not foul an RO membrane. However, the amount of
calcium present in the mine water can result in scaling, which reduces the amount and quality of
the membrane output.15 A sulfate concentration of 700 to 1500 ppm would not foul an RO
membrane but causes the product to have a strong odor and bad taste, making it undesirable as
drinking water.15 The phosphate in the mine water crystallize on the membrane and lead to poor
performance.15
The high costs and concerns about the exposure of a RO system to certain compounds
within the mine water caused Moo Pig Sooie to pursue a different method of reducing fluoride
concentrations. Compared with adsorption, a full reverse osmosis system must address
pretreatment, membrane fouling, and posttreatment of the feed and product streams, while
adsorbents do not need these treatments to work effectively. Additionally, RO greatly exceeds
the necessary purification standards for this task and does not yield an environmentally friendly
byproduct.
University of Arkansas Task #4 12
Adsorption
Adsorption is a common fluoride removal method that can be accomplished by a variety
of adsorbents. This method functions by pumping the contaminated water through a packed bed
filled with an adsorbent. This process is appealing because it is relatively simple and there are a
large variety of adsorbents available to choose from. Each adsorbent has a unique equilibrium
loading capacity and rate of adsorption. These parameters, as well as cost and byproduct
generation, are used to select the best adsorbent for a process. Moo Pig Sooie decided to use
adsorption as the fluoride removal method because of the readily available variety of adsorbents,
high fluoride removal capacity, environmentally friendly byproduct generation, and the
simplicity of operation that we believe gives the best possible solution to this task.

University of Arkansas Task #4 13
Adsorbent Background and Proposed Solution
Activated Alumina
Activated Alumina (AA) is commonly used as an adsorbent for the removal of fluoride
and arsenic from contaminated water. AA is made from treating bauxite, or aluminum ore, with
heat and acid. The product is highly porous, contains no organics, and is mostly of the form
Al2O3.16 As an adsorbent, it is often sold in granular forms of 14 x 28 Tyler mesh size.17
Activated alumina, at ideal operating conditions, can have a fluoride adsorption capacity of 16
mg/g. It can be regenerated with a slightly basic solution.18
AA adsorption systems are available for domestic and commercial use. AA water filters
for domestic use may be found in most local hardware stores.19 Larger units for commercial use
are often installed in production plants, where the process wastewater contains high
concentrations of fluoride. These systems usually involve two adsorption columns in parallel.20
A properly designed AA system can easily reduce fluoride concentrations from 10 ppm
to less than 2 ppm. However, there are some disadvantages to using activated alumina. Firstly,
the adsorptive capacity of AA can decrease up to 30% after 5 regeneration cycles. Eventually the
AA must be discarded and replaced with fresh AA. The spent AA has no known applications
and, the EPA recommends it to be landfilled. Another disadvantage of using activated alumina is
handling the regeneration solution that retains high concentrations of fluoride. Usually, this
waste is sent to an evaporation pond.21
Despite its unfavorable byproduct generation, AA is an appealing adsorbent because it is
inexpensive. A 2014 study by the EPA estimated the total operating costs of an AA unit treating
900 gpm of water with 8 ppm fluoride to be approximately $1/1000 gallons.21
The Moo Pig Sooie team pursued activated alumina as a potential solution due to its
known success and low operating costs. Moo Pig Sooie also investigated applications for spent
AA that would avoid landfilling.
Biochar
Biochar is a potential adsorbent because of its availability, low cost, and low
environmental impacts. Moo Pig Sooie felt that biochar adsorbents proposed a unique solution to
this problem and decided to pursue orange peel char (OPC) and rice hull char (RHC).
OPC is a viable fluoride adsorbent because orange peels are biodegradable, inexpensive,
and naturally contain high amounts of calcium.22 Fluoride has an affinity for calcium and will

University of Arkansas Task #4 14
readily adsorb onto the calcium in the orange peels. OPC is made by drying and then pyrolyzing
orange peels. However, the cost to ship orange peels gets increasingly expensive since orange
peels are water heavy. A second step of drying them before shipment would need to preferably
be implemented.
Rice hull char (RHC) is also a viable adsorbent because contains carboxyl, hydroxyl, and
amidogen groups, all of which increase adsorption capabilities. Rice hulls are also very
inexpensive because they are one of the most readily available agricultural byproducts. Literature
values report fluoride equilibrium loading capacity of RHC ranging from 2.91 mg/g to 8 mg/g.23
Because the RHC yields lower capacities than the other adsorbents, it would take more in a
column to get the desired results.
Bone Char
Bone char is a common adsorbent used for removing heavy metals and fluoride from
water. The char is made by crushing and pyrolyzing animal bones, most of which come from
cattle.24 Bone char is a highly porous material that is suitable for adsorption and consists mostly
of carbonates and calcium phosphate.25 Under ideal conditions, bone char can have an adsorption
capacity of 11 mg/g. It is a commonly used soil amendment, and sulfate-enhanced bone char can
even be used as a substitute for phosphate fertilizer.27 This appealed to our team, since our spent
bone char would contain high amounts of sulfate and phosphates.
Bone char is generated in millions of tons each year. The agricultural outlook provided
by the Organization for Economic Co-operation and Development (OECD) in 2018 predicted
that the amount of meat production will increase by 40 million tons in ten years. There will be a
corresponding increase in meat production waste, specifically animal bones.26
The high adsorption capacities, environmentally friendly byproduct, and projected supply
of bone char led Moo Pig Sooie to pursue bone char as a fluoride adsorbent.
Selected Adsorbent
To select an adsorbent, the adsorption capacity, rate of adsorption, byproduct product
application, and costs of each adsorbent were evaluated. The adsorbents studied were activated
alumina, orange peel char, rice hull char, and bone char. A scoring system was created to
determine which adsorbent might be the best choice.

University of Arkansas Task #4 15
The adsorption capacity score was determined by the maximum adsorption capacities
found in literature. The highest adsorption capacity received the highest ranking. Although we
performed the batch experiments in our own lab to determine the adsorption capacities, the batch
test results varied so greatly from literature values that we decided to only reference literature
values. Discussion of batch testing and possible errors can be found in section 4.2.
The rate of adsorption scores was determined by the minimal contact time needed for the
adsorbents to reach the max adsorption capacity. The least amount of time received the highest
score. Byproduct application had two possible scores. If the solution resulted in landfilling the
byproduct, this earned a score of 1. If the byproduct could be applied elsewhere, such as a
fertilizer or benign soil amendment, this earned score of 4. The cost scores were determined by
costs per ton of adsorbent. All the cost values were obtained from wholesale company Alibaba.
If a price range was given, the lowest value was selected to represent cost per ton.
At the end of the ranking system evaluation, the results end up showing that activated
alumina would be the least favorable option to pursue with a score of 9. The other three
adsorbents ended up having very similar scores, so a definitive primary adsorbent was not
determined. All adsorbents were batch tested to see if the test results would reflect literature
results.
Table 3: Adsorbent Comparison Table

University of Arkansas Task #4 16
Test Data
Preparation of Adsorbents
The Moo Pig Sooie team investigated five different adsorbents: 1/8” spherical AA, bone
char, orange peel char, rice hull char, and 14 x 28 Tyler mesh AA. The activated alumina was
purchased in its appropriate form. Bone char was purchased in 8 x 24 Tyler mesh size, and
sieved to particle sizes greater than 1.4 mm. Orange peels and rice hulls were bought uncharred
and were both pyrolyzed using the unit shown in Figure 2.
Figure 2: Pyrolysis Unit
The orange peels were dried in an oven at 190°F for three hours before pyrolysis to
reduce the time required for pyrolysis and mitigate the accumulation of oils in the pyrolysis unit.
Rice hulls were not dried beforehand because their moisture content was determined to be low
enough that it would not affect the pyrolysis time or unit.
For each biochar, the pyrolysis unit was filled with the material to 80% of the unit’s
volume. The temperature was raised to 900°F, and then held constant for one hour before
cooling. The charred products were sieved to sizes greater than 1.4 mm.

University of Arkansas Task #4 17
Batch Testing
Batch tests were performed for each of the five adsorbents to determine their adsorption
capacities. First, one liter of synthetic water was prepared using 1.7 g/L of calcium sulfate, and
22.1 mg/L of sodium fluoride.
15g of the adsorbent was added to the solution and stirred with an impeller at 300 RPM
and 20°C. A baffle was placed on the side of the beaker to promote the distribution of adsorbent
during stirring. The stirring apparatus is shown in Figure 3.
Figure 3: Batch Testing Apparatus, Bone Char
Samples were analyzed by the Don Tyson for Agricultural Sciences Water Quality Lab at
the University of Arkansas, using the EPA 300 method. Results are shown in Figure 4.

University of Arkansas Task #4 18
Figure 4: Fluoride Concentration vs Time for Batch Tests
Based on these data, Moo Pig Sooie eliminated the 1/8” AA as a potential adsorbent
because the granular 14 x 28 AA adsorbed more fluoride and was made of the same material. If
AA was chosen as the final adsorbent, the 14 x 28 mesh form would be preferred. These data
also indicated that fluoride concentrations increased in biochar batches. Our team hypothesized
that these chars must naturally contain fluoride. To test this, rice hull and orange peel chars were
batch tested in solutions of pure deionized (DI) water. See Figure 5 for results.
Figure 5: Fluoride Concentrations in DI water with Biochars
0
2
4
6
8
10
12
14
16
18
20
0 50 100 150 200 250 300
Co
nce
ntr
atio
n F
luo
rid
e (p
pm
)
Time (min)
Fluoride Concentration vs. Time
1/8" AA
14 x 28 AA
Bone Char
Rice Hull Char
Orange Peel Char
0
0.5
1
1.5
2
2.5
3
3.5
0 50 100 150 200 250
Flu
ori
de
Co
nce
ntr
atio
n (
pp
m)
Time (min)
Fluoride Concentrations in DI Water
Orange Peel Char
Rice Hull Char
University of Arkansas Task #4 19
These results indicate that biochar solutions increase fluoride content in the water and
therefore must naturally contain fluoride. Although these results contradicted literature, Moo Pig
Sooie concluded that rice hull and orange peel chars were not viable fluoride adsorbents.
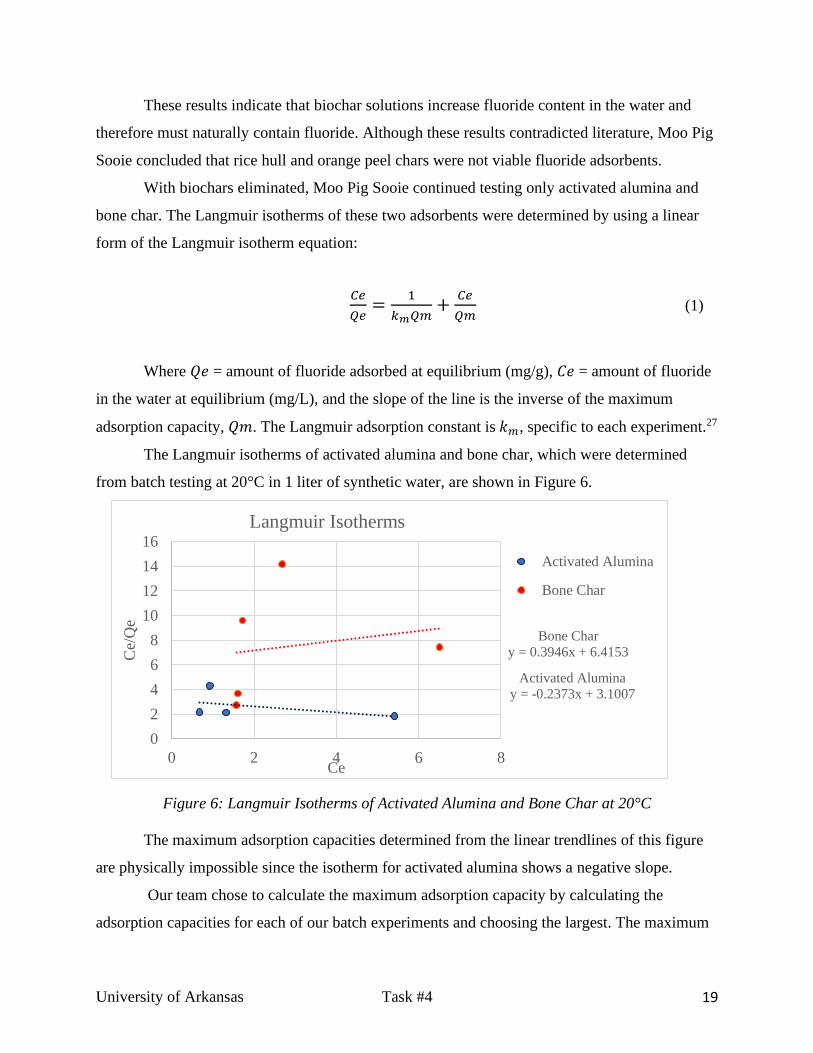
With biochars eliminated, Moo Pig Sooie continued testing only activated alumina and
bone char. The Langmuir isotherms of these two adsorbents were determined by using a linear
form of the Langmuir isotherm equation:
𝐶𝑒
𝑄𝑒=
1
𝑘𝑚𝑄𝑚+
𝐶𝑒
𝑄𝑚 (1)
Where 𝑄𝑒 = amount of fluoride adsorbed at equilibrium (mg/g), 𝐶𝑒 = amount of fluoride
in the water at equilibrium (mg/L), and the slope of the line is the inverse of the maximum
adsorption capacity, 𝑄𝑚. The Langmuir adsorption constant is 𝑘𝑚, specific to each experiment.27
The Langmuir isotherms of activated alumina and bone char, which were determined
from batch testing at 20°C in 1 liter of synthetic water, are shown in Figure 6.
Figure 6: Langmuir Isotherms of Activated Alumina and Bone Char at 20°C
The maximum adsorption capacities determined from the linear trendlines of this figure
are physically impossible since the isotherm for activated alumina shows a negative slope.
Our team chose to calculate the maximum adsorption capacity by calculating the
adsorption capacities for each of our batch experiments and choosing the largest. The maximum
Activated Alumina
y = -0.2373x + 3.1007
Bone Char
y = 0.3946x + 6.4153
0
2
4
6
8
10
12
14
16
0 2 4 6 8
Ce/
Qe
Ce
Langmuir Isotherms
Activated Alumina
Bone Char

University of Arkansas Task #4 20
adsorption capacities for bone char and AA were determined to be .57 mg/g and .63 mg/g,
respectively. Literature reports that, at a pH of 7 and at 20°C, AA and bone char should have a
maximum adsorption capacity of 16 mg/g and 11 mg/g, respectively.24,31
Moo Pig Sooie hypothesized two reasons for the large disparity between our results and
literature values. The first hypothesis was that the high concentrations of other ions, specifically
sulfate, were competing with fluoride for active sites on the adsorbent. Multiple studies have
indicated that sulfate competes with fluoride during adsorption.9,18,24,28,30 Moo Pig Sooie tested
this hypothesis by running batch experiments with water containing only fluoride, water with
fluoride and sulfate, and water using the synthetic mine water recipe listed in Table 1 listed
earlier. Our team predicted that the adsorbents would adsorb the most fluoride when only
fluoride was present in the water, and that the least amount of fluoride would be adsorbed from
the mine water, where multiple competitive ions were present.
The results of this experiment with bone char are shown in Figure 7. Adsorption of
Fluoride was defined as the concentration of fluoride present in the water at the time of sample
collection, divided by the initial concentration in the water, C0.
Figure 7: Adsorption of Fluoride with Competitive Ions, Bone Char
0
0.5
1
1.5
2
2.5
3
0 100 200 300 400 500
ln(C
/C0)
Time (min)
Adsorption of Fluoride vs. Time, Bone Char
20 ppm, Fluoride Only
10 ppm Fluoride, With Sulfate
10 ppm Fluoride, Mine Water
University of Arkansas Task #4 21
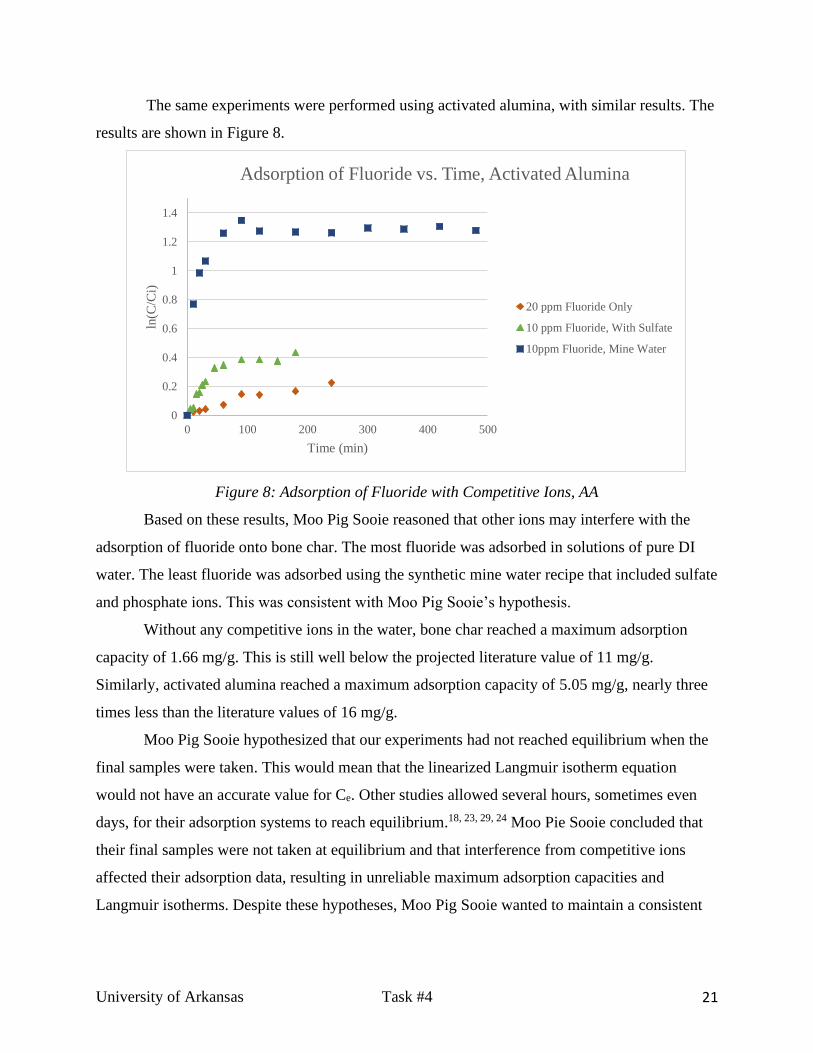
The same experiments were performed using activated alumina, with similar results. The
results are shown in Figure 8.
Figure 8: Adsorption of Fluoride with Competitive Ions, AA
Based on these results, Moo Pig Sooie reasoned that other ions may interfere with the
adsorption of fluoride onto bone char. The most fluoride was adsorbed in solutions of pure DI
water. The least fluoride was adsorbed using the synthetic mine water recipe that included sulfate
and phosphate ions. This was consistent with Moo Pig Sooie’s hypothesis.
Without any competitive ions in the water, bone char reached a maximum adsorption
capacity of 1.66 mg/g. This is still well below the projected literature value of 11 mg/g.
Similarly, activated alumina reached a maximum adsorption capacity of 5.05 mg/g, nearly three
times less than the literature values of 16 mg/g.
Moo Pig Sooie hypothesized that our experiments had not reached equilibrium when the
final samples were taken. This would mean that the linearized Langmuir isotherm equation
would not have an accurate value for Ce. Other studies allowed several hours, sometimes even
days, for their adsorption systems to reach equilibrium.18, 23, 29, 24 Moo Pie Sooie concluded that
their final samples were not taken at equilibrium and that interference from competitive ions
affected their adsorption data, resulting in unreliable maximum adsorption capacities and
Langmuir isotherms. Despite these hypotheses, Moo Pig Sooie wanted to maintain a consistent
0
0.2
0.4
0.6
0.8
1
1.2
1.4
0 100 200 300 400 500
ln(C
/Ci)
Time (min)
Adsorption of Fluoride vs. Time, Activated Alumina
20 ppm Fluoride Only
10 ppm Fluoride, With Sulfate
10ppm Fluoride, Mine Water

University of Arkansas Task #4 22
study derived from experimental results, and so used our experimental data to design a full-scale
system.
Byproduct Studies
Moo Pig Sooie investigated possible byproduct solutions for the two adsorbents. BC is an
appealing adsorbent due to its biocompatibility and potential agricultural applications. However,
high fluoride concentrations can be harmful to some plants.31 If the adsorbed fluoride was
stripped from the BC, it could enter the soil and damage the plants, and eventually could
contaminate water sources. Common soil pH’s in the United States range from 5 to 7 and, in
some areas can be up to 7.8.32 The Moo Pig Sooie team tested if fluoride would strip from BC in
pH’s of 5, 6, and 8 by placing fluoride-saturated bone char in solutions of these different pH’s. A
pH of 7 was not tested, because all batch experiments determining adsorption capacities were
performed at a pH of 7 and had shown that bone char would adsorb fluoride at this pH. Samples
were taken daily and can been seen in Figure 9.
Figure 9: pH test results for Bone Char
These results indicate that bone char will initially slough fluoride ions, but over time will
re-adsorb the ions. BC re-adsorbed the most fluoride all conditions. This good because this
means the BC would not fully leech from the adsorbent into the soil, potentially harming the
plant.
Moo Pig Sooie also explored alternative byproduct applications options for AA, since
current AA treatment systems send the spent adsorbent to a landfill. Moo Pig Sooie pursued the
0
0.5
1
1.5
2
2.5
0 2 4 6 8
Flu
ori
de
Conce
ntr
atio
n (
ppm
)
Time (days)
Bone Char pH Tests
pH 5
pH 6
pH 8

University of Arkansas Task #4 23
potential use of placing spent AA into concrete mixes. Concrete testing experiments were
organized with Dr. Cameron Murray of the University of Arkansas Civil Engineering
Department. These experiments involved replacing approximately 20% of the sand used in
concrete with the mesh form or spherical form of activated alumina. The compositions are shown
in Table 4.
Table 4: Composition of Control Mix, 14 x 28 Mesh, and 1/8” AA mixes
Mix Composition (lbs/yd)
Cement Rock AA Sand Water Air Total
Control 611 1720 0 1087.97 305.5 0.06 3724.53
14 x 28
mesh AA
611 1720 289.57 870.38 305.5 0.06 3796.51
1/8” AA 611 1720 289.57 870.38 305.5 0.06 3796.51
These concrete mixes were subjected to slump tests and break tests. The slump test for
concrete mix is done to determine the workability of the mix. If the mix is too viscous or not
viscous enough, it is difficult to use the mix for projects. The slump test concluded that the 14 x
28 mesh AA had the lowest workability and slumped the most out of the three groups. The
results of slump testing are shown in Table 5.
Table 5: Slump of Each Mix During Slump Test
Mix Slump (inches)
Control 7
14 x 28 mesh AA 10
1/8” AA 8
Break tests are used to determine the compressive strength of the concrete. This involves
applying a compressive force onto a cylinder of concrete until failure. These tests are performed
after 1,7,14, and 28 days. After 28 days, it is assumed that the concrete has 95% of its maximum
strength. The break tests of Moo Pig Sooie’s concrete mixes are shown in Table 6.
Table 6: Average Strength of Each Mix During Break Test
Mix
Average Strength (psi)
Day 1 Day 7 Day 14 Day 28
Control 2,778 5,069 5,529 5,721
14 x 28 mesh AA 1,672 3,898 3,939 4,149
1/8” AA 2,294 4,168 4,452 5,268

University of Arkansas Task #4 24
The break tests showed that the 1/8” AA was stronger than the 14 x 28 mesh, but weaker
than the control group. This leads to the possibility that AA decreases the strength of concrete by
an unknown factor. These results indicated that AA might be used in concrete projects that
require low strength performance, such as sidewalks. However, an AA-based concrete mixture
has poor workability and further testing would be required to find an optimal AA to sand ratio
that does not sacrifice strength and workability for landfill reduction. Moo Pig Sooie concluded
that AA is not currently a desirable substitute for sand, and that AA-generated waste from an
adsorption process is only fit for landfilling.

University of Arkansas Task #4 25
Bench Scale Design
The bench scale design consists of a clear PVC column, centrifugal pump, and tubing
shown in in the Figure 10 schematic. Figure 11 is an image of the setup.
Figure 10: Bench Scale Adsorption Column
Figure 11: Bench Scale Column
The column is loaded with either 80.7 g of bone char or 83.7 g of AA. Once the column
is packed, it is tightly sealed and reconnected to system. The submersible pump is started and
introduces DI water to the column. Once the desired flow rate is achieved, the pump is
transferred into a synthetic solution, and this solution is sent through the system.
Operating conditions were determined by varying the flowrate through the column and
taking a sample once steady state was achieved. Tables 7 and 8 are the results for experiments.

University of Arkansas Task #4 26
Table 7: Bench Scale Adsorption Column Data for BC
Flow rate
(mL/min)
Time for two bed
volumes (min)
Residence
time (min)
Concentration
fluoride (ppm)
Fraction of
Fluoride
Adsorbed
Loading Capacity (mg
Fluoride / g adsorbent)
0.00 0.000 0.00 8.99 0.00 0.00
9.25 24.86 12.4 0.215 0.98 1.89
13.0 17.69 8.85 0.11 0.99 1.91
14.4 15.97 7.99 0.117 0.99 1.91
16.3 14.11 7.06 0.149 0.98 1.90
19.0 12.11 6.05 0.147 0.98 1.90
20.1 11.44 5.72 0.221 0.98 1.90
23.3 9.870 4.94 0.256 0.97 1.89
30.1 7.640 3.82 0.427 0.95 1.88
Table 8: Bench Scale Adsorption Column Data for AA
Flow rate
(mL/min)
Time for two bed
volumes (min)
Residence time
(min)
Concentration
fluoride (ppm)
Fraction of
Fluoride
Adsorbed
Loading Capacity (mg
Fluoride adsorbed/ g
adsorbent)
0.00 0.000 0.00 8.716 0.0 0.00
8.65 29.83 14.9 0.000 1.0 1.94
13.0 19.85 9.92 0.228 0.97 1.89
15.0 17.20 8.60 0.000 1.0 1.94
16.5 15.64 7.82 0.483 0.94 1.84
18.8 13.76 6.88 0.100 0.99 1.92
22.0 12.29 6.14 0.490 0.94 1.83
22.4 11.52 5.76 0.900 0.90 1.74
25.0 10.32 5.16 0.416 0.95 1.85
Both adsorbents were tested at similar flowrates and initial fluoride concentrations in the
solution. These adsorbents yielded similar fractions, with AA performing slightly better than the
BC. Both columns were able to reduce solutions to less than 2ppm. The adsorbents yielded
similar loading capacities, with average values of 1.84 mg/g and 1.87 mg/g for BC and AA,

University of Arkansas Task #4 27
respectively. These values are significantly skewed from literature values and our batch loading
capacities. As discussed in our batch results, competitive sulfate ions may inhibit the adsorption
of fluoride, and most literature studies were performed using solutions of only fluoride. The
bench scale results may vary from the batch test results because the solutions experienced
different contact times and adsorbent volumes in the column.
The bench scale results indicate that almost all the fluoride was adsorbed after passing
through the column even at faster flow rates of 25 mL/min. The amount of fluoride adsorbed can
be represented by fractional conversion of fluoride concentration in the solution. Figures 13 and
14 are the relationships between the fraction of fluoride adsorbed and residence time.
Figure 13: Fraction of Fluoride Adsorbed vs. Residence Time for BC
Figure 14: Fraction of Fluoride Adsorbed vs. Residence Time for AA
0
0.5
1
1.5
0 2 4 6 8 10 12 14
Wei
ght
Fra
ctio
n
Residence Time (min)
Fraction of Fluoride Adsorbed vs. Residence Time
for BC
0
0.2
0.4
0.6
0.8
1
1.2
0 2 4 6 8 10 12 14 16
Wei
ght
Fra
ctio
n
Residence Time (min)
Fraction of Fluoride Adsorbed vs. Residence Time for
AA
University of Arkansas Task #4 28
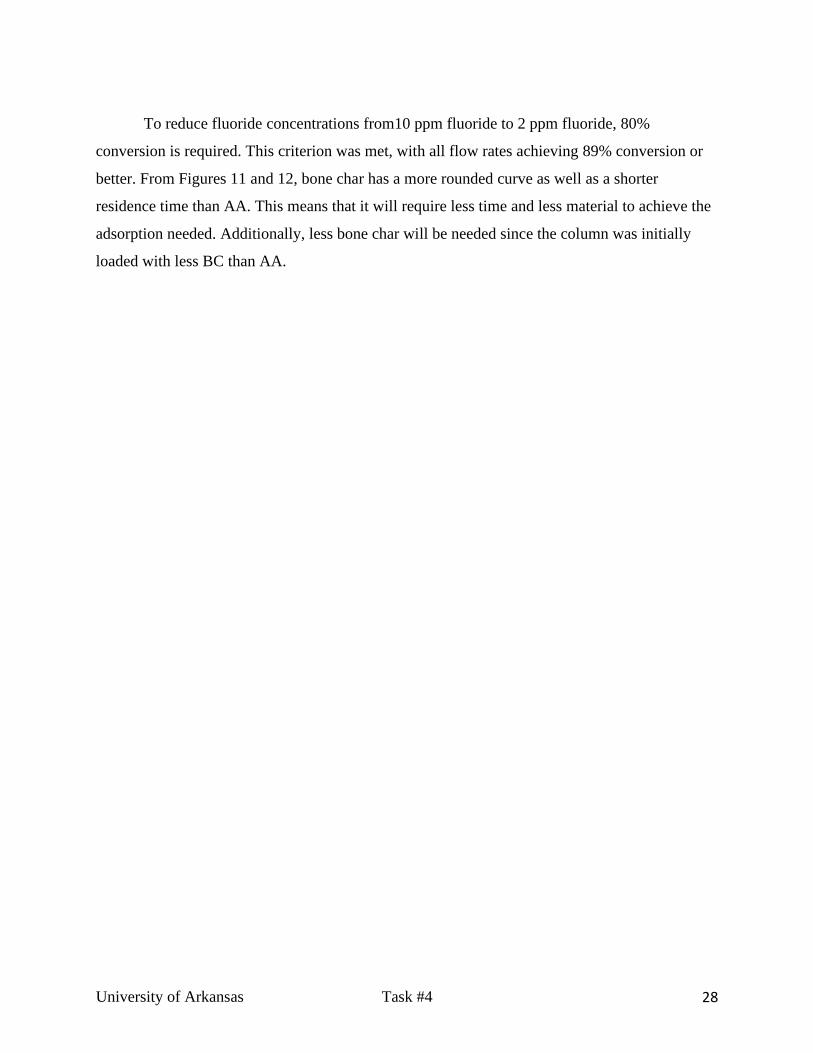
To reduce fluoride concentrations from10 ppm fluoride to 2 ppm fluoride, 80%
conversion is required. This criterion was met, with all flow rates achieving 89% conversion or
better. From Figures 11 and 12, bone char has a more rounded curve as well as a shorter
residence time than AA. This means that it will require less time and less material to achieve the
adsorption needed. Additionally, less bone char will be needed since the column was initially
loaded with less BC than AA.
University of Arkansas Task #4 29
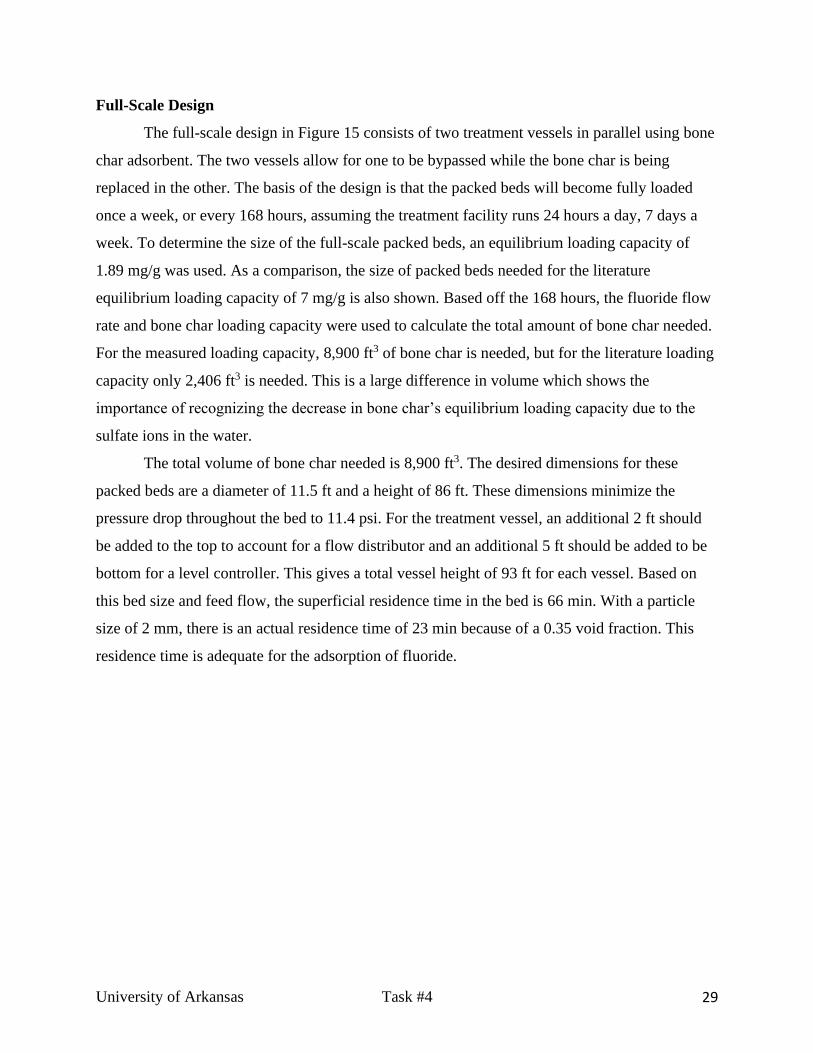
Full-Scale Design
The full-scale design in Figure 15 consists of two treatment vessels in parallel using bone
char adsorbent. The two vessels allow for one to be bypassed while the bone char is being
replaced in the other. The basis of the design is that the packed beds will become fully loaded
once a week, or every 168 hours, assuming the treatment facility runs 24 hours a day, 7 days a
week. To determine the size of the full-scale packed beds, an equilibrium loading capacity of
1.89 mg/g was used. As a comparison, the size of packed beds needed for the literature
equilibrium loading capacity of 7 mg/g is also shown. Based off the 168 hours, the fluoride flow
rate and bone char loading capacity were used to calculate the total amount of bone char needed.
For the measured loading capacity, 8,900 ft3 of bone char is needed, but for the literature loading
capacity only 2,406 ft3 is needed. This is a large difference in volume which shows the
importance of recognizing the decrease in bone char’s equilibrium loading capacity due to the
sulfate ions in the water.
The total volume of bone char needed is 8,900 ft3. The desired dimensions for these
packed beds are a diameter of 11.5 ft and a height of 86 ft. These dimensions minimize the
pressure drop throughout the bed to 11.4 psi. For the treatment vessel, an additional 2 ft should
be added to the top to account for a flow distributor and an additional 5 ft should be added to be
bottom for a level controller. This gives a total vessel height of 93 ft for each vessel. Based on
this bed size and feed flow, the superficial residence time in the bed is 66 min. With a particle
size of 2 mm, there is an actual residence time of 23 min because of a 0.35 void fraction. This
residence time is adequate for the adsorption of fluoride.

University of Arkansas Task #4 30
Figure 15: Process Schematic Diagram, Full Scale Industrial Design
Based on the literature equilibrium loading capacity values, the volume of bone char
would require one vessel with a packed bed volume of 2,406 ft3. The diameter of this packed bed
would be 9.8 ft with a height of 31.6 ft. These dimensions would result in a pressure drop of 6.1
psi. This is drastically different than the vessel size calculated from real equilibrium loading
capacity values, showing the importance of recognizing the competing ions in the water.
The beds are designed to treat an inlet concentration of 10 ppm fluoride. Figure 16 is the
block flow diagram of the full-scale design depicting the mass of bone char that is required
weekly and where the spent bone char will be moved. Once the water has run through the packed
bed, the concentration of fluoride will be 2 ppm or lower. This water can be discarded to nearby
creeks. The fluoride will eventually build up on the bone char and the bed will become fully
loaded. This will occur after approximately 7 days or 168 hours of running the 1000 gpm feed
water. At this time, the bone char will need to be replaced. The spent bone char can be land
applied after it is removed from the columns. In this location, the pH of the soil is approximately
5.5. This pH will keep the fluoride attached to the bone char according to the pH experiments
conducted with bone char, which was discussed earlier. The packed bed can then be filled with
new bone char.

University of Arkansas Task #4 31
Figure 16: Block Flow Diagram for Full Scale Industrial Design
University of Arkansas Task #4 32
Bone Char Byproduct Application
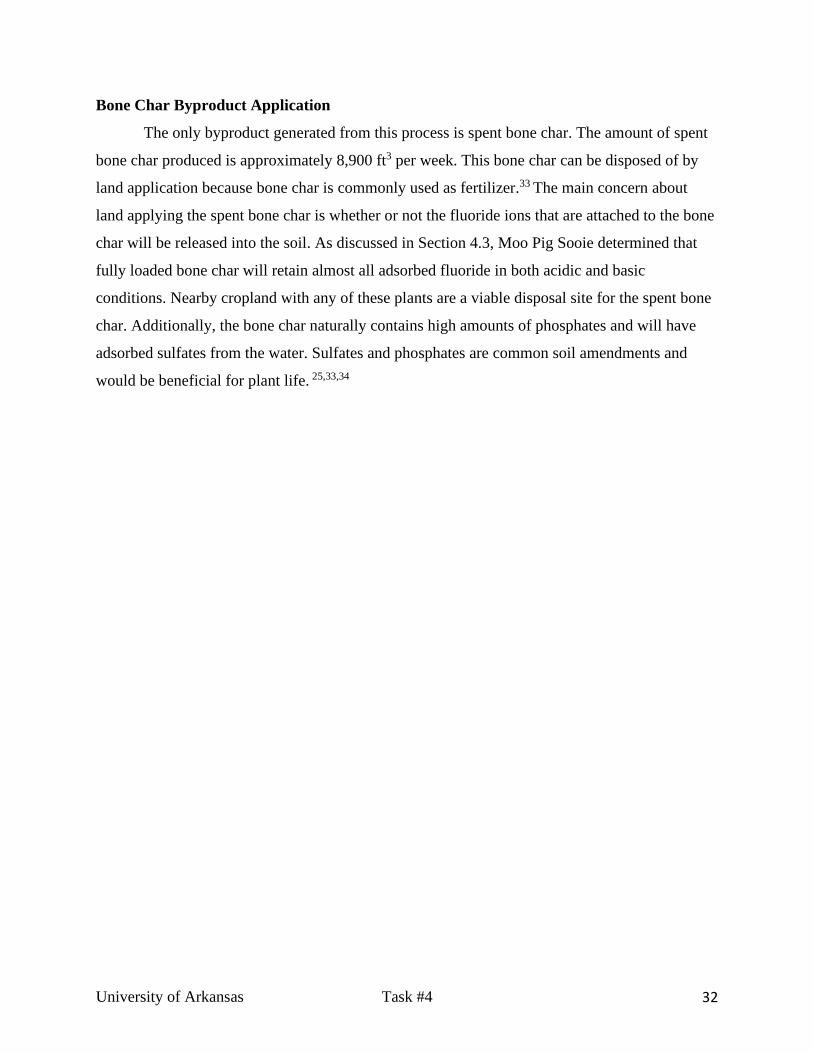
The only byproduct generated from this process is spent bone char. The amount of spent
bone char produced is approximately 8,900 ft3 per week. This bone char can be disposed of by
land application because bone char is commonly used as fertilizer.33 The main concern about
land applying the spent bone char is whether or not the fluoride ions that are attached to the bone
char will be released into the soil. As discussed in Section 4.3, Moo Pig Sooie determined that
fully loaded bone char will retain almost all adsorbed fluoride in both acidic and basic
conditions. Nearby cropland with any of these plants are a viable disposal site for the spent bone
char. Additionally, the bone char naturally contains high amounts of phosphates and will have
adsorbed sulfates from the water. Sulfates and phosphates are common soil amendments and
would be beneficial for plant life. 25,33,34

University of Arkansas Task #4 33
Business Plan
The economic analysis for the full-scale bone char facility was done on a basis of adding
this facility to already available land on the mine site as well as on the basis that it will not be
operated for the entire year. The Henderson mine generates more water than the mine can handle
eight months out of the year because of rainfall and snow melting. Figures B.2-4 show the
average temperatures, rainfall, and snowfall in the area. This facility will be a 10-year project
with a 2-year construction period. In order to generate revenue, the spent bone char after the
adsorption process will be sold as a soil amendment to potato farms near the mine. Potato farms
were chosen since potato plants have been known to handle higher concentrations of fluoride if
needed. This analysis was done based on this facility operating only 8 months out of the year, as
the winter months may cause the water to freeze. Currently, reverse osmosis is a very popular
choice when it comes to water treatment, so our bone char facility was compared to a reverse
osmosis facility as seen in Table 9.
Table 9: Bone Char vs. Reverse Osmosis Full Scale Facility Cost Breakdown
Bone Char Facility Reverse Osmosis Facility
Item Cost
2 Columns $133,512
Pump $22,600
Direct Costs $530,778
Indirect Costs $220,116
Total Capital
Cost
$750,894
Adsorbent Cost $3,110,000
Utility Cost $13,600
Operating Labor Cost
$802,920
Transportation
Cost $865,920
Yearly
Operating Cost
$4,792,440
Revenue $2,592,000
10-Year NPV ($10,944,505)
Cost per 1000 gal $4.20
Item Cost
Capital Cost $144,700,000
Yearly
Operating Cost
$8,145,000
10-Year NPV ($38,180,000)
Cost per 1000 gal $15.50
University of Arkansas Task #4 34
The capital cost for the bone char facility was done by first determining the purchased
cost of the equipment. A polyethylene column with a diameter like our design was found online
and used as a basis for sizing it up to our desired capacity. This polyethylene column cost
$25,000 with a capacity of 13,000 gallons, and the six tenths rule was used for sizing.36 The final
cost is seen in Table 9 above. The total equipment purchased cost was then used to calculate the
direct and indirect costs for the facility. Then the direct and indirect costs were added up to get
the capital cost. The economics for the full-scale reverse osmosis facility was done by a report
for the city of San Diego, which as show in Table 9, is a very expensive facility to construct.37
The capital cost for the reverse osmosis is almost three orders of magnitude larger than the
capital cost for the bone char facility, so it is more economical to construct a bone char facility.
The adsorbent cost for the bone char was determined by taking the market price of
$600/metric ton and multiplying it by the number of metric tons required for 8 months of
operation per year.38 The revenue generated from selling bone char as a soil amendment after
adsorption was found by first finding the market price of bone char for soil amendment use
which turned out to be $750/metric ton.39 This price was decreased to $500/metric ton due to the
bone char already being used and containing fluorine, and to make it a more attractive option.
The transportation costs were determined by first calculating the amount of ocean containers
required for international shipping from China to Los Angeles since the bone char is being
purchased from China. Then the number of truckloads required to move the bone char from Los
Angeles to Henderson, Colorado was calculated and added to the yearly transportation costs seen
in Table 9. The net present value was calculated by doing a discounted cash flow analysis using a
discount rate of 10% over a period of 10 years. As seen in Table 9, the NPV for the bone char
facility is much lower than the reverse osmosis facility. Overall, Table 9 shows that the yearly
operating cost for the reverse osmosis facility is almost twice as much as the yearly operating
cost for the bone char facility. By taking the yearly operating cost and capital cost, the bone char
facility is much cheaper and easier to construct and maintain than the reverse osmosis facility.

University of Arkansas Task #4 35
Health, Safety, and Environmental Regulations
One of the main concerns when working with fluoride is its ability to create hydrofluoric
acid with water. The concentrations and temperatures used for the experiments were low enough
that this did not pose a large threat, but all team members need to keep this in mind in case of
spills. Proper PPE and housekeeping practices should always be followed. Any chemical
containing fluorine, in our case sodium fluoride, should be stored and labeled properly. For
bench scale experiments, the same precautions should be used as well as the additional concern
of ensuring the discharge from the column feeds into the proper waste container. Because
fluoride-concentrated water is regulated, a hazardous waste container large enough to
accommodate multiple experiments must be kept in the lab. For the full-scale design, a
hazardous waste container would only be needed in abnormal situations where the system was
unable to discharge into the creek. Typical safety precautions such as PPE and housekeeping still
need to be followed.
While the discharge for the Henderson mine flows into a creek that is not directly a
source of drinking water, it is still necessary to consider health and environmental risks
associated with waterways as they may lead to a drinking water source. Right now, the EPA has
set an enforceable drinking water standard of 4 ppm, with a secondary, non-enforceable standard
of 2 ppm. Reducing the fluoride concentration of the discharge from 10 ppm to 2 ppm will
ensure the waterways are well within the enforceable drinking water standards.
Throughout the U.S., some locations add fluoride to their water supplies through a
process called fluoridation. This act is not mandatory by the EPA and has been hit with some
backlash as new risk assessments for fluoride evolve. Supporters of fluoridation, including the
American Dental Association, argue that fluoride in water is beneficial for communities because
it prevents tooth decay, protects against cavities, and saves money in dental care costs.40
Opposing arguments claim that there is little to no regulation in personal intake when fluoride is
added to water sources and cannot be safely monitored. Currently, Colorado does not mandate
fluoridation of municipal water.41 Moo Pig Sooie’s method to adsorb fluoride using bone char
will ensure that the surrounding community is not exposed to a quality of water that could
potentially be harmful to them, even though this monitoring is not required by the government.

University of Arkansas Task #4 36
Community Relations Plan and Public Acceptance
Having the community involved in the decisions regarding spent bone char land
application is important for the success of the proposed system. Without the community’s
approval, the foreseen benefits would not outweigh the costs for the Henderson mine. The
amount of fluoride in water, whether naturally occurring or added artificially, has been a
controversial topic for many years.
Moo Pig Sooie’s plan is to sample the affected communities to gather their thoughts on
the addition of fluoride to the soil of their crops. During experimentation, it was found that
fluoride was released from bone char most slowly in acidic conditions. Therefore, applying the
spent bone char to potatoes or other crops that prefer acidic soil nearby the Henderson mine
would be the optimal location to minimize the concern of the surrounding community. A public
involvement plan is needed for the process to have the approval and enthusiasm from the
community. This plan includes: first, keeping the public up to date on the information regarding
the adsorption process so that they can be active participants; next, involving the community in
decision making and actions to be taken, from the initial start-up to any amendments that may
come up in the future; and lastly, making sure there is accountability on both sides to uphold the
agreements put in place. This partnership between the Henderson Mine and the San Luis Valley
community will ensure that all parties are satisfied with the conditions of their soil and will foster
a mutually beneficial relationship that is dedicated to the progression of both the Henderson
Mine’s environmental regulations and the community’s welfare.

University of Arkansas Task #4 37
Conclusion and Recommendations
After a careful analysis of water treatment methods, adsorption media, and literature
reviews, Moo Pig Sooie decided the use of BC for the adsorption of fluoride was the most
feasible secondary water treatment method.
The adsorption properties were vastly affected by the presence of sulfate in the water,
lowering the adsorption capacity of the chosen media. Along with the sulfates in the water, other
minerals and metals in the water affected the loading of fluoride onto the adsorbent. The size of
the full-scale system designed must accommodate enough adsorbent that can remove the
necessary amount of fluoride in the presence of competitive ions.
The land application of spent bone char is cost effective and environmentally safe. Since
the adsorbent loads sulfate as well as fluoride, the sulfate that will leech from the material can act
as a soil amendment. Fluoride will be stripped from the bone char in minimal and harmless
amounts. This knowledge, as well as the plans to keep ongoing public updates on the fluoride
content of the soil, will assist public acceptance of the process. Moo Pig Sooie believes this
water treatment proposal will make a good candidate for the removal of fluoride in the
discharged mine water and will allow mines to have a sustainable and environmentally friendly
byproduct.

University of Arkansas Task #4 38
Acknowledgments
The Moo Pig Sooie team would like to thank the University of Arkansas Faculty and
Staff: Dr. Michael Ackerson, Dr. Roy W. Penney, Mr. James Barron, Dr. Tammy Lutz-Rechtin,
Dr. Lauren Greenlee, Mr. Dearl Peachee, Mr. Harold Watson, Dr. Cameron Murray, Dr. Robert
Cross, Mr. Brett Waterman, and Dr. Bradley Austin of the Don Tyson Water Quality Lab.
University of Arkansas Task #4 39
References
1. Peckham, S., & Awofeso, N. (2014). Water Fluoridation: A Critical Review of the
Physiological Effects of Ingested Fluoride as a Public Health Intervention. Scientific
World Journal.
2. United States Environmental Protection Agency. (2020). Drinking Water Regulations
and Contaminants.
3. American Cancer Society. (2020). Water Fluoridation and Cancer Risk.
4. Brett Waterman, personal communication, 24 January 2020.
5. Centers for Disease and Control Prevention. (2020). My Water's Fluoride.
6. United States Census Bureau. (2020). American Fact Finder.
7. SGS Minerals Services. (2013). High Density Sludge (HDS) Process.
8. Fluoride Removal from Wastewater. (n.d.). Retrieved March 8, 2020, from
http://www.phadjustment.com/Fluoride/Fluoride-Removal-from-Industrial-
Wastewater.html
9. Team, F. N. (2017, November 2). What Is Ion Exchange?: Fluence. Retrieved March 8,
2020, from https://www.fluencecorp.com/what-is-ion-exchange/
10. Waghmare, S. S., & Arfin, T. (2015). Fluoride Removal from Water by various
techniques: Review. International Journal of Innovative Science, Engineering &
Technology, 2(9), 560–571. Retrieved from
http://ijiset.com/vol2/v2s9/IJISET_V2_I9_67.pdf
11. Shubert, A. (2015, October 1). Overview of the El Paso Kay Bailey Hutchison
Desalination.
12. Tiffenbach, A., Stariha, V. B., Dahm, K., & Guerra, K. (2014, July). Estimating the Cost
of Brackish Groundwater Desalination in Texas.
13. Texas Water Development Board. (2017, February 14). Kay Bailey Hutchison
Desalination Plant Report.
14. City of El Paso. (2018). El Paso Water Rates and Fees.
15. Goosen, Mattheus & Sablani, Shyam & Jackson, D.. (2005). Fouling of Reverse Osmosis
and Ultrafiltration Membranes: A Critical Review. Separation Science and Technology -
SEPAR SCI TECHNOL. 39. 2261-2297. 10.1081/SS-120039343.
University of Arkansas Task #4 40
16. European Food Safety Authority. (2006, September 27). Opinion of the Scientific Panel
on food additives, flavourings, processing aids and materials in contact with food (AFC)
related to the safety in use of the activated alumina treatment for the removal of fluoride
from natural mineral waters. EFSA Journal, 1-8.
17. Carlson, C., & Ebben, A. (2020). Activated Alumina Overview.
18. Waghmare, S., & Arfin, T. (2015). Fluoride Removal from Water by various techniques:
Review. IJISET.
19. The Home Depot. (2020). Under Sink Water Filters.
20. De Nora. (2015). SORB 09 Fluoride Removal System. De Nora Water Technologies.
Retrieved from DeNora.com.
21. Environmental Protection Agency. (2014). Design Manual: Removal of Fluoride from
Drinking Water Supplies by Activated Alumina. Environmental Protection Agency.
22. Romelle, Feumba D., et al. “Chemical Composition of Some Selected Fruit Peels.” EA
Journals, European Centre for Research Traning and Development UK, Sept. 2016.
23. Goswami, R., & Kumar, M. (2018). Removal of fluoride from aqueous solution using
nanoscale rice husk biochar. Groundwater for Sustainable Development, 7, 446–451. 24
24. Alkurdi, S., Al-Juboori, R., Bundschuh, J., & Hamawand, I. (2019). Bone Char as a green
sorbent for removing health threatening fluoride from drinking water. Environmental
International, 704-719.
25. Zimmer, D., Panten, K., Frank, M., Springer, A., & Leinweber, P. (2019). Sulfur-
Enriched Bone Char as Alternative P Fertilizer: Spectroscopic, Wet Chemical, and Yield
Response Evaluation. Agriculture.
26. . Gautam, Ravindra and Mahesh Chattopadhaya. "Kinetics and Equilibrium Isotherm
Modeling: Graphene-Based Nanomaterials for the Removal of Heavy Metals From
Water." Nanomaterials for Wastewater Remediation. Elsevier, 2016. 79-109.
28. Bhatnagar, A., Kumar, E., & Sillanpää, M. (2011). Fluoride removal from water by
adsorption—A review. Chemical Engineering Journal, 171(3), 811-840.
29. Jha, R., Jha, U., Dey, R., Mishra, S., & Swain, S. (2013). Fluoride sorption by zirconium
(IV) loaded carboxylated orange peel. Desalination and Water Treatment, 53(8), 2144-
2157.
30. Gebrewold, B. D., Kijjanapanich, P., Rene, E. R., Lens, P. N., & Annachhatre, A. P.
(2018). Fluoride removal from groundwater using chemically modified rice husk and
corn cob activated carbon. Environmental Technology, 40(22), 2913-2927.
University of Arkansas Task #4 41
31. Tomar, V., & Kumar, D. (2013). A critical study on efficiency of different materials for
fluoride removal from aqueous media. Chemistry Central Journal.
32. Pscheidt, J. (2020). Fluorine Toxicity in Plants. 32
33. USDA Natural Resources Conservation Services. (1998). Soil Quality
Indicators: pH. 33
34. Dimengo, M. (2018, October). Bone Char Benefits. 34
35. Albert, S. (2013). Vegetable Crop Soil pH Tolerances.
36. Plastic-Mart. (2020). Polyethylene Tank Price. https://www.plastic-
mart.com/category/19/cone-bottom-tanks
37. City of San Diego. (2012). Reverse Osmosis Full-Scale Facility Cost Analysis.
https://www.sandiego.gov/sites/default/files/legacy/water/purewater/pdf/projectreports/se
ction5costs.pdf
38. Alibaba. (2020). Bone Char Market Price.
https://www.alibaba.com/product-detail/Bone-
Char_133373450.html?spm=a2700.7724857.normalList.43.30ac120aSugEJi
39. Compostwerks. (2020). Bone Char Fertilizer Price.
https://www.compostwerks.com/organics/natural-fertilizers/product/48-bone-char-50-
pound-bag-omri-listed
40. Fluoride Action Network. (n.d.) State Fluoride Database. Fluoridealert.org.
41. Treatment of Aqueous Effluents. (n.d.). Retrieved March 8, 2020, from
http://www.tetrachemicalseurope.com/getFile.asp?File_Content_ID=1028

University of Arkansas Task #4 42
Appendix
Figure A.1: High Temperature Graph for Empire, CO
Figure A.2: Average Rainfall in Empire, CO
Figure A.3: Average Snowfall in Empire, CO