removal of cadmium from wastewater by water hyacinth
TRANSCRIPT

This article was downloaded by: [University of Leicester]On: 13 June 2013, At: 15:15Publisher: RoutledgeInforma Ltd Registered in England and Wales Registered Number: 1072954Registered office: Mortimer House, 37-41 Mortimer Street, London W1T 3JH, UK
International Journal ofEnvironmental StudiesPublication details, including instructions for authors andsubscription information:http://www.tandfonline.com/loi/genv20
Removal of cadmium fromwastewater by water hyacinthSadhna Rai a , M. S. Narayanswami a , S. H. Hasan b , D. C.Rupainwr b & Yogesh C. Sharma ca Department of Civil Engineering, Institute of Technology,Banaras Hindu University, Varanasi, 221 005, Indiab Department of Applied Chemistry, Institute of Technology,Banaras Hindu University, Varanasi, 221 005, Indiac Pollution Control Labs, Dept. of Materials Science, Hatia,National Institute of Foundry and Forge Tech., Ranchi, 834003, IndiaPublished online: 24 Feb 2007.
To cite this article: Sadhna Rai , M. S. Narayanswami , S. H. Hasan , D. C. Rupainwr & YogeshC. Sharma (1994): Removal of cadmium from wastewater by water hyacinth, InternationalJournal of Environmental Studies, 46:4, 251-262
To link to this article: http://dx.doi.org/10.1080/00207239408710930
PLEASE SCROLL DOWN FOR ARTICLE
Full terms and conditions of use: http://www.tandfonline.com/page/terms-and-conditions
This article may be used for research, teaching, and private study purposes. Anysubstantial or systematic reproduction, redistribution, reselling, loan, sub-licensing,systematic supply, or distribution in any form to anyone is expressly forbidden.
The publisher does not give any warranty express or implied or make anyrepresentation that the contents will be complete or accurate or up to date. Theaccuracy of any instructions, formulae, and drug doses should be independentlyverified with primary sources. The publisher shall not be liable for any loss, actions,claims, proceedings, demand, or costs or damages whatsoever or howsoevercaused arising directly or indirectly in connection with or arising out of the use ofthis material.

© 1994 Gordon and Breach Science Publishers S.A.Printed in Malaysia
REMOVAL OF CADMIUM FROM WASTEWATER BYWATER HYACINTH
SADHNA RAI,* M. S. NARAYANSWAMI,* S. H. HASAN,** D. C. RUPAINWAR**and YOGESH C. SHARMA***
*Department of Civil Engineering, Institute of Technology, Banaras Hindu University,Varanasi -- 221 005, India; **Department of Applied Chemistry, Institute of Technology,
Banaras Hindu University, Varanasi -- 221 005, India; ***Pollution Control Labs,National Institute of Foundry and Forge Tech., Dept. of Materials Science, Hatia:
Ranchi -- 834 003, India
(Received 26 March, 1994)
Removal of cadmium from wastewaters by water hyacinth has been investigated. The growth of the plant wasinhibited at cadmium concentration 2.0 mgL-1. Cadmium was found to accumulate in the top as well as in the rootsof the plant. The uptake increased with increasing initial concentration of cadmium. The uptake was enhanced withtime of exposure and between the 6th and 16th days. The enhancement was more significant. Kinetics andmechanism of uptake were also studied. The value of the metal accumulation factor 'Fa ' was found to be greater inthe roots of the plant. The overall removal capacity of the process was calculated and found to be significant.
1. INTRODUCTION
Heavy metals and their compounds are, in one form or other, necessary for industrialdevelopment of society. A number of compounds of cadmium, like other heavy metalsform essential part of the human diet.1 It is a fact that from the beginning of the 19thcentury, cadmium contamination increased about five times due to its increased use in theIndustrial Revolution.2 The harmful effects including the carcinogenic nature of cadmiumhave been well documented.3 Ingestion of cadmium into the human body results in a wellknown painful disease, itai-itai.3 The European Community has fixed the threshold limitvalue (TLV) of cadmium for human beings as 0.1 mg/L.4 The main source of cadmium inwastewater is the waste from electroplating, protective coatings, battery and plasticmanufacturing industries.5 Some other relevant uses of cadmium are in the alloys,solders, specific fungicides etc.6
Precipitation,7 ion exchange,8 adsorption,9 solvent extraction10 etc. are the conventionalmethodology for the treatment of aqueous solutions, wastewater and effluents rich incadmium. In precipitation, large amounts of sludge are produced. Moreover, it requiresproper dosing and regular monitoring. Ion-exchange lacks in selectivity and solventextraction is costly. During the past few years aqua-vascular plants such as waterhyacinth has been used for the treatment of toxic metals from wastewaters."-12 Thepresent communication is devoted to the use of water hyacinth for the uptake of Cd(II)from aqueous solutions. Plant growth, relative growth rate, accumulation of Cd(II) in theplant, uptake of metals with time of exposure are discussed. Kinetics and mechanism ofthe uptake of Cd(II) by plant are also highlighted. An approach to metal accumulation offactors is presented.
***Corresponding Author
251
Intern. J. Environmental Studies, 1994, Vol. 46, pp. 251-262Reprints available directly from the PublisherPhotocopying permitted by license only
Dow
nloa
ded
by [
Uni
vers
ity o
f L
eice
ster
] at
15:
15 1
3 Ju
ne 2
013

252 S. RAIETAL.
2. EXPERIMENTAL
2.1. Materials and Methods
Mature plants were collected from a swamp and kept in a plastic tank for seven days priorto the experiments which were carried out. Plants were maintained in solutions of halfstrength Hoagland's solution (pH:7). The composition of the Hoagland solution is givenin Table I. Stock solution of cadmium was prepared by dissolving cadmium nitrate indistilled water. All the chemicals used were of A.R. grade.
Experiments were set up in a container by putting in individual plants and filling withtap water. Then Hoagland's solution was added to each container. Thereafter fiveweighed plants were exposed to cadmium at nominal concentrations of 1.0, 2.0, 2.5, 4.0and 6.0 ppm. There were three replicates for the analysis of metal on the 1st, 2nd, 4th,6th, 8th, 12th and 16th days after the beginning of the experiments. One control groupwas also prepared. Table II represents the characteristics of the tap water.
2.2. Analysis
The plants were divided into two parts. First, the tops including petioles, rhizomes,stolons and leaves and the second part, roots. Each part was dried for 72 h at 65°C andweighed. Original dry weights were estimated by extrapolation from original freshweights and the dry weight: fresh weight ratios. Growth variables measured included dryweights, biomass i.e. total dry weight of all plant tissues, total growth which is biomass-initial dry weight and relative growth rate, the 'gm dry weight increase/gm initial dryweight' per day. Dried plant tissues were ground with a ball mill. Tissue samplerweighing approximately 0.5 g were ashed in a muffle furnace for 5 h at 450°C. Ashedsamples were digested with 2 mL of HNO3-HCIO4 (2:1 V/V) and diluted to 100 mL with
TABLE IComposition of Hoagland solution
Solution 1(Concentration ofthe solutions 1 M)
KH2PO4KNO3Ca(NO3)2
MgSO4
Solution 2NH4H2PO4KNO3Ca(NO3)3
MgSO4
Solution AH3BO3MnCl2UH2OZnSO4.7H2OCuSO4.5H2OH2MoO4.H2O
Solution BIron tartrate
g/Litre
136101.1164.1120.3
132.07101.1164.1120.3
1.861.810.220.080.02
5.0
Ml/L of the solution
1552
1642
ppm0.50.50.050.020.01
1 ML in 1 Litre of solution
1 mL of Solution A was added either to solution 1 or 2 and the volume was made up to 1 L.Thereafter, solution B was added. pH was adjusted to 6.0 with 0.1 M H2SO4.
Dow
nloa
ded
by [
Uni
vers
ity o
f L
eice
ster
] at
15:
15 1
3 Ju
ne 2
013

CADMIUM REMOVAL BY WATER HYACINTH 253
TABLE IIThe average tap water characteristics from tube-well source in B.H.U.
Turbidity — 5 ppmColour — ColourlessTotal Dissolve Solids — 324.0 ppmTotal hardness — 280.0 ppm as CaCO3
Chlorides — 7.0 ppmCalcium — 88 ppmIron — 1.0 ppmMg — 1.15 ppmMn — Not detectedpH — 8.2Cadmium — —Zinc — 0.05 ppm
distilled water. Water samples and digested plant samples were analysed for cadmium byA AS.13 Metal concentrations in water and plant samples and the total accumulation andpartitioning of the metals by the plants were calculated.
3. RESULTS AND DISCUSSION
3.1. Plants Growth and Relative Growth Rate (RGR)
The growth of water hyacinth to different concentrations of cadmium is shown in TableIII. It is noted that the fresh weight of the plants slightly decreased with increasing metalconcentration, except for the first and the second day after treatment by the exposure ofthe plants to the 1.0 and 2.0 mgLr1 of cadmium. At higher concentrations of Cd thegrowth of the plant is inhibited.
The effect of cadmium on the growth rate of the water hyacinth is given in Table IV. Itis clear from this table that RGR decreases with increasing cadmium concentration and atexposure of 4.0 mgLr1 of cadmium, the growth is negative. The negative value of RGR isindicative of zero growth for practical purposes. It was considered that a decrease in thegrowth was induced by metal toxicity. Figure 1 shows the effect of Cd concentration onRGR of the water hyacinth. It is clear from this figure that the curve intercepts theconcentration axis at 3.3 mgL"1 indicating that the growth stops at this concentration dueto metal toxicity.
TABLE IIIRelative change in the growth of plants on a fresh weight basis compared with initial fresh weight (1.00)
Treatment
(mg/L)
1.02.02.54.06.0Control
1
1.000.941.261.291.37
2
1.000.921.281.081.281.15
4
1.051.001.211.031.05
Days after treatment
6
1.110.991.281.000.96
8
1.101.011.200.900.951.34
12
1.211.111.190.880.94
16
1.211.001.150.940.881.68
Dow
nloa
ded
by [
Uni
vers
ity o
f L
eice
ster
] at
15:
15 1
3 Ju
ne 2
013

254
Initialconcentration(mg/L)
1.02.02.54.06.0Control
S.RA1 ETAL.
TABLE IVEffect on the growth of water hyacinth following the exposure to cadmium
Initialdry weight
(g)
1.231.201.111.341.151.12
Dry weightafter 16 days
(g)
1.491.301.191.180.902.00
Growth
0.260.180.08
-0.16*-0.26*
0.88
Growthrate
(x 10"2)
1.631.130.58
-1.0 '-1.63*
5.5
Relativegrowth rate
(x 10"2)
1.330.940.45
-0.74-1.33
4.9
* Negative growth rate values are due to inhibition at stated concentration of cadmium.
3.2. Accumulation of Cadmium in Plant Tissues
The accumulation of metal in plant material is expressed as 'microgram of metal per gram'in the dry matter. The data for accumulation of cadmium are presented in Table V, bothfor the top and the roots of plants exposed to metal containing water. It is clear that thecadmium concentration in both the tops and the roots increased with increase in cadmiumconcentration and also with the passage of time, except for the 4.0 and 6.0 mgLr1 cadmiumgroup. Thus, in the 4.0 and 6.0 mgL"1 cadmium group after 6 days there is a suddenincrease in the uptake. The concentration in the control group was found to be 7.0 ± 0.5and 1.6 ± 0.5 ug g"1 in the roots and the tops, respectively.
3.3. Uptake of Metals and Exposure Levels
In the whole plant the uptake of cadmium increased linearly with increase in the initialsolution concentration (Fig. 2). The calculated regression coefficients between cadmiumuptake and its exposure levels are found to be 0.68, 0.83, 0.82 and 0.98 on the 1st, 4th,8th and 16th days of treatment, respectively. The variation of uptake with metal dosesexhibits linearity at the highest level of cumulative exposure (16th day). However, thelinearity trend could not be established with confidence at lower levels of cumulative
2.0
1.0
-1.0
1.0 2.0 3.0 ""vjl.0 5.0s
Exposure of Cadmium Mety (ppm)
6 . 0
- 2 . 0 "-
FIGURE 1 Relative growth rate (RGR) for water hyacinth after 16 days exposure to cadmium.
Dow
nloa
ded
by [
Uni
vers
ity o
f L
eice
ster
] at
15:
15 1
3 Ju
ne 2
013

CADMIUM REMOVAL BY WATER HYACINTH 255
TABLEVConcentration of cadmium (fig/g dry weight) in water hyacinth treated with cadmium
Treatment Part Days of treatment01 ineiai
(ppm)
1.0
2.0
2.5
4.0
6.0
Control
TopRootTopRootTopRootTopRootTopRootTopRoot
1
34.191.083.1
261.0207.6
1369.0408.0
1281.0590.0
1520.0
2
48.1196.0115.6389.0223.6
1406.0538.6
1379.0615.0
1720.0
4
65.6381.0226.6437.0336.0
1506.0640.0
1430.0675.0
1885.0
6
103.6401.0344.6581.0444.6
1569.0700.0
1590.0790.0
1900.0
8
148.6491.0391.6706.0500.0
1612.0940.0
2000.0900.0
2117.0
12
207.6593.0081.0528.0528.0
1700.01100.002500.01120.03280.0
16
279.0662.0911.0569.0569.0
1890.01220.02700.01190.03900.0
1.6 + 0.57.0 ±0.5
6.1 -
5.1 _
4.1 -
3.1 -
2 .1 -
1.1
0.1
1
4
8
16
day
days
days
days
O
AXD
1 2 3 4 5 6 7
E x p o s u r e L e v e l o f M e t a l , tng/L
FIGURE 2 Concentration of Cd2+ in water hyacinth after 1,4, 8 and 16 days.
exposure (1st, 4th and 8th days). Thus, the uptake process apparently follows amonophasic isotherm with linear increase of metal concentration. These findings aresupported by previous workers.14
Dow
nloa
ded
by [
Uni
vers
ity o
f L
eice
ster
] at
15:
15 1
3 Ju
ne 2
013

256 S. RAI ETAL.
3.4. Relation Between Uptake of Metals with Time of Exposure
The pattern of cadmium uptake with respect to time of exposure at higher concentrationsshows that the uptake is in two stages. The first stage uptake rate extends up to 6 days,followed by a second stage with the enhanced uptake between 6 and 16 days (Fig. 3). Theoverall cadmium uptake rate seems to be dependent on the exposure level of cadmium inthe solution. The biphasic nature is clearly evident at each stage of exposure while at thetwo lower concentrations, 1.0 and 2.0 mgL~\ only a single stage of biphasic nature can beidentified.
3.5. Kinetics of the Metal Uptake
A logarithmic relationship between the metal uptake and days of treatment wasestablished in order to obtain a better correlation of metal uptake as a function ofexposure duration (Fig.4).
The functional relationship obtained is,
6 mgL"1 Cd: Stage I : log u = 3.306 + 0.135 log t
Stage II : log u = 2.879 + 0.692 log t
The above relationship between metal uptake and time can be transformed into thefollowing form:
U, = (Ui)?j (1)
5 -
1.0
2.0
2.5
4.0
6.0
mg/L
mg/L
mg/L
mg/L
mg/L
O
•
X•
Temperature = 30°C
6 8 10
t i m e ( d a y s )
12 14 16
FIGURE 3 Cd2+ uptake in water hyacinth as a function of time.
Dow
nloa
ded
by [
Uni
vers
ity o
f L
eice
ster
] at
15:
15 1
3 Ju
ne 2
013

CADMIUM REMOVAL BY WATER HYACINTH 257
3 . 7 6
3 . 7 2
3 . 6 8
3 . 6 4 -
3 . 6 0 -
3 . 5 6 -
-oo
o 3 . 5 2
enO
3 . 4 8 ~
3 . 4 4 -
3 . 4 0 -
3 . 3 6 -
3 . 3 2 ' I 1 I I
0 . 0 0 . 2 0 . 4 0 . 6 0 . 8 1 . 0 1 . 2
log t
FIGURE 4 Effect of varying time on the uptake of cadmium in water hyacinth. Cd2+ is 6 mg/L.
Dow
nloa
ded
by [
Uni
vers
ity o
f L
eice
ster
] at
15:
15 1
3 Ju
ne 2
013

258 S. RAIETAL.
where ut = uptake at any time, t
Ui = uptake on the first day of the stage under consideration
nj = parameter for the power relationship for the appropriate stage.
The values of 'i ' and ' j ' are as follows:
For single stage only : i = 1, j = 1
For double stage : I stage - i = 1, j = 1II stage - i = 2, j = 2
The values for u, and nj are given in Table VI for the respective cadmiumconcentrations.
TABLE VIParameters for exponent of time in the uptake for cadmium
n2
Cadmium concentration(mgL-1)
6.0 "1
u2n2
2116.80.135
2614.00.692
3.6. Mechanism of Removal
No histological studies have been carried out by the authors but, based on the literaturereview and on the basis of data, a general explanation is attempted towards themechanism of uptake. The cellular uptake of cadmium in two stages is believed to havebeen operative because of some internal changes in the mechanism of metabolismoccuring within the cells of the plants.
3.7. Metal Accumulation Factors
This particular parameter resulting from exposures for 16 days to metal-containing waterare shown in Table VII. The values are presented as the dry matter of the plants. Thevalues of the accumulation factor Fa in roots of the plants tended to be higher than that inthe tops. Fa was calculated as
_ ug/g dry plant tissues . .
Hg/g water
Fa for cadmium ranged as follows: 1.98 X 10² to 3.05 x 10² in the tops and 4.55 x 10² to7.56 x 102 in the roots.
Perusal of the data given in Table VII suggests that the accumulation of metal in theplant root is dependent on the metal concentration to which it has been exposed. Thereason responsible for the higher value of Fa in the plant root may be that metals find a
Dow
nloa
ded
by [
Uni
vers
ity o
f L
eice
ster
] at
15:
15 1
3 Ju
ne 2
013

CADMIUM REMOVAL BY WATER HYACINTH 259
N _ n TABLE VIIDependence of for cadmium per individual water hyacinth of the metal concentration
n and days of treatment
Days Exposure to cadmium (ppm)
1.0 2.0 2.5 4.0 6.0
1246812
6.522.851.110.860.470.17
3.361.981.260.620.370.08
0.560.500.330.220.160.10
1.321.040.890.710.330.08
1.411.160.980.890.680.15
higher adsorption on the surface of the root. The percentage of metal removal from thesolutions as measured on the 16th day decreases with increasing concentrations of Cd.The percentage removal is, however, higher than 75% for the concentration range 1 and6 mg L"1 of cadmium.
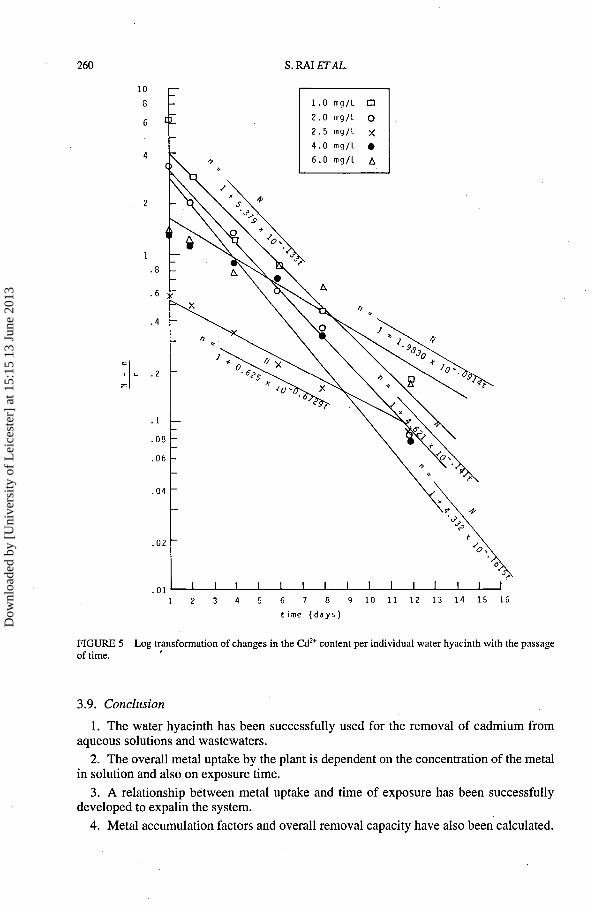
3.8. Overall Removal Capacity
The overall capacity of removal of heavy metals by water hyacinth has been studied byMuramoto and Oki15 using the following rate equation:
where, the index n refers to the metal content in one plant, N, the maximum value of n, tis exposure time in days and A is a coefficient of overall accumulation rate. Theintegrated form of the above equation is
(4)
or
N —nm = lnk-A,,. (5)
n
The value of N was determined from the experimental observations on the 16th day ofN —n
plant treatment with the metals and the values of ratio are given in Table VII. An
N —nplot of vs t (Fig. 5) provides the estimation of the accumulation rate coefficient A
nand the constant K as shown in Fig. 5. The calculated values for the maximum overallremoval capacity of cadmium for various exposure level and kinetic constants have beengiven in Table VIII. Finally, logistic curves obtained from equation 5 with constantsshown in Table V are presented in Fig. 6 along with the observed data. The mathematicalmodel suggested by Muramoto and Oki15 has been found adequate for the present dataand the overall uptake rate can be expressed in terms of logistic curves for waterhyacinth.
Dow
nloa
ded
by [
Uni
vers
ity o
f L
eice
ster
] at
15:
15 1
3 Ju
ne 2
013
260 S. RAIETAL.
10 i—1.0
2.0
2.5
4.0
6.0
mg/L
mg/L
mg/L
mg/L
mg/L
a
o
•A
I I I I I I I I I I I I I I I9 10 11 12 13 14 15 16
.01
FIGURE 5 Log transformation of changes in the Cd2+ content per individual water hyacinth with the passageof time.
3.9. Conclusion
1. The water hyacinth has been successfully used for the removal of cadmium fromaqueous solutions and wastewaters.
2. The overall metal uptake by the plant is dependent on the concentration of the metalin solution and also on exposure time.
3. A relationship between metal uptake and time of exposure has been successfullydeveloped to expalin the system.
4. Metal accumulation factors and overall removal capacity have also been calculated.
Dow
nloa
ded
by [
Uni
vers
ity o
f L
eice
ster
] at
15:
15 1
3 Ju
ne 2
013

CADMIUM REMOVAL BY WATER HYACINTH 261
5 6 7 8 9 10
Days of Treatment
11 12 13 15 16
FIGURE 6 Changes in the cadmium content (mg) per individual water hyacinth with the passage of time inwater hyacinth.
TABLE VIIIKinetic coefficients for overall removal of cadmium by water hyacinth on 16th day
Exposurelevel (ppm)
1.02.02.54.06.0
Observed
0.940.502.453.925.09
Value of NCalculated
0.901.462.453.874.76
5.374.620.624.331.98
K
0.130.140.620.160.09
5. These studies may prove helpful in designing treatment plants for the wastewatersrich in cadmium.
REFERENCES
1. U. Forstner and G. T. W. Wittmann, Metal Pollution in the Aquatic Environment; Springer-Verlag (1983).2. Y. C. Sharma, G. Prasad and D. C. Rupainwar, Int. J. Environ. Studies, 45, 11 (1991).3. A. G. Mukherjee, Environmental Pollution and Health Hazards : Causes and Control, Galgotia Pub., N.D.
(1986).
Dow
nloa
ded
by [
Uni
vers
ity o
f L
eice
ster
] at
15:
15 1
3 Ju
ne 2
013

262 S. RAI ETAL.
4. I. M. Sayre, J. Am. Wastewater Assoc., 1, 453 (1988).5. J. D. Nriagu, Environ. Pollut., 50, 139 (1988).6. R. Paton, Cadmium in Minor Metal Survey, 9th Ed., Cornell, N. Y., Metal Bulletin Ltd., Worcester Park,
U.K. (1977).7. S. H. Jenkins, D. G. Knight and R. E. Humphercg, Int. J. Air Water Pollut., 8, 537 (1969).8. T. J. Serg, M. Casnady and G. S. Logsden, J. Am. Water Works, Assn. 70, 680 (1978).9. Y. C. Sharma, G. Prasad and D. C. Rupainwar, Intern. J. Environ. Anal Chem., 45, 11-18 (1991).
10. S. H. Hasan, S. Rai, V. C. Joshi and D. C. Rupainwar, Asian Environ. (Accepted for publication) (1991).11. B.C. Wolverton and R. C. McDonald, Environ. Health Pers., 27, 161-164 (1978).12. B. C. Wolverton and R. C. McDonald, J. Water Pollution Control Fed., 51, 305-313 (1978).13. Standard Methods for the Examination of Water and Wastewater, 14th ed. APHA, AWWA, WPCF NY
(1980).14. B. C. Wolverton, NASA, Tech. Memo. No. TM-X-72721 (1975).15. S. Muramoto and Y. Oki, Bull. Environ. Contam. Toxicol., 30, 170 (1983).
Dow
nloa
ded
by [
Uni
vers
ity o
f L
eice
ster
] at
15:
15 1
3 Ju
ne 2
013