remote wireless automation and monitoring of large … · 2015-04-02 · remote wireless automation...
TRANSCRIPT
Remote Wireless Automation and Monitoring of Large Farm using wireless
sensors networks and Internet
Laith Ali Abdul-Rahaim; Ahmed Mohammed Ali Ali Dept. of Electrical Engineering
Babylon University Babylon, Iraq
[email protected] Abstract— The work includes designing and programming a control panel to watch and control the network by using LabView program which views changes values of the farm as well as the real values required for controlling max. and min. limits and the working sensing sectors. It helps in putting values of changes adapted by the user to the network (high and low controlling values, the number of the sensing nodes and controlling type). RF link has been built to connect the farm with the manager's house electromagnetically by building connection towers of (24m) height, the environment and physiological information transform from WSN network to the Central Unit Room inside the farm, then all data received by the system sensors will be sent to the manager's house which is 10Km far from the farm where a band width of nearly 171.1 Mbps can be obtained. Accordingly, the farm is completely controlled from the manager's house by using intranet network and a controlling system. Furthermore a video monitoring system (IP) and security system of different cams connected with a server and a processor which can be viewed according to the real time are used. It is also easy to control and monitor all changes in the farm in any place all over the world via the International Network where a user can login using the net by TeamViewer program which consists of special protocols for accessing.
Keywords- IEEE 802.15.4, 802.11, WSN, ZigBee, Networks, Sensors
I. INTRODUCTION
Wireless sensor network (WSN) is most significant technologies in the last decade. It consists of small-size wireless sensor nodes Supported with radio and has one or several sensors. WSN is a granular solution to automate large farm due to cost, efficiency and reliability. In relation to communication protocol, ZigBee is considered as the main popular standard used in WSN due to its good features, low-cost, low power consumption, high capacity, high security and high reliability which they are encourage designer to use it. In this work, a monitoring and controlling system were designed. WSN are the main features of the designed system. The designed system consists of four node types namely: sensing nodes, coordinator node, control node, and gateway node. The system depends upon sensing nodes to collect environmental and physiological data such as temperature, relative humidity, dissolved oxygen in water, PH degree of water and level of water by using high accuracy sensors. The total number of the sensing nodes can be set or modify by manager of the farm from the monitor room or from the manager home "control center" by the way of "Link" . Moreover, if the network topology is forced to change for any reason such as node dead or measurement error, the designed system will adapt that change.
The dissolved oxygen in the water is the most important factor that affects the process of aquaculture, it is known that a lack of dissolved oxygen in the water for a certain limit leads to many problems, and if this continues, the shortage without interference from the breeder, the disaster would be a potential fish kills. One of the problems that fish face at the lack is oxygen: gradual or sudden death of fish. And lack of growth rates. And stress injury and emergence of various diseases. And stop eating and loss of appetite.
Another important factor that affected aquaculture is the pH of water, and it means the hydrogen ion concentration in water. Experts in the field of aquaculture, say that exceeded pH hydrogen amount of the range of 6 - 10 hampers the growth of the fish. It is known that the amount of pH freshwater variable, while the 8.1 to 8.3 salt water in the surface areas , and at least to 7.5 in the depths , and in basins that contain hydrogen sulfide gas reduces this value to 7.0 , is known to be affected by the presence of indicators of acidity aquatic plants consuming carbon dioxide , as influenced by the acidity of the soil itself. Many fish diseases appear as a result of the acidity of the water, where is generated from that swim slow, and harm the skin and warp the color of the gills, Low water pH turns water to be poisonous for most of fish in the aquarium, when pH equal to 5 fishes start mortality, which covered its body white layer, and secrete a large amount of mucus , and the parties to the gills turn to brown color.
Laith Ali Abdul-Rahaim et al. / International Journal of Computer Science & Engineering Technology (IJCSET)
ISSN : 2229-3345 Vol. 6 No. 03 Mar 2015 118
In the case of the low level of the lake water, it leads to increased acidic lake water (PH decrease in water) and this in turn leads to a decrease in dissolved oxygen in the water and necessary for the growth of the fish, this situation leads to a decline in the growth of the fish naturally in the lake, to the unwillingness of the fish in the consumption of feed needed to grow in these conditions. In addition to increasing population growth and increasing health awareness led to increased demand for fish meat significantly in recent years. In order to solve the problems mentioned above and for getting the perfect growth and high economic, control system and remote sensing have been proposed, to control the proportions of oxygen(O2) and( pH )in lake, which ensures the ideal growth and abundant production, through the use of high precision sensors, for fast data transfer and a high accuracy. In addition to what is mentioned above there are another problems that faced the manager's farm which are: Fluctuation of the water level of the lake, where it has a negative impact on the process of aquaculture. And The difficulty of monitoring the behavior of a bird ostrich, day and night, so as to know the behavior of the animal bird constantly to see the fundamental problems in the breeding of this bird. And the importance of strong and continuous monitoring of temperature and humidity incubator hatching eggs of ostrich birds. The difficulty of manager arrival to the farm in severe weather conditions such as heavy rains and heat to the fact that these areas are rural areas with rough roads are unpaved.
The proposed system has a number of precision sensors assembled in nodes to measure the actual values of environmental variables (temperature of water in basin fish hatching , humidity, and water irrigation level of lake, the proportion of oxygen in the water of lake and the proportion of PH in the water of lake in addition to surveillance of farm for management and study the behavior of a bird ostrich by using distributed IP cameras ) and send them to the central unit room "Gateway" in the farm , where the necessary changes are executed and then transmit the sensors information's that we already get it, with an IP video to show secure status of the farm and bird ostrich behavior to the manager's home, by link between the home and the farm, on a distance up to 10 km. On the other hand, the needs of Iraqi farmers such as low cost, robustness, friendly in use, and long life. In addition, the following main goals are considered in this paper are: The system depends on high efficiency, low cost components. And increase the growth of fish by controlling environmental variables such as the ratio of oxygen, pH and the level of the lake water. For precise control of the temperature in the basin of hatching fish, played a key role in the proportion of fish hatching eggs perfectly. And for precise control and monitoring of the relative humidity and temperature in the hatcher of the ostrich eggs. Ease of movement of the farm manager and saving time, effort, and ease of administration. Reduce labor and ease of control of the receivership by observation through remote monitoring. Real-time processing, real-time watching for the farm, average value, lake water vital parameters remote monitoring and controlling. And optimum power saving in sensing node. And the designed system support scalability. And Farm operator can diagnose system error. On other hand, the system must adapt error coming from sensors reading or network topology. And the design supports two control modes. Farmer can set one of them optionally.
The main problem and motivation for this paper have been presented now. The following sections of this paper present both the analysis and research that have been done to develop a smart farm automation system. These sections are arranged as follow: Section two" Wireless Sensor Network", discusses the theory background on the wireless sensor network and ZigBee standard technology, "RF Link parameters". Section three "farm sensors" provides essential background information about farm sensors and actuators which used in this paper. Hardware and software implementation of the system are presented in Sections four "deal with Implementation of Proposal Wireless Automation System". The experimental results are discussed then in section five "Result and discussion". Finally, the conclusions on this project are drawn and presented in Section six. An outlook of how future work can improve the already obtained results is also provided.
II. WIRELESS SENSOR NETWORK
Wireless Sensor Network (WSN) is a network of spatially distributed small and cheap devices called "Sensor Nodes" which equipped with sensing, computing, power, and short-range communication modules to monitor a certain phenomenon such as environmental data or object tracking.[14]. Sensor nodes are distributed over a particular area of interest to monitor a certain physical or environmental condition in a cooperated way. After collecting the desired information from the environment, each node processes that information and then sends them to a collection center, which is also denoted as a sink node using their wireless radios. The sink node sometimes acts as a gateway which relays the information further to the control center at a remote location to another network such as internet [15].
Wireless sensor networks concept's is based on a simple equation: (Sensing + CPU + Radio = Thousands of potential applications) [16].
The energy consumption of network operation is the main concern in WSNs. Sensor nodes depend on limited power supply (battery) in all them activities. However, for most applications, it is not feasible to replace the batteries of the sensor nodes after deployment. Therefore, power saving technique must be used with WSN to increase network lifetime [9]. Despite the limitations of individual sensor nodes resources and the design challenges, wireless sensor network has several advantages makes it form the most interest fields in the last few years [17].
Laith Ali Abdul-Rahaim et al. / International Journal of Computer Science & Engineering Technology (IJCSET)
ISSN : 2229-3345 Vol. 6 No. 03 Mar 2015 119

The protocol is a common set of rules that manage the exchange of the data between two devices. Communication standard is a set of protocols with different functions making communication and networking of wireless devices form different Vendor is possible. According to Open Systems Interconnection (OSI) model, communication standard predefined in layers stack. Each layer is responsible for performing a specific one or more protocol, and dealing with the layers above and below it.
WSN protocol implemented in the each wireless node so that, it will affect by node resources limitation. To this end, many design challenges must be consider when choosing communication standard as : Power limitations of wireless sensor nodes. Processing limitation of wireless sensor nodes. Scalability. Fault tolerance. Distributed natural of wireless sensor network.
Several standards, for short-range wireless networking, including IEEE 802.11 Wireless Local Area Network (WLAN), IEEE 802.15.4 Wireless Personal Area Network (WPAN) and Bluetooth are suitable to use in WSN and each of these standards has its particular applications. In table 1, comparison is made between these standards to give a better understanding about advantages and disadvantage of each technology [19,20].
Table .1 Comparison of different wireless standard technologies
Feature Wi-Fi (IEEE802.11)
Bluetooth (IEEE802.15.1) ZigBee (IEEE802.15.4)
Radio DSSS FHSS DSSS
Data rate 11Mbps 1Mbps 250kbps
Data type Video, audio, graphics, files Audio, graphics , picture, files Small data packet
Range (m) 100 10 40
Battery life Hours weeks years
Power consumption 160 to 600mW 40 to 100mW 1mW
Cost ($) 100 40 22 Complexity complex Very complex simple
From the above table, it can be concluded that ZigBee is the best solution to apply in WSN among the other technology. ZigBee feature includes low data rate, low cost, long battery life, low power conception and support simple in size and complexity.
III. FARM ENVIRONMENT SENSORS
The productivity and crop quality of the farm including: aquaculture process and hatcheries of ostrich eggs, depend on many different factors such as dissolved oxygen concentration(O2)in water ,concentration of pH value , temperature of hatchery fishes, water level , humidity of hatcheries ostrich eggs. Farm manager must have a set of reference values to certain variables of environmental, and then the automation system works around values of these variables. Watching for the behavior of ostriches, securing and surveillant the entrance of the farm by using an IP cam can also be defined.
A. Farm Sensors
Many sensors are available in the market to fulfill farm automations system requirements. The control quality of the system depends in the first step on the quality of the data which collected by these sensors. Therefore, sensors selection is important to build high efficiency monitoring and controlling system.
1. The Water temperature
Fishes are cold-blooded organisms that any body temperature is not constant but change, depending on the temperature of the aqueous medium in it, and then had a water temperature no role effectiveness. In all physiological functions of fish growth and reproduction and respiration, movement and disease resistance and others affected by water temperature directly.[28]
2. The Dissolved Oxygen
Dissolved oxygen is the most important environmental factor for life , health and growth of fishes , and low concentration of oxygen in water leads to many problems the like: low immunity , low growth rates and in the case of the very low levels below the critical point this leads to the fishes death.
Some fishes types live in warm water can low oxygen level between (3 mg/L – 2 mg/L), whereas cold water fishes can't this levels.
In general , the concentration of dissolved oxygen in the water the fish farms is recommended to ensure the preservation of good health of the fish and the high growth rates is not less than 5 mg / L .[28]
Laith Ali Abdul-Rahaim et al. / International Journal of Computer Science & Engineering Technology (IJCSET)
ISSN : 2229-3345 Vol. 6 No. 03 Mar 2015 120
3. The Concentration of pH
pH value ,expresses of the properties of aqueous acid or alkali, and each kind of fishes has its preferred "pH". In general, most types of fishes aqueous medium with light alkaline grades (7.5-8) .[28]
4. Hatcheries of Ostrich Eggs
The optimal air temperature inside hatching machine ranges between (35C-39C),depending on the control process on hatchery. The range of healthy relative humidity for successful hatching ranges between (25%-30%). In order to monitor and control these environmental factors, sensors and actuators are essential. Farm crops can benefit a lot of the use of WSNs, because they can collect environment information which is scattered over wide area and control actuators in efficient way. WSNs have a lot of application implemented in practical life. Each WSN application has unique sensors and actuators to perform a specific task. Sensors measure the state of the environment and report this to a control system, which then makes the necessary changes. A lot of sensor technologies are available on the markets that are ready to be attached to a wireless sensing platform. Therefore, this particular section of the paper will be looking at some of the sensor/actuator devices that are available on the market to be used in this work
5. Environment Temperature Sensors.
Lake and basin fish hatching environment Temperature can be measured via diverse types of sensors. All of them infer temperature by sensing some change in a physical characteristic. Thermal resistance or also called (Negative Thermal Coefficient (NTC)) represents another class of temperature sensors. It is based on resistance change in a ceramic semiconductor in the manner of resistance drops nonlinearly with temperature rise. The high sensitivity to temperature change makes the thermistor extremely well suited to precision temperature measurement. For example, a typical industrial-type thermistor with a 2000 Ω resistance at 25˚ C will exhibit a resistance change of 78 Ω /˚ C change in temperature [32]. Typically, thermistor measures temperature in range (-38 Co to 260 Co) with non-linear response. It has a lot of advantages over other types such as high sensitive, low cost, good stability, accuracy over small temperature rage, and fast response [30].
Signal condition circuit for thermistor is a simple voltage divider. The use of a thermistor in such a circuit results in much higher sensitivity than that obtainable with a thermocouple or RTD [34]. Form above circuit, NTC resistance can be computed according to the value of (V) which represented the result of voltage divider of (Vcc) between selected resistance (R) and NTC temperature dependence resistance (Rt). NTC voltage drop is convert to digital number by using high resolution Analog to Digital Converter (ADC) then fed to micro-controller to determine NTC resistance depending on the flowing formula:
∗ 1
Where: RNTC: - NTC resistance at certain temperature.
V: - Voltage drop at NTC resistance. Vcc: - Supply voltage.
R: - Selected resistance.
After NTC resistance value computed, actual temperature degree can be calculated form Resistance-Temperature curve fitting. This curve gives us information about the behavior of NTC resistance when temperature rises or decreases. As mentioned before, NTC has non-linear response therefore the result of fitting process should be polynomial equation. A lot of applications use thermistor due to good features such as high sensitivity, low-cost, small dimensions, and relatively simple circuitry requirements. Form these applications we mention to temperature transducer, remote measurement, temperature control circuit, thermal conductivity measurement, and compensate for the effects of temperature on both component and circuit performance. Also, it is used in the physical and biological fields such as in the food industry or in medicine [32].
6. Environment Relative Humidity Sensors
Relative humidity at any temperature is the actual humidity divided by the value of saturated humidity at that temperature. For example, a relative humidity value of 50% at 20Co means that the air contains half of the quantity of water that would be needed to saturate it at this temperature. When it comes to humidity sensing technology, the most widely used and available of humidity sensor types are: resistive, thermal conductivity, and capacitive humidity sensor [34]. Resistive humidity sensors depend on natural phenomenon in which the change in resistances of many nonmetal conductors are relying on the water content of that material. Resistive humidity sensors have disadvantages which include sensitivity to chemical vapor, required complex signal conditioning circuit and lower operating temperature in compare to other sensor types [30]. Thermal conductivity humidity sensors depend on the thermal conductivity of gas to measure absolute humidity. It consists of two matched NTC thermistor in a bridge circuit; one is hermetically encapsulated in dry nitrogen and the other is exposed to the environment. The difference in resistance of the thermistors is proportional to the absolute humidity [31-36] . This type of sensors characterizes by durability, ability to work in high temperature environments and high
Laith Ali Abdul-Rahaim et al. / International Journal of Computer Science & Engineering Technology (IJCSET)
ISSN : 2229-3345 Vol. 6 No. 03 Mar 2015 121

accuracy but it is very expensive. However, it is suitable for application such as kilns for drying wood, machinery for drying textiles, and food dehydration [30]. Capacitive humidity sensors are based on the changes in the dielectric constant of materials between plates of capacitors. The dielectric consists of a polymer material that has the ability to absorb water molecules. The absorption of water vapor of the material results in changes in the dielectric constant of the capacitor. By careful design, the capacitance can be made directly proportional to percentage relative humidity of the surrounding gas or atmosphere.[32]
The main advantages of this type of sensors are: cheap , small size, wide RH range (5% to 95%) with ±2% accuracy, high sensitivity, fast response, low temperature dependent , and high chemical stability with minimal maintenance requirements. These features make capacitive humidity sensors viable for many specific operating conditions and ideally suitable for a system where uncertainty of unaccounted conditions exists during operations [30] [33].
The signal conditioning circuit of capacitive humidity sensor. 555 timer in the stable mode is used to drive Capacitive to voltage (C/V) chip. The relationship between the measured capacitance (Cx), and output voltage (Vout) of C/V converter can be expressed by:
∗ ∗ ∗ 2
Where: fin:- The frequency of output signal of 555 timer
Cx: - Measured capacitance. R3 :- The resistance that is connected to C/V chip for RC circuit.
Vcc: - Supply voltage
7. Liquid Level Measurement
Level measurement is required in a wide range of applications and can involve the measurement of solids in the form of powders or small particles as well as liquids. While some applications require levels to be measured to a high degree of accuracy, other application only need an approximate indication of level. A wide variety of sensors are available to meet these differing needs. This section will present some of the available level measurement methods that can be used for environmental monitoring application [35]. Ultrasonic level sensors emit sound waves, and the liquid surface reflects the sound waves back to the source. The transit time is proportional to the distance between the liquid surface and the transmitter. The measuring system evaluates the time-of-flight (t) of the signal from 3.3 equation:
2 3
Where: v :- Propagation velocity of the waves. And d :- The distance between water surface and sensor.
These sensors are ideal for noncontact level sensing of very viscous fluids such as heavy oil, latex, and slurries. Practically, there are limitations to this method, which include: Foam on the surface can absorb sound. Speed of sound varies with temperature. Turbulence can cause inaccurate readings.
VI. IMPLEMENTATION OF PROPOSAL WIRELESS AUTOMATION SYSTEM
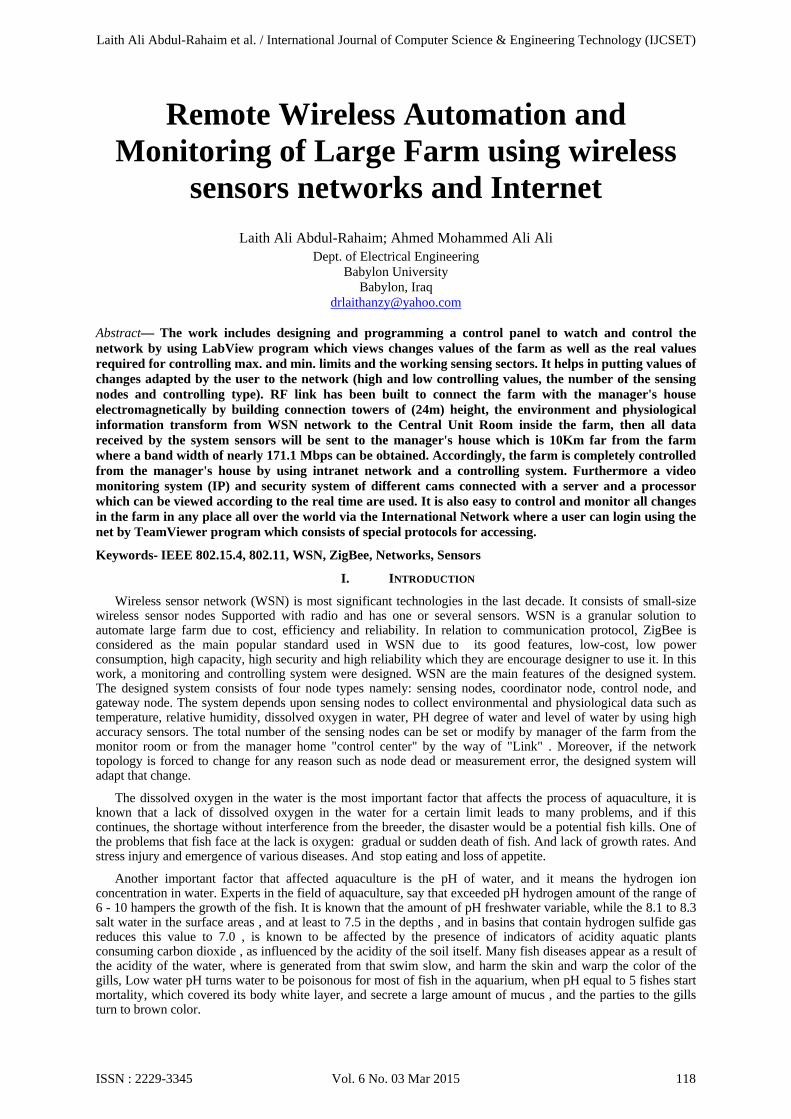
In this paper, wireless sensor network is presents as practical application. Generally, in each node, two different kinds of modules were designed and implemented: The sensor/actuator module and the wireless module are based on special design of a 9600 b/s asynchronous wireless communication. The WSN follows the standard IEEE 802.15.4 and implements a routing protocol based on ZigBee. Smart farm automation system consists of ZigBee network with five nodes type, each node will take its name and position according to its function in the system. These nodes are: Coordinator Node (CRN), Sensing Nodes (SN), Control Nodes (CN), Hybrid nodes Control/Sensing, and Gateway Node (GWN).In addition to what mentioned above, we implemented a securing and monitoring system consisting of a network IP cams connected wirelessly. Figure .1 illustrates overall system for smart farm automation based on WSN.
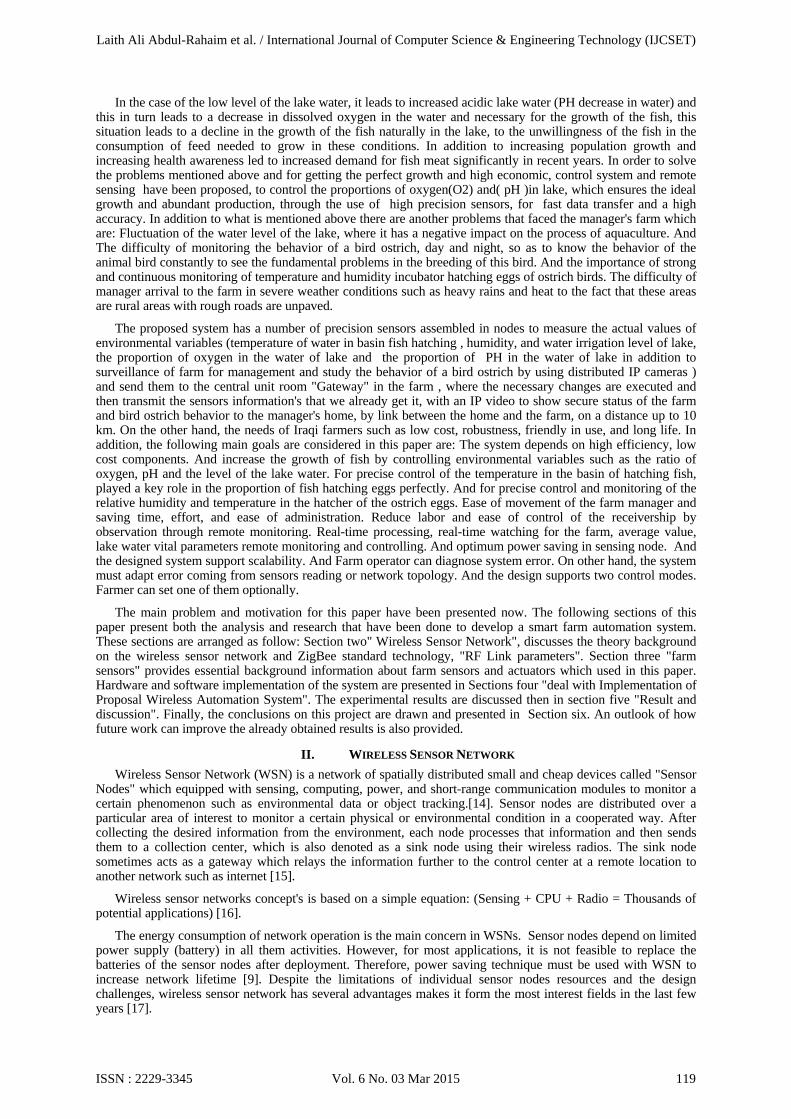
In this work, coordinator node was installed on the lakeshore by using special designed stairway installed on the surface of the water and prepared especially for this purpose. It is worth mentioning, that we combined sensing node that responsible of monitoring O2, pH, Temperature and water level in the like farm with the coordinator in one node, because they are so near to each other. Each sensor node uses special sensors to collect environment information such as dissolved Oxygen in water, pH concentration temperature and water level in the lake farm and relative humidity and temperature for ostriches eggs hatchery or another temperature and level sensor in the basin fish hatching..
The Gateway node function is to connect ZigBee network to the computer via USB port to display the obtained data from the network and deliver data which is set by farm manager to the network. LabView program was creating as high level user interface application.
Laith Ali Abdul-Rahaim et al. / International Journal of Computer Science & Engineering Technology (IJCSET)
ISSN : 2229-3345 Vol. 6 No. 03 Mar 2015 122
In geWay nodhardwarepart of th
The Coordinacentral nsend. CoCollects actuator Detects fultrasonic
eneral, our dede set as ZigBe design and she block diagrasystem includ
ator or commnode in our deordinator nodsensing nodestate dependi
faults and erroc level sensor
esign implemeee end device
software desigam in figure .des one coor
munication maesign without de has the flowes data and cing on averagor in the systr and temperat
Figure
Figure 2
ented ZigBee e while coordign / configurat1 will discuss
rdinator node ster or main this node the
wing tasks: i. calculate averge value andem. Coordinature sensors, a
e.1 Overall system
sensors installati
star topologyinator node re
ation for all sys in detail.
fixed on thecontroller no
e network inaStarts ZigBee
rage value ofpredefine upp
ator node attaas shown in fig
m for smart farm
ions in coordinato
y in which seepresented Zigystem parts. H
e lakeshore bode is the heaactive and othe network. ii. f each farm pper and lowe
ached with disgure 2 below.
automation based
or / sensing comb
ensing node, cgBee coordina
However, in th
by using specart of the desiher nodes still
Manages nodparameter. iv
er limits of eassolved oxyge
d on WSN.
bination node
control node, ator. The workhe next paragr
cial designed igned systeml waiting permdes communicv. Take decisach farm paraen , pH conce
and Gate k includes raphs each
stairway. m. It is the mission to cation. iii. ion about ameter. v. entration ,
Laith Ali Abdul-Rahaim et al. / International Journal of Computer Science & Engineering Technology (IJCSET)
ISSN : 2229-3345 Vol. 6 No. 03 Mar 2015 123
This Thereforeresearchethat wereof aquacucontrol swhich leaour syste(control n
In vierecipe vomicroconto raise n
The was its implevel (10
Whencontrol nlake. Whactuator node ,to heaters. Ithe feed researche
A. P
In thplatform.USB to sshields wshield, E-
HighDevelopmAtmega3
Thmost timeach sensprocessed
work shows he; the researcer attached the plaguing theulture, when tignal to the cads to mixing em " Lungs onode 2) that reew of the fact olatile and unntroller, the conew water intowater level of portance in th0 cm) is idealn the lake wa
node1) that is rhen the water lOFF. The resensure the su
In addition to is given acco
er made calibr
Processor subs
his work Ard. It contains eserial driver c
with specific t-Health care sh level langument Environ328P controllehe microcontro
me in sleep mosor individuald data to trans
how to monitocher has usedese sensors to
e farm managethe decrease ocontrol node t
of the lake wof the lake", esponsible to that the water
nstable, if eaoordinating noo the lake, to ef the lake, whiche nutrition an for fish farmi
ater decrease uresponsible tolevel arrives msearcher used uccessful hatc
using it in theording to the ration procedu
system
duino platformeverything nechip to progrtasks can conshield… etc. uage with conment) is a sper. It is open sooller was conode and it stilllly by using cosceiver due to
Figure 3 P
oring a fish lad sensors witho coordinator er, is the decreof oxygen for ato control thre
water that is powhere the practuate the 3-r used in the l
arned decreasode sends a coequivalent the ch is an impornd safety of fiing. under a thresh
o drive / actuatmax. threshold
NTC type tehing process e lake with cotemperature i
ures for this se
m are dependeded to suppoam microcontnect to Ardui
mpiler was uecial programource softwar
nnect to envirl waits an inteontrol signal tserial connec
Practical sensors
ake using dissh high accuranode since it
ease in dissolva predeterminee- phase motoor of oxygen rocess of exch phase motor lake is not fresed this ratio ontrol signal t concentrationrtant factor in
fish diseases a
hold value, thte 3-Phase indd , the coordinemperature senand keep tem
oordinator nodin the lake toensor to use it
d to drive Atort microcont
ntroller or seriino to increas
used to progm running on re which depenronment sensoerrupts to wakthen read dataction TX, RX.
connection to the
solved oxygenacy and resolut is placed on ved oxygen inned level happtor pump lakewith oxygen hanging oxygpump used insh water riveror increased
to the (controln of pH.
n the density oas the sun play
he coordinatorduction motornator sends a nsor in both
mperature in rade to know tem reduce wastaoptimally.
tmega microctroller includeial monitoringse its applicat
gram this micomputer thatnds on C/C++ors as shown ke up to perfoa from that sen
e Atmega 328P d
n, pH, temperaution. As men
the lakeshoren the water drapened , the cooe water to a cair. The resea
gen take placethis part in de
s. The concenlevels specif
l node1), to op
f fish in the bayed an import
r node send ar to turn it ONsignal to the c: basin fish hange betweenmperature degage happening
controller. Figes clock circug. In additionion filed such
crocontroller. t allows us to
+ languages. in figure 3. M
orm single tasnsor, process t
iagram
ature and leventioned previoe. One of the ains used in thordinating nodcertain height archer called the. We will dietails later.
ntration of the ified earlier wperate the mo
asin of the laktant role, main
a control signaN to rise the wcontrol node t
hatching contrn (22C-26C)gree of the lakg in feed. Alr
gure 3 showsuit, voltage sunal, a lot of ch as relay shi
The IDE (Io write sketch
Microcontrollsk at a time. them, and fin
el sensors. ously, the problems
he process de sends a in the air
his part of iscuss the
pH of the within the otor pump,
ke, as well ntaining a
al to the ( ater to the to turn the rol /sensor ) by using ke. Where ready, the
s Arduino upply, and ompatible eld, GSM
Integrated hes for the
ler spends It enables ally sends
Laith Ali Abdul-Rahaim et al. / International Journal of Computer Science & Engineering Technology (IJCSET)
ISSN : 2229-3345 Vol. 6 No. 03 Mar 2015 124
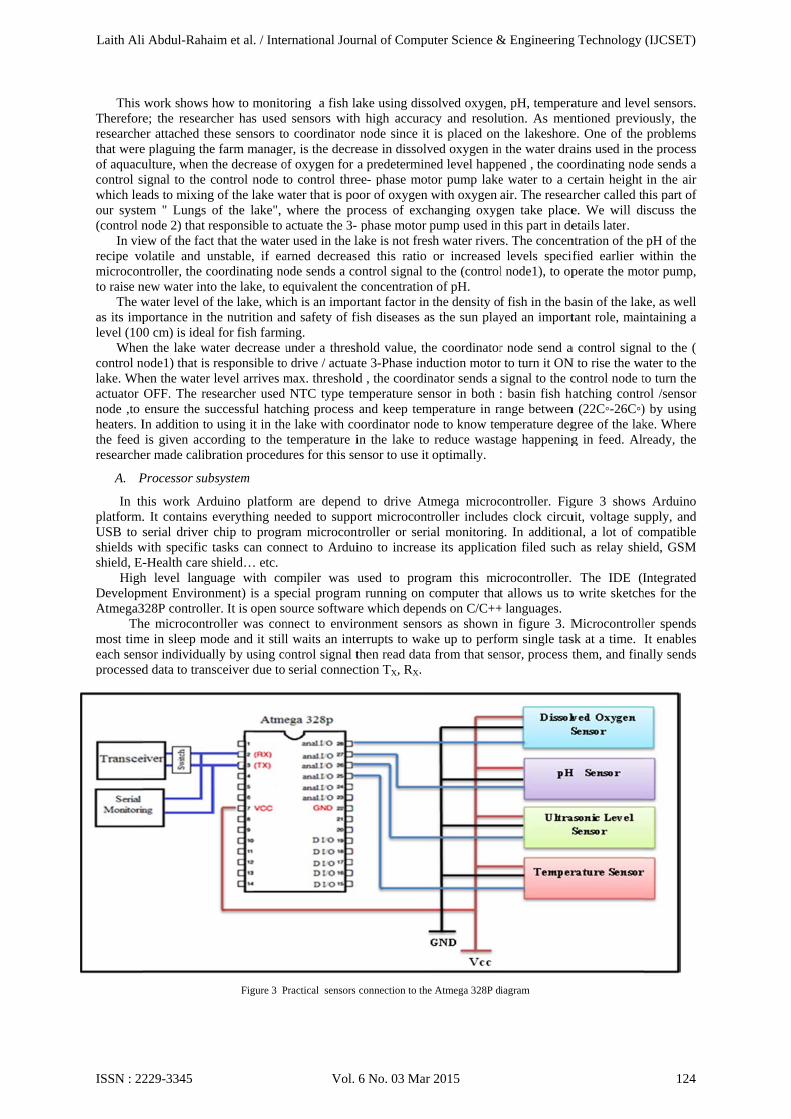
In this node we used four analog channels; to read analog signal from dissolved Oxygen , pH consternation, ultrasonic level and temperature sensors . The ADC converts an analog input voltage to a 10-bit digital value using successive approximation technology. The conversion process returns integers from 0 to 1023 which represent ground and Vref voltage respectively.
As it mentioned before, Vref voltage was set to 2.5 volt so the microcontroller can calculate the output voltage by using the fallowing formula:
∗2.5
2 1024∗ 1000 4
Where Quantization level is an integer number from 0 to 1023.
After that, microcontroller manipulates sensors readings whose input values are the output obtained from eq. (4).Then the coordinator node send this data serially to the gate way node to be displayed by a LabView program on a monitor of desktop computer which is placed in the "Central Unit Room" (CUR), inside the farm. As we will see in this section.
B. Communication subsystem
XBee 63mW External antenna-Series B2 module from Digi International as radio transceiver is used in this system. XBee module is designed to operate within the ZigBee protocol and support the unique needs of low-cost, low-power wireless sensor networks [20]. The modules require minimal power and provide reliable delivery of data between remote devices. We use XBee shield to connect Arduino platform with XBee module. This shield provides the module with 3.3 volt supply by using voltage regulator. Also, it contains DIP switch to change the serial connection between XBee module and microcontroller or computer. In practical work on the ground, we have been got many problems one of them was the weak in signal strength due to the long distance between the nodes and the presence of obstacles in the farm these previous reasons cause an attenuation in the signal . So, we have been solved this problem in these steps:
1. Used at least 3m length, SMA (Sub-Miniature Version A) connector is semi-precision coaxial cable. It is minimal connector interface for coaxial cable with screw type coupling mechanism. The connector has a 50Ω impedance. It is designed for use from DC to 18 GHz. Figure 4.15 shows male/female RF-connector.
2. Used dipole antenna with 8dBi , 2.4GHz. It is worth mentioning, that we were made a weather proof box for the coordinator node to protect the node from the hard climate conditions like: sun and rain .
C. Combination coordinator/sensing node software program
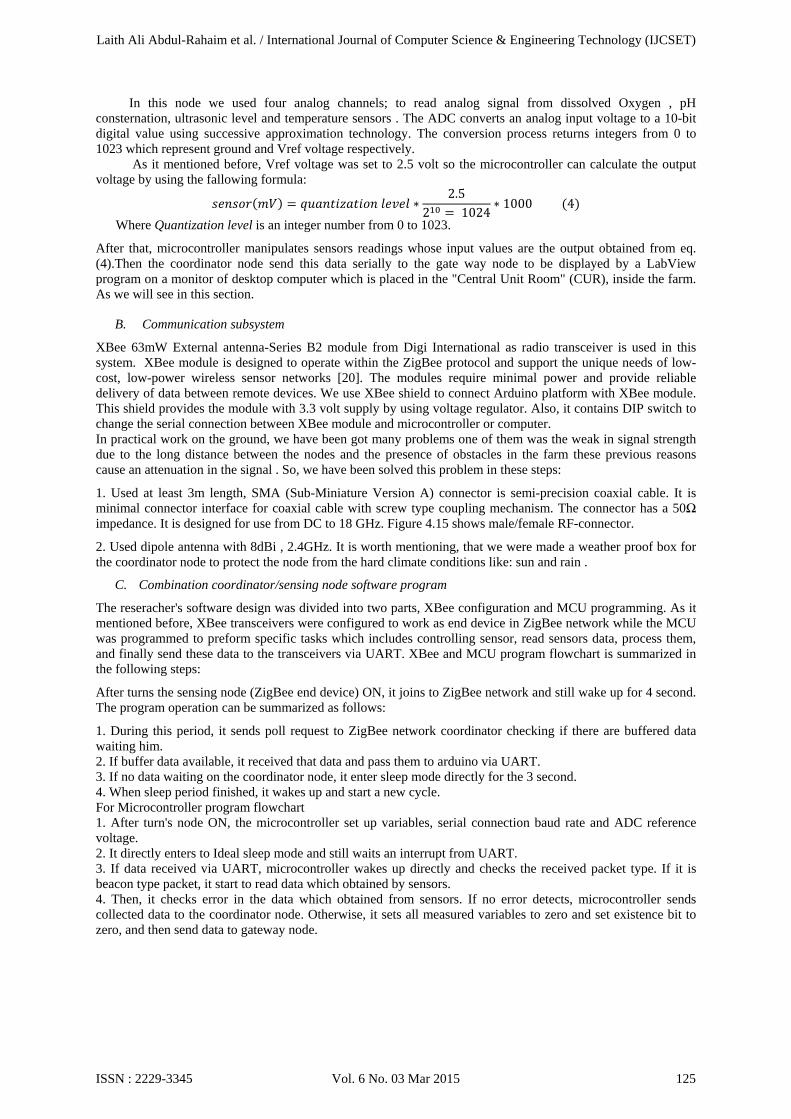
The reseracher's software design was divided into two parts, XBee configuration and MCU programming. As it mentioned before, XBee transceivers were configured to work as end device in ZigBee network while the MCU was programmed to preform specific tasks which includes controlling sensor, read sensors data, process them, and finally send these data to the transceivers via UART. XBee and MCU program flowchart is summarized in the following steps:
After turns the sensing node (ZigBee end device) ON, it joins to ZigBee network and still wake up for 4 second. The program operation can be summarized as follows:
1. During this period, it sends poll request to ZigBee network coordinator checking if there are buffered data waiting him. 2. If buffer data available, it received that data and pass them to arduino via UART. 3. If no data waiting on the coordinator node, it enter sleep mode directly for the 3 second. 4. When sleep period finished, it wakes up and start a new cycle. For Microcontroller program flowchart 1. After turn's node ON, the microcontroller set up variables, serial connection baud rate and ADC reference voltage. 2. It directly enters to Ideal sleep mode and still waits an interrupt from UART. 3. If data received via UART, microcontroller wakes up directly and checks the received packet type. If it is beacon type packet, it start to read data which obtained by sensors. 4. Then, it checks error in the data which obtained from sensors. If no error detects, microcontroller sends collected data to the coordinator node. Otherwise, it sets all measured variables to zero and set existence bit to zero, and then send data to gateway node.
Laith Ali Abdul-Rahaim et al. / International Journal of Computer Science & Engineering Technology (IJCSET)
ISSN : 2229-3345 Vol. 6 No. 03 Mar 2015 125
D. H
In our wcontrollin
1
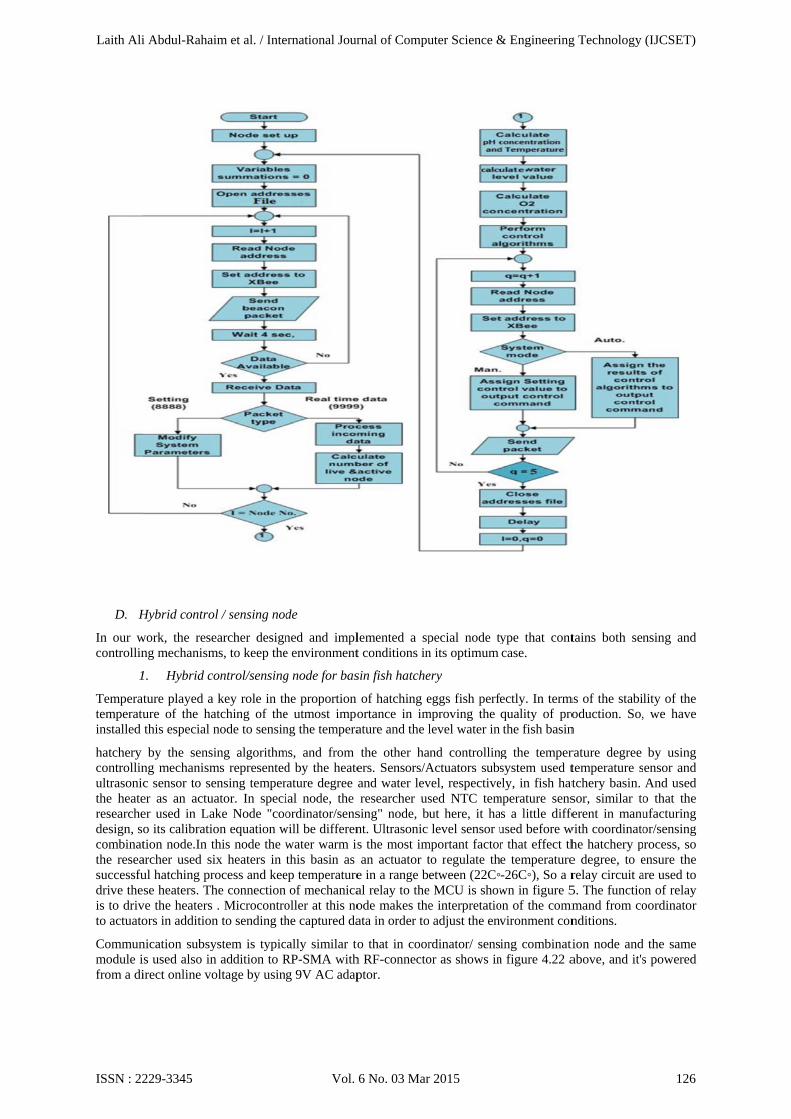
Temperatemperatuinstalled
hatchery controllinultrasonicthe heateresearchedesign, socombinatthe reseasuccessfudrive theis to drivto actuato
Communmodule ifrom a di
Hybrid contro
work, the reseng mechanism
1. Hybrid co
ature played a ure of the hathis especial n
by the sensing mechanismc sensor to seer as an actuaer used in Lao its calibratiotion node.In tarcher used siul hatching prse heaters. Th
ve the heaters ors in addition
nication subsyis used also inirect online vo
l / sensing nod
earcher designms, to keep the
ontrol/sensing
key role in thatching of thenode to sensin
ing algorithmms representedensing temperator. In speci
ake Node "cooon equation wthis node the wix heaters in rocess and keehe connection . Microcontro
n to sending th
ystem is typicn addition to Roltage by usin
Fi
de
ned and imple environment
g node for bas
he proportion e utmost impong the tempera
ms, and from d by the heaterature degree ial node, the ordinator/sens
will be differenwater warm isthis basin as
ep temperatureof mechanica
oller at this nohe captured da
ally similar toRP-SMA withg 9V AC adap
igure 4 Coordinat
lemented a spt conditions in
sin fish hatche
of hatching eortance in imature and the l
the other haers. Sensors/Aand water levresearcher us
sing" node, bnt. Ultrasonic s the most iman actuator t
e in a range bal relay to theode makes theata in order to
o that in coorh RF-connectoptor.
tor node MCU pr
pecial node tyn its optimum
ery
eggs fish perfmproving the level water in
and controllinActuators subsvel, respectivesed NTC temut here, it halevel sensor u
mportant factorto regulate thetween (22C
e MCU is showe interpretatio
o adjust the env
rdinator/ sensor as shows in
rogram flowchart
ype that contcase.
fectly. In termquality of prothe fish basin
g the tempersystem used t
ely, in fish hatmperature sens
s a little diffeused before wr that effect the temperature-26C), So a rwn in figure 5on of the commvironment con
ing combinatin figure 4.22 a
tains both sen
ms of the stabioduction. So,
n
rature degree temperature stchery basin. sor, similar toferent in manuwith coordinatohe hatchery pe degree, to erelay circuit a5. The functiomand from conditions.
tion node andabove, and it's
nsing and
lity of the , we have
by using ensor and And used o that the ufacturing or/sensing rocess, so
ensure the are used to on of relay oordinator
the same s powered
Laith Ali Abdul-Rahaim et al. / International Journal of Computer Science & Engineering Technology (IJCSET)
ISSN : 2229-3345 Vol. 6 No. 03 Mar 2015 126
2. Hybrid
In order thatched humidity
Relative of the Hucomponesurroundtemperatu
So, tempcalibratioaccuracy integratedProgramm
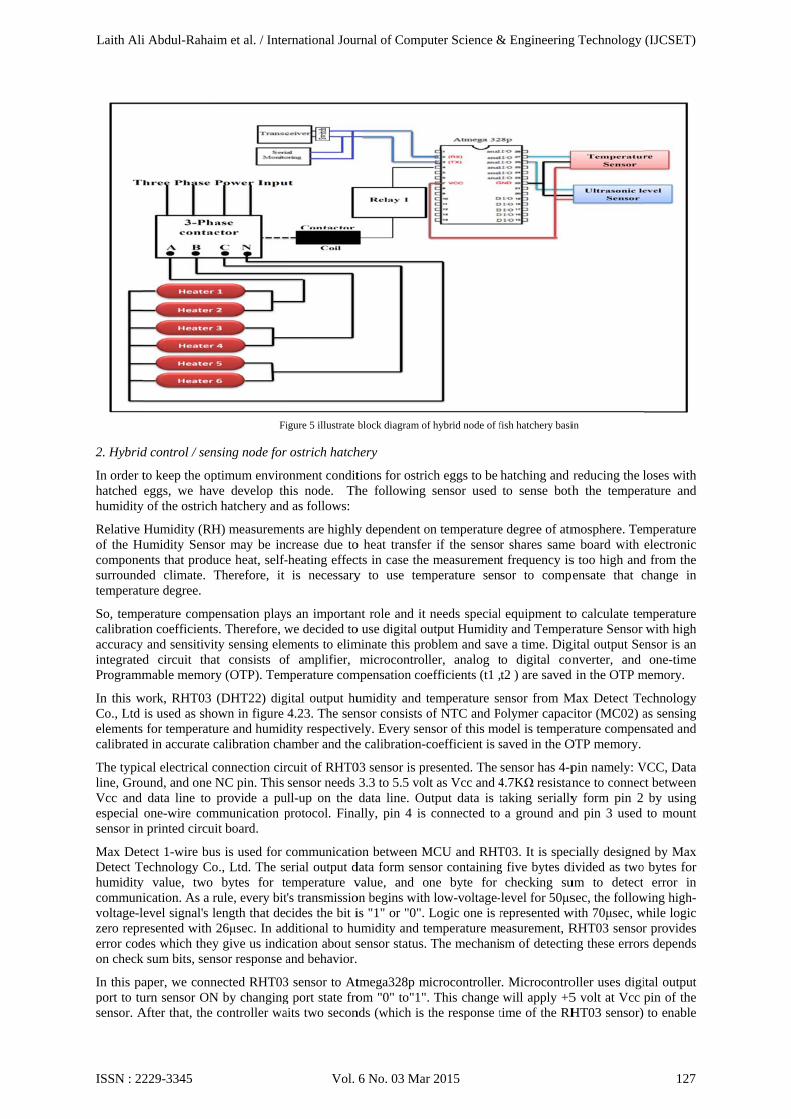
In this wCo., Ltd elements calibrated
The typicline, GroVcc and especial sensor in
Max DetDetect Thumiditycommunivoltage-lzero reprerror codon check
In this paport to tusensor. A
d control / sen
to keep the opeggs, we hav
y of the ostrich
Humidity (RHumidity Sens
ents that produded climate. Ture degree.
perature compon coefficientsy and sensitivitd circuit thamable memor
work, RHT03 is used as sho for temperatud in accurate c
cal electrical cund, and one data line to
one-wire comn printed circu
tect 1-wire buechnology Co
y value, two ication. As a revel signal's l
resented with des which theyk sum bits, sen
aper, we connurn sensor ONAfter that, the
nsing node for
ptimum envirove develop thh hatchery and
H) measuremeor may be inuce heat, self-Therefore, it
pensation plays. Therefore, wty sensing ele
at consists ory (OTP). Tem
(DHT22) digown in figure ure and humidcalibration ch
connection cirNC pin. This provide a pu
mmunication pit board.
us is used for o., Ltd. The s
bytes for trule, every bitlength that de26μsec. In ad
y give us indinsor response a
nected RHT03N by changing
controller wa
Fi
r ostrich hatch
onment condithis node. Thd as follows:
ents are highlycrease due to-heating effec
is necessary
ys an importanwe decided toements to elimf amplifier,
mperature com
gital output hu4.23. The sen
dity respectiveamber and the
rcuit of RHT0sensor needs
ull-up on the protocol. Fina
communicatioerial output demperature vt's transmissiocides the bit i
dditional to hucation about sand behavior.
3 sensor to Atg port state froaits two secon
igure 5 illustrate b
hery
tions for ostriche following
y dependent oo heat transfercts in case they to use tem
nt role and it o use digital ouminate this pro
microcontrollmpensation coe
umidity and tnsor consists oely. Every sene calibration-c
03 sensor is pr3.3 to 5.5 voldata line. Ou
ally, pin 4 is
on between Mdata form sensvalue, and oon begins withis "1" or "0". umidity and tesensor status.
tmega328p mom "0" to"1".
nds (which is t
block diagram of
ch eggs to be sensor used
on temperaturer if the sensormeasurement
mperature sen
needs specialutput Humiditoblem and savler, analog tefficients (t1 ,
temperature seof NTC and Pnsor of this mocoefficient is s
resented. The lt as Vcc and 4utput data is tconnected to
MCU and RHTsor containingne byte for
h low-voltage-Logic one is remperature mThe mechani
microcontroller This change the response t
f hybrid node of f
hatching and to sense both
e degree of atmr shares samet frequency issor to comp
l equipment toty and Temperve a time. Digto digital cont2 ) are saved
ensor from Molymer capacodel is tempersaved in the O
sensor has 4-p4.7KΩ resistantaking seriallya ground and
T03. It is specg five bytes di
checking sulevel for 50μsrepresented weasurement, Rsm of detectin
r. Microcontrowill apply +5
time of the RH
fish hatchery basi
reducing the lth the temper
mosphere. Teme board with s too high andensate that c
o calculate temrature Sensor
gital output Senverter, and
d in the OTP m
Max Detect Tecitor (MC02) arature compen
OTP memory.
pin namely: Vnce to connecy form pin 2d pin 3 used
cially designeivided as two
um to detect sec, the follow
with 70μsec, wRHT03 sensorng these error
oller uses digi5 volt at Vcc HT03 sensor)
in
loses with rature and
mperature electronic
d from the change in
mperature with high
ensor is an one-time
memory.
echnology as sensing nsated and
VCC, Data ct between
by using to mount
d by Max o bytes for
error in wing high-while logic r provides rs depends
ital output pin of the to enable
Laith Ali Abdul-Rahaim et al. / International Journal of Computer Science & Engineering Technology (IJCSET)
ISSN : 2229-3345 Vol. 6 No. 03 Mar 2015 127
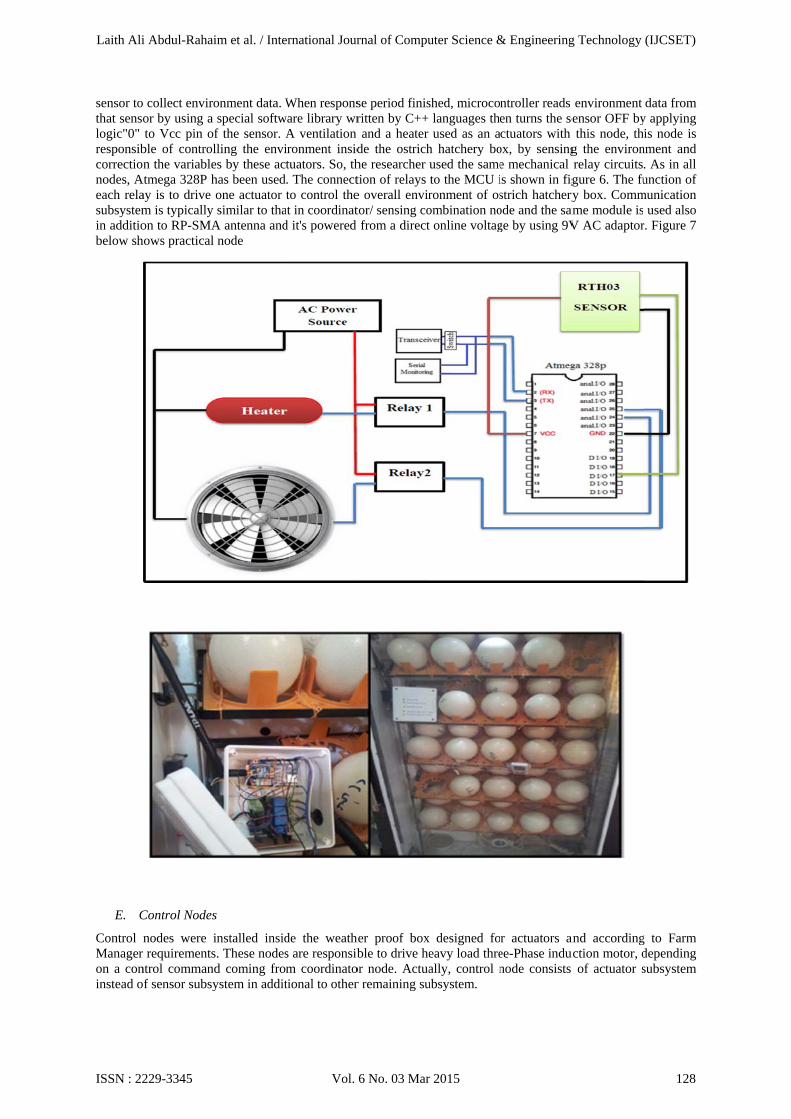
sensor tothat sensologic"0" responsibcorrectionodes, Aeach relasubsystemin additiobelow sh
E. C
Control nManager on a coninstead o
o collect enviroor by using a to Vcc pin of
ble of controln the variable
Atmega 328P hay is to drive m is typically on to RP-SMAhows practical
Control Nodes
nodes were ir requirementsntrol commandof sensor subsy
onment data. Wspecial softwf the sensor. Alling the envies by these achas been usedone actuator similar to tha
A antenna andnode
s
installed insids. These nodesd coming froystem in addit
Figure 6
Figure 7 Pr
When responsware library wr
A ventilation ironment insidtuators. So, th. The connectto control the
at in coordinatd it's powered
de the weaths are responsibm coordinatotional to other
The designed blo
ractical hybrid co
se period finisritten by C++and a heater
de the ostrichhe researcher tion of relays e overall envirtor/ sensing cofrom a direct
her proof boxble to drive he
or node. Actuar remaining su
ock diagram of th
ontrol/sensing nod
shed, microcolanguages theused as an a
h hatchery boused the sameto the MCU ironment of osombination not online voltag
x designed foeavy load threally, control n
ubsystem.
he hybrid node fo
de for ostrich hat
ntroller reads en turns the sectuators with
ox, by sensinge mechanical is shown in figstrich hatcheryode and the samge by using 9V
r actuators anee-Phase indunode consists
r ostrich hatchery
chery
environment ensor OFF bythis node, th
g the environrelay circuitsgure 6. The fu
ry box. Commame module isV AC adaptor
and accordinguction motor, d of actuator s
y
data from y applying is node is
nment and . As in all unction of
munication used also
r. Figure 7
g to Farm depending subsystem
Laith Ali Abdul-Rahaim et al. / International Journal of Computer Science & Engineering Technology (IJCSET)
ISSN : 2229-3345 Vol. 6 No. 03 Mar 2015 128
1
This condrainage water levheavy mosend cont
It shoulddecreasesto turn th
1
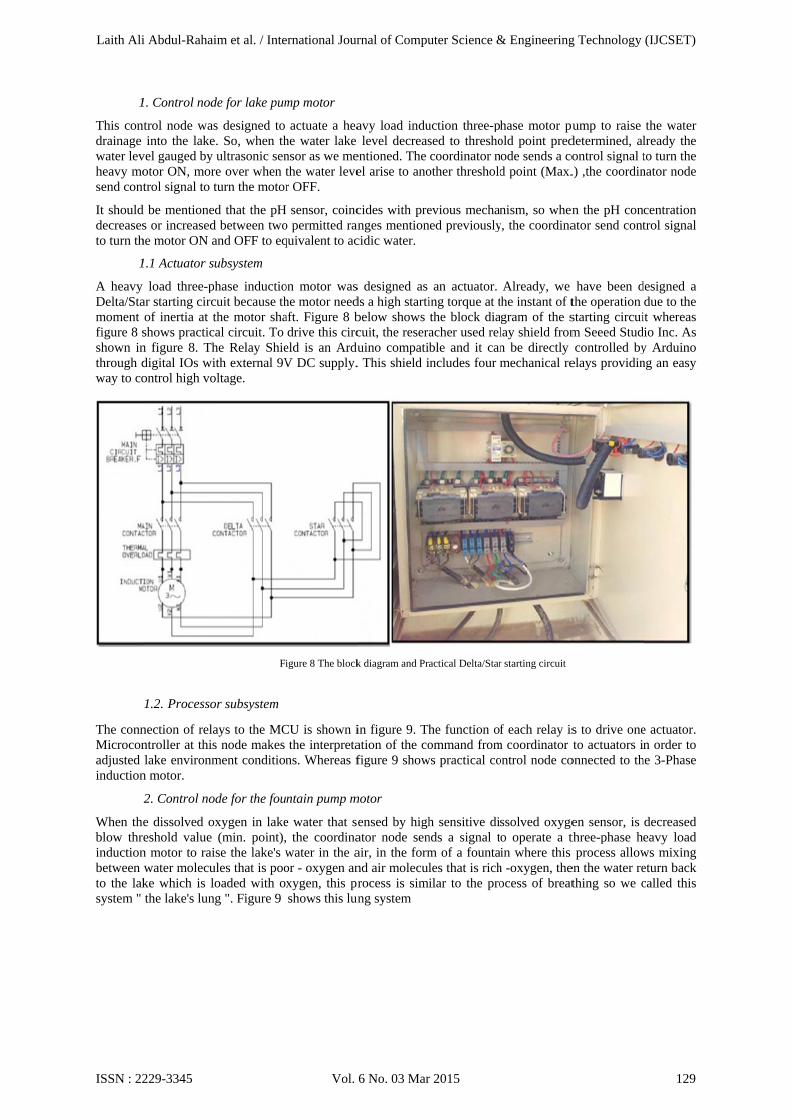
A heavy Delta/Stamoment figure 8 sshown inthrough dway to co
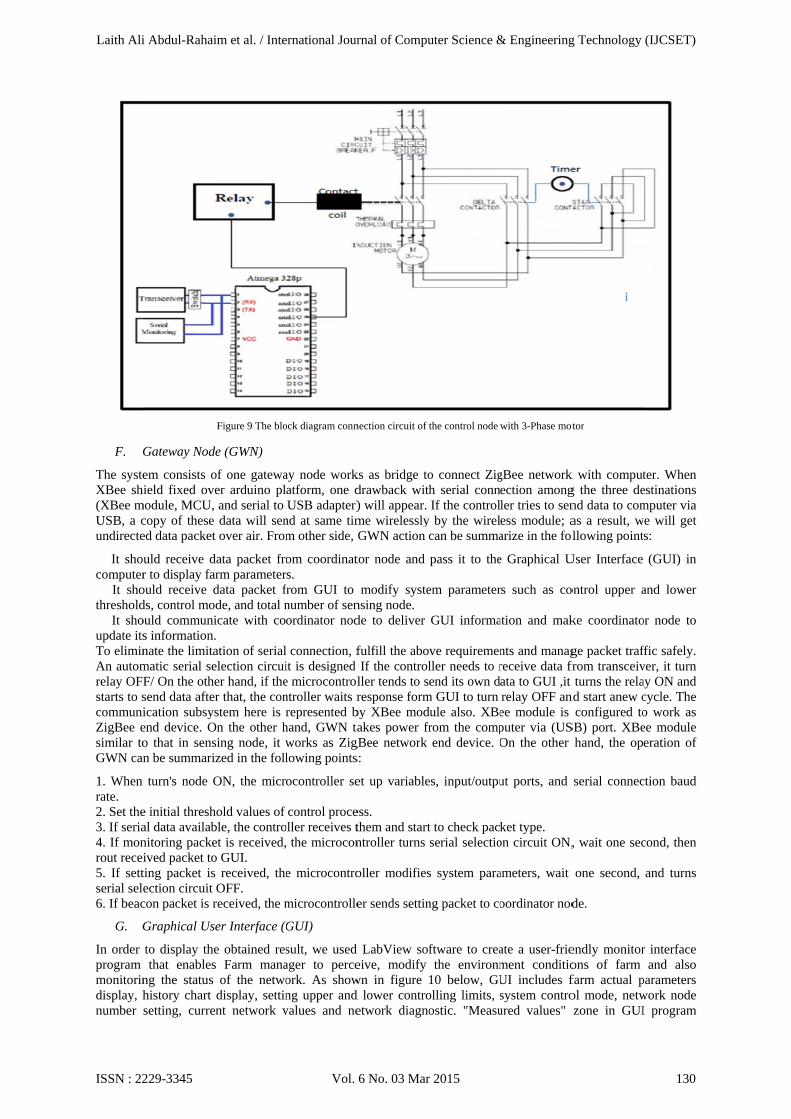
The connMicroconadjusted induction
When thblow thrinductionbetween to the laksystem "
1. Control nod
ntrol node wasinto the lake
vel gauged by otor ON, mortrol signal to t
d be mentiones or increased
he motor ON a
1.1 Actuator su
load three-par starting circof inertia at tshows practicn figure 8. Thdigital IOs wiontrol high vo
1.2. Processo
nection of relantroller at thislake environm
n motor.
2. Control no
e dissolved oeshold value
n motor to raiwater molecuke which is lthe lake's lun
de for lake pum
s designed to e. So, when th
ultrasonic senre over when tturn the motor
d that the pHd between twoand OFF to eq
ubsystem
hase inductiocuit because ththe motor shaal circuit. To he Relay Shieith external 9Voltage.
or subsystem
ays to the MCs node makes ment condition
ode for the fou
xygen in lake(min. point),
ise the lake's wules that is poooaded with og ". Figure 9
Fi
mp motor
actuate a heahe water lake nsor as we methe water lever OFF.
H sensor, coinco permitted ranquivalent to ac
on motor washe motor needaft. Figure 8 bdrive this circ
eld is an ArduV DC supply.
CU is shown ithe interpreta
ns. Whereas f
ntain pump m
e water that s the coordinawater in the aor - oxygen anxygen, this prshows this lun
igure 8 The block
avy load indulevel decreas
entioned. The el arise to ano
cides with preanges mentioncidic water.
s designed as ds a high startibelow shows cuit, the reserauino compatib. This shield i
in figure 9. Thation of the cofigure 9 show
motor
ensed by highator node senair, in the formnd air moleculrocess is simi
ung system
k diagram and Pr
uction three-psed to threshocoordinator n
other threshold
evious mechanned previously
an actuator. ing torque at tthe block diaacher used relble and it canincludes four m
he function oommand from
ws practical co
h sensitive dinds a signal tm of a fountales that is richilar to the pro
actical Delta/Star
hase motor puold point predode sends a cod point (Max.
nism, so wheny, the coordina
Already, we the instant of tgram of the slay shield fromn be directly mechanical re
f each relay ism coordinator ontrol node co
ssolved oxygeo operate a tin where this
h -oxygen, theocess of breat
r starting circuit
ump to raise determined, alontrol signal t.) ,the coordin
n the pH conator send cont
have been dthe operation starting circuim Seeed Studcontrolled by
elays providin
s to drive oneto actuators in
onnected to th
en sensor, is three-phase hprocess allow
en the water rething so we c
the water lready the to turn the nator node
centration trol signal
designed a due to the it whereas
dio Inc. As y Arduino ng an easy
e actuator. n order to
he 3-Phase
decreased eavy load ws mixing eturn back called this
Laith Ali Abdul-Rahaim et al. / International Journal of Computer Science & Engineering Technology (IJCSET)
ISSN : 2229-3345 Vol. 6 No. 03 Mar 2015 129
F.
The systeXBee sh(XBee mUSB, a cundirecte
It shocomputer It shothreshold It shoupdate itsTo eliminAn automrelay OFFstarts to scommuniZigBee esimilar toGWN can
1. When rate. 2. Set the3. If seria4. If monrout rece5. If settserial sel6. If beac
G. G
In order program monitorindisplay, hnumber
Gateway Nod
em consists ohield fixed ovmodule, MCU,copy of these ed data packet
uld receive dr to display faould receive dds, control moould communis information.nate the limitamatic serial seF/ On the othsend data afteication subsyend device. Oo that in sensn be summari
turn's node O
e initial threshal data availabnitoring packeived packet toting packet isection circuit con packet is r
Graphical Us
to display thethat enables
ng the status history chart setting, curre
de (GWN)
of one gatewaer arduino pl and serial to data will sen
t over air. From
data packet froarm parameterdata packet f
ode, and total nicate with co. ation of serialelection circuier hand, if the
er that, the constem here is r
On the other hsing node, it wized in the foll
ON, the micr
hold values of ble, the controet is received,o GUI. s received, theOFF. received, the m
ser Interface (
e obtained ress Farm mana
of the netwodisplay, settin
ent network v
Figure 9 The blo
ay node workatform, one dUSB adapter)
nd at same timm other side, G
om coordinatrs. from GUI to number of senordinator nod
l connection, fit is designede microcontrolntroller waits rrepresented b
hand, GWN taworks as ZigBlowing points
ocontroller se
control proceoller receives t the microcon
e microcontro
microcontrolle
(GUI)
sult, we used ager to perceork. As showng upper and values and ne
ock diagram conn
ks as bridge todrawback with) will appear. me wirelesslyGWN action c
tor node and
modify systensing node. de to deliver
fulfill the aboIf the control
ller tends to sresponse form
by XBee modakes power fr
gBee network s:
et up variable
ess. them and startntroller turns
oller modifies
er sends settin
LabView sofeive, modify wn in figure d lower controetwork diagno
nection circuit of
o connect Zigh serial connIf the control
y by the wirelcan be summa
pass it to the
em parameter
GUI informa
ve requiremenller needs to rend its own d
m GUI to turn dule also. XBefrom the comp
end device. O
es, input/outpu
t to check packserial selectio
s system para
ng packet to co
ftware to creathe environm
10 below, GUolling limits, sostic. "Measu
the control node
gBee network ection amongler tries to seness module; aarize in the fol
e Graphical U
rs such as co
ation and mak
nts and managreceive data frata to GUI ,it relay OFF anee module is puter via (USOn the other
ut ports, and
ket type. on circuit ON,
ameters, wait
oordinator nod
ate a user-friement conditioUI includes fsystem controured values"
with 3-Phase mot
k with computg the three dend data to comas a result, wllowing point
User Interface
ontrol upper a
ke coordinato
ge packet traffrom transceiv
turns the reland start anew c
configured toSB) port. XBe
hand, the op
serial connec
, wait one sec
one second,
de.
endly monitorons of farm farm actual pol mode, netwzone in GUI
otor
ter. When estinations mputer via
we will get s:
(GUI) in
and lower
or node to
ffic safely. ver, it turn ay ON and cycle. The o work as ee module eration of
ction baud
cond, then
and turns
r interface and also
parameters work node I program
Laith Ali Abdul-Rahaim et al. / International Journal of Computer Science & Engineering Technology (IJCSET)
ISSN : 2229-3345 Vol. 6 No. 03 Mar 2015 130
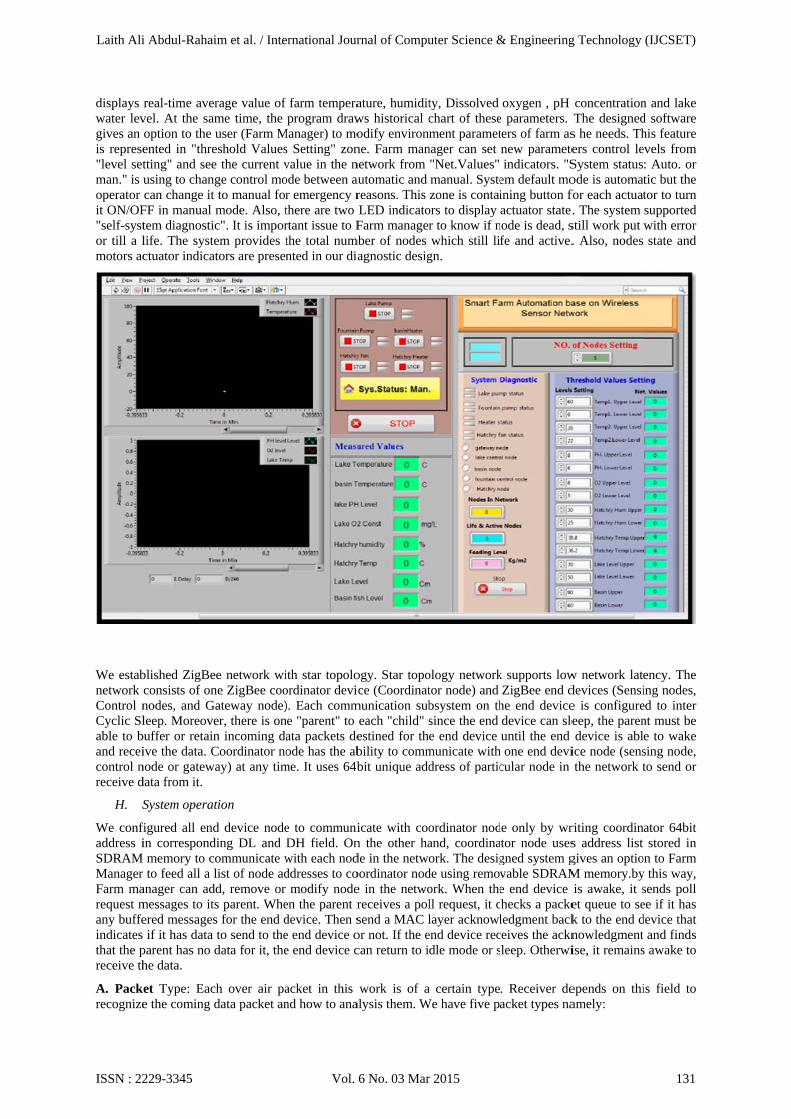
displays water levgives an is represe"level setman." is operator it ON/OF"self-systor till a lmotors ac
We estabnetwork Control nCyclic Slable to band receicontrol nreceive d
H. S
We confaddress iSDRAM Manager Farm marequest many buffeindicates that the preceive th
A. Packrecognize
real-time avervel. At the samoption to the ented in "thretting" and seeusing to chancan change it
FF in manual tem diagnostilife. The systectuator indica
blished ZigBeconsists of onnodes, and Gleep. Moreove
buffer or retainive the data. C
node or gatewdata from it.
System operat
figured all endin correspond memory to c
r to feed all a lanager can admessages to itered messages if it has data
parent has no dhe data.
ket Type: Eace the coming d
rage value of me time, the user (Farm M
eshold Valuese the current vge control moto manual formode. Also, tc". It is imporem provides t
ators are presen
ee network wine ZigBee coo
Gateway node)er, there is onn incoming daCoordinator no
way) at any tim
tion
d device nodeding DL and ommunicate wlist of node ad
dd, remove or s parent. Whes for the end dto send to thedata for it, the
ch over air padata packet an
f farm temperaprogram draw
Manager) to mos Setting" zonvalue in the node between aur emergency rthere are two rtant issue to Fthe total numbnted in our dia
ith star topoloordinator devi). Each commne "parent" to ata packets deode has the ab
me. It uses 64b
e to communiDH field. Onwith each nodddresses to co
modify nodeen the parent rdevice. Then se end device oe end device c
acket in this nd how to ana
Figure 10
ature, humiditws historical codify environne. Farm mannetwork from automatic and reasons. This LED indicatoFarm manager
mber of nodes agnostic desig
ogy. Star topoce (Coordinat
munication subeach "child" sestined for thbility to commbit unique add
icate with coon the other hade in the netwooordinator node in the networeceives a polsend a MAC lor not. If the ecan return to i
work is of aalysis them. W
. Graphical User
ty, Dissolved chart of thesement paramet
nager can set "Net.Values" manual. Systezone is contai
ors to display r to know if nwhich still li
gn.
ology networktor node) and bsystem on thsince the end e end device
municate withdress of partic
ordinator nodand, coordinaork. The desig
de using removork. When thell request, it clayer acknowlend device recdle mode or s
a certain typeWe have five pa
Interface
oxygen , pH e parameters. ters of farm asnew parameteindicators. "S
em default moining button foactuator state.
node is dead, sfe and active.
k supports lowZigBee end d
he end devicedevice can sleuntil the end one end devi
cular node in
de only by wrator node usesgned system gvable SDRAMe end device hecks a packeledgment back
ceives the acknleep. Otherwi
. Receiver deacket types na
concentrationThe designeds he needs. Thers control leSystem statusode is automafor each actuat. The system still work put . Also, nodes
w network latdevices (Sensie is configureeep, the parendevice is abl
ice node (sensthe network t
riting coordins address list gives an optioM memory.byis awake, it set queue to sek to the end dnowledgmentise, it remains
epends on thiamely:
n and lake d software his feature evels from : Auto. or tic but the tor to turn supported with error state and
ency. The ing nodes, ed to inter nt must be e to wake sing node, to send or
ator 64bit stored in
on to Farm y this way, sends poll ee if it has device that
and finds s awake to
is field to
Laith Ali Abdul-Rahaim et al. / International Journal of Computer Science & Engineering Technology (IJCSET)
ISSN : 2229-3345 Vol. 6 No. 03 Mar 2015 131
i. Beacon packet: It sends from coordinator node to each sensing node. This packet is used to make sensing node wake up and preform its tasks. Moreover, gateway node depends on beacon packet to send system setting packet. ii. Real-time data packet: After sensing node collects environment data, it sends the data to coordinator node using Real-time data packet. iii. Monitoring packet: This packet is directed from coordinator node to computer software (GUI) through gateway node. It is used for to monitoring the farm and system variables. iv. Control packet: it is used to hold control command to control node. v. Setting Packet: It is sent from GUI to coordinator node. It passes through gateway node it is used to set system parameters. B. System parameters: This field consists of all parameters which set by GUI such as farm parameters upper and lower levels, total number of network node and control mode. C. Control command: Control algorithms output are transferring to control and gateway nodes in this field. D. Actual data: This field contains farm environment variable values. E. Packet footer: It contain one of the two following fields: i. Node existence bit (Sensing node). ii. Active Node in the network (monitoring packet). In the following points, system operation is summarized. Starting from sensing physical parameters until reaches to display farm variables and controlling actuators: a) Sensing node is responsible to collect farm environment data and send them to coordinator node. Sensing nodes must receive permission (beacon packet) from coordinator node to start collecting data and send them. b) The system starts to collect environment informations when coordinator node turns on. Once the coordinator node is active, it takes few second to establish ZigBee network and joining its child devices. c) Coordinator node depends on destination addresses stored in SDRAM memory to manage communication with other nodes. The designed system gives Farm Manager the ability to great or modify TXT file which includes node addresses in easy way. d) Coordinator node starts to load the first address which represents gateway address using AT command. After that, coordinator node sends beacon message to gateway node. Gateway will response to that packet by sending system setting packet which consists Farm Manager defined control threshold values, automatic/manual control mode and network nodes number. e) When coordinator node receives setting packet, it immediately modifies both the nodes number value in the network and the control threshold values. f) Then, coordinator node start to send series of beacon messages to different destination addresses to collect information from sensing nodes. g) While coordinator node receives the response of beacons from each node, it preforms averaging process. The process includes the addition of each measured value from different sensing nodes and divided result by the total number of nodes. Our design support adaptive average value calculation. This mean, when the number of nodes changes for any reason like nodes dead, the average value still correct for active and life node only. h) After that, coordinator node read O2,pH, temperature and water level sensors voltage, make calculations and then send them to the coordinator. i) At this moment, all the information is available at the coordinator node to preform control functions. It starts to compare the average value of each parameter with its corresponding upper and lower limits which it has been set by the user. By this method, the coordinator node takes decision to turn actuator ON or OFF. j) Coordinator node checks control mode of the system. k) Coordinator node will send monitoring packet to the gateway. Gate way node routs this type of packet to computer directly. GUI will display this information to the Farm Manager. l) Control node sends control packet to control node to modify actuators status. m) Finally, coordinator node enters waiting interval. During this interval the network will be inactive. n) During waiting period, GUI response to monitor packet coming from gateway by sending back packet contains the modified values which they are set by the user. At this point the system will ready to begin new cycle.
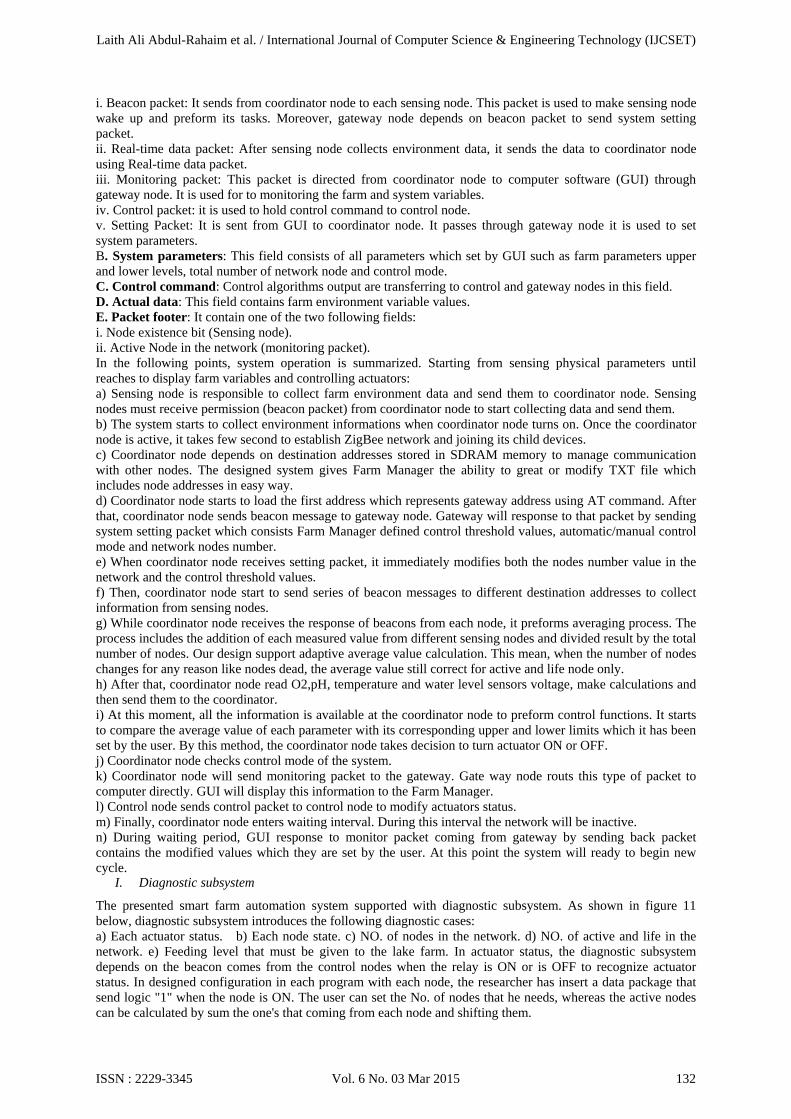
I. Diagnostic subsystem
The presented smart farm automation system supported with diagnostic subsystem. As shown in figure 11 below, diagnostic subsystem introduces the following diagnostic cases: a) Each actuator status. b) Each node state. c) NO. of nodes in the network. d) NO. of active and life in the network. e) Feeding level that must be given to the lake farm. In actuator status, the diagnostic subsystem depends on the beacon comes from the control nodes when the relay is ON or is OFF to recognize actuator status. In designed configuration in each program with each node, the researcher has insert a data package that send logic "1" when the node is ON. The user can set the No. of nodes that he needs, whereas the active nodes can be calculated by sum the one's that coming from each node and shifting them.
Laith Ali Abdul-Rahaim et al. / International Journal of Computer Science & Engineering Technology (IJCSET)
ISSN : 2229-3345 Vol. 6 No. 03 Mar 2015 132
Farm Masensing nto give re11 showsside, if gindicationindicate Ofound, bewhen thediagnosti
J. s
With the accordingand survbeen useanother nsignal thaby a hob the IP casuch as ocontinuouquantitiessolutions
K.
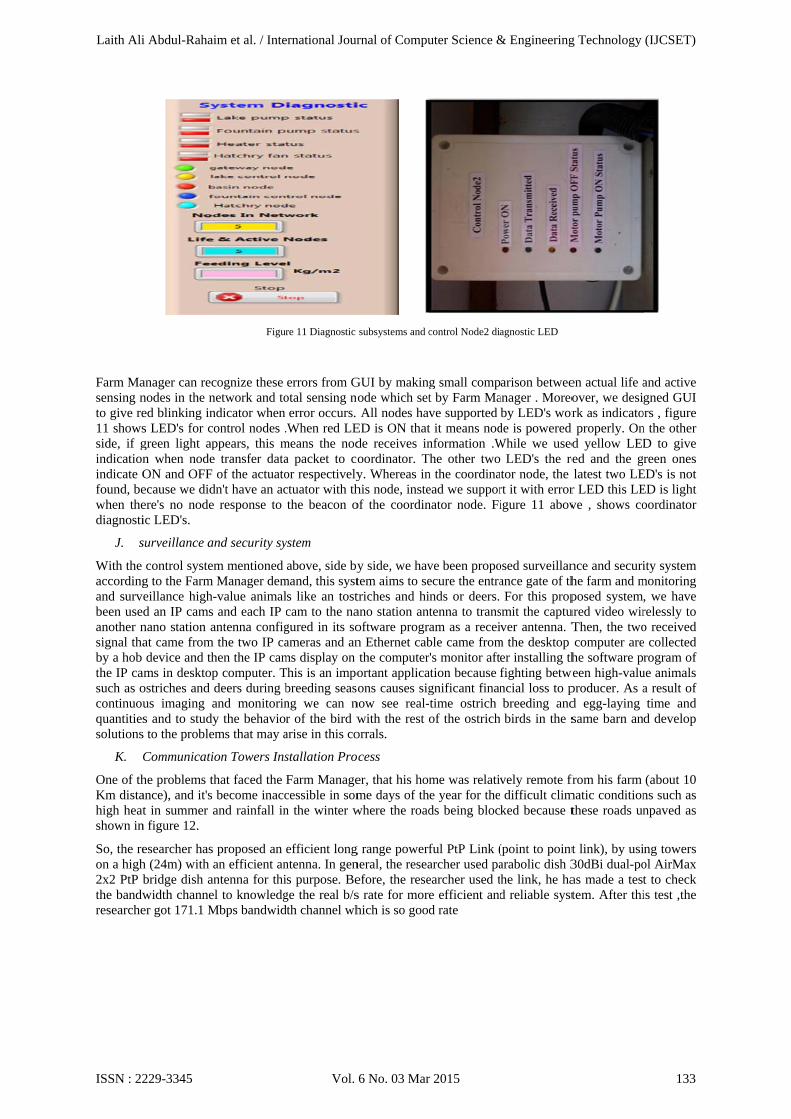
One of thKm distahigh heatshown in
So, the reon a high2x2 PtP bthe bandwresearche
anager can recnodes in the ned blinking ins LED's for cogreen light apn when nodeON and OFF ecause we didere's no node ic LED's.
surveillance an
control systemg to the Farm eillance high-d an IP cams nano station aat came from device and th
ams in desktopostriches and dus imaging as and to study
s to the proble
Communicatio
he problems thance), and it's t in summer a
n figure 12.
esearcher has h (24m) with abridge dish anwidth channeer got 171.1 M
cognize these network and tondicator when ontrol nodes .ppears, this me transfer data
of the actuatodn't have an ac
response to
nd security sy
m mentioned Manager dem
-value animaland each IP c
antenna configthe two IP ca
hen the IP camp computer. Tdeers during band monitoriny the behavioms that may a
on Towers Ins
hat faced the become inacc
and rainfall in
proposed an an efficient anntenna for thil to knowledg
Mbps bandwid
Figur
errors from Gotal sensing noerror occurs.
.When red LEmeans the noda packet to coor respectivelyctuator with ththe beacon o
ystem
above, side bymand, this systls like an tostcam to the nagured in its soameras and anms display on This is an impobreeding seasong we can nr of the bird warise in this co
stallation Pro
Farm Managecessible in somn the winter w
efficient long ntenna. In genis purpose. Bege the real b/sdth channel wh
re 11 Diagnostic
GUI by makinode which setAll nodes hav
ED is ON thatde receives inoordinator. Ty. Whereas inhis node, insteof the coordin
y side, we havtem aims to setriches and hiano station anoftware progrn Ethernet cabthe computerortant applicaons causes sig
now see real-with the rest orrals.
cess
er, that his homme days of thwhere the road
g range powerfneral, the reseaefore, the reses rate for morhich is so good
subsystems and c
g small compt by Farm Mave supported t it means nodnformation .W
The other twon the coordinaead we suppornator node. Fi
ve been propoecure the entrainds or deers.tenna to transam as a receible came fromr's monitor aftation because gnificant finan-time ostrich of the ostrich
me was relative year for theds being bloc
ful PtP Link (archer used paearcher used te efficient andd rate
control Node2 dia
arison betweeanager . Moreoby LED's wor
de is powered While we used
LED's the reator node, the rt it with errorigure 11 abov
osed surveillanance gate of thFor this prop
smit the captuver antenna. T
m the desktop er installing thfighting betwencial loss to pbreeding andbirds in the s
vely remote frdifficult clim
ked because t
(point to pointarabolic dish 3he link, he had reliable syst
agnostic LED
en actual life aover, we desirk as indicato
d properly. Ond yellow LED
red and the glatest two LE
r LED this LEve , shows co
nce and securihe farm and mposed system
ured video wirThen, the twocomputer arehe software p
ween high-valuproducer. As ad egg-laying same barn an
from his farm matic conditionthese roads un
t link), by usi30dBi dual-poas made a testtem. After thi
and active gned GUI
ors , figure n the other D to give reen ones
ED's is not ED is light oordinator
ity system monitoring , we have relessly to o received e collected rogram of
ue animals a result of time and
d develop
(about 10 ns such as npaved as
ing towers ol AirMax t to check is test ,the
Laith Ali Abdul-Rahaim et al. / International Journal of Computer Science & Engineering Technology (IJCSET)
ISSN : 2229-3345 Vol. 6 No. 03 Mar 2015 133
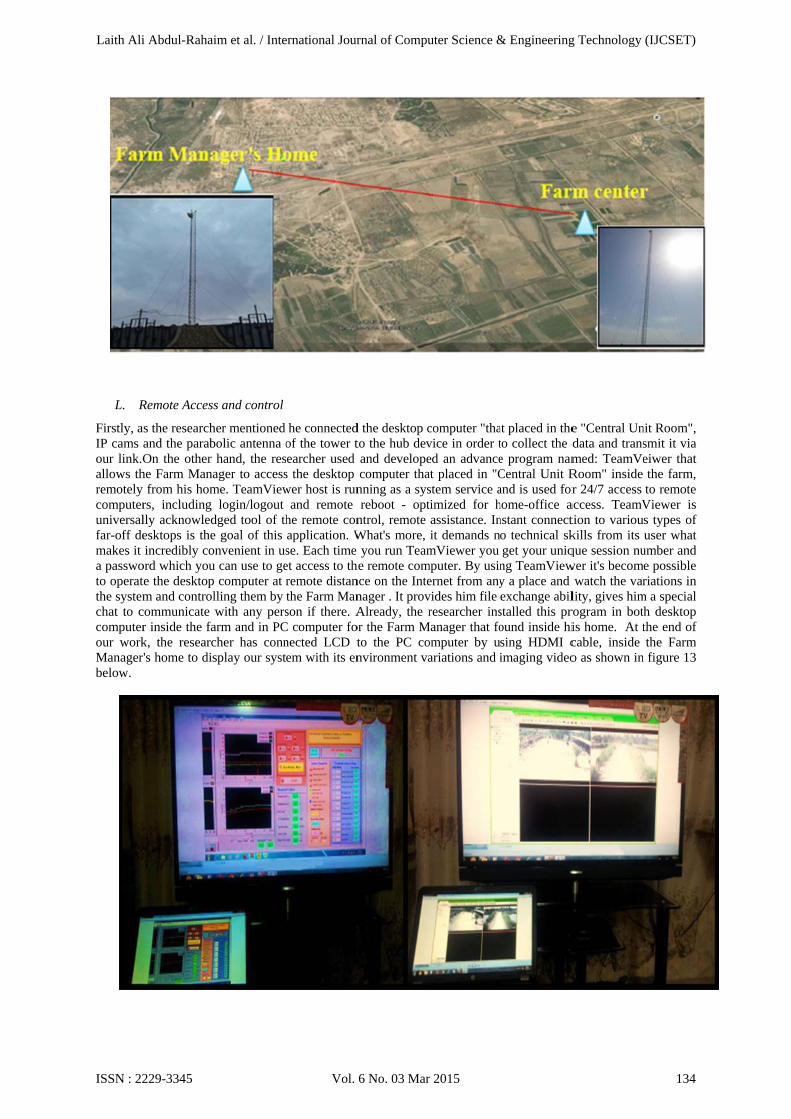
L. R
Firstly, aIP cams our link.Oallows thremotely computeruniversalfar-off demakes it a passwoto operatthe systemchat to ccomputerour workManagerbelow.
Remote Access
as the researchand the parabOn the other
he Farm Mana from his homrs, including lly acknowledesktops is theincredibly co
ord which youte the desktop m and control
communicate r inside the fak, the researcr's home to dis
s and control
her mentioned bolic antenna o
hand, the resager to accessme. TeamView
login/logout dged tool of the goal of this nvenient in us
u can use to ge computer at rlling them by with any pers
arm and in PCcher has connsplay our syst
Figure 12 Positio
Figure 13 s
he connectedof the tower t
searcher used s the desktop wer host is run
and remote he remote conapplication. Wse. Each time et access to thremote distanthe Farm Manson if there. A
C computer fonected LCD tem with its en
oning process of
hows received fa
d the desktop cto the hub devand developecomputer tha
nning as a sysreboot - opt
ntrol, remote What's more,
you run Teamhe remote comnce on the Intenager . It provAlready, the r
or the Farm Mto the PC convironment va
the farm manage
arm data to the far
computer "thavice in order ted an advanceat placed in "Cstem service atimized for hassistance. Init demands n
mViewer you mputer. By usinernet from anyvides him file researcher ins
Manager that foomputer by uariations and i
r's home and the
rm manager's hom
at placed in theto collect the de program namCentral Unit Rand is used forhome-office anstant connecto technical skget your uniq
ng TeamViewy a place and exchange abilstalled this pround inside hising HDMI cimaging video
farm in Google m
me displayed on L
e "Central Undata and transmed: TeamVeRoom" inside r 24/7 access
access. TeamVtion to varioukills from its que session nuwer it's becom
watch the varlity, gives himrogram in botis home. At tcable, inside o as shown in
map
LCD
nit Room", smit it via eiwer that the farm, to remote
Viewer is s types of user what
umber and e possible riations in
m a special h desktop the end of the Farm
n figure 13
Laith Ali Abdul-Rahaim et al. / International Journal of Computer Science & Engineering Technology (IJCSET)
ISSN : 2229-3345 Vol. 6 No. 03 Mar 2015 134
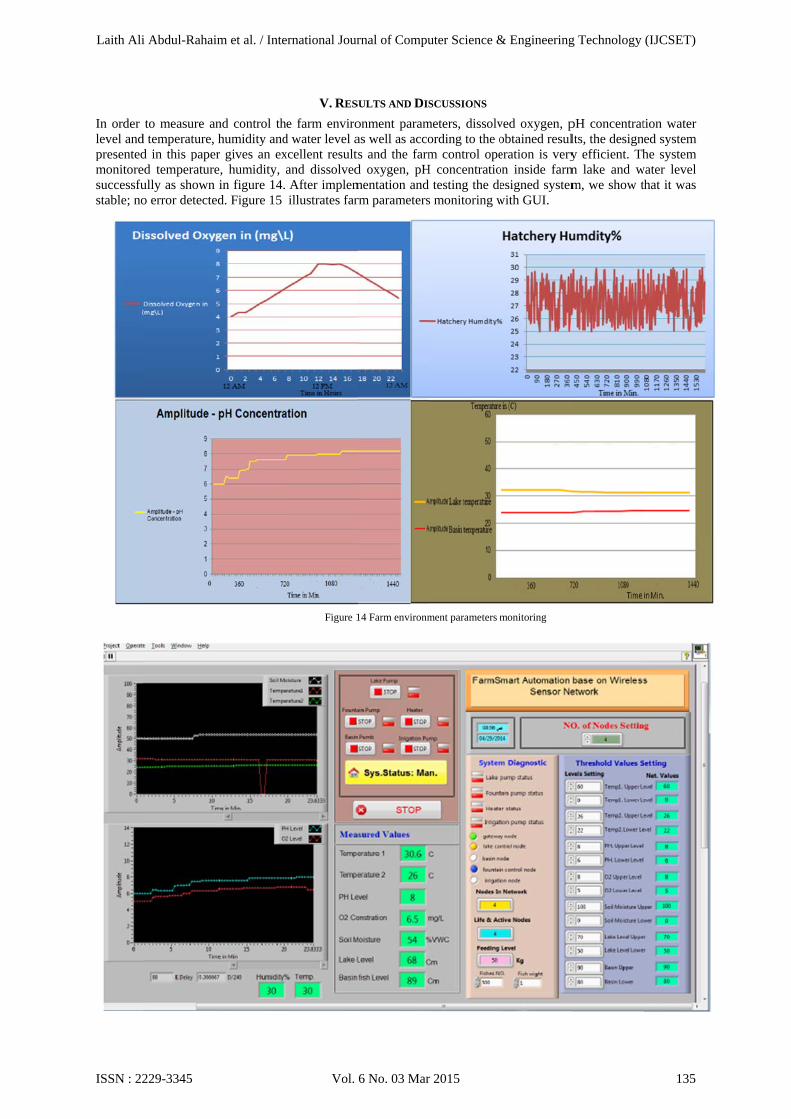
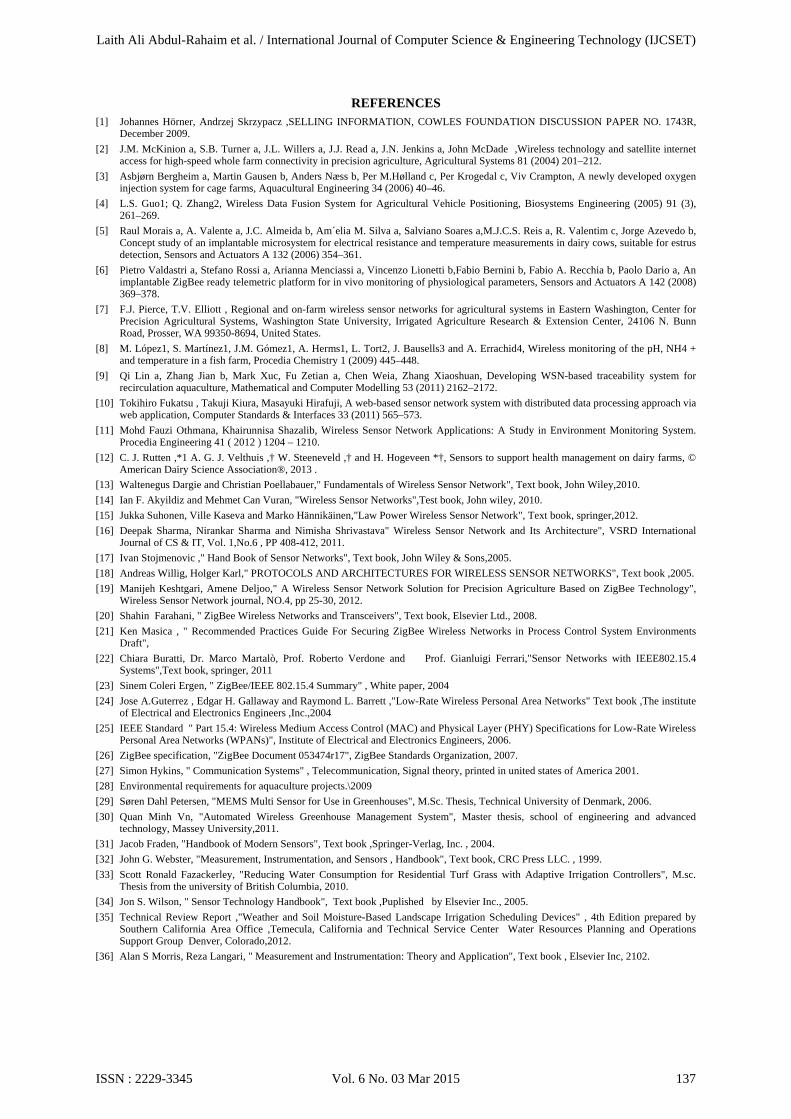
In order level andpresentedmonitoresuccessfustable; no
to measure ad temperature,d in this papeed temperatureully as showno error detecte
and control th humidity and
er gives an exe, humidity,
n in figure 14. ed. Figure 15
Fi
V. RES
e farm envirod water level axcellent resultand dissolvedAfter implemillustrates far
igure 15 Farm env
Figure 1
SULTS AND DIS
onment paramas well as accots and the farmd oxygen, pHmentation andrm parameters
nvironment param
14 Farm environm
SCUSSIONS
meters, dissolvording to the om control ope
H concentratiotesting the de
s monitoring w
meters monitoring
ment parameters m
ved oxygen, pobtained resuleration is veryon inside farmesigned systemwith GUI.
in GUI
monitoring
pH concentratlts, the designy efficient. Th
m lake and wm, we show t
tion water ed system he system
water level that it was
Laith Ali Abdul-Rahaim et al. / International Journal of Computer Science & Engineering Technology (IJCSET)
ISSN : 2229-3345 Vol. 6 No. 03 Mar 2015 135
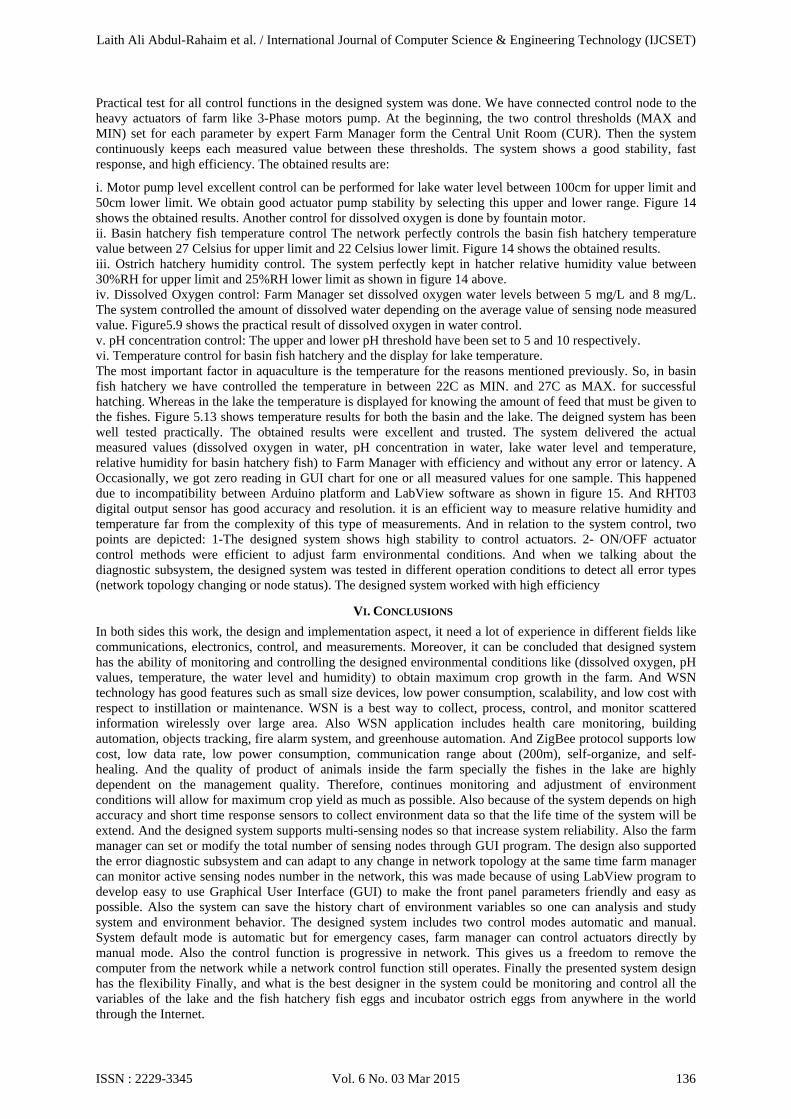
Practical test for all control functions in the designed system was done. We have connected control node to the heavy actuators of farm like 3-Phase motors pump. At the beginning, the two control thresholds (MAX and MIN) set for each parameter by expert Farm Manager form the Central Unit Room (CUR). Then the system continuously keeps each measured value between these thresholds. The system shows a good stability, fast response, and high efficiency. The obtained results are:
i. Motor pump level excellent control can be performed for lake water level between 100cm for upper limit and 50cm lower limit. We obtain good actuator pump stability by selecting this upper and lower range. Figure 14 shows the obtained results. Another control for dissolved oxygen is done by fountain motor. ii. Basin hatchery fish temperature control The network perfectly controls the basin fish hatchery temperature value between 27 Celsius for upper limit and 22 Celsius lower limit. Figure 14 shows the obtained results. iii. Ostrich hatchery humidity control. The system perfectly kept in hatcher relative humidity value between 30%RH for upper limit and 25%RH lower limit as shown in figure 14 above. iv. Dissolved Oxygen control: Farm Manager set dissolved oxygen water levels between 5 mg/L and 8 mg/L. The system controlled the amount of dissolved water depending on the average value of sensing node measured value. Figure5.9 shows the practical result of dissolved oxygen in water control. v. pH concentration control: The upper and lower pH threshold have been set to 5 and 10 respectively. vi. Temperature control for basin fish hatchery and the display for lake temperature. The most important factor in aquaculture is the temperature for the reasons mentioned previously. So, in basin fish hatchery we have controlled the temperature in between 22C as MIN. and 27C as MAX. for successful hatching. Whereas in the lake the temperature is displayed for knowing the amount of feed that must be given to the fishes. Figure 5.13 shows temperature results for both the basin and the lake. The deigned system has been well tested practically. The obtained results were excellent and trusted. The system delivered the actual measured values (dissolved oxygen in water, pH concentration in water, lake water level and temperature, relative humidity for basin hatchery fish) to Farm Manager with efficiency and without any error or latency. A Occasionally, we got zero reading in GUI chart for one or all measured values for one sample. This happened due to incompatibility between Arduino platform and LabView software as shown in figure 15. And RHT03 digital output sensor has good accuracy and resolution. it is an efficient way to measure relative humidity and temperature far from the complexity of this type of measurements. And in relation to the system control, two points are depicted: 1-The designed system shows high stability to control actuators. 2- ON/OFF actuator control methods were efficient to adjust farm environmental conditions. And when we talking about the diagnostic subsystem, the designed system was tested in different operation conditions to detect all error types (network topology changing or node status). The designed system worked with high efficiency
VI. CONCLUSIONS
In both sides this work, the design and implementation aspect, it need a lot of experience in different fields like communications, electronics, control, and measurements. Moreover, it can be concluded that designed system has the ability of monitoring and controlling the designed environmental conditions like (dissolved oxygen, pH values, temperature, the water level and humidity) to obtain maximum crop growth in the farm. And WSN technology has good features such as small size devices, low power consumption, scalability, and low cost with respect to instillation or maintenance. WSN is a best way to collect, process, control, and monitor scattered information wirelessly over large area. Also WSN application includes health care monitoring, building automation, objects tracking, fire alarm system, and greenhouse automation. And ZigBee protocol supports low cost, low data rate, low power consumption, communication range about (200m), self-organize, and self-healing. And the quality of product of animals inside the farm specially the fishes in the lake are highly dependent on the management quality. Therefore, continues monitoring and adjustment of environment conditions will allow for maximum crop yield as much as possible. Also because of the system depends on high accuracy and short time response sensors to collect environment data so that the life time of the system will be extend. And the designed system supports multi-sensing nodes so that increase system reliability. Also the farm manager can set or modify the total number of sensing nodes through GUI program. The design also supported the error diagnostic subsystem and can adapt to any change in network topology at the same time farm manager can monitor active sensing nodes number in the network, this was made because of using LabView program to develop easy to use Graphical User Interface (GUI) to make the front panel parameters friendly and easy as possible. Also the system can save the history chart of environment variables so one can analysis and study system and environment behavior. The designed system includes two control modes automatic and manual. System default mode is automatic but for emergency cases, farm manager can control actuators directly by manual mode. Also the control function is progressive in network. This gives us a freedom to remove the computer from the network while a network control function still operates. Finally the presented system design has the flexibility Finally, and what is the best designer in the system could be monitoring and control all the variables of the lake and the fish hatchery fish eggs and incubator ostrich eggs from anywhere in the world through the Internet.
Laith Ali Abdul-Rahaim et al. / International Journal of Computer Science & Engineering Technology (IJCSET)
ISSN : 2229-3345 Vol. 6 No. 03 Mar 2015 136
REFERENCES [1] Johannes Hörner, Andrzej Skrzypacz ,SELLING INFORMATION, COWLES FOUNDATION DISCUSSION PAPER NO. 1743R,
December 2009.
[2] J.M. McKinion a, S.B. Turner a, J.L. Willers a, J.J. Read a, J.N. Jenkins a, John McDade ,Wireless technology and satellite internet access for high-speed whole farm connectivity in precision agriculture, Agricultural Systems 81 (2004) 201–212.
[3] Asbjørn Bergheim a, Martin Gausen b, Anders Næss b, Per M.Hølland c, Per Krogedal c, Viv Crampton, A newly developed oxygen injection system for cage farms, Aquacultural Engineering 34 (2006) 40–46.
[4] L.S. Guo1; Q. Zhang2, Wireless Data Fusion System for Agricultural Vehicle Positioning, Biosystems Engineering (2005) 91 (3), 261–269.
[5] Raul Morais a, A. Valente a, J.C. Almeida b, Am´elia M. Silva a, Salviano Soares a,M.J.C.S. Reis a, R. Valentim c, Jorge Azevedo b, Concept study of an implantable microsystem for electrical resistance and temperature measurements in dairy cows, suitable for estrus detection, Sensors and Actuators A 132 (2006) 354–361.
[6] Pietro Valdastri a, Stefano Rossi a, Arianna Menciassi a, Vincenzo Lionetti b,Fabio Bernini b, Fabio A. Recchia b, Paolo Dario a, An implantable ZigBee ready telemetric platform for in vivo monitoring of physiological parameters, Sensors and Actuators A 142 (2008) 369–378.
[7] F.J. Pierce, T.V. Elliott , Regional and on-farm wireless sensor networks for agricultural systems in Eastern Washington, Center for Precision Agricultural Systems, Washington State University, Irrigated Agriculture Research & Extension Center, 24106 N. Bunn Road, Prosser, WA 99350-8694, United States.
[8] M. López1, S. Martínez1, J.M. Gómez1, A. Herms1, L. Tort2, J. Bausells3 and A. Errachid4, Wireless monitoring of the pH, NH4 + and temperature in a fish farm, Procedia Chemistry 1 (2009) 445–448.
[9] Qi Lin a, Zhang Jian b, Mark Xuc, Fu Zetian a, Chen Weia, Zhang Xiaoshuan, Developing WSN-based traceability system for recirculation aquaculture, Mathematical and Computer Modelling 53 (2011) 2162–2172.
[10] Tokihiro Fukatsu , Takuji Kiura, Masayuki Hirafuji, A web-based sensor network system with distributed data processing approach via web application, Computer Standards & Interfaces 33 (2011) 565–573.
[11] Mohd Fauzi Othmana, Khairunnisa Shazalib, Wireless Sensor Network Applications: A Study in Environment Monitoring System. Procedia Engineering 41 ( 2012 ) 1204 – 1210.
[12] C. J. Rutten ,*1 A. G. J. Velthuis ,† W. Steeneveld ,† and H. Hogeveen *†, Sensors to support health management on dairy farms, © American Dairy Science Association®, 2013 .
[13] Waltenegus Dargie and Christian Poellabauer," Fundamentals of Wireless Sensor Network", Text book, John Wiley,2010.
[14] Ian F. Akyildiz and Mehmet Can Vuran, "Wireless Sensor Networks",Test book, John wiley, 2010.
[15] Jukka Suhonen, Ville Kaseva and Marko Hännikäinen,"Law Power Wireless Sensor Network", Text book, springer,2012.
[16] Deepak Sharma, Nirankar Sharma and Nimisha Shrivastava" Wireless Sensor Network and Its Architecture", VSRD International Journal of CS & IT, Vol. 1,No.6 , PP 408-412, 2011.
[17] Ivan Stojmenovic ," Hand Book of Sensor Networks", Text book, John Wiley & Sons,2005.
[18] Andreas Willig, Holger Karl," PROTOCOLS AND ARCHITECTURES FOR WIRELESS SENSOR NETWORKS", Text book ,2005.
[19] Manijeh Keshtgari, Amene Deljoo," A Wireless Sensor Network Solution for Precision Agriculture Based on ZigBee Technology", Wireless Sensor Network journal, NO.4, pp 25-30, 2012.
[20] Shahin Farahani, " ZigBee Wireless Networks and Transceivers", Text book, Elsevier Ltd., 2008.
[21] Ken Masica , " Recommended Practices Guide For Securing ZigBee Wireless Networks in Process Control System Environments Draft",
[22] Chiara Buratti, Dr. Marco Martalò, Prof. Roberto Verdone and Prof. Gianluigi Ferrari,"Sensor Networks with IEEE802.15.4 Systems",Text book, springer, 2011
[23] Sinem Coleri Ergen, " ZigBee/IEEE 802.15.4 Summary" , White paper, 2004
[24] Jose A.Guterrez , Edgar H. Gallaway and Raymond L. Barrett ,"Low-Rate Wireless Personal Area Networks" Text book ,The institute of Electrical and Electronics Engineers ,Inc.,2004
[25] IEEE Standard " Part 15.4: Wireless Medium Access Control (MAC) and Physical Layer (PHY) Specifications for Low-Rate Wireless Personal Area Networks (WPANs)", Institute of Electrical and Electronics Engineers, 2006.
[26] ZigBee specification, "ZigBee Document 053474r17", ZigBee Standards Organization, 2007.
[27] Simon Hykins, " Communication Systems" , Telecommunication, Signal theory, printed in united states of America 2001.
[28] Environmental requirements for aquaculture projects.\2009
[29] Søren Dahl Petersen, "MEMS Multi Sensor for Use in Greenhouses", M.Sc. Thesis, Technical University of Denmark, 2006.
[30] Quan Minh Vn, "Automated Wireless Greenhouse Management System", Master thesis, school of engineering and advanced technology, Massey University,2011.
[31] Jacob Fraden, "Handbook of Modern Sensors", Text book ,Springer-Verlag, Inc. , 2004.
[32] John G. Webster, "Measurement, Instrumentation, and Sensors , Handbook", Text book, CRC Press LLC. , 1999.
[33] Scott Ronald Fazackerley, "Reducing Water Consumption for Residential Turf Grass with Adaptive Irrigation Controllers", M.sc. Thesis from the university of British Columbia, 2010.
[34] Jon S. Wilson, " Sensor Technology Handbook", Text book ,Puplished by Elsevier Inc., 2005.
[35] Technical Review Report ,"Weather and Soil Moisture-Based Landscape Irrigation Scheduling Devices" , 4th Edition prepared by Southern California Area Office ,Temecula, California and Technical Service Center Water Resources Planning and Operations Support Group Denver, Colorado,2012.
[36] Alan S Morris , Reza Langari, " Measurement and Instrumentation: Theory and Application", Text book , Elsevier Inc, 2102.
Laith Ali Abdul-Rahaim et al. / International Journal of Computer Science & Engineering Technology (IJCSET)
ISSN : 2229-3345 Vol. 6 No. 03 Mar 2015 137