remote sensing the plasmasphere, plasmapause, … sensing the plasmasphere, plasmapause, ......
TRANSCRIPT
Remote sensing the plasmasphere, plasmapause, plumes and otherfeatures using ground-based magnetometers
Frederick Menk1,*, Zoë Kale2, Murray Sciffer1, Peter Robinson1, Colin Waters1, Russell Grew1, Mark Clilverd3,
and Ian Mann2
1 School of Mathematical and Physical Sciences, University of Newcastle, Callaghan, NSW 2308 Australia*Corresponding author: [email protected]
2 Physics Department, University of Alberta, Edmonton, Alberta T6G2J1, Canada3 British Antarctic Survey, High Cross, Cambridge CB3 0ET, UK
Received 15 April 2014 / Accepted 1 October 2014
ABSTRACT
The plasmapause is a highly dynamic boundary between different magnetospheric particle populations and convection regimes.Some of the most important space weather processes involve wave-particle interactions in this region, but wave properties mayalso be used to remote sense the plasmasphere and plasmapause, contributing to plasmasphere models. This paper discusses theuse of existing ground magnetometer arrays for such remote sensing. Using case studies we illustrate measurement ofplasmapause location, shape and movement during storms; refilling of flux tubes within and outside the plasmasphere; storm-timeincrease in heavy ion concentration near the plasmapause; and detection and mapping of density irregularities near theplasmapause, including drainage plumes, biteouts and bulges. We also use a 2D MHD model of wave propagation throughthe magnetosphere, incorporating a realistic ionosphere boundary and Alfvén speed profile, to simulate ground array observationsof power and cross-phase spectra, hence confirming the signatures of plumes and other density structures.
Key words. Magnetosphere (inner) – Plasma waves – Space weather – Monitoring – Density
1. Introduction
This paper describes methods and results for remote sensingplasmapause dynamics using existing ground magnetometerarrays. The plasmapause is one of the fundamental magneto-spheric boundaries, and separates the dense, cold (eV energy)population of the inner magnetosphere (the plasmasphere)from the low density energized ions and electrons of the outerregion. Electric fields drive plasma motion in both regions.In the inner magnetosphere closed streamlines are acted uponby the corotation electric field arising from rotation of theneutral atmosphere and lower ionosphere with Earth. In theouter magnetosphere streamlines map to the magnetopauseand tail, and plasma motion is dominated by solar windinduced convection.
The movement of plasma within the plasmasphere and theposition of the plasmapause are controlled by several factors.Neutral winds move ionospheric plasma through the geomag-netic field, generating a dynamo electric field and E · B radialdrifts of flux tubes. The ionosphere and plasmasphere are indynamic equilibrium, so field-aligned flux transfer takes placedue to pressure differentials arising from diurnal and storm-related production and loss processes. The refilling rate ofdepleted flux tubes from the ionosphere can differ for differention species (Singh & Horwitz 1992) and the O+ concentrationmay become strongly enhanced near the storm-time plasma-pause (Fraser et al. 2005). In addition, the magnetosphericdawn-to-dusk electric field may penetrate to low altitudesand drive cross-L drifts under magnetically disturbed condi-tions. In fact, the dayside plasmapause responds promptly to
over- or under-shielding associated with sudden changes inthe convection electric field, and can rapidly develop localizeddents, shoulders and other features. Studies with the Clusterspacecraft constellation have shown that density irregularities(depletions of order 20%; characteristic size 365 km but upto 5000 km) occur frequently within the plasmasphere and atthe plasmapause, especially under magnetically active condi-tions (Darrouzet et al. 2004). Enhanced convection associatedwith southward turning of the IMF Bz also triggers formationof large-scale drainage plumes which allow convective erosionof plasmaspheric plasma to the outer magnetosphere (e.g.Goldstein & Sandel 2005).
While the plasmapause demarcates different convectionregimes, it is also important for other reasons. The ring currentarises from the azimuthal motion of trapped particles in theinner magnetosphere and roughly straddles the plasmapause(Darrouzet et al. 2013). The main contributors to the currentdensity are 1–100 keV ions. The quiet time ring current isdominated by protons of both solar wind and ionospheric ori-gin, while O+ from the ionosphere becomes increasinglyimportant with increasing geomagnetic activity, dominatingthe ring current during large storms (Daglis et al. 1999). Ringcurrent particles are lost through collisional processes andpitch angle diffusion by plasma waves, particularly electromag-netic ion-cyclotron (EMIC) waves and magnetosonic whistlermode waves including VLF chorus just outside the plasma-sphere, and hiss in plumes and within the plasmasphere(Summers et al. 2007). Favoured regions for EMIC waveoccurrence are just inside the dusk plasmapause and in plumes,and particle loss timescales due to EMIC waves depend on the
J. Space Weather Space Clim., 4, A34 (2014)DOI: 10.1051/swsc/2014030� F. Menk et al., Published by EDP Sciences 2014
OPEN ACCESSRESEARCH ARTICLE – INVITED BY THE EDITORS-IN-CHIEF
This is an Open Access article distributed under the terms of the Creative Commons Attribution License (http://creativecommons.org/licenses/by/4.0),which permits unrestricted use, distribution, and reproduction in any medium, provided the original work is properly cited.

plasma ion composition. Furthermore, at storm times electronsmay be accelerated to relativistic (MeV) energies by momen-tum diffusion with chorus waves and wave-particle interactionswith 1–10 mHz waves, forming the outer radiation belt strad-dling the plasmapause. These particles pose space weather haz-ards. Thus particle populations organized around theplasmapause boundary are important participants in ring cur-rent and radiation belt dynamics.
The change in density and hence Alfvén speed at theplasmapause constitutes a boundary for plasma waves propa-gating in the magnetosphere. This has several consequences.(i) The magnetosphere is separated into outer and inner cavi-ties, able to sustain cavity mode resonances with characteristicperiods, amplitude and phase structure. (ii) Field line eigenfre-quencies exhibit a sudden change across the plasmapause.(iii) Compressional (fast) mode MHD waves propagatingEarthward, on encountering the plasmapause, can modeconvert and couple energy to the field guided Alfvén mode.(iv) Wave energy is also reflected at the plasmapause.(v) Surface wave modes and spatially localized guided poloidalmode waves may be excited at or near a steep plasmapause.(vi) The enhanced ion population near the storm-timeplasmapause favours the generation of wave-particle instabili-ties and EMIC waves, as mentioned above, and also affectsfield line eigenfrequencies. In summary, the plasmapauseexerts a profound influence on propagating ULF waves includ-ing those involved in wave-particle interactions.
Clearly there are compelling reasons for monitoring andimproving knowledge of plasmpause location and spatio-temporal behaviour. To date such information has mostly comefrom ground-based VLF observations and satellite-borne parti-cle counters, wave experiments and imagers. However, theplasmapause is a highly dynamic three-dimensional structureand these techniques each suffer limitations.
Measurements of VLF whistlers have been used to inferthe equatorial electron density and hence the plasmapauseposition for five decades (e.g. Carpenter 1963; Carpenter &Park 1973; Park et al. 1978). The whistlers are triggered bylightning and propagate along field-aligned ducts that are mostfavourably located about 1.5 RE inside the plasmapause(Walker 1978), so it is difficult to obtain simultaneous observa-tions over a range of L shells. It is widely believed that whis-tlers are mostly recorded on the ground at night, but detailedanalysis of observations from Rothera (L = 2.7) shows a pref-erence for winter months with a diurnal maximum near sunriseand occurrence throughout the day (Collier et al. 2011). Whilstbetter temporal coverage may be achieved using whistler modesignals generated by continuously operating VLF transmitters,the frequencies available restricts this technique to L � 2.7(Clilverd et al. 1991).
Satellite-borne particle detectors (e.g. Chappell et al. 1971;Horwitz et al. 1990) and plasma wave instruments (Carpenter& Anderson 1992; Moldwin et al. 2002) have been used forstatistical and case studies of electron density distributions,illustrating the position and evolution of the plasmapauseunder a range of magnetic conditions. These density profilescan be quite complicated, with regions of detached plasmaand other complex structures. The ‘‘snapshot’’ nature of singlespacecraft observations makes it difficult to monitor the evolu-tion of such features. Furthermore, spacecraft charging maybias low energy measurements from particle counters.
Using statistical whistler-derived and in situ electron den-sity data, Carpenter and Anderson (1992) developed empirical
models describing the electron density profile within theplasmasphere, across the plasmapause and in the outer magne-tosphere. The location of the plasmapause inner boundary, Lppi,over 00-15 MLT was given by
Lppi ¼ 5:6 – 0:46 Kpmax ð1Þ
where Kpmax is the maximum night-time Kp value in the pre-ceding 24 h. In order to better characterize the longitudinalasymmetry in plasmapause shape Moldwin et al. (2002) usedlinear fits to the entire CRRES in situ plasma wave databaseto propose a generalized model of the form
Lppi ¼ ðA � rAÞ þ ðB � rBÞKp ð2Þwhere A, B, rA and rB are parameters that depend on localtime. For example, for the 0900-1500 LT sector
Lppi ¼ ð5:20� 0:165Þ – ð0:425� 0:040ÞKp ð3Þand Kp is the maximum value over the previous 12 h. Suchmodels assume that Kp is related to the strength of convec-tion. Models incorporating local time effects and indicessuch as Dst and AE associated with specific current systemsmay be more appropriate predictors of the statistical plasma-pause position (O’Brien & Moldwin 2003).
Awealth of information on the two-dimensional behaviour ofthe plasmapause has come from observations of the He+ distribu-tion by imaging resonantly reflected sunlight at 30.4 nm usingEUV scanners (e.g. Yoshikawa et al. 2000; Goldstein et al.2002; Sandel et al. 2003). Features observed include semi-corotating plumes, radial ‘‘fingers’’ and ‘‘voids’’ of enhanced ordepleted density and rapid reconfiguration of the plasmapauseboundary in response to changes in the magnetospheric convec-tion electric field. The inferred outward flux of ions suggeststhe plasmasphere is a significant source of plasma to the outermagnetosphere even under magnetically quiet conditions(Yoshikawa et al. 2000). Unfortunately, such observations arenot ongoing and temporal coverage is limited to suitable orbitintervals. Furthermore, the sensitivity of the imagers (equivalentto 30–50 electrons cm�3 for the IMAGE satellite EUV experi-ment) means that only relatively dense structures are detected.
Plasma drainage plumes are a particularly important fea-ture of the outer magnetosphere. They comprise elongatedstructures of dense plasmaspheric plasma typically in the noonto dusk sector during periods of moderate to disturbed geo-magnetic activity and persisting well into recovery phases(Spasojevic et al. 2003; Moldwin et al. 2004). Plasmasphericplasma is eroded and lost to the outer magnetosphere throughplumes. Irregular internal structures within plumes are likelygrowth regions for EMIC waves (Morley et al. 2009). Compar-ison of high resolution in situ measurements from the Clusterspacecraft with IMAGE EUV observations has provideddetailed information on plume structure and motion (e.g.Darrouzet et al. 2006).
Measurements of ULF field line resonances (FLRs) withground-based magnetometers can be used to estimate the equa-torial mass density and can therefore complement and extendwhistler and spacecraft studies of the plasmapause region(e.g. Menk et al. 1999, 2004; Chi et al. 2000, 2013). The res-onances may be observed for many hours during local daytime,so with suitable ground arrays coverage can span a range of lat-itudes and longitudes. Algorithms have been developed forautomated detection of FLRs and determination of mass den-sity (Berube et al. 2003; Lichtenberger et al. 2013), achievingdetection rates of order 50% (Chi et al. 2013). Furthermore,
J. Space Weather Space Clim., 4, A34 (2014)
A34-p2

comparison of FLR-based mass density estimates with whistleror in situ electron density data (and EUV-derived He+ data ifavailable) allows intercalibration of techniques (Clilverdet al. 2003) and provides information on the heavy ion concen-tration (Berube et al. 2005; Grew et al. 2007). A plasmasphericmass density model based on extensive observations from 7ground magnetometer stations near 80� W geographic longi-tude was described by Berube et al. (2005). Averaged overall conditions this model gives
qeq Lð Þ ¼ 10�0:67Lþ5:1: ð4Þ
Ozhogin et al. (2012) presented a similar electron densitymodel which also described the field-aligned density variation.Limitations of the FLR technique include the choice of field-aligned density and magnetic field models (Berube et al.2006; Takahashi et al. 2006; Vellante & Föster 2006), experi-mental uncertainty in determining resonant frequencies, andthe lack of FLR observations at night.
It is also possible to estimate the plasma mass density fromin situ measurements of the field line eigenfrequency, and com-parison with in situ electron density data provides informationon the ion mass. A statistical study of the plasmatrough regionduring solar maximum found the average ion mass is 3.0 amubut increases with increasing geomagnetic activity (Takahashiet al. 2006). Detailed analysis of FLRs and particle measure-ments in the outer magnetosphere with the Cluster spacecraftcan provide information on the density distribution withsufficient precision that uncertainty in frequency is small(Denton et al. 2009).
Comparison of FLR-derived plasmaspheric mass densitieswith in situ electron density measurements shows that the aver-age ion mass within the plasmasphere is 1–2 amu at quiet timesbut increases with proximity to the plasmapause at disturbedtimes (Berube et al. 2005). Such heavy ion mass loading maydistort or mask the appearance of features such as the outerboundary of the plasmapause or plasma plumes when comparedwith in situ electron density measurements (Fraser et al. 2005;Takahashi et al. 2008). However, the detection of plasma drain-age plumes through comparison of ground-based FLR measure-ments of mass density with EUV images of He+ intensity wasreported by Abe et al. (2006) and Grew et al. (2007).
According to Kim et al. (2007) plasma mass density (deter-mined with ground magnetometers) does not change deepwithin the plasmasphere during a magnetic storm and plumeevent, and sunward plasma erosion via the plume is confinedto the outer layers of the plasmasphere.
It is important to realize that the plasmapause and drainageplumes are three-dimensional structures. The high-altitudeplasmapause maps to the equatorward edge of the mid-latitudeionospheric trough (Foster et al. 1978; Yizengaw & Moldwin2005). Enhanced storm-time density structures are monitoredby GPS total electron content (TEC) techniques and incoherentscatter radars and are the low altitude signatures of drainageplumes (Foster et al. 2002; Yizengaw et al. 2008).
This paper illustrates the use of ground-based measure-ments of ULF FLRs to detect and monitor changes in plasma-spheric density and the plasmapause. This is done through casestudies including comparison with satellite particle, imagingand TEC observations and numerical modelling of plasmawave propagation through the magnetosphere. Whilst groundmagnetometer measurements alone cannot provide a compre-hensive picture of the evolution of plasma features, theexistence of multiple ground arrays facilitates their use as a
monitoring tool and can provide input to suitable models ofmagnetospheric density and structure.
2. Techniques
2.1. Field line resonances
The principles behind the measurement of FLRs using groundmagnetometers are straightforward and were described inMenk et al. (1999), Waters et al. (2000, 2006) and Menk &Waters (2013). It is assumed that a spectrum of fast modeULF plasma waves within the magnetosphere couples energyto local toroidal mode standing field line eigenoscillations.The techniques are based upon identifying the changes inamplitude and phase across a resonance, best accomplishedby comparing measurements between a pair of magnetometersclosely spaced in latitude. This is illustrated in Figure 1. Thetop panel shows an idealized equatorial mass density profilebased on models described by Poulter & Allan (1986) and Car-penter & Anderson (1992). Density within the plasmasphereand plasmatrough falls off with radial distance as R�4, the innerboundary of the plasmapause is at 4.5 RE and the plasmapausewidth is 0.2 RE. A similar L-dependence in mass density wasobserved by Chi et al. (2013), while equatorial electron densitiesexhibit an L�3.07 dependence (Ozhogin et al. 2012). Filledcircles represent the projection to the equatorial plane of stationsin a hypothetical ground magnetometer array separated
Fig. 1. Model equatorial mass density profile (top) and correspondingradial variation in toroidal mode resonance frequency (bottom). Filledcircles represent projection of ground stations separated by 110 km ingeographic latitude, with A, B and C straddling the plasmapause (seetext). Dashed lines depict a plasmaspheric density trough or biteout and ahypothesized plasma drainage plume.
F. Menk et al.: Plasmapause remote sensing using magnetometer arrays
A34-p3

by 110 km in geographic latitude. This is about the optimum sta-tion separation for detecting resonance signatures (Menk et al.2004; see also discussion by Chi et al. 2013). The dashed linesrepresent a plasmaspheric density trough or biteout of the formdescribed by Carpenter et al. (2000) and a slice through ahypothesized plasma drainage plume.
The bottom panel of Figure 1 shows the correspondingtoroidal mode field line eigenfrequency profile. The smoothchange in resonance frequency within the plasmasphere andplasmatrough is readily detected as a zero crossing in theamplitude difference and a peak in cross-phase between adja-cent magnetometer stations (Waters et al. 1991). A plasma-spheric biteout and drainage plume of the form shown willproduce distinct changes in resonant frequency that should,in principle, be easily detectable.
If the equatorial mass density varies with radial distancefollowing an inverse power law R�a then for a � 8 the toroidalmode field line eigenfrequency decreases with increasing L.This is the usual case in the plasmasphere and plasmatroughand results in a particular direction for the cross-phase peakidentified at the resonant frequency between two adjacentmagnetometers.
However, if at a steep density gradient a > 8 then the senseof the cross-phase peak is reversed (Kale et al. 2007). This mayoccur where magnetometer stations straddle the plasmapause,shown by ‘‘A’’ and ‘‘B’’ in Figure 1. If a = 8 then the cross-phase signature disappears. This may also happen if thestations straddle the boundary of the plasmapause, providingan averaged, misleading sense of the variation in resonant fre-quency, as represented by points ‘‘A’’ and ‘‘C’’ joined by thehorizontal dashed lines in Figure 1. In any case, the disappear-ance of the cross-phase peak is a characteristic signature of theplasmapause and can be used to track its motion over a groundarray (Milling et al. 2001).
Mass densities presented in this paper were estimated fromthe observed FLR frequencies following the procedure outlinedin Menk et al. (1999, 2004). Magnetometer data were obtainedfrom the IMAGE, SAMNET and MEASURE arrays, and twostations on the Antarctic peninsula. IMAGE (InternationalMonitor for Auroral Geomagnetic Effects) is a 31-station digitalarray spanning Scandinavia and northern Europe, while SAM-NET (Sub Auroral Magnetometer Network) stations span theUK and Scandinavia. MEASURE is a meridional array of pairedmagnetometers along the east coast of the United States.All these arrays contribute to the SuperMAG ground magne-tometer network and database (Gjerloev 2012).
In determining the mass density we have assumed a field-aligned density distribution of the form R�3 and used a simpledipole magnetic field model. The first assumption introducesan error in density typically less than that arising from exper-imental error in determining the resonant frequency (about25%), while the second assumption leads to an overestimateof mass density that increases with increasing L value andmagnetic activity (Berube et al. 2006), being around 30% atL = 3.0 when Dst = �50 nT. In addition the asymmetry ofthe geomagnetic field leads to a longitudinal variation thatenhances mass and electron densities in December months atAmerican longitudes (Menk et al. 2012).
2.2. In situ electron densities and plasmaspheric imaging
In this study we compare mass densities derived from groundmagnetometer measurements of resonance frequencies with
in situ measurements of electron densities from the RadioPlasma Imager (RPI) experiment (Reinisch et al. 2001) onboard the IMAGE spacecraft (Burch 2003). IMAGE operatedin an elliptical polar orbit with apogee at 7.2 RE
(46,000 km), perigee at 1,000 km altitude and 14.2 h orbitalperiod. The RPI instrument is a low-power radar that alternatesbetween active and passive mode and spans the plasma reso-nance frequencies characteristic of the magnetosphere.We used data obtained from the RPI database at DartmouthUniversity for the passive mode in which the RPI received nat-ural plasma wave emissions from 3 kHz to 1.1 MHz and theelectron number density is determined (to within a few per-cent) from the upper hybrid emission band (Benson et al.2004), or from the lower edge of a range of continuum radia-tion (e.g. Goldstein et al. 2003). The densities were derivedwith an automatic fitting algorithm and manual correction.
For the studies described here we only examined RPI mea-surements from 07 to 16 MLT that were also within ±30� of themagnetic equator. Following Vellante & Föster (2006) weassumed that electron density is constant along field lines overthis latitude range. This assumption is true for diffusive equi-librium conditions and in reasonable agreement with resultsfrom a detailed study of RPI data by Ozhogin et al. (2012),although there can be considerable variation between individ-ual measurements, and somewhat steeper density gradientsmore than about ±20� off the magnetic equator.
We have also used images from the EUVexperiment on theIMAGE spacecraft, which provides line of sight measurementsof sunlight resonantly scattered at 30.4 nm from He+ ions, thusimaging the plasmasphere and related structures. These imageswere mapped to the magnetic equatorial plane as described bySandel et al. (2003).
2.3. Total electron content measurements
Information on plasmaspheric electron density can also beobtained from GPS observations. Measurements of integratedcolumnar total electron content (TEC) from dual frequencyGPS receivers either on the ground or in low Earth orbit(LEO) can be used in tomographic inversion of multiple slantTEC observations across a region (Yizengaw & Moldwin2005). The technique has been used, in conjunction withEUV imaging, to correlate the location of the mid-latitude ion-ospheric trough with the low altitude extension of the plasma-pause (Yizengaw & Moldwin 2005), to image upward field-aligned flows from the ionosphere (Yizengaw et al. 2006a)and to map plasmaspheric plumes to the ionosphere (Fosteret al. 2002; Yizengaw et al. 2006b). Here we use electron den-sity profiles obtained from tomographic construction of datafrom the GPS receiver on the Australian FedSat spacecraft,in a sun-synchronous 800 km altitude orbit in the 1,030 LTframe (Fraser 2003). The data were averaged over ±30� latitudeto obtain equatorial electron density profiles.
3. Results
3.1. Storm-time plasmaspheric density
In order to illustrate the use of magnetometer arrays to monitormass density within the plasmasphere we consider the interval9–23 December 2003, which follows a Kp = 6�,Dst = �55 nT disturbance over 5–8 December. Kp reached5+ on 10 December and 6� early on 11 December, but stayed
J. Space Weather Space Clim., 4, A34 (2014)
A34-p4
above 4 until 15 December, reaching Kp = 5� again on 20December. Dst reached a minimum of �51 nT at 20 UT on10 December.
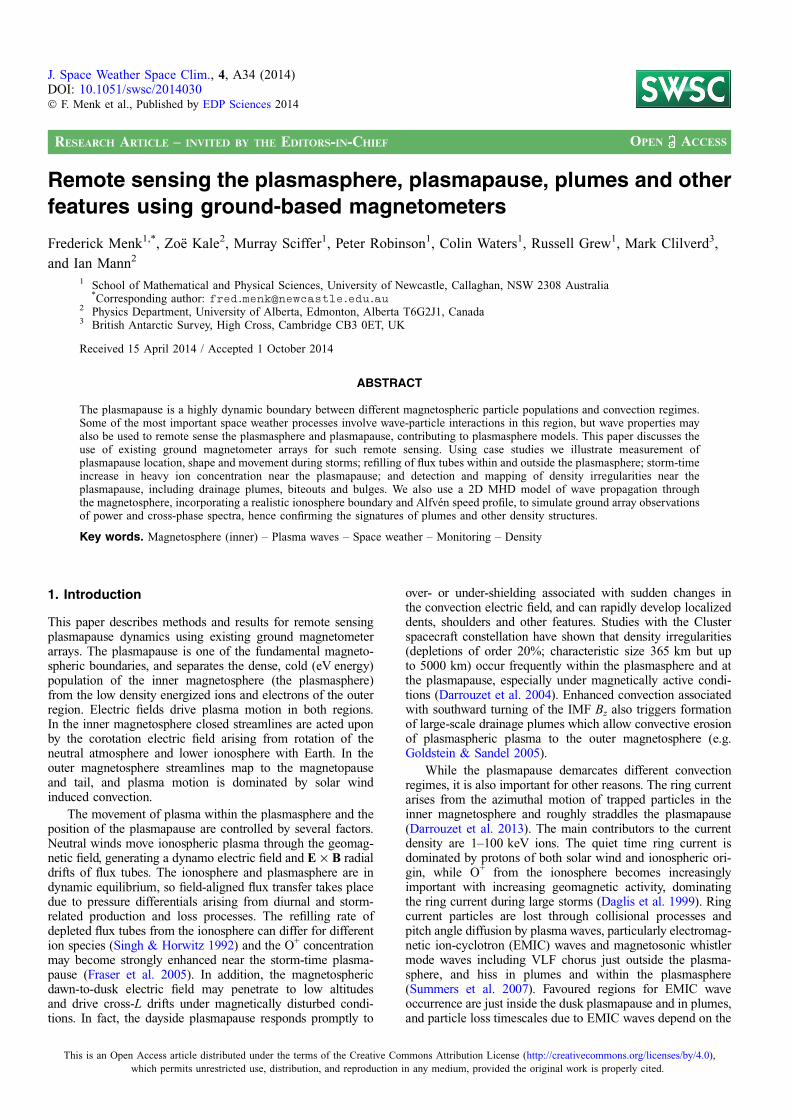
The expected plasmapause L value given by Eq. (2) for theperiod of interest is shown in Figure 2a. Mass densities wereestimated using FLR cross-phase measurements between twomagnetometer stations centred at L = 2.61 on the Antarcticpeninsula, Vernadsky and the low power magnetometer M3.Further details on these appear in Clilverd et al. (2003).The horizontal dashed line in Figure 2a identifies the midpointL value of the ground stations, which was at all times inside theexpected plasmapause.
The variation in mass density at L = 2.61 over this intervalis presented in Figure 2b, where LT � UT-4. The ordinate axisrepresents mass density in units of amu cm�3, which is thesame as the number density if the plasma contains no heavyions. Periods where Kp � 4+ are identified by solid horizontallines. The horizontal dashed line at 2245 amu cm�3 indicatesthe average expected mass density from Eq. (4). Densities arebelow this value during the moderately disturbed period over9–13 December and increase over subsequent days due torefilling from the underlying ionosphere. This is discussed fur-ther in Section 3.2. Refilling also results in the diurnal variationin density evident on 12, 13 December and after 16 December.
Unusually high density values appear in the early localmorning and late evening on some days. These may be dueto heavy ion mass loading, for example associated with an oxy-gen torus (Fraser et al. 2005; Grew et al. 2007), or quarter and
intermediate wave mode field line oscillations when there is astrong asymmetry in ionospheric conductances at conjugateends of the field line. The quarter wave modes are identifiedby open circles and occur most often in December and Junemonths at east American longitudes, resulting in greatly over-estimated mass density (Obana et al. 2008).
Crosses in Figure 2b denote electron densities obtainedfrom Doppler measurements of ducted whister-mode signalsfrom high power VLF transmitters. The VLF receiver waslocated at Rothera (L = 2.7) and densities were scaled toL = 2.61 assuming an R�3 power law. The electron densitiesare from around 02 MLT but follow similar trends to the massdensity values.
Comparing Figures 2a and 2b clearly shows that mass den-sities inside the plasmasphere can decrease significantly duringmoderately disturbed conditions. However, the pronouncedincreases in density accompanying disturbed conditions on14/15, 20 and 21 December indicate the presence of unusuallyhigh mass densities relative to the whistler-derived electrondensities.
The cross-phase spectra show unusual features on a num-ber of days. This is illustrated in Figure 3, which presentswhole-day cross-phase spectra for 11, 15, 17 and 20 December.Features of interest are: (i) almost no cross-phase signatureover all of 11 December; (ii) three cross-phase bands, withthe upper and lower frequency bands exhibiting a reversedpolarity (negative cross-phase), from 11–16 UTon 15 December;(iii) unusually low cross-phase frequency before 06 UT on 17December; (iv) a well defined, relatively low and constantfrequency cross-phase signature during enhanced magnetic activ-ity on 20 December. Point (i) suggests movement of the plasma-pause over or near the station field lines, although this is not borneout by the model prediction of plasmapause position. Feature(ii) is associated with strong density gradients, discussed inSection 3.3. Feature (iii) is due to quarter mode field line oscilla-tions, as mentioned above and (iv) relates to the high mass densi-ties also mentioned above.
Further information on plasmasphere dynamics on 15 and16 December comes from tomographic inversion of TEC datafrom the GPS receiver on the FedSat spacecraft, which on 16December passed over the Antarctic Peninsula stations around1400 UT and over New Zealand around 2230 UT. Geomag-netic activity was weakly disturbed with Kp < 3 throughoutthe day, although the equatorward boundary of the auroral ovalextended to �62o MLAT at 0 MLT and �64.6� at 12 MLT at17 UT.
The reconstructed electron density profile for the secondpass was presented and discussed in detail by Yizengawet al. (2006a) and clearly shows field-aligned low energy ionoutflow from near the cusp region. Here we focus on the elec-tron density profile for the equatorial plane for the 14 UT passover the ground magnetometer stations. This is presented inFigure 4 and shows an irregular plasmapause with the innerboundary near L = 3.6–3.8, somewhat lower than the L valuespredicted by the Moldwin et al. (2002) and O’Brien &Moldwin (2003) statistical models (L = 4.1 and L = 3.9respectively). The TEC- and VLF-derived electron densitiesat L = 2.61 are similar to the estimated mass densities.
3.2 Storm-time evolution of the plasmapause and refilling
We now consider how magnetometers can be used to investi-gate storm-time evolution of the plasmapause and subsequent
9 10 11 12 13 14 15 16 17 18 19 20 21
9 10 11 12 13 14 15 16 17 18 19 20 21
December 2003
6
5
4
3
2
L va
lue
December 2003
1E4
1E3
100
Mas
s de
nsity
, am
u cm
-3
Fig. 2. (a) Plasmapause location given by Moldwin et al. (2002)model for 9–21 December 2003. Horizontal dashed line at L = 2.61shows location of magnetometer pair midpoint. (b) Mass density atL = 2.61 over 9–21 December 2003. Solid horizontal lines indicateintervals where Kp � 4+; dashed horizontal line represents averagemass density from the Berube et al. (2005) model. Open circlesidentify likely quarter mode oscillations and crosses denote VLF-derived electron densities.
F. Menk et al.: Plasmapause remote sensing using magnetometer arrays
A34-p5

refilling. We consider the illustrative interval 7–19 March1998. General geophysical conditions are summarized in thetop panel of Figure 5. Magnetic activity was low for severaldays prior to a storm that commenced on 9 March. Peak activ-ity values were Kp = 7+ at 18–21 UT and Dst = �116 nT at20 UT, both on 10 March. Both indices recovered to lower val-ues over the next few days, with a short increase in disturbancelevels early on 15 March.
Magnetometer data were examined for all stations of theSAMNET and IMAGE ground arrays. Data were sampled at(or resampled to) 10 s cadence, and cross-power, power ratioand cross-phase spectra were examined for 27 combinationsof nearby station pairs with midpoints ranging from L = 2.8to L = 9.9. The resultant mass density profiles for 12 UT(�13 LT) on each day are shown in the bottom panel ofFigure 5. Each profile is plotted such that the point immedi-ately above the date label is at L = 6, and each adjacent datelabel represents a step of L = 1. Even days are plotted with
heavy lines. An asterisk on or near each plot identifies the lat-itude (not density) of the 12 MLT plasmapause determinedusing Eq. (3).
The results show that before the storm the plasmaspherewas nearly saturated with an almost constant mass density gra-dient across the expected plasmapause position. This is partic-ularly evident on 7 March. For comparison, the superimposeddotted and dashed lines for this day represent the saturatedplasmasphere electron and mass densities predicted by themodels described by Berube et al. (2005).
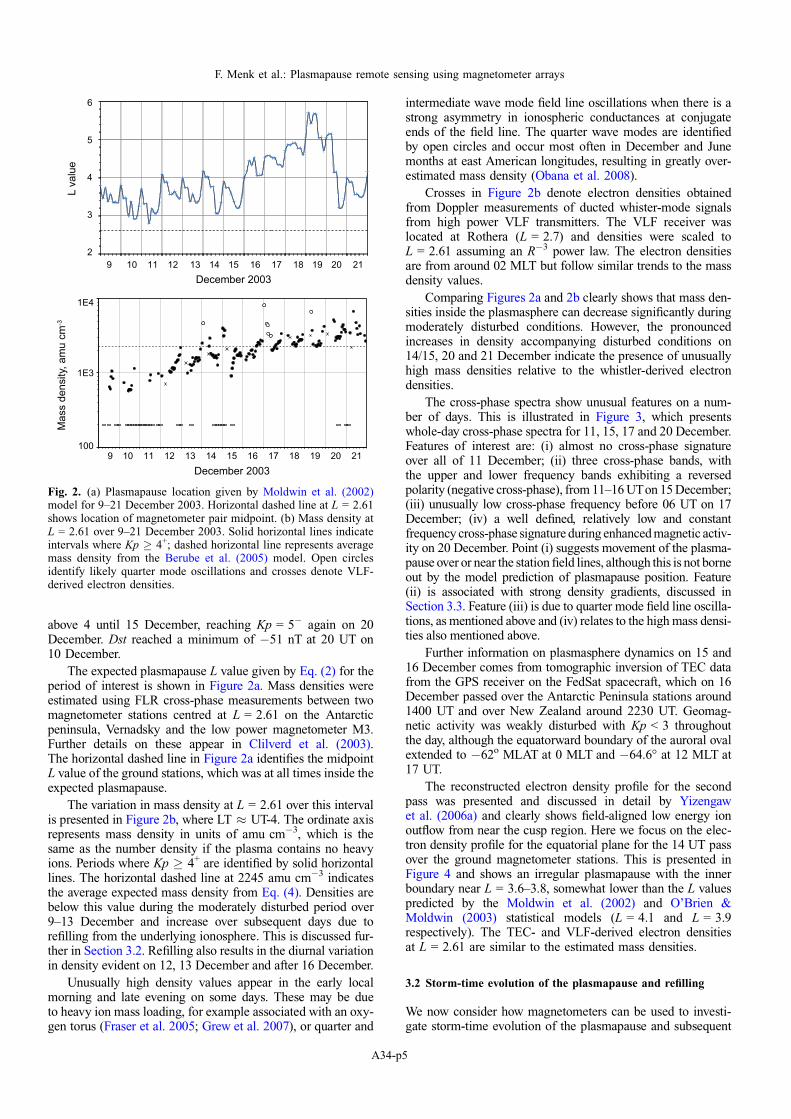
The storm main phase on 11 March produced a markedreduction in mass density compared with the previous day,especially at lower L values. This is illustrated in the top panelof Figure 6, which shows the 12 UT mass densities at selectedL values over 9–17 March inclusive. Open circles represent theplasmapause location given by Eq. (3). These correspond wellwith the observed densities except on 11 March when theplasmapause was likely eroded to just equatorward ofL = 2.82. Plasmaspheric erosion followed by refilling is evi-dent when comparing the change in density with plasmapauseposition at L = 2.82, 3.57 and 4.02 on subsequent days.
A more precise picture of flux tube refilling is obtained byexamining the rate of density change with higher time resolu-tion. This is illustrated in the bottom panel of Figure 6, whichshows mass density determined each 20 min from FLR mea-surements at two station pairs over 03–17 UT (�04–18 LT)on 12 March. Both station pair midpoints map to outside theplasmapause over these times. The error bar at 5 UT representstypical uncertainty related to measurement of the resonant fre-quency. Mass density increased more or less steadily at bothstations at around 4–5 amu cm�3, being higher for the low lat-itude station, although there are small local variations. Thisrefilling rate equates to an upward ion flux at 1000 km altitudeof around 0.8 · 108 amu cm�2 s�1.
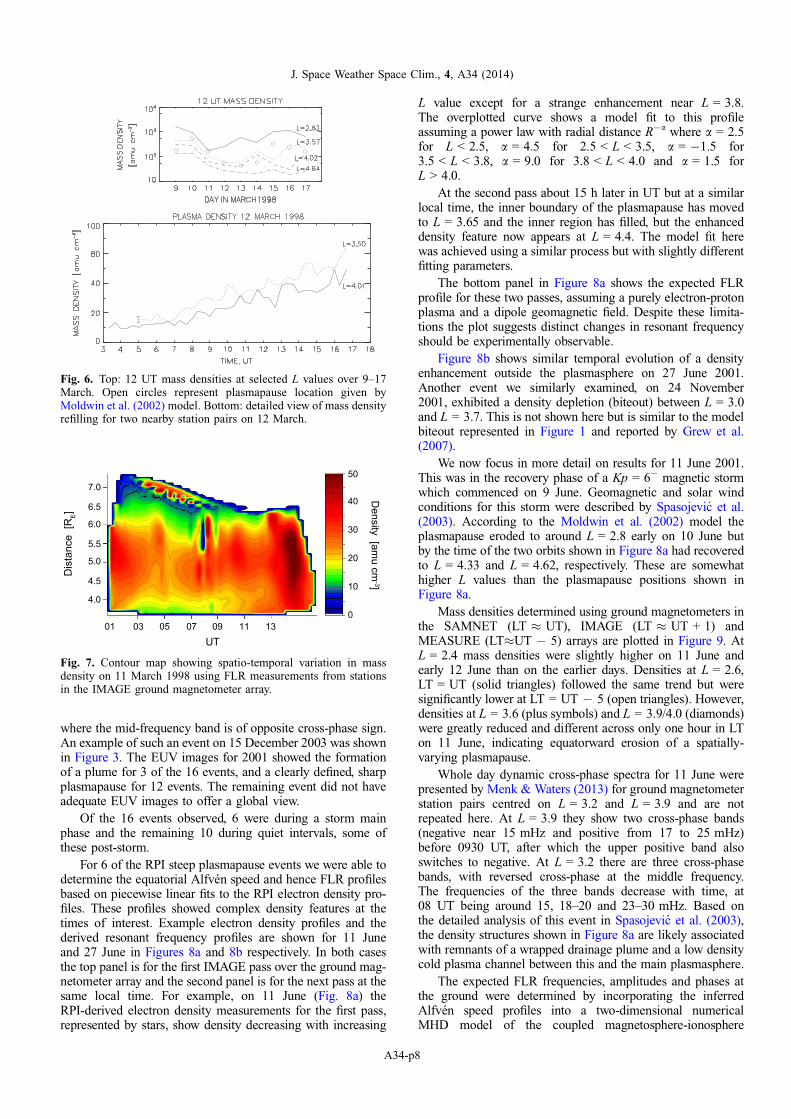
Detailed inspection of the 11 March density profile in thebottom panel in Figure 5 suggests latitude-dependent densitystructures may be present. To more clearly represent this wehave plotted in Figure 7 the variation in FLR-derived massdensity for the outer magnetosphere, where the time axis arisesfrom rotation of the magnetometer array stations with Earth.Magnetospheric structures that change with UT or do not coro-tate would result in a temporal feature in the plot. The plotshows that density is enhanced (relative to lower L values)for several hours over L = 4.3–5.6, with additional densityenhancements extending to higher L just before 05 UT,
00 04 08 12 16 20Time (UT)
50
40
30
20
10
0
50
40
30
20
10
0
50
40
30
20
10
0
45
0
-45
45
0
-45
90
0
-90
Freq
uenc
y, m
Hz
Freq
uenc
y, m
Hz
Freq
uenc
y, m
Hz
Freq
uenc
y, m
Hz
Phase, deg
Phase, deg
Phase, deg
Phase, deg
50
40
30
20
10
0
45
0
-45
Fig. 3. Whole-day cross-phase spectra for L = 2.61 AntarcticPeninsula stations for (top to bottom) 11, 15, 17 and 20 December2003, respectively. Colour scale represents cross-phase magnitudeand sign between the stations; note the different scale for15 December. Horizontal cross-phase bands identify the resonantfrequency.
2.0 2.5 3.0 3.5 4.0 4.5
L value
1E4
1E3
1E2
10
1
Ele
ctro
n de
nsity
, cm
-3
Fig. 4. GPS TEC-derived electron density profile for 1400 UT,16 December 2003.
J. Space Weather Space Clim., 4, A34 (2014)
A34-p6

between 07 and 09 UT and after 13 UT. This suggests a com-plex pattern of convection and plasma erosion during the stormmain phase. A region of high density beyond the main plasma-sphere (L > 6.5) from 03 to 07 UT may be due to a significantheavy ion population or a dense plume feature.
3.3 Detection of drainage plumes
Figure 1 shows that a plume-like density enhancement mayproduce a distinct change in resonant frequency, although theform of this profile will be affected by field line distortionand the presence of heavy ions. Grew et al. (2007) reportedthe detection of a drainage plume and plasmaspheric biteoutusing ground magnetometer FLR measurements. Here we out-line a different method for the detection of such densitystructures.
We suppose that steep density gradients associated with asharp plasmapause, plumes and other features such as biteouts,may be manifested in ground data as cross-phase reversals. Toinvestigate this we searched for steep density gradients at or
near the plasmapause over the year 2001 using in situ electrondensity data from the RPI instrument on the IMAGE satellite.Considering only data from within 30� of the magnetic equa-tor, to identify steep gradients we used the criteria a > 8,2.5 < L < 5.50, 4000 < ne < 10 and Dne > 100, where ne iselectron density. We also required the satellite footprint to bewithin 5� geographic longitude of ground magnetometerstations.
Sixteen steep plasmapause events were identified in thisway, 14 of these in the European region. For all these eventswe then examined dynamic cross-phase spectra from stationsof the SAMNET and IMAGE magnetometer arrays straddlingthe expected plasmapause location. IMAGE EUV images werealso inspected, where available, in order to study the globalstructure of the plasmasphere for these events.
Reversed cross-phase peaks were found to be characteristicof such RPI-identified steep plasmapause crossings. In addi-tion, double maxima, i.e. two bands of enhanced cross-phasebut with different sense of phase polarity for one band, werealso often observed, and occasionally three bands were seen,
Fig. 5. Top: Kp and Dst over 4–19 March 1998. Bottom: mass density profiles at 1200 UT (LT � UT + 1) over 7–19 March 1998. For eachprofile L = 6 is above the corresponding date label, and an asterisk identifies the plasmapause latitude given by the Moldwin et al. (2002)model. Heavy lines represent even-numbered days. Diagonal dotted and dashed lines at 7 March denote saturated plasmasphere electron andmass densities from the Berube et al. (2005) models.
F. Menk et al.: Plasmapause remote sensing using magnetometer arrays
A34-p7
where the mid-frequency band is of opposite cross-phase sign.An example of such an event on 15 December 2003 was shownin Figure 3. The EUV images for 2001 showed the formationof a plume for 3 of the 16 events, and a clearly defined, sharpplasmapause for 12 events. The remaining event did not haveadequate EUV images to offer a global view.
Of the 16 events observed, 6 were during a storm mainphase and the remaining 10 during quiet intervals, some ofthese post-storm.
For 6 of the RPI steep plasmapause events we were able todetermine the equatorial Alfvén speed and hence FLR profilesbased on piecewise linear fits to the RPI electron density pro-files. These profiles showed complex density features at thetimes of interest. Example electron density profiles and thederived resonant frequency profiles are shown for 11 Juneand 27 June in Figures 8a and 8b respectively. In both casesthe top panel is for the first IMAGE pass over the ground mag-netometer array and the second panel is for the next pass at thesame local time. For example, on 11 June (Fig. 8a) theRPI-derived electron density measurements for the first pass,represented by stars, show density decreasing with increasing
L value except for a strange enhancement near L = 3.8.The overplotted curve shows a model fit to this profileassuming a power law with radial distance R�a where a = 2.5for L < 2.5, a = 4.5 for 2.5 < L < 3.5, a = �1.5 for3.5 < L < 3.8, a = 9.0 for 3.8 < L < 4.0 and a = 1.5 forL > 4.0.
At the second pass about 15 h later in UT but at a similarlocal time, the inner boundary of the plasmapause has movedto L = 3.65 and the inner region has filled, but the enhanceddensity feature now appears at L = 4.4. The model fit herewas achieved using a similar process but with slightly differentfitting parameters.
The bottom panel in Figure 8a shows the expected FLRprofile for these two passes, assuming a purely electron-protonplasma and a dipole geomagnetic field. Despite these limita-tions the plot suggests distinct changes in resonant frequencyshould be experimentally observable.
Figure 8b shows similar temporal evolution of a densityenhancement outside the plasmasphere on 27 June 2001.Another event we similarly examined, on 24 November2001, exhibited a density depletion (biteout) between L = 3.0and L = 3.7. This is not shown here but is similar to the modelbiteout represented in Figure 1 and reported by Grew et al.(2007).
We now focus in more detail on results for 11 June 2001.This was in the recovery phase of a Kp = 6� magnetic stormwhich commenced on 9 June. Geomagnetic and solar windconditions for this storm were described by Spasojevic et al.(2003). According to the Moldwin et al. (2002) model theplasmapause eroded to around L = 2.8 early on 10 June butby the time of the two orbits shown in Figure 8a had recoveredto L = 4.33 and L = 4.62, respectively. These are somewhathigher L values than the plasmapause positions shown inFigure 8a.
Mass densities determined using ground magnetometers inthe SAMNET (LT � UT), IMAGE (LT � UT + 1) andMEASURE (LT�UT � 5) arrays are plotted in Figure 9. AtL = 2.4 mass densities were slightly higher on 11 June andearly 12 June than on the earlier days. Densities at L = 2.6,LT = UT (solid triangles) followed the same trend but weresignificantly lower at LT = UT � 5 (open triangles). However,densities at L = 3.6 (plus symbols) and L = 3.9/4.0 (diamonds)were greatly reduced and different across only one hour in LTon 11 June, indicating equatorward erosion of a spatially-varying plasmapause.
Whole day dynamic cross-phase spectra for 11 June werepresented by Menk & Waters (2013) for ground magnetometerstation pairs centred on L = 3.2 and L = 3.9 and are notrepeated here. At L = 3.9 they show two cross-phase bands(negative near 15 mHz and positive from 17 to 25 mHz)before 0930 UT, after which the upper positive band alsoswitches to negative. At L = 3.2 there are three cross-phasebands, with reversed cross-phase at the middle frequency.The frequencies of the three bands decrease with time, at08 UT being around 15, 18–20 and 23–30 mHz. Based onthe detailed analysis of this event in Spasojevic et al. (2003),the density structures shown in Figure 8a are likely associatedwith remnants of a wrapped drainage plume and a low densitycold plasma channel between this and the main plasmasphere.
The expected FLR frequencies, amplitudes and phases atthe ground were determined by incorporating the inferredAlfvén speed profiles into a two-dimensional numericalMHD model of the coupled magnetosphere-ionosphere
Fig. 6. Top: 12 UT mass densities at selected L values over 9–17March. Open circles represent plasmapause location given byMoldwin et al. (2002) model. Bottom: detailed view of mass densityrefilling for two nearby station pairs on 12 March.
01 03 05 07 09 11 13
UT
Density [am
u cm-3]
Dis
tanc
e [R
E]
7.0
6.5
6.0
5.5
5.0
4.5
4.0
50
40
30
20
10
0
Fig. 7. Contour map showing spatio-temporal variation in massdensity on 11 March 1998 using FLR measurements from stationsin the IMAGE ground magnetometer array.
J. Space Weather Space Clim., 4, A34 (2014)
A34-p8

(Waters & Sciffer 2008). The outer boundary of the model isset at 10 RE and the inner boundary is formed by the iono-sphere described by the International reference ionosphere(IRI) and Mass spectrometer and incoherent scatter radar
(MSIS) models for the day being considered. The model wasdriven by a fast mode pulse at the outer boundary with aGaussian spatial distribution and uniform spectral contentacross the 1–100 mHz frequency range. The azimuthal wavenumber, m, was set to 2, and the ionospheric Pedersen and Hallconductances were both set to 5 S.
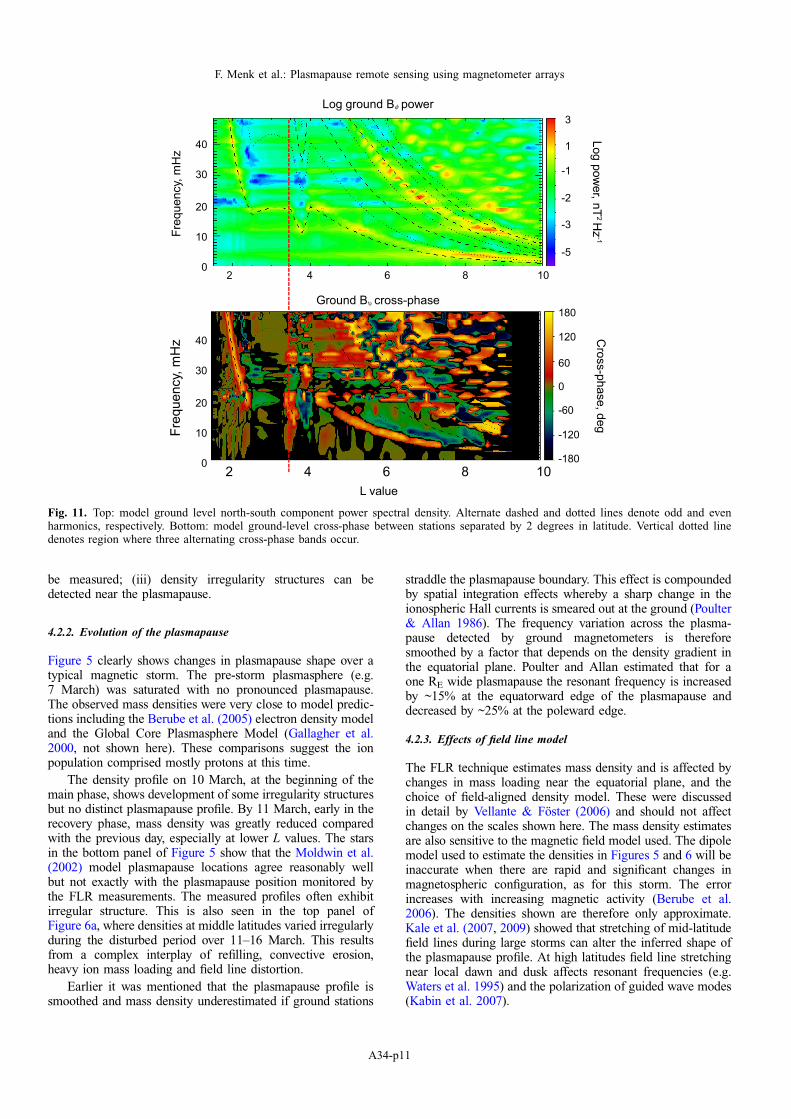
The Alfvén speed and plasma density profiles for the noonmeridian plane are presented in Figure 10. The inferredplasmapause structure is evident. The resultant ground levelnorth-south component power spectral density and cross-phasebetween stations separated by 2 degrees in latitude are shownin Figure 11. Alternate dashed and dotted lines in the top paneldenote odd and even harmonics respectively, with frequencyindicated on the ordinate axis. The abscissa extends to theouter boundary at 10 RE. Power enhancements representregions where incoming compressional mode waves coupleto local resonances at harmonics of the toroidal mode eigenfre-quencies. The three alternating cross-phase bands seen in theactual data at L = 3.2 are reproduced by the model, highlightedby the vertical dashed line. These features are associated withthe sudden decrease in resonant frequency (increase in density)at the inner edge of the density enhancement. The two cross-phase bands seen in actual ground magnetometer data nearL = 3.9 are also reproduced by the model and are associatedwith the steeply increasing resonant frequency (decreasingdensity) on the outer edge of the density feature.
Fig. 8. (a) Top and middle: in situ electron density measurements (stars) and piecewise linear fits for two IMAGE satellite passes on 11 June2001. Bottom: resultant inferred FLR profile for these two passes based on Alfvén speed derived from electron density measurements.(b) Same as Figure 8a except for 27 June 2001.
Fig. 9. FLR-derived mass densities for 9–12 June 2001. Symbolsare as follows: L = 2.4, LT = UT = blue circles; L = 2.6,LT = UT = black triangles and LT = UT – 5 = open triangles;L = 3.2, LT = UT = brown squares; L = 3.6, LT = UT + 1 = plussymbols; L = 3.9/4.0, LT = UT = grey diamonds andLT = UT + 1 = green diamonds; L = 4.7, LT = UT + 1 = crosses;L = 5.7, LT = UT + 1 = orange stars.
F. Menk et al.: Plasmapause remote sensing using magnetometer arrays
A34-p9

4. Discussion
4.1. Storm-time density within the plasmasphere
4.1.1. Summary of observations
The observations presented in Section 3.1 showed that:(i) ground-based magnetometers can be used to routinely mon-itor plasmaspheric mass density, showing features such asstorm-time depletion and refilling; (ii) mass density deepwithin the plasmasphere can be significantly reduced duringmoderately disturbed (Kp = 4–5) periods; (iii) movement ofthe plasmapause to near or over the ground stations may beaccompanied by loss or reversal of the cross-phase signature;(iv) during disturbed periods mass density near the plasma-pause may be significantly higher than electron number den-sity, indicating the presence of heavy ions.
4.1.2. Density changes within the plasmasphere
Figures 2 and 3 show that increases in Kp and movement of theplasmapause (given by empirical models) to within 0.3–0.7 RE
of the L = 2.61 ground stations on 10, 11, 14 and 15 Decembercaused decreases in mass density of order 50% within a few
hours. Kim et al. (2007) reported no such decrease in massdensity at L � 2.9 during a Kp = 8+ storm although Chiet al. (2000) found that mass density at L = 2 dropped to aboutone third of quiet values during a similar storm. In agreementwith Chi et al., we also found substantial density recoverywithin a day.
4.1.3. Is the model plasmapause location correct?
It is possible that the Earthward boundary of the plasmapausemoved to lower latitudes than predicated by the statistical mod-els, to near or over the L = 2.61 ground stations. Evidence forthis is the loss of cross-phase signature in Figure 3 on11 December, and, as explained later, reversal in the sense ofthat signature on 15 December. Further evidence comes fromthe TEC-derived electron density profile in Figure 4, for asatellite pass directly over the ground magnetometer stationson 16 December. This clearly shows the plasmapause to besomewhat irregular in shape and with the inner boundary nearL = 3.6–3.8, about 0.4 and 0.2 RE inward of the Moldwin et al.(2002) and O’Brien & Moldwin (2003) models, respectively.Such a discrepancy cannot account for the decrease in densityon 10 and 15 December.
As mentioned in Section 2.1, if mass density decreaseswith radial distance as R�8 then the cross-phase signature dis-appears between magnetometer stations monitoring field linesmapping to this region, such as for those labelled ‘‘A’’ and ‘‘B’’in Figure 1. This can be used to identify an overhead plasma-pause (Milling et al. 2001). However, stations ‘‘A’’ and ‘‘C’’straddling the plasmapause boundary provide a misleadingindication of the change in resonant frequency. This can causethe cross-phase peak to diminish to the point where it is nolonger detectable, but also averages the frequency variationso that the minimum frequency at the boundary is not detectedand the inferred mass density is lower than reality. This maypartly explain the inferred sudden reduction in mass densityon 15 December seen in Figure 2b.
4.1.4. Enhanced storm-time density
The bottom panel in Figure 3 shows a sustained cross-phasesignature around 12–15 mHz on 20 December. As seen inFigure 2b, the FLR-derived mass densities on 20 and 21December are 50–100% higher than expected for quiet times.These density enhancements accompany increased magneticactivity and are not what we would expect under enhancedconvection and erosion of plasmaspheric plasma to the outermagnetosphere. It is likely that the mass density increasesresult from an increase in the proportion of heavy ions, espe-cially O+, in the outer plasmasphere at this time. Comparisonwith the VLF-derived electron number density from the samelocation on 21 December suggests a mass loading factor oforder 2.0–3.0. This would be achieved if the plasma comprisedprotons and 7–21% O+ by number. This is comfortably withinthe range reported by Berube et al. (2005).
4.2. Storm-time plasmapause and refilling
4.2.1. Summary of observations
Section 3.2 presented ground-based FLR observations during acanonical magnetic storm. This showed that (i) a ground mag-netometer array can monitor evolution of the plasmapause den-sity profile throughout a storm cycle; (ii) flux tube refilling can
Log Alfvén speed
VA max = 7.8 x 10³ km s-1 VA min = 2.4 x 10² km s-1
Log Density
0 2 4 6 8 1 0
4
2
0
-2
-4
4
2
0
-2
-4
0 2 4 6 8 1 0
4.0
3.5
3.0
2.5
2.0
-14
-16
-18
-20
-21
Log ρ [kg.m-3]
Log VA [km
.s-1]
ρ max = 2.3 x 10⁻¹⁴ k m-3 ρ min = 4.1 x 10⁻²¹ kg m-3
Fig. 10. Alfvén speed (top) and plasma density (bottom) profilesfor the noon meridian plane (Sun to the right) used in the 2D MHDsimulation for 11 June 2001. X- and y-axes are in units of RE. Theinner boundary is a realistic ionosphere and the outer boundary is at10 RE.
J. Space Weather Space Clim., 4, A34 (2014)
A34-p10
be measured; (iii) density irregularity structures can bedetected near the plasmapause.
4.2.2. Evolution of the plasmapause
Figure 5 clearly shows changes in plasmapause shape over atypical magnetic storm. The pre-storm plasmasphere (e.g.7 March) was saturated with no pronounced plasmapause.The observed mass densities were very close to model predic-tions including the Berube et al. (2005) electron density modeland the Global Core Plasmasphere Model (Gallagher et al.2000, not shown here). These comparisons suggest the ionpopulation comprised mostly protons at this time.
The density profile on 10 March, at the beginning of themain phase, shows development of some irregularity structuresbut no distinct plasmapause profile. By 11 March, early in therecovery phase, mass density was greatly reduced comparedwith the previous day, especially at lower L values. The starsin the bottom panel of Figure 5 show that the Moldwin et al.(2002) model plasmapause locations agree reasonably wellbut not exactly with the plasmapause position monitored bythe FLR measurements. The measured profiles often exhibitirregular structure. This is also seen in the top panel ofFigure 6a, where densities at middle latitudes varied irregularlyduring the disturbed period over 11–16 March. This resultsfrom a complex interplay of refilling, convective erosion,heavy ion mass loading and field line distortion.
Earlier it was mentioned that the plasmapause profile issmoothed and mass density underestimated if ground stations
straddle the plasmapause boundary. This effect is compoundedby spatial integration effects whereby a sharp change in theionospheric Hall currents is smeared out at the ground (Poulter& Allan 1986). The frequency variation across the plasma-pause detected by ground magnetometers is thereforesmoothed by a factor that depends on the density gradient inthe equatorial plane. Poulter and Allan estimated that for aone RE wide plasmapause the resonant frequency is increasedby ~15% at the equatorward edge of the plasmapause anddecreased by ~25% at the poleward edge.
4.2.3. Effects of field line model
The FLR technique estimates mass density and is affected bychanges in mass loading near the equatorial plane, and thechoice of field-aligned density model. These were discussedin detail by Vellante & Föster (2006) and should not affectchanges on the scales shown here. The mass density estimatesare also sensitive to the magnetic field model used. The dipolemodel used to estimate the densities in Figures 5 and 6 will beinaccurate when there are rapid and significant changes inmagnetospheric configuration, as for this storm. The errorincreases with increasing magnetic activity (Berube et al.2006). The densities shown are therefore only approximate.Kale et al. (2007, 2009) showed that stretching of mid-latitudefield lines during large storms can alter the inferred shape ofthe plasmapause profile. At high latitudes field line stretchingnear local dawn and dusk affects resonant frequencies (e.g.Waters et al. 1995) and the polarization of guided wave modes(Kabin et al. 2007).
2 4 6 8 10
2 4 6 8 10L value
40
30
20
10
0
40
30
20
10
0
Freq
uenc
y, m
Hz
Freq
uenc
y, m
Hz
180
120
60
0
-60
-120
-180
Cross-phase, deg
3
1
-2
-1
-3
-5
Log power, nT
2 Hz
-1
Log ground B power φ
Ground B cross-phase υ
Fig. 11. Top: model ground level north-south component power spectral density. Alternate dashed and dotted lines denote odd and evenharmonics, respectively. Bottom: model ground-level cross-phase between stations separated by 2 degrees in latitude. Vertical dotted linedenotes region where three alternating cross-phase bands occur.
F. Menk et al.: Plasmapause remote sensing using magnetometer arrays
A34-p11
4.2.4. Refilling
The top panel of Figure 6 shows the variation in mass densityat selected L values over 9–17 March inclusive. The increase inmass density at L = 2.82 over 12–15 March relates to an equiv-alent daily refilling rate of around 200 amu cm�3, comparedwith ~400 amu cm�3 d�1 at L = 2.6 reported by Obanaet al. (2010). This is reasonable since ongoing magnetic activ-ity would cause additional plasma erosion and loss, for exam-ple on 15 March. This net rate represents the daily average ofsupply and loss processes and should be distinguished from therefilling rate associated purely with the upward ion flux on thedayside.
The bottom panel of Figure 6 affords a more detailed pic-ture of flux tube refilling. Mass density increased more or lesssteadily at both stations at 4–5 amu cm�3, corresponding to anupward ion flux at 1000 km altitude of around0.8 · 108 amu cm�2 s�1. This is comparable to but smallerthan the rate observed at this latitude by Obana et al. (2010).Upward fluxes at lower latitudes will be higher due to the smal-ler flux tube volume. The short variations in the rate of massdensity increase show that the upward flux varies around amean value on time scales of an hour or so.
Over this interval the plasmapause was located at lower Lthan the ground stations. The refilling discussed here is there-fore to depleted flux tubes mapping outside the plasmasphere.A similar result was reported by Obana et al. (2010) and sup-ports the argument by Reinisch et al. (2004) that during refill-ing periods the plasmapause, as determined by particle densitymeasurements, does not coincide with the topological bound-ary between convecting and corotating plasma flow.
4.2.5. Monitoring magnetospheric density
Results presented here and illustrated in Figure 7 show that anorth-south array of ground magnetometers can provide infor-mation on the mass density profile through the plasmasphereand magnetosphere. The time evolution of density features ismonitored with the rotation of Earth. Longitudinally distrib-uted stations are required for spatial information on corotatingdensity features.
Such maps can be routinely implemented using automatedalgorithms, and would provide a ‘‘quick look’’ reference on themagnetosphere structure and dynamics. Several suitable mag-netometer arrays exist and historical data are available, asshown here. The density data can also provide important inputsto data assimilative models (e.g. Lichtenberger et al. 2013).
4.3. Detection of drainage plumes and other structures
4.3.1. Summary
Results presented in Section 3.3 show that (i) cross-phasereversals and other features identify the presence of steep den-sity gradients at drainage plumes, biteouts and other structures;and (ii) numerical modelling using realistic ionospheric bound-ary conditions is able to simulate the frequency and phase pro-files measured by ground stations under such conditions.
4.3.2. Identification of a plasmaspheric plume on 11 June
We found 16 intervals in 2001 when steep density gradientswere identified at the plasmapause using in situ electron den-sity data. EUV images showed a sharp plasmapause for 12
of these events and formation of a plume for another 3 events.Cross-phase reversals and multiple bands of opposite cross-phase sign were found to be signatures of such events. We wereable to use electron density data to infer the equatorial Alfvénspeed for 6 of these events. The resultant profiles showed com-plex structures near the plasmapause. Using numerical model-ling of wave propagation in a realistic magnetosphere we thensimulated the expected power and cross-phase patterns forground array stations.
Magnetometer array data presented in Figure 9 for the9–12 June storm interval show several trends. At lower lati-tudes (L = 2.4, 2.6) mass densities in the European sector werenot greatly affected, but plasma erosion decreased density atthe east American, L = 2.61 stations on 10 and 11 June. Massdensities at L = 3.2 overall did not change much during thestorm. Densities at L � 3.6 decreased greatly from 10 Junewith gradual recovery and subsequent refilling, indicatingmovement of the plasmapause to lower latitudes. Mass densi-ties from the MEASURE array (open triangles) exhibit signif-icant increases in the evenings on 9 and 11 June. Similar localtime, summer increases were noted by Chi et al. (2013) but thecause is not clear.
Looking more carefully at the morning of 11 June, therewas an approximate doubling of mass density at L = 4.0 overabout 4 h. This coincides with the location of a densityenhancement in the electron density profile shown at the sametime in the top panel Figure 8a.
The evolution of a drainage plume during this storm wasdiscussed in detail by Spasojevic et al. (2003). A plume formedon 9 June but exhibited L-dependent rotation rates, so that theplume wrapped around the main plasmasphere, and due toongoing activity a second plume was observed in EUV imageslate on 10 June, when pronounced shoulders were also presentin the local morning and post-noon sectors. Here we identifythe increase in mass density seen in Figure 9 near L = 3.9/4.0 early on 11 June with the drainage plume. Abe et al.(2006) described the possible detection of a plume in groundmagnetometer data on 10 June, by comparing the H compo-nent power ratio between two stations separated in both lati-tude and longitude with the plume location identified inEUV images. They did not present cross-phase measurementswhich are usually regarded as more reliable than the powerratio methods they used. Grew et al. (2007) demonstrated thedetection of a drainage plume during an extended moderatelydisturbed interval in October 2001, through the local increasein mass density identified using cross-phase measurements,VLF electron density data and EUV observations.The increases in mass density we observed are consistent withthese results.
Important additional information comes from consider-ation of the cross-phase structure. Two opposite sign cross-phase bands were recorded at L = 3.9 and three such bandsat L = 3.2. These are reproduced by the simulation modellingshown in Figure 11, which in conjunction with Spasojevicet al. (2003) analysis allows us to associate these features withremnants of a wrapped drainage plume and a low density coldplasma channel between this and the main plasmasphere.
4.3.2. Identification of a bulge and drainage plume on 27 June
Spasojevic et al. (2003) also described in detail evolution of theplasmapause boundary and a drainage plume on 26–27 June.Figure 8b shows RPI-derived electron density profiles for this
J. Space Weather Space Clim., 4, A34 (2014)
A34-p12

day, with an enhancement in density in the top panel aroundL = 3.0–3.3. Ground magneteometer data showed thisenhancement, and loss of cross-phase signal (i.e. overheadplasmapause) at L = 3.6–3.9 from 06 to 09 LT, with twocross-phase bands, one of reversed sign (i.e. strong density gra-dient, plasmapause moving outward) over 09–12 LT. Followingresults presented by Spasojevic et al. (2003) we identify theseearlier features with the western edge of a radially outwardbulge or shoulder, and the inner boundary of the plasmapausenear L = 3.4. The 19–20 UT, 06–07 MLT IMAGE orbitcrossed the plasmapause near the westward, outer edge ofthe plume.
For this example the ground magnetometer FLR observa-tions have thus identified the bulge, the plasmapause boundaryand the irregular outer edge of a plume.
4.3.3. Numerical modelling
The use of a numerical model to simulate the ground magne-tometer signatures using actual data as input is novel.The model was described by Waters & Sciffer (2008) and usesnonorthogonal basis functions to allow incorporation of a real-istic ionosphere boundary (with Hall current and oblique geo-magnetic field) and dipole field geometry in themagnetosphere. The ionosphere is represented by a thin currentsheet at 120 km altitude. Ionospheric Hall and Pedersen con-ductances are specified by the IRI and MSIS models and wereset at 5 S for this simulation. The outer boundary at 10 RE isdriven by a time-dependent field-aligned perturbation whichproduces a broadband compressional component that propa-gates through the magnetosphere. ULF wave propagation andresonance properties are largely determined by the variationof Alfvén speed, established by reference to in situ electrondensity data assuming a purely electron-proton plasma.The azimuthal wavenumber was set to 2, which is typical forlow latitude FLRs (e.g. Saka & Kim 1985). The FLRs arenormal modes of the system and are used to develop powerand phase profiles across the ground. The resonance width isdetermined by the ionospheric conductance and is smaller inthe ionosphere than on the ground.
Although the modelling makes some simplifying assump-tions it reproduces the observations and thus confirms that mul-tiple frequency bands of opposite cross-phase identify steepdensity structures associated with plasma drainage plumes,bulges and biteouts. This is an important result extending theutility of ground-based magnetometer observations for moni-toring the plasmapause region.
4.3.4. Wave propagation across the plasmapause
Inspection of the top panel in Figure 11 shows that the modelpredicts reduced wave power within the plasmasphere at higherfrequencies (above 22 mHz) compared with the outer magne-tosphere. This is due to reflection, absorption and tunnelling ofwave energy at the plasmapause (Moore et al. 1987; Zhanget al. 1993). The latter authors used 3-D ray tracing to showthat compressional Pc3 waves propagating through the magne-tosphere encounter an ion-ion cutoff between the He+ and O+
gyroresonances. This imposes a bandpass filter so that onlylower frequency waves penetrate to the inner magnetosphere.The location and bandwidth of the filtering action are governedby the O+ concentration. Since this often increases near theplasmapause during magnetically active conditions more com-pressional Pc3 wave energy could enter the plasmasphere then.
In any case, the difference or ratio in Pc3 power may be mea-surably different between ground stations that straddle theplasmapause. In situ observations also reveal clear reductionsin Pc5 wave power within the dayside plasmasphere comparedto the plasmatrough (Hartinger et al. 2010), although this mayalso be related to different FLR conditions in these regions.
5. Conclusions
This paper has discussed remote sensing of the plasmasphereand plasmapause using measurements from existing ground-based magnetometers. The main results are as follows.
(i) A ground magnetometer array can routinely monitormass density within the dayside plasmasphere andevolution of the plasmapause density profile through-out a storm cycle. Data are most conveniently exam-ined via time series plots, density-latitude profiles, orlatitude-time contour maps.
(ii) During disturbed times mass density can decreasewithin a few hours by 50% or more 0.5 RE or furtherinward of the plasmapause.
(iii) Loss of the cross-phase signature identifies move-ment of the plasmapause to near or over the groundstations.
(iv) Refilling of depleted flux tubes mapping to withinand outside the plasmapause is readily measured.For the example presented the upward flux, measuredwith 20 min resolution at L = 3.5 and L = 4.01, wasaround 0.8 · 108 amu cm�2 s�1 relative to 1000 kmaltitude.
(v) The plasmapause position determined by magnetom-eter measurements is generally within 0.5 RE of thelocation predicted by empirical statistical models,but reveals rapidly changing and complex structuresunder disturbed conditions. The magnetometer mea-surements are affected by mass loading, field linedistortion and to a lesser extent, the assumed field-aligned density distribution.
(vi) During disturbed periods mass density near theplasmapause may be several times higher than elec-tron number density, due to the presence of heavyions. In the example discussed mass densityincreased by 50–100% within a few hours, consistentwith an O+ proportion of 7–21% O+ by number.Knowledge of the electron number density and He+
concentration allows the plasma composition to beestimated.
(vii) Reversals of phase with time and frequency in cross-phase spectra identify the presence of steep densitygradients at the plasmapause, at drainage plumes,biteouts and other structures. This was confirmedby reference to in situ electron density data andEUV images.
(viii) We used a 2-D numerical MHD model incorporatingrealistic ionosphere boundary conditions and a mag-netospheric Alfvén speed profile based on in situmeasurements, to simulate the frequency and phaseprofiles expected across a ground station array attimes when cross-phase reversals and steep densitygradients were observed. This was able to reproducethe observations and provides information on howsuch cross-phase signatures are formed. This novel
F. Menk et al.: Plasmapause remote sensing using magnetometer arrays
A34-p13
approach confirms the ability to model wave propa-gation and coupling to resonances near the plasma-pause under realistic situations.
Acknowledgements. We thank all those involved in operating andproviding data for the various instrument arrays. The IMAGE mag-netometer array is operated by a multinational consortium headedby the Finnish Meteorological Institute, while SAMNET is operatedby the Space Plasma Environment and Radio Science (SPEARS)group, Department of Physics, Lancaster University. The MEA-SURE magnetometer array is operated by Florida Institute of Tech-nology and UCLA IGPP; the PI is M. Moldwin. Vernadksymagnetometer data were kindly supplied by G. Milinevski fromthe Ukranian Antarctic Center, while Rothera magnetometer andVLF data were obtained under the auspices of the NERC AntarcticFunding Initiative with logistic support from the British AntarcticSurvey. RPI electron density data were supplied by Richard Denton,Phillip Webb, Jerry Goldstein, Jillian Redfern and Bodo Reinisch.IMAGE satellite EUV data were supplied by B. Sandel via theEUV web site at Arizona University. TEC tomographic data werekindly provided by E. Yizengaw of Boston College, having beenobtained from the FedSat satellite developed and operated by theCRC for Satellite Systems under the Commonwealth of AustraliaCooperative Research Centers Program. Aspects of this work weresupported by the Australian Research Council through project no.DP0559544. FWM thanks the hospitality of the Department ofElectronic Engineering at La Trobe University, Melbourne, duringpreparation of this report. The editor thanks Mark B. Moldwinand one anonymous referee for their assistance in evaluating thispaper.
References
References
Abe, S., H. Kawano, J. Goldstein, S. Ohtani, S.I. Solovyev, D.G.Baishev, and K. Yumoto. Simultaneous identification of aplasmaspheric plume by a ground magnetometer pair andIMAGE extreme ultraviolet imager, J. Geophys. Res., 111,A11202, 2006, DOI: 10.1029/2006JA011653.
Benson, R.F., P.A. Webb, J.L. Green, L. Garcia, and B.W. Reinisch.Magnetospheric electron densities inferred from upper-hybridband emissions, Geophys. Res. Lett., 31, L20803, 2004,DOI: 10.1029/2004GL020847.
Berube, D., M.B. Moldwin, and J.M. Weygand. An automatedmethod for the detection of field line resonance frequencies usingground magnetometer techniques, J. Geophys. Res., 108, A9,2003, DOI: 10.1029/2002JA009737.
Berube, D., M.B. Moldwin, S.F. Fung, and J.L. Green. A plasma-spheric mass density model and constraints on its heavy ionconcentration, J. Geophys. Res., 110, A04212, 2005,DOI: 10.1029/2004JA010684.
Berube, D., M.B. Moldwin, and M. Ahn. Computing magneto-spheric mass density from field line resonances in a realisticmagnetic field geometry, J. Geophys. Res., 111, A08206, 2006,DOI: 10.1029/2005JA011450.
Burch, J.L. The first two years of IMAGE, Space Sci. Rev., 109,1–4, 2003, DOI: 10.1023/B:SPAC.0000007510.32068.68.
Carpenter, D.L. Whistler evidence of a ‘‘knee’’ in the magneto-spheric ionization density profile, J. Geophys. Res., 68 (6),1675–1682, 1963, DOI: 10.1029/JZ068i006p01675.
Carpenter, D.L., and C.G. Park. On what ionospheric workersshould know about the plasmapause-plasmasphere, Rev.Geophys. Space Phys., 11 (1), 133–154, 1973,DOI: 10.1029/RG011i001p00133.
Carpenter, D.L., and R.R. Anderson. An ISEE/whistler model ofequatorial electron density in the magnetosphere, J. Geophys.Res., 97, A2, 1097–1108, 1992, DOI: 10.1029/91JA01548.
Carpenter, D.L., R.R. Anderson, W. Calvert, and M.B. Moldwin.CRRES observations of density cavities inside the plasmasphere,J. Geophys. Res., 105, 23323–23338, 2000,DOI: 10.1029/2000JA000013.
Chappell, C.R., K.K. Harris, and G.W. Sharp. The dayside of theplasmasphere, J. Geophys. Res., 76 (31), 7632–7647, 1971,DOI: 10.1029/JA076i031p07632.
Chi, P.J., C.T. Russell, S. Musman, W.K. Peterson, G. Le,V. Angelopolous, G.D. Reeves, M.B. Moldwin, and F.K. Chun.Plasmaspheric depletion and refilling associated with theSeptember 25, 1978 magnetic storm observed by groundmagnetometers at L=2, Geophys. Res. Lett., 27, 5, 2000,DOI: 10.1029/1999GL010722.
Chi, P.J., M.J. Engebretson, M.B. Moldwin, C.T. Russell,I.R. Mann, et al. Sounding of the plasmasphere by Mid-continentMAgnetoseismic Chain (McMAC) magnetometers, J. Geophys.Res., 118, 6, 2013, DOI: 10.1002/jgra.50274.
Clilverd, M.A., A.J. Smith, and N.R. Thomson. The annual variationin quiet time plasmaspheric electron density determined fromwhistler mode group delays, Planet. Space Sci., 39 (7),1059–1067, 1991, DOI: 10.1016/0032-0633(91)90113-O.
Clilverd, M.A., F.W. Menk, G. Milinevski, B.R. Sandel, andJ. Goldstein. In situ and ground-based intercalibration measure-ments of plasma density at L=2.5, J. Geophys. Res., 108, A10,2003, DOI: 10.1029/2003JA009866.
Collier, A.B., J. Lichtenberger, M.A. Clilverd, C.J. Rodger, andP. Steinbach. Source region for whistlers detected at Rothera,Antarctica, J. Geophys. Res., 116, A03219, 2011,DOI: 10.1029/2010JA016197.
Daglis, I.A., R.M. Thorne, W. Baumjohann, and S. Orsino.The terrestrial ring current: origin, formation, and decay, Rev.Geophys., 37 (4), 407–438, 1999, DOI: 10.1.1.40.2177.
Darrouzet, F., P.M.E. Décréau, J. De Keyser, A. Masson, andD.L. Gallagher. Density structures inside the plasmasphere:cluster observations, Ann. Geophys., 22, 2577–2585, 2004,DOI: 10.5194/angeo-22-2577-2004.
Darrouzet, F., J. De Keyser, P.M.E. Décréau, D.L. Gallagher, V.Pierrad, et al. Analysis of plasmaspheric plumes: CLUSTER andIMAGE observations, Ann. Geophys., 24, 1737–1758, 2006,DOI: 10.5194/angeo-24-1737-2006.
Darrouzet, F., V. Pierrard, S. Benck, G. Lointier, and J. Cabrera.Links between the plasmapause and the radiation belt boundariesas observed by the instruments CIS, RAPID, and WHISPERonboard Cluster, J. Geophys. Res., 118, 7, 2013,DOI: 1.1002/jgra.50239.
Denton, R.E., P.M.E. Décréau, M.J. Engebretson, F. Darrouzet, andJ.L. Posch. Field line distribution of density at L=4.8 inferredfrom observations by CLUSTER, Ann. Geophys, 27, 705–724,2009, DOI: 10.5194/angeo-27-705-2009.
Foster, J.C., C.G. Park, L.H. Brace, J.R. Burrows, J.H. Hoffman, E.J.Maier, and J.H. Whitteker. Plasmapause signatures in theionosphere and magnetosphere, J. Geophys. Res., 83, A3,1175–1182, 1978, DOI: 10.1029/JA083iA03p01175.
Foster, J.C., P.J. Erickson, A.J. Coster, J. Goldstein, and F.J. Rich.Ionospheric signatures of plasmaspheric tails, Geophys. Res.Lett., 29, 13, 2002, DOI: 10.1029/2002GL015067.
Fraser, B.J. The FedSat microsatellite mission, Space Sci. Rev., 107,1–2, 2003, DOI: 10.1023/A:1025508816225.
Fraser, B.J., J.L. Horwitz, J.A. Slavin, Z.C. Dent, and I.R. Mann.Heavy ion mass loading of the geomagnetic field near theplasmapause and ULF wave implications, Geophys. Res. Lett.,32, L04102, 2005, DOI: 10.1029/2004GL021315.
Gallagher, D.L., P.D. Craven, and R.H. Comfort. Global core plasmamodel, J. Geophys. Res., 105, A8, 18819–18833, 2000,DOI: 10.1029/1999JA000241.
J. Space Weather Space Clim., 4, A34 (2014)
A34-p14
Gjerloev, J.W. The SuperMAG data processing technique,J. Geophys. Res., 117, A9, 1978–2012, 2012,DOI: 10.1029/2012JA017683.
Goldstein, J., and B.R. Sandel. The global pattern of evolution ofplasmaspheric drainage plumes. In: J. Burch, M. Schulz, andH. Spence, Editor, Inner magnetosphere interactions: newperspectives from imaging. American Geophysical Union,Washington, D.C., 2005, DOI: 10.1029/159GM02.
Goldstein, J., R.W. Spiro, P.H. Reiff, R.A. Wolf, and B.R. Sandel.IMF-driven overshielding electric field and the origin of theplasmaspheric shoulder of March 24, 2000, Geophys. Res. Lett,29, 16, 2002, DOI: 10.1029/2001GL014534.
Goldstein, J., M. Spasojevic, P.H. Reiff, B.R. Sandel, T. Forrester,D.L. Gallagher, and B.W. Reinisch. Identifying the plasmapausein IMAGE EUV data using IMAGE RPI in situ steep densitygradients, J. Geophys. Res., 108, A4, 2003,DOI: 10.1029/2002JA009475.
Grew, R.S., F.W. Menk, M.A. Clilverd, and B.R. Sandel. Mass andelectron densities in the inner magnetosphere during a prolongeddisturbed interval, Geophys. Res. Lett, 34, L02108, 2007,DOI: 10.1029/2006GL028254.
Hartinger, M., M.B. Moldwin, V. Angelopolous, K. Takahashi,H.J. Singer, R.R. Anderson, Y. Nishimura, and J.R. Wygant. Pc5wave power in the quiet-time plasmasphere and trough: CRRESobservations, Geophys. Res. Lett., 37, L07107, 2010,DOI: 10.1029/2010GL042475.
Horwitz, J.L., R.H. Comfort, and C.R. Chappell. A statisticalcharacterization of plasmapshere density structure and boundarylocations, J. Geophys. Res., 95, 7937–7947, 1990,DOI: 10.1029/JA095iA06p07937.
Kabin, K., R. Rankin, I.R. Mann, A.W. Degeling, and R. Marchand.Polarization properties of standing shear Alfvén waves in non-axisymmetric background magnetic fields, Ann. Geophys., 25,815–822, 2007, DOI: 10.5194/angeo-25-815-2007.
Kale, Z.C., I.R. Mann, C.L. Waters, J. Goldstein, F.W. Menk, andL.G. Ozeke. Ground magnetometer observation of a cross-phasereversal at a steep plasmapause, J. Geophys. Res., 112, A10222,2007, DOI: 10.1029/2007JA012367.
Kale, Z.C., I.R. Mann, C.L. Waters, M. Vellante, T.L. Zhang, and F.Honary. Plasmaspheric dynamics resulting from the Hallowe’en2003 geomagnetic storms, J. Geophys. Res., 114, A08204, 2009,DOI: 10.1029/2009JA014194.
Kim, K.-H., J. Goldstein, and D. Berube. Plasmaspheric drainageplume observed by the Polar satellite in the prenoon sector andthe IMAGE satellite during the magnetic storm of 11 April 2001,J. Geophys. Res., 112, A06237, 2007,DOI: 10.1029/2006JA012030.
Lichtenberger, J., M.A. Clilverd, B. Heilig, M. Vellante, andJ Manninen. The plasmasphere during a space weather event:first results from the PLASMON project, J. Space Weather SpaceClim., 3, A23, 2013, DOI: 10.1051/swsc/2013045.
Menk, F.W., and C.L. Waters. Magnetoseismology: ground-basedremote sensing of Earth’s magnetosphere, Wiley, Berlin, 2013.
Menk, F.W., D. Orr, M.A. Clilverd, A.J. Smith, C.L. Waters, D.K.Milling, and B.J. Fraser. Monitoring spatial and temporalvariations in the dayside plasmasphere using geomagnetic fieldline resonances, J. Geophys. Res., 104, A9, 19955–19969, 1999,DOI: 10.1029/1999JA900205.
Menk, F.W., I.R. Mann, A.J. Smith, C.L. Waters, M.A. Clilverd, andD.K. Milling. Monitoring the plasmapause using geomagneticfield line resonances, J. Geophys. Res., 109, A04216, 2004,DOI: 10.1029/2003JA010097.
Menk, F.W., S.T. Ables, R.S. Grew, M.A. Clilverd, and B.R. Sandel.The annual and longitudinal variations in plasmaspheric iondensity, J. Geophys. Res., 117, A3, 2012,DOI: 10.1029/2011JA017071.
Milling, D.K., I.R. Mann, and F.W. Menk. Diagnosing theplasmapause with a network of closely spaced ground-basedmagnetometers, Geophys. Res. Lett., 28 (1), 115–118, 2001,DOI: 10.1029/2000GL011935.
Moldwin, M.B., L. Downward, H.K. Rassoul, R. Amin, andR.R. Anderson. A new model of the location of the plasmapause:CRRES results, J. Geophys. Res., 107, A11, 2002,DOI: 10.1029/2001JA009211.
Moldwin, M.B., J. Howard, J. Sanny, J.D. Bocchicchio,H.K. Rassoul, and R.R. Anderson. Plasmaspheric plumes:CRRES observations of enhanced density beyond the plasma-pause, J. Geophys. Res., 109, A5, 2004,DOI: 10.1029/2003JA010320.
Moore, T.E., D.L. Gallagher, J.L. Horwitz, and R.H. Comfort. MHDwave breaking in the outer plasmasphere, Geophys. Res. Lett., 14,10, 1987, DOI: 10.1029/GL014i010p01007.
Morley, S.K., S.T. Ables, M.D. Sciffer, and B.J. Fraser. Multipointobservations of Pc1-2 waves in the afternoon sector, J. Geophys.Res., 114, A09205, 2009, DOI: 10.1029/2009JA014162.
Obana, Y., F.W. Menk, M.D. Sciffer, and C.L. Waters. Quarter-wavemodes of standing Alfvén waves detected by cross-phaseanalysis, J. Geophys. Res., 113, A08203, 2008,DOI: 10.1029/2007JA012917.
Obana, Y., F.W. Menk, and I. Yoshikawa. Plasma refilling rates forL = 2.3–3.8 flux tubes, J. Geophys. Res., 115, A03204, 2010,DOI: 10.1029/2009JA014191.
O’Brien, T.P., and M.B. Moldwin. Empirical plasmapause modelsfrom magnetic indices, Geophys. Res. Lett., 30 (4), 1152, 2003,DOI: 10.1029/2002GL016007.
Ozhogin, P., J. Tu, P. Song, and B.W. Reinisch. Field-aligneddistribution of the plasmaspheric electron density: an empiricalmodel derived from the IMAGE RPI measurements, J. Geophys.Res., 117, A06225, 2012, DOI: 10.1029/2011JA017330.
Park, C.G., D.L. Carpenter, and D.B. Wiggin. Electron density in theplasmasphere: whistler data on solar cycle, annual and diurnalvariations, J. Geophys. Res., 83, A7, 1978,DOI: 10.1029/JA083iA07p03137.
Poulter, E.M., and W. Allan. The ground magnetic fields of transientULF pulsations at the plasmapause, Planet. Space Sci., 34 (11),1073–1079, 1986.
Reinisch, B.W., X. Huang, D.M. Haines, I.A. Galkin, and J.L.Green. First results from the Radio Plasma Imager on IMAGE,Geophys. Res. Lett., 28, 6, 2001, DOI: 10.1029/2000GL012398.
Reinisch, B.W., X. Huang, P. Song, J.L. Green, S.F. Fung, V.M.Vasyliunas, D.L. Gallagher, and B.R. Sandel. Plasmaspheric massloss and refilling as a result of a magnetic storm, J. Geophys.Res., 109, A01202, 2004, DOI: 10.1029/2003JA009948.
Saka, O., and J.S. Kim. Spatial phase structure of low-latitude Pc3-4pulsations, Planet. Space Sci., 33 (9), 1073–1079, 1985.
Sandel, B.R., J. Goldstein, D.L. Gallagher, and M. Spasojevic.Extreme ultraviolet imager observations of the structure anddynamics of the plasmasphere, Space Sci. Rev., 109, 1–4, 2003,DOI: 10.1023/B:SPAC.0000007511.47727.5b.
Singh, N., and J.L. Horwitz. Plasmasphere refilling: recent obser-vations and modelling, J. Geophys. Res., 97, A2, 1992,DOI: 10.1029/91JA02602.
Spasojevic, M., J. Goldstein, D.L. Carpenter, U.S. Inan, B.R. Sandel,M.B. Moldwin, and B.W. Reinisch. Global response of theplasmasphere to a geomagnetic disturbance, J. Geophys. Res.,108, A9, 2003, DOI: 10.1029/2003JA009987.
Summers, D., B. Li, and N.P. Meredith. Timescales for radiation beltelectron acceleration and loss due to resonant wave-particleinteractions: 2. Evaluation for VLF chorus, ELF hiss, andelectromagnetic ion cyclotron waves, J. Geophys. Res., 112,A04207, 2007, DOI: 101.209/2006JA011993.
Takahashi, K., R.E. Denton, R.R. Anderson, and W.J. Hughes. Massdensity inferred from toroidal wave frequencies and its compar-ison to electron density, J. Geophys. Res., 111, A01201, 2006,DOI: 10.1029/2005JA011286.
Takahashi, K., S.-I. Ohtani, R.E. Denton, W.J. Hughes, andR.R. Anderson. Ion composition in the plasma trough andplasma plume derived from a Combined Release and RadiationEffects Satellite magnetoseismic study, J. Geophys. Res., 113,A12203, 2008, DOI: 10.1029/2008JA013248.
F. Menk et al.: Plasmapause remote sensing using magnetometer arrays
A34-p15

Vellante, M., and M. Föster. Inference of the magnetosphericplasma mass density from field line resonances: a test using aplasmasphere model, J. Geophys. Res., 111, A11204, 2006,DOI: 10.1029/2005JA011588.
Walker, A.D.M. Formation of whistler ducts, Planet. Space Sci., 26(4), 375–379, 1978, DOI: 10.1016/0032-0633(78)90121-6.
Waters, C.L., and M.D. Sciffer. Field line resonant frequencies andionospheric conductance: results from a 2-D MHD model,J. Geophys. Res., 113, A05219, 2008,DOI: 10.1029/2007JA012822.
Waters, C.L., F.W. Menk, and B.J. Fraser. The resonance structure oflow latitude Pc3 geomagnetic pulsations, Geophys. Res. Lett., 18(12), 2293–2296, 1991, DOI: 10.1029/91GL02550.
Waters, C.L., B.G. Harrold, F.W. Menk, J.C. Samson, and B.J.Fraser. Field line resonances and waveguide modes at lowlatitudes, 2. A model, J. Geophys. Res., 105, A4, 7763–7774,2000, DOI: 10.1029/1999JA900267.
Waters, C.L., F.W. Menk, M.F. Thomson, C. Foster, andF.R. Fenrich. Remote sensing the magnetosphere using ground-based observations of ULF waves. In: K. Takahashi, P.J. Chi,R.E. Denton, and R.L. Lysak, Editors, Magnetospheric ULFwaves: synthesis and new directions. American GeophysicalUnion, Washington, DC, 319–340, 2006,DOI: 10.1029/169GM21.
Waters, C.L., J.C. Samson, and E.F. Donovan. The temporalvariation of the frequency of high latitude field line resonances,J. Geophys. Res., 100, A5, 7987–7996, 1995,DOI: 10.1029/94JA02712.
Yizengaw, E., and M.B. Moldwin. The altitude extension of themid-latitude trough and its correlation with plasmapauseposition, Geophys. Res. Lett., 32, L09105, 2005,DOI: 10.1029/2005GL022854.
Yizengaw, E., M.B. Moldwin, P.L. Dyson, B.J. Fraser, andS. Morley. First tomographic image of ionospheric outflows,Geophys. Res. Lett., 33, L20102, 2006a,DOI: 10.1029/2006GL027698.
Yizengaw, E., M.B. Moldwin, and D.A. Galvan. Ionosphericsignatures of a plasmaspheric plume over Europe, Geophys.Res. Lett., 33, L17103, 2006b, DOI: 10.1029/2006GL026597.
Yizengaw, E., J. Dewar, J. MacNeil, M.B. Moldwin, D. Galvan,J. Sanny, D. Berube, and B. Sandel. The occurrence ofionospheric signatures of plasmaspheric plumes over differentlongitudinal sectors, J. Geophys. Res., 113, A08318, 2008,DOI: 10.1029/2007JA012925.
Yoshikawa, I., A. Yamazaki, K. Shiomi, K. Yamashita, Y. Takizawa,and M. Nakamura. Evolution of the outer plasmasphere duringlow geomagnetic activity observed by the EUV scanner onboardPlanet-B, J. Geophys. Res., 105, A12, 27777–27789, 2000,DOI: 10.1029/2000JA900106.
Zhang, X., R.H. Comfort, Z.E. Musielak, T.E. Moore,D.L. Gallagher, and J.L. Green. Propagation characteristics ofPc3 compressional waves generated at the dayside magnetopause,J. Geophys. Res., 98, A9, 15403–15410, 1993,DOI: 10.1029/93JA01322.
Cite this article as: Menk F., Z. Kale, M. Sciffer, P. Robinson, C. Waters, et al.: Remote sensing the plasmasphere, plasmapause, plumes andother features using ground-based magnetometers. J. Space Weather Space Clim., 4, A34, 2014, DOI: 10.1051/swsc/2014030.
J. Space Weather Space Clim., 4, A34 (2014)
A34-p16