remote operations tools, infrastructure and logistics used during the lita 2004 expedition and...
TRANSCRIPT

Remote operations tools, infrastructure and logistics used during the LITA 2004 expedition and development priorities for
2005Peter CoppinEventScope Project/Remote Experience and Learning Lab, Carnegie
Mellon University[Karl Fischer, Melissa Ludowise, Luisa Lu, Eben Myers, Mike Wagner,
Ron McCloskey, with help from Dan Cuellar, Trey Smith, Dave Thompson and Kristen Stubbs]Carnegie Mellon UniversityJanuary 6, 2005


[Museums, homes andschools]
[EventScope lab, team
and tools]
[Far away places]

Presentation overview• Topics
– Teleoperations center– Interfaces
• Uplink• Downlink [via web and the ops interface]
– E/PO [tomorrow]
• Presentation format for each topic– Review initial concepts that guided our 2004 development– Review concepts that were implemented– Review what worked & what needs to be improved– Development priorities for 2005

04 ops concepts were based on 03 shakedown
[and MER]

Teleoperations center

Figure is drawn to scale.1/8” in figure = 1’ in room
K. Stubbs, 7/28/04 Updated: E. Myers, 9/27/04
Science OpsRoom Layout v.2
Storagearea
curtain
Key:Scientists
GebES
ES EPO
Projector screen
Projector screenInstrument group
Theme group
Theme group
Tables for maps
Printer
Wall available for use of sketchpads and whiteboard
Science Activity Areas:Two science activity areas for two
theme groups. Consists of:ComputersProjectors
Instrument Teams:Other computing areas for instrument specialistsWireless internet for scientist laptopsSupport and EventScope staff
Observations and ethnographyCameras and recording devices
Observers: Stubbs, Thomas, Glasgow, Hinds

Figure is drawn to scale.1/8” in figure = 1’ in room
K. Stubbs, 7/28/04 Updated: E. Myers, 9/27/04
Science OpsRoom Layout v.3.1a
curtain
Key:Scientists
ESES EPOGeneral
Behind curtain is same as v.2 (see slide 4)
Projector screen
Projector screen (2 projectors)
Printer
Wall available for use of sketchpads and whiteboard
Food/Coffee Table
Central Meeting TableIncludes two ops workstations (each with a projector)
Secondary Meeting AreaIncludes one ops workstation (with a projector) possibly for FI work.
Work AreasDesks and chairs for individual work

Figure is drawn to scale.1/8” in figure = 1’ in room
K. Stubbs, 7/28/04 Updated: E. Myers, 9/27/04
Science OpsRoom Layout v.3.1b
curtain
Key:Scientists
ESES EPOGeneral
Behind curtain is same as v.2 (see slide 4)
Projector screen
Projector screen (2 projectors)
Printer
Wall available for use of sketchpads and whiteboard
Food/Coffee Table
Central Meeting TableIncludes two ops workstations (each with a projector)
Secondary Meeting AreaIncludes one ops workstation (with a projector) possibly for FI work.
Work AreasDesks and chairs for individual work

Figure is drawn to scale.1/8” in figure = 1’ in room
K. Stubbs, 7/28/04 Updated: E. Myers, 9/27/04
Science OpsRoom Layout v.3
curtain
Key:Scientists
ESES EPOGeneral
Behind curtain is same as v.2 (see slide 4)
Projector screens
Projector screen
Printer
Wall available for use of sketchpads and whiteboard
Food/Coffee Table
Central Meeting TableIncludes two ops workstations (each with a projector)
Secondary Meeting AreaIncludes one ops workstation (with a projector) possibly for FI work.Work Areas
Desks and chairs for individual work

Logistical considerations
Teleoperation center housed with ES staff for extra support [ref. 03]
Near Craig St. AmenitiesHotelsMass transitFoodCoffee

Data presentation through ops workstations, individual laptops and paper
Mapping and brainstorming on pin walls

Science activity stations

Science activity station [cont.]

Science activity station [detail]
Uplink Downlink

What worked/ what needs improvement
• What worked– Overall room layout and it’s reconfigurability [we went through 2
iterations]. • Map areas/pin walls
– Location near hotels, transit, food, coffee shop– Surveillance and ethnography support– VNC [a form of remote desktop] worked great for distributed ops
• Areas that need improvement– Wireless internet was flaky– Need kitchen area/breakroom [we have one as of Jan05]– Need better conference phone– Need more light– More tables and chairs

Interfaces

Interface types
• Uplink interface• Downlink interfaces
– EventScope– Web [with Dan Cuellar, David Seneker
and Trey Smith]
• Triangulation tool• E/PO interfaces [to be presented
tomorrow]

Uplink interface / downlink interface
Uplink Downlink

Uplink interface pin concept
Uplink

Specifying actions with the action palette
2. Select
3. Tune parameters1. Click

Switching between actions

Switching between actions through the use of pins or toggle
buttons

“Cutting and pasting” previous actions to save time and reduce
effort

Specifying a “via point” [a location with no actions]

Running a sample plan by using the “quicklook” feature to get feedback from local planning
software
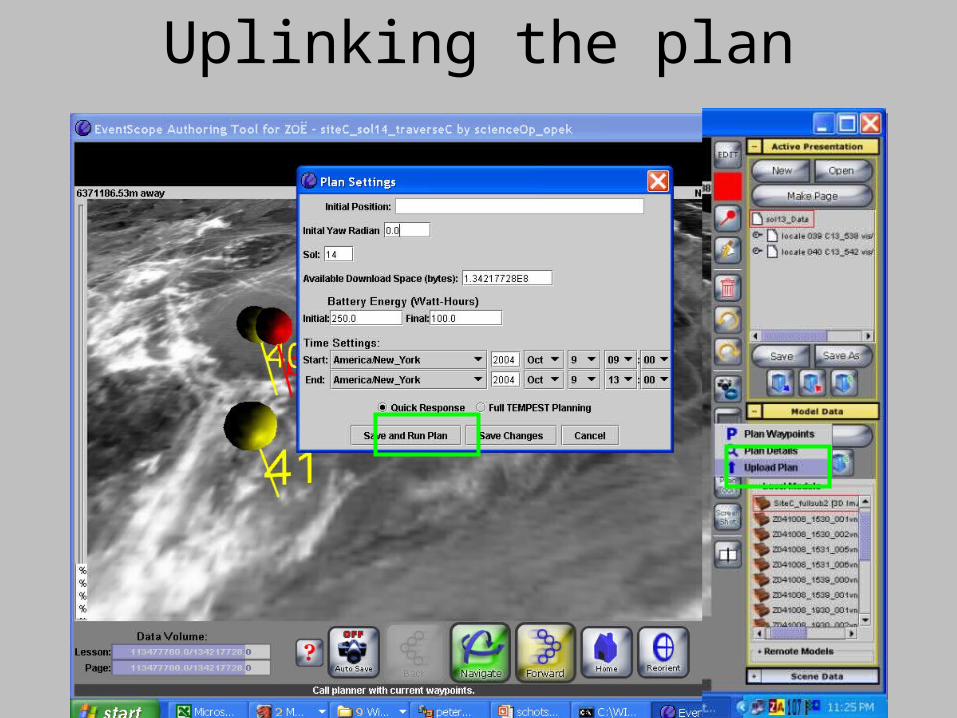
Uplinking the plan

What happens when we uplink a plan:
• Human/machine readable .xml uploads to the Remote Download Directory [RDL]
• A visualization of the plan uploads to the RDL for later reference

Various ops screenshots


Monday

Tuesday

Wednesday

Uplinking: Next steps– What worked
• Science team operated tools on their own [contrast to initial expectations]• CVS version installed on ops workstations enabled us to improve interface during expedition.
Example:– Added the ability to copy previous actions– Changed the .xml file to make it human readable
– Areas that need improvement• Work with rover team to integrate ops tests with rover tests • Quicker integration of orbital data enables scientists to know when they are in an unplannable area
[requires orbital visible data prior to expedition]• Fix overlapping text on pins through better scaling during DEM navigation • Minor interface change: Put actions in chronological order• Include rational from the rover or field team that explains why locals were skipped• Include common actions in interface. This is partially achieved through cut and paste feature.
– Questions• Quicklook plan simulator• Could we replace request ID’s with local names?

Downlinking techniques
Downlink
• Method 1: via science website– Pros:
• Familiar Mozilla/ IE interface• Easy for scientists to bring
data into other tools
– Cons: • Data is not visually correlated
to the DEM or pins
• Method 2: via ops interface– Pros:
• Data is hyperlinked to the pins on the DEM
• Path of the rover is visualized in interface
– Cons: • Greater dependence on rover
systems [dangerous during the rover debugging phase]

Downlinking through the Remote Download Directory [RDL]

Downlink: Rover path visualization

Pins are linked to data
“Click”
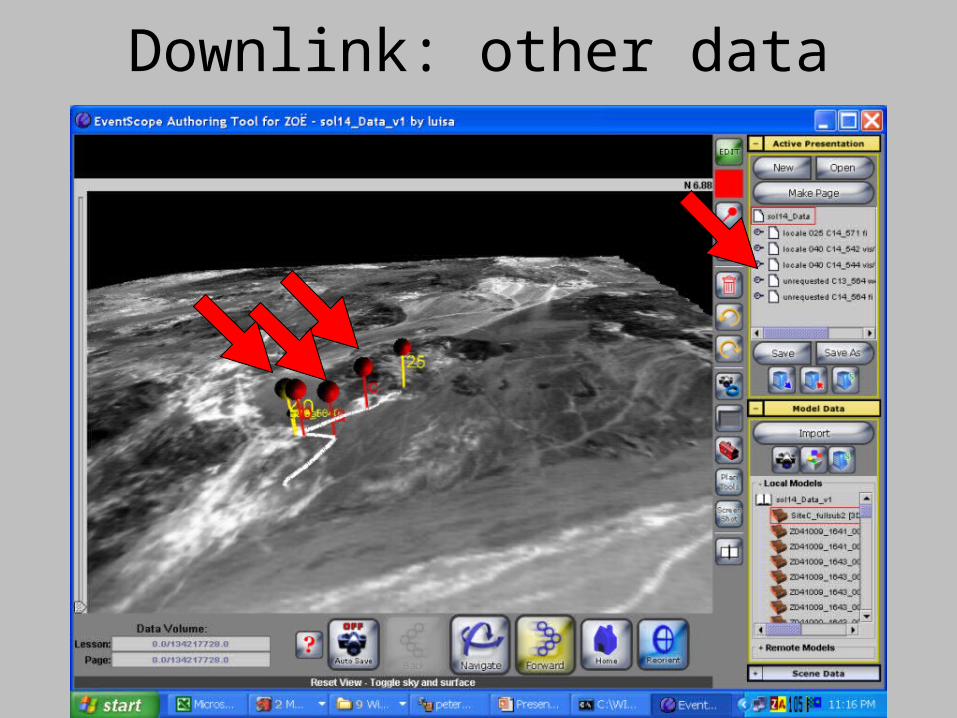
Downlink: other data

Other downlink screenshot Friday [note data from localization system]

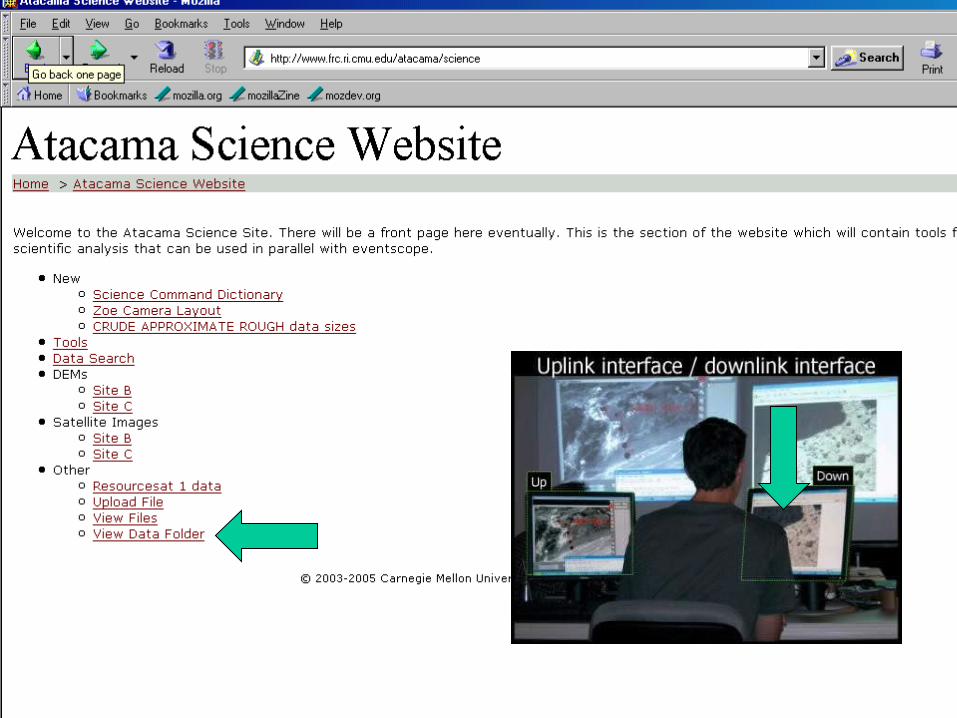
Dowlink via the Atacama Science website
[Dan Cuellar, David Seneker, Trey Smith]

Atacama science web site contains:
– View Data Folder [this was the primary resource during the mission]
– The ability for team members to upload files
– Documents [science command dictionary, Zoë camera layout, data size chart [rough sizes]
– Orbital data– Tools [search, etc.]


Downlink interface• What worked
– Request ID system, though hard at first was a huge improvement over 03
– Web– Data access through pins [on prototype level]– Visualization that represented the path of the rover
• What needs improvement– Data access through pins either needs to be improved or
scrapped. Depends on rover localization and other factors– Improve 3D pan data if we want to navigate within the pan– Focus on usability of web, but keep it simple
• Take a look at science reports [Lucia example, Trey example, Geb ideas]

Take a look at science reports for data representation ideas [Lucia example, Trey examples, Geb ideas]

Triangulation tool

Triangulation tool

Triangulation tool

Triangulation tool

Triangulation tool

Triangulation tool: Next
• Good concept and potentially very valuable for operations [note rover localization issues]
• Needs more testing with real datasets [prioritize in relation to competing priorities]
• Needs better focus on usability• Address texture and DEM registration

Remote experiences at museums

Remote Experiences for the public
• 3D Virtual Environment updates each day for public and museum downloads

EventScope remote experience .pse files

Conclusions from 2nd ops debriefing• Round trip data tracking
– Great progress with request ID and database system– Perhaps make it more visual
• Improve testing schedule through integration with rover team• Thumbnails for science website
– Lucia ideas, Geb ideas, Trey ideas, include other ethnographic feedback
• Distributed ops– VNC worked great, but need better speaker phone system
• Better integration of orbital data– Suggest conducting orbital pre-mission using distributed operations prior to on site live expedition
• Enables us to familiarize ourselves with orbital data, align coordinate frames, etc.• Enables us to refine distributed operations prior to live mission
• Expand mission templates: Nathalie’s standard package idea• Bore site the spectrometer• Room: Create more individual work areas [now possible]

Overall conclusions• Most findings from 03 shakedown test incorporated into 04 ops…[but need testing-
integration time to reap full benefits]• Uplink vs. downlink interfaces
– Use ops interface • For uplinking• To visualize the path of the rover
– Use web for downlinking
• Improve map registration• Finish triangulation tool• Keep ops room the same, utilizing benefits of new amenities
– Improve printing
• Question: In 2005 will we be targeting rover’s within the pan? Role of 3D pan data • Quick look plan simulator: clarify next steps [prioritize]• Get feedback from ethnographers• Base ops interface on E/PO interface to reduce the number of buttons?• Camera positions/ context images: Chong slides and context images for rover?

Remote ops discussion

ContactPeter [email protected]