remote desktop protocol performance improvements€¦ · microsoft remote desktop protocol...
TRANSCRIPT

MICROSOFT
Remote Desktop Protocol
Performance Improvements in Windows Server 2008 R2 and Windows 7
Microsoft Corporation
January 2010

Copyright This document is provided “as-is”. Information and views expressed in this document, including URL and
other Internet Web site references, may change without notice. You bear the risk of using it.
This document does not provide you with any legal rights to any intellectual property in any Microsoft
product. You may copy and use this document for your internal, reference purposes. This document is
confidential and proprietary to Microsoft. It is disclosed and can be used only pursuant to a non-
disclosure agreement.
© 2010 Microsoft. All rights reserved.
Microsoft, Aero, ClearType, Internet Explorer, PowerPoint, Silverlight, Windows, Windows Media,
Windows Server, and Windows Vista are trademarks of the Microsoft group of companies. All other
trademarks are property of their respective owners.

Contents Copyright ....................................................................................................................................................... 2
Contents ........................................................................................................................................................ 3
Overview ....................................................................................................................................................... 4
User Scenarios ............................................................................................................................................... 5
Test Setup ..................................................................................................................................................... 6
Remote Desktop Connection Settings ...................................................................................................... 6
Presentation Virtualization ........................................................................................................................... 8
Color Depth ............................................................................................................................................... 8
ClearType Virtualization (a.k.a. Font Smoothing) ................................................................................... 10
Desktop Composition .............................................................................................................................. 11
Embedded Multi-Media Performance .................................................................................................... 12
Multi-Media Redirection ......................................................................................................................... 14
Effects of Latency on Broadband Remoting Performance ...................................................................... 15
Conclusion ................................................................................................................................................... 16
Appendices .................................................................................................................................................. 17
Appendix A. Hardware Configuration ..................................................................................................... 17
Appendix B. Understanding Network Traffic Profiles ............................................................................. 18

Overview With the release of the Windows Server®°2008 R2 and Windows®°7 operating systems, Remote Desktop
Protocol (RDP) is more feature rich, enabling new presentation and remote-oriented functionality such
as accelerated bitmap rendering, multi-media redirection streaming, and network topology awareness.
In short, RDP is better able to support today’s ever increasingly complex and rich multi-media
environment.
As these features become integrated in the enterprise environment, it is important to analyze and
understand their impact on your current network infrastructure and the end-user experience. This paper
details different RDP features and the potential improvements to usability and quality of the end user
remoting experience as well as system deployment metrics. It also includes performance considerations
for individual features that can help guide your decisions when modifying your deployment
configuration to improve performance or tune it to the specific needs of your end users.
To test the impact of different features and compare RDP 7.0 to the previous RDP 6.1 version, we
performed a variety of tests by using automated and simulation tools to demonstrate the user scenarios
outlined in this white paper. These tests are broken down into two broad groups: a set that simulated a
user working with actual Microsoft® Office applications at realistic speeds, and a set of multi-media
scenarios that simulated a rich media environment commonly expected by today’s and tomorrow’s
users. In addition, some of the scenarios have been run at increased network latencies to demonstrate
the viability of using RDP in distributed environments, such as in Branch offices or telecommuting
scenarios where broadband capabilities exist.
Comparisons of previous versions of RDP are covered in previous white papers. However, their results
cannot be directly compared to the results presented in this white paper because the test server/client
hardware as well as networking, the scenarios, and Office applications have all been updated to reflect
current industry expectations. For example, the display sizes used have been updated to reflect higher
desktop resolutions.

User Scenarios Five different user scenarios were used to measure the performance of the Remote Desktop Connection
(RDC) client.
Executive/Complex PowerPoint Scenario. This scenario emulates a user presenting 43 high-
fidelity slides by using Microsoft Office PowerPoint® 2007. The slides contain images,
transitions, and backgrounds with color gradient. The user spends a minimum of 20 seconds
viewing each slide.
Simple PowerPoint Scenario. This scenario emulates a user presenting content by using
PowerPoint 2007. The slides in this scenario are more text-intensive than those in the executive
PowerPoint scenario and have plainer backgrounds and simpler images in the form of black
diagrams.
Typing and Scrolling Scenario. This scenario emulates a user that is using Microsoft Office Word
2007. First the user opens a document and resizes its window and then highlights and changes
the font (to Arial 10 point). Then the user opens a 17-page document (the RDP 5.1 compared to
RDP 6.0 comparison white paper) and then resizes this document two times before starting to
scroll through this document at around 2 pages per minute (at a minimum of 800 milliseconds
per line of text). After completing the scrolling, a new document is opened and 1068 lines of text
consisting of 7059 words is typed into it at a maximum rate of four characters per second, which
equates to an average user typing at 35 words per minute.
Internet Explorer Scenario. This scenario emulates a user browsing the Web by using Windows
Internet Explorer® 8. The user browses and scrolls through multiple Web pages that contain a
mix of text, natural images, and some schematic diagrams. The rate of scrolling is one line every
200 milliseconds, and this Web page takes around ten minutes to scroll through. The Web pages
are stored on the local disk drive of the Remote Desktop Session Host (RD Session Host) server
to avoid errors due to varying load times.
Multi-Media Sample 1. This scenario contains a short variable bit-rate Adobe Flash-encoded
video embedded in a Web page that is stored on the local hard drive of the RD Session Host
server. The video is played within Internet Explorer 8 by an embedded player plug-in. This
scenario emulates users viewing rich content Web pages containing multi-media. The resolution
of the Adobe Flash video is 1152 by 688 pixels.
Multi-Media Sample 2. This scenario contains a short fixed bit-rate Silverlight®-encoded video
embedded in a Web page that is stored on the local hard drive of the RD Session Host server.
The video is played within Internet Explorer 8 by an embedded player plug-in. This scenario
emulates users viewing rich content Web pages containing multi-media. The resolution of the
Silverlight video is 1024 by 576 pixels, its total data rate is 5000 kilobits per second (Kbps), and it
renders at 29 frames per second (fps) with 64 Kbps mono auto.
Multi-Media Sample 3. This scenario contains a thirty-second Windows Media® (WMV)-
encoded video at 29 frames per second at a resolution of 1280 by 720 pixels with a 192 Kbps
audio track. This scenario is used to test multi-media redirection.

Test Setup The tests were conducted in a private lab to avoid external network interference. The results in this
white paper are the average of three to five test runs depending on the standard deviation between the
individual runs. Details of the server and client systems used can be found in the Appendices together
with additional details of how certain measurements were taken, and how they should be interpreted.
Remote Desktop Connection Settings Tests were run by using the following range of Remote Desktop Connection client settings. As the
RDP 6.1 client and RDP 7.0 client vary in their interfaces slightly, both are fully detailed. All test results
indicate the setting combinations used for testing when a one-to-one direct mapping did not exist.
Color depth: High Color (16-bit) and Highest Quality (32-bit)
Connection speed setting on the Experience tab:
a. Windows Vista® with Service Pack 1 client
Default: Modem - 56 kilobits per second (Kbps)
LAN: 10 megabits per second (Mbps) or higher
b. Windows 7 client:
Default: Low-speed broadband - 256 Kbps to 2 Mbps
LAN: 10 Mbps or higher
WAN: 10 Mbps or higher with high latency
Default bulk compression and persistent bitmap caching settings
Font smoothing (ClearType®): On or Off
Desktop composition (Aero®Glass): On or Off

Chart 1 shows all the different client configuration options used in this report and their default settings.
RDP
version
Client
connection
setting
Desktop
background
Font
smoothing
Desktop
composition
Show
contents
while
dragging
Menu and
window
animation
Visual
styles/themes
Persistent
bitmap
caching
6.1 Default
Modem
56 Kbps
6.1 LAN
7.0 Default
Low-speed
broadband
7.0 LAN
7.0 WAN
Chart 1: Client configuration options used in this report and their default settings
Presentation Virtualization
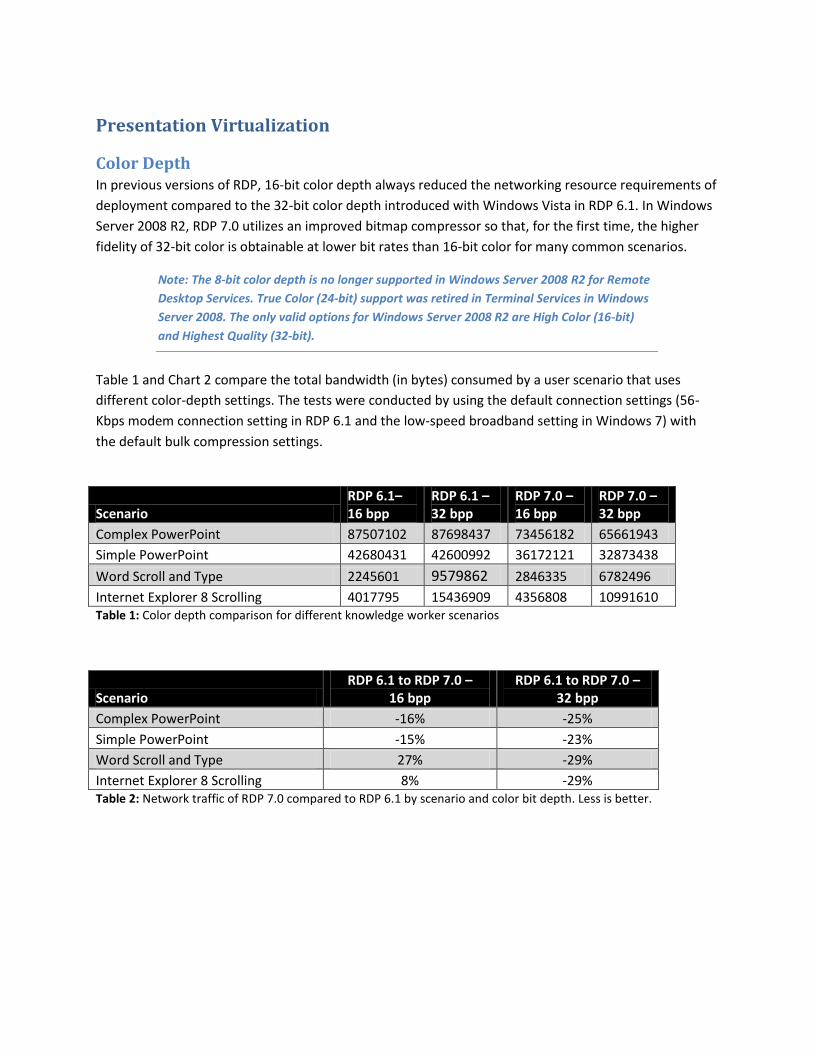
Color Depth In previous versions of RDP, 16-bit color depth always reduced the networking resource requirements of
deployment compared to the 32-bit color depth introduced with Windows Vista in RDP 6.1. In Windows
Server 2008 R2, RDP 7.0 utilizes an improved bitmap compressor so that, for the first time, the higher
fidelity of 32-bit color is obtainable at lower bit rates than 16-bit color for many common scenarios.
Note: The 8-bit color depth is no longer supported in Windows Server 2008 R2 for Remote
Desktop Services. True Color (24-bit) support was retired in Terminal Services in Windows
Server 2008. The only valid options for Windows Server 2008 R2 are High Color (16-bit)
and Highest Quality (32-bit).
Table 1 and Chart 2 compare the total bandwidth (in bytes) consumed by a user scenario that uses
different color-depth settings. The tests were conducted by using the default connection settings (56-
Kbps modem connection setting in RDP 6.1 and the low-speed broadband setting in Windows 7) with
the default bulk compression settings.
Scenario RDP 6.1– 16 bpp
RDP 6.1 – 32 bpp
RDP 7.0 – 16 bpp
RDP 7.0 – 32 bpp
Complex PowerPoint 87507102 87698437 73456182 65661943
Simple PowerPoint 42680431 42600992 36172121 32873438
Word Scroll and Type 2245601 9579862 2846335 6782496
Internet Explorer 8 Scrolling 4017795 15436909 4356808 10991610 Table 1: Color depth comparison for different knowledge worker scenarios
Scenario RDP 6.1 to RDP 7.0 –
16 bpp RDP 6.1 to RDP 7.0 –
32 bpp
Complex PowerPoint -16% -25%
Simple PowerPoint -15% -23%
Word Scroll and Type 27% -29%
Internet Explorer 8 Scrolling 8% -29% Table 2: Network traffic of RDP 7.0 compared to RDP 6.1 by scenario and color bit depth. Less is better.

Chart 2: Color depth comparison for different scenarios
Chart 3: Network traffic of RDP 7.0 compared to RDP 6.1 by scenario and color bit depth. Less is better.

Tables 1 & 2 and Charts 2 & 3 show that RDP 7.0 is more efficient at remoting bitmap-rich content by
reducing between 15% to 29% the total network traffic generated for 32-bit color depth displays. 16-bit
color depth is less effective with reduction in bandwidth for PowerPoint, Web browsing, and Word
scrolling and typing.
ClearType Virtualization (a.k.a. Font Smoothing) ClearType® display technology is a Microsoft font smoothing technique that improves the readability of
text on LCD screens. With the proliferation of LCD screens and the release of Windows°Vista,
Windows 7, and Office 2007, ClearType has become very important. Most of the fonts available in
Windows°Vista and Office 2007 are tuned for ClearType and look unattractive when it is turned off. Due
to these reasons, Remote Desktop Services decided to give the user the option to turn on ClearType.
You can get ClearType in the Remote Desktop Connection (RDC) 7.0 client by going to the Experience
tab and selecting Font smoothing. However, the high fidelity of ClearType comes at a cost.
Normally (with Font smoothing disabled) fonts are transmitted as glyphs. Remote Desktop Protocol
transmits glyphs efficiently and caches them to reduce bandwidth consumption. With ClearType
enabled, fonts are transmitted as bitmaps and not as glyphs; transmitting these bitmaps to the client
results in increased bandwidth consumption. From our initial internal testing, we found that enabling
ClearType for text scrolling and typing scenarios resulted in an increase in bandwidth consumption that
was 79% to 83% greater than when the scenario was run with ClearType disabled (in contrast to RDP 6.1
where enabling ClearType cost between 1x and 2x of extra bandwidth). In RDP 7.0, ClearType can be
enabled in many instances without significant impact in bandwidth compared to RDP 6.1.
Table 3 and Chart 4 show the total bandwidth consumption (in Bytes) for user scenarios running at 16-
and 32-bit color depths with the LAN connection setting + ClearType or Font smoothing explicitly turned
off or on.
RDP version Font smoothing enabled
Font smoothing disabled
Bandwidth increase using font smoothing
RDP 6.1 - 16bpp 5039496 2441593 106%
RDP 6.1 - 32bpp 30295938 9579862 216%
RDP 7.0 - 16bpp 5465492 3059905 79%
RDP 7.0 - 32bpp 12371554 6771320 83%
Table 3: Total bandwidth consumption for ClearType text versus Normal text

Chart 4: Bandwidth consumption for Font smoothing On and Off
Font smoothing is disabled by default on the RDC client, and can be enabled on the Experience tab
either explicitly by selecting the Font smoothing check box or by setting a faster connection type setting
such as LAN or WAN. The RemoteApp Wizard enables font smoothing by default. In Windows
Server°2008 R2, to provide a mechanism to control this setting for all RDP 7.0 remote clients, you can
apply a Group Policy setting to disable font smoothing.
Desktop Composition The Desktop composition feature fundamentally changes the way applications display pixels on the
screen. When Desktop composition is enabled, individual windows no longer draw directly to the screen
or primary display device as they did in earlier versions of Windows. Instead, their drawing is redirected
to off-screen surfaces in video memory, which are then rendered into a desktop image and presented
on the display.
Desktop composition is performed by the Desktop Window Manager (DWM), a new component
introduced in Windows Vista. Through desktop composition, DWM enables visual effects on the desktop
as well as in various features, such as glass window frames, 3-D window transition animations, Windows
Flip, and Windows Flip 3D.
Remote Desktop Protocol was extended to support desktop composition remoting (or, composed mode
RDP). This is achieved by transmitting composition commands from DWM on the server to the RDC
client. The client interprets these commands and renders the desktop. The composition commands can
lead to increased bandwidth consumption, but provide the distinguishable look and feel of the

Windows 7 desktop experience. Multiple features of the Windows 7 desktop took advantage of the
desktop composition technology.
In RDP 7.0, desktop composition has a higher impact on the Word typing and scrolling scenario than on
the PowerPoint scenarios. Desktop composition remoting is only available when connecting from a
Windows Vista computer to another Windows Vista computer or Windows 7 computer, and between a
Windows 7 computer and a server running Windows Server 2008 R2.
Scenario Desktop composition ON Desktop Composition OFF
Complex PowerPoint 66770232 66043451
Simple PowerPoint 35498220 32873438
Word Scroll and Type 12542409 6788096
Table 4: Total server to client network bandwidth used varies by desktop composition
Chart 5: Total server to client network bandwidth used varies by desktop composition
Embedded Multi-Media Performance High fidelity video playback is a new and potentially very taxing scenario for desktop remoting. In a later
section of this report we show a new technology for streaming video to the remote client for local
rendering. In cases where this is not possible, such as for training materials or banner advertisements
embedded in Web-pages, two technologies that are commonly used are Adobe Flash and Microsoft
Silverlight. In this section, we examine RDP performance when remoting such content.

Note: All runs had Remote Desktop Audio Redirection enabled.
For information about the rendering rate calculations used, see Appendix B.
RDP 7 display color depth Flash-IE8 Silverlight-IE8
16 bpp 791425873 895101286
32 bpp 986870751 1148268703
Table 5: Total bytes sent from server to client at default settings
RDP 7 display color depth Flash-IE8 Silverlight-IE8
16 bpp 41.6 46.4
32 bpp 50.2 60.1
Table 6: Bandwidth usage in megabits per second (Mbps) from server to client at default settings
Chart 6: Bandwidth usage from server to client in megabits per second (Mbps) for embedded multi-
media presenting using client default settings
To achieve a better visual update rate, RDP 7.0 is sending more data between the server and client even
though we have already previously noted that it is more efficient at compressing and transmitting
bitmap data than RDP 6.1. The following tables and charts measure the amount of graphical data
rendered at the remote client; this is in effect how much of the remote user’s screen has been updated.
A higher value here indicates a higher visual update rate and thus a much richer and smoother multi-
media user experience.

RDP 7 display color depth Flash-IE8 Silverlight-IE8
16 bpp 9.3 13
32 bpp 11.7 17.3
Table 7: Effective frames per second client rendering rates
Chart 7: Effective frames per second client rendering rates
Multi-Media Redirection Multimedia redirection functionality was introduced with RDP 7.0 and allows using the rendering
capability of the client to play video files. When a client and a server support the same set of codec, the
video file without decompressing is sent to the client for rendering and playing.
In contrast, RDP 6.1 clients always rendered the video files on the server and sent them as a set of
bitmaps to the client to present. The video quality was poor, and is represented in the data set with very
low frame rate (less than 5 frames per second with 400 KB on the wire). The issue with playing back fast-
moving multimedia content in RDP 6.1 was related to the fact that each frame had to be treated as a
distinct bitmap image, and was compressed inefficiently. The original compression format of the image
is a much more efficient compression for the nature of multi-frame video content, and beginning with
RDP 7.0, we are keeping the video in this efficient format as it reaches the bottleneck of the system –
the network. We also don’t waste any additional CPU cycles on the server by decompressing and then
recompressing and encoding the multimedia data to send to the clients.
Display bit depth Avg bandwidth/sec wildlife media FrameRate
16 bpp 1212169 29 fps
32 bpp 1224795 29 fps
Table 8: Average bandwidth and frame rate for media redirection in RDP 7.0

Effects of Latency on Broadband Remoting Performance Both the Branch Office and Telecommuter usage scenarios are affected by limited bandwidth and
increased latencies between the remote users’ client computers and the data center/central computer
facilities they are actually utilizing. For non multi-media applications, such as common knowledge
worker scenarios, the main limitation affecting users is that of medium to higher latency networks,
which might or might not have sufficient bandwidth. As both broadband speed and their availability
increases, higher latency networks will become a more common situation faced by remote desktop
users. Although bandwidth limits are increasing, in many cases round trip latencies are already reaching
their combined network infrastructure switching and speed-of-light limits. For testing these scenarios,
we have assumed sufficient bandwidth exists for the test scenarios and then set the round trip latency
to 100 milliseconds (i.e. 50 msec each way) by using a specialized Wide Area Network (WAN) simulator.
100 msec is typical of coast-to-coast networking delays. We have tested both knowledge worker and
media-rich scenarios.
In many Windows GDI-based knowledge worker applications, the remote server-based application
completes roughly the same amount of drawing onto the remote users’ screen no matter how fast the
network or client system can render the data stream generated. This is contrary to many video encoding
systems that ‘drop’ frames of screen data when the downstream systems (such as network or decoders)
cannot keep up with the expected frame/data rate. If the remoting protocol is unable to efficiently
handle a particular set of network characteristics such as higher latencies, its effective bandwidth usage
will drop; however, as it still renders the same graphical data, the users’ experience will degrade as
graphical data is delivered more slowly than it is actually produced at the remote server. To
demonstrate these effects, we measured the total time an application took to run on the server as well
as how much network data it produced.
Total application time in seconds RDP version, color depth and client connection type setting
Complex PowerPoint – Local no delay
Complex PowerPoint – 100 msec RTT
Extra delay compared to no extra latency
RDP 6.1 – 16 bpp - default 902.6 993.6 10%
RDP 6.1 – 32 bpp - default 899.8 993.5 10%
RDP 6.1 – 16 bpp - LAN 900.7 992.2 10%
RDP 6.1 – 32 bpp - LAN 900.7 994.5 10%
RDP 7.0 – 16 bpp - default 901.4 989.9 10%
RDP 7.0 – 32 bpp - default 901.3 952.4 6%
RDP 7.0 – 16 bpp - WAN 901.9 933.9 4%
RDP 7.0 – 32 bpp - WAN 902.2 925.8 3%
Table 9: Application execution time when using a higher latency network

Chart 8: Extra delay experienced by remote users when running the complex PowerPoint scenario with
WAN simulators
Table 9 shows that RDP 7.0 32 bpp encoding, which reduced bandwidth needs, also helps with higher
latency networks. More importantly, RDP 7.0 has been made more network-aware, and when the user
indicates to RDP that it needs to better handle higher latency links by setting the client connection type
to the WAN setting, RDP 7.0 is able to reduce the negative effects of higher latency on the end-user
experience.
As the bandwidth requirements of the remote scenario increase, so do the benefits of this new RDP 7.0
feature.
Conclusion The test results, and more importantly, the actual end user experience, demonstrate that the
performance of Remote Desktop Protocol 7.0 in Windows Server 2008 R2 and Windows 7 is
substantially better than earlier RDP versions. Highlights include an improved user experience with color
depth and font smoothing, lower network bandwidth usage while being able to tolerate higher latency
network conditions, and redirection of Windows Media, allowing the possibility of full frame rate
remoting of high quality media on LANs on a par with playing multi-media locally.

Appendices
Appendix A. Hardware Configuration
Server: Dual Core AMD 2.4-GHz opteron processor in 1U server with 4 GB of RAM and dual SATA
Disks
Client computer and Network Capture computer: HP5150SFF Single Core AMD64 2.2-GHz
desktop computers with single 80-GB SATA Disks and ATI Graphics
Network switches: Netgear GS108 & FS108-gigabit Ethernet switches
WAN simulator: Intel 3.4-GHz P4HT Desktop with three Intel Pro gigabit PCI network cards
The logical networking layout shown in Diagram 1.
.
Diagram 1: Logical networking layout
Windows
Server 2008
GigaBit Ethernet
Managed Switch
Network
Capture
Machine
Windows
Server 2008
R2
Windows
Vista with
SP1
Windows 7
WAN
Simulator
GigaBit Ethernet
Switch
Dual-Boot Server
Identical Client Machines
Server traffic is
mirrored at
Ethernet frame level

Appendix B. Understanding Network Traffic Profiles
The network monitoring infrastructure records at a small granularity based on a timestamp for each
Ethernet packet received. Over the time a test is executed, we can measure the total amount of
bandwidth consumed by the server to client traffic. In many cases the total bandwidth consumed is
enough to indicate how well a protocol is working compared to a previous version. In some cases
network engineers need to know the average bandwidth consumed per user session over the time the
session is performing useful work. We calculated this based on average mean bandwidth consumed (i.e.
the total bandwidth consumed divided by the total time for the network measurement). The last
important measurement is that of how uniform the network traffic bandwidth distribution is. For this
we used the peak bandwidth consumed over a fixed small time period, in this case a one-second
interval. This peak number can be used to act as additional guidance in provisioning of a network.
Diagram 2: Details of network measurements
Instantaneous Bandwidth Used
Time
Peak BW
Measured over a Small Interval of Time
Average BW Measured Over Total Time
Small Time Interval
Total Measurement Run Time
Total BW used for test
= ∑ of all instantaneous
BW measurements