remittance markets in africa - cbd
TRANSCRIPT
D I R E C T I O N S I N D E V E L O P M E N T
Finance
Remittance Markets in Africa
Sanket Mohapatra and Dilip Ratha
Editors
Pub
lic D
iscl
osur
e A
utho
rized
Pub
lic D
iscl
osur
e A
utho
rized
Pub
lic D
iscl
osur
e A
utho
rized
Pub
lic D
iscl
osur
e A
utho
rized

Remittance Markets in Africa

Remittance Markets in AfricaSanket Mohapatra and Dilip Ratha
Editors
© 2011 The International Bank for Reconstruction and Development / The World Bank1818 H Street NWWashington DC 20433Telephone: 202-473-1000Internet: www.worldbank.org
All rights reserved
1 2 3 4 14 13 12 11
This volume is a product of the staff of the International Bank for Reconstruction andDevelopment / The World Bank. The findings, interpretations, and conclusions expressed in thisvolume do not necessarily reflect the views of the Executive Directors of The World Bank or thegovernments they represent.
The World Bank does not guarantee the accuracy of the data included in this work. The bound-aries, colors, denominations, and other information shown on any map in this work do not implyany judgement on the part of The World Bank concerning the legal status of any territory or theendorsement or acceptance of such boundaries.
Rights and PermissionsThe material in this publication is copyrighted. Copying and/or transmitting portions or all ofthis work without permission may be a violation of applicable law. The International Bank forReconstruction and Development / The World Bank encourages dissemination of its work andwill normally grant permission to reproduce portions of the work promptly.
For permission to photocopy or reprint any part of this work, please send a request with com-plete information to the Copyright Clearance Center Inc., 222 Rosewood Drive, Danvers, MA01923, USA; telephone: 978-750-8400; fax: 978-750-4470; Internet: www.copyright.com.
All other queries on rights and licenses, including subsidiary rights, should be addressed to theOffice of the Publisher, The World Bank, 1818 H Street NW, Washington, DC 20433, USA; fax:202-522-2422; e-mail: [email protected].
ISBN: 978-0-8213-8475-6eISBN: 978-0-8213-8553-1DOI: 10.1596/978-0-8213-8475-6
Library of Congress Cataloging-in-Publication DataRemittance markets in Africa / Sanket Mohapatra and Dilip Ratha, editors.
p. cm.Includes bibliographical references and index.ISBN 978-0-8213-8475-6—ISBN 978-0-8213-8553-1 (electronic)
1. Emigrant remittances—Africa, Sub-Saharan. 2. Economic development—Finance—Africa,Sub-Saharan. 3. Africa, Sub-Saharan—Emigration and immigration—Economic aspects. 4. Africa, Sub-Saharan—Economic conditions. 5. Financial services industry—Africa, Sub-Saharan. 6. Africans—Economic aspects—Europe, Western. 7. Immigrants—Economicaspects—Europe, Western. I. Mohapatra, Sanket, 1975- II. Ratha, Dilip. HG3982.R46 2011332.450869120967—dc22
2011013215Cover illustration: Diana Ong/SuperStock/by Getty ImagesCover design: Drew Fasick
v
Contents
Foreword xvAcknowledgments xviiAbbreviations xix
PART I Overview 1
Chapter 1 Migrant Remittances in Africa: An Overview 3Sanket Mohapatra and Dilip Ratha
Recent Remittance Trends in Africa 6Macroeconomic Impacts of Remittances 11Impact on Households 16Remittance Markets in Africa 26Policies for Leveraging Remittances
for Development 38Overview of Remittance Market Surveys
in Africa and Two Remittance-Source Countries 42Annex 1.1 50Annex 1.2 51Notes 54References 59
vi Contents
PART II Remittance Markets in Remittance-ReceivingCountries 71
Chapter 2 Burkina Faso 73Yiriyibin Bambio
Remittance and Migration Trends 74Characteristics of the Remittance Industry 77The Regulatory and Business Environment 81Conclusions and Recommendations 86Annex 2.1 87Notes 88References 88
Chapter 3 Cape Verde 91Georgiana Pop
Remittance and Emigration Trends 91Characteristics of the Remittance Industry 96Access to Other Financial Services 100The Regulatory and Business Environment 100Remittance Costs and Identification Requirements 103Conclusions and Recommendations 106Annex 3.A Financial Sector Development
in Cape Verde 109Notes 110References 110
Chapter 4 Ethiopia 113Alemayehu Geda and Jacqueline Irving
Recent Migration Trends 114Remittance Sources and Trends 114Characteristics of the Remittance Industry 116The Regulatory and Business Environment 124Remittance Costs 126Customer Identification Requirements 127Conclusions and Policy Implications 127Annex 4.1 Banks and MTOs Interviewed
for the Study of the Ethiopian Remittance Services Industry 130
Contents vii
Notes 130References 131
Chapter 5 Ghana 133Peter Quartey
Remittance and Migration Trends 133Characteristics of the Remittance Industry 138The Regulatory and Business Environment 145Conclusions and Recommendations 149Notes 151References 152
Chapter 6 Kenya 155Rose W. Ngugi
Remittance and Migration Trends 156Characteristics of the Remittance Industry 158The Regulatory and Business Environment 172Conclusions and Recommendations 178Notes 182References 182
Chapter 7 Nigeria 185Chukwuma Agu
Remittance and Emigration Trends 187Characteristics of the Remittance Industry 190The Regulatory and Business Environment 199Conclusions and Recommendations 210Notes 216References 217
Chapter 8 Senegal 221Fatou Cisse
Remittance Trends and Their Economic Significance 222Characteristics of the Remittance Industry
in Senegal 229The Regulatory and Business Environment 235Conclusion 238
Notes 239References 239
Chapter 9 Uganda 243Rose W. Ngugi and Edward Sennoga
Trends and Uses of Remittances 245Characteristics of the Remittance Industry 247Emerging Products: Mobile Money Transfers 256Transport Service for Domestic Remittances 258Remittances and Access to Financial Services 259Regulatory and Business Environment 260Remittance Costs and Identification
Requirements 262Conclusion 266Recommendations 267Notes 268References 268
PART III Remittance Markets in Remittance-Source Countries 271
Chapter 10 France 273Frederic Ponsot
Remittance and Migration Trends 273Characteristics of the Remittance Industry 278The Regulatory and Business Environment 295Conclusions and Recommendations 302Annex 10.1 308Acknowledgments 310Notes 311References 315
Chapter 11 United Kingdom 317Leon Isaacs
Migration and Remittance Trends 317Characteristics of the Remittance Industry 320The Regulatory and Business Environment 329
viii Contents
Conclusions and Recommendations 340Annex 11.1 Country-Specific Pricing Grids 344Notes 345References 346
Contributors 347
Boxes2.1 Remittances and Poverty Reduction in Burkina Faso 742.2 Remittances from Côte d’Ivoire 772.3 The Financial System in Burkina Faso 823.1 The Central Bank’s Regulatory and
Supervisory Role 1014.1 The Ethiopian Financial Sector 1174.2 Case Study: Birritu Express 1205.1 Informal RSP Case Study: A Shoe Seller at
Madina Market, Accra 1445.2 The Financial Sector in Ghana 1466.1 The M-PESA Money Transfer System 1626.2 Transport Industry and Money Transfer
Services in Kenya 1646.3 Hawala: The Somali Community-Based
Remittance System 1656.4 The Financial Sector in Kenya 1717.1 Geographic Nuances of Nigerian Migration
and Remittances 1887.2 Recharge Cards for Domestic and International
Remittances: The MTN Model 1927.3 The Financial System in Nigeria 1937.4 NIPOST’s Potential to Revolutionize the
Nigerian Remittance Market 1977.5 The Plague of Fraud in Remittance and
Other Electronic Fund Transfers 2119.1 Financial Institutions in Uganda 2489.2 SACCOs and MFIs as Providers of Domestic and
Cross-Border Remittance Services 2549.3 The Transport Sector as a Provider of Remittance
Services in Uganda and in East Africa 25810.1 French Banks and Sub-Saharan Migrants 28210.2 The BdE Experience: Developing Agent Networks 283
Contents ix
10.3 Loro/Nostro Accounts Enable African Banks to Collect Deposits in France 293
10.4 Telemedia and Tagattitude: New Channels for Micropayments to Mali 294
10.5 RSP Remittance Ceilings 30211.1 Case Study: A Formal Remittance Service Provider
Coping with Global Financial Crisis 31911.2 Case Study: A Shipping Company as Informal RSP 32311.3 Case Study: An Arab RSP with a Large Branch
Network in the United Kingdom 32411.4 Case Study: A Competitive Small Formal RSP 32611.5 The EU Payment Services Directive 330
Figures1.1 Remittances and Other Resource Flows to
Africa, 1990–2010 71.2 Sources of Remittances to Africa and All
Developing Regions in 2010 101.3 Stability of Resource Flows to Africa, 1990–2008,
by Source 121.4 External Debt as a Share of Exports from, and
Remittances to, Selected Countries 131.5 Shares of Remittance Recipients in Top Two
Consumption Quintiles, Selected Countries 181.6 Average Annual Remittance to Selected
Countries, by Source 191.7 Secondary and Tertiary Educational Attainment
of Remittance Recipient and Nonrecipient Households, Selected Countries 22
1.8 Household Bank Accounts in Selected African Countries, by Remittance Status 25
1.9 Cost of Sending Remittances 271.10 South-South Remittance Costs in Sub-Saharan Africa 281.11 Banking Networks and Costs, by Region 291.12 Factors Inhibiting Use of Formal Remittance Channels 301.13 Formal and Informal Remittance Channels in Africa 331.14 Average M-PESA Transaction Size,
March 2007–March 2009 351.15 Top Remittance Areas Needing Attention in
Sub-Saharan Africa 39
x Contents
2.1 Migrant Remittance Flows to Burkina Faso, WAEMU, and ECOWAS, 1974–2010 75
2.2 Obstacles to Providing Formal Remittance Services 832.A.1 Remittance Sources and Destinations, WAEMU vs.
Non-WAEMU Countries 872.A.2 Inward and Outward Remittances among
WAEMU Countries 883.1 Composition of External Financing for
Cape Verde, 1995 and 2007 923.2 Share of 2007 Remittances to Cape Verde
by Country of Origin 943.3 Cape Verdean Overseas Disapora, 2000 964.1 Remittance Flows to Ethiopia, 1990–2009 1165.1 Remittance Transmission Channels in Ghana 1355.2 Destinations of Ghanaian Emigrants 1365.3 Sources of Remittance Inflows to Ghana
through Banks, 2007 1395.4 RSP Types in Ghana 1415.5 Partnership Benefits to RSP Firms 1425.6 RSP Remittance Instruments 1435.7 Perceptions of Competition from Informal RSPs 1486.1 RSP Partnership Benefits 1686.2 Remittance Instruments Used by RSPs 1697.1 Foreign Direct Investment and Remittances in
Nigeria, 2005–09 1867.2 Peak Remittance Periods in Nigeria 1897.3 RSP Perceptions of Laws and Regulations as
Obstacles to Remittance Business 2017.4 RSP Perceptions of Barriers to Remittance
Business, by Type 2027.5 Perceptions of Informal RSPs as Competitors 2068.1 Volume of Migrant Workers’ Remittances to
Senegal, 2001–10 2228.2 Share of GDP from Migrant Workers’
Remittances, 2001–09 2238.3 Comparison of Remittance Flows to Senegal,
1995–2010, by Source 2268.4 Regional Coverage of Bank Branches in
Senegal, 2009 2318.5 MTO Remittance Market Shares in Senegal, 2009 232
Contents xi
8.6 RSP Firms’ Perceptions of Laws and Regulations as Obstacles to Providing Remittance Services in Senegal 236
10.1 Migrants in France, 2007, by Region of Origin 27410.2 Migrant Remittance Outflows from France, 1999–2007 27510.3 Comparisons of 2005 GDP Per Capita, by Region 27810.4 Distribution of Interviewed RSPs, by Type 28010.5 Distribution of Formal Remittance Flows, by Channel 29210.A.1 Formal Sector RSP Categories Identified in
the Catalog 30810.A.2 Categories of Formal Sector RSPs Interviewed 30910.A.3 Formal Sector Market Shares, by RSP Type 31011.1 Average Fees and Foreign Exchange Charges
for Remittances to Africa 32011.2 Prices to Send £100, by African Corridor 33511.3 Prices to Send £250, by African Corridor 33611.4 Comparison Remittance Fees to Africa over Three
Waves of Data 33611.5 Costs to Send Remittances to Africa and South Asia 33711.6 U.K. Remittances Customer Charter 342
Tables1.1 Remittances and Other Resource Flows
to Africa, 1990–2010 81.2 Securitization Potential for Sub-Saharan
Africa, 2009 141.3 Use of Remittances by Recipient Households
in Selected African Countries, by Source 201.4 Food Security Strategies and Remittances
in Ethiopian Households 241A.1 Household Access to Information and
Communication Technology in Selected African Countries, by Remittance Status 50
1A.2 Formal and Informal Remittance Channels, Select African Countries 51
2.1 RSP Types and Coverage in Burkina Faso 792.2 Money Transfer Instruments Offered by RSPs 802.3 Rates to Send $200 in Burkina Faso, by RSP type 843.1 International Remittance Flows to and from
Cape Verde, 2001–10 933.2 RSP Branches in Cape Verde 97
xii Contents
3.3 Business Partnerships for Remittance Services 973.4 Remittance Products, by RSP 993.5 Fees for Remittances to Cape Verde, by MTO 1054.1 Branches of Primary Remittance Service
Providers in Ethiopia 1184.2 Remittance Instruments in Ethiopia, by RSP Type 1214.A1 Ethiopia RSPs Interviewed 1305.1 Uses of Migrant Remittances in Ghana 1355.2 RSP Perceptions of Laws and Regulations
as Entry Barriers 1476.1 Remittance Inflows to Kenya 1576.2 Kenyan RSP Survey Sample Distribution 1596.3 Financial Services Coverage in Kenya, 2007 1616.4 Remittance Charges in Kenya, by RSP Type 1777.1 Branches and Coverage of Primary RSPs
in Nigeria 1917.2 Average Fees for Domestic Remittances in Nigeria 2077.3 Bank Fees for Outward International Remittances
in Nigeria, 2007–08 2088.1 Remittance Transfers by Use in Senegal, 2008 2248.2 Impact of Remittances on Poverty Rates,
by Location 2258.3 Sources of Remittances to Senegal, 2008,
by Location 2258.4 Principal Destinations of Senegalese International
Migrants, 2008 2288.5 Volume and Market Share of Remittance Transfers
in Senegal, by Method 2309.1 Remittance Trends in Uganda 2459.2 Participation of RSPs and Services Provided by RSPs
in Uganda, 2008 2499.3 Remittance Charges for Sending U.S. Currency, 2008 26310.1 Growth of Immigrant Population in France,
1999–2005, by Region of Origin 27610.2 Remittance Market from France to Selected
North African and Sub-Saharan Countries 27710.3 Remittance Channels Used by Senegalese
Migrants in France 28110.4 Transfer Channels from France to Mali,
Senegal, and Comoros 281
Contents xiii
10.5 Community-Based RSP Chain of Operations and Main Actors, by Role 287
10.6 Estimate of Total French Remittance Market from Average Transfer and Propensity Data (Model 1) 290
10.7 Estimate of the French Remittance Market from AfDB Country Data (Model 2) 290
10.8 Remittances from France to Selected Sub-Saharan African Countries 291
10.9 Main RSP Types and Coverage of Selected Remittance Corridors 297
10.10 Remittance Charges of African CBIP Partners, 2009 30010.11 Charges to Send €150 through Selected RSPs 30110.12 MTO Charges to Send €150 from Selected Countries 30110.A.1 Extrapolated Data 31010.A.2 Repartition of Extrapolated Data, by
Destination Country 31111.1 Average Fee and Foreign Exchange Charges 33411.2 Fee Comparison for Remittances to Africa,
2008 vs. 2007 33511.A.1.1 Remittance Pricing, by African Corridor 346
xiv Contents
xv
A substantive literature suggests that migration generates benefits formigrants, the host societies, and the countries of origin. The economicbenefits for the countries of origin are realized primarily through thereceipt of remittances. These large and stable resource flows remained rel-atively resilient during the global financial crisis compared to steepdeclines in private capital flows, and they have quickly recovered to theprecrisis levels. African countries are estimated to have received$40 billion in officially recorded flows in 2010, but the true size isbelieved to be far larger. Remittances are associated with reduction inpoverty, improved education and health outcomes, and increased avail-ability of funds for small business investments. Remittances represent apositive and relatively noncontroversial outcome of migration.
Despite the importance of remittances, the official data on remit-tance flows to Africa are weak, and remittance markets in Africaremain underdeveloped. Informal remittance channels continue todominate cross-border and domestic remittance flows in the region.The cost of sending remittances to Africa continues to remain signifi-cantly higher than those in more mature migration corridors, such asbetween Mexico and the United States.
Foreword
This volume brings together studies of remittance markets in eightSub-Saharan African countries and two key destinations for Africanmigrants outside the African continent. It provides an overview of theremittance markets, and the policy and institutional environments in bothsending and receiving countries. Based on primary surveys of remittanceservice providers about the types of remittance services, barriers to entryand exit, legal and regulatory environment, remittance costs, and innova-tive technologies, the chapters of this volume provide a unique windowinto the functioning of remittance markets in this region.
These country studies served as background material for a joint flagshipreport of the African Development Bank and the World Bank, LeveragingMigration for Africa: Remittances, Skills, and Investments, released in March2011. Reflecting the objective of the project to build local capacity inAfrican countries, the country studies were prepared primarily by localresearchers and institutions in Africa, France, and the United Kingdom.The chapter authors presented preliminary findings during a workshopconducted at the African Development Bank in Tunis (March 16–17,2009) and final findings at the World Bank in Washington, D.C. (March18, 2010). The country studies were then peer reviewed.
As discussed in the volume, measures to reduce remittance fees,increase market competition and consumer protection, increase theinvolvement of post offices and other non-bank institutions, and encour-age the extension of mobile money transfer services to cross-borderremittances will benefit the ultimate clients, the people of Africa. I hopethat the findings of this volume will motivate more research, improveddata collection, and policy action in the area of migrant remittances inAfrica.
Hans TimmerDirector
Development Prospects GroupThe World Bank
xvi Foreword
xvii
This volume represents a companion volume to Leveraging Migration forAfrica: Remittances, Skills, and Investments, a flagship report of the AfricaMigration Project. Most of the country studies of remittance marketsincluded in this volume are authored by local researchers and practition-ers located in the countries. This volume has benefited from the guidanceand direction of Hans Timmer.
This report benefited from the comments and suggestions of partici-pants at a workshop at the African Development Bank in Tunis on March16–17, 2009: Ernest Addison, Chukwuma Agu, David OlusanyaAjakaiye, Gisèle Aubut, Yiriyibin Bambio, Mohamed Bourenane, FatouCissé, Marie-Laure de-Bergh, Julie Fortin, Mandla Sizwe Gantsho,Patrick Giraud, Jacqueline Irving, Leon Isaacs, David Asiimwe Kihangire,Sarah Lahmani, Pedro de Lima, Sam Lugaraba, Albertine A. H. LipouMassala, Henriette B. Mampuya, Subha Nagarajan, Stefan Nalletamby,Léonce Ndikumana, Rose Ngugi, Kerry Nelson, Caglar Ozden, JohnPage, Marc Petzoldt, Sonia Plaza, Aruma Oteh, Peter Quartey, Neil Ruiz,Carlotta Saporito, Sara Johansson De Silva, Simon Turner, and RosemaryVargas-Lundius.
We are grateful to Neil Ruiz for coordinating the financial and admin-istrative aspects of the survey implementation, and to Sonia Plaza for
Acknowledgments
useful suggestions. Mirafe Marcos and Deepak Mishra provided help infacilitating interviews in Addis Ababa. Special thanks to Antonio C. Davidfor his contribution during the initial phase of the project to develop aharmonized survey questionnaire, identifying relevant country contacts,and for his participation in a mission to several African countries. TolaOni and Ani Silwal provided research assistance at various stages of theproject.
This report was made possible with the financial support for the AfricaMigration Project by the African Development Bank; CanadianInternational Development Agency (CIDA); U.K. Department forInternational Development (DFID); Ministry of Immigration, Integration,Asylum and Solidarity Development, France; Ministry of Foreign Affairs,Denmark; International Fund for Agricultural Development (IFAD); andSwedish International Development Cooperation Agency (Sida), and theWorld Bank.
Book design, editing, and production were coordinated by Mary Fisk,Steven McGroarty, and Denise Bergeron of the World Bank Office of thePublisher. We are especially grateful to Mary Fisk for her consistent sup-port, good humor, and patience through the process of editing this volume.We are thankful to Stephen McGroarty and Santiago Pombo-Bejarano fortheir support during the publication process.
Sanket MohapatraDilip Ratha
Editors
xviii Acknowledgments
xix
AfDB African Development BankAML anti-money-laundering (regulations)AML-CFT anti-money-laundering and combating the financing
of terrorism ATM automated teller machineBCEAO Central Bank of West African States (Banque
Centrale des États de l’Afrique de l’Ouest)BACB Agricultural and Commercial Bank of Burkina FasoBCA Atlantic Commercial Bank (Banco Comercial do
Atlântico) (Cape Verde)BCB Commercial Bank of Burkina FasoBCN Cape Verde Business Bank (Banco Caboverdiano
de Negócios)BCV Bank of Cape VerdeBdE Banque d’Escompte (France)BIA Inter-Atlantic Bank (Banco Interatlântico)
(Cape Verde)BIB International Bank of Burkina FasoBIM Banque Internationale pour le Mali BOFID Banks and Other Financial Institutions Decree
(Nigeria)
Abbreviations
CBAO Banking Company of West Africa (CompagnieBancaire de l’Afrique Occidentale) (Senegal)
CBIP Company of International Banks in Paris(Compagnie de Banques Internationales de Paris)
CCK Communication Commission of KenyaCECV Savings Bank of Cape Verde (Caixa Economica de
Cabo Verde) CVEsc Cape Verde escudo DMA Developing Markets Associates LtdDMB deposit money bankECOWAS Economic Community of West African StatesEEA European Economic AreaEFCC Economic and Financial Crimes Commission
(Nigeria)EFT electronic funds transferEML electronic money licenseFATF Financial Action Task Force (Nigeria)FDI foreign direct investmentFSA Financial Services Authority (United Kingdom)GDP gross domestic productGLSS Ghana Living Standards SurveyGSM Global System for Mobile CommunicationsHMRC Her Majesty’s Revenue and Customs (United
Kingdom)IMF International Monetary FundINSEE French National Institute for Statistics and
Economic Studies (Institut National de la Statistiqueet des Études Économiques)
K Sh Kenyan shillingKYC know-your-customer (regulations)MECSEF Mutual Savings and Loan of Senegalese France
(La Mutuelle d’Epargne et de Crédit des Sénégalaisde France)
MEF Ministry of Economy and Finance (Burkina Faso)MFI microfinance institutionMoFED Ministry of Finance and Economic Development
(Ethiopia)MSB money service businessMTO money transfer operator
xx Abbreviations
NBE National Bank of EthiopiaNIPOST Nigerian Postal ServiceODA official development assistancePE payment establishmentPI payment institutionPOS point of salePSD Payment Services DirectiveRSP remittance service providerRTGS real time gross settlement (funds transfer systems)SACCO savings and credit cooperative organizationSEPA Single Euro Payments AreaSFDP Société Financière de Paiement (joint venture of
Western Union and La Banque Postale)SG Société Générale (France)SONAPOST national postal service (Burkina Faso)SWIFT Society for Worldwide Interbank Financial
TelecommunicationUKMTA U.K. Money Transmitters AssociationVAT value added taxWAEMU West African Economic and Monetary Union
Note: All monetary amounts are U.S. dollars unless otherwise indicated.
Abbreviations xxi


PA R T I
Overview

3
Remittances are often said to be the most tangible and least controversiallink between migration and development (Russell 1992; Ratha 2007).Remittance flows to developing countries have increased substantiallyduring the past decade to reach $325 billion in 2010 (World Bank 2011).Remittances sent by 31 million international African migrants reachednearly $40 billion in 2010, equivalent to 2.6 percent of Africa’s grossdomestic product (GDP).
The data on African migration and remittance flows, however, arelikely to be understated because of the scale of undocumented migrationwithin the African continent, the prevalence of informal remittance chan-nels within the region, and the relatively weak official data in manyAfrican countries (World Bank 2006). The true size of remittance flowsto Africa, including unrecorded flows through formal and informal chan-nels, is believed to be significantly larger than the official data. After for-eign direct investment (FDI), recorded remittances are the Africancontinent’s largest source of foreign inflows.
Remittance receipts generate large benefits for the countries of originin Africa. The review of the literature and evidence presented in thischapter suggests that remittances tend to be stable, and often counter-cyclical, compared to other private flows and help to sustain consumption
C H A P T E R 1
Migrant Remittances in Africa: An Overview
Sanket Mohapatra and Dilip Ratha
and investment during economic downturns. Cross-country analysis andevidence from household surveys show that remittance receipts are asso-ciated with reductions in poverty, increased household resources devotedto investment, and improved health and education outcomes. Migrantremittances help smooth household consumption and act as a form ofinsurance for African households facing shocks to their income and liveli-hood caused by drought, famine, and other natural disasters. The securi-tization of future remittance flows—the use of hard currency remittancesas collateral to raise financing—can increase the access of African banksand firms to international capital markets and can be used to fund longer-term development and infrastructure projects.
In spite of the size, stability, and development implications of thesefinancial flows, this chapter suggests that remittance markets in Africaremain relatively underdeveloped. Africa has arguably the largest share ofcross-border remittances flowing through informal channels, and signifi-cantly higher remittance costs, compared with other, more mature remit-tance corridors (for example, from the United States to Mexico and fromthe Persian Gulf to South Asia). African migrants—especially those resid-ing in other African countries—and recipient households often havelimited access to formal remittance and banking services. A large share ofinternational remittances to Africa is channeled through a few large inter-national money transfer agencies, which sometimes work in exclusivepartnership with African banks and post offices.
The broader business and operating environment for provision of remit-tance services is relatively weak in many African countries. At the sametime, the rapid adoption of innovative money transfer and branchless-banking technologies is transforming the landscape for domestic orwithin-country remittances and potentially broader financial services inAfrica. However, the adoption of these technologies for cross-bordertransfers has been limited so far, in part because of concerns about moneylaundering and terrorist financing related to cross-border money transfers.
This volume represents an effort to better understand the current stateand issues in remittance markets in Africa and in selected remittance-source countries. It brings together studies of remittance markets for eightSub-Saharan African countries and in two key migrant-destination coun-tries outside the African continent conducted as part of the AfricaMigration Project in 2008–10. These studies served as background mate-rial for a joint regional report of the African Development Bank (AfDB)and the World Bank titled Leveraging Migration for Africa: Remittances,Skills, and Investments (AfDB and World Bank 2011).
4 Remittance Markets in Africa
The surveys of remittance service providers (RSPs) were implementedby primarily country-based researchers and institutions between 2008and 2009. The country studies cover recent migration and remittancetrends, business environments, services provided to remittance sendersand receivers, remittance costs, and innovations in the remittance market-place. Collectively, these studies provide a unique perspective of RSPsabout their business and operating environment, regulations governingremittance transfers, and innovations in remittance technologies across awide range of African countries.
In general, the country studies reflect the state of the remittance mar-kets in Africa and migrant-destination countries at the time of the sur-veys. Given the rapidly changing and dynamic nature of remittancemarkets in Africa, some of the key facts and trends (such as volumes ofremittances received, subscribers of mobile money-transfer services, andrecent regulatory changes) have been updated to reflect the latest infor-mation available. Many findings of the country studies—especially thediscussions of market structure and policy issues—are equally or evenmore relevant today in view of the increasing awareness of migrant remit-tances as a source of development financing for recipient countries andthe international efforts targeted at reducing the cost of internationalremittances.
This overview chapter outlines the implications of remittances forAfrica’s development and the related policy issues. It sets out the contextfor better understanding the importance of effective functioning of remit-tance markets for the livelihood strategies of African households. Thechapter also shows how migrant remittances serve essential consumptionneeds and act as an insurance against adverse shocks; contribute to thefuture productivity of Africans by providing funds for nutrition, educa-tion, and health; and improve their access to formal banking services andinformation and communication technology. In addition, it briefly dis-cusses the implications of remittances for growth, sovereign creditworthi-ness, and external financing. The chapter’s conclusion provides a bridge tothe remainder of the volume and summarizes the 10 remittance-marketcountry studies.
The overview chapter and country studies paint a nuanced picture ofnot only the opportunities, but also the many obstacles still to be over-come in the quest for providing affordable and transparent remittanceand broader financial services to the poorest in Africa. The cost of send-ing remittances to Africa, and especially within Africa, is the highestamong developing countries. The market for cross-border remittances
Migrant Remittances in Africa: An Overview 5
in Africa continues to be characterized by a high degree of informality,lack of effective competition, exchange controls on outward transfers, andoften-exclusive partnerships of international money transfer companieswith local banks and post offices that contribute to high costs and restrictmarket entry and competition. At the same time, the widespread adop-tion of mobile money transfers for domestic remittances represents asuccess story of how Africa has effectively leapfrogged the technologyfrontier to design and deliver technology solutions targeting the poorest.
This rest of the overview is organized as follows. We first discuss recenttrends and prospects for migration and remittances in Africa. Next, weexamine the implications of remittances for growth and access to exter-nal finance of African countries. The section on implication of remittancesfor the welfare of African households draws on the literature and recenthousehold surveys. The subsequent section reviews remittance costs,competition, legal and regulatory environments, and technological inno-vations in African remittance markets. We then discuss recent policy ini-tiatives and outline some policy options for better leveraging remittancesfor Africa’s development. The final section summarizes the studies ofeight remittance markets in Sub-Saharan Africa (chapters 2–9 of this vol-ume) and two key destination countries of African migrants: France andthe United Kingdom (chapters 10–11 of this volume).
Recent Remittance Trends in Africa
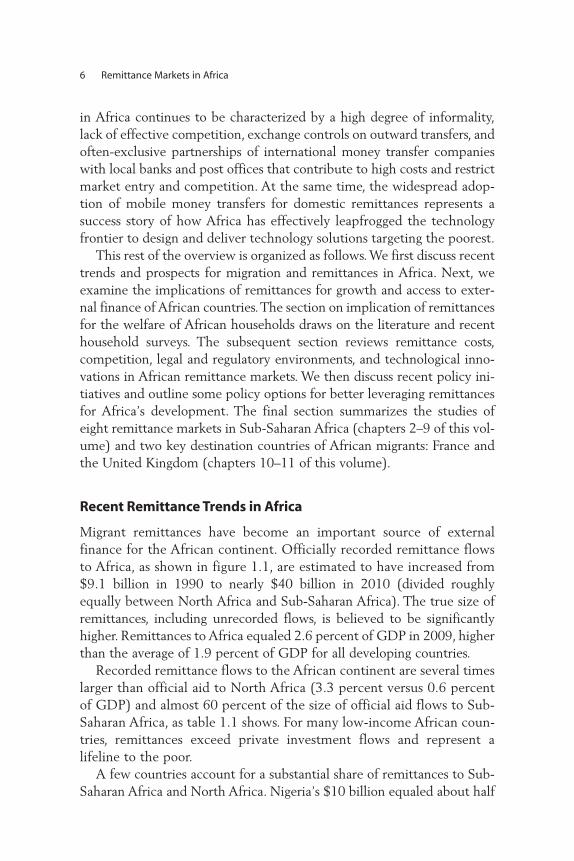
Migrant remittances have become an important source of externalfinance for the African continent. Officially recorded remittance flowsto Africa, as shown in figure 1.1, are estimated to have increased from$9.1 billion in 1990 to nearly $40 billion in 2010 (divided roughlyequally between North Africa and Sub-Saharan Africa). The true size ofremittances, including unrecorded flows, is believed to be significantlyhigher. Remittances to Africa equaled 2.6 percent of GDP in 2009, higherthan the average of 1.9 percent of GDP for all developing countries.
Recorded remittance flows to the African continent are several timeslarger than official aid to North Africa (3.3 percent versus 0.6 percentof GDP) and almost 60 percent of the size of official aid flows to Sub-Saharan Africa, as table 1.1 shows. For many low-income African coun-tries, remittances exceed private investment flows and represent alifeline to the poor.
A few countries account for a substantial share of remittances to Sub-Saharan Africa and North Africa. Nigeria’s $10 billion equaled about half
6 Remittance Markets in Africa
of all officially recorded remittances to Sub-Saharan Africa in 2010.Other large remittance recipients in Sub-Saharan Africa, in order ofimportance, include Sudan, Kenya, Senegal, South Africa, and Uganda.
As a share of GDP, however, the largest recipients are Lesotho(28.5 percent), Togo (10.7 percent), Cape Verde (9.4 percent),Senegal (9.3 percent), and The Gambia (8.2 percent). In NorthAfrica, the Arab Republic of Egypt and Morocco—the two largestrecipients in North Africa in terms of both U.S. dollar–denominatedflows and share of GDP—account for three-quarters of flows to NorthAfrica region, followed by Algeria and Tunisia.
These estimates of remittance inflows, based on data officiallyreported in the International Monetary Fund (IMF) balance of paymentsstatistics (IMF 2010a), are likely well below the actual volume of remit-tance flows to Africa. The remittance inflows data reported by countryauthorities themselves are often higher than the IMF figures. For exam-ple, Ghana’s central bank reported $1.6 billion in remittance inflows in
Migrant Remittances in Africa: An Overview 7
–20
19901999
20002001
20022003
20042005
20062007
20082009
2010e1998
19971996
19951994
19931992
1991
–10
0
10
20
30
40
50
60
US$
, bill
ion
s
FDI
official aid
private debt and portfolio equity
recorded remittances
Figure 1.1 Remittances and Other Resource Flows to Africa, 1990–2010
Sources: World Bank 2010c and Bank staff calculations. Note: FDI = foreign direct investment. 2010e = estimated amount.
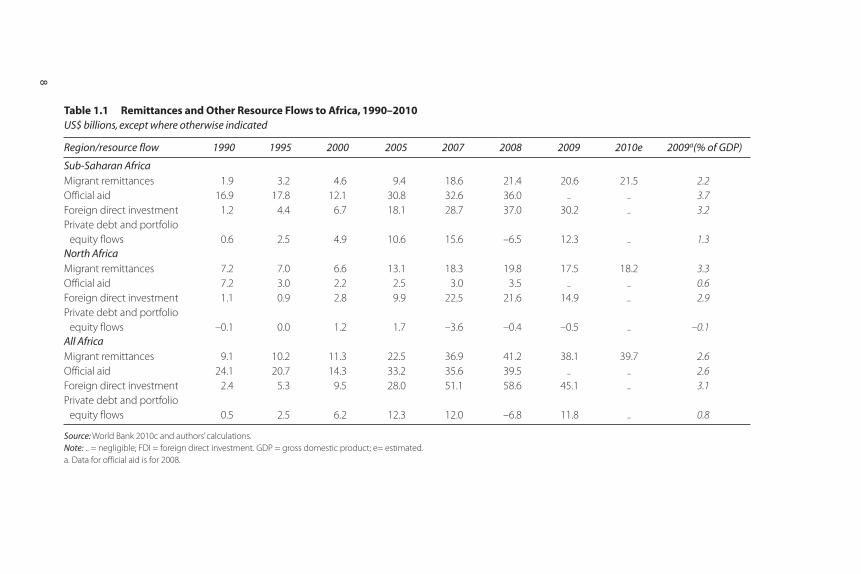
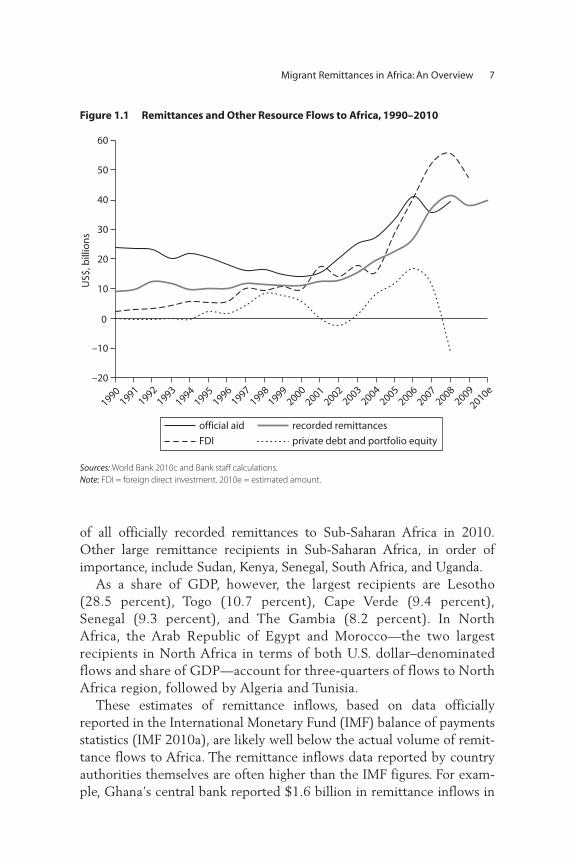
Table 1.1 Remittances and Other Resource Flows to Africa, 1990–2010 US$ billions, except where otherwise indicated
Region/resource flow 1990 1995 2000 2005 2007 2008 2009 2010e 2009a(% of GDP)
Sub-Saharan AfricaMigrant remittances 1.9 3.2 4.6 9.4 18.6 21.4 20.6 21.5 2.2Official aid 16.9 17.8 12.1 30.8 32.6 36.0 .. .. 3.7Foreign direct investment 1.2 4.4 6.7 18.1 28.7 37.0 30.2 .. 3.2Private debt and portfolio
equity flows 0.6 2.5 4.9 10.6 15.6 –6.5 12.3 .. 1.3North AfricaMigrant remittances 7.2 7.0 6.6 13.1 18.3 19.8 17.5 18.2 3.3Official aid 7.2 3.0 2.2 2.5 3.0 3.5 .. .. 0.6Foreign direct investment 1.1 0.9 2.8 9.9 22.5 21.6 14.9 .. 2.9Private debt and portfolio
equity flows –0.1 0.0 1.2 1.7 –3.6 –0.4 –0.5 .. –0.1All Africa Migrant remittances 9.1 10.2 11.3 22.5 36.9 41.2 38.1 39.7 2.6Official aid 24.1 20.7 14.3 33.2 35.6 39.5 .. .. 2.6Foreign direct investment 2.4 5.3 9.5 28.0 51.1 58.6 45.1 .. 3.1Private debt and portfolio
equity flows 0.5 2.5 6.2 12.3 12.0 –6.8 11.8 .. 0.8
Source: World Bank 2010c and authors’ calculations. Note: .. = negligible; FDI = foreign direct investment. GDP = gross domestic product; e= estimated. a. Data for official aid is for 2008.
8
2009—more than 10 times the $114 million reported in the IMF balanceof payments statistics. Ethiopia reported more than $700—about twicethe $353 million reported by the IMF. These discrepancies are in partrelated to the misreporting of migrant remittances with other types ofcurrent transfers, such as transfers to nongovernmental organizations andembassies and payments related to small-value trade transactions. In addi-tion, only about half of Sub-Saharan African countries report remittancedata with any regularity (Irving, Mohapatra, and Ratha 2010). And somecountries—such as the Central African Republic, the DemocraticRepublic of Congo, Somalia, and Zimbabwe, all of which are believed toreceive significant remittance flows—report no remittance data at all.Even fewer Sub-Saharan African countries report monthly or quarterlydata on remittances.1
Remittance flows through money transfer companies are often cap-tured indirectly (in the reporting of partner banks, for example), but theindependent operations of such firms may not be fully captured. Cross-border flows through other institutions (such as post offices, savingscooperatives, and microfinance institutions) and emerging channels (suchas mobile money transfer services) are not captured in most Sub-SaharanAfrican countries.
Surveys of migrants and remittance recipients and other secondarysources suggest that informal remittance flows, which are not included inthe IMF estimates, could be equal to or exceed official figures for Sub-Saharan Africa (Page and Plaza 2006; IFAD 2009). Central banks in someAfrican countries, such as Uganda, are making efforts to estimate theseinformal flows—through, for example, foreign exchange transactions dataand surveys of remittance-receiving households—but these efforts appearto be limited to a few countries.
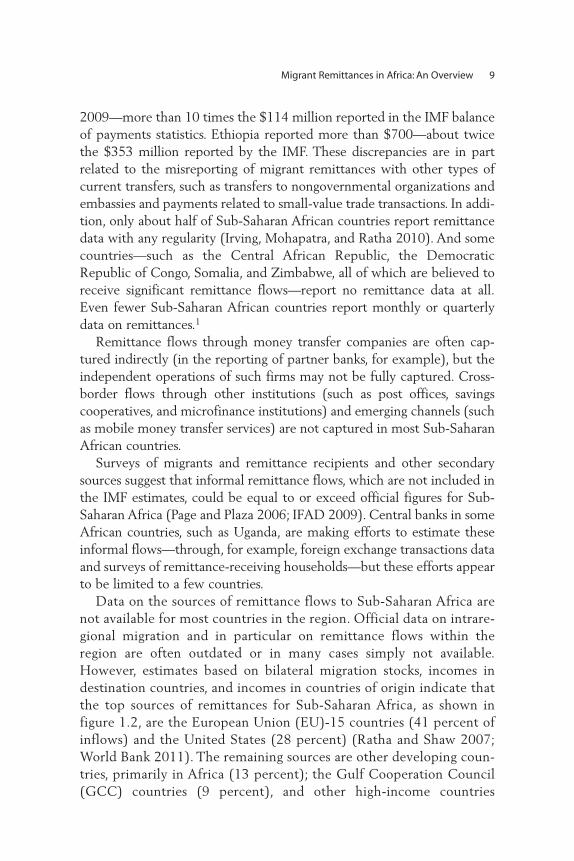
Data on the sources of remittance flows to Sub-Saharan Africa arenot available for most countries in the region. Official data on intrare-gional migration and in particular on remittance flows within theregion are often outdated or in many cases simply not available.However, estimates based on bilateral migration stocks, incomes indestination countries, and incomes in countries of origin indicate thatthe top sources of remittances for Sub-Saharan Africa, as shown in figure 1.2, are the European Union (EU)-15 countries (41 percent ofinflows) and the United States (28 percent) (Ratha and Shaw 2007;World Bank 2011). The remaining sources are other developing coun-tries, primarily in Africa (13 percent); the Gulf Cooperation Council(GCC) countries (9 percent), and other high-income countries
Migrant Remittances in Africa: An Overview 9
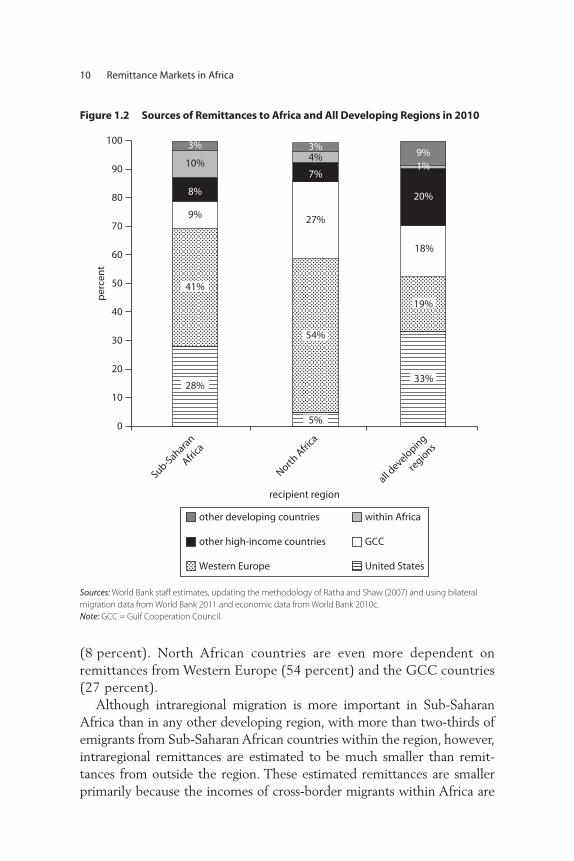
(8 percent). North African countries are even more dependent onremittances from Western Europe (54 percent) and the GCC countries(27 percent).
Although intraregional migration is more important in Sub-SaharanAfrica than in any other developing region, with more than two-thirds ofemigrants from Sub-Saharan African countries within the region, however,intraregional remittances are estimated to be much smaller than remit-tances from outside the region. These estimated remittances are smallerprimarily because the incomes of cross-border migrants within Africa are
10 Remittance Markets in Africa
28%10
20
30
recipient region
40
50
per
cen
t
60
70
80
90
100
05%
33%
41%
19%
9% 27%
18%
8%
7%
20%
10%4%
1%
3% 3%9%
Sub-Sahara
n
Africa
North A
frica
all develo
ping
regio
ns
54%
other developing countries within Africa
other high-income countries GCC
Western Europe United States
Figure 1.2 Sources of Remittances to Africa and All Developing Regions in 2010
Sources: World Bank staff estimates, updating the methodology of Ratha and Shaw (2007) and using bilateral migration data from World Bank 2011 and economic data from World Bank 2010c.Note: GCC = Gulf Cooperation Council.
significantly lower than the incomes of African migrants in Europe, theUnited States, and the Gulf.
Macroeconomic Impacts of Remittances
Remittances tend to behave countercyclically and thus act as a form ofinsurance for origin countries against macroeconomic shock. Remittancesrose during the financial crises in Mexico in 1995 and in Indonesia andThailand in 1998 (Ratha 2007) and have increased with natural disastersand political conflicts (Yang and Choi 2007; Yang 2008a; Clarke andWallsten 2004; Mohapatra, Joseph, and Ratha 2009).
Remittances thus behave very differently from most other private-source flows, which tend to be procyclical (Ratha 2003; Chami,Hakura, and Montiel 2009; Frankel 2011). This is largely because mostremittances involve transactions among members of the same house-hold, and thus are less driven by profit-seeking motives than privateresource flows. Remittances are also less at the mercy of changes inthe priorities of official aid donors and their fiscal situations (WorldBank 2006). But remittances can be procyclical when they are sent forinvestment purposes, usually in middle-income countries (Sayan 2006;Lueth and Ruiz-Arranz 2008).2
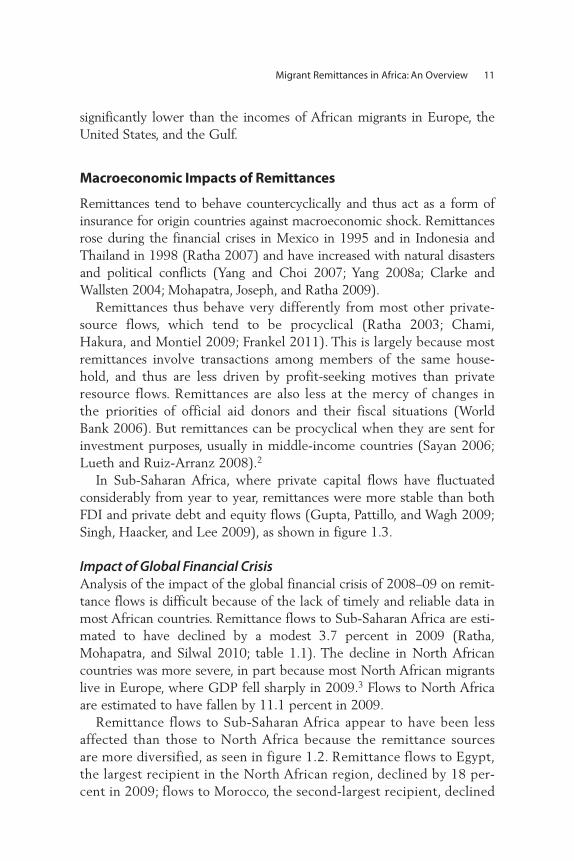
In Sub-Saharan Africa, where private capital flows have fluctuatedconsiderably from year to year, remittances were more stable than bothFDI and private debt and equity flows (Gupta, Pattillo, and Wagh 2009;Singh, Haacker, and Lee 2009), as shown in figure 1.3.
Impact of Global Financial CrisisAnalysis of the impact of the global financial crisis of 2008–09 on remit-tance flows is difficult because of the lack of timely and reliable data inmost African countries. Remittance flows to Sub-Saharan Africa are esti-mated to have declined by a modest 3.7 percent in 2009 (Ratha,Mohapatra, and Silwal 2010; table 1.1). The decline in North Africancountries was more severe, in part because most North African migrantslive in Europe, where GDP fell sharply in 2009.3 Flows to North Africaare estimated to have fallen by 11.1 percent in 2009.
Remittance flows to Sub-Saharan Africa appear to have been lessaffected than those to North Africa because the remittance sourcesare more diversified, as seen in figure 1.2. Remittance flows to Egypt,the largest recipient in the North African region, declined by 18 per-cent in 2009; flows to Morocco, the second-largest recipient, declined
Migrant Remittances in Africa: An Overview 11
9 percent. In Sub-Saharan Africa, flows to Kenya remained flat in2009, and they declined by 6 percent in Cape Verde and by 9 percentin Ethiopia.
Remittance flows to Africa are estimated to have registered a quickrecovery, rising by 4 percent in 2010. In the medium term, an uncertaineconomic recovery, high unemployment rates, and possible moves towardtightening immigration restrictions in destination countries (which likelywould be aimed at migrants from outside the EU) could restrain thegrowth of remittance inflows to Africa. The implications of the widespreadprotests and crisis in North Africa and the Middle East in early 2011 werenot clear as of the time of writing this chapter.
Remittances and Countries’ CreditworthinessRemittance inflows can improve sovereign creditworthiness by increasingthe level and stability of foreign exchange receipts (Ratha 2007;Avendaño, Gaillard, and Nieto-Parra 2009). Remittances also help stabi-lize the current account by reducing the volatility of overall capital flows(Chami and others 2008). Remittances can reduce the probability of cur-rent account reversals, especially when they exceed 3 percent of GDP(Bugamelli and Paterno 2009).
Appropriately accounting for remittances can improve evaluationsof African countries’ external debt sustainability and creditworthi-ness. Remittances are now being factored into sovereign ratings inmiddle-income countries and debt sustainability analysis in low-income
12 Remittance Markets in Africa
0.0
0.5
coef
ficie
nt
of v
aria
tio
n
1.0
1.5
2.0
private
debt a
nd
portfolio
equity
fore
ign d
irect
investm
ent
rem
ittance
s
officia
l aid
Figure 1.3 Stability of Resource Flows to Africa, 1990–2008, by Source
Source: World Bank 2010a.
countries (IMF 2010b).4 But fewer than half of African countries have asovereign rating from one of the three major rating agencies (Ratha,Mohapatra, and Plaza 2009). Obtaining a sovereign rating—and improv-ing the sovereign rating in those African countries that have one (afterappropriately accounting for remittances)—will translate into improvedmarket access for subsovereign entities, such as African banks and firms,whose foreign currency borrowing is typically subject to the country’s“sovereign ceiling” (Borensztein, Cowan, and Valenzuela 2007; Ratha, De,and Mohapatra 2011).5
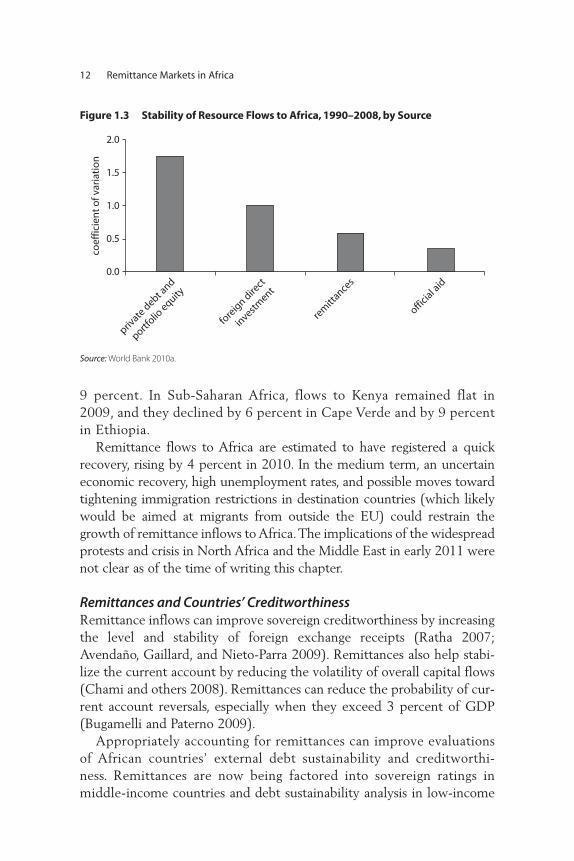
Including remittances in the calculation of the debt-to-exports ratio,as shown in figure 1.4, can provide a more accurate evaluation of debtsustainability and the amount of fiscal adjustment that may be neededto place debt on a sustainable path (World Bank 2006; Abdih and oth-ers 2009; IMF and World Bank 2009).6 Including remittances in credit-worthiness analysis using the shadow ratings model of Ratha, De, andMohapatra (2011) suggests that the creditworthiness of remittance-recipient countries would improve by one to three notches. The poorquality of remittance data in many African countries makes it difficult toassess the extent of improvement in sovereign creditworthiness that
Migrant Remittances in Africa: An Overview 13
0
recipient country
deb
t-to
-exp
ort
s ra
tio
, %
Guinea-B
issau
Liberia
Comoro
s
Guinea
Cape Verd
e
Gambia, T
he
Sierra Leone
Côte d
’lvoire
100
200
300
400
500
600
700
800
including remittancesexcluding remittances
Figure 1.4 External Debt as a Share of Exports from, and Remittances to, SelectedCountriespercentage of value of exports and received remittances
Source: World Bank 2010c.
would result from the inclusion of remittances in the Africa region,however.
The securitization of future remittance flows (and other future receiv-ables) can help African countries to use future remittances as collateral toraise additional financing from international capital markets and toreduce interest costs and lengthen the maturity of bonds for financingdevelopment projects such as low-income housing or power and watersupply (Ratha 2005; Ketkar and Ratha 2009a, 2009b).7 Banks in severalAfrican countries, aided by the African Export-Import Bank, have usedremittance securitization to raise international financing at lower cost andlonger maturities.
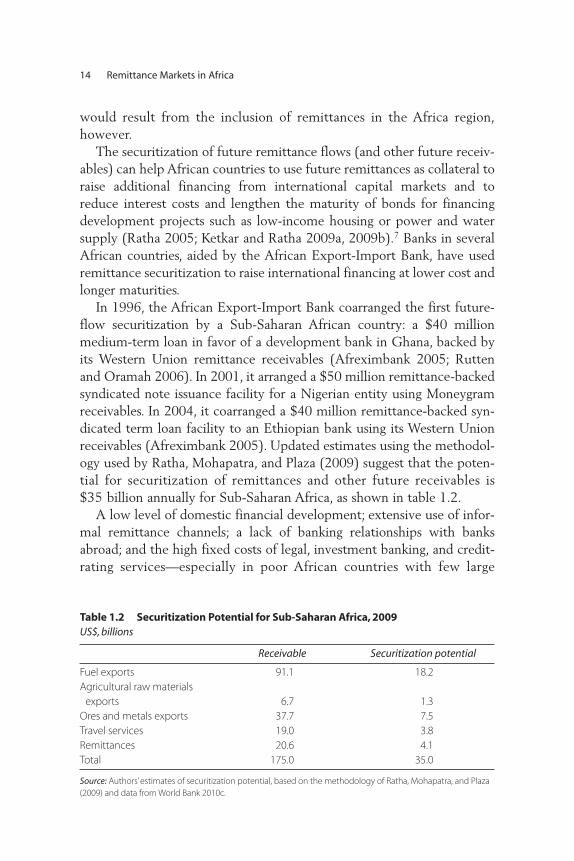
In 1996, the African Export-Import Bank coarranged the first future-flow securitization by a Sub-Saharan African country: a $40 millionmedium-term loan in favor of a development bank in Ghana, backed byits Western Union remittance receivables (Afreximbank 2005; Ruttenand Oramah 2006). In 2001, it arranged a $50 million remittance-backedsyndicated note issuance facility for a Nigerian entity using Moneygramreceivables. In 2004, it coarranged a $40 million remittance-backed syn-dicated term loan facility to an Ethiopian bank using its Western Unionreceivables (Afreximbank 2005). Updated estimates using the methodol-ogy used by Ratha, Mohapatra, and Plaza (2009) suggest that the poten-tial for securitization of remittances and other future receivables is$35 billion annually for Sub-Saharan Africa, as shown in table 1.2.
A low level of domestic financial development; extensive use of infor-mal remittance channels; a lack of banking relationships with banksabroad; and the high fixed costs of legal, investment banking, and credit-rating services—especially in poor African countries with few large
14 Remittance Markets in Africa
Table 1.2 Securitization Potential for Sub-Saharan Africa, 2009 US$, billions
Receivable Securitization potential
Fuel exports 91.1 18.2Agricultural raw materials
exports 6.7 1.3Ores and metals exports 37.7 7.5Travel services 19.0 3.8Remittances 20.6 4.1Total 175.0 35.0
Source: Authors’ estimates of securitization potential, based on the methodology of Ratha, Mohapatra, and Plaza(2009) and data from World Bank 2010c.
entities—make the use of securitization instruments difficult for Sub-Saharan countries (Ketkar and Ratha 2009a). The viability of securitiza-tion of future remittance flows can be facilitated by introducing asecuritization law and improving flows through formal channels. Bilateraland multilateral donors can play a role in facilitating securitization—building, for example, on the United Nations Development Programme’spartnership with Standard & Poor’s to help African countries obtain sov-ereign ratings, which act as a ceiling for private sector borrowings.8 Thereare risks to taking on foreign currency debt, however, and remittancesecuritization needs to be accompanied by prudential debt managementand sound macroeconomic policies.
Remittances can affect economic growth in a positive manner by rais-ing consumption and investment expenditures; by increasing expendi-tures on health, education, and nutrition that contribute to long-termproductivity (discussed further in the next section); and by improving thestability of consumption and output at both the household and macro-economic level (Chami, Hakura, and Montiel 2009). These benefits inturn increase the supply of investment from both domestic and foreignsources by increasing financial intermediation (Aggarwal, Demirgüç-Kunt, and Martinez Peria 2006; see Gupta, Pattillo, and Wagh 2009 forevidence for Sub-Saharan Africa), which can ultimately contribute tohigher growth (Rajan and Zingales 1998; see Ghirmay 2004 and Akinloand Egbetunde 2010 for Sub-Saharan Africa).9
Large inflows of remittances can cause the real exchange rate to appre-ciate (“Dutch disease”), which can impair growth if tradeable productionimparts external benefits such as economies of scale and learning effects(World Bank 2006; Acosta, Lartey, and Mandelman 2009; Gupta, Pattillo,and Wagh 2009). But remittances do not appear to have had a significantimpact on competitiveness for developing countries on average (Rajanand Subramanian 2005).10 And there is little evidence of this effect forAfrica, apart from some small countries such as Cape Verde, where remit-tance inflows are nearly 10 percent of GDP (Bourdet and Falck 2006).
In principle, large remittance receipts may also reduce the labor supply(Lucas 1987; Azam and Gubert 2006; Bussolo and Medvedev 2007;Chami and others 2008). There is little evidence of this phenomenon,however, and choices by some individuals to work less would be unlikelyto have a significant impact on output in African countries with high lev-els of underemployment. Some experts argue that the additional incomefrom remittances can reduce pressure to improve the quality of policiesand institutions by making recipients less dependent on government
Migrant Remittances in Africa: An Overview 15
benefits (Abdih and others 2008) or by providing sufficient foreignexchange to ease governments’ concerns over structural rigidities. Others,however, find that remittances have a positive impact on growth in coun-tries with higher-quality political and economic policies and institutions(Catrinescu and others 2009).11
The complexity of the growth process and the well-known problemsof cross-country growth regressions make it difficult to determinewhether remittances increase growth rates. In economies in which thefinancial system is underdeveloped, remittances may alleviate liquidityand credit constraints and help finance small-business investments,thereby effectively acting as a substitute for financial development.Giuliano and Ruiz-Arranz (2009) find evidence that the impact ofremittances on growth is stronger when the level of financial develop-ment is weaker. Regression analysis suggests that remittances have thegreatest impact on growth when the share of the broad money supply(M2) in GDP (an indicator of financial development) is below 28 per-cent, as it is in most African economies.
Impact on Households
Remittances can help reduce poverty, raise household investment, andincrease access to health and education services. This section reviews theliterature on the development implications of remittances from severaldeveloping regions, including Africa. It also looks at recent evidence col-lected through the Africa Migration Project surveys of the characteristicsof households that receive remittances from outside Africa, within Africa,and within the same country (see Plaza, Navarrete, and Ratha, 2011).Although it can be difficult to separate the effects of remittances fromthe overall effect of migration in empirical studies (McKenzie and Sasin2007), it is well established that the primary economic benefit of migra-tion to recipient households is the receipt of remittances (World Bank2006).12 The findings regarding households receiving remittances in ori-gin countries complement information about the characteristics of remit-tance senders in destination countries (World Bank 2006; Bollard,McKenzie, and Morten 2010).
Remittances can reduce poverty by directly augmenting the incomesof poor recipient households and increasing aggregate demand, therebyincreasing employment and wages of the poor. Cross-country regressionsgenerally find that remittances have reduced the share of poor people inthe population (Adams and Page 2003, 2005). Econometric analyses
16 Remittance Markets in Africa
suggest that remittances have reduced poverty in Africa. Anyanwu andErhijakpor (2010) find that a 10 percent increase in official internationalremittances as a share of GDP led to a 2.9 percent decline in the shareof people living in poverty in a sample of 33 African countries for1990–2005, with similar declines observed for the depth and severity ofpoverty (see also Ajayi and others 2009). Gupta, Pattillo, and Wagh(2009) find that the impact of remittances on poverty in Africa, althoughpositive, was smaller than for other developing countries, a result theyattribute to the possibility that poverty can itself cause increased migra-tion and hence greater remittances.
Studies of Burkina Faso (Lachaud 1999; Wouterse 2010); Ghana(Quartey and Blankson 2004; Adams 2006; Adams, Cuecuecha, and Page2008a); Lesotho (Gustafsson and Makonnen 1993); Morocco (Sorensen2004); and Nigeria (Odozia, Awoyemia, and Omonona 2010) concludethat remittances are associated with a reduction in the share of people inpoverty—and, in some cases, the depth and severity of poverty as well. Asubstantial part of remittances in Mali is saved for unexpected events,thus serving as insurance for entire households (Ponsot and Obegi 2010).Food security in rural areas of Nigeria improved considerably with anincrease in remittances (Babatunde and Martinetti 2010).
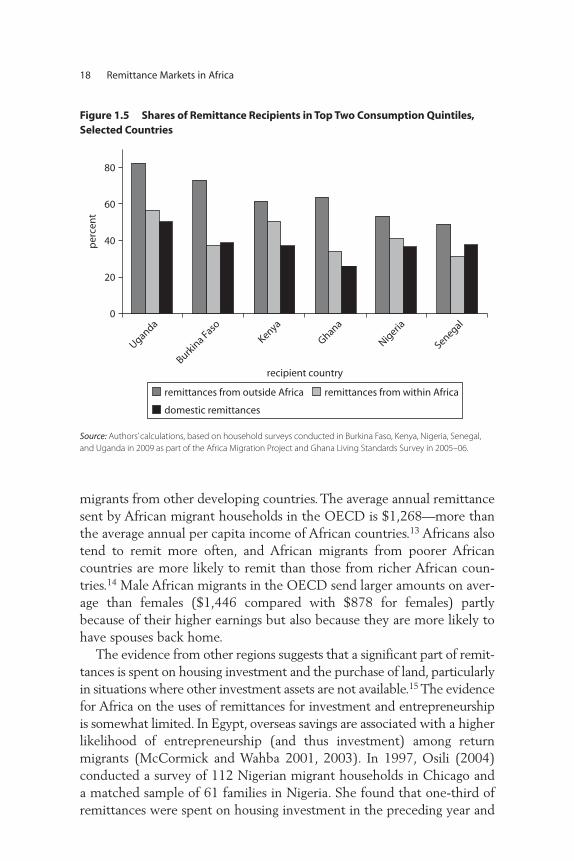
The evidence about the implications of remittances for inequality isless clear because it is not possible to observe the counterfactual incomesin the absence of migration (World Bank 2006; Ratha 2007). Householdsthat receive remittances, especially from outside the African continent,may be richer to begin with in order to have the resources needed formigration, but they may also have higher incomes because of migrationand the receipt of remittances. As figure 1.5 illustrates, recent householdsurveys conducted as part of the Africa Migration Project and an earliersurvey in Ghana find that more than half of households in Burkina Faso,Ghana, and Nigeria, and 30 percent of households in Senegal receivingremittances from outside Africa are in the top two consumption quintiles.
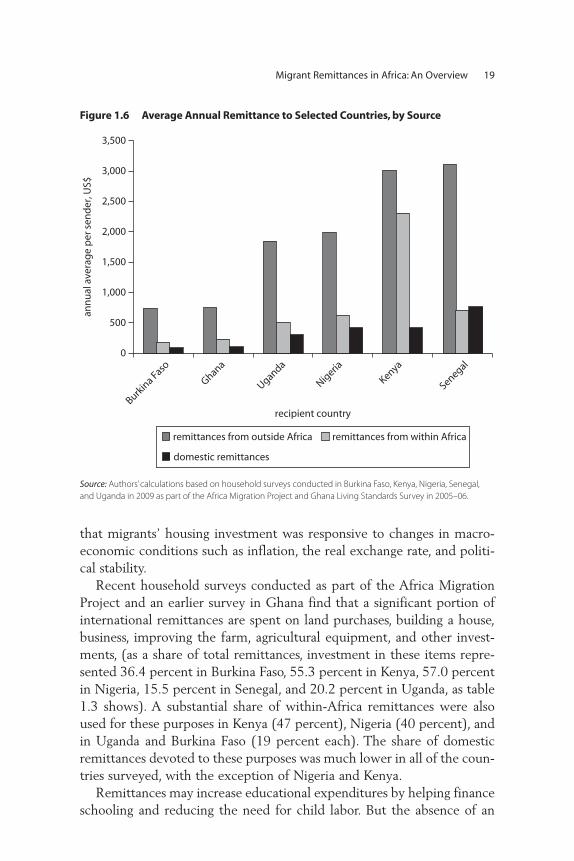
As figure 1.6 illustrates, remittances from outside Africa tend to bemuch larger, on average, than remittances from other African countries ordomestic sources.
A recent study on the characteristics of African remittance sendersbased on microdata of more than 12,000 African migrants in nineOrganisation for Economic Co-operation and Development (OECD)countries (Bollard, McKenzie, and Morten 2010) complements the find-ings from surveys of remittance-recipient households. The destination-country data suggest that Africans remit twice as much on average as
Migrant Remittances in Africa: An Overview 17
migrants from other developing countries. The average annual remittancesent by African migrant households in the OECD is $1,268—more thanthe average annual per capita income of African countries.13 Africans alsotend to remit more often, and African migrants from poorer Africancountries are more likely to remit than those from richer African coun-tries.14 Male African migrants in the OECD send larger amounts on aver-age than females ($1,446 compared with $878 for females) partlybecause of their higher earnings but also because they are more likely tohave spouses back home.
The evidence from other regions suggests that a significant part of remit-tances is spent on housing investment and the purchase of land, particularlyin situations where other investment assets are not available.15 The evidencefor Africa on the uses of remittances for investment and entrepreneurshipis somewhat limited. In Egypt, overseas savings are associated with a higherlikelihood of entrepreneurship (and thus investment) among returnmigrants (McCormick and Wahba 2001, 2003). In 1997, Osili (2004)conducted a survey of 112 Nigerian migrant households in Chicago anda matched sample of 61 families in Nigeria. She found that one-third ofremittances were spent on housing investment in the preceding year and
18 Remittance Markets in Africa
0
recipient country
20
40
60
80
Uganda
Burkin
a Faso
Kenya
Ghana
Nigeria
Senegal
per
cen
t
remittances from outside Africa remittances from within Africa
domestic remittances
Figure 1.5 Shares of Remittance Recipients in Top Two Consumption Quintiles, Selected Countries
Source: Authors’ calculations, based on household surveys conducted in Burkina Faso, Kenya, Nigeria, Senegal,and Uganda in 2009 as part of the Africa Migration Project and Ghana Living Standards Survey in 2005–06.
that migrants’ housing investment was responsive to changes in macro-economic conditions such as inflation, the real exchange rate, and politi-cal stability.
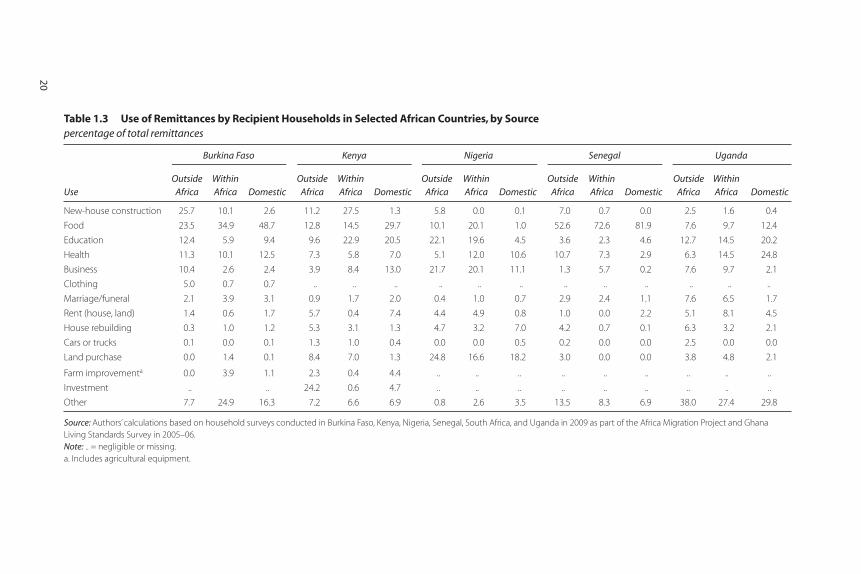
Recent household surveys conducted as part of the Africa MigrationProject and an earlier survey in Ghana find that a significant portion ofinternational remittances are spent on land purchases, building a house,business, improving the farm, agricultural equipment, and other invest-ments, (as a share of total remittances, investment in these items repre-sented 36.4 percent in Burkina Faso, 55.3 percent in Kenya, 57.0 percentin Nigeria, 15.5 percent in Senegal, and 20.2 percent in Uganda, as table1.3 shows). A substantial share of within-Africa remittances were alsoused for these purposes in Kenya (47 percent), Nigeria (40 percent), andin Uganda and Burkina Faso (19 percent each). The share of domesticremittances devoted to these purposes was much lower in all of the coun-tries surveyed, with the exception of Nigeria and Kenya.
Remittances may increase educational expenditures by helping financeschooling and reducing the need for child labor. But the absence of an
Migrant Remittances in Africa: An Overview 19
0
recipient country
500
1,000
1,500
2,000
2,500
3,000
3,500
Burkin
a Faso
Ghana
Uganda
Nigeria
Kenya
Senegal
ann
ual
ave
rag
e p
er s
end
er, U
S$
remittances from outside Africa remittances from within Africa
domestic remittances
Figure 1.6 Average Annual Remittance to Selected Countries, by Source
Source: Authors’ calculations based on household surveys conducted in Burkina Faso, Kenya, Nigeria, Senegal,and Uganda in 2009 as part of the Africa Migration Project and Ghana Living Standards Survey in 2005–06.
20
Table 1.3 Use of Remittances by Recipient Households in Selected African Countries, by Sourcepercentage of total remittances
Use
Burkina Faso Kenya Nigeria Senegal Uganda
Outside Africa
Within Africa Domestic
Outside Africa
Within Africa Domestic
Outside Africa
Within Africa Domestic
OutsideAfrica
WithinAfrica Domestic
OutsideAfrica
WithinAfrica Domestic
New-house construction 25.7 10.1 2.6 11.2 27.5 1.3 5.8 0.0 0.1 7.0 0.7 0.0 2.5 1.6 0.4
Food 23.5 34.9 48.7 12.8 14.5 29.7 10.1 20.1 1.0 52.6 72.6 81.9 7.6 9.7 12.4
Education 12.4 5.9 9.4 9.6 22.9 20.5 22.1 19.6 4.5 3.6 2.3 4.6 12.7 14.5 20.2
Health 11.3 10.1 12.5 7.3 5.8 7.0 5.1 12.0 10.6 10.7 7.3 2.9 6.3 14.5 24.8
Business 10.4 2.6 2.4 3.9 8.4 13.0 21.7 20.1 11.1 1.3 5.7 0.2 7.6 9.7 2.1
Clothing 5.0 0.7 0.7 .. .. .. .. .. .. .. .. .. .. .. ..
Marriage/funeral 2.1 3.9 3.1 0.9 1.7 2.0 0.4 1.0 0.7 2.9 2.4 1.1 7.6 6.5 1.7
Rent (house, land) 1.4 0.6 1.7 5.7 0.4 7.4 4.4 4.9 0.8 1.0 0.0 2.2 5.1 8.1 4.5
House rebuilding 0.3 1.0 1.2 5.3 3.1 1.3 4.7 3.2 7.0 4.2 0.7 0.1 6.3 3.2 2.1
Cars or trucks 0.1 0.0 0.1 1.3 1.0 0.4 0.0 0.0 0.5 0.2 0.0 0.0 2.5 0.0 0.0
Land purchase 0.0 1.4 0.1 8.4 7.0 1.3 24.8 16.6 18.2 3.0 0.0 0.0 3.8 4.8 2.1
Farm improvementa 0.0 3.9 1.1 2.3 0.4 4.4 .. .. .. .. .. .. .. .. ..
Investment .. .. 24.2 0.6 4.7 .. .. .. .. .. .. .. .. ..
Other 7.7 24.9 16.3 7.2 6.6 6.9 0.8 2.6 3.5 13.5 8.3 6.9 38.0 27.4 29.8
Source: Authors’ calculations based on household surveys conducted in Burkina Faso, Kenya, Nigeria, Senegal, South Africa, and Uganda in 2009 as part of the Africa Migration Project and Ghana Living Standards Survey in 2005–06.Note: .. = negligible or missing.a. Includes agricultural equipment.
adult household member may put pressure on children to perform addi-tional household chores or work on the family farm, reducing time foreducation. Evidence from other regions suggests that remittances cancontribute to better school attendance, higher school enrollment rates,and additional years in school, especially for females.16
The paucity of household survey data means that the evidence onthe impact of remittances on educational outcomes in Africa is rela-tively weak. In Egypt, children of remittance-receiving households weremore likely than other children to enroll in university, and girls ages15–17 in remittance-receiving households performed less domesticwork and were more likely to be in school than other girls the same age(Elbadawi and Roushdy 2009). Remittance-receiving households inGhana invested more in education than did other households (Adams,Cuecuecha, and Page 2008b).
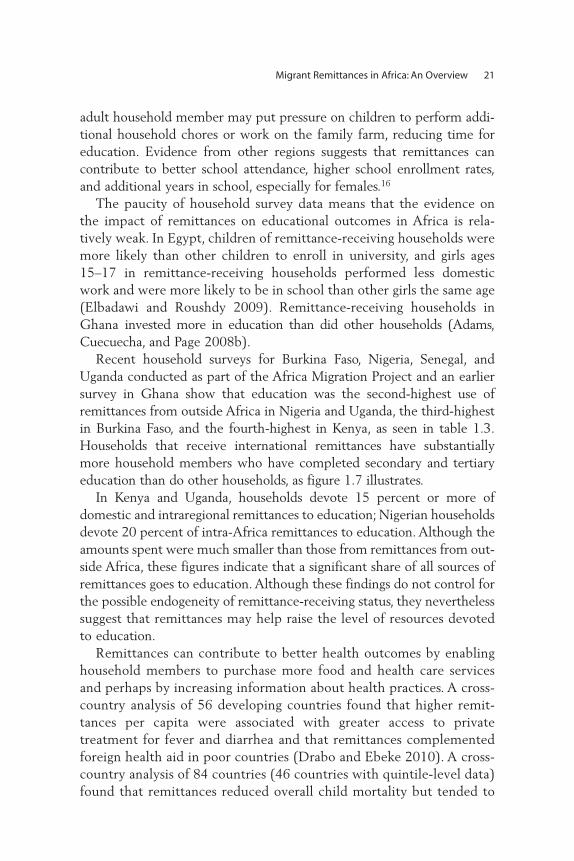
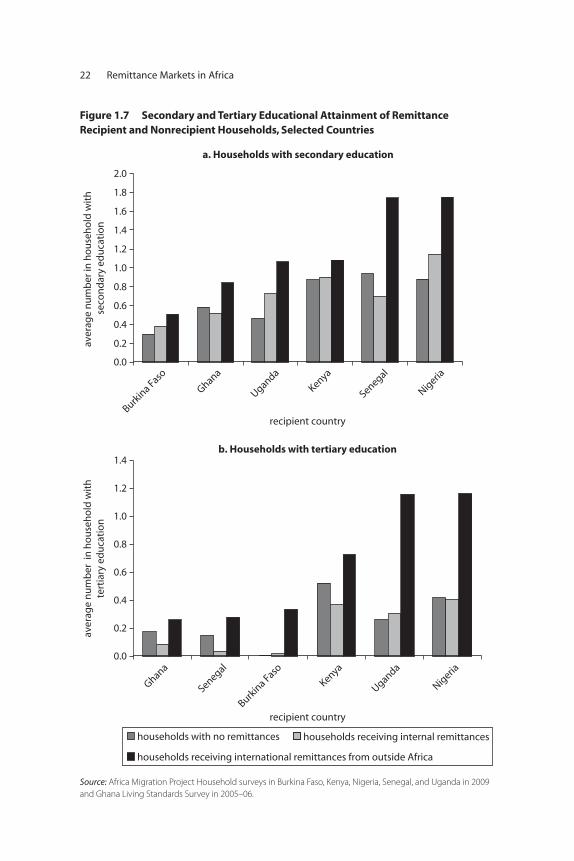
Recent household surveys for Burkina Faso, Nigeria, Senegal, andUganda conducted as part of the Africa Migration Project and an earliersurvey in Ghana show that education was the second-highest use ofremittances from outside Africa in Nigeria and Uganda, the third-highestin Burkina Faso, and the fourth-highest in Kenya, as seen in table 1.3.Households that receive international remittances have substantiallymore household members who have completed secondary and tertiaryeducation than do other households, as figure 1.7 illustrates.
In Kenya and Uganda, households devote 15 percent or more ofdomestic and intraregional remittances to education; Nigerian householdsdevote 20 percent of intra-Africa remittances to education. Although theamounts spent were much smaller than those from remittances from out-side Africa, these figures indicate that a significant share of all sources ofremittances goes to education. Although these findings do not control forthe possible endogeneity of remittance-receiving status, they neverthelesssuggest that remittances may help raise the level of resources devotedto education.
Remittances can contribute to better health outcomes by enablinghousehold members to purchase more food and health care servicesand perhaps by increasing information about health practices. A cross-country analysis of 56 developing countries found that higher remit-tances per capita were associated with greater access to privatetreatment for fever and diarrhea and that remittances complementedforeign health aid in poor countries (Drabo and Ebeke 2010). A cross-country analysis of 84 countries (46 countries with quintile-level data)found that remittances reduced overall child mortality but tended to
Migrant Remittances in Africa: An Overview 21
22 Remittance Markets in Africa
a. Households with secondary education
b. Households with tertiary education
0.0
0.2
0.4
0.6
0.8
1.0
1.2
1.4
1.6
1.8
2.0
Burkin
a Faso
Ghana
Uganda
Kenya
Senegal
Nigeria
0.0
0.2
0.4
0.6
0.8
1.0
1.2
1.4
Ghana
Senegal
Burkin
a Faso
Kenya
Uganda
Nigeria
aver
age
nu
mb
er i
n h
ou
seh
old
wit
hte
rtia
ry e
du
cati
on
aver
age
nu
mb
er in
ho
use
ho
ld w
ith
se
con
dar
y ed
uca
tio
n
households with no remittances households receiving internal remittances
households receiving international remittances from outside Africa
recipient country
recipient country
Figure 1.7 Secondary and Tertiary Educational Attainment of Remittance Recipient and Nonrecipient Households, Selected Countries
Source: Africa Migration Project Household surveys in Burkina Faso, Kenya, Nigeria, Senegal, and Uganda in 2009and Ghana Living Standards Survey in 2005–06.
be more effective in reducing mortality among children from the rich-est households than from the poorest households (Chauvet, Gubert,and Mesplé-Somps 2009).17
The evidence on the impact of remittances on health outcomes israther sparse for Africa. Evidence from the household surveys above indi-cates that households dedicate 5–12 percent of remittances from outsideAfrica to health care, as seen in table 1.3. A similar share of within-Africaand domestic remittances is devoted to health expenditures, but theamounts spent are much lower because of the smaller average size ofthese remittances. Among households in Ghana that receive remittancesfrom outside and within Africa, households headed by women spendmore on health care than do households headed by men (Guzmán,Morrison, and Sjöblom 2007). In rural Mali, households receiving remit-tances increased demand for health services and were more likely to seekmodern care (Birdsall and Chuhan 1986). A recent study using panel datafor 1993–2004 for the KwaZulu-Natal province in South Africa finds thatremittance-receiving households spent a larger budget share on food andhealth expenditures and that remittances enabled poorer households toaccess better-quality medical care (Nagarajan 2009).
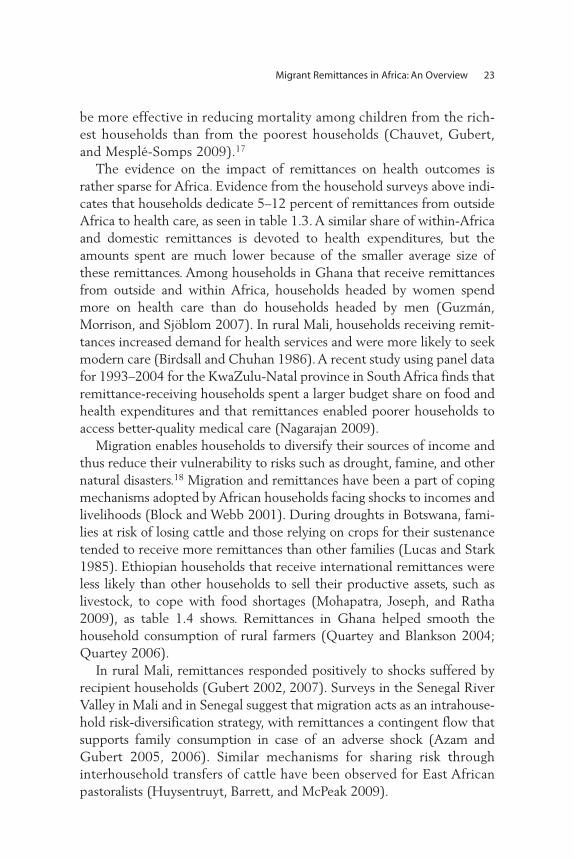
Migration enables households to diversify their sources of income andthus reduce their vulnerability to risks such as drought, famine, and othernatural disasters.18 Migration and remittances have been a part of copingmechanisms adopted by African households facing shocks to incomes andlivelihoods (Block and Webb 2001). During droughts in Botswana, fami-lies at risk of losing cattle and those relying on crops for their sustenancetended to receive more remittances than other families (Lucas and Stark1985). Ethiopian households that receive international remittances wereless likely than other households to sell their productive assets, such aslivestock, to cope with food shortages (Mohapatra, Joseph, and Ratha2009), as table 1.4 shows. Remittances in Ghana helped smooth thehousehold consumption of rural farmers (Quartey and Blankson 2004;Quartey 2006).
In rural Mali, remittances responded positively to shocks suffered byrecipient households (Gubert 2002, 2007). Surveys in the Senegal RiverValley in Mali and in Senegal suggest that migration acts as an intrahouse-hold risk-diversification strategy, with remittances a contingent flow thatsupports family consumption in case of an adverse shock (Azam andGubert 2005, 2006). Similar mechanisms for sharing risk throughinterhousehold transfers of cattle have been observed for East Africanpastoralists (Huysentruyt, Barrett, and McPeak 2009).
Migrant Remittances in Africa: An Overview 23
Remittances can also enable recipient households to build stronger andmore resilient housing. Mohapatra, Joseph, and Ratha (2009) find thatremittance-receiving households in Burkina Faso and Ghana were morelikely to have a concrete house, after controlling for the possible endo-geneity of the remittance-receiving status by using propensity score-matching methods.
Remittances can play an important role in improving access to infor-mation and communication technology. A household survey conducted aspart of the Africa Migration Project shows that in Burkina Faso, 66 per-cent of international remittance recipients have access to a mobile phonecompared with 41 percent of nonrecipients (as shown in annex 1.1, table1A.1).19 These households also have significantly higher ownership ofradios (66 percent versus 39 percent), televisions (41 percent versus9 percent), and computers (14 percent versus 2 percent). Householdsin Ghana, Nigeria, Senegal, and Uganda receiving international remit-tances also report having higher rates of access to mobile phones, radios,televisions, and computers.
Remittances are often the only relationship that many poor peoplehave with the formal financial system. If remittances are received throughbanks or other financial intermediaries (such as microfinance institutionsor savings cooperatives), there is a high likelihood that some part of theremittance will be saved (Aggarwal, Demirgüç-Kunt, and Martinez Peria2006; Gupta, Pattillo, and Wagh 2009). Even if remittances are received
24 Remittance Markets in Africa
Table 1.4 Food Security Strategies and Remittances in Ethiopian Households percentage of households using strategy to cope with food shortages
Food security strategy
Households not receivingremittances
Households receiving domestic
remittances
Households receiving
internationalremittances
Food aid 42.3 55.9 0.0Sale of livestock and
livestock products 40.5 3.9 0.0Sale of other agricultural
products 18.2 3.7 0.0Sale of household assets 4.1 4.6 11.5From own cash 10.3 5.3 31.3Others 15.6 33.0 48.9
Source: Mohapatra, Joseph, and Ratha 2009. Note: Column totals add up to more than 100 percent because households reported more than one response.
through money transfer companies or informal providers, recipients maysave the remittance in some type of financial institution rather than putit under the mattress. The steady stream of remittance receipts can alsobe used as a factor in evaluating the creditworthiness of recipients formicroloans, consumer loans, and small-business loans (sought, for exam-ple, to purchase agricultural equipment) (Ratha 2007). Remittances alsoplay a role in smoothing the income stream of poor households that facehigh income volatility and shocks. This reduced income volatility canmake them more attractive borrowers.
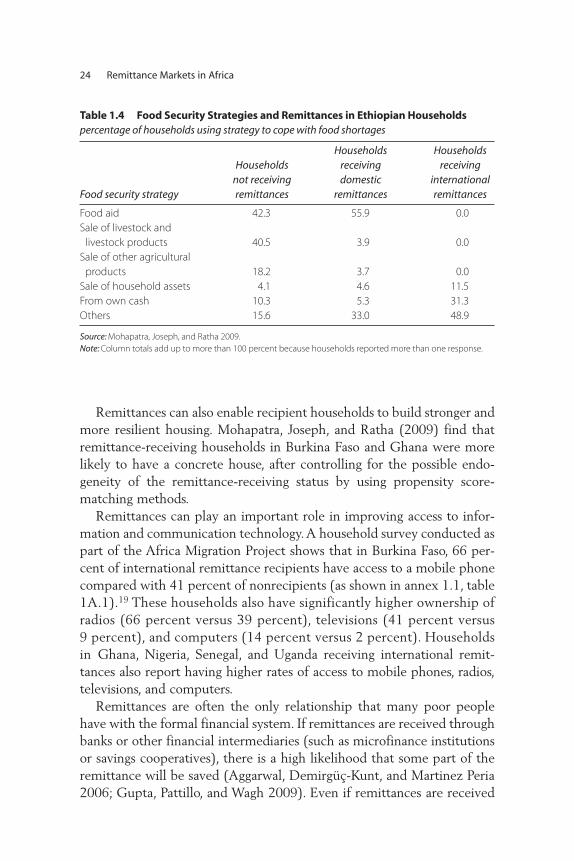
Data from recent household surveys conducted as part of the AfricaMigration Project and an earlier survey in Ghana reveal that householdsthat receive international remittances typically have better access tofinancial services, such as bank accounts, as figure 1.8 shows. Householdsreceiving domestic remittances tend to be worse off in terms of financialaccess than households receiving international remittances, in part
Migrant Remittances in Africa: An Overview 25
0
recipient country
20
40
60
80
ho
use
ho
lds
wit
h b
ank
acco
un
ts, %
Burkin
a Faso
Ghana
Uganda
Kenya
Senegal
Nigeria
households with no remittances households receiving internal remittances
households receiving international remittances from outside Africa
Figure 1.8 Household Bank Accounts in Selected African Countries, by Remittance Status
Source: Authors’ calculations based on household surveys conducted in Burkina Faso, Kenya, Nigeria, Senegal,and Uganda in 2009 as part of the Africa Migration Project and Ghana Living Standards Survey in 2005–06.
because households that send out domestic migrants tend to be poorer.There are some notable exceptions, such as Kenya, where the widespreaduse of mobile money transfers and the ability to save using mobile phoneshas effectively substituted for formal banking services (see next sectionfor a detailed discussion).
Remittance Markets in Africa
Remittance markets in Africa remain relatively underdeveloped in termsof their financial infrastructure and the regulatory environment. Surveysof African households and RSPs conducted in the context of the AfricaMigration Project indicate three broad patterns:
• Intraregional (south-south) and domestic remittances are sent over-whelmingly through informal channels. They are hand carried duringvisits home, sent through transport companies, or sent through infor-mal hawala channels, in part because of limited access to and the highcost of formal financial (banking) services relative to average per capitaincomes in African countries (Pendleton and others 2006; Tevera andChikanda 2009; Bracking and Sachikonye 2008).
• A large share of remittances from outside Africa is channeled througha few large international money transfer agencies, which often workde facto or de jure in exclusive partnership with African banks andpost offices (IFAD 2009).
• The rapid adoption of innovative mobile-money transfer and branchless-banking technologies is transforming the landscape for remittancesand broader financial services in Africa (Morawczynski and Pickens2009; Aker and Mbiti 2010). Although the adoption of these innova-tive technologies has been limited mostly to domestic money transfers(in part because of concerns about money laundering and terrorist financing related to cross-border remittances), the technologies havethe potential to vastly improve access to both remittances andbroader financial services, including low-cost savings and credit prod-ucts, for African migrants and remittance recipients.
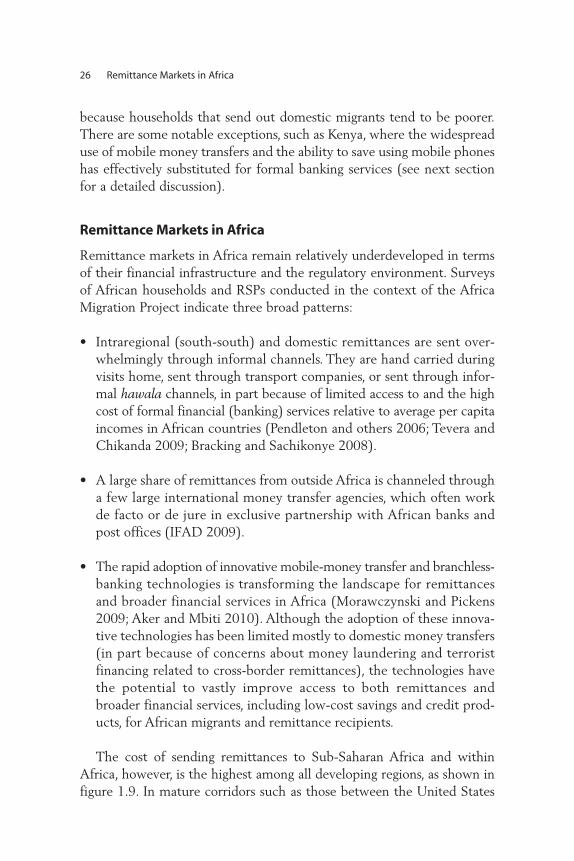
The cost of sending remittances to Sub-Saharan Africa and withinAfrica, however, is the highest among all developing regions, as shown infigure 1.9. In mature corridors such as those between the United States
26 Remittance Markets in Africa
and Mexico, remittance costs can be as low as $5 per transaction; betweenthe Persian Gulf and South Asia, the cost can be as low as $1.20
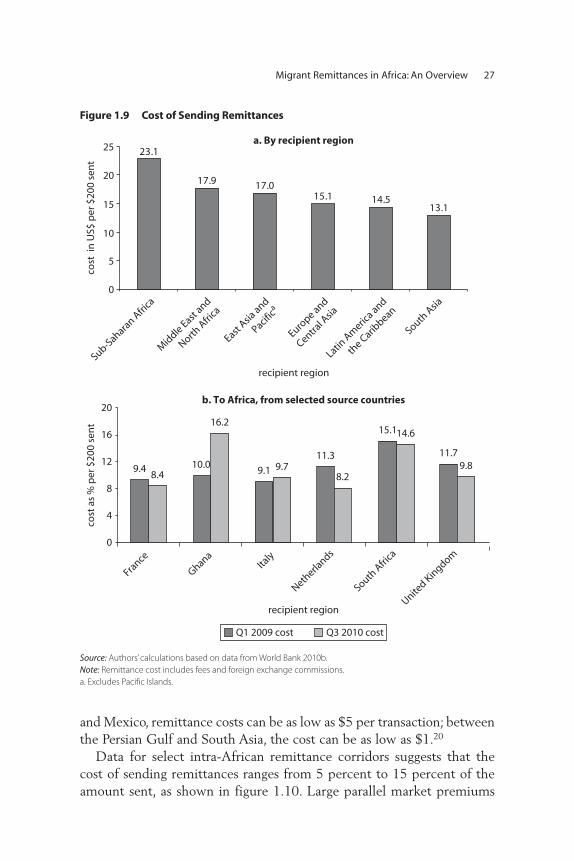
Data for select intra-African remittance corridors suggests that thecost of sending remittances ranges from 5 percent to 15 percent of theamount sent, as shown in figure 1.10. Large parallel market premiums
Migrant Remittances in Africa: An Overview 27
a. By recipient region
b. To Africa, from selected source countries
recipient region
recipient region
cost
as
% p
er $
200
sen
tco
st i
n U
S$ p
er $
200
sen
t
9.1
15.1
11.3
8.29.4
8.49.7
11.79.8
14.6
10.0
16.2
0
4
8
12
16
20
France
GhanaIta
ly
Netherla
nds
South A
frica
United Kin
gdom
Q1 2009 cost Q3 2010 cost
23.1
0
5
10
15
20
25
17.9 17.015.1 14.5
13.1
East Asia
and
Pacifica
Sub-Sahara
n Afri
ca
Latin A
meric
a and
the C
aribbean
Mid
dle East and
North A
frica
South A
sia
Europe and
Central A
sia
Figure 1.9 Cost of Sending Remittances
Source: Authors’ calculations based on data from World Bank 2010b.Note: Remittance cost includes fees and foreign exchange commissions.a. Excludes Pacific Islands.
between official and parallel market exchange rates in many Africancountries imply that the true cost is likely to be larger.
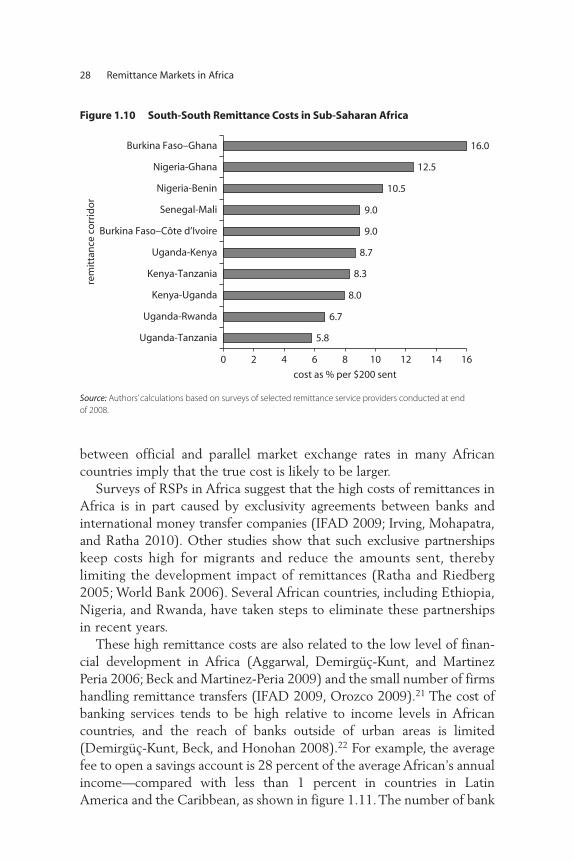
Surveys of RSPs in Africa suggest that the high costs of remittances inAfrica is in part caused by exclusivity agreements between banks andinternational money transfer companies (IFAD 2009; Irving, Mohapatra,and Ratha 2010). Other studies show that such exclusive partnershipskeep costs high for migrants and reduce the amounts sent, therebylimiting the development impact of remittances (Ratha and Riedberg2005; World Bank 2006). Several African countries, including Ethiopia,Nigeria, and Rwanda, have taken steps to eliminate these partnershipsin recent years.
These high remittance costs are also related to the low level of finan-cial development in Africa (Aggarwal, Demirgüç-Kunt, and MartinezPeria 2006; Beck and Martinez-Peria 2009) and the small number of firmshandling remittance transfers (IFAD 2009, Orozco 2009).21 The cost ofbanking services tends to be high relative to income levels in Africancountries, and the reach of banks outside of urban areas is limited(Demirgüç-Kunt, Beck, and Honohan 2008).22 For example, the averagefee to open a savings account is 28 percent of the average African’s annualincome—compared with less than 1 percent in countries in LatinAmerica and the Caribbean, as shown in figure 1.11. The number of bank
28 Remittance Markets in Africa
16.0
12.5
10.5
9.0
9.0
8.7
8.3
8.0
6.7
5.8
0 2 4 6
cost as % per $200 sent
rem
itta
nce
co
rrid
or
8 10 12 14 16
Burkina Faso–Ghana
Nigeria-Ghana
Nigeria-Benin
Senegal-Mali
Burkina Faso–Côte d’Ivoire
Uganda-Kenya
Kenya-Tanzania
Kenya-Uganda
Uganda-Rwanda
Uganda-Tanzania
Figure 1.10 South-South Remittance Costs in Sub-Saharan Africa
Source: Authors’ calculations based on surveys of selected remittance service providers conducted at end of 2008.
Migrant Remittances in Africa: An Overview 29
a. Number of bank branches
b. Fees to open a savings account
c. Number of ATMs
0.84.0
region
nu
mb
er p
er s
q k
mn
um
ber
per
sq
km
% o
f GD
P p
er c
apit
a
region
region
4.7
14.6
20.521.9
0
5
10
15
20
25
27.9
14.9
6.4 6.03.1
0.90
10
20
30
1.2 3.27.7 8.2
19.9
71.6
0
20
40
60
80
East Asia
and
Pacific
East Asia
and
Pacific
East Asia
and
Pacific
Sub-Sahara
n Afri
ca
Sub-Sahara
n Afri
ca
Sub-Sahara
n Afri
ca
Latin A
meric
a and
the C
aribbean
Latin A
meric
a and
the C
aribbean
Latin A
meric
a and
the C
aribbean
Mid
dle East and
North A
frica
Mid
dle East and
North A
frica
Mid
dle East and
North A
frica
South A
sia
South A
sia
South A
sia
Europe and
Central A
sia
Europe and
Central A
sia
Europe and
Central A
sia
Figure 1.11 Banking Networks and Costs, by Region
Source: Authors’ calculations based on data from Demirgüç-Kunt, Beck, and Honohan 2008.Note: GDP = gross domestic product. ATM = automatic teller machine. sq km = square kilometer.
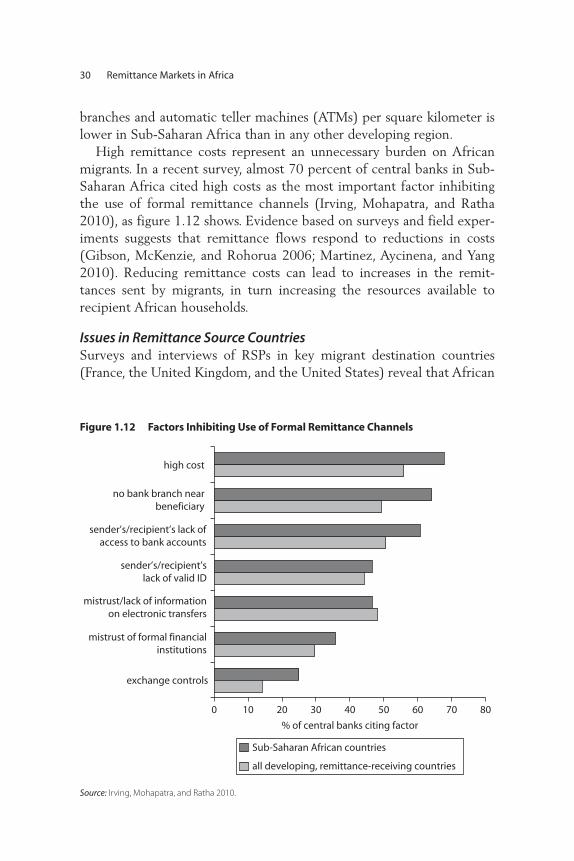
30 Remittance Markets in Africa
high cost
no bank branch nearbeneficiary
sender’s/recipient’s lack ofaccess to bank accounts
sender’s/recipient’slack of valid ID
mistrust/lack of informationon electronic transfers
mistrust of formal financialinstitutions
exchange controls
0 10 20 30 40 50 60
% of central banks citing factor
70 80
Sub-Saharan African countries
all developing, remittance-receiving countries
Figure 1.12 Factors Inhibiting Use of Formal Remittance Channels
Source: Irving, Mohapatra, and Ratha 2010.
branches and automatic teller machines (ATMs) per square kilometer islower in Sub-Saharan Africa than in any other developing region.
High remittance costs represent an unnecessary burden on Africanmigrants. In a recent survey, almost 70 percent of central banks in Sub-Saharan Africa cited high costs as the most important factor inhibitingthe use of formal remittance channels (Irving, Mohapatra, and Ratha2010), as figure 1.12 shows. Evidence based on surveys and field exper-iments suggests that remittance flows respond to reductions in costs(Gibson, McKenzie, and Rohorua 2006; Martinez, Aycinena, and Yang2010). Reducing remittance costs can lead to increases in the remit-tances sent by migrants, in turn increasing the resources available torecipient African households.
Issues in Remittance Source CountriesSurveys and interviews of RSPs in key migrant destination countries(France, the United Kingdom, and the United States) reveal that African
migrants’ lack of access to formal financial services and required identi-fication, exclusive partnerships, and regulations related to anti-money-laundering and combating the financing of terrorism (AML/CFT) alsoraise the costs of transferring money to Africa.23 Most transfers from des-tination countries outside Africa are sent as cash through money transfercompanies or through banks that are acting as agents of money-transfercompanies, rather than potentially cheaper account-to-account andcash-to-account transfers because (a) remittance senders lack access tobanking facilities, perhaps due to inadequate identification requirements;(b) banking services are too costly in the remittance-source countries andin recipient countries in Africa; and (c) African banks lack branches orrepresentative offices in the destination countries, and vice-versa. SomeWest African banks have representative offices in France and operatethrough partnerships with French banks (see chapter 10) but the range ofservices provided appears to be small. Many West African migrants inFrance appear to prefer to send money through friends, relatives, or evencommunity groups.
Exclusivity partnerships are also found in some remittance-sourcecountries. The French postal service has an exclusive partnership withWestern Union (see chapter 10). Although documented remittance costsare among the lowest for France-Africa corridors, such partnerships canlimit competition and the access of migrants to alternative RSPs. U.S. reg-ulations aimed at AML/CFT implemented after September 11, 2001, havemade it more difficult for smaller RSPs to access banking and settlementfacilities for the transfer of remittances to Africa. Mainstream U.S. banksappear to be wary of having money transfer operators—particularly fromEast Africa and other African subregions—as clients.
Regulations in destination countries could encourage greater trans-parency in remittance markets. For example, the United States is requir-ing the disclosure of prices and exchange rate commissions by remittanceproviders, establishing error resolution mechanisms for consumers, andencouraging access by low-income consumers. Although the U.S. govern-ment has recently undertaken these and other measures to reduce remit-tance costs, improve consumer protections related to remittances, andleverage remittances for improving financing of infrastructure projects(such as the BRIDGE initiative discussed earlier), differences in legal andregulatory frameworks, compliance requirements, and institutions gov-erning remittances across the U.S states make the exercise of implement-ing national-level policies on remittances challenging (Andreassen2006). There is need for a national-level institutional focal point for
Migrant Remittances in Africa: An Overview 31
remittances in the United States. A similar initiative to improve trans-parency, competition, and consumer protection in remittance markets isunder way in Europe under the EU’s Payment Services Directive (seechapter 11).
Remittance Channels in Africa The high cost and limited reach of formal channels, along with the infor-mal and seasonal character of African migration, results in the large rolethat informal channels (money carried during visits, sent through friendsand relatives, sent through the hawala system, through settlement ofsmall trade transactions, and carried by buses and transport companies)play in African remittances. Some estimates suggest that the prevalenceof informal transfers is the highest in Africa among all developing regions(Page and Plaza 2006; Ratha and Shaw 2007). Surveys conducted inSouthern Africa in 2004–05 found that carrying remittances by hand dur-ing visits home accounted for about half of remittance transfers in south-ern Africa: remittances carried by hand and sent through friends andrelatives accounted for 68 percent of remittances in Botswana, 88 percentin Lesotho, 73 percent in Swaziland, and 46 percent in Zimbabwe(Pendleton and others 2006; Tevera and Chikanda 2009; see also Brackingand Sachikonye 2008 for evidence from Zimbabwe on the increasingreliance on informal channels during a period of hyperinflation).24
Recent household surveys conducted in the context of the AfricaMigration Project in 2009 and an earlier survey in Ghana show somecountry variation in the importance of informal channels. The share ofhouseholds receiving within-Africa remittances through informal chan-nels was 60 percent or more in Burkina Faso, Ghana, and Senegal, asshown in figure 1.13 and annex table 1A.2. Among migrants in SouthAfrica sending remittances to other African countries, mostly within theSouthern African region, the share of those using informal channels wasclose to 80 percent. The share of households receiving within-Africaremittances that used informal channels was only 24 percent in Kenya(the only country of the five with extensive reliance on transfers throughmobile phones—24 percent of within-Africa remittances); 33 percent inNigeria, where banks are more widely used than in the other countries;and 44 percent in Uganda with money transfer operators and banksaccounting for the remaining half.
Informal channels were even more prevalent for domestic moneytransfers (95 percent for Burkina Faso, 94 percent in Ghana, 95 percent
32 Remittance Markets in Africa
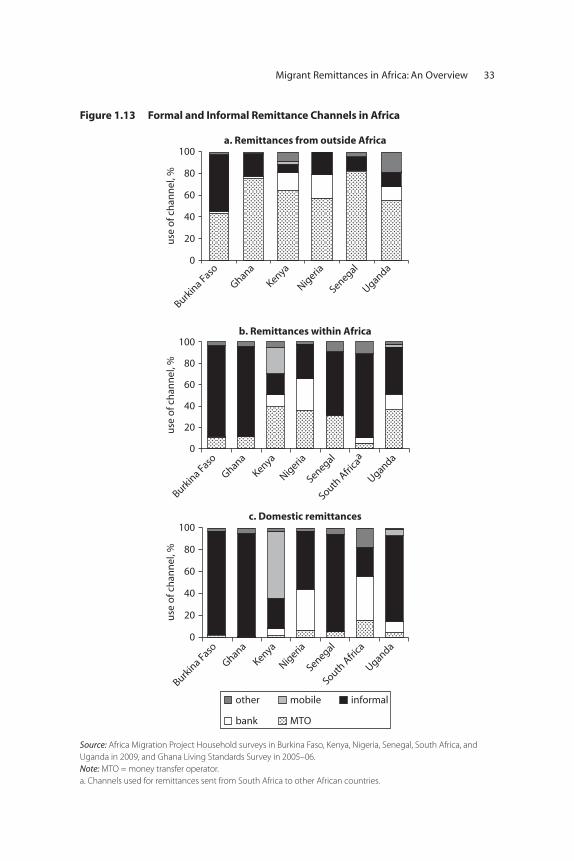
Migrant Remittances in Africa: An Overview 33
b. Remittances within Africa
c. Domestic remittances
0
use
of c
han
nel
, %u
se o
f ch
ann
el, %
use
of c
han
nel
, %
20
40
60
80
Burkin
a Faso
Ghana
Kenya
Nigeria
Senegal
Uganda
Burkin
a Faso
Ghana
Kenya
Nigeria
Senegal
South A
frica
a
Uganda
Burkin
a Faso
Ghana
Kenya
Nigeria
Senegal
South A
frica
Uganda
100a. Remittances from outside Africa
0
20
40
60
80
100
0
20
40
60
80
100
other mobile informal
bank MTO
Figure 1.13 Formal and Informal Remittance Channels in Africa
Source: Africa Migration Project Household surveys in Burkina Faso, Kenya, Nigeria, Senegal, South Africa, andUganda in 2009, and Ghana Living Standards Survey in 2005–06.Note: MTO = money transfer operator. a. Channels used for remittances sent from South Africa to other African countries.
in Senegal, and 78 percent for Uganda), also shown in figure 1.13 andannex table 1A.2). In relatively prosperous South Africa, informal remit-tance channels account for only a quarter of domestic remittances, in partbecause of a well-developed financial system and recent efforts toimprove financial inclusion, such as the introduction of the Mzansischeme, where South African banks provide basic, low-cost bankingaccounts; banks in South Africa now account for 41 percent of domesticremittances and money transfer companies for 16 percent. Similarly, inNigeria, which has a better banking infrastructure than most otherAfrican countries, banks accounted for more than one-third (37 percent)and money transfer companies for 6 percent.
The most prominent exception to the view of domestic remittances inAfrica being sent through mostly informal channels is Kenya, wherenearly two-thirds (62 percent) of domestic remittance transfers were con-ducted through mobile phones at the time of the household survey in late2009, as figure 1.13 shows. The next section recounts the transformationof the domestic remittance landscape in Kenya since the introduction ofthe M-PESA mobile money service in early 2007. Uganda has also seenthe introduction of mobile money transfers, with 5 percent of domesticremittances conducted by mobile phones at the time of the survey in thesecond half of 2009. This share is likely to have increased subsequent tothe survey.
Formal channels for both remittances from outside Africa and withinthe region were heavily dominated by money-transfer companies (mostlyWestern Union). In particular, only about 2 percent of households receiv-ing remittances from outside Africa use banks, although the share isslightly higher in Kenya (16.2 percent), Nigeria (22.3 percent), andUganda (12.5 percent). The role of other intermediaries—including postoffices, microfinance institutions, savings and credit cooperatives, and newtechnologies such as Internet transfers and mobile money transfers—iseven more limited for international remittances from outside Africa. Bycontrast, the share of households using informal channels for remittancesfrom outside Africa was less than 21 percent in five of the six countriessurveyed on receipt of remittances (the exception was 52 percent inBurkina Faso).
Mobile Money Services for Domestic RemittancesThe availability of the M-PESA mobile money service has brought abouta profound change in the types of domestic remittance channels used byKenyans in the relatively short time span since its introduction in March
34 Remittance Markets in Africa
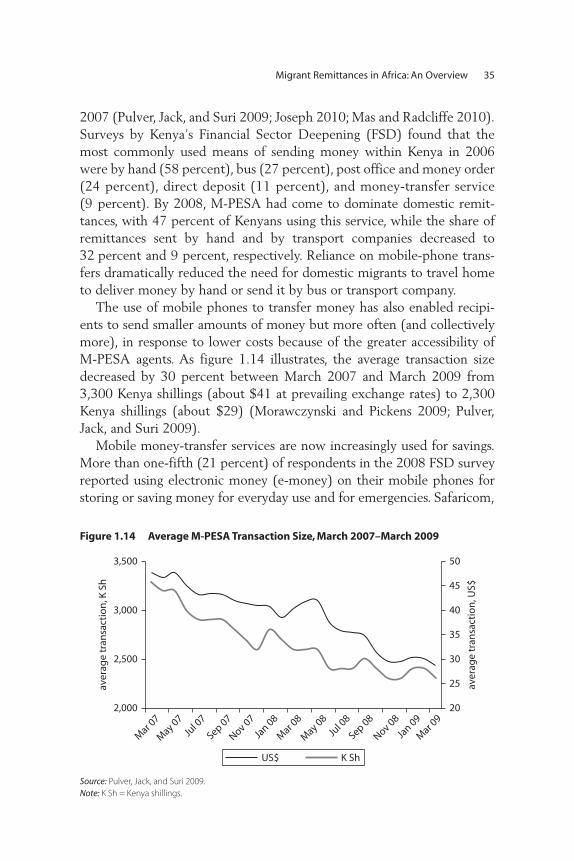
2007 (Pulver, Jack, and Suri 2009; Joseph 2010; Mas and Radcliffe 2010).Surveys by Kenya’s Financial Sector Deepening (FSD) found that themost commonly used means of sending money within Kenya in 2006were by hand (58 percent), bus (27 percent), post office and money order(24 percent), direct deposit (11 percent), and money-transfer service(9 percent). By 2008, M-PESA had come to dominate domestic remit-tances, with 47 percent of Kenyans using this service, while the share ofremittances sent by hand and by transport companies decreased to32 percent and 9 percent, respectively. Reliance on mobile-phone trans-fers dramatically reduced the need for domestic migrants to travel hometo deliver money by hand or send it by bus or transport company.
The use of mobile phones to transfer money has also enabled recipi-ents to send smaller amounts of money but more often (and collectivelymore), in response to lower costs because of the greater accessibility ofM-PESA agents. As figure 1.14 illustrates, the average transaction sizedecreased by 30 percent between March 2007 and March 2009 from3,300 Kenya shillings (about $41 at prevailing exchange rates) to 2,300Kenya shillings (about $29) (Morawczynski and Pickens 2009; Pulver,Jack, and Suri 2009).
Mobile money-transfer services are now increasingly used for savings.More than one-fifth (21 percent) of respondents in the 2008 FSD surveyreported using electronic money (e-money) on their mobile phones forstoring or saving money for everyday use and for emergencies. Safaricom,
Migrant Remittances in Africa: An Overview 35
20
25
30
35
40
45
50
2,000
Mar 0
7
May 07
Jul 0
7
Sep 07
Nov 07
Mar 0
8
May 08
Jul 0
8
Sep 08
Nov 08
Jan 08
Mar 0
9
Jan 09
2,500
3,000
3,500
aver
age
tran
sact
ion
, K S
h
aver
age
tran
sact
ion
, US$
US$ K Sh
Figure 1.14 Average M-PESA Transaction Size, March 2007–March 2009
Source: Pulver, Jack, and Suri 2009.Note: K Sh = Kenya shillings.
in partnership with Kenya’s Equity Bank, recently launched a mobilesavings account, “M-Kesho,” that provides access to interest-bearing sav-ings accounts and access to the ATM network of Equity Bank. Otherfirms such as Zain are now competing with M-PESA in Kenya to providesimilar services. In neighboring Uganda, Zain and MTN’s mobile moneyservices have more than a million users (Business Daily Africa 2010).
Similar mobile money-transfer and mobile banking services haveexpanded to other countries and subregions in Africa. The mobile opera-tor Zain, with operations in 15 African countries and 42 million sub-scribers, offers Zain Zap, a mobile remittance service that, in addition tomoney transfers, also offers services such as payments for bills and gro-ceries (Economist 2010).25 Orange Money offers mobile money transfersin a number of West African countries, including Côte d’Ivoire,Madagascar, Mali, and Senegal.26 In Benin in West Africa, mobile opera-tor MTN and Ecobank have launched a service that allows users to openaccounts and to transfer, deposit, and withdraw money. In Sierra Leone,Splash mobile money service was introduced in September 2009 andgained more than 150,000 clients within a year (Awareness Times 2010).In South Africa, Wizzit offers person-to-person mobile money-transferservices and works in partnership with the mainstream ABSA Bank andthe South African post office to provide banking facilities, includingaccess to point-of-sale devices and debit cards that can be used at ATMs.27
Mobile money technologies are being mostly used for domesticmoney transfers in Africa and other regions, but their use for cross-borderremittances is still nascent (see CGAP and Dalberg 2010 for some exam-ples). This is in part because of concerns related to money launderingusing cross-border transfers but also because of insufficient maturity ofbranchless-banking infrastructure on the receiving end and lack of cus-tomer awareness and trust in new services (Bold 2010).
Some telecommunications firms that operate across countries are start-ing to offer cross-border remittances in certain subregions. In East Africa,for example, Zain Zap (in partnership with CitiBank and StandardChartered Bank) allows its customers to send money to any bank in Kenya,Tanzania, and Uganda and to receive money from any bank account in theworld. In West Africa, where members of the West African Economic andMonetary Union have a common central bank and similar monetary regu-lations, cross-border mobile money-transfer services do not appear to befunctional. Mobile money transfers being piloted in partnership with inter-national money transfer companies (for example, from the UnitedKingdom and the United States to M-PESA mobile money accounts in
36 Remittance Markets in Africa
Kenya) are almost identical to cash-based remittances for the remittancesender and have a similar cost structure, with the difference that the remit-tance is deposited into the mobile money account of the recipient.
Even within this limited scope, the deposit of cross-border remittancesdirectly into the mobile money account of the recipient has potentially sig-nificant advantages over traditional cash-based money transfer services. Itincreases the reach of remittance services because the recipient can with-draw the remittance at domestic money transfer outlets. In Kenya, forexample, the international RSP can piggyback on the vast network ofM-PESA agents, greatly reducing, if not eliminating, the need to build acostly network for distribution of international remittances or to formalliances with banks or post offices. For the recipient, receiving remittancesdirectly into a mobile money account obviates the need to travel to thenearest town or outlet of the money transfer operator to receive cash.
Money transfers through mobile phones raise the issue of whethertelecommunications or banking regulators should regulate these services.Kenya’s M-PESA was allowed to operate with little regulatory oversightand few reporting requirements in its initial years. Regulators appear tobe learning how to deal with this innovation. There is considerable vari-ation in the experience of countries with mobile money services inAfrica and other regions.28 Regulatory “forbearance” may allow newtechnologies to scale up rapidly, but it can expose the financial system tosystemic risk if the volume of transactions flowing through the mobilemoney transfer system is large and the deposits are stored in one or twofinancial institutions. The issue of how to regulate and create a levelplaying field between mobile network operators and banks is becomingmore important as banks enter the mobile money space. Another issue ishow to replicate the Kenyan example in other African countries wheretelecommunications infrastructure is less developed and operators arestate monopolies.
Developing a robust and efficient regulatory framework that providesclear guidelines, expands permitted points of service (such as retailagents), reduces reporting requirements for small-value cross-bordertransactions, and eliminates requirements for proof of legal residence toset up a bank account can facilitate mobile money transfers (Maimbo,Saranga, and Strychacz 2010). Learning from the experiences of countriessuch as Brazil and the Philippines can help African countries come upwith innovative regulatory solutions.29 Some pilot projects are attempt-ing to bridge the divide between community-based pooled remittancesand the use of Internet and mobile technologies. Some service providers
Migrant Remittances in Africa: An Overview 37
are attempting to use Internet-based technologies to transfer remittancesfrom France to villages in Mali, West Africa (see chapter 10).
Postal Services’ Role in Improving Access to Remittances and other Financial Services Post offices typically have strong networks in both urban and rural areas,with significant potential to reach poor populations. They also have theright business model of serving the poor. While commercial banks areinaccessible to the poorest in many countries, post offices are typicallymore familiar and more accessible. In a recent study, Clotteau and Anson(2011) of the Universal Postal Union estimate that more than 80 percentof post offices in Sub-Saharan Africa are located outside the three largestcities, in areas where more than 80 percent of people in the country live.This stands in sharp contrast to the mainstream commercial banks thatare usually concentrated in the largest cities in Africa. This provides postalnetworks a unique opportunity to become key players in both interna-tional and domestic remittances—and to bring the unbanked into the for-mal financial system.
However, posts in Africa face operational risks in handling cash, inad-equate training, and outdated information technology systems (Clotteauand Anson 2011).30 For very small remittances, the application of anti-money-laundering regulations is not proportional to the risk raised bysuch transactions and hinders the reduction of remittance fees. Also, mostpost offices are not connected to national clearing and settlement sys-tems, which considerably limits their efficiency. Furthermore, a numberof posts are prevented from collecting savings, which is a natural comple-ment to remittance services. And most postal operators are governmentpublic corporations or government departments. Perhaps most important,exclusivity arrangements of some post offices in Africa with internationalmoney-transfer companies prevent effective competition in the remit-tances market. These agreements can also include offices that are not pro-viding any remittance service or where the partner of the post will neverdeploy the service. Last, in some instances, the post is regulated by thepostal regulator for international money orders and by the financial regu-lator for account-based services.
Policies for Leveraging Remittances for Development
This section outlines policies to improve the quality of data on remit-tances; reduce costs and improve transparency in remittance markets;
38 Remittance Markets in Africa
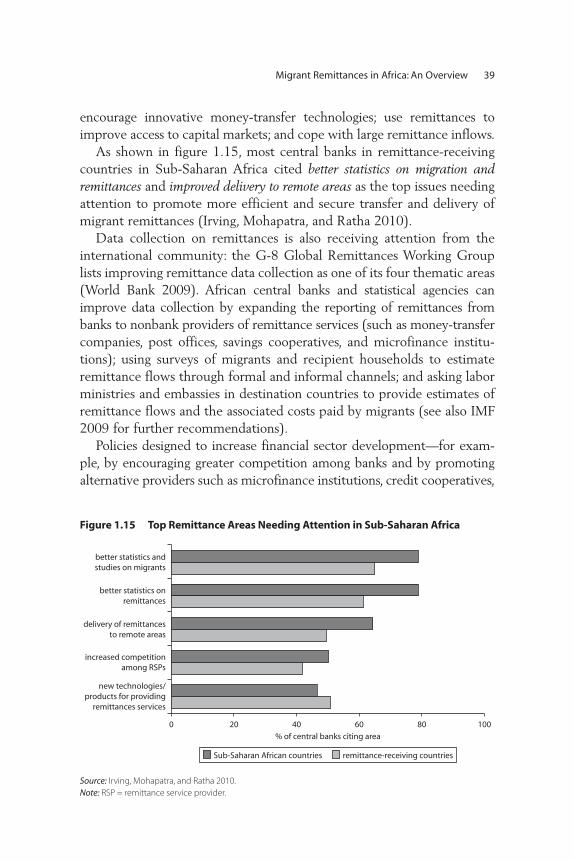
encourage innovative money-transfer technologies; use remittances toimprove access to capital markets; and cope with large remittance inflows.
As shown in figure 1.15, most central banks in remittance-receivingcountries in Sub-Saharan Africa cited better statistics on migration andremittances and improved delivery to remote areas as the top issues needingattention to promote more efficient and secure transfer and delivery ofmigrant remittances (Irving, Mohapatra, and Ratha 2010).
Data collection on remittances is also receiving attention from theinternational community: the G-8 Global Remittances Working Grouplists improving remittance data collection as one of its four thematic areas(World Bank 2009). African central banks and statistical agencies canimprove data collection by expanding the reporting of remittances frombanks to nonbank providers of remittance services (such as money-transfercompanies, post offices, savings cooperatives, and microfinance institu-tions); using surveys of migrants and recipient households to estimateremittance flows through formal and informal channels; and asking laborministries and embassies in destination countries to provide estimates ofremittance flows and the associated costs paid by migrants (see also IMF2009 for further recommendations).
Policies designed to increase financial sector development—for exam-ple, by encouraging greater competition among banks and by promotingalternative providers such as microfinance institutions, credit cooperatives,
Migrant Remittances in Africa: An Overview 39
better statistics andstudies on migrants
better statistics onremittances
delivery of remittancesto remote areas
increased competitionamong RSPs
new technologies/products for providing
remittances services
0 20 40 60 80 100
Sub-Saharan African countries
% of central banks citing area
remittance-receiving countries
Figure 1.15 Top Remittance Areas Needing Attention in Sub-Saharan Africa
Source: Irving, Mohapatra, and Ratha 2010.Note: RSP = remittance service provider.
and postal savings banks—are likely to have a beneficial impact on themarket for remittances.
Increasing the role of African post offices in remittances can be facili-tated by several policy measures. African post offices can partner withdestination-country post offices, banks, and money-transfer companies toextend existing domestic money-order facilities to international remit-tances. Better coordination among the various regulating entities shouldbe promoted to ensure better consumer protection. Other measuresinclude inclusion of financial services in the definition of universal serv-ice of post offices; connecting post offices to high-speed Internet and cre-ating integrated management information systems; encouraging basicsavings accounts where remittances can be paid, small savings deposited,and payments processed; and integrating new technologies into theiroperations. Some mobile money-transfer operators, such as Wizzit inSouth Africa and M-PESA in Kenya, are actively working with postoffices and postal savings banks as their agents.31 A clear policy recom-mendation for post offices in Africa to more effectively participate inremittances is to eliminate exclusive partnerships and encourage Africanpost offices to partner with more money-transfer companies (and evenbanks). This will put downward pressure on costs. This recommendationhas already led to policy changes in some African countries32 and has beenimplemented by the Central Bank of Nigeria and by Rwandan authorities.
African rural banks, savings cooperatives, and microfinance institutionscan also play a similar role in improving access to formal remittance (andfinancial) services. Money transfers can act as an entry point for providingremittance senders and unbanked recipients in rural areas other financialproducts and services such as deposits, savings, and credit facilities.Measures to encourage the participation of savings and credit cooperatives,rural banks, and microfinance institutions in providing remittance serviceswill help to improve financial access. A similar recommendation—to elim-inate exclusive partnerships and allow multiple partnerships for sendingand delivering remittances—also applies to rural banks and microfinanceinstitutions.
Disseminating information about remittance channels and the costs ofsending money to Africa would increase transparency and competition inthe remittance industry, thus encouraging lower prices and new entrantswhile fostering the increased use of formal channels. Following thesuccess of a U.K. remittance price database, France, Germany, Italy, theNetherlands, New Zealand, and Norway have commissioned websitesthat provide information on available channels. The World Bank has
40 Remittance Markets in Africa
launched a Remittance Prices Worldwide database with over 150 remit-tance corridors (World Bank 2010b).
In addition to national and global price databases, information onremittance channels and costs should also be provided in published form(for example, pamphlets) to emigrants at airports before departure, dur-ing predeparture orientation and training, and at embassies and associa-tions in destination countries to reach migrants without access to theInternet. It can also be made available through central banks, labor min-istries, foreign employment bureaus, and recruitment associations in ori-gin countries.
Measures that would encourage the expansion of mobile phones tocross-border remittances include (a) harmonizing banking and telecom-munications regulations to enable mainstream African banks to partici-pate in mobile money transfers and for telecommunications firms to offermicrodeposit and savings accounts; (b) simplifying AML/CFT regulationsfor small-value transfers; and (c) ensuring that mobile distribution net-works are open to multiple international RSPs instead of becoming exclu-sive partnerships between an international money transfer operator(MTO) and country-based mobile money services. Also, the implicationsof such exclusive partnerships for the price structure of mobile moneyservices should be examined; the price of mobile money services appearsto be similar to that charged for sending cash remittances, despite the factthat reliance on mobile-phone transfers reduces the need to build a costlydistribution network.
Policy makers in Sub-Saharan Africa should be more alert to “Dutchdisease” in countries where remittances inflows are large compared withthe size of the economy, where supply constraints are a significant hin-drance to the expansion of the nontradeable sector, and where a signifi-cant portion of remittances are spent on domestic goods, especiallynontradeables (Gupta, Pattillo, and Wagh 2009). Countries should adjustto large remittance inflows that are likely to be permanent by maintain-ing market-based exchange-rate policies, taking steps to support the pro-duction of tradeables that might be harmed due to exchange rateovervaluation (for example, through infrastructure investments), andreducing labor and product market rigidities that impair competitiveness.Large inflows that are likely to be temporary can be sterilized, althoughthe cost of sterilization can be high. Meanwhile, the resulting rise indomestic interest rates can attract more capital inflows, placing furtherpressure on the exchange rate (Fajnzylber and Lopez 2007). It can bedifficult to distinguish between temporary and permanent levels of
Migrant Remittances in Africa: An Overview 41
remittance inflows, although because remittances tend to be relativelystable, “Dutch disease” effects are of less concern than for natural resourcewindfalls and other cyclical flows.
Overview of Remittance Market Surveys in Africa and Two Remittance-Source Countries
This section provides an overview of the studies—presented in theremainder of this volume—of remittance markets in African countriesand in key destination countries of African migrants. These country stud-ies are based on primary surveys of a wide range of RSPs, including com-mercial and state-owned banks, MTOs, exchange bureaus, post offices,savings and credit cooperatives, microfinance institutions, telecommuni-cation companies, retail stores, travel agencies, and informal providerssuch as transport companies. Similar issues of cost, competition, and reg-ulatory environment are examined from the perspective of the providers,but the focus is on (a) understanding the regulatory, market, and institu-tional constraints in the sending of remittances, and (b) discussion ofrecent policy initiatives to improve transparency, consumer protection,and competition in remittance markets in the sending countries.
Chapters 2–9 present the findings of remittance market studies of thefollowing Sub-Saharan African countries: Burkina Faso, Cape Verde,Ethiopia, Ghana, Kenya, Nigeria, Senegal, and Uganda. Chapters 10–11present studies of remittance markets in two key remittance-source coun-tries outside the African continent: France and the United Kingdom.Summarized below are some of the policy-relevant findings of each coun-try study.
Yiriyibin Bambio in chapter 2 discusses the remittance market inBurkina Faso—a major source of intraregional migrants in the WestAfrica subregion. An estimated 1.6 million recorded emigrants live out-side the country, with large numbers going to Côte d’Ivoire, Niger, andMali within the subregion and to Italy and France outside the region(World Bank 2011). Despite the large volume of migration, BurkinaFaso received only $43 million in officially recorded remittances in2010 (less than 1 percent of GDP) mainly because of the prevalence ofinformal channels. The study finds that the remittance industry inBurkina Faso operates within the broader regional regulatory environ-ment of the West African Monetary Union. Although formal remittancechannels (such as Western Union, Moneygram, and MoneyExpress) arefaster and more secure, they are also more expensive for the customer
42 Remittance Markets in Africa
and do not adequately reach rural areas, which often lack electricity andcomputer access.
The Burkina Faso survey also found that although remittance firms donot consider regulations (centered on anti-money-laundering, tax policy,and exchange controls) to constitute a significant barrier to entry, they doconsider regulations to be significant impediments to business activities.There are also inefficiencies in the clearing and settlement system andlack of adequately trained staff, which can create difficulties in compli-ance and in fulfilling Know-Your-Customer (KYC) requirements. As aconsequence, remittance costs remain high, and informal providers con-tinue to coexist with formal providers. However, some Burkinabè banksare active in the destination countries of migrants (for example, in Côted’Ivoire and Italy) and facilitate the transfer of funds and savings ofBurkinabè migration back to their home country.
Recommendations to improve the efficiency of remittance marketsinclude developing prepaid cards and mobile money transfer; encourag-ing Burkinabè banks with branches or representative offices in destinationcountries to provide savings, investment, and money transfer products toBurkinabè migrants; dialoguing with migrant communities to understandtheir money transfer and investment needs; creating more transparency inthe clearing and settlement system of banks with their agents and sub-agents; and training to improve the KYC compliance of nonbank moneytransfer operators.
In chapter 3, Georgiana Pop provides an overview of the remittancemarket in Cape Verde, a small country with the highest emigration ratein Africa at 38 percent of the population (World Bank 2011). CapeVerde received $144 million in remittances in 2010, about 9 percent ofits GDP. Around two-thirds of families in Cape Verde receive moneyfrom abroad, mainly from Portugal, France, the United States, and theNetherlands. The survey finds that the industry is dominated by four pri-vate banks and one exchange office; two banks in partnership withMTOs such as Western Union and MoneyGram account for more than90 percent of the market. However, there significant inefficiencies, withbanks lacking significant branch networks in rural areas and the countrylacking microfinance institutions.
Although the banks in Cape Verde provide a range of deposits, savingproducts, loans, credit cards, and mortgages, which can contribute to finan-cial deepening, fees for sending domestic and international outward remit-tances are high relative to the incomes of the poor, which limits theiraccess to such services. The RSPs perceive the regulatory and business
Migrant Remittances in Africa: An Overview 43
environment as favorable to conducting a remittance business, and theycomply with minimum capital requirements and regulations on reportingrequirements for suspicious activities and large currency transactions.Access to finance for banks and nonfinancial institutions, in terms of avail-ability, costs, and competition from the informal sector, are perceived asmoderate obstacles to doing business by 60 percent of RSPs.
Some specific recommendations to improve the efficiency of remit-tances in Cape Verde include requiring RSPs to report outward andinward remittance flows separately (instead of a net flow); improving sta-tistics on intra-African and within-country remittance flows; better esti-mating the size of the informal remittance market; setting upmicrofinance institutions and new money-transfer technologies, such asprepaid cards or mobile-phone banking; encouraging the entry of non-bank providers to stimulate competition and help to reduce overall trans-action fees; and developing diaspora bonds, the securitization ofremittances to leverage migration and remittances for investment, andfinancial products targeted at migrants.
Alemayehu Geda and Jacqueline Irving find in chapter 4 that, despitethe contribution of remittances to Ethiopia’s external financing position,there are many barriers in the effective delivery of remittances. A lowlevel of financial intermediation and the lack of a modern national clear-ing and settlement system are seen as challenges. Most Ethiopian banksare concentrated in the major cities, and the bank branch and ATM net-works are very limited, with little coverage of rural areas. Ethiopia alsoappears to be behind other East African countries such as Kenya andUganda in the development and use of mobile money transfers and in pro-viding remittance-linked financial services. This is partly because ofEthiopia’s relatively underdeveloped financial system and a weak telecom-munications infrastructure. Most remittances appear to be either con-sumed or invested in real estate, which offers higher returns than savingsdeposits and other financial instruments in a high-inflation environment.
Policy recommendations for improving the remittance market inEthiopia include expediting the process for obtaining a license; facilitat-ing entry of new players; establishing a national real-time gross settlementfunds-transfer system; introducing more competition and reducing barri-ers to entry in the telecom sector to encourage firms to use mobile moneytransfer services; granting post offices and MFIs access to clearing and set-tlement systems to expand access to rural areas and increase competition;and frequently updating the information on available remittance channelsand costs to assist Ethiopian migrants.
44 Remittance Markets in Africa
Peter Quartey finds in chapter 5 that Ghana’s regulatory environmentgoverning remittances services is generally effective and that current lawsand regulations do not present major challenges to RSPs’ business opera-tions. However, banks have gained a progressively larger share of theremittance market in Ghana because of the introduction of universalbanking, the population’s greater trust in banks than in nonbank financialinstitutions, and the banks’ extensive presence in rural areas.
The establishment of a National Switch (E-Zwich) as a common pay-ment platform will enable the integration of existing bank switches andreduce costs of money transfers. An E-Zwich debit card has been intro-duced on a pilot basis for payments of salaries and other governmentassistance, and it is expected that financial institutions will launch a prod-uct that will enable remittance recipients to access money transfersthrough the card. There is currently little adoption of mobile moneytransfers in Ghana, but high mobile-phone penetration suggests potentialfor development of this sector. Similarly, the completion of a fiber-opticbackbone and fall in Internet costs could encourage people to use Internettransfers.
Financial sector reforms have made it easier for institutions to engagein remittance services. However, informal remittance services, such ashand carrying, sending through friends and relatives, and incorrect invoic-ing of cross-border trade transactions, continue to be significant. Becauseinward remittances can be paid out only in local currency, while outwardremittances are not permitted, informal firms have an opportunity tothrive.
Rose W. Ngugi summarizes of the remittance market in chapter 6 onKenya, which has been in the spotlight for its rapid adoption of mobilemoney transfers; the largest provider, M-PESA, acquired more than 12 mil-lion customers within four years of its launch in early 2007. The study findsthat although Kenya has a diverse range of RSPs, the role of informal chan-nels (such as transport companies) has declined with the increasing popu-larity of mobile money. And while the cost of maintaining an account isprohibitive and constrains the demand for other financial services for remit-tance clients, mobile money transfer services in recent years have providedbanking services in partnership with banks, including savings accounts andbank account management through the mobile phone service.
The cost of international remittances is significantly high across thevarious providers, and the rate charged for sending $200 ranges between8 percent and 18 percent for international transfers. The use of mobilemoney is mostly used for domestic remittances. Although there have
Migrant Remittances in Africa: An Overview 45
been some pilot projects for international money transfers in partnershipwith international money transfer companies, the costs appear to be sim-ilar to conventional cash transfers, and the amounts transferred appear tobe small compared to those sent through mobile phones.
Chukwuma Agu provides an overview in chapter 7 of the remittancemarket in Nigeria, the largest remittance recipient in the African conti-nent. The study finds that remittances have outpaced FDI, official devel-opment assistance, and other inflows into the country, and are secondonly to oil exports as a foreign exchange earner for Nigeria. However, italso finds that the remittance market in Nigeria is not yet well managed.
International money transfer companies play a dominant role, withNigerian banks acting as intermediaries and distributors of remittances.Remittance transfers are expensive—as high as 20 percent for inwardremittances—and the instruments quite limited beyond cash-to-cashtransfers. Remittance services are seldom linked to regular bank servicesin a way that could promote improved use of remittance funds or accessto other services on account of regular transfers. Outward-bound remit-tances are highly regulated, and limits are placed on transactions, whileinternal remittances can be expensive except for account-to-accounttransfers within the same bank.
Even though recent reforms have regularized the activities of foreignexchange bureaus, they are not allowed to handle remittance transactions.The use of mobile money transfers and card-based remittances is smallcompared with other countries in East Africa. There continues to be alarge informal sector. The official remittances data do not adequately dif-ferentiate between migrant remittances and other small-value transfersrelated to trade and other payments.
Recommendations to increase competition and reduce cost inNigeria’s remittance market include enforcing recent regulation toexpunge exclusivity from contracts among RSPs; encouraging banks toopen outlets in remittance-source countries; regulating maximum charge-able fees on international transfers; allowing foreign exchange bureausand microfinance institutions to partner with foreign and local MTOs andbanks to provide remittance services; empowering the Nigerian PostalService (whose network spreads across the entire country and offersaffordable tariffs) to compete on remittances services, improving ruralareas’ access to remittance services putting downward pressure on costs;encouraging use of mobile money transfers to enhance access to remittanceservices in rural areas and reduce associated costs; and improving datacollection on remittances.
46 Remittance Markets in Africa
In chapter 8, Fatou Cisse finds that remittances have become the prin-cipal source of external financing for Senegal, far exceeding FDI, externalborrowing, and foreign aid. The EU countries account for more than halfthe remittances sent to the country. Money transfer services, banks, andthe post office make up the formal sector. Money transfer companiesaccount for one-third of the remittance market—with one companyaccounting for more than 70 percent—and have high costs because oftheir monopoly status. Banks have only a small share in remittance trans-fers in Senegal for several reasons, including high cost, the distance ofbank branches from residential areas (especially in rural areas), long serv-ice delivery delays, long wait times at branches, and sometimes unex-pected and arbitrary commission charges upon receipt. Banks also oftenwork in exclusive partnership with international MTOs. The post office,which has a large network and presence in rural areas, provides postalmoney orders for local transfers and works with several internationalMTOs to deliver international transfers.
Remittances sent through informal channels (by migrants themselves,by relatives and friends, or through intermediaries) remain prevalent, par-ticularly among the poor, because of the proximity to recipients, simplic-ity of operations, lack of overhead costs, freedom from regulatoryconstraints, and low-cost products. However, the informal sector’s shareappears to have declined in recent years. Mobile money is a recent phe-nomenon in Senegal. A “Yoban’tel” service, launched jointly by Obopayand Société Générale de Banques au Sénégal in mid-2010 (after the sur-vey), allows cash deposits into mobile accounts and a variety of bill pay-ment options.
Rose W. Ngugi and Edward Sennoga find in chapter 9 that a key barrierto understanding remittances in Uganda is inadequate data collection andreporting. Ugandan banks find it difficult to separate migrant remittancesfrom other small-value payments when reporting remittances to the cen-tral bank. Remittance costs for outward international remittances tend tobe high. The nonformal providers include community-based and transportcompanies. Few financial services are offered to remittance transfer clients.Mobile telephone transfer services are gaining entry, but they have yet tomake significant contributions to domestic remittances.
Frederic Ponsot examines in chapter 10 the remittance market inFrance, a key destination country for migrants from West Africa andNorth Africa. Two-fifths of an estimated 6.7 million immigrants in Franceare estimated to originate in the African continent (World Bank 2011).The largest African sources of immigrants in France are the North African
Migrant Remittances in Africa: An Overview 47
countries (Algeria, Morocco, and Tunisia), followed by Senegal, Côted’Ivoire, Mali, Cameroon, the Republic of Congo, and the DemocraticRepublic of Congo in Sub-Saharan Africa. Recorded remittance outflowsfrom France were $5.2 billion in 2009, with a significant share going toAfrica; however, the actual amounts, including flows through unrecordedchannels, are likely to be higher.
The study finds that the remittance industry in France is dominated bybanks, a few money transfer companies that are registered as financialinstitutions, and a partnership between La Banque Postale and WesternUnion. French banks do not appear to view African migrants as viablemass-market clients. Some African banks have representative offices inFrance that facilitate remittances, payments of pensions to retirees in theircountries of origin (especially in North Africa), and investments.However, Sub-Saharan African banks have little presence in France, witha few exceptions (for example, banks from Burkina Faso and Senegal).
On the receiving side, the corridors in Africa are marked by weakfinancial infrastructure, and the informal sector plays a significant role inrural areas. However, the emergence of microfinance institutions andretail card-based payment systems (with the help of monetary authoritiesand international donors) have the potential to improve the delivery ofremittances.
The chapter makes some concrete policy recommendations toimprove the quality of remittance outflows data, including comparingthese with remittance-recipient African countries, and discusses policiesto increase competition and reduce costs, including eliminating exclusivepartnerships; promoting payment institutions; reducing barriers to entryfor money transfers; encouraging banks to partner with a variety of RSPs;clarifying regulations about the involvement of telecom operators incross-border remittances to facilitate remittances from France to Africathrough mobile phones; and improving the infrastructure for remittancepayments, a key step toward bringing remittances into the formal finan-cial system.
In chapter 11, Leon Isaacs summarizes the remittance market in theUnited Kingdom, a key destination country for migrants from East Africaand Southern Africa. Over one-sixth of immigrants (1.2 million) are esti-mated to be from Africa (World Bank 2011). The largest African-migrantcountries of origin in the United Kingdom include South Africa, Kenya,Nigeria, Zimbabwe, Somalia, Ghana, and Uganda. Recorded remittanceoutflows from the United Kingdom were $3.7 billion in 2009, but the
48 Remittance Markets in Africa
actual amounts, including flows through unrecorded channels, are likelyto be much higher.
The study finds that a broad range of RSPs send money to Africa.Because of a “light touch” regulatory regime relative to other Europeancountries, there are few barriers to entry of small RSPs to the U.K. remit-tance market. Average costs for sending remittances to Africa, however,tend to be higher than for sending to, for example, South Asia, but thesecosts have been declining over time. Most RSPs have now been registeredas Payments Institutions, under the EU Payments Services Directive.Some services offer Internet-based transfers, and some (such as Mukuru)used to offer even transfers for goods and fuel in Zimbabwe because ofthe country’s hyperinflation.
Recommendations to improve the efficiency of remittance flowsfrom the United Kingdom to Africa include (a) establishing a dialoguebetween the money transfer companies and central banks of recipientcountries in Africa; (b) broadening the types of businesses that can pro-vide remittances, including nonbank financial institutions and retailbusinesses; (c) working with authorities to remove incentives to transferthrough informal channels (by eliminating the parallel market premiumbetween official and market rates through exchange liberalization);(d) increasing cost transparency by frequently updating, and increas-ing coverage of, available remittance price data; and (e) promotingfinancial literacy for African migrants.
Migrant Remittances in Africa: An Overview 49
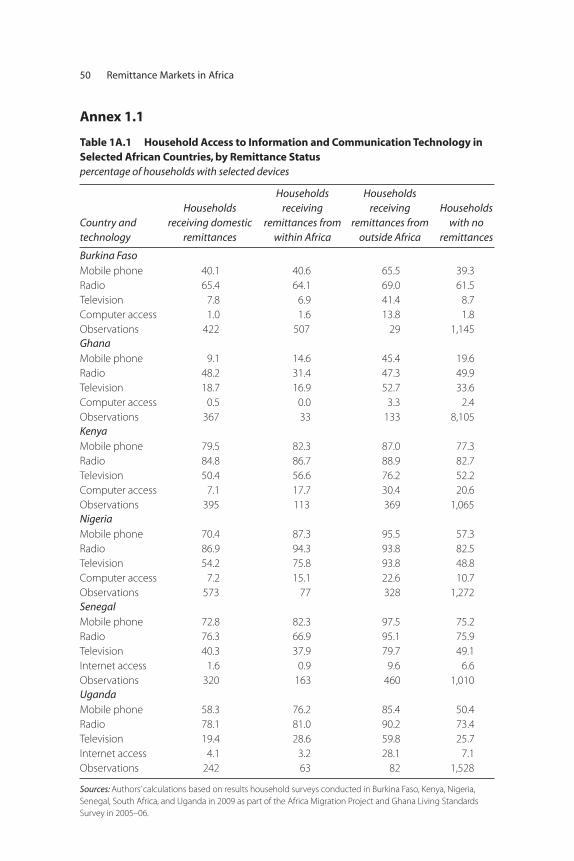
Annex 1.1
50 Remittance Markets in Africa
Table 1A.1 Household Access to Information and Communication Technology inSelected African Countries, by Remittance Statuspercentage of households with selected devices
Country andtechnology
Householdsreceiving domestic
remittances
Householdsreceiving
remittances fromwithin Africa
Householdsreceiving
remittances fromoutside Africa
Householdswith no
remittances
Burkina FasoMobile phone 40.1 40.6 65.5 39.3Radio 65.4 64.1 69.0 61.5Television 7.8 6.9 41.4 8.7Computer access 1.0 1.6 13.8 1.8Observations 422 507 29 1,145GhanaMobile phone 9.1 14.6 45.4 19.6Radio 48.2 31.4 47.3 49.9Television 18.7 16.9 52.7 33.6Computer access 0.5 0.0 3.3 2.4Observations 367 33 133 8,105 KenyaMobile phone 79.5 82.3 87.0 77.3Radio 84.8 86.7 88.9 82.7Television 50.4 56.6 76.2 52.2Computer access 7.1 17.7 30.4 20.6Observations 395 113 369 1,065NigeriaMobile phone 70.4 87.3 95.5 57.3Radio 86.9 94.3 93.8 82.5Television 54.2 75.8 93.8 48.8Computer access 7.2 15.1 22.6 10.7Observations 573 77 328 1,272SenegalMobile phone 72.8 82.3 97.5 75.2Radio 76.3 66.9 95.1 75.9Television 40.3 37.9 79.7 49.1Internet access 1.6 0.9 9.6 6.6Observations 320 163 460 1,010UgandaMobile phone 58.3 76.2 85.4 50.4Radio 78.1 81.0 90.2 73.4Television 19.4 28.6 59.8 25.7Internet access 4.1 3.2 28.1 7.1Observations 242 63 82 1,528
Sources: Authors’ calculations based on results household surveys conducted in Burkina Faso, Kenya, Nigeria,Senegal, South Africa, and Uganda in 2009 as part of the Africa Migration Project and Ghana Living StandardsSurvey in 2005–06.
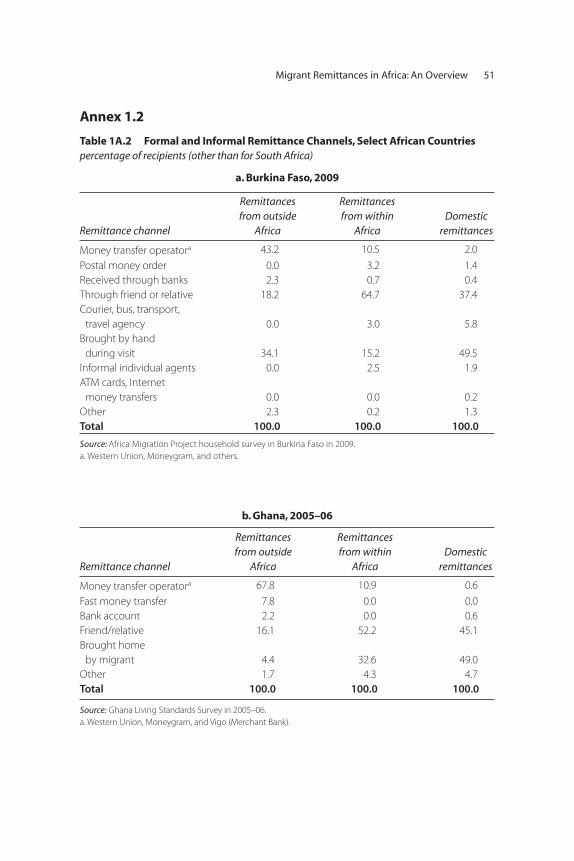
Annex 1.2
Migrant Remittances in Africa: An Overview 51
Table 1A.2 Formal and Informal Remittance Channels, Select African Countries percentage of recipients (other than for South Africa)
a. Burkina Faso, 2009
Remittance channel
Remittancesfrom outside
Africa
Remittances from within
AfricaDomestic
remittances
Money transfer operatora 43.2 10.5 2.0Postal money order 0.0 3.2 1.4Received through banks 2.3 0.7 0.4Through friend or relative 18.2 64.7 37.4Courier, bus, transport,
travel agency 0.0 3.0 5.8Brought by hand
during visit 34.1 15.2 49.5Informal individual agents 0.0 2.5 1.9ATM cards, Internet
money transfers 0.0 0.0 0.2Other 2.3 0.2 1.3Total 100.0 100.0 100.0
Source: Africa Migration Project household survey in Burkina Faso in 2009.a. Western Union, Moneygram, and others.
b. Ghana, 2005–06
Remittance channel
Remittances from outside
Africa
Remittances from within
AfricaDomestic
remittances
Money transfer operatora 67.8 10.9 0.6Fast money transfer 7.8 0.0 0.0Bank account 2.2 0.0 0.6Friend/relative 16.1 52.2 45.1Brought home
by migrant 4.4 32.6 49.0Other 1.7 4.3 4.7Total 100.0 100.0 100.0
Source: Ghana Living Standards Survey in 2005–06.a. Western Union, Moneygram, and Vigo (Merchant Bank).
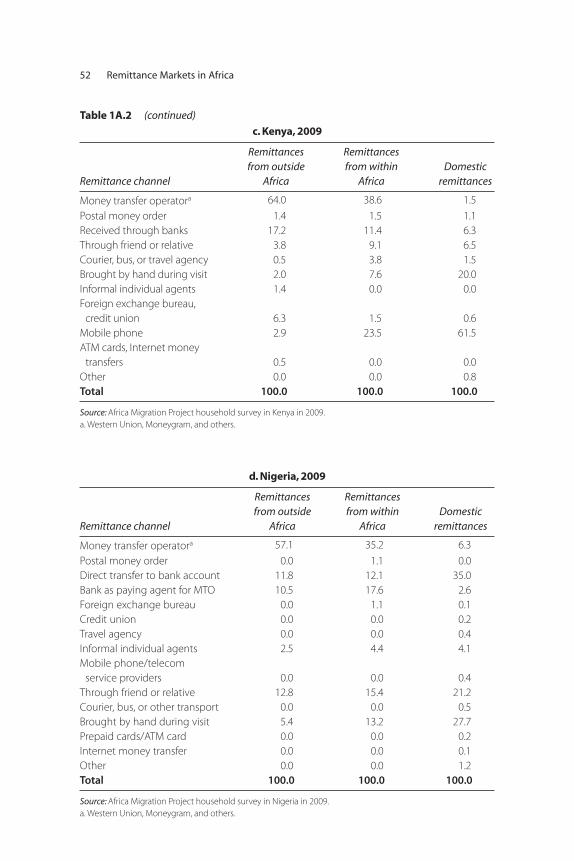
52 Remittance Markets in Africa
c. Kenya, 2009
Remittance channel
Remittances from outside
Africa
Remittancesfrom within
AfricaDomestic
remittances
Money transfer operatora 64.0 38.6 1.5Postal money order 1.4 1.5 1.1Received through banks 17.2 11.4 6.3Through friend or relative 3.8 9.1 6.5Courier, bus, or travel agency 0.5 3.8 1.5Brought by hand during visit 2.0 7.6 20.0Informal individual agents 1.4 0.0 0.0Foreign exchange bureau,
credit union 6.3 1.5 0.6Mobile phone 2.9 23.5 61.5ATM cards, Internet money
transfers 0.5 0.0 0.0Other 0.0 0.0 0.8Total 100.0 100.0 100.0
Source: Africa Migration Project household survey in Kenya in 2009.a. Western Union, Moneygram, and others.
d. Nigeria, 2009
Remittance channel
Remittances from outside
Africa
Remittances from within
AfricaDomestic
remittances
Money transfer operatora 57.1 35.2 6.3Postal money order 0.0 1.1 0.0Direct transfer to bank account 11.8 12.1 35.0Bank as paying agent for MTO 10.5 17.6 2.6Foreign exchange bureau 0.0 1.1 0.1Credit union 0.0 0.0 0.2Travel agency 0.0 0.0 0.4Informal individual agents 2.5 4.4 4.1Mobile phone/telecom
service providers 0.0 0.0 0.4Through friend or relative 12.8 15.4 21.2Courier, bus, or other transport 0.0 0.0 0.5Brought by hand during visit 5.4 13.2 27.7Prepaid cards/ATM card 0.0 0.0 0.2Internet money transfer 0.0 0.0 0.1Other 0.0 0.0 1.2Total 100.0 100.0 100.0
Source: Africa Migration Project household survey in Nigeria in 2009.a. Western Union, Moneygram, and others.
Table 1A.2 (continued)
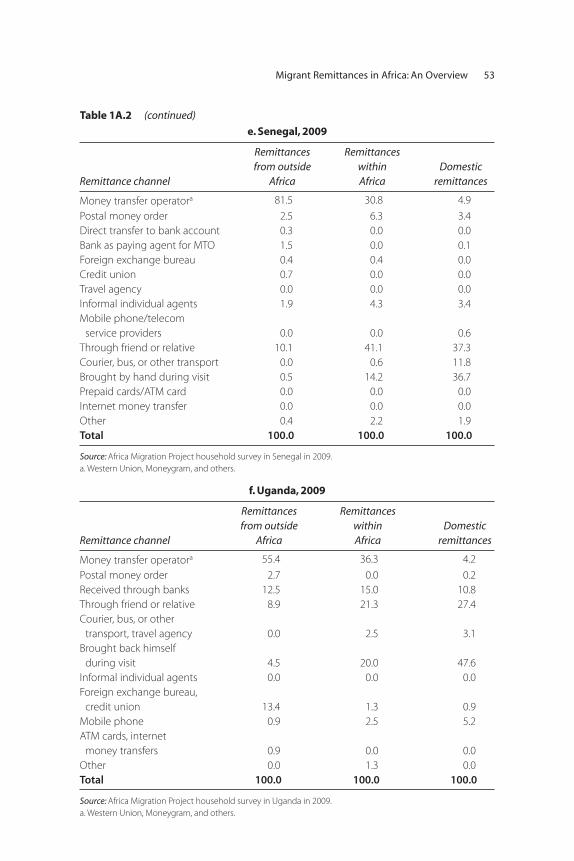
Migrant Remittances in Africa: An Overview 53
e. Senegal, 2009
Remittance channel
Remittances from outside
Africa
Remittances within Africa
Domestic remittances
Money transfer operatora 81.5 30.8 4.9Postal money order 2.5 6.3 3.4Direct transfer to bank account 0.3 0.0 0.0Bank as paying agent for MTO 1.5 0.0 0.1Foreign exchange bureau 0.4 0.4 0.0Credit union 0.7 0.0 0.0Travel agency 0.0 0.0 0.0Informal individual agents 1.9 4.3 3.4Mobile phone/telecom
service providers 0.0 0.0 0.6Through friend or relative 10.1 41.1 37.3Courier, bus, or other transport 0.0 0.6 11.8Brought by hand during visit 0.5 14.2 36.7Prepaid cards/ATM card 0.0 0.0 0.0Internet money transfer 0.0 0.0 0.0Other 0.4 2.2 1.9Total 100.0 100.0 100.0
Source: Africa Migration Project household survey in Senegal in 2009.a. Western Union, Moneygram, and others.
f. Uganda, 2009
Remittance channel
Remittances from outside
Africa
Remittances within Africa
Domestic remittances
Money transfer operatora 55.4 36.3 4.2Postal money order 2.7 0.0 0.2Received through banks 12.5 15.0 10.8Through friend or relative 8.9 21.3 27.4Courier, bus, or other
transport, travel agency 0.0 2.5 3.1Brought back himself
during visit 4.5 20.0 47.6Informal individual agents 0.0 0.0 0.0Foreign exchange bureau,
credit union 13.4 1.3 0.9Mobile phone 0.9 2.5 5.2ATM cards, internet
money transfers 0.9 0.0 0.0Other 0.0 1.3 0.0Total 100.0 100.0 100.0
Source: Africa Migration Project household survey in Uganda in 2009.a. Western Union, Moneygram, and others.
Table 1A.2 (continued)
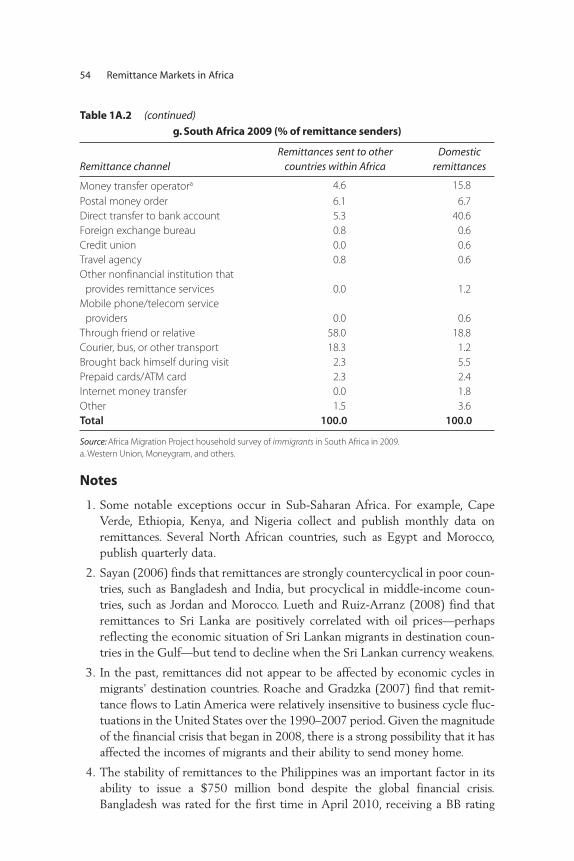
Notes
1. Some notable exceptions occur in Sub-Saharan Africa. For example, CapeVerde, Ethiopia, Kenya, and Nigeria collect and publish monthly data onremittances. Several North African countries, such as Egypt and Morocco,publish quarterly data.
2. Sayan (2006) finds that remittances are strongly countercyclical in poor coun-tries, such as Bangladesh and India, but procyclical in middle-income coun-tries, such as Jordan and Morocco. Lueth and Ruiz-Arranz (2008) find thatremittances to Sri Lanka are positively correlated with oil prices—perhapsreflecting the economic situation of Sri Lankan migrants in destination coun-tries in the Gulf—but tend to decline when the Sri Lankan currency weakens.
3. In the past, remittances did not appear to be affected by economic cycles inmigrants’ destination countries. Roache and Gradzka (2007) find that remit-tance flows to Latin America were relatively insensitive to business cycle fluc-tuations in the United States over the 1990–2007 period. Given the magnitudeof the financial crisis that began in 2008, there is a strong possibility that it hasaffected the incomes of migrants and their ability to send money home.
4. The stability of remittances to the Philippines was an important factor in itsability to issue a $750 million bond despite the global financial crisis.Bangladesh was rated for the first time in April 2010, receiving a BB rating
54 Remittance Markets in Africa
g. South Africa 2009 (% of remittance senders)
Remittance channelRemittances sent to other
countries within AfricaDomestic
remittances
Money transfer operatora 4.6 15.8Postal money order 6.1 6.7Direct transfer to bank account 5.3 40.6Foreign exchange bureau 0.8 0.6Credit union 0.0 0.6Travel agency 0.8 0.6Other nonfinancial institution that
provides remittance services 0.0 1.2Mobile phone/telecom service
providers 0.0 0.6Through friend or relative 58.0 18.8Courier, bus, or other transport 18.3 1.2Brought back himself during visit 2.3 5.5Prepaid cards/ATM card 2.3 2.4Internet money transfer 0.0 1.8Other 1.5 3.6Total 100.0 100.0
Source: Africa Migration Project household survey of immigrants in South Africa in 2009.a. Western Union, Moneygram, and others.
Table 1A.2 (continued)
from Standard & Poor’s Investor Relations Service and a Ba3 from Moody’sInvestors Service, similar to the ratings of many emerging markets. The ratingagencies cited the high share of remittance flows in GDP and the high growthrate as important factors in their rating decisions.
5. In developed countries, a firm’s credit risk typically accounts for a large partof the information content of its ratings; in developing countries, the sover-eign rating exerts significant influence on—and often acts as a ceiling for—theforeign currency ratings of firms and banks in the country (Borensztein,Cowan, and Valenzuela 2007; Ratha, De, and Mohapatra 2011).
6. The joint World Bank–IMF Low-Income Country Debt SustainabilityFramework now allows for more explicit consideration of remittances in eval-uating the ability of countries to repay external obligations and take on non-concessional borrowing from private creditors (IMF 2010b).
7. Banks in several developing countries—including Brazil, Egypt, El Salvador,Guatemala, Kazakhstan, Mexico, and Turkey—have been able to raise cheaperand longer-term financing (more than $15 billion since 2000) from interna-tional capital markets by securitizing future remittance flows (Ratha 2005,Ketkar and Ratha 2009a).
8. The United States, in partnership with the Inter-American DevelopmentBank, launched the BRIDGE (Building Remittance Investments forDevelopment, Growth and Entrepreneurship) initiative, which aims to secu-ritize remittances for infrastructure projects in developing countries, startingwith pilots in El Salvador and Honduras.
9. An empirical study of 109 countries for 1990–2003 shows that a well-developed financial sector can more effectively intermediate remittances withinvestment and that the impact of remittance inflows on exchange rate appre-ciation is smaller when the level of financial development is higher (Acosta,Baerg, and Mandelman 2009). Increased receipt of remittances is also associatedwith higher market capitalization, a key indicator of financial market develop-ment (Billmeier and Massa 2009). A higher sovereign rating as a result of remit-tances can translate into greater access of subsovereign entities to internationalcapital markets, thereby increasing the level of investment in the economy.
10. Latin American countries receiving remittances have experienced someexchange rate appreciation (Fajnzylber and Lopez 2007; Amuedo-Dorantesand Pozo 2004), but Fajnzylber and Lopez (2007) find little or no impact ofremittance flows on the exchange rate outside the Latin American region.
11. Empirical specifications that include remittances in cross-country growthregressions provide mixed results (Barajas and others 2009; Catrinescu andothers 2009; Singh, Haacker, and Lee 2009). The lack of significance of remit-tances in some growth equations may reflect the fact their effects on humanand physical capital are realized only over a long time period; that the effectsare endogenous (that is, they rise with declines in output); or that official data
Migrant Remittances in Africa: An Overview 55
on remittances are of poor quality. Another factor accounting for the lack ofsignificance may be omitted variables, such as policies and institutions(Catrinescu and others 2009), the level of financial development (Giulianoand Ruiz-Arranz 2009), and other indirect channels through which remit-tances can influence economic growth (Rao and Hassan 2009).
12. Other benefits include the transmission of knowledge, trade and investmentlinkages, fertility norms, and so on.
13. Only one-third of African migrant households in the OECD send remit-tances. The average remittance sent by migrant households that remit is$2,638 (Bollard, McKenzie, and Morten 2010).
14. The evidence on whether skilled or unskilled migrants send larger remittancesis mixed. Some studies suggest that skilled migrants remit less because theyare more likely to settle down in their host countries and eventually bringtheir families (Niimi and Ozden 2006; Faini 2007). Other studies, based onmicrodata, find a positive relationship between education and the amountsremitted (Bollard and others 2009; Clemens 2009). Some authors suggestthat remittances sent by skilled migrants may exceed the cost of their train-ing (Clemens 2009; Easterly and Nyarko 2009).
15. Taylor and Wyatt (1996) argue that the shadow value of remittances for over-coming risk and liquidity constraints is particularly important to householdsin the low- to middle-income range, which otherwise tend to be credit- constrained. Guatemalan households receiving remittances spend more at themargin on housing, even after controlling for the endogeneity of remittance-receiving status (Adams and Cuecuecha 2011). About one-fifth of the capitalinvested in 6,000 microenterprises in urban Mexico was financed by remit-tances (Woodruff and Zenteno 2001, 2007; see also Massey and Parrado1998). In rural Pakistan, international remittances raise the propensity toinvest in agricultural land (Adams 1998). Remittance-receiving households thatbenefited from an exchange rate shock spent more hours in self-employmentand were more likely to start relatively capital-intensive entrepreneurialenterprises in the Philippines (Yang 2008b). Some recent studies (for exam-ple, Ashraf and others 2010) find that giving migrants more control over theuses of remittances can increase savings rates among both migrants and remit-tance recipients.
16. See Acosta, Fajnzylber, and López (2007); Acosta and others (2008);Ebeke (2010); Cox-Edwards and Ureta (2003); Hanson and Woodruff(2003); Lopez-Cordova (2005); Calero, Bedi, and Sparrow (2009);Amuedo-Dorantes, Georges, and Pozo (2010); Bredl (2011); Adams andCuecuecha (2010); De and Ratha (2006); Mansuri (2007); Yang (2008b);Bansak and Chezum (2009). However, other studies have found a nega-tive impact of migration on educational outcome. A recent study found
56 Remittance Markets in Africa
that living in a migrant-sending household in Mexico reduced the likeli-hood of children completing high school by 13–15 percent (McKenzieand Rapoport 2010).
17. Fajnzylber and Lopez (2007) find that in Guatemala and Nicaragua, chil-dren 1–5 in remittance-receiving households were more likely to be ofabove- average height and weight and to have had a doctor-assisted delivery.Studies of Mexico find that remittances were associated with lower infantmortality rates (Hildebrandt and McKenzie 2005; Lopez-Cordova 2005)and higher health care expenditures (Amuedo-Dorantes, Pozo, and Sainz2007; Valero-Gil 2009). Kanaiaupuni and Donato (1999) find that infantmortality rates initially rose in Mexican villages with very high rates ofmigration to the United States but that remittances eventually reducedinfant mortality rates.
18. In Ecuador, remittances helped keep children of remittance-receiving house-holds in school when faced with adverse shocks (Calero, Bedi, and Sparrow2009). Increased remittances helped smooth household consumption andcompensate for the loss of assets after an earthquake in El Salvador in 2001(Halliday 2006). Transfers from friends and relatives in the United Statesplayed an important role in reducing the distress caused in Haiti by CycloneJeanne in 2004 (Weiss-Fagan 2006) and after the devastating earthquake in2010 (Ratha 2010). Remittance-receiving households in the Aceh region ofIndonesia recovered more quickly than other households after the 2004tsunami (Wu 2006). Migrant remittances were important factors in disasterrecovery and reconstruction after a devastating earthquake in Pakistan in2005 (Suleri and Savage 2006). In the Philippines, remittances helped com-pensate for the loss in income caused by adverse rainfall shocks (Yang andChoi 2007). In Thailand, domestic remittances increased in response tobelow-average rainfall in the recipients’ region and to increases in medicalexpenses in recipient households (Miller and Paulson 2007).
19. Mohapatra, Joseph, and Ratha (2009) find that remittance-receiving house-holds in Ghana are likely to have better access to communication equipmentand mobile phones than households that do not receive any remittances, evenafter controlling for the possibility of self-selection of remittance-receivinghouseholds.
20. The World Bank’s Remittance Prices Worldwide database provides averageremittance costs through banks and nonbank intermediaries for more than150 migration corridors. http://remittanceprices.worldbank.org.
21. Transfer costs tend to be lower when financial systems are more developed andexchange rates less volatile (Freund and Spatafora 2008). Beck and MartinezPeria (2009) find that remittance corridors with larger stocks of migrants, alarger number of RSPs, and greater banking competition have lower costs.
Migrant Remittances in Africa: An Overview 57
22. Access to “bank-like” institutions, such as microfinance institutions and sav-ings and credit cooperatives, is also limited outside of urban areas (Demirgüç-Kunt, Beck, and Honohan 2008).
23. Qualitative information was collected for the United States. Conducting asurvey in the United States proved infeasible because there is no national-level institutional focal point; each state has a different legal and regulatoryframework, compliance requirements, and institutions governing remittances(Andreassen 2006).
24. The Southern African Migration Project conducted national-level representa-tive surveys on remittance flows and usage at the household level for fivecountries belonging to the Southern African Development Community:Botswana, Lesotho, Southern Mozambique, Swaziland, and Zimbabwe, witha focus on intraregional transfers from South Africa and Botswana (Pendletonand others 2006). While the use of informal channels is predominant inremittances sent from South Africa to neighboring countries, among formalchannels used, TEBA Bank provides bank transfers for migrant mining work-ers in South Africa, accounting for about 16 percent of transfers to Botswanaand 8 percent for Swaziland.
25. The concept of mobile money transfers is being transferred from Africa toother developing regions. India’s Bharti Telecom, which recently acquiredZain, has received approval from India’s central bank to start mobile pay-ments services in India. The “semiclosed wallet” will allow Bharti Airtel’s cus-tomers in India to exchange physical cash for virtual money, which can thenbe used to pay for goods and services up to Rs 5,000 (about $108) per trans-action. It does not, however, allow cash withdrawals at present. See EconomicTimes 2010.
26. http://allafrica.com/stories/201006071332.html.
27. http://www.wizzit.co.za.
28. In the Philippines, for example, regulators have imposed the same reportingrequirements on bank and nonbank mobile money providers (Dolan 2009).
29. The Philippines has been at the forefront of mobile money-transfer services(World Bank 2006), while Brazil has considerable experience with “branchlessbanking” using retail payment networks and point-of-sale devices deployed atagents such as grocery stores (Pickens, Porteous, and Rotman 2009).
30. For example, in Sub-Saharan Africa in 2008, only 17 percent of post officeswere equipped with computers and had Internet access. A study led by theUniversal Postal Union in 2010 showed that only two African countries outof 43 who answered a questionnaire had developed a cost-accounting system(Clotteau and Anson 2011).
31. http://www.postbank.co.ke/.
32. World Bank and BIS-CPSS 2007.
58 Remittance Markets in Africa
References
Abdih, Yasser, Ralph Chami, Jihad Dagher, and Peter Montiel. 2008. “Remittancesand Institutions: Are Remittances a Curse?” Working Paper 08/29,International Monetary Fund, Washington, DC.
Abdih, Yasser, Michael Gapen, Amine Mati, and Ralph Chami. 2009. “FiscalSustainability in Remittance-Dependent Economies.” Working Paper 09/190,International Monetary Fund, Washington, DC.
Acosta, Pablo, Nicole Baerg, and Federico Mandelman. 2009. “FinancialDevelopment, Remittances, and Real Exchange Rate Appreciation.” EconomicReview (Federal Reserve Bank of Atlanta) 94 (1): 1–12.
Acosta, Pablo A., Cesar Calderon, Humberto López, and Pablo Fajnzylber. 2008.“What is the Impact of International Remittances on Poverty and Inequalityin Latin America?” World Development 36 (1): 89–114.
Acosta, Pablo, Pablo Fajnzylber, and Humberto López. 2007. “The Impact ofRemittances on Poverty and Human Capital: Evidence from Latin AmericanHousehold Surveys.” In International Migration, Economic Development andPolicy, ed. Caglar Özden and Maurice Schiff, 59–98. New York: World Bankand Palgrave Macmillan.
Acosta, Pablo, Emmanuel Lartey, and Federico Mandelman. 2009. “Remittancesand the Dutch Disease.” Journal of International Economics 79(1): 102–16.
Adams, Richard H. 1998. “Remittances, Investment and Rural AssetAccumulation in Pakistan.” Economic Development and Cultural Change47 (1): 155–73.
———. 2006. “Remittances and Poverty in Ghana.” Policy Research WorkingPaper 3838, World Bank, Washington, DC.
Adams, Richard H., and Alfredo Cuecuecha. 2010. “Remittances, HouseholdExpenditure and Investment in Guatemala.” World Development, 38 (11):1626–1641.
Adams, Richard H., Alfredo Cuecuecha, and John Page. 2008a. “Remittances,Consumption and Investment in Ghana.” Policy Research Working Paper4515, World Bank, Washington, DC.
———. 2008b. “The Impact of Remittances on Poverty and Inequality in Ghana.”Policy Research Working Paper 4732, World Bank, Washington, DC.
Adams, Richard H., and John Page. 2003. “International Migration, Remittancesand Poverty in Developing Countries.” Policy Research Working Paper 3179,World Bank, Washington, DC.
———. 2005. “Do International Migration and Remittances Reduce Poverty inDeveloping Countries?” World Development 33 (10): 1645–69.
AfDB (African Development Bank) and World Bank. 2011. Leveraging Migrationfor Africa: Remittances, Skills, and Investments. Washington, DC: World Bank.
Migrant Remittances in Africa: An Overview 59
Afreximbank (African Export-Import Bank). 2005. Annual Report. http://www.afreximbank.com.
Aggarwal, Reena, Asli Demirgüç-Kunt, and Maria Soledad Martinez Peria. 2006.“Do Workers’ Remittances Promote Financial Development?” Policy ResearchWorking Paper 3957, World Bank, Washington, DC.
Ajayi, Michael A., Mukaila A. Ijaiya, Gafar T. Ijaiya, Raji A. Bello, Mufthau A. Ijaiya,and Sidikat L. Adeyemi. 2009. “International Remittances and Well-Being inSub-Saharan Africa.” Journal of Economics and International Finance 1 (3):78–84.
Aker, Jenny C., and Isaac M. Mbiti. 2010. “Mobile Phones and EconomicDevelopment in Africa.” Working Paper 211, Center for Global Development,Washington, DC.
Akinlo, Anthony E., and Tajudeen Egbetunde. 2010. “Financial Development andEconomic Growth: The Experience of 10 Sub-Saharan African CountriesRevisited.” The Review of Finance and Banking 2 (1): 17–28.
Amuedo-Dorantes, Catalina, and Susan Pozo. 2004. “Workers’ Remittances and theReal Exchange Rate: A Paradox of Gifts.” World Development 32 (8): 1407–17.
———. 2011. “New Evidence on the Role of Remittances on Health CareExpenditures by Mexican Households.” Review of Economics of the Household9 (1): 69–98.
Amuedo-Dorantes, Catalina, Susan Pozo, and Tania Sainz. 2007. “Remittances andHealthcare Expenditure Patterns of Populations in Origin Communities:Evidence from Mexico.” Integration & Trade 27 (July–December): 159–84.
Andreassen, Ole. 2006. “Remittance Service Providers in the United States: Howremittance firms operate and how they perceive their business environment.”Financial Sector Discussion Series, Payments Systems and Remittances, WorldBank, Washington DC. June.
Anyanwu, John C., and Andrew E. O. Erhijakpor. 2010. “Do InternationalRemittances Affect Poverty in Africa?” African Development Review 22(1): 51–91.
Avendaño, Rolando, Norbert Gaillard, and Sebastián Nieto Parra. 2009. “AreWorkers’ Remittances Relevant for Credit Rating Agencies?” DevelopmentCenter Working Paper 282, Organisation for Economic Co-operation andDevelopment, Paris.
Awareness Times (Sierra Leone). 2010. “In Sierra Leone, Over 150,000 ClientsRegistered with Splash Mobile Money.” September 16. http://news.sl/drwebsite/publish/article_200516307.shtml.
Azam, Jean-Paul, and Flore Gubert. 2005. “Those in Kayes. The Impact ofRemittances on Their Recipients in Africa.” Revue Économique 56 (6): 1331–58.
———. 2006. “Migrants’ Remittances and the Household in Africa: A Review ofEvidence.” Journal of African Economies 15 (AERC Supplement): 426–62.
60 Remittance Markets in Africa
Babatunde, Raphael O., and Enrica C. Martinetti. 2010. “Impact of Remittances onFood Security and Nutrition in Rural Nigeria.” Unpublished manuscript, Centerfor International Cooperation and Development, University of Pavia, Italy.
Bansak, Cynthia, and Brian Chezum. 2009. “How Do Remittances Affect HumanCapital Formation of School-Age Boys and Girls?” American Economic Review99 (2): 145–48.
Barajas, Adolfo, Ralph Chami, Connel Fullenkamp, Michael Gapen, and Peter J.Montiel. 2009. “Do Workers’ Remittances Promote Economic Growth?”Working Paper 09/153, International Monetary Fund, Washington, DC.
Beck, Thorsten, and Maria Soledad Martinez Peria. 2009. “What Explains the Costof Remittances? An Examination Across 119 Country Corridors.” PolicyResearch Working Paper 5072, World Bank, Washington, DC.
Billmeier, Andreas, and Isabella Massa. 2009. “What Drives Stock MarketDevelopment in Emerging Markets—Institutions, Remittances, or NaturalResources?” Emerging Markets Review 10 (1): 23–35.
Birdsall, Nancy, and Punam Chuhan. 1986. “Client Choice of Health CareTreatment in Rural Mali.” Unpublished manuscript for the Health, Nutritionand Population Department, World Bank, Washington, DC.
Block, Steven, and Patrick Webb. 2001. “The Dynamics of LivelihoodDiversification in Post-Famine Ethiopia.” Food Policy 26 (4): 333–50.
Bold, Chris. 2010. “Borderless Branchless Banking.” Technology Blog, ConsultativeGroup to Assist the Poor (CGAP), Washington DC. December 14.
Bollard, Albert, David McKenzie, and Melanie Morten. 2010. “The RemittingPatterns of African Migrants in the OECD.” Journal of African Economies 19(5): 605–34.
Bollard, Albert, David McKenzie, Melanie Morten, and Hillel Rapoport. 2009.“Remittances and the Brain Drain Revisited: The Microdata Show that MoreEducated Migrants Remit More.” Policy Research Working Paper 5113, WorldBank, Washington, DC.
Borensztein, Eduardo, Kevin Cowan, and Patricio Valenzuela. 2007. “SovereignCeilings ‘Lite’? The Impact of Sovereign Ratings on Corporate Ratings inEmerging Market Economies.” Working Paper 07/75, International MonetaryFund, Washington, DC.
Bourdet, Yves, and Hans Falck. 2006. “Emigrants’ Remittances and Dutch Diseasein Cape Verde.” International Economic Journal 20 (3): 267–84.
Bracking, Sarah, and Lloyd Sachikonye. 2008 “Remittances, Poverty Reductionand Informalization in Zimbabwe 2005–6: A Political Economy ofDispossession?” Brooks World Poverty Institute Working Paper 28, Universityof Manchester, U.K.
Bredl, Sebastian. 2011. “Migration, Remittances and Educational Outcomes: TheCase of Haiti.” International Journal of Educational Development 31 (2): 162–68.
Migrant Remittances in Africa: An Overview 61
Bugamelli, Matteo, and Francesco Paterno. 2009. “Do Workers’ RemittancesReduce the Probability of Current Account Reversals?” World Development 37(12): 1821–38.
Business Daily Africa. 2010. “Mobile Money Transforms Uganda.” September 7.allafrica.com/stories/201009070007.html.
Bussolo, Maurizio, and Dennis Medvedev. 2007. “Do Remittances Have a FlipSide? A General Equilibrium Analysis of Remittances, Labor SupplyResponses, and Policy Options for Jamaica.” Policy Research Working Paper4143, World Bank, Washington, DC.
Calero, Carla, Arjun S. Bedi, and Robert Sparrow. 2009 “Remittances, LiquidityConstraints and Human Capital Investments in Ecuador.” World Development37 (6): 1143–54.
Catrinescu, Natalia, Miguel Leon-Ledesma, Matloob Piracha, and Bryce Quillin.2009. “Remittances, Institutions, and Economic Growth.” World Development37 (1): 81–92.
CGAP (Consultative Group to Assist the Poor) and Dalberg (Global DevelopmentAdvisers). 2010. “Improving Access and Reducing Costs of InternationalRemittances through Branchless Banking Solutions.” Landscaping researchby Dalberg for the CGAP Technology Program, CGAP, Washington, DC.http://www.cgap.org/gm/document-1.9.49049/Dalberg-CGAP_Intl_Remit_Branchless_Banking_Findings.pdf.
Chami, Ralph, Adolfo Barajas, Thomas Cosimano, Connel Fullenkamp, MichaelGapen, and Peter Montiel. 2008. “Macroeconomic Consequences ofRemittances.” Occasional Paper 259, International Monetary Fund,Washington, DC.
Chami, Ralph, Dalia Hakura, and Peter Montiel. 2009. “Remittances: AnAutomatic Stabilizer?” Working Paper 09/91, International Monetary Fund,Washington, DC.
Chauvet, Lisa, Flore Gubert, and Sandrine Mesplé-Somps. 2009. “Are RemittancesMore Effective than Aid to Reduce Child Mortality? An Empirical AssessmentUsing Inter- and Intra-Country Data.” Développement Institutions &Mondialisation (DIAL) Working Paper DT/2009-11, DIAL, Paris.
Clarke, George, and Scott Wallsten. 2004. “Do Remittances Protect Householdsin Developing Countries against Shocks? Evidence from a Natural Disaster inJamaica.” Unpublished manuscript, World Bank, Washington, DC.
Clemens, Michael. 2009. “The Financial Effects of High-Skill Emigration: NewData on African Doctors Abroad.” Presentation at the InternationalConference on Diaspora for Development, World Bank, Washington, DC, July13–14. http://siteresources.worldbank.org/INTPROSPECTS/Resources/334934-1110315015165/Clemens.pdf.
Clotteau, Nils, and Jose Anson. 2011. “Role of Post Offices in Remittances andFinancial Inclusion.” Background note prepared for the Africa Migration
62 Remittance Markets in Africa
Project, Universal Postal Union, Berne, Switzerland. Migration andDevelopment Brief 15, World Bank, Washington, DC.
Cox-Edwards, Alejandra, and Manuelita Ureta, M. 2003. “International Migration,Remittances and Schooling: Evidence from El Salvador.” Journal ofDevelopment Economics 72 (2): 429–61.
De, Prabal, and Dilip Ratha. 2006. “Migration and Remittances in Sri Lanka.”Unpublished manuscript, Development Prospects Group, World Bank,Washington, DC.
Demirgüç-Kunt, Asli, Thorsten Beck, and Patrick Honohan. 2008. “Finance forAll? Policies and Pitfalls in Expanding Access.” Policy Research Report, WorldBank, Washington, DC.
Dolan, Jonathan. 2009. “Accelerating the Development of Mobile MoneyEcosystems.” Report on the Mobile Money Summit 2009, InternationalFinance Corporation and Harvard Kennedy School, Cambridge, MA.http://www.hks.harvard.edu/m-rcbg/CSRI/publications/report_39_mobile_money_january_09.pdf.
Drabo, Alassane, and Christian Ebeke. 2010. “Remittances, Public HealthSpending and Foreign Aid in the Access to Health Care Services inDeveloping Countries.” Working Paper E 2010.04, Central ExtensionResources Development Institute (CERDI), Clermont-Ferrand, France.
Easterly, William, and Yaw Nyarko. 2009. “Is the Brain Drain Good for Africa?” InSkilled Immigration Today: Prospects, Problems, and Policies, ed. Jagdish Bhagwatiand Gordon Hanson, 316–60. New York: Oxford University Press.
Ebeke, Christian H. 2010. “The Effect of Remittances on Child Labor: Cross-Country Evidence.” Economics Bulletin 30 (1): 351–64.
Economic Times. 2010. “Bharti Gets RBI Nod for Mobile Money Services.”September 17. http://economictimes.indiatimes.com/articleshow/6559841.cms?prtpage=1.
Economist. 2010. “Low-Cost Bundle: India’s Biggest Mobile Operator Makes aFresh Attempt to Enter Africa.” February 18. http://www.economist.com/node/15546456?story_id=15546456.
Elbadawi, Asmaa, and Rania Roushdy. 2009. “Impact of International Migrationand Remittances on Child Schooling and Child Work: The Case of Egypt.”Paper for the World Bank’s MENA International Migration Program fundedby the European Commission, World Bank, Washington, DC.
Faini, Riccardo. 2007. “Remittances and the Brain Drain: Do More SkilledMigrants Remit More?” The World Bank Economic Review 21 (2): 177–91.
Fajnzylber, Pablo, and Humberto López. 2007. Close to Home: The DevelopmentImpact of Remittances in Latin America. Washington, DC: World Bank.
Frankel, Jeffrey. 2011. “Are Bilateral Remittances Countercyclical?” OpenEconomies Review 22 (1): 1–16 .
Migrant Remittances in Africa: An Overview 63
Freund, Caroline, and Nikola Spatafora. 2008. “Remittances, Transaction Costs,and Informality.” Journal of Development Economics 86 (2): 356–66.
Ghirmay, Teame. 2004. “Financial Development and Economic Growth in Sub-Saharan African Countries: Evidence from Time Series Analysis.” AfricanDevelopment Review 16 (3): 415–32.
Gibson, John, David McKenzie, and Halahingano Rohorua. 2006. “How Cost-Elastic Are Remittances? Evidence from Tongan Migrants in New Zealand.”Pacific Economic Bulletin 21 (1): 112–28.
Giuliano, Paola, and Marta Ruiz-Arranz. 2009. “Remittances, FinancialDevelopment and Growth.” Journal of Development Economics 90 (1): 144–52.
Gubert, Flore. 2002. “Do Migrants Insure Those who Stay Behind? Evidence fromthe Kayes Area (Western Mali).” Oxford Development Studies 30 (3): 267–287.
———. 2007. “Migration and Development: Mixed Evidence from Western Mali.”Development 50 (4): 94–100.
Gupta, Sanjeev, Catherine A. Pattillo, and Smita Wagh. 2009. “Impact ofRemittances on Poverty and Financial Development in Sub-Saharan Africa.”World Development 37 (1): 104–15.
Gustafsson, Bjorn, and Negatu Makonnen. 1993. “Poverty and Remittances inLesotho.” Journal of African Economies 2 (1): 49–73.
Guzmán, Juan Carlos, Andrew R. Morrison, and Mirja Sjöblom. 2007. “TheImpact of Remittances and Gender on Household Expenditure Patterns.” InThe International Migration of Women, ed. Maurice Schiff, Andrew R.Morrison, and Mirja Sjöblom, 125–52. Washington, DC: World Bank.
Halliday, Timothy. 2006. “Migration, Risk and Liquidity Constraints in ElSalvador.” Economic Development and Cultural Change 54 (4): 893–925.
Hanson, Gordon, and Christopher Woodruff. 2003. “Emigration and EducationalAttainment in Mexico.” Unpublished manuscript, University of California,San Diego.
Hildebrandt, Nicole, and David McKenzie. 2005. “The Effects of Migration onChild Health in Mexico.” Economia 6 (1): 257–289.
Huysentruyt, Marieke, Christopher B. Barrett, and John G. McPeak. 2009.“Understanding Declining Mobility and Interhousehold Transfers among EastAfrican Pastoralists.” Economica 76 (302): 315–36.
IFAD (International Fund for Agriculture and Development). 2009. “SendingMoney Home to Africa: Remittance Markets, Enabling Environment andProspects.” Study report, IFAD, Rome.
IMF (International Monetary Fund). 2009. International Transactions inRemittances: Guide for Compilers and Users. Washington, DC: IMF.
———. 2010a. Balance of Payments Statistics Yearbook 2010. Washington, DC: IMF.
64 Remittance Markets in Africa
———. 2010b. “Staff Guidance Note on the Application of the Joint Bank-FundDebt Sustainability Framework for Low-Income Countries.” Guidance Note,IMF and World Bank staffs, Washington, DC.
IMF and World Bank. 2009. “A Review of Some Aspects of the Low-IncomeCountry Debt Sustainability Framework.” Policy Paper, IMF and World Bank,Washington, DC. http://www.imf.org/external/np/pp/eng/2009/080509a.pdf.
Irving, Jacqueline, Sanket Mohapatra, and Dilip Ratha. 2010. “MigrantRemittance Flows: Findings from a Global Survey of Central Banks.” WorkingPaper 194, World Bank, Washington, DC.
Joseph, Michael. 2010. “Kenya’s Telecom Revolution and Invention of MobileMoney.” Presentation at the World Bank, Washington, DC, November 12.
Kanaiaupuni, Shawn M., and Katharine M. Donato. 1999. “Migradollars andMortality: The Effects of Migration on Infant Survival in Mexico.”Demography 36 (3): 339–53.
Ketkar, Suhas, and Dilip Ratha, eds. 2009a. Innovative Financing for Development.Washington, DC: World Bank.
———. 2009b. “New Paths to Funding.” Finance and Development, InternationalMonetary Fund.
Lachaud, Jean-Pierre. 1999. “Envoi de fonds, inegalite et pauvrete au BurkinaFaso.” Documents de travail 40, Groupe d’Economie du Développement del’Université Montesquieu Bordeaux IV.
Lopez-Cordova, E. 2005. “Globalization, Migration and Development: The Roleof Mexican Migrant Remittances.” Economia 6 (1): 217–56.
Lucas, Robert E. B. 1987. “Emigration to South Africa’s Mines.” AmericanEconomic Review 77 (3): 313–30.
Lucas, Robert E. B., and Oded Stark. 1985. “Motivations to Remit: Evidence fromBotswana.” Journal of Political Economy 93 (5): 901–18.
Lueth, Erik, and Marta Ruiz-Arranz. 2008. “Determinants of Bilateral RemittanceFlows.” The B.E Journal of Macroeconomics 8 (1), Article 26.
Maimbo, Samuel, Tania Saranga, and Nicholas Strychacz. 2010. “FacilitatingCross-Border Mobile Banking in Southern Africa.” Economic Premise No. 26,World Bank, Washington, DC.
Mansuri, Ghazala. 2007. “Does Work Migration Spur Investment in OriginCommunities? Entrepreneurship, Schooling, and Child Health in RuralPakistan.” In International Migration, Economic Development, and Policy, ed.Çaglar Özden and Maurice Schiff, 99–140. Basingstoke, U.K.: PalgraveMacmillan.
Martinez, Claudia, Diego Aycinena, and Dean Yang. 2010. “The Impact ofRemittance Fees on Remittance Flows: Evidence from a Field Experiment
Migrant Remittances in Africa: An Overview 65
among Salvadoran Migrants.” Unpublished manuscript, University of Michigan,Ann Arbor.
Mas, Ignacio, and Dan Radcliffe. 2010. “Mobile Payments Go Viral: M-PESA inKenya.” Working paper, Bill and Melinda Gates Foundation, Seattle.
Massey, Douglas, and Emilio A. Parrado. 1998. “International Migration andBusiness Formation in Mexico.” Social Science Quarterly 79 (1): 1–20.
McCormick, Barry, and Jackline Wahba. 2001. “Overseas Work Experience,Savings and Entrepreneurship amongst Return Migrants to LDCs.” ScottishJournal of Political Economy 48 (2):164–78.
———. 2003 “Return International Migration and Geographical Inequality: TheCase of Egypt.” Journal of African Economies 12 (4): 500–32.
McKenzie, David, and Hillel Rapoport. 2010. “Can Migration Reduce EducationalAttainment? Evidence from Mexico.” Journal of Population Economics.Published online: DOI No. 10.1007/s00148-010-0316-x. http://www.springerlink.com/content/95ht846m8m3065l7
McKenzie, David, and Marcin J. Sasin. 2007. “Migration, Remittances, Poverty, andHuman Capital: Conceptual and Empirical Findings.” Policy ResearchWorking Paper 4272, World Bank, Washington, DC.
Miller, Douglas L., and Anna L. Paulson. 2007. “Risk Taking and the Quality ofInformal Insurance: Gambling and Remittances in Thailand.” Working Paper2007-01, Federal Reserve Bank of Chicago.
Mohapatra, Sanket, George Joseph, and Dilip Ratha. 2009. “Remittances and NaturalDisasters: Ex-Post Response and Contribution to Ex-Ante Preparedness.” PolicyResearch Working Paper 4972, World Bank, Washington, DC.
Morawczynski, Olga, and Mark Pickens. 2009. “Poor People Using Mobile FinancialServices: Observations on Customer Usage and Impact from M-PESA.”Consultative Group to Assist the Poor (CGAP) Brief, CGAP, Washington, DC.
Nagarajan, Subha. 2009. “Migration, Remittances, and Household Health:Evidence from South Africa.” Ph.D. dissertation, George WashingtonUniversity, Washington, DC.
Niimi, Yoko, and Caglar Ozden. 2006. “Migration and Remittances: Causes andLinkages.” Policy Research Working Paper 4087, World Bank, Washington, DC.
Odozia, John C., Timothy T. Awoyemia, and Bolarin T. Omonona. 2010.“Household Poverty and Inequality: The Implication of Migrants’ Remittancesin Nigeria.” Journal of Economic Policy Reform 13 (2): 191–99.
Orozco, Manuel. 2009. “Emerging Markets for Rwanda: Remittance Transfers, ItsMarketplace and Financial Intermediation.” Report, Inter-American Dialogue,Washington, DC.
Osili, Una Okonkwo, 2004. “Migrants and Housing Investments: Theory andEvidence from Nigeria.” Economic Development and Cultural Change 52 (4):821–49.
66 Remittance Markets in Africa
Page, John, and Sonia Plaza. 2006. “Migration Remittances and Development: AReview of Global Evidence.” Journal of African Economies 15 (Suppl. 2):245–336.
Pendleton, Wade, Jonathan Crush, Eugene Campbell, Thuso Green, HamiltonSimelane, Daniel Tevera, and Fion de Vletter. 2006. “Migration, Remittancesand Development in Southern Africa.” Migration Policy Series 44, SouthernAfrican Migration Project, Cape Town, South Africa.
Pickens, Mark, David Porteous, and Sarah Rotman. 2009. “Scenarios forBranchless Banking in 2020.” Consultative Group to Assist the Poor (CGAP)Focus Note 57, CGAP, Washington, DC. http://www.cgap.org/gm/document-1.9.40599/FN57.pdf.
Plaza, Sonia, Mario Navarrete, and Dilip Ratha. 2011. “Migration and RemittancesHousehold Surveys: Methodological Issues and New Findings from Sub-Saharan Africa.” Unpublished manuscript, Africa Migration Project, WorldBank, Washington DC.
Ponsot, Frédéric, and Bruno Obegi. 2010 “Etude de capitalisation des initiatives etmécanismes en matière de transferts de fonds au Mali.” Study conducted forCentre d’Information et de Gestion des Migrations (CIGEM), Mali.
Pulver, Caroline, William Jack, and Tavneed Suri. 2009. “The Performance andImpact of M-PESA: Preliminary Evidence from a Household Survey.”Unpublished paper, FSD Kenya Trust, Nairobi. http://technology.cgap.org/technologyblog/wp-content/uploads/2009/10/fsd_june2009_caroline_pulver.pdf.
Quartey, Peter. 2006. “The Impact of Migrant Remittances on Household Welfarein Ghana.” Research Paper 158, African Economic Research Consortium,Nairobi.
Quartey, Peter, and Theresa Blankson. 2004. “Do Migrant Remittances Minimizethe Impact of Macro-Volatility on the Poor in Ghana?” Report for the GlobalDevelopment Network, University of Ghana, Legon.
Rajan, Raghuram G., and Arvind Subramanian. 2005. “What Undermines Aid’sImpact on Growth?” Working Paper 05/127, International Monetary Fund,Washington, DC.
Rajan, Raghuram G., and Luigi Zingales. 1998. “Financial Dependence andGrowth.” The American Economic Review 88 (3): 559–86.
Rao, Bhaskara, and Gazi Hassan. 2009. “A Panel Data Analysis of the GrowthEffects of Remittances.” Munich Personal RePEc Archive (MPRA) WorkingPaper 18021, Munich. http://mpra.ub.uni-muenchen.de/18021/1/MPRA_paper_18021.pdf.
Ratha, Dilip. 2003. “Workers’ Remittances: An Important and Stable Source ofExternal Development Finance.” In Global Development Finance: Striving forStability in Development Finance, 157–75. Washington, DC: World Bank.
Migrant Remittances in Africa: An Overview 67
———. 2005. “Leveraging Remittances for Capital Market Access.” Unpublishedmanuscript, World Bank, Washington, DC.
———. 2007. “Leveraging Remittances for Development.” Policy Brief (June),Migration Policy Institute, Washington, DC.
———. 2010. “Mobilize the Diaspora for the Reconstruction of Haiti.” SSRCFeature: Haiti, Now and Next, Social Science Research Council, New York.http://www.ssrc.org/features/pages/haiti-now-and-next/1338/1438.
Ratha, Dilip, Prabal De, and Sanket Mohapatra. 2011. “Shadow Sovereign Ratingsfor Unrated Developing Countries.” World Development 39(3): 295–307.
Ratha, Dilip, Sanket Mohapatra, and Sonia Plaza. 2009. “Beyond Aid: NewSources and Innovative Mechanisms for Financing Development in Sub-Saharan Africa.” In Innovative Financing for Development, ed. Suhas Ketkar andDilip Ratha, 143–83. Washington DC: World Bank.
Ratha, Dilip, Sanket Mohapatra, and Ani Silwal. 2010. “Outlook for RemittanceFlows 2010–11: Remittance Flows to Developing Countries RemainedResilient in 2009, Expected to Recover in 2010–11.” Migration andDevelopment Brief 12, World Bank, Washington, DC. http://www.worldbank.org/prospects/migrationandremittances.
Ratha, Dilip, and Jan Riedberg. 2005. “On Reducing Remittance Costs.”Unpublished manuscript, Development Research Group, World Bank,Washington, DC.
Ratha, Dilip, and William Shaw. 2007. “South-South Migration and Remittances.”Development Prospects Group Working Paper 102, World Bank, Washington,DC.
Roache, Shaun K., and Ewa Gradzka. 2007. “Do Remittances to Latin AmericaDepend on the U.S. Business Cycle?” Working Paper 07/273, InternationalMonetary Fund, Washington, DC.
Russell, Sharon S. 1992. “Remittances from International Migration: A Review inPerspective.” World Development 14 (6): 677–96.
Rutten, Lamon, and Okey Oramah. 2006. “Using Commoditized Revenue Flowsto Leverage Access to International Finance; with a Special Focus on MigrantRemittances and Payment Flows.” Study for the United Nations Conferenceon Trade and Development (UNCTAD) Secretariat UNCTAD/DITC/COM/2006/9, UNCTAD, Geneva.
Sayan, Serdar. 2006. “Business Cycles and Workers’ Remittances: How DoMigrant Workers Respond to Cyclical Movements of GDP at Home?”Working Paper 06/52, International Monetary Fund, Washington, DC.
Singh, Raju J., Markus Haacker, and Kyung-woo Lee. 2009. “Determinants andMacroeconomic Impact of Remittances to Sub-Saharan Africa.” WorkingPaper 09/216, International Monetary Fund, Washington, DC.
68 Remittance Markets in Africa
Sorensen, Ninna Nyberg. 2004. “Migrant Remittances as a Development Tool:The Case of Morocco.” Working Paper 2, International Organization forMigration, Geneva. http://www.belgium.iom.int/pan-europeandialogue/documents/remittances_morocco.pdf.
Suleri, Abid Qaiyum, and Kevin Savage. 2006. “Remittances in Crises: A CaseStudy from Pakistan.” Humanitarian Policy Group background paper,Overseas Development Institute, London. http://www.odi.org.uk/hpg/papers/BGPaper_RemittancesPakistan.pdf.
Taylor, J. Edward, and T. J. Wyatt. 1996. “The Shadow Value of MigrantRemittances, Income and Inequality in a Household-Farm Economy.” TheJournal of Development Studies 32 (6): 899–912.
Tevera, Daniel, and Abel Chikanda. 2009. “Migrant Remittances and HouseholdSurvival in Zimbabwe.” Working Paper, Southern African Migration Project,Cape Town.
Valero-Gil, Jorge N. 2009. “Remittances and the Household’s Expenditures onHealth.” Journal of Business Strategies 26 (1): 119–40.
Weiss-Fagan, Patricia. 2006. “Remittances in Crises: A Haiti Case Study.”Humanitarian Policy Group background paper, Overseas Development Institute,London. http://www.odi.org.uk/hpg/papers/BG_Haiti_remittances.pdf.
Woodruff, Christopher, and Rene Zenteno. 2001. “Remittances andMicroenterprises in Mexico.” Working Paper, Graduate School of InternationalRelations and Pacific Studies, University of California, San Diego.
———. 2007. “Migration Networks and Microenterprises in Mexico.” Journal ofDevelopment Economics 82 (2): 509–28.
World Bank. 2006. Global Economic Prospects 2006: Economic Implications ofRemittances and Migration. Washington, DC: World Bank.
———. 2009. Issue Brief on Migration and Remittances, Washington, DC: WorldBank. (www.worldbank.org)
———. 2010a. Global Development Finance (database). World Bank, Washington,DC. http://data.worldbank.org/data-catalog/global-development-finance.
———. 2010b. Remittance Prices Worldwide (database). World Bank, Washington,DC. http://remittanceprices.worldbank.org.
———. 2010c. World Development Indicators (database). World Bank,Washington, DC. http://data.worldbank.org/data-catalog/world-development-indicators.
———. 2011. Migration and Remittances Factbook 2011. Washington, DC: WorldBank.
Wouterse, F. 2010. “Remittances, Poverty, Inequality and Welfare: Evidence fromthe Central Plateau of Burkina Faso” The Journal of Development Studies 46(4): 771–89.
Migrant Remittances in Africa: An Overview 69
Wu, Treena. 2006. “The Role of Remittances in Crisis: An Aceh Research Study.”Humanitarian Policy Group background paper, Overseas DevelopmentInstitute, London. http://www.odi.org.uk/hpg/papers/BG_Remittances_Aceh.pdf.
Yang, Dean. 2008a. “Coping With Disaster: The Impact of Hurricanes onInternational Financial Flows, 1970–2002.” The B.E. Journal of EconomicAnalysis and Policy 8 (1): Article 13.
———. 2008b. “International Migration, Remittances and Household Investment:Evidence from Philippine Migrants’ Exchange Rate Shocks.” The EconomicJournal 118 (528): 591–630.
Yang, Dean, and HwaJung Choi. 2007. “Are Remittances Insurance? Evidencefrom Rainfall Shocks in the Philippines.” The World Bank Economic Review 21(2): 219–48.
70 Remittance Markets in Africa
PA R T I I
Remittance Markets in Remittance-Receiving Countries

73
The extent of migration is considerable in Burkina Faso. In 2011, thenumber of Burkinabè emigrants equaled an estimated 9.7 percent ofthe country’s population, and immigrants to Burkina Faso made up6.4 percent of the population (World Bank 2011). Consequently,remittances—the transfers of funds associated with internal or inter-national migration—affect the country’s development and per capitaincome (as discussed in box 2.1). The extent of the impact dependson the volume and the use of the transfers.
To increase understanding of the remittance market in Burkina Faso,the analysis in this chapter draws upon a 2008 survey of remittanceservice providers (RSPs). The results help explain the remittance indus-try’s operations, potential, and limitations. Such an analysis can enhancethe contribution of remittance flows to development by helping policymakers and institutions to analyze trends and the determinants of remit-tance flows. The principal focus is on RSP characteristics; regulation; andremittance costs, volumes, sources, and destinations. The literature so farhas provided qualitative data about these aspects. However, little quan-titative information about remittances is available, and the unrecordedflows are significant.
C H A P T E R 2
Burkina Faso
Yiriyibin Bambio
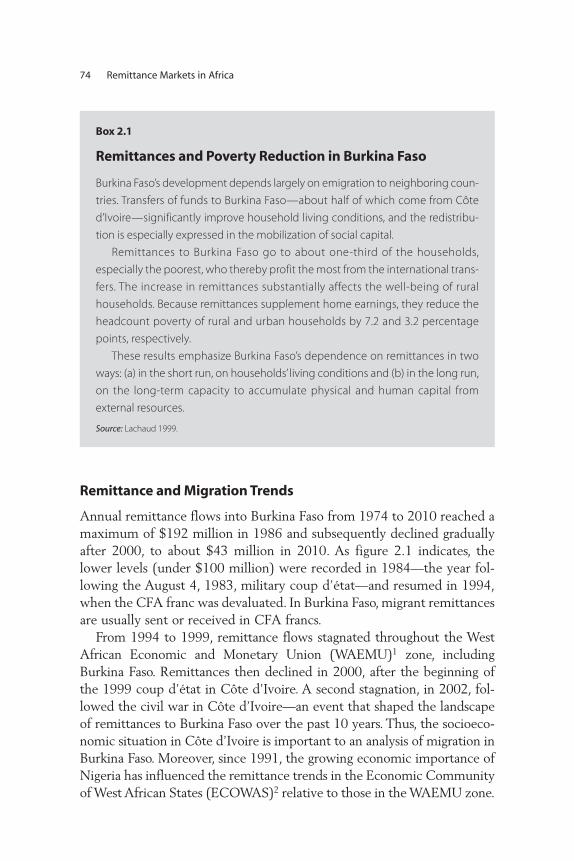
Remittance and Migration Trends
Annual remittance flows into Burkina Faso from 1974 to 2010 reached amaximum of $192 million in 1986 and subsequently declined graduallyafter 2000, to about $43 million in 2010. As figure 2.1 indicates, thelower levels (under $100 million) were recorded in 1984—the year fol-lowing the August 4, 1983, military coup d’état—and resumed in 1994,when the CFA franc was devaluated. In Burkina Faso, migrant remittancesare usually sent or received in CFA francs.
From 1994 to 1999, remittance flows stagnated throughout the WestAfrican Economic and Monetary Union (WAEMU)1 zone, includingBurkina Faso. Remittances then declined in 2000, after the beginning ofthe 1999 coup d’état in Côte d’Ivoire. A second stagnation, in 2002, fol-lowed the civil war in Côte d’Ivoire—an event that shaped the landscapeof remittances to Burkina Faso over the past 10 years. Thus, the socioeco-nomic situation in Côte d’Ivoire is important to an analysis of migration inBurkina Faso. Moreover, since 1991, the growing economic importance ofNigeria has influenced the remittance trends in the Economic Communityof West African States (ECOWAS)2 relative to those in the WAEMU zone.
74 Remittance Markets in Africa
Box 2.1
Remittances and Poverty Reduction in Burkina Faso
Burkina Faso’s development depends largely on emigration to neighboring coun-
tries. Transfers of funds to Burkina Faso—about half of which come from Côte
d’Ivoire—significantly improve household living conditions, and the redistribu-
tion is especially expressed in the mobilization of social capital.
Remittances to Burkina Faso go to about one-third of the households,
especially the poorest, who thereby profit the most from the international trans-
fers. The increase in remittances substantially affects the well-being of rural
households. Because remittances supplement home earnings, they reduce the
headcount poverty of rural and urban households by 7.2 and 3.2 percentage
points, respectively.
These results emphasize Burkina Faso’s dependence on remittances in two
ways: (a) in the short run, on households’ living conditions and (b) in the long run,
on the long-term capacity to accumulate physical and human capital from
external resources.
Source: Lachaud 1999.
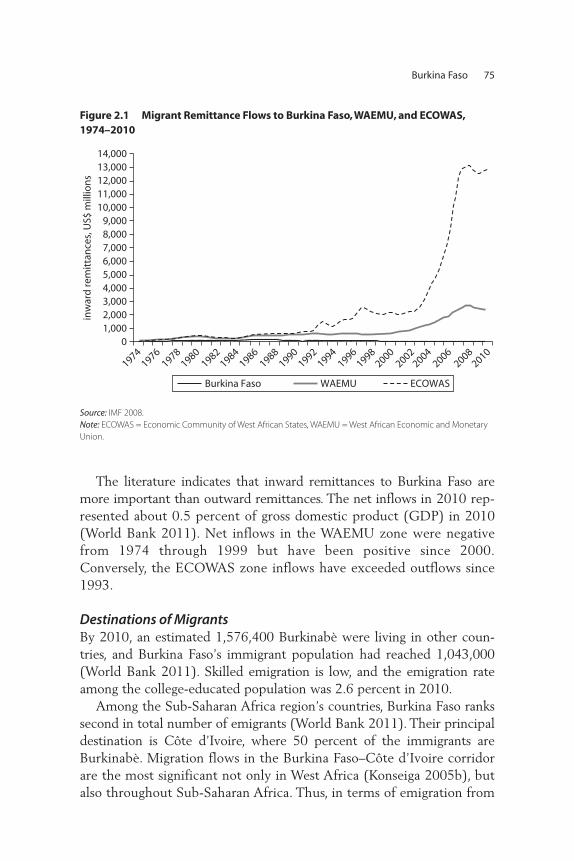
The literature indicates that inward remittances to Burkina Faso aremore important than outward remittances. The net inflows in 2010 rep-resented about 0.5 percent of gross domestic product (GDP) in 2010(World Bank 2011). Net inflows in the WAEMU zone were negativefrom 1974 through 1999 but have been positive since 2000.Conversely, the ECOWAS zone inflows have exceeded outflows since1993.
Destinations of MigrantsBy 2010, an estimated 1,576,400 Burkinabè were living in other coun-tries, and Burkina Faso’s immigrant population had reached 1,043,000(World Bank 2011). Skilled emigration is low, and the emigration rateamong the college-educated population was 2.6 percent in 2010.
Among the Sub-Saharan Africa region’s countries, Burkina Faso rankssecond in total number of emigrants (World Bank 2011). Their principaldestination is Côte d’Ivoire, where 50 percent of the immigrants areBurkinabè. Migration flows in the Burkina Faso–Côte d’Ivoire corridorare the most significant not only in West Africa (Konseiga 2005b), butalso throughout Sub-Saharan Africa. Thus, in terms of emigration from
Burkina Faso 75
Figure 2.1 Migrant Remittance Flows to Burkina Faso, WAEMU, and ECOWAS,1974–2010
Source: IMF 2008.Note: ECOWAS = Economic Community of West African States, WAEMU = West African Economic and MonetaryUnion.
01,0002,0003,0004,0005,0006,0007,0008,0009,000
10,00011,00012,00013,00014,000
inw
ard
rem
itta
nce
s, U
S$ m
illio
ns
Burkina Faso WAEMU ECOWAS
19741976
19781980
19821984
19861988
19901992
19941996
19982000
20022004
20062008
2010
one African country to another, Burkina Faso has the largest diaspora(Lindley 2008).
In 1960, 56.6 percent of the emigrants from Burkina Faso movedto Côte d’Ivoire, 31.3 percent to Ghana, and 3.9 percent to Mali(Somé 1991). In 1985, 91 percent of migrants went to Côte d’Ivoireand 8.8 percent to Ghana. Between 1988 and 1992, emigrants fromBurkina Faso divided their destinations as follows: 85.4 percent toCôte d’Ivoire, 4.3 percent to Niger, 3.3 percent to Mali, 5.5 percentto other African countries, and 0.6 percent to other continents entirely(Konseiga 2005b). Today, the top 10 destination countries for Burkinabèemigrants (in order of total numbers) are Côte d’Ivoire, Mali, Italy, Benin,Nigeria, France, Gabon, Germany, and the United States (Ratha and Xu2008).
Internal migration in Burkina Faso represents nearly 30 percent of allmigration flows (Konseiga 2005a), usually representing a drift frommigrants’ homelands because of difficult living conditions in the rural areas,where most of the poor live. Seasonal migration is principally a survivalstrategy in regions where natural resources are scarce (Konseiga 2005a).
Remittance Volumes, Sources, and DestinationsPartial data from SNC-Finances and some bank agencies show that, with30 percent of the total transfers, Côte d’Ivoire is the principal source ofBurkina Faso migrant remittance transfers (box 2.2). The WAEMU coun-tries, as a whole, represent nearly one-third of remittance sources andapproximately 40 percent of migrant destinations. The migrant andremittance flows to and from certain destinations such as Mali, Senegal,and Togo are determined by the respective importance or transit activi-ties of those countries’ nationals in Burkina Faso.
Seasonal variations in the volume of remittance transfers also havebeen observed. Transfers tend to grow at the beginning and in the lastquarter of each year—a variation that seems related to festivals and thestart of the new school year.
According to the 2008 survey responses, RSPs’ average net profitfrom the provision of remittance services in 2007 was €20,298. Over2004–07, the annual inward international remittances processed by thefirms in the sample averaged about €3.5 million, from about 336,972transactions. At the same time, the firms’ annual outward internationalremittances averaged €1.2 million, from 219,358 transactions.
According to the survey, the total estimated size of the inward inter-national remittance market in Burkina Faso was €33.3 million from
76 Remittance Markets in Africa
formal channels and €3.8 million from informal channels in 2007. Theannual inward domestic remittances by firms during the past three yearsaveraged €2.9 million, from 83,202 transactions per year. The total out-ward internal remittances per sample firm over the same period aver-aged €3.7 million per year, from 108,812 transactions.
The total estimated size of the domestic formal remittance market is€7.9 million and the informal market, €3.05 million. The survey respon-dents, many of whom did not seem well informed, had widely underesti-mated this market to be about half of its actual size.
Characteristics of the Remittance Industry
The 2008 RSP survey revealed that the remittance industry in BurkinaFaso comprises several types of formal and informal firms that operateprimarily in urban zones. The instruments and products used in remit-tance transactions are weakly diversified. Partnership and agreementcharacteristics differ depending on the money operator and whether the
Burkina Faso 77
Box 2.2
Remittances from Côte d’Ivoire
In the 1990s, remittances to Burkina Faso were 6 percent of GDP. Although these
remittances have proved difficult to quantify, the World Bank estimated that, in 1990,
Burkinabè sent home a total of $140 million. In 1994, exports totaled $216 million
and imports stood at $344 million, demonstrating the significance of remittances to
the country’s income and expenditure accounts. However, the 1999 turmoil in Côte
d’Ivoire, the primary source of remittances, led to the occasional expulsion of
Burkinabè from that country. As a result, annual remittances fell to $67 million
(2.5 percent of GDP) by the end of the decade.
Returning migrants do not always send remittances home or bring money back
to invest, except for the Fulani ethnic group, who may invest in herds, or the Lobi,
who may invest in more livestock for trading. Mossi migrants do remit money, but
returnees also tend to bring money back personally or even use it to buy goods
such as sunglasses, umbrellas, and clothes to impress those at home. Therefore, it
may be questionable whether the Mossi economy experienced an impact from
the accumulation of capital and investment.
Source: Kress 2006.
RSP is a formal or informal provider. The sample size for this survey was32 firms, of which 23 percent are informal providers.
Types and Coverage of Remittance FirmsThe national postal service (Société Nationale des Postes, or SONAPOST)pioneered money transfer services in Burkina Faso, but Western Union (thecountry’s most important money transfer operator [MTO]) introducedelectronic transfers. Its principal competitors are MoneyGram and MoneyExpress. Money transfer services in Burkina Faso were initially suppliedby the banks in partnership with these MTOs. However, since 2003, non-bank firms can also provide these services with authorization from theMinistry of Economy and Finance (MEF). As a result, about 100 firms arenow active in the RSP market.
The formal sector comprises 11 banks and about 60 private nonbankfirms (table 2.1). The most important nonbank firms are SNC-Financesand SONAPOST. Most of these nonbank firms not only supply remit-tance services, but also engage in other activities. The formal moneytransfer sector operates mainly in urban and semiurban zones. Ruralbranches represent only 11 percent of their coverage. The informal sec-tor includes about 30 firms, operating principally within the transporta-tion sector.
The informal sector has developed considerably during the pastdecade. It is generally associated with companies that transport passengersor goods and is intensively involved in the rural zone. Money sending andreceiving conditions are simplified, with low tariffs relative to the formalsector. Informal firms are particularly active in the domestic transfermarket. However, these channels are less secure than the formal ones.Because informal providers are survey averse, the survey could capturelittle information about them.
Partnerships and Agreements with Money Transfer OperatorsEach non-MTO formal firm operates, directly or indirectly, in partnershipwith an international MTO that provides and manages the electronictransfer system. The partnership between a commercial bank and MTOis exclusive; each bank is contractually required to work with only oneMTO for remittance services. A formal firm benefits from the partnershipprimarily by receiving a portion of the commission on remittance pay-ments or receipts.
As MTOs, two formal nonbank firms—SNC-Finances and SONAPOST—provide their own money transfer services as bank agents.However, these arrangements are also exclusive.
78 Remittance Markets in Africa
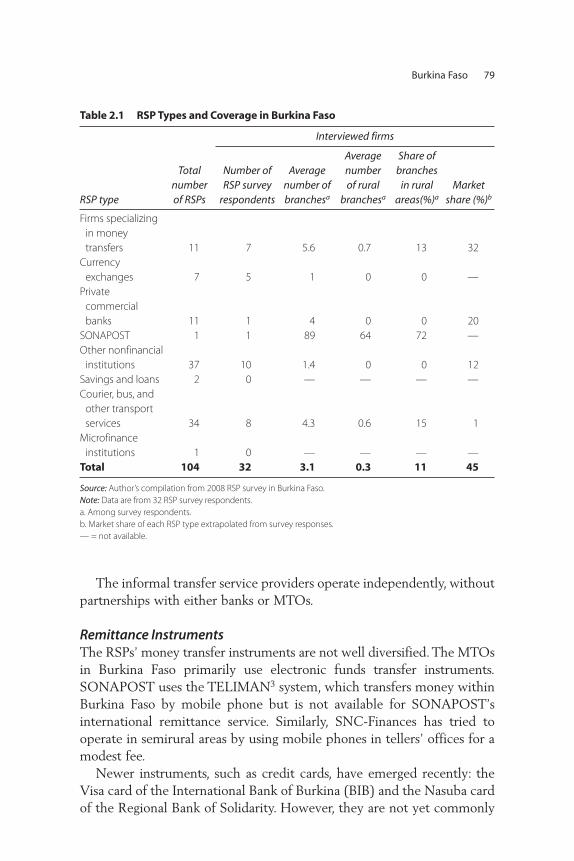
The informal transfer service providers operate independently, withoutpartnerships with either banks or MTOs.
Remittance InstrumentsThe RSPs’ money transfer instruments are not well diversified. The MTOsin Burkina Faso primarily use electronic funds transfer instruments. SONAPOST uses the TELIMAN3 system, which transfers money withinBurkina Faso by mobile phone but is not available for SONAPOST’sinternational remittance service. Similarly, SNC-Finances has tried tooperate in semirural areas by using mobile phones in tellers’ offices for amodest fee.
Newer instruments, such as credit cards, have emerged recently: theVisa card of the International Bank of Burkina (BIB) and the Nasuba cardof the Regional Bank of Solidarity. However, they are not yet commonly
Burkina Faso 79
Table 2.1 RSP Types and Coverage in Burkina Faso
RSP type
Totalnumberof RSPs
Interviewed firms
Number ofRSP survey
respondents
Averagenumber ofbranchesa
Averagenumber of rural
branchesa
Share ofbranches
in ruralareas(%)a
Marketshare (%)b
Firms specializingin money transfers 11 7 5.6 0.7 13 32
Currency exchanges 7 5 1 0 0 —
Private commercialbanks 11 1 4 0 0 20
SONAPOST 1 1 89 64 72 —Other nonfinancial
institutions 37 10 1.4 0 0 12Savings and loans 2 0 — — — —Courier, bus, and
other transportservices 34 8 4.3 0.6 15 1
Microfinance institutions 1 0 — — — —
Total 104 32 3.1 0.3 11 45
Source: Author’s compilation from 2008 RSP survey in Burkina Faso.Note: Data are from 32 RSP survey respondents.a. Among survey respondents.b. Market share of each RSP type extrapolated from survey responses. — = not available.
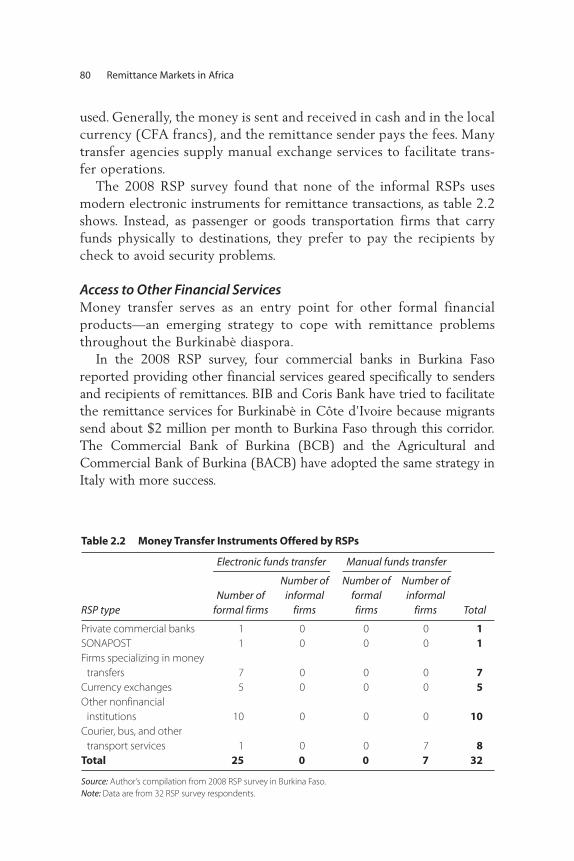
used. Generally, the money is sent and received in cash and in the localcurrency (CFA francs), and the remittance sender pays the fees. Manytransfer agencies supply manual exchange services to facilitate trans-fer operations.
The 2008 RSP survey found that none of the informal RSPs usesmodern electronic instruments for remittance transactions, as table 2.2shows. Instead, as passenger or goods transportation firms that carryfunds physically to destinations, they prefer to pay the recipients bycheck to avoid security problems.
Access to Other Financial ServicesMoney transfer serves as an entry point for other formal financialproducts—an emerging strategy to cope with remittance problemsthroughout the Burkinabè diaspora.
In the 2008 RSP survey, four commercial banks in Burkina Fasoreported providing other financial services geared specifically to sendersand recipients of remittances. BIB and Coris Bank have tried to facilitatethe remittance services for Burkinabè in Côte d’Ivoire because migrantssend about $2 million per month to Burkina Faso through this corridor.The Commercial Bank of Burkina (BCB) and the Agricultural andCommercial Bank of Burkina (BACB) have adopted the same strategy inItaly with more success.
80 Remittance Markets in Africa
Table 2.2 Money Transfer Instruments Offered by RSPs
RSP type
Electronic funds transfer Manual funds transfer
TotalNumber of
formal firms
Number of informal
firms
Number of formalfirms
Number ofinformal
firms
Private commercial banks 1 0 0 0 1SONAPOST 1 0 0 0 1Firms specializing in money
transfers 7 0 0 0 7Currency exchanges 5 0 0 0 5Other nonfinancial
institutions 10 0 0 0 10Courier, bus, and other
transport services 1 0 0 7 8Total 25 0 0 7 32
Source: Author’s compilation from 2008 RSP survey in Burkina Faso.Note: Data are from 32 RSP survey respondents.
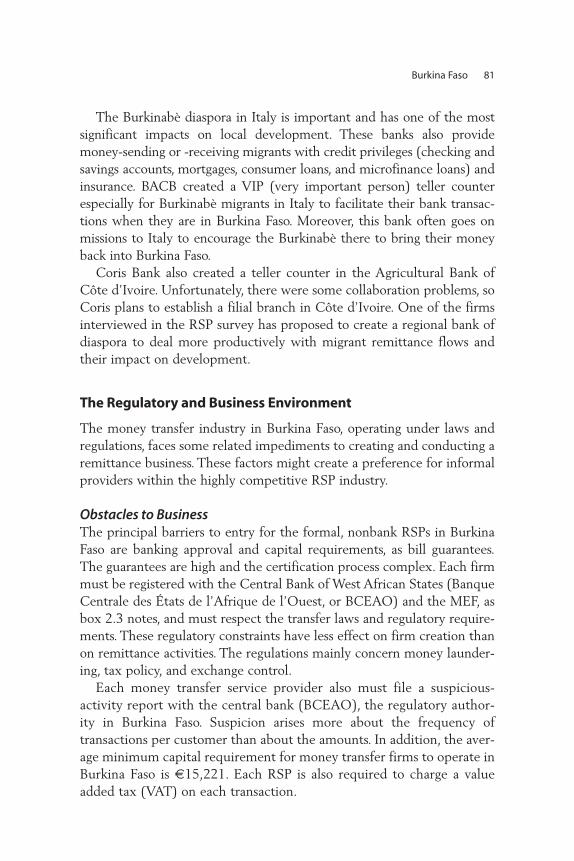
The Burkinabè diaspora in Italy is important and has one of the mostsignificant impacts on local development. These banks also providemoney-sending or -receiving migrants with credit privileges (checking andsavings accounts, mortgages, consumer loans, and microfinance loans) andinsurance. BACB created a VIP (very important person) teller counterespecially for Burkinabè migrants in Italy to facilitate their bank transac-tions when they are in Burkina Faso. Moreover, this bank often goes onmissions to Italy to encourage the Burkinabè there to bring their moneyback into Burkina Faso.
Coris Bank also created a teller counter in the Agricultural Bank ofCôte d’Ivoire. Unfortunately, there were some collaboration problems, soCoris plans to establish a filial branch in Côte d’Ivoire. One of the firmsinterviewed in the RSP survey has proposed to create a regional bank ofdiaspora to deal more productively with migrant remittance flows andtheir impact on development.
The Regulatory and Business Environment
The money transfer industry in Burkina Faso, operating under laws andregulations, faces some related impediments to creating and conducting aremittance business. These factors might create a preference for informalproviders within the highly competitive RSP industry.
Obstacles to Business The principal barriers to entry for the formal, nonbank RSPs in BurkinaFaso are banking approval and capital requirements, as bill guarantees.The guarantees are high and the certification process complex. Each firmmust be registered with the Central Bank of West African States (BanqueCentrale des États de l’Afrique de l’Ouest, or BCEAO) and the MEF, asbox 2.3 notes, and must respect the transfer laws and regulatory require-ments. These regulatory constraints have less effect on firm creation thanon remittance activities. The regulations mainly concern money launder-ing, tax policy, and exchange control.
Each money transfer service provider also must file a suspicious-activity report with the central bank (BCEAO), the regulatory author-ity in Burkina Faso. Suspicion arises more about the frequency oftransactions per customer than about the amounts. In addition, the aver-age minimum capital requirement for money transfer firms to operate inBurkina Faso is €15,221. Each RSP is also required to charge a valueadded tax (VAT) on each transaction.
Burkina Faso 81
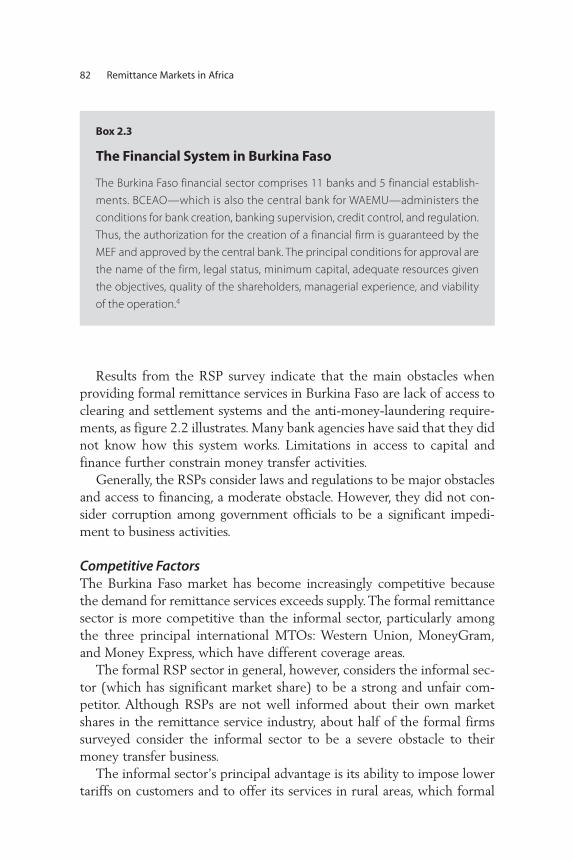
Results from the RSP survey indicate that the main obstacles whenproviding formal remittance services in Burkina Faso are lack of access toclearing and settlement systems and the anti-money-laundering require-ments, as figure 2.2 illustrates. Many bank agencies have said that they didnot know how this system works. Limitations in access to capital andfinance further constrain money transfer activities.
Generally, the RSPs consider laws and regulations to be major obstaclesand access to financing, a moderate obstacle. However, they did not con-sider corruption among government officials to be a significant impedi-ment to business activities.
Competitive FactorsThe Burkina Faso market has become increasingly competitive becausethe demand for remittance services exceeds supply. The formal remittancesector is more competitive than the informal sector, particularly amongthe three principal international MTOs: Western Union, MoneyGram,and Money Express, which have different coverage areas.
The formal RSP sector in general, however, considers the informal sec-tor (which has significant market share) to be a strong and unfair com-petitor. Although RSPs are not well informed about their own marketshares in the remittance service industry, about half of the formal firmssurveyed consider the informal sector to be a severe obstacle to theirmoney transfer business.
The informal sector’s principal advantage is its ability to impose lowertariffs on customers and to offer its services in rural areas, which formal
82 Remittance Markets in Africa
Box 2.3
The Financial System in Burkina Faso
The Burkina Faso financial sector comprises 11 banks and 5 financial establish-
ments. BCEAO—which is also the central bank for WAEMU—administers the
conditions for bank creation, banking supervision, credit control, and regulation.
Thus, the authorization for the creation of a financial firm is guaranteed by the
MEF and approved by the central bank. The principal conditions for approval are
the name of the firm, legal status, minimum capital, adequate resources given
the objectives, quality of the shareholders, managerial experience, and viability
of the operation.4
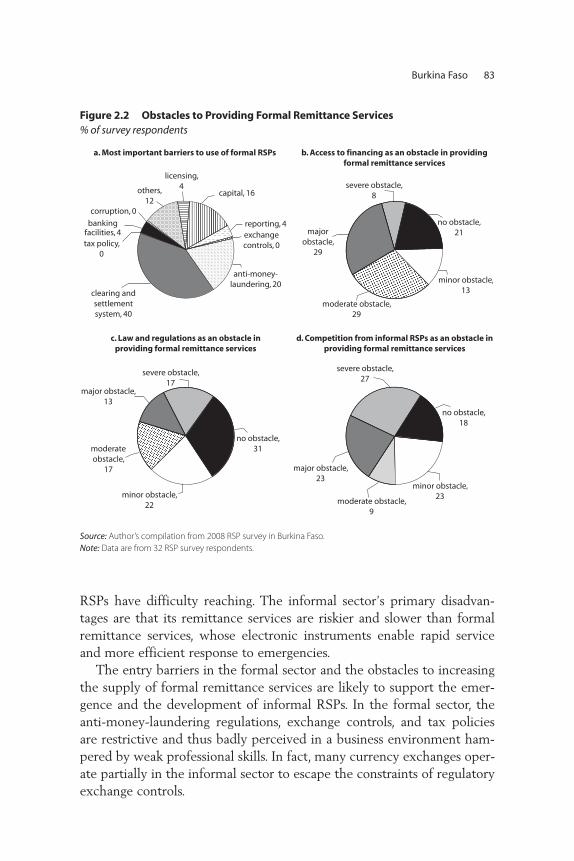
RSPs have difficulty reaching. The informal sector’s primary disadvan-tages are that its remittance services are riskier and slower than formalremittance services, whose electronic instruments enable rapid serviceand more efficient response to emergencies.
The entry barriers in the formal sector and the obstacles to increasingthe supply of formal remittance services are likely to support the emer-gence and the development of informal RSPs. In the formal sector, theanti-money-laundering regulations, exchange controls, and tax policiesare restrictive and thus badly perceived in a business environment ham-pered by weak professional skills. In fact, many currency exchanges oper-ate partially in the informal sector to escape the constraints of regulatoryexchange controls.
Burkina Faso 83
clearing andsettlementsystem, 40
tax policy,0
bankingfacilities, 4
corruption, 0
others,12
licensing,4
capital, 16
reporting, 4exchangecontrols, 0
anti-money-laundering, 20
majorobstacle,
29
major obstacle,23
major obstacle,13
severe obstacle,8
severe obstacle,27
severe obstacle,17
no obstacle,21
no obstacle,18
no obstacle,31
minor obstacle,13
minor obstacle,23minor obstacle,
22
moderate obstacle,29
moderate obstacle,9
moderateobstacle,
17
c. Law and regulations as an obstacle inproviding formal remittance services
d. Competition from informal RSPs as an obstacle inproviding formal remittance services
b. Access to financing as an obstacle in providingformal remittance services
a. Most important barriers to use of formal RSPs
Figure 2.2 Obstacles to Providing Formal Remittance Services % of survey respondents
Source: Author’s compilation from 2008 RSP survey in Burkina Faso.Note: Data are from 32 RSP survey respondents.
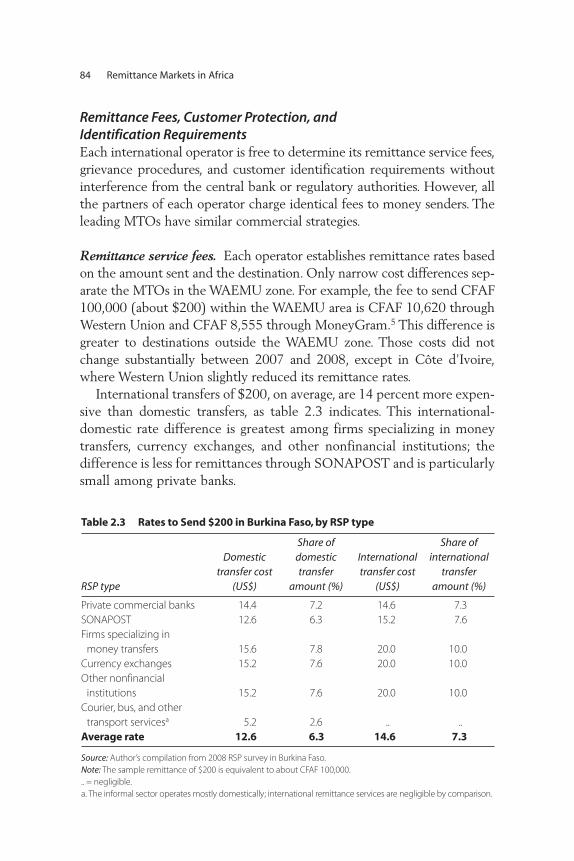
Remittance Fees, Customer Protection, and Identification RequirementsEach international operator is free to determine its remittance service fees,grievance procedures, and customer identification requirements withoutinterference from the central bank or regulatory authorities. However, allthe partners of each operator charge identical fees to money senders. Theleading MTOs have similar commercial strategies.
Remittance service fees. Each operator establishes remittance rates basedon the amount sent and the destination. Only narrow cost differences sep-arate the MTOs in the WAEMU zone. For example, the fee to send CFAF100,000 (about $200) within the WAEMU area is CFAF 10,620 throughWestern Union and CFAF 8,555 through MoneyGram.5 This difference isgreater to destinations outside the WAEMU zone. Those costs did notchange substantially between 2007 and 2008, except in Côte d’Ivoire,where Western Union slightly reduced its remittance rates.
International transfers of $200, on average, are 14 percent more expen-sive than domestic transfers, as table 2.3 indicates. This international-domestic rate difference is greatest among firms specializing in moneytransfers, currency exchanges, and other nonfinancial institutions; thedifference is less for remittances through SONAPOST and is particularlysmall among private banks.
84 Remittance Markets in Africa
Table 2.3 Rates to Send $200 in Burkina Faso, by RSP type
RSP type
Domestictransfer cost
(US$)
Share ofdomestictransfer
amount (%)
Internationaltransfer cost
(US$)
Share of international
transferamount (%)
Private commercial banks 14.4 7.2 14.6 7.3SONAPOST 12.6 6.3 15.2 7.6Firms specializing in
money transfers 15.6 7.8 20.0 10.0Currency exchanges 15.2 7.6 20.0 10.0Other nonfinancial
institutions 15.2 7.6 20.0 10.0Courier, bus, and other
transport servicesa 5.2 2.6 .. ..Average rate 12.6 6.3 14.6 7.3
Source: Author’s compilation from 2008 RSP survey in Burkina Faso.Note: The sample remittance of $200 is equivalent to about CFAF 100,000. .. = negligible.a. The informal sector operates mostly domestically; international remittance services are negligible by comparison.
The informal sector deals heavily in internal transfers, and its rates areonly about 40 percent of what the formal RSPs would charge, as table 2.3also shows. For example, the cost of sending CFAF 100,000 withinBurkina Faso is CFAF 7,552 through Western Union and less than CFAF3,000, on average, through informal channels.
Customer grievance procedures. Complaints about remittances not beingreceived or delivered are rare. According to the survey responses, few remit-tance transactions go unclaimed each month. Among the 32 surveyed firms,4 percent reported at least one unclaimed transaction per month, andanother 2 percent reported two unclaimed transactions per month.
If the remittance is not delivered as promised, the customer’s mainoption is to talk to the agent. However, most of the nonbank remit-tance firms do not have customer service centers specifically chargedwith addressing customer grievances or disputes.
The private banks and SONAPOST reported only moderate customergrievance-solving issues. Those RSPs have systems for addressing cus-tomer grievances, generally within one week at the most. However, morethan 47 percent of RSPs lack a system to handle consumer grievances, andagents often fulfill many functions within the same firm. For instance, thecheckout assistant might also be an accountant or a sales representativewith responsibility for helping any aggrieved customers.
Thirty-five percent of all RSP survey respondents said they solve cus-tomer grievances within one week, and only 29 percent of the specializedmoney transfer firms state that it takes a full week. In the informal sector,the grievance-resolution period varies more widely, but it appears to belonger on average than in the formal sector.
Identification and other reporting requirements. Banks and otherfinancial institutions, including all money transfer agencies, require anidentification document to send or receive funds—not only to preventtheft or fraud, but also to comply with know-your-customer (KYC)policies in general and AML-CFT (Anti-Money-Laundering–Combatingthe Financing of Terrorism) reporting requirements in particular. Theaccepted forms of identification are typically the national identity card,passport, military professional card, consular card, or refugee card.Employment certificates or proof-of-residence documents are notaccepted because they do not sufficiently identify the customer if atransfer issue arises. Presumably, these criteria do not limit the access ofpoor households to transfer services.
Burkina Faso 85
In addition, as a safeguard against suspicious transactions, the sendermust specify how recipients will use the remittances. Remittances appearto be used mostly to purchase food and medicines and for housing andutilities and seldom for land, kerosene or petrol, school fees, or trade.
No commission or fee is charged to the receiver of remittances fromabroad, which are not directly received in foreign currency but in thelocal currency. However, the sender can exchange funds for foreign cur-rency, in which case the receiver has to pay fees or a commission. In gen-eral, there is no limit on the amount that customers can receive, but alimit can sometimes depend on the firm’s liquidity level.
Conclusions and Recommendations
In summary, the scope of migration and remittances is important forBurkina Faso, which is an emigration country. The primary destinationof migrants from Burkina Faso is Côte d’Ivoire, which is also the princi-pal source of migrant remittances and significantly influences remit-tance inflows.
The regulatory requirements for remittance transfers center principallyon tax policy, exchange controls, and AML laws. Although regulations donot constitute a significant barrier to the establishment of remittance serv-ice firms, formal sector RSPs do consider them to be significant impedi-ments to business activities that, as a result, encourage migrants to useinformal providers. Other significant obstacles to the formal RSPs’ busi-ness are competition from informal providers and limitations on or lack ofaccess to capital and finance.
In the formal sector, electronic money transfers are the preferred remit-tance instruments, and the principal MTOs in Burkina Faso are WesternUnion, MoneyGram, and Money Express. Although formal remittanceservices are quicker and more secure than informal sector services—whichoperate through manual transfer of funds—formal channels are moreexpensive for the customer and are less efficient in underserved rural areas.
Other findings of the RSP survey included the following:
• The clearing and settlement system between commercial banks andtheir agencies is not fully transparent.
• The prevalence of unskilled staff in most of the RSP firms makes oper-ations inefficient; in many cases, the KYC requirements are not satisfied.
• Although the customer identification requirements and other regula-tions have been simplified, remittance fees remain high.
86 Remittance Markets in Africa
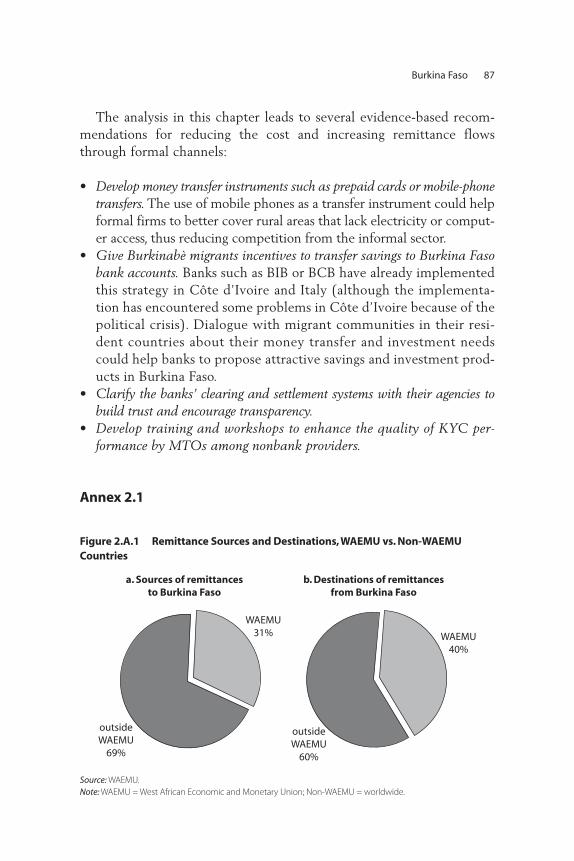
The analysis in this chapter leads to several evidence-based recom-mendations for reducing the cost and increasing remittance flowsthrough formal channels:
• Develop money transfer instruments such as prepaid cards or mobile-phonetransfers. The use of mobile phones as a transfer instrument could helpformal firms to better cover rural areas that lack electricity or comput-er access, thus reducing competition from the informal sector.
• Give Burkinabè migrants incentives to transfer savings to Burkina Fasobank accounts. Banks such as BIB or BCB have already implementedthis strategy in Côte d’Ivoire and Italy (although the implementa-tion has encountered some problems in Côte d’Ivoire because of thepolitical crisis). Dialogue with migrant communities in their resi-dent countries about their money transfer and investment needscould help banks to propose attractive savings and investment prod-ucts in Burkina Faso.
• Clarify the banks’ clearing and settlement systems with their agencies tobuild trust and encourage transparency.
• Develop training and workshops to enhance the quality of KYC per-formance by MTOs among nonbank providers.
Annex 2.1
Burkina Faso 87
a. Sources of remittancesto Burkina Faso
b. Destinations of remittancesfrom Burkina Faso
WAEMU31%
outsideWAEMU
69%
outsideWAEMU
60%
WAEMU40%
Figure 2.A.1 Remittance Sources and Destinations, WAEMU vs. Non-WAEMU Countries
Source: WAEMU.Note: WAEMU = West African Economic and Monetary Union; Non-WAEMU = worldwide.
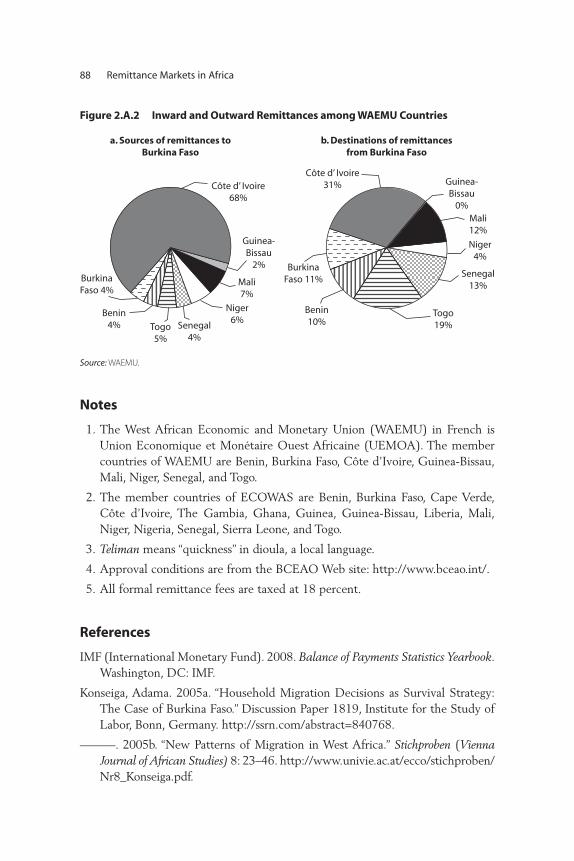
Notes
1. The West African Economic and Monetary Union (WAEMU) in French isUnion Economique et Monétaire Ouest Africaine (UEMOA). The membercountries of WAEMU are Benin, Burkina Faso, Côte d’Ivoire, Guinea-Bissau,Mali, Niger, Senegal, and Togo.
2. The member countries of ECOWAS are Benin, Burkina Faso, Cape Verde,Côte d’Ivoire, The Gambia, Ghana, Guinea, Guinea-Bissau, Liberia, Mali,Niger, Nigeria, Senegal, Sierra Leone, and Togo.
3. Teliman means “quickness” in dioula, a local language.
4. Approval conditions are from the BCEAO Web site: http://www.bceao.int/.
5. All formal remittance fees are taxed at 18 percent.
References
IMF (International Monetary Fund). 2008. Balance of Payments Statistics Yearbook.Washington, DC: IMF.
Konseiga, Adama. 2005a. “Household Migration Decisions as Survival Strategy:The Case of Burkina Faso.” Discussion Paper 1819, Institute for the Study ofLabor, Bonn, Germany. http://ssrn.com/abstract=840768.
———. 2005b. “New Patterns of Migration in West Africa.” Stichproben (ViennaJournal of African Studies) 8: 23–46. http://www.univie.ac.at/ecco/stichproben/Nr8_Konseiga.pdf.
88 Remittance Markets in Africa
a. Sources of remittances toBurkina Faso
b. Destinations of remittancesfrom Burkina Faso
Côte d’ Ivoire68%
Côte d’ Ivoire31%
Guinea-Bissau
2%
Guinea-Bissau
0%
Mali7%
Mali12%
Niger6%
Niger4%
Senegal4%
Senegal13%
Benin4%
Benin10%
BurkinaFaso 4%
BurkinaFaso 11%
Togo5%
Togo19%
Figure 2.A.2 Inward and Outward Remittances among WAEMU Countries
Source: WAEMU.
Kress, Brad. 2006. “Burkina Faso: Testing the Tradition of Circular Migration.”Country profile, Centre for Research into Economic and Social Trends,Migration Policy Institute, Washington, DC. http://www.migrationinformation.org/Profiles/display.cfm?ID=399.
Lachaud, Jean-Pierre. 1999. “Envois de fonds, inégalité et pauvreté au BurkinaFaso.” Working paper, Centre d’économie et développement UniversitéMontesquieu-Bordeaux IV, France. http://ged.u-bordeaux4.fr/ceddt40.pdf.
Lindley, Anna. 2008. “African Remittances and Progress: Opportunities andChallenges.” Análisis del Real Instituto 52, Real Instituto Elcano, Madrid.
Somé, P. 1991. “Emigration from Burkina Faso from 1960 to 1985: Analysis ofDemographic and Socioeconomic Consequences.” Pop Sahel 1991 (16):13–8.
World Bank. 2011. Migration and Remittances Factbook 2011, 2nd ed. Washington,DC: World Bank.
Burkina Faso 89

91
Remittances sent by international migrants are perceived to enhance thedevelopment prospects of low- and middle-income economies, maintaintheir macroeconomic stability, mitigate the impact of exogenous shocks,and reduce poverty because of the increasing volumes and more stabletrends relative to other external flows.1
The remittance inflows to Sub-Saharan Africa have been modestcompared with those to other developing regions. Remittance flows toSub-Saharan Africa quadrupled from US$4.6 billion in 2000, toUS$21.5 billion in 2010 (World Bank 2011). However, Sub-SaharanAfrica attracted only 6.6 percent of total remittances to developingcountries in 2010. In many African countries (such as Cape Verde,Lesotho, Mauritius, Nigeria, Swaziland, and Togo), remittances aresimilar in size to or have outpaced official development assistance(Gupta, Patillo, and Wagh 2009; World Bank 2011).
Remittance and Emigration Trends
Cape Verde is one of the top recipients of remittances in Sub-SaharanAfrica, receiving high inflows relative to other small island economiesthat depend heavily on remittances, including the Dominican Republic,
C H A P T E R 3
Cape Verde
Georgiana Pop
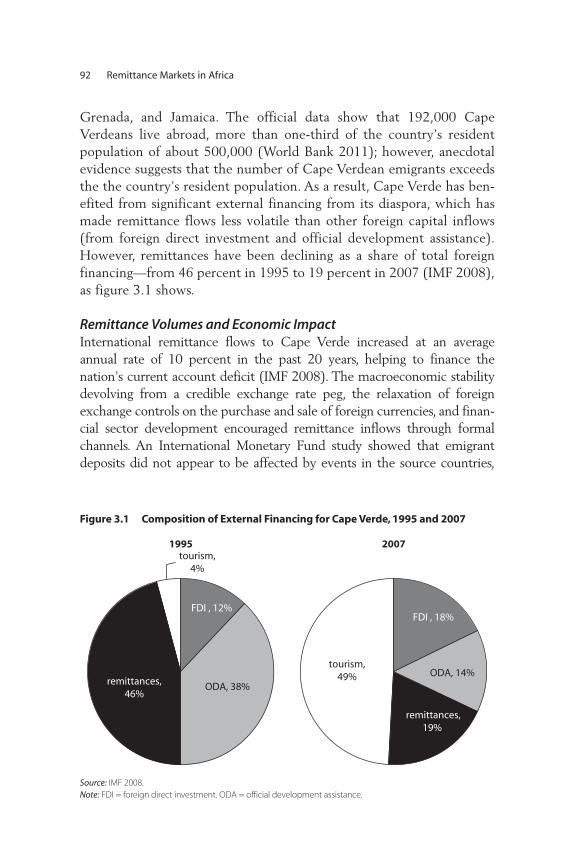
Grenada, and Jamaica. The official data show that 192,000 CapeVerdeans live abroad, more than one-third of the country’s residentpopulation of about 500,000 (World Bank 2011); however, anecdotalevidence suggests that the number of Cape Verdean emigrants exceedsthe the country’s resident population. As a result, Cape Verde has ben-efited from significant external financing from its diaspora, which hasmade remittance flows less volatile than other foreign capital inflows(from foreign direct investment and official development assistance).However, remittances have been declining as a share of total foreignfinancing—from 46 percent in 1995 to 19 percent in 2007 (IMF 2008),as figure 3.1 shows.
Remittance Volumes and Economic ImpactInternational remittance flows to Cape Verde increased at an averageannual rate of 10 percent in the past 20 years, helping to finance thenation’s current account deficit (IMF 2008). The macroeconomic stabilitydevolving from a credible exchange rate peg, the relaxation of foreignexchange controls on the purchase and sale of foreign currencies, and finan-cial sector development encouraged remittance inflows through formalchannels. An International Monetary Fund study showed that emigrantdeposits did not appear to be affected by events in the source countries,
92 Remittance Markets in Africa
FDI , 12%
ODA, 38%remittances,46%
tourism,4%
FDI , 18%
ODA, 14%
remittances,19%
tourism,49%
1995 2007
Figure 3.1 Composition of External Financing for Cape Verde, 1995 and 2007
Source: IMF 2008. Note: FDI = foreign direct investment. ODA = official development assistance.
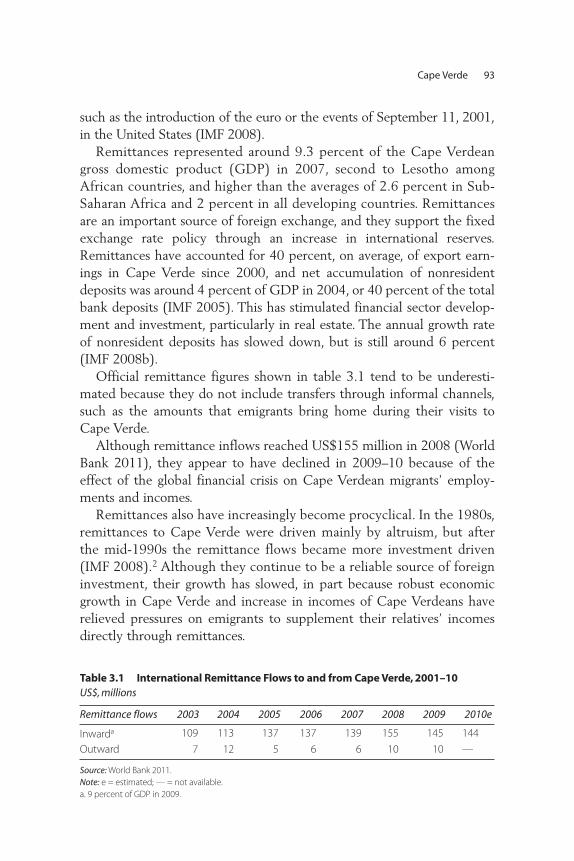
such as the introduction of the euro or the events of September 11, 2001,in the United States (IMF 2008).
Remittances represented around 9.3 percent of the Cape Verdeangross domestic product (GDP) in 2007, second to Lesotho amongAfrican countries, and higher than the averages of 2.6 percent in Sub-Saharan Africa and 2 percent in all developing countries. Remittancesare an important source of foreign exchange, and they support the fixedexchange rate policy through an increase in international reserves.Remittances have accounted for 40 percent, on average, of export earn-ings in Cape Verde since 2000, and net accumulation of nonresidentdeposits was around 4 percent of GDP in 2004, or 40 percent of the totalbank deposits (IMF 2005). This has stimulated financial sector develop-ment and investment, particularly in real estate. The annual growth rateof nonresident deposits has slowed down, but is still around 6 percent(IMF 2008b).
Official remittance figures shown in table 3.1 tend to be underesti-mated because they do not include transfers through informal channels,such as the amounts that emigrants bring home during their visits toCape Verde.
Although remittance inflows reached US$155 million in 2008 (WorldBank 2011), they appear to have declined in 2009–10 because of theeffect of the global financial crisis on Cape Verdean migrants’ employ-ments and incomes.
Remittances also have increasingly become procyclical. In the 1980s,remittances to Cape Verde were driven mainly by altruism, but afterthe mid-1990s the remittance flows became more investment driven(IMF 2008).2 Although they continue to be a reliable source of foreigninvestment, their growth has slowed, in part because robust economicgrowth in Cape Verde and increase in incomes of Cape Verdeans haverelieved pressures on emigrants to supplement their relatives’ incomesdirectly through remittances.
Cape Verde 93
Table 3.1 International Remittance Flows to and from Cape Verde, 2001–10 US$, millions
Remittance flows 2003 2004 2005 2006 2007 2008 2009 2010e
Inwarda 109 113 137 137 139 155 145 144
Outward 7 12 5 6 6 10 10 —
Source: World Bank 2011. Note: e = estimated; — = not available.a. 9 percent of GDP in 2009.
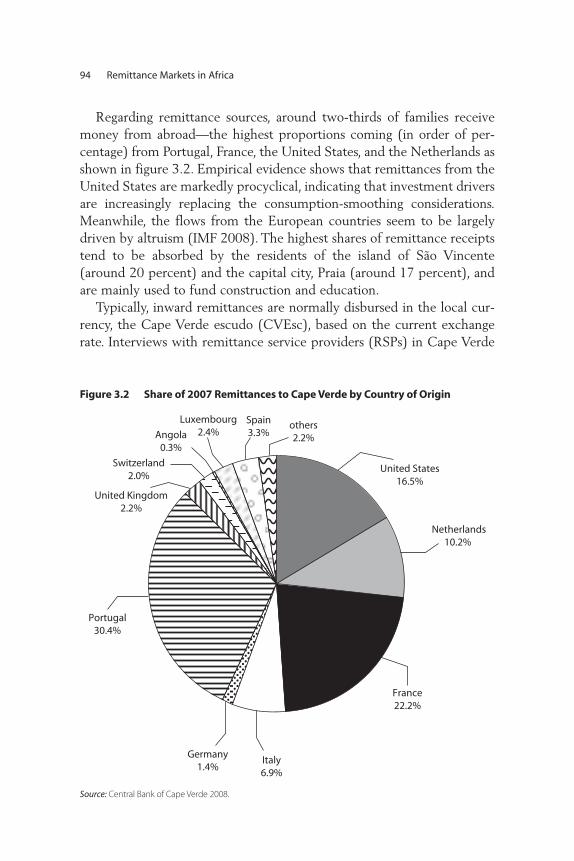
Regarding remittance sources, around two-thirds of families receivemoney from abroad—the highest proportions coming (in order of per-centage) from Portugal, France, the United States, and the Netherlands asshown in figure 3.2. Empirical evidence shows that remittances from theUnited States are markedly procyclical, indicating that investment driversare increasingly replacing the consumption-smoothing considerations.Meanwhile, the flows from the European countries seem to be largelydriven by altruism (IMF 2008). The highest shares of remittance receiptstend to be absorbed by the residents of the island of São Vincente(around 20 percent) and the capital city, Praia (around 17 percent), andare mainly used to fund construction and education.
Typically, inward remittances are normally disbursed in the local cur-rency, the Cape Verde escudo (CVEsc), based on the current exchangerate. Interviews with remittance service providers (RSPs) in Cape Verde
94 Remittance Markets in Africa
United States16.5%
Netherlands10.2%
France22.2%
Italy6.9%
Germany1.4%
Portugal30.4%
Angola0.3%
Switzerland2.0%
Luxembourg2.4%
Spain3.3%
others2.2%
United Kingdom2.2%
Figure 3.2 Share of 2007 Remittances to Cape Verde by Country of Origin
Source: Central Bank of Cape Verde 2008.
suggest that inward remittance flows are seasonal. Spikes are observedfrom June to August and from December to January, as remittanceinflows aim to support increased consumption associated with summerand winter holidays.
Despite exceptionally high remittance amounts, evidence about theloss in external competitiveness from an appreciation of the exchangerate as a result of these large remittance inflows, or the so-called “Dutchdisease,” is weak. Although there is some evidence that an appreciatingeffective real exchange rate could be attributed to the Dutch disease(Bourdet and Falck 2004), the exchange rate in Cape Verde has been gen-erally in line with fundamental goods while the wages in the nontradablesector do not seem to have an impact on the tradable sector wages(IMF 2008). This is mainly because the nontradable sector is shallowand most of the tradable sector wages are concentrated in the tourismsector (IMF 2008).
Destinations of MigrantsCape Verde is one of the few countries that have experienced large-scale emigration. As of 2010, 192,000 Cape Verdeans lived abroad,representing around 37.5 percent of the population (World Bank2011). The top migrant destination countries in Africa (from highest tolowest percentages of Cape Verde emigrants) are Angola, Senegal,Mozambique, and Nigeria. The main destinations outside Africa (also inorder of migrants’ preference) are the United States, Portugal, Angola,France, Senegal, Argentina, the Netherlands, Italy, Spain, andLuxembourg (IMF 2008; see figure 3.3).
Interestingly, although the largest share of the overseas diaspora livesin the United States (53 percent of the total), those emigrants supply only16.5 percent of the remittances. One explanation may be that the CapeVerdeans living in the United States are often fourth- and fifth-generationU.S. residents, with decreasing identification as Cape Verdeans. Althoughthe disapora in Portugal and France is smaller (totaling around 21 percent),the remittance flows originating in these two countries collectivelyaccount for more than 52 percent of total remittances.
Emigration of skilled workers is the predominant trend. CapeVerde ranks among the top-10 middle-income economies in the emi-gration of skilled workers, with an emigration rate of college-educatedpeople as high as 67.5 percent (World Bank 2011). It is also thelargest source country of educated emigrants, physicians, and nursesfrom Sub-Saharan Africa.
Cape Verde 95
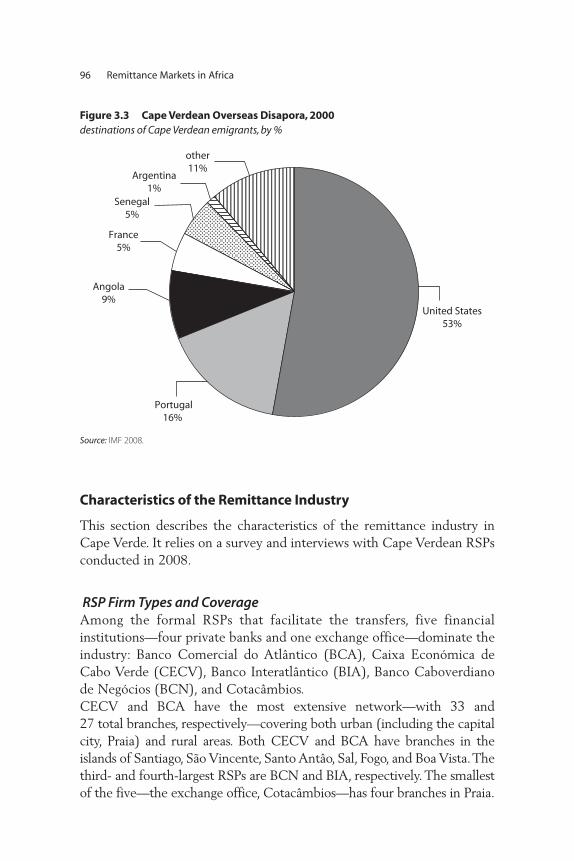
Characteristics of the Remittance Industry
This section describes the characteristics of the remittance industry inCape Verde. It relies on a survey and interviews with Cape Verdean RSPsconducted in 2008.
RSP Firm Types and CoverageAmong the formal RSPs that facilitate the transfers, five financialinstitutions—four private banks and one exchange office—dominate theindustry: Banco Comercial do Atlântico (BCA), Caixa Económica deCabo Verde (CECV), Banco Interatlântico (BIA), Banco Caboverdianode Negócios (BCN), and Cotacâmbios.CECV and BCA have the most extensive network—with 33 and 27 total branches, respectively—covering both urban (including the capitalcity, Praia) and rural areas. Both CECV and BCA have branches in theislands of Santiago, São Vincente, Santo Antâo, Sal, Fogo, and Boa Vista. Thethird- and fourth-largest RSPs are BCN and BIA, respectively. The smallestof the five—the exchange office, Cotacâmbios—has four branches in Praia.
96 Remittance Markets in Africa
United States53%
Portugal16%
Angola9%
other11%
Senegal5%
Argentina1%
France5%
Figure 3.3 Cape Verdean Overseas Disapora, 2000destinations of Cape Verdean emigrants, by %
Source: IMF 2008.
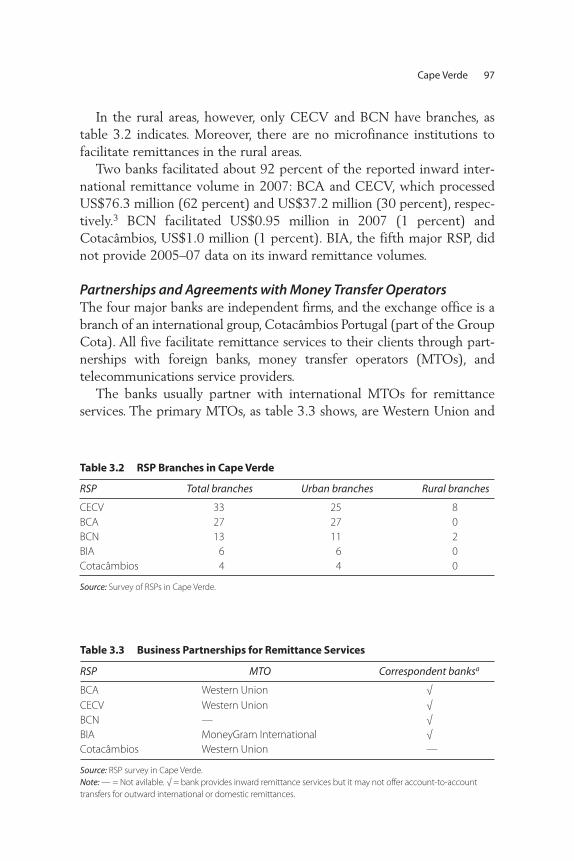
In the rural areas, however, only CECV and BCN have branches, astable 3.2 indicates. Moreover, there are no microfinance institutions tofacilitate remittances in the rural areas.
Two banks facilitated about 92 percent of the reported inward inter-national remittance volume in 2007: BCA and CECV, which processedUS$76.3 million (62 percent) and US$37.2 million (30 percent), respec-tively.3 BCN facilitated US$0.95 million in 2007 (1 percent) andCotacâmbios, US$1.0 million (1 percent). BIA, the fifth major RSP, didnot provide 2005–07 data on its inward remittance volumes.
Partnerships and Agreements with Money Transfer OperatorsThe four major banks are independent firms, and the exchange office is abranch of an international group, Cotacâmbios Portugal (part of the GroupCota). All five facilitate remittance services to their clients through part-nerships with foreign banks, money transfer operators (MTOs), andtelecommunications service providers.
The banks usually partner with international MTOs for remittanceservices. The primary MTOs, as table 3.3 shows, are Western Union and
Cape Verde 97
Table 3.3 Business Partnerships for Remittance Services
RSP MTO Correspondent banksa
BCA Western Union √CECV Western Union √BCN — √BIA MoneyGram International √Cotacâmbios Western Union —
Source: RSP survey in Cape Verde. Note: — = Not avilable. √ = bank provides inward remittance services but it may not offer account-to-accounttransfers for outward international or domestic remittances.
Table 3.2 RSP Branches in Cape Verde
RSP Total branches Urban branches Rural branches
CECV 33 25 8BCA 27 27 0BCN 13 11 2BIA 6 6 0Cotacâmbios 4 4 0
Source: Survey of RSPs in Cape Verde.
MoneyGram International. Typically, those partnerships are exclusive; forexample, if a bank signs a partnership with Western Union for moneytransfer operations, it cannot enter a partnership with MoneyGram.However, other types of money transfer services (such as account-to-account transfers) involving foreign correspondent banks do not excludepartnerships with Western Union or MoneyGram.
The partnerships with MTOs and correspondent banks include variousprofit-sharing arrangements. The significant remittance inflows also gen-erate indirect benefits to the RSPs, such as enhancing their capacity andsupporting their financial consolidation. Most commonly, these financialinstitutions benefit from full access to payment infrastructures and distri-bution networks (particularly in the countries from which remittancesoriginate); access to foreign exchange; and commissions (about 20 per-cent) charged on remittance payments and receipts.
Other institutions, such as Correios de Cabo Verde (Post Office ofCape Verde), also provide remittance services through Western Union,but data on these inward remittance flows are not available. Overallremittance inflows might be higher than reported because some of thestatistics include inflows processed only through formal channels (forexample, Western Union). Inflows through informal channels or person-to-person transfers are not captured. This trend confirms the overallassumption that remittance inflows may be underreported in Cape Verde.
Remittance Products Remittance products are well developed in Cape Verde, and all RSPs offera wide range of services—mainly electronic cash transfers and account-to-account transfers. In addition, as table 3.4 shows, some banks (such asBCA, BIA, and BCN) offer other remittance products, including bankdrafts, checks, money orders, prepaid cards for use at designated retailers,prepaid debit cards, and money transfers transmitted by cellular phone.
The settlement system and customer services are effective, and theyfacilitate the processing of remittance inflows. In the case of electroniccash transfers (using MTOs such as Western Union or MoneyGram), thesettlement of international remittance transactions is instantaneous. Inthe case of international account-to-account transfers, the remittancerecipients in Cape Verde normally receive the amounts due within twoworking days from the transfer date.
Banks do not require customers of remittance services to open anaccount, thus eliminating their monthly fees for account maintenance.The remittance sender pays all the fees due for the money transfers.
98 Remittance Markets in Africa
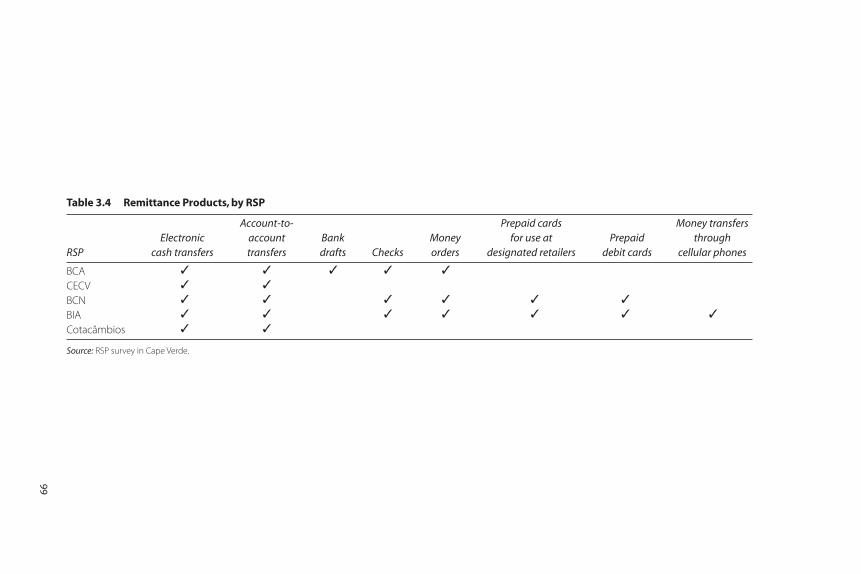
Table 3.4 Remittance Products, by RSP
RSPElectronic
cash transfers
Account-to-account transfers
Bank drafts Checks
Money orders
Prepaid cards for use at
designated retailersPrepaid
debit cards
Money transfers through
cellular phones
BCA ✓ ✓ ✓ ✓ ✓
CECV ✓ ✓
BCN ✓ ✓ ✓ ✓ ✓ ✓
BIA ✓ ✓ ✓ ✓ ✓ ✓ ✓
Cotacâmbios ✓ ✓
Source: RSP survey in Cape Verde.
99
Furthermore, all financial institutions designate one or two staff mem-bers to deal with customer grievances, particularly when remittances arenot delivered on time or at all. The most common way to address such com-plaints is by talking to the sending agents. Among the Cape Verde RSPs,customer complaints vary in frequency between once a week and onceevery two or three months—in some cases, as seldom as once every fivemonths. The customer service is effective because grievances are handledrelatively quickly (within one week, often in as little as two days) to resolvecustomers’ complaints about remittances not being received or delivered.
Access to Other Financial Services
Most of the banks providing remittance services in Cape Verde alsoextend other financial services to remittance receivers and senders, irre-spective of whether they are regular banking customers or not. The mostcommon products offered to remittance receivers are deposits, savingsproducts, small and large consumer loans, business loans, educational andvehicle loans, credit cards, and mortgages (however, nonresidents cannotbenefit from mortgages). Remittance senders, too, may have access todeposits, savings accounts, business loans, and mortgages.
By facilitating remittances, the banks can also potentially enlarge theircustomer bases and financial revenues. By developing customized servicesfor remittance receivers and senders, the banks may help to formalizeremittance flows, reduce remittance costs, and increase the scope forinvestment in Cape Verde.
The Regulatory and Business Environment
All the RSPs who participated in the survey perceive the regulatory andbusiness environment as conducive to remittance service operations.Sixty percent of the respondents perceive the laws and regulations gov-erning remittances, collectively, as a minor obstacle. The remaining 40 percent do not consider laws and regulations to be an obstacle at all.
The Central Bank of Cape Verde is responsible for the regulation andsupervision of commercial banks, offshore banks, and nonfinancial insti-tutions. All commercial banks are subject to standard regulatory require-ments (as described in box 3.1), an annual on-site examination, andregular monthly reporting. BCA, CECV, BCN, BIA, and Cotacâmbios areregistered with the central bank to provide remittance services as well asany other banking or financial services.
100 Remittance Markets in Africa
Cape Verde 101
Box 3.1
The Central Bank’s Regulatory and Supervisory Role
The Central Bank of Cape Verde (CBCV) is responsible for the regulation and
supervision of commercial banks, offshore banks, and non-bank financial institu-
tions. The law governing the central bank was revised in 2002 to clarify the bank’s
overriding policy objectives and to bring the law in line with international prac-
tices. Among the main revisions were the following:
• Cash advances to the government may never exceed 5 percent of the current
revenue collected in the preceding year. Any overdraft account of this kind
must be in balance at the end of each year.
• The central bank’s independence and accountability was explicitly stated in the
law.
• The admissible operations using domestic monetary policy instruments were
streamlined.
• Best practices for safeguarding the central bank’s capital (“top-up” rules), deter-
mining net income, and distributing net profits were introduced.
Under this law, the central bank may provide liquidity support for commercial
banks—in particular, by granting short-term credit to commercial banks with the
collateral of marketable government securities. Furthermore, to bridge tempo-
rary liquidity shortages, it may act as a lender of last resort, but any lending of this
type is limited to three times the borrowing entity’s capital and carries a penalty
rate of interest determined on a case-by-case basis. The central bank also can
issue temporary emergency rules to govern the volume of credit and interest
rates applicable to commercial banking operations.
As the regulations of the banking and financial sectors have improved, the
central bank has been implementing measures to reinforce its operational and
oversight responsibilities by training its staff and modernizing computer systems
and internal controls. A framework for internal controls for the commercial banks
for anti-money-laundering is part of on-site inspection. The anti-money-laundering
legislation (2002) and the accompanying regulations (2003) complete the legal
framework. The banks now must comply with a series of prudential regulations,
including the following:
• Equity stakes in firms not supervised by the central bank may not exceed cer-
tain limits.
(continued)
Among the reporting requirements, banks and nonfinancial institu-tions must comply with reporting requirements in case of suspiciousactivities and large currency transactions. They have to notify the centralbank of all currency transactions exceeding CVEsc 1 million (approxi-mately US$12,412)4 as well as all suspicious activities they might detect.
To handle foreign exchange transactions, all these banks and institu-tions must establish partnerships with correspondent banks, and they mayorder cross-border transfers freely because the central bank sets no max-imum fee or charge for such transfers, nor does it limit foreign exchangeholdings or remittance inflows.
The mandatory minimum capital requirement to operate in the bank-ing and financial market is CVEsc 300 million (approximately US$3.7million). The minimum capital for the exchange offices is CVEsc 35 mil-lion (approximately US$434,000 at the time of the survey in 2008).Some banks also indicated that they must comply with a net worthrequirement of 10 percent of net results above the minimum capital anda requirement that 5 percent of deposits be in the national currency.
Entry and Other Barriers to Provision of Remittance Services Although laws and regulations do not seem to significantly affect theremittance industry, the RSPs differ in their perceptions of the main
102 Remittance Markets in Africa
Box 3.1 (continued)
• Equity and loans exceeding 10 percent of the bank’s capital are considered high
risk.
• Exposure to any client may not exceed 25 percent of the institution’s capital,
and the amount of high-risk obligations may not exceed eight times the bank’s
capital.
• The minimum capital requirement for a bank is CVEsc 300 million, and the risk-
weighted capital adequacy ratio is 10 percent.
• Banks are obliged to set up provisions for overdue loans, general credit risks,
retirement pensions, survivors’ benefits, and capital losses on securities and
other instruments. (Nonperforming loans are divided into five groups—up to
3 months, 6 months, 12 months, 36 months, and more than 36 months—with
nonperforming loans secured by collateral requiring lower provisioning.)
Source: IMF 2005.
barriers to entry when starting a remittance-related business. Half of therespondents consider the following to be moderate to major barriers: bank-ing license requirements, access to financial infrastructure (payment sys-tems), minimum capital requirements, and access to capital and finance.One respondent considered competition to be a major barrier to entry.
Among the lesser barriers to entry, 75 percent of the respondents per-ceived access to distribution networks as a minor barrier, and they unan-imously considered corruption to be the least important barrier.
In particular, 60 percent of respondents consider capital requirements,anti-money-laundering requirements, and exchange controls to be mod-erate barriers to providing remittance-related services. Sixty percent alsoconsider license requirements and lack of access to clearing and settle-ment systems to be minor obstacles. Finally, tax policy, lack of access tobanking facilities, and government corruption are perceived as the leastimportant barriers to running remittance-related operations.
Remittance Costs and Identification Requirements
Remittance fees for transfers outside and within Cape Verde do not varysignificantly across RSPs. Typically, the fee to send money abroad or withinthe country ranges between CVEsc 1,500 and CVEsc 2,100 (approxi-mately US$20 to US$28)5 for money transfer operators’ services, irrespec-tive of the remittance corridor—a scant increase from previous years. Forexample, BCA reported fixed fees of CVEsc 1,900 (approximatelyUS$24.00)6 in 2007 and CVEsc 2,000 (approximately US$26.60) in 2008.
The fee for account-to-account transfers at some banks is also fixed atCVEsc 2,500 (approximately US$31). These costs are higher than thoseto remit from the United States to Mexico or to other Latin Americancountries through credit unions, which is about US$10 for up to US$300in remittances (Maimbo and Ratha 2005; World Bank 2006).
The average foreign exchange commission charged by some banks is0.018 percent for all major remittance corridors. However, because mostinflows come from European countries, this commission does not applyto transactions involving an exchange from euro to CVEsc because theexchange rate between the two currencies is fixed. Typically, for receiptof remittances from abroad, banks do not charge any fee for transfersthrough money transfer operators, but they do charge CVEsc 500(approximately US$6) for account-to-account transfers. Nevertheless,these costs may be prohibitive for the less wealthy population, therebyfueling the development of informal remittance networks.
Cape Verde 103
Remittance fees are also fixed for destination countries in Africa.People send money from Cape Verde to other African countries primarilythrough these corridors:
• Northern Africa: Algeria and Morocco • Western Africa: Burkina Faso, The Gambia, Ghana, Guinea, Guinea-
Bissau, Nigeria, Senegal, Sierra Leone, and Togo • West-central Africa: Cameroon, Gabon, and São Tomé and Príncipe• Southern and southwest Africa: Angola, Namibia, South Africa, and
Swaziland • Eastern Africa: Uganda.
The growing demand to send remittances from developed financial mar-kets to Cape Verde boosted the development of money transfer servicesand customized programs in the source countries. In the United States,major commercial banks such as Citizens Bank and Wells Fargo view remit-tance services as a way to attract a significant number of the unbankedpopulation to their mainstream financial products. In an arrangementwith banks in Cape Verde, for example, Citizens Bank offers Cape Verdeanmigrants a remittance facility that is cheaper than Western Union. In itsthree years of operations, this program has made more than 1,000 formerlyunbanked Cape Verdean migrants customers of Citizens Bank. However,most of such programs require the migrant to open a bank account and arethus unlikely to appeal to undocumented workers (IMF 2008).
The cost of sending money from developed countries to Cape Verde isrelatively high, especially for poor migrants. Transferring money to CapeVerde through Western Union and MoneyGram is slightly more expensivethan through other operators or services. Fees range between US$10.00 andUS$18.60 to send US$100 through MoneyGram International, and thefees for the high-volume corridors (such as France, Portugal, and the UnitedStates) are lower than those for low-volume corridors (such as the UnitedKingdom). These fees through Western Union and MoneyGram are alsolower than fees they charge to send money from Cape Verde (see table 3.5).
Nevertheless, such fees may be prohibitive for poor migrants who sendhome only a few hundred dollars per transaction and may encourage theuse of informal channels to facilitate such transfers. These channelscharge, on average, 14.3 percent, confirming the generally high transac-tion costs for Sub-Saharan Africa.7 Moreover, fees to send remittancesfrom the United Kingdom to Cape Verde and other countries, eitherwithin or outside Africa, do not differ substantially.
104 Remittance Markets in Africa
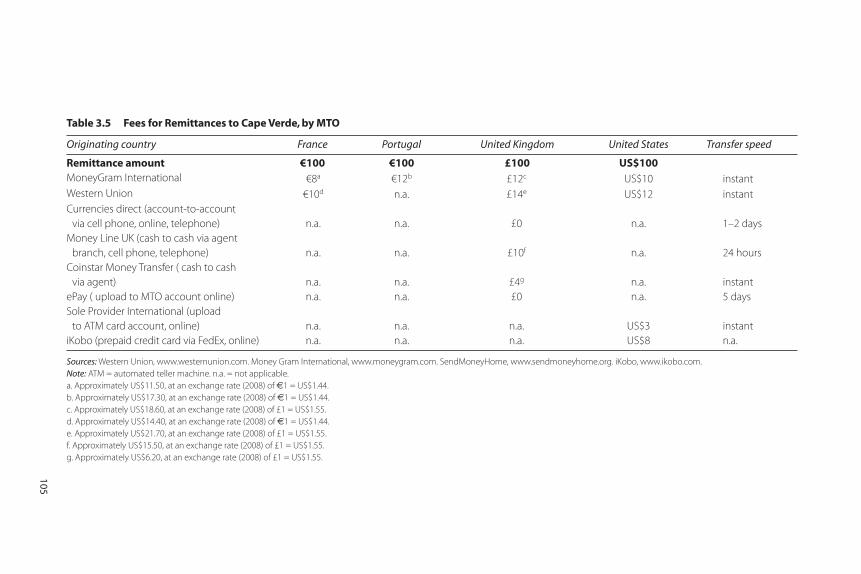
Table 3.5 Fees for Remittances to Cape Verde, by MTO
Originating country France Portugal United Kingdom United States Transfer speed
Remittance amount €100 €100 £100 US$100MoneyGram International €8a €12b £12c US$10 instantWestern Union €10d n.a. £14e US$12 instantCurrencies direct (account-to-account
via cell phone, online, telephone) n.a. n.a. £0 n.a. 1–2 daysMoney Line UK (cash to cash via agent
branch, cell phone, telephone) n.a. n.a. £10f n.a. 24 hoursCoinstar Money Transfer ( cash to cash
via agent) n.a. n.a. £4g n.a. instantePay ( upload to MTO account online) n.a. n.a. £0 n.a. 5 daysSole Provider International (upload
to ATM card account, online) n.a. n.a. n.a. US$3 instantiKobo (prepaid credit card via FedEx, online) n.a. n.a. n.a. US$8 n.a.
Sources: Western Union, www.westernunion.com. Money Gram International, www.moneygram.com. SendMoneyHome, www.sendmoneyhome.org. iKobo, www.ikobo.com. Note: ATM = automated teller machine. n.a. = not applicable.a. Approximately US$11.50, at an exchange rate (2008) of €1 = US$1.44.b. Approximately US$17.30, at an exchange rate (2008) of €1 = US$1.44.c. Approximately US$18.60, at an exchange rate (2008) of £1 = US$1.55.d. Approximately US$14.40, at an exchange rate (2008) of €1 = US$1.44.e. Approximately US$21.70, at an exchange rate (2008) of £1 = US$1.55.f. Approximately US$15.50, at an exchange rate (2008) of £1 = US$1.55.g. Approximately US$6.20, at an exchange rate (2008) of £1 = US$1.55.
105
Typically, to disburse or send remittances outside or within CapeVerde, all RSPs require official identification documents—either anational passport or national identification card—regardless of whetherthe customers hold an account with the respective banks. Driver’slicenses or utility bills are rarely accepted as identification documents.Only Cotacâmbios reported accepting these two types of identifica-tion documents. Letters from the village head or local authorities arenot accepted.
Because poor populations or those living in rural areas may not alwayspossess national identification cards or national passports, their access toremittance services and, implicitly, to additional sources of revenue maybe limited.
Conclusions and Recommendations
As one of the few countries in Africa that have experienced large-scaleemigration, as a share of its population, Cape Verde is among the toprecipients of remittances (as a share of its GDP) in Africa.
Summary of findingsHowever, official statistics often fail to capture informal remittanceinflows, including person-to-person transfers, often used for remittancesto rural areas and poor segments of the population. In addition, estimatesof the volume of remittances sent from other African countries are noteasily available.
Four private banks and one exchange office are Cape Verde’s primaryRSPs. However, the industry is highly concentrated: Among the five pri-mary RSPs, two banks (BCA and CECV) facilitated around 92 percent ofthe inward remittance flows in 2007.
Rural areas in Cape Verde remain underserved. Only two banks(CECV and BCN) even have branches in the rural areas. Moreover, nomicrofinance institutions exist that might facilitate remittances in therural areas.
The RSPs have established partnerships to facilitate the transfer ofremittances—most commonly with MTOs, such as Western Union andMoneyGram International, and with foreign correspondent banks. AllRSPs offer one or more of the most common remittance products: elec-tronic cash transfers, account-to-account transfers, bank drafts, checks,money orders, prepaid debit cards or cards for use at designated retailers,and money transfers through cellular phones.
106 Remittance Markets in Africa
Overall, the remittance settlement system and customer servicesappear to be effective, and remittance recipients may benefit from a rel-atively wide range of financial products, including deposits, saving prod-ucts, loans, credit cards, and mortgages. High remittance levels enhancethe RSPs’ capacity and support their financial consolidation, confirmingthe overall effect of remittances on financial deepening documented invarious studies (including Gupta, Pattillo, and Wagh 2009).
The RSPs’ fees for sending remittances abroad and within the countrydo not vary significantly, but they are high—and the high fees especiallylimit the poor population’s access to such services. Similarly, the cost ofsending money from developed countries to Cape Verde is relativelyhigh, especially for poor migrants. Transferring money from France,Portugal, or the United States through Western Union and MoneyGramappears to be slightly more expensive than through other operators orservices. However, fees to send money through high-remittance-volumecorridors are lower than fees for low-volume corridors, as observed inother countries.
All RSPs perceive the regulatory and business environment as favor-able to conducting a remittance business. There is a mandatory minimumcapital requirement to operate in the banking and financial market. Banksand nonfinancial institutions also must comply with the existing regula-tions on reporting requirements for suspicious activities and large currencytransactions. However, laws and regulations do not seem to significantlyaffect the remittance industry. Most of the RSPs perceive insufficientaccess to finance for banks and nonfinancial institutions—in terms of avail-ability, costs, and competition from informal sector—as moderate obstaclesto doing business.
RecommendationsFor better leveraging of the impact of remittances on development inCape Verde, specific actions are recommended in three areas: data collec-tion, remittance transaction costs, and investment and financial products.
Improve data collection. RSPs can take the following actions to improvedata collection on remittance flows and, hence, to increase the accuracy ofnational remittance volume estimates and forecasts:
• Streamline statistics on both inward and outward remittance flows(remittances that Cape Verde emigrants send home and those sent byimmigrants living in Cape Verde) by keeping separate books for
Cape Verde 107
inward remittances from Cape Verdeans abroad and outward volumesremitted by immigrants.
• Track the within-country remittance flows, and in particular, improveknowledge of the flows remitted into rural areas and to poor segmentsof the population.
• Improve data collection on remittance flows for the intra-Africancorridors.
Reduce transaction costs, and increase access of the poor. Steps toincrease access of the poor to remittance services and to reduce remit-tance costs include:
• Improve access to remittance services in rural areas by encouragingentry of microfinance institutions to reach poor populations.
• Encourage the use of new money-transfer technologies such as pre-paid cards or mobile phones, which are less costly than traditionalremittance services and products.
• Stimulate competition among banks and other nonfinancial institu-tions by reducing barriers to entry of new remittance service providers,which will help reduce overall transaction fees.
Develop investment and financial products. Finally, to strengthen thelinks between remittance flows and investment, financial institutionsshould implement the following innovative strategies:
• Develop financial products that target the Cape Verdean diaspora,including disapora bonds.
• Increase awareness of investment opportunities among the CapeVerdean diaspora in both Europe and the United States.
• Use future remittance flows as collateral to improve long-term capi-tal (through securitization of remittances, trade payments, and investment)—a strategy that has already proven effective in other developing countries such as Ecuador, the Arab Republic of Egypt,and Turkey.
108 Remittance Markets in Africa
Annex 3.A Financial Sector Development in Cape Verde
Cape Verde’s modern financial sector has developed over the past decade.The central bank, the Central Bank of Cape Verde is responsible for regu-lation. Four commercial banks are currently the main banking serviceproviders in Cape Verde: Banco Comercial do Atlântico (BCA) (spun offfrom the central bank in 1995), Caixa Económica de Cabo Verde (CECV),Banco Interatlântico (BIA), and Banco Caboverdiano de Negócios (BCN).8
The financial sector is performing well and is exhibiting a relativelyhigh level of financial intermediation. It is also highly liquid, with broadmoney representing 72.3 percent of GDP by the end of 2004—one of thehighest levels in Sub-Saharan Africa. Credit to the private sector anddeposits of commercial banks were 34 percent and 60 percent of GDP,respectively, at the end of 2003. This is much higher than in other low-income countries in Africa and comparable to those of other lower- andupper-middle-income countries (average of 12.4 percent) (IMF 2005).
The bankwide nonperforming loan portfolio, although higher than thatin developed countries, has gradually decreased from 9.00 percent in2002 to 6.31 percent (of the total) in 2005 as a result of improved super-vision by the central bank and accelerated collection efforts. The returnsto equity appear to be higher than global benchmarks and those in othercountries from Sub-Saharan Africa (IMF 2005).
The banking sector is highly concentrated9 and dominates the financialsector, with commercial banks accounting for 87 percent of financial sys-tem assets, while the insurance10 and the stock markets11 are relativelysmall. Altogether, seven nonbank financial institutions (two insurancecompanies, one venture capital firm, two exchange houses, a leasing com-pany, and the Sociedade Interbancária e Sistemas de Pagamento [SISP])and four offshore banks are operational.12
The market infrastructure, which is still developing, includes the pay-ment system and interbank market. In addition to SISP, another institu-tion, Sistema Integrado de Compensação Interbancária e Liquidação, wascreated to integrate compensation of checks and interbank transfers with24-hour processing operations. SISP integrates VISA services to supporttourism and attract foreign exchange and is expanding in some otherislands of Cape Verde.
The interbank market is dominated by two big banks and characterizedby a limited number of participants, inelastic interest rates, lack of interbankdeposits, and temporary excess liquidity in the banking system. The cen-tral bank sets reference rates (including those for lending and borrowingfacilities) and may use treasury bills of maturities of up to one year in
Cape Verde 109
open-market operations to inject (and absorb) liquidity in the banking sec-tor. However, these instruments have not been used since 1999 becausethere has been no shortage of liquidity in the banking system (IMF 2005).
Notes
1. See Ratha (2003).
2. Empirical analysis of remittances to Cape Verde shows that the domestic realinterest rates were negative in the first part of the 1980s (the inflation ratesurpassing the nominal interest rate of 6.5 percent), but after the mid-1990s,returns on deposits increased as special accounts for emigrant remittanceswere created, yielding 1 to 3 percentage points more than resident deposits(IMF 2008).
3. CECV provided data that included only inward remittances processedthrough Western Union services. The account-to-account transfers are notincluded.
4. Based on the annual average exchange rate (2007) of US$1 = CVEsc 80.56.
5. Based on the annual exchange rate (2008) of US$1 = CVEsc 75.27.
6. Based on the annual average exchange rate (2007) of US$1 = CVEsc 80.56.
7. See Gupta, Pattilo and Wagh (2009).
8. BCA and BIA are subsidiaries of the same state-owned bank in Portugal: CaixaGeral de Depósitos. CECV is a subsidiary of two Portuguese banks: CaixaEconómica Montepio Geral and Montepio Geral-Assoçiacão Multulista.
9. BCA controlled 66.3 percent of the total deposits and the total assets and55.6 percent of the total loans of the commercial banks at the end of 2004(IMF 2005).
10. Car insurance accounts for 55 percent of total insurance premiums, providingvery limited long-term capital to the market. Life insurance is underdevel-oped, representing only 1.3 percent of insurance premiums.
11. The Bolsa de Valores de Cabo Verde was inaugurated in 2005. Several com-panies (BCA, Garantia, CECV, and a tobacco company) have already beenlisted, and the government also placed 44 treasury bonds dating back to 1993in addition to new treasury bills.
12. Five additional offshore banks have requested licenses.
References
Bourdet, Y., and H. Falck. 2004. “Emigrants’ Remittances and Dutch Disease inCape Verde.” International Economic Journal (Korean International EconomicAssociation) 20 (3): 267–284.
110 Remittance Markets in Africa
Gupta S., C. Pattillo, and S. Wagh. 2009. “Impact of Remittances on Poverty andFinancial Development in Sub-Saharan Africa.” World Development 37 (1):104–15.
IMF (International Monetary Fund). 2005. Cape Verde: Selected Issues andStatistical Appendix. IMF Country Report 05/319, IMF, Washington, DC.http://imf.org/external/pubs/ft/scr/2005/cr05319.pdf.
———. 2008. “Cape Verde: Selected Issues.” Country Report 08/243, IMF,Washington, DC. http://www.imf.org/external/pubs/ft/scr/2008/cr08243.pdf.
Maimbo, S., and D. Ratha, eds. 2005. Remittances: Development Impact and FutureProspects. Washington DC: World Bank.
Ratha, Dilip. 2003. “Workers’ Remittances: An Important and Stable Source ofExternal Development Finance.” In Global Development Finance: Striving forStability in Development Finance, 157–175. Washington, DC: World Bank. http://siteresources.worldbank.org/INTRGDF/Resources/GDF2003-Chapter7.pdf.
World Bank. 2006. Global Economic Prospects 2006: Economic Implications ofRemittances and Migration. Washington, DC: World Bank.
———. 2007. “Cape Verde Investment Climate Assessment.” Report of the AfricaRegional Program on Enterprise Development, World Bank, Washington, DC.http://siteresources.worldbank.org/INTAFRSUMAFTPS/Resources/Cape_Verde_ICA_March_07_r1.pdf.
———. 2010. “Migrant Remittance Flows: Findings from a Global Survey ofCentral Banks.” Working Paper 194, World Bank, Washington, DC.
———. 2011. Migration and Remittances Factbook 2011. Washington, DC: WorldBank.
Cape Verde 111

113
Remittances are an extremely important source of foreign exchange forEthiopia.Although World Bank data based on the International MonetaryFund’s (IMF) Balance of Payments statistics provide a figure of $387 mil-lion for remittance inflows in 2010 (World Bank 2011), the figure forofficially recorded remittance inflows reported by the National Bank ofEthiopia is more than $600 million (NBE 2010). The actual volume ofremittances in Ethiopia, including flows through formal and informalchannels, could be in the range of $1 billion to $2 billion annually. Thischapter draws on a 2008–09 survey of remittance service providers(RSPs) in Ethiopia and on the Ethiopia-specific findings of a global sur-vey of central banks conducted in mid-2008 to provide a picture of theremittance industry in Ethiopia and discuss, among other issues, compe-tition, the regulatory environment, new technologies, and access to remit-tances and other financial services.
The volume of remittances that flow into a country depends on sev-eral factors, including the following:
• Size of emigrant population (World Bank 2011)• Facilities for transferring funds (Ratha 2003; Puri and Ritzema 2004)
C H A P T E R 4
Ethiopia
Alemayehu Geda and Jacqueline Irving
• Level of economic activity in the migrant-recipient countries • Rate of inflation in the recipient country (El-Sakka and McNabb
1999).
The views on the role of domestic inflation have been mixed. El-Sakkaand McNabb (1999) hold that inflation has a positive relationship to thesize of remittance inflow because migrants increase the amount they sendin response to inflation in the home country to maintain the consump-tion of families back home. Elbadawi and Rocha (1992), however arguethat a high inflation rate is a sign of economic instability and, thus, maydiscourage remittances. In Ethiopia, the former argument seems applica-ble to remittances destined for consumption, while the latter view mayrelate to the investment-related flows.
Recent Migration Trends
The revolution and unrest that characterized Ethiopia’s political climatein the 1970s caused large numbers of Ethiopians to migrate overseas.Most of the people in this first wave of migration to the West came fromEthiopia’s urban elite—primarily young and well-educated Ethiopianswho, for political reasons, sought refuge in Western countries. In thedecades that followed, however, migration gradually became an aspirationof most of Ethiopia’s urban people, mainly for economic reasons. Sincethe mid-1980s, even rural peasants have been migrating in large numbersto the Gulf Cooperation Council and other Middle Eastern countries insearch of jobs and better pay. More than 1 million Ethiopians are believedto reside abroad (Aredo 2005) out of a population of 83 million (WorldBank 2011).
The country’s internal and international migration is based largely onindividuals’ or families’ responses to adverse local socioeconomic, physi-cal, and political environment conditions. In this context, the character,direction, and volume of migration within and from Ethiopia in the pastthree decades have been shaped by political instability, decline or stagnationin the agricultural sector, and government resettlement programs of the1980s (Gebre 2001; Ezra 2001; Mberu 2006).
Remittance Sources and Trends
Despite its large migrant population, Ethiopia has not fully tapped itspotential, some authors note. Nega and others (2004), cited in Aredo
114 Remittance Markets in Africa
Ethiopia 115
(2005), indicate that the remittance flow to Ethiopia is only one-sixth ofits potential, covering just 8 percent of the nation’s budget deficit. Theseauthors indicate that if the potential level of remittances were to materi-alize, it would exceed the level of official development assistance, whichreached $3.3 billion in 2008 (World Bank 2011).
The remittance inflow data for Ethiopia vary by source. The WorldBank (2011) reported remittance inflows totaling 1.3 percent of grossdomestic product (GDP) in 2009. According to the Bank’s latest data,remittance flows grew steadily from $27 million in 1995 to $53 millionin 2000 and more than tripled in the subsequent years to reach$387 million by 2010. However, data from the National Bank ofEthiopia (NBE) suggest that the figure could be substantially higher.The NBE reported that net transfers from private individuals reached$661 million in the 2009-10 fiscal year (NBE 2010). Informal remit-tance flows to Ethiopia also appear to be significant. The NBE QuarterlyBulletin reports that of the above individual transfers, $428 million was“underground private transfers” (NBE 2010). If Ethiopian migrants sendan estimated $100 to $200 monthly to their relatives back home, apply-ing this amount to the estimated 1 million Ethiopian migrants results inan annual total estimate in the range of $1.2 billion to $2.4 billion inremittance transfers.
The NBE has not yet compiled disaggregated data for cross-borderremittance flows to Ethiopia by source country (Irving, Mohapatra,and Ratha 2010).1 According to recent World Bank data, the largestdestinations for Ethiopian migrants among high-income countries in2010 were the United States, Israel, Saudi Arabia, Canada, andGermany (World Bank 2011). In 2008, based on available informationon migration trends, the major source countries for migrant remit-tances to Ethiopia were the United States and Gulf CooperationCouncil countries (notably, the United Arab Emirates, Bahrain, SaudiArabia, and Kuwait).
As figure 4.1 shows, recorded remittance flows to Ethiopia appearedto have declined by 22 percent in 2009 as a result of the global financialcrisis, partially reversing the dramatic growth in the previous decade.According to some Ethiopian commercial banks participating in thisstudy, the volume of migrant remittance inflow transactions they werehandling (as of March 2009) had declined since the September 2008onset of the more severe phase of the global financial crisis because of lay-offs in migrant-employing sectors. However, other banks reportedincreases in transactions because increasing numbers of Ethiopians in the
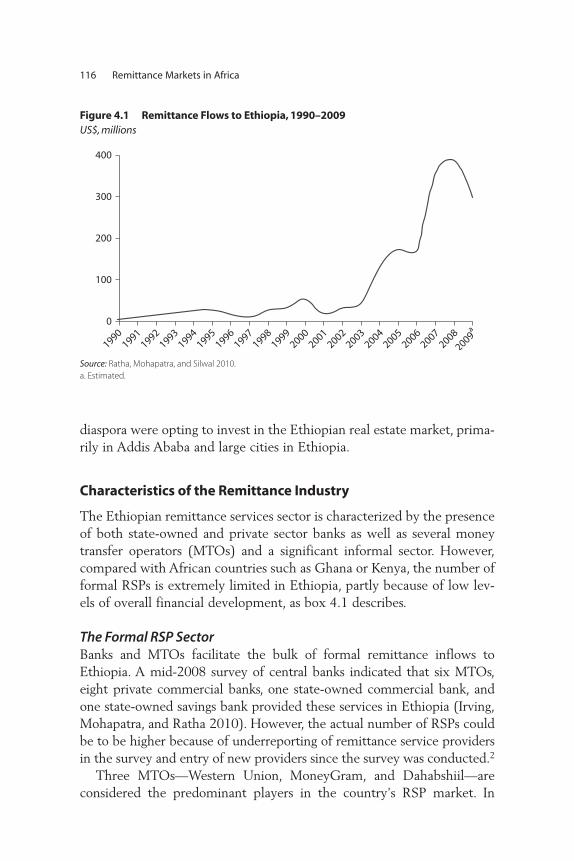
diaspora were opting to invest in the Ethiopian real estate market, prima-rily in Addis Ababa and large cities in Ethiopia.
Characteristics of the Remittance Industry
The Ethiopian remittance services sector is characterized by the presenceof both state-owned and private sector banks as well as several moneytransfer operators (MTOs) and a significant informal sector. However,compared with African countries such as Ghana or Kenya, the number offormal RSPs is extremely limited in Ethiopia, partly because of low lev-els of overall financial development, as box 4.1 describes.
The Formal RSP SectorBanks and MTOs facilitate the bulk of formal remittance inflows toEthiopia. A mid-2008 survey of central banks indicated that six MTOs,eight private commercial banks, one state-owned commercial bank, andone state-owned savings bank provided these services in Ethiopia (Irving,Mohapatra, and Ratha 2010). However, the actual number of RSPs couldbe to be higher because of underreporting of remittance service providersin the survey and entry of new providers since the survey was conducted.2
Three MTOs—Western Union, MoneyGram, and Dahabshiil—areconsidered the predominant players in the country’s RSP market. In
116 Remittance Markets in Africa
Figure 4.1 Remittance Flows to Ethiopia, 1990–2009 US$, millions
19901999
20002001
20022003
20042005
20062007
20082009
a
19981997
19961995
19941993
19921991
0
100
200
300
400
Source: Ratha, Mohapatra, and Silwal 2010.
a. Estimated.
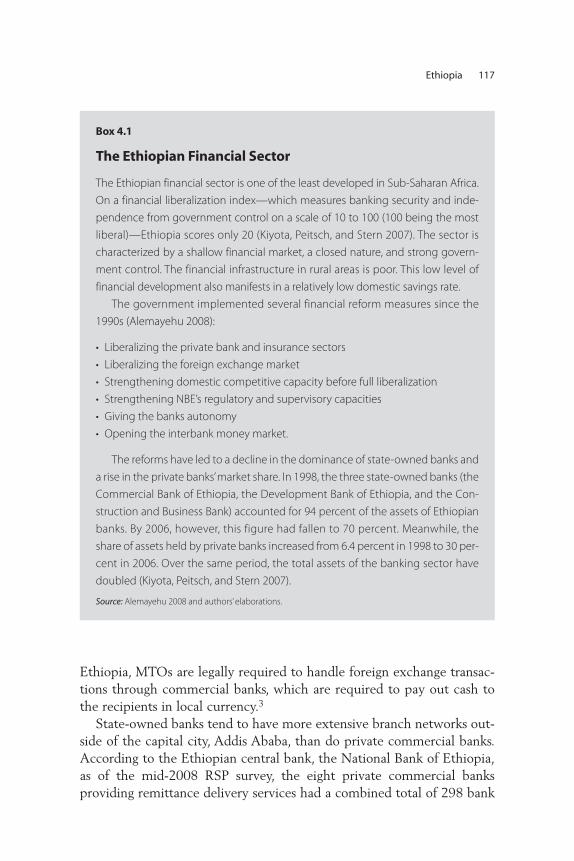
Ethiopia, MTOs are legally required to handle foreign exchange transac-tions through commercial banks, which are required to pay out cash tothe recipients in local currency.3
State-owned banks tend to have more extensive branch networks out-side of the capital city, Addis Ababa, than do private commercial banks.According to the Ethiopian central bank, the National Bank of Ethiopia,as of the mid-2008 RSP survey, the eight private commercial banksproviding remittance delivery services had a combined total of 298 bank
Ethiopia 117
Box 4.1
The Ethiopian Financial Sector
The Ethiopian financial sector is one of the least developed in Sub-Saharan Africa.
On a financial liberalization index—which measures banking security and inde-
pendence from government control on a scale of 10 to 100 (100 being the most
liberal)—Ethiopia scores only 20 (Kiyota, Peitsch, and Stern 2007). The sector is
characterized by a shallow financial market, a closed nature, and strong govern-
ment control. The financial infrastructure in rural areas is poor. This low level of
financial development also manifests in a relatively low domestic savings rate.
The government implemented several financial reform measures since the
1990s (Alemayehu 2008):
• Liberalizing the private bank and insurance sectors
• Liberalizing the foreign exchange market
• Strengthening domestic competitive capacity before full liberalization
• Strengthening NBE’s regulatory and supervisory capacities
• Giving the banks autonomy
• Opening the interbank money market.
The reforms have led to a decline in the dominance of state-owned banks and
a rise in the private banks’market share. In 1998, the three state-owned banks (the
Commercial Bank of Ethiopia, the Development Bank of Ethiopia, and the Con-
struction and Business Bank) accounted for 94 percent of the assets of Ethiopian
banks. By 2006, however, this figure had fallen to 70 percent. Meanwhile, the
share of assets held by private banks increased from 6.4 percent in 1998 to 30 per-
cent in 2006. Over the same period, the total assets of the banking sector have
doubled (Kiyota, Peitsch, and Stern 2007).
Source: Alemayehu 2008 and authors’ elaborations.
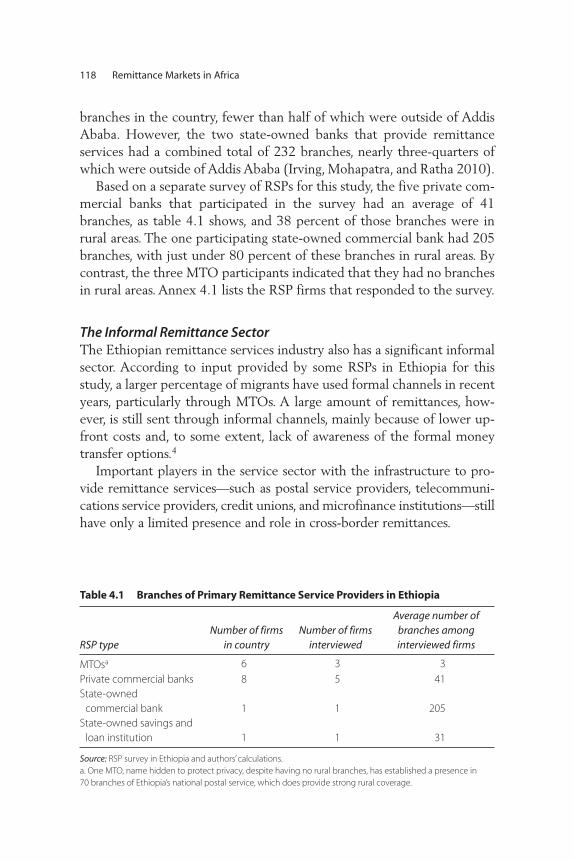
branches in the country, fewer than half of which were outside of AddisAbaba. However, the two state-owned banks that provide remittanceservices had a combined total of 232 branches, nearly three-quarters ofwhich were outside of Addis Ababa (Irving, Mohapatra, and Ratha 2010).
Based on a separate survey of RSPs for this study, the five private com-mercial banks that participated in the survey had an average of 41branches, as table 4.1 shows, and 38 percent of those branches were inrural areas. The one participating state-owned commercial bank had 205branches, with just under 80 percent of these branches in rural areas. Bycontrast, the three MTO participants indicated that they had no branchesin rural areas. Annex 4.1 lists the RSP firms that responded to the survey.
The Informal Remittance SectorThe Ethiopian remittance services industry also has a significant informalsector. According to input provided by some RSPs in Ethiopia for thisstudy, a larger percentage of migrants have used formal channels in recentyears, particularly through MTOs. A large amount of remittances, how-ever, is still sent through informal channels, mainly because of lower up-front costs and, to some extent, lack of awareness of the formal moneytransfer options.4
Important players in the service sector with the infrastructure to pro-vide remittance services—such as postal service providers, telecommuni-cations service providers, credit unions, and microfinance institutions—stillhave only a limited presence and role in cross-border remittances.
118 Remittance Markets in Africa
Table 4.1 Branches of Primary Remittance Service Providers in Ethiopia
RSP typeNumber of firms
in countryNumber of firms
interviewed
Average number of branches among interviewed firms
MTOsa 6 3 3
Private commercial banks 8 5 41
State-owned
commercial bank 1 1 205
State-owned savings and
loan institution 1 1 31
Source: RSP survey in Ethiopia and authors’ calculations.
a. One MTO, name hidden to protect privacy, despite having no rural branches, has established a presence in
70 branches of Ethiopia’s national postal service, which does provide strong rural coverage.
Partnerships and Agreements between Banks and MTOsAll the surveyed RSPs indicated that they have at least one partnershipagreement with other RSPs to provide cross-border remittance transferservices. Partnerships between banks and MTOs are currently by far themost common type of partnership in the Ethiopian RSP market. All sixcommercial banks participating in the survey indicated that they havepartnerships with MTOs in providing remittance services to recipients inEthiopia. Similarly, all three MTO participants indicated that they part-ner with banks. One innovative MTO has various types of partnershipagreements to provide its remittance and remittance-linked services, asdescribed in box 4.2.
In the past few years, NBE has been encouraging banks to form part-nerships with microfinance institutions to reach the unbanked, particu-larly in rural areas.Three of the firms participating in the RSP survey (oneMTO, the state-owned commercial bank, and one private commercialbank) indicated that they have recently begun or were planning to formpartnerships with microfinance institutions or the national post office.One MTO reported that it has kiosks in some 70 branches of Ethiopia’spostal service, with a focus on rural areas. Two microfinance institutionsin Ethiopia—the Dedebit Credit and Savings Institution (DECSI) and theAmhara Credit and Savings Institution (ACSI)—are already providingdomestic remittance transfer services and are seeking a license from NBEto transfer cross-border remittances.5
Prohibition of Exclusive Partnerships Exclusivity contracts are not legally permissible in Ethiopia under regula-tions implemented by NBE in August 2006.6 Since the abolition of exclu-sivity contracts, banks and other RSPs have clearly begun takingadvantage of the more competitive operating environment for the provi-sion of remittance services.Virtually all the banks participating in the RSPsurvey indicated that they have recently negotiated, or are in the processof negotiating, new partnership agreements with MTOs, particularly withsome of the smaller MTOs in the market. Among the RSP survey partic-ipants for this study, only one MTO indicated that it continued to oper-ate in partnership with a bank.
How RSPs Benefit from PartnershipsNearly all (9 out of 10) of the surveyed RSPs in Ethiopia cited commis-sions on remittance receipts as a benefit of their partnerships with other
Ethiopia 119
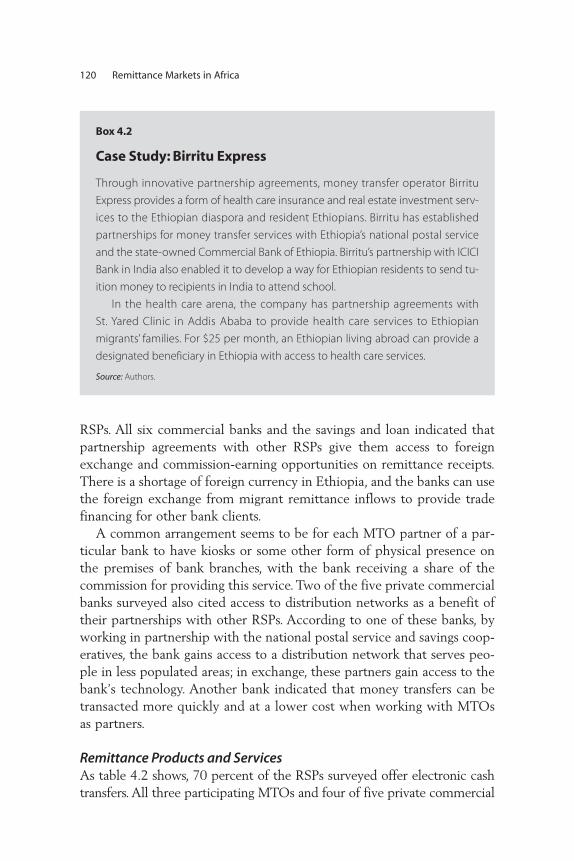
RSPs. All six commercial banks and the savings and loan indicated thatpartnership agreements with other RSPs give them access to foreignexchange and commission-earning opportunities on remittance receipts.There is a shortage of foreign currency in Ethiopia, and the banks can usethe foreign exchange from migrant remittance inflows to provide tradefinancing for other bank clients.
A common arrangement seems to be for each MTO partner of a par-ticular bank to have kiosks or some other form of physical presence onthe premises of bank branches, with the bank receiving a share of thecommission for providing this service. Two of the five private commercialbanks surveyed also cited access to distribution networks as a benefit oftheir partnerships with other RSPs. According to one of these banks, byworking in partnership with the national postal service and savings coop-eratives, the bank gains access to a distribution network that serves peo-ple in less populated areas; in exchange, these partners gain access to thebank’s technology. Another bank indicated that money transfers can betransacted more quickly and at a lower cost when working with MTOsas partners.
Remittance Products and Services As table 4.2 shows, 70 percent of the RSPs surveyed offer electronic cashtransfers. All three participating MTOs and four of five private commercial
120 Remittance Markets in Africa
Box 4.2
Case Study: Birritu Express
Through innovative partnership agreements, money transfer operator Birritu
Express provides a form of health care insurance and real estate investment serv-
ices to the Ethiopian diaspora and resident Ethiopians. Birritu has established
partnerships for money transfer services with Ethiopia’s national postal service
and the state-owned Commercial Bank of Ethiopia. Birritu’s partnership with ICICI
Bank in India also enabled it to develop a way for Ethiopian residents to send tu-
ition money to recipients in India to attend school.
In the health care arena, the company has partnership agreements with
St. Yared Clinic in Addis Ababa to provide health care services to Ethiopian
migrants’ families. For $25 per month, an Ethiopian living abroad can provide a
designated beneficiary in Ethiopia with access to health care services.
Source: Authors.
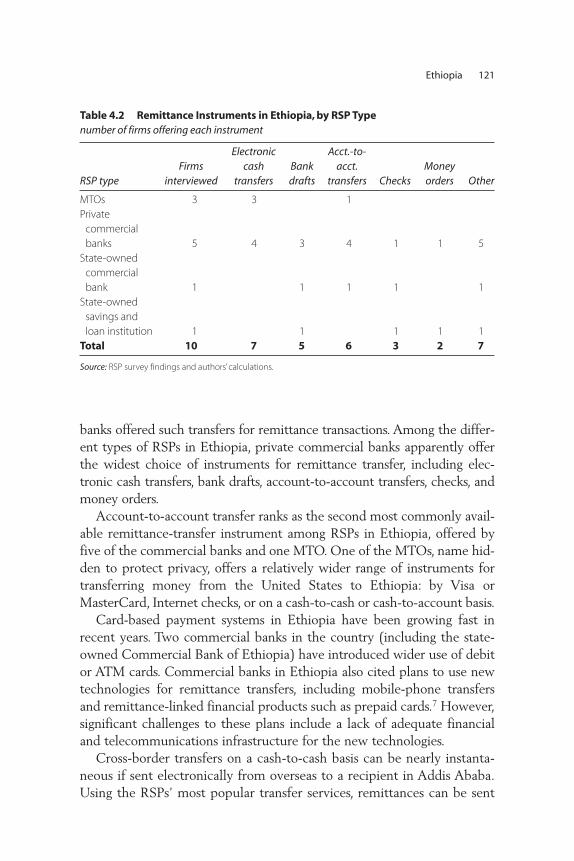
Ethiopia 121
Table 4.2 Remittance Instruments in Ethiopia, by RSP Type number of firms offering each instrument
RSP typeFirms
interviewed
Electronic cash
transfersBank drafts
Acct.-to-acct.
transfers ChecksMoney orders Other
MTOs 3 3 1
Private
commercial
banks 5 4 3 4 1 1 5
State-owned
commercial
bank 1 1 1 1 1
State-owned
savings and
loan institution 1 1 1 1 1
Total 10 7 5 6 3 2 7
Source: RSP survey findings and authors’ calculations.
banks offered such transfers for remittance transactions. Among the differ-ent types of RSPs in Ethiopia, private commercial banks apparently offerthe widest choice of instruments for remittance transfer, including elec-tronic cash transfers, bank drafts, account-to-account transfers, checks, andmoney orders.
Account-to-account transfer ranks as the second most commonly avail-able remittance-transfer instrument among RSPs in Ethiopia, offered byfive of the commercial banks and one MTO. One of the MTOs, name hid-den to protect privacy, offers a relatively wider range of instruments fortransferring money from the United States to Ethiopia: by Visa orMasterCard, Internet checks, or on a cash-to-cash or cash-to-account basis.
Card-based payment systems in Ethiopia have been growing fast inrecent years. Two commercial banks in the country (including the state-owned Commercial Bank of Ethiopia) have introduced wider use of debitor ATM cards. Commercial banks in Ethiopia also cited plans to use newtechnologies for remittance transfers, including mobile-phone transfersand remittance-linked financial products such as prepaid cards.7 However,significant challenges to these plans include a lack of adequate financialand telecommunications infrastructure for the new technologies.
Cross-border transfers on a cash-to-cash basis can be nearly instanta-neous if sent electronically from overseas to a recipient in Addis Ababa.Using the RSPs’ most popular transfer services, remittances can be sent
from abroad to urban destinations in Ethiopia in less than one day,according to 5 of the 10 RSP survey respondents (2 of which are MTOs).If remittances are transmitted by electronic or Internet check to a bankaccount, a recipient typically has access to the funds within two to fourbusiness days after the online transaction is completed.
By contrast, none of the surveyed RSPs indicated that they coulddeliver remittances sent from abroad to rural destinations in Ethiopia inless than one day—although four RSPs indicated that next-day deliverywas possible to recipients in rural areas. Further delays in rural deliveriesmay occur because people often schedule a trip to the remittance-disbursing branch or agent to coincide with other business (for example,waiting until market day). Of the 10 RSP study participants, 2 (both ofwhich are banks) indicated that they had no branches or other physicalpresence in remote rural areas.
Access to Other Financial Services The financial services most commonly offered by the surveyed RSPs toremittance recipients are savings deposits and other savings products—cited by five of the 10 firms, of which three were commercial banks.Access to credit for starting or developing a business was cited by 2 firms(a savings and loan institution and state-owned commercial bank), each ofwhich reported offering loans to both small and large businesses that aregeared specifically to remittance recipients. Mortgage loans are offeredrecipients by a savings and loan institution and an MTO, Birritu Express,which provides mortgage loans to Ethiopian migrants in the United Statesfor themselves or family members, as noted in box 4.2. A state-ownedbank handles a government-guaranteed corporate bond (issued by theEthiopian Electric Power Corp.) that targets the Ethiopian diaspora.
Aside from these instances, Ethiopia’s banks and other RSPs have notyet made much progress in using remittance transfers as an entry pointfor formal financial products. According to the RSPs responding to thesurvey, remittances not used for consumption are often invested in tangi-ble assets, such as real estate, instead of in savings deposits and otherfinancial instruments that generate low or even negative returns in realterms. Thus, most banks and other financial-service providers do notappear to be actively marketing savings instruments and investment vehi-cles to Ethiopian migrants or their families.
Nevertheless, commercial banks do offer a few different types ofaccounts geared to the Ethiopian diaspora. Private individuals and com-panies in the Ethiopian diaspora can typically hold foreign currency in
122 Remittance Markets in Africa
these Ethiopian accounts as U.S. dollars, U.K. pounds sterling, or euros.One impediment to holding more money in local savings accounts is the$50,000 limit imposed on savings held locally in an interest-bearing for-eign currency account by Ethiopians in the diaspora, combined with thelow interest payable on these accounts, according to some banks respond-ing to the survey.
Nonrepatriable, local-currency-denominated savings accounts that theholder can use for local payment purposes are also available to Ethiopiansin the diaspora. This latter type of account pays a significantly higher rateof interest than the minimum savings deposit rate set by NBE, but fundsheld in this account cannot be transferred abroad and cannot be con-verted into foreign currency. At least one commercial bank has begunoffering a zero-balance account—a new savings product that sets no min-imum balance and was launched to encourage unbanked people whocome into the bank for remittances to open an account to hold some por-tion of their remittances.Those eligible for this and other savings accountsat Ethiopian banks include nonresident Ethiopians and nonresident for-eign nationals of Ethiopian origin living abroad more than one year; com-panies owned by such individuals are also eligible.
Although they have not yet begun using new technologies in earnest,banks and other RSPs are considering how they may adopt new technolo-gies in the future to develop remittance-linked financial products such asprepaid debit cards or microfinance loans.
Resolution of Customer Grievances Most of the remittance service providers in Ethiopia encounter frequentconsumer grievances concerning failure of delivery. The responses fromthe RSPs emphasize the need for a dedicated system to handle such com-plaints. The RSPs seem to lack the personnel to handle customer griev-ances, a lack that may reflect the relatively low level of competition inthe sector.
The frequency of such failures varies markedly among the operators.Fifty percent of the firms indicated that consumer grievances occur oncea week, and 10 percent noted that they occur once every two to threemonths. Another 10 percent said they receive an average of one griev-ance per day.
Once grievances are received, the operators also vary widely in thespeed with which they address the problems: 20 percent of the firmsresolve them within a day, 40 percent within a week, and 10 percent takeup to a month.
Ethiopia 123
The Regulatory and Business Environment
The process of obtaining a license from NBE to provide remittance trans-fer services can be time consuming and lengthy. As of March 2009, it wasnot unusual for the entire procedure to run up to two years for an MTO,according to interviews with RSPs. Four of seven RSPs (two MTOs andtwo commercial banks) that provided input about perceived barriers tostarting a remittance transfer business in Ethiopia cited the licensingrequirements as a main barrier.
Access to financial infrastructure was also cited by four of seven remit-tance service providers (two MTOs and two commercial banks) as a mainbarrier to starting a remittance transfer business in Ethiopia. The inabilityof RSPs in Ethiopia to undertake remittance outflow transactions becauseof foreign exchange regulations and difficulty obtaining access to capital orfinancing were each cited by one MTO as a main barrier to starting aremittance transfer business in Ethiopia.
The lack of a modern national payment system and, in particular, thelack of a real-time gross settlement (RTGS) system currently pose amajor challenge to RSPs in Ethiopia because it means that there is noeffective common clearing and settlement system linking all the banks.In the first quarter of 2009, it could take up to five days to clear adomestic remittance transfer from one bank to another within Ethiopia.Lack of a telecommunications infrastructure in rural areas also makesit difficult for RSPs to offer remittance transfer services in these areas.Because there is no broadband telecommunications system in rural areasand some MTOs require broadband for their “fast money” transfer serv-ices, sending money from Addis Ababa to rural areas could take as longas two to three days.
A relatively larger number of firms (8 of 10) participating in the sur-vey cited barriers to providing remittance transfer services, once a busi-ness has been launched. The top-cited barrier (mentioned by three RSPs)was lack of access to clearing and settlement systems, cited by two com-mercial banks and one MTO. A second-ranking (and closely related)barrier, cited by two firms, was the inadequate information and commu-nications technology infrastructure, particularly in rural areas. Capitalrequirements and anti-money-laundering (AML) requirements were alsocited by two RSPs each. Although only one RSP (a commercial bank)cited competition posed by informal providers when queried about bar-riers to doing business generally, when the participating RSPs were askedspecifically and directly about obstacles posed by informal providers, 7 of10 indicated that it was a major or severe obstacle.
124 Remittance Markets in Africa
Exchange Controls and AML/CFT RequirementsThe U.S. dollar is the most common currency of denomination for cross-border remittances transferred to Ethiopia. However, remittances mustalways be paid out in local currency when received as cash in Ethiopia,although they can be held locally in foreign currency accounts subject tolimitations on maximum- or minimum-balance amounts.
Because of foreign exchange shortages, commercial banks and otherRSPs in Ethiopia typically do not handle cross-border migrant remittanceoutflow transactions. Sending foreign exchange abroad requires docu-mentation of purpose, and migrant remittance outflow transactions arenot generally a permissible purpose for obtaining foreign exchange. OneMTO’s partnership with ICICI Bank in India has enabled it to develop aninnovative way for Ethiopian residents to send tuition money to familymember recipients who are residing as students in India to finance thecosts associated with their studies (described in box 4.2).
Exchange controls were not specifically cited as one of the top barriersto providing remittance transfer services by the RSPs surveyed for thestudy, with the exception of one MTO. One of the commercial banks andthe savings and loan institution consider exchange controls to be a moder-ate to fairly major barrier, however. To some extent, exchange control reg-ulations governing foreign currency held locally are perceived as a barrierto the provision of remittance-linked financial services in Ethiopia, accord-ing to some of the banks, which have cited as too low the $50,000 limiton what any one account holder can hold in a foreign currency account.
AML and combating the financing of terrorism (CFT) requirements,conversely are considered top barriers to doing business in the remittancetransfer industry by two of the RSPs participating in the study and werecited as moderate barriers by another three RSPs (two private commer-cial banks and an MTO).
Remittance Industry Competition in EthiopiaAs discussed earlier, since 2006, MTOs have been forbidden to imposeexclusivity contracts when partnering with banks in providing remittanceservices in Ethiopia, and banks have taken advantage of this regulatorychange to forge multiple partnerships with MTOs. Along with the entryof new market entrants in recent years, this has helped to foster improvedcompetitiveness in Ethiopia’s remittances transfer industry.
Competition from informal providers remains a major challenge tomany RSPs in the formal sector because informal RSPs typically can offertransfer services at lower cost and foreign exchange commissions at a
Ethiopia 125
better (black market) rate. Sixty percent of the survey participants citedcompetition from informal providers as a major obstacle, and another10 percent consider it a severe obstacle. Two of the 10 RSPs consider itno obstacle at all, however. Although NBE launched an effort to closemany informal kiosks that were operating illegally in 2008, many ofthese informal providers reportedly have since reopened elsewhere.
Remittance Costs
In past years, banks and other RSPs in Ethiopia that provide remittanceservices have eliminated the service fees previously charged to remittancerecipients. The fees and other costs for these transactions are nowimposed on the transaction senders only.
Fees payable by the sender opting for formal channels tend to be high-est for fast-money (electronic) cash transfer via MTOs. As of October2009, MTO transfer fees payable by senders in the United States rangedfrom $7 to $10 for transfer of $200 by the three niche MTOs participat-ing in this study (each of which had a physical presence in at least oneU.S. city as well).8 The MTOs impose various fee structures on senders ofremittances from overseas to recipients in Ethiopia. For example, one ofthe MTOs participating in this study charges a flat fee that decreases inproportion to the amount sent, once a certain threshold was exceeded,and others charge a fee in direct proportion to the amount sent.
For domestic transfers, fees charged by the banks to senders for domes-tic transfer of $200 varied from the Ethiopian birr equivalent of $0.18 to$1.82, according to the participating commercial banks. These fees areconsiderably lower than those of MTOs for domestic transfers, althoughin the latter case (as with cross-border transfers), the sender is charged apremium for quicker transmission.
Ethiopia’s central bank operates a webpage9 that publicly posts infor-mation about MTOs that have partnerships with banks in Ethiopia andthe associated fees for remittance transfers by MTOs. It obliges RSPs toreveal the following:
• Terms and tariffs applicable to a remittance service, including theircorrespondent bank, agent fees, and other services they provide
• The estimated time it will take to get the money to the receiver (RSPsare required to transmit remittances to their customers within 24 hours)
• The exchange rate that the RSPs use to convert the foreign currencyto domestic currency and vice versa.
126 Remittance Markets in Africa
Customer Identification Requirements
Driver’s licenses and national passports are the most commonlyaccepted forms of identification from remittance recipients, acceptedby all nine participating RSPs providing this information. Eight of theRSPs accept national identification (ID) cards as well. Less commonlyaccepted forms of ID are verification of employment or a letter from alocal or village authority. A few of the commercial banks and one MTOalso accept ID cards issued by local or regional authorities, although oneof these banks stated that the only acceptable ID for foreign nationalsresiding in Ethiopia is a national passport. A wider range of ID forms areapparently accepted by the state-owned commercial bank, savings andloan institution, and MTOs.10
Private commercial banks had the most limited range of acceptable IDrequirements among the participating RSPs, which could impede theability of the poorest recipients, particularly those dwelling in rural areas,to collect remittances from them. All participating RSPs providing inputon this issue accept a national ID card, however.
Among most of the RSPs, there was no difference in ID requirementsfor account holders or registered customers versus customers withoutaccounts or nonregistered customers, with one exception: the participat-ing savings and loan institution accepts a savings passbook from accountholders as a valid ID.
Conclusions and Policy Implications
The importance of the remittance industry for Ethiopia is worth empha-sizing because it contributes at least as much (or more) foreign exchangeas the Ethiopian export sector. Despite an increase in the amount ofremittance inflows transferred through formal channels in the pastdecade, the current low level of financial intermediation and the lack of amodern national payments system currently pose major challenges toRSPs. The top-cited barrier to operating a remittance transfer business—among both bank and nonbank RSPs—was lack of access to clearing andsettlement systems. There may be beneficial lessons for Ethiopia in ini-tiatives to modernize its payment and settlements system infrastructure(such as introducing an RTGS system), as other developing countrieshave done in the past few years.
The development of new technologies and products for the delivery ofcross-border remittance inflows, such as mobile money transfers and
Ethiopia 127
card-based technologies, could further reduce the cost of remittancetransfers and further boost competitiveness among RSPs in Ethiopia’sremittances services market. The development of prepaid and debit cardsand other remittance-linked financial products could eventually alsoexpand access to financial services by unbanked remittance recipients inrural areas. However, the telecommunications infrastructure remainsunderdeveloped in Ethiopia, and this is a sector that will require furthermodernization and development.
New types of partnership agreements are emerging in Ethiopia’s RSPsmarket. These include partnerships involving microfinance institutions(MFIs) and the national post office to better serve the unbanked, partic-ularly in rural areas of the country. Ethiopia’s postal service has begunlinking with some MTOs to provide money transfer services. Grantingcertain nonbank RSPs such as MFIs and national post offices access tonational clearing and settlement systems could more effectively expandrural access, increase competition, and reduce transmission costs (Rathaand Riedberg 2005). Expediting the process for obtaining a license tooperate a money transfer business in Ethiopia, by facilitating entry, alsocould help boost competitiveness of the formal sector for remittancetransfers. The cost of remittance transfers tends to decline, and the qual-ity of available services to rise, as the number of market competitorsincreases (Orozco 2002; Ratha and Riedberg 2005).
Making information on remittance transfer fees publicly available toboth potential senders and receivers enhances market transparencyamong the market’s RSPs and can further increase the remittance inflowssent through formal channels. The public posting and frequent updatingof information on remittance transfer fees on the NBE website—andproviding this information in the destination countries, such as throughEthiopian embassies and migrant associations—would further enhancemarket transparency.
Ethiopia’s banks and other RSPs have not yet made much concreteprogress in using remittance transfers as an entry point for formal financialproducts, partly because of the relatively underdeveloped state of Ethiopia’sfinancial system. The share of remittances not used for consumption isoften invested in tangible assets, such as real estate, which has been offeringhigher returns than savings deposits and other financial instruments.
Striking the right balance in administering AML/CFT requirementswill also be important to ensuring that the RSP industry’s formal sectorwill continue to grow and benefit from the dynamism and new technolo-gies that can accompany the entry of new market participants. Half of the
128 Remittance Markets in Africa
respondents to the RSP survey consider AML/CFT requirements to bemoderate to major barriers to doing business in the remittance transferindustry in Ethiopia. It will be important, therefore, to ensure that overlyonerous AML/CFT requirements do not make it difficult for legitimatelyregistered and operating RSPs to do business—an unintended conse-quence that could drive more remittances into informal channels if thecompetitiveness of the formal sector is negatively affected.
Ethiopia 129
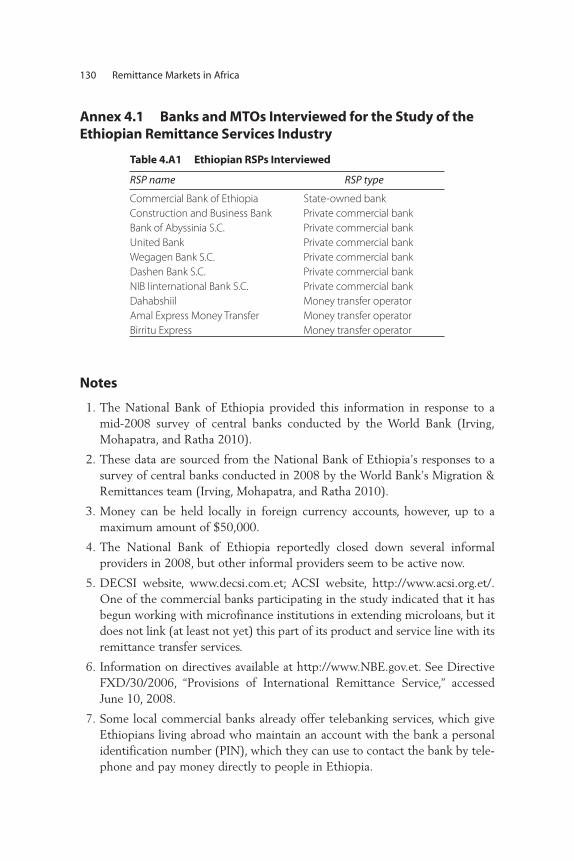
Annex 4.1 Banks and MTOs Interviewed for the Study of theEthiopian Remittance Services Industry
130 Remittance Markets in Africa
Table 4.A1 Ethiopian RSPs Interviewed
RSP name RSP type
Commercial Bank of Ethiopia State-owned bank
Construction and Business Bank Private commercial bank
Bank of Abyssinia S.C. Private commercial bank
United Bank Private commercial bank
Wegagen Bank S.C. Private commercial bank
Dashen Bank S.C. Private commercial bank
NIB Iinternational Bank S.C. Private commercial bank
Dahabshiil Money transfer operator
Amal Express Money Transfer Money transfer operator
Birritu Express Money transfer operator
Notes
1. The National Bank of Ethiopia provided this information in response to amid-2008 survey of central banks conducted by the World Bank (Irving,Mohapatra, and Ratha 2010).
2. These data are sourced from the National Bank of Ethiopia’s responses to asurvey of central banks conducted in 2008 by the World Bank’s Migration &Remittances team (Irving, Mohapatra, and Ratha 2010).
3. Money can be held locally in foreign currency accounts, however, up to amaximum amount of $50,000.
4. The National Bank of Ethiopia reportedly closed down several informalproviders in 2008, but other informal providers seem to be active now.
5. DECSI website, www.decsi.com.et; ACSI website, http://www.acsi.org.et/.One of the commercial banks participating in the study indicated that it hasbegun working with microfinance institutions in extending microloans, but itdoes not link (at least not yet) this part of its product and service line with itsremittance transfer services.
6. Information on directives available at http://www.NBE.gov.et. See DirectiveFXD/30/2006, “Provisions of International Remittance Service,” accessedJune 10, 2008.
7. Some local commercial banks already offer telebanking services, which giveEthiopians living abroad who maintain an account with the bank a personalidentification number (PIN), which they can use to contact the bank by tele-phone and pay money directly to people in Ethiopia.
8. Birritu Express currently charges senders in the United States a fee of $7 forelectronic transfer of amounts up to $300 to a recipient in Ethiopia—anamount that increases to $8 for transfer of $301–$500 and $13 for amountsof $501–$800. Dahabshiil charges 5 percent on transaction amounts up to$1,000 from the United States (or $10 for sending $200).
9. See http://www.nbe.gov.et. However, the information in the central bank’swebsite appears to be out of date.
10. The state-owned commercial bank accepts a Kebele ID card, pension card,student ID, and signature verification as acceptable forms of ID for receivingremittances.
References
Alemayehu, Geda. 2008. “The Structure and Performance of Ethiopia’s FinancialSector in the Pre and Post Reform Period: With Special Focus on Banking.”In Domestic Resource Mobilization and Financial Development, ed. GeorgeMavrotas, 163–202. Basingstoke, U.K.: Palgrave Macmillan.
Aredo, Dejene. 2005. “Migrant Remittances, Shocks and Poverty in UrbanEthiopia: An Analysis of Micro-Level Panel Data.” Addis Ababa University,Addis Ababa, Ethiopia.
Elbadawi, Ibrahim A., and Roberto Rocha. 1992. “Determinants of ExpatriateWorkers’ Remittances in North Africa and Europe.” Working Paper WPS1038, World Bank, Washington, DC.
El-Sakka, Mohammed I.T., and Robert McNabb. 1999. “The MacroeconomicDeterminants of Emigrant Remittances.” World Development 27 (8):1493–502.
Ezra, Markos. 2001. “Ecological Degradation, Rural Poverty, and Migration inEthiopia: A Contextual Analysis.” Policy Research Division, PopulationCouncil Working Paper 149, Population Council, New York, NY.
Gebre, Ynitso D. 2001. “Population Displacement and Food Insecurity in Ethiopia:Resettlement, Settlers and Hosts.” University of Florida, Ph.D. dissertation.
IMF (International Monetary Fund). 1993. Balance of Payments Manual. 5th ed.Washington, DC: IMF.
Irving, Jacqueline, Sanket Mohapatra, and Dilip Ratha. 2010. Migrant RemittanceFlows: Findings from a Global Survey of Central Banks. Working Paper 102,World Bank, Washington, DC.
Kiyota, Kozo, Barbara Peitsch, and Robert M. Stern. 2007. “The Case for FinancialSector Liberalization in Ethiopia.” Working Paper 565, Research Seminar inInternational Economics, University of Michigan.
Ethiopia 131
Mberu, Blessing U. 2006. “Internal Migration and Household Living Conditions inEthiopia.” Journal of Demographic Research 14 (21): 509–40.
Nega, B., K. Tadesse, S. Nuru, and Z. Mamma. 2004. “Using Resources fromMigrants for Development in Ethiopia.” Ethiopean Economic Association/Ethiopean Economic Policy Research Institute. Report prepared for theInternational Organization for Migration Addis Ababa.
NBE (National Bank of Ethiopia). 2010. “Quarterly Bulletin.” Vol. 25, Quarter 3,Addis Ababa, Ethiopia (available at http://www.nbe.gov.et/publications/quarterlybulletin.htm).
Orozco, Manuel. 2002. Attracting Remittances: Market, Money and Reduced Costs.Report commissioned by the Multilateral Investment Fund of the Inter-American Development Bank, Washington, DC.
Puri, Shivani, and Tineke Ritzema. 2004. “Migrant Worker Remittances, Micro-Finance and Informal Economy: Prospects and Issues.” International LabourOrganization (ILO) Working Paper 21, ILO, Geneva.
Ratha, Dilip. 2003. “Worker’s Remittances: An Important and Stable Source ofExternal Development Finance.” In Global Development Finance: Striving forStability in Development Finance, 157–75. Washington, DC: World Bank.http://siteresources.worldbank.org/INTRGDF/Resources/GDF2003-Chapter7.pdf.
Ratha, Dilip, and Jan Reidberg. 2005. “On Reducing Remittance Costs.”Unpublished manuscript, World Bank, Washington DC.
Ratha, Dilip, Sanket Mohapatra, and Ani Silwal. 2010. “Outlook for RemittanceFlows 2010–11: Remittance Flows to Developing Countries RemainedResilient in 2009, Expected to Recover in 2010–11.” Migration andDevelopment Brief 12, World Bank, Washington, DC. http://www.worldbank.org/prospects/migrationandremittances.
Wimaladharma Jan, Douglas Pearce, and David Stanton. 2004. “Remittances: TheNew Development Finance?” Small Enterprise Development 15 (1): 12–19.
World Bank. 2006. Global Economic Prospects: Economic Implications of Remittancesand Migration. Washington, DC: World Bank.
———. 2011. Migration and Remittances Factbook 2011. Washington, DC: WorldBank.
132 Remittance Markets in Africa
133
Migrant remittances have become a stable source of income for mostdeveloping countries, proving to be more stable flow than official develop-ment assistance (ODA) and other private capital flows (Maimbo 2003;Sander 2003). Global remittance flows currently exceed $420 billion,about $317 billion of which goes to developing countries—more thanthree times the ODA these countries now receive and more than 10 timesthe $2.98 billion in remittances they received in 1975 (World Bank 2009).
Studies analyzing the impact of remittances show that these flows arebeneficial at all levels—individual, household, community, and national.This trend is no different in Ghana, where migrant remittances increasedfrom about $449 million in 1999 to $1.8 billion in 2008, far exceedingODA (Bank of Ghana 2008). The World Bank figures on migration andremittances show a smaller increase in remittances to Ghana, from$31 million in 1999 to $128 million in 2008 (World Bank 2009).1
Remittance and Migration Trends
The rapid growth in migrant remittance volumes and the proliferation ofmoney transfer institutions (both formal and informal) have boosted thecontribution of remittances to the development and growth of theGhanaian economy. They have helped many households get through
C H A P T E R 5
Ghana
Peter Quartey
income disruptions and have financed education, real estate, and smallbusinesses. Partially offsetting these positive contributions, however, is theexodus of skilled workers from Ghana to developed countries such as theUnited Kingdom and the United States—a migration with a major impacton the country’s economic and social sectors.
A large portion of remittances to Ghana are transferred throughinformal channels, and this method reduces the potential contributionof remittances to development—through financial sector deepening,credit multiplier effects, savings, and investment. Remittance flows out-side the formal financial sector also raise issues of money laundering andother financial crimes.
Apart from cash transfers through the formal financial system, thefourth Ghana Living Standards Survey (GLSS 4), conducted in 1999,estimated that cash remittances accounted for 20 percent of total privateinward remittances (Quartey 2006). Therefore, it is reasonable to con-clude that a considerable amount of remittances are sent through infor-mal means such as home associations and friends or illegally throughnonbank financial intermediaries. According to at least one survey, as fig-ure 5.1 shows, an estimated 64 percent of remittance inflows may besent through a friend, relative, or other intermediary of the sender.
Remittances have an impact on the Ghanaian economy throughinvestment in housing, which has spinoff effects on a large number ofbusinesses (Mazzucato, van den Boom, and Nsowah-Nuamah 2004). TheGLSS 3 and 4 also reported that remittances significantly improvedhousehold welfare.2 The bulk of remittances, however, are reserved forprivate consumption and recurrent expenditures, including livingexpenses, school fees, hospital bills, weddings and other social activities,funerals, repayment of debt, and the costs of migrating abroad.
According to the figures in table 5.1, an estimated 17–25 percent ofremittances are used for small businesses, housing development, andother uses (Black, King, and Tiemoko 2003; Asiedu 2005; Quartey2006).3 Thus, migrant remittances enhance the growth of the privatesector through their impact on the financing of small- and medium-scale enterprises.
The analysis in this chapter is based also on a 2008 survey of remit-tance service providers (RSPs) in Ghana for the policy-oriented researchproject on Migration, Remittances and Development, undertaken jointlyby the World Bank and the African Development Bank (AfDB). The find-ings are expected to provide a better understanding of the RSP marketand to help national policy makers in Sub-Saharan Africa to enhance theRSPs’ impact on development.
134 Remittance Markets in Africa
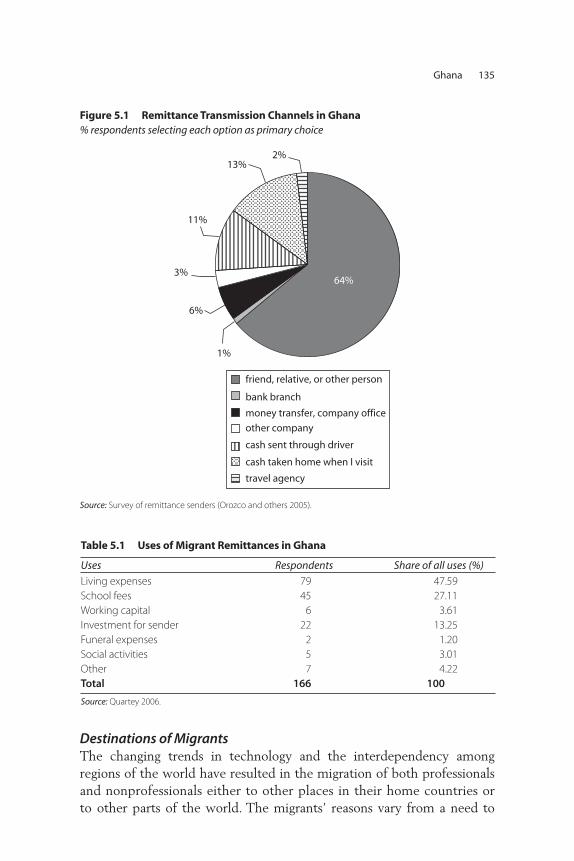
Destinations of Migrants The changing trends in technology and the interdependency amongregions of the world have resulted in the migration of both professionalsand nonprofessionals either to other places in their home countries orto other parts of the world. The migrants’ reasons vary from a need to
Ghana 135
1%
3%
11%
13%2%
64%
6%
friend, relative, or other person
bank branch
money transfer, company office
other company
cash sent through driver
cash taken home when I visit
travel agency
Figure 5.1 Remittance Transmission Channels in Ghana % respondents selecting each option as primary choice
Source: Survey of remittance senders (Orozco and others 2005).
Table 5.1 Uses of Migrant Remittances in Ghana
Uses Respondents Share of all uses (%)
Living expenses 79 47.59School fees 45 27.11Working capital 6 3.61Investment for sender 22 13.25Funeral expenses 2 1.20Social activities 5 3.01Other 7 4.22Total 166 100
Source: Quartey 2006.
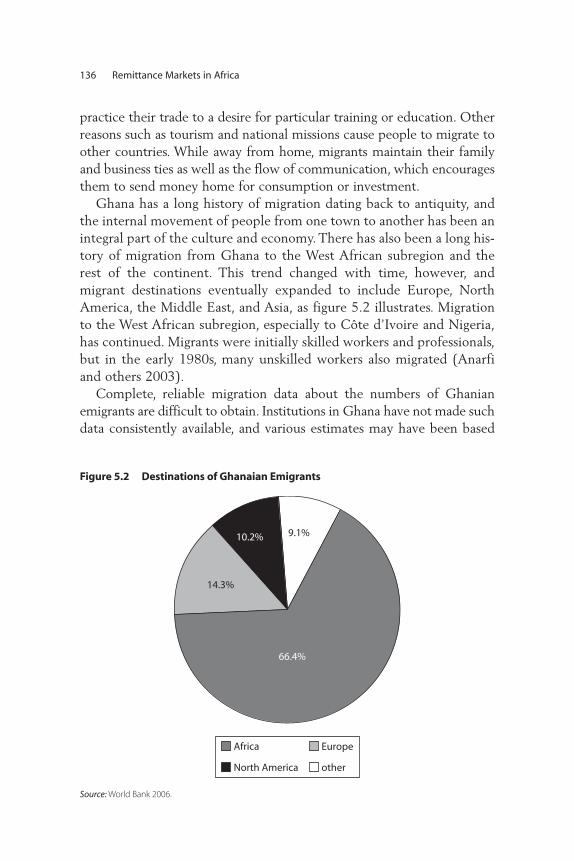
practice their trade to a desire for particular training or education. Otherreasons such as tourism and national missions cause people to migrate toother countries. While away from home, migrants maintain their familyand business ties as well as the flow of communication, which encouragesthem to send money home for consumption or investment.
Ghana has a long history of migration dating back to antiquity, andthe internal movement of people from one town to another has been anintegral part of the culture and economy. There has also been a long his-tory of migration from Ghana to the West African subregion and therest of the continent. This trend changed with time, however, andmigrant destinations eventually expanded to include Europe, NorthAmerica, the Middle East, and Asia, as figure 5.2 illustrates. Migrationto the West African subregion, especially to Côte d’Ivoire and Nigeria,has continued. Migrants were initially skilled workers and professionals,but in the early 1980s, many unskilled workers also migrated (Anarfiand others 2003).
Complete, reliable migration data about the numbers of Ghanianemigrants are difficult to obtain. Institutions in Ghana have not made suchdata consistently available, and various estimates may have been based
136 Remittance Markets in Africa
Figure 5.2 Destinations of Ghanaian Emigrants
Source: World Bank 2006.
Africa Europe
North America other
66.4%
14.3%
10.2% 9.1%
on differing definitions, assumptions, and time periods. The varying esti-mates have included the following:
• In 2000, an estimated total of 906,698 Ghanaians (4.56 percent of thecountry’s population) lived outside Ghana (World Bank 2006).4
• In 2006, an estimated 189,461 Ghanaians resided in the 33 Organisa-tion for Economic Co-operation and Development member countries,representing less than 1 percent of the estimated total population of22.1 million (EU 2006).5
• According to data from the various country embassies in Ghana, anestimated 461,549 Ghanaians live in Europe and North America, and 1 million more Ghanaians live in other African countries. On thisbasis, Twum-Baah (2005) concluded that approximately 1.5 millionGhanaians live outside the country—not 3 million, as some publica-tions reported. However, this estimate excludes Ghanaians in the GulfStates and Asia.
• Both the Ghana Statistical Service and the Ghana Immigration Servicelack data about Ghanaians living abroad. Recent data from the Min-istry of Foreign Affairs indicate that 107,487 Ghanaians were regis-tered with Ghana missions in 33 countries, but the ministry estimatesthat this number exceeds half a million.6
Internal MigrationSome authors have described Ghanaians as migratory (Caldwell 1969).Indeed, internal and cross-border migration has long been a significantlivelihood strategy for Ghanaians (Kabki 2007). From all indications, inter-nal migration began before independence (in 1957) and has continuedever since. The trend is notably a rural-to-urban shift, and internal migrantsrepresented 13 percent and 17 percent of the total population in 1960 and1970, respectively. As of 2000, 27.4 percent of Ghana’s 18.9 million peo-ple lived outside their places of birth. Intra- and interregional migrantswere 9.9 percent and 17.5 percent of the total population, respectively.7
North-south migration has been prevalent in the country, in partbecause of the different ecological zones. In view of the heavy dependenceon small-scale agriculture, usually for subsistence, the long dry season con-stitutes a lean farming season and provides an opportunity for many peo-ple in the north to move southward to work instead of remaining idle intheir localities. They return at the beginning of the rainy season to resumetheir farming. This type of migration is temporal, cyclical, and dominatedby males.
Ghana 137
The types of internal migration observed in Ghana include rural-to-urban, intrarural, urban-to-rural, and intraurban.8 The volume and inten-sity of these movements keep changing and are influenced by the socialand economic factors that shape migrants’ aspirations. The GLSS 4 resultsshowed that rural areas receive more than 60 percent of internal migrants;intrarural migration, 32 percent; urban-to-rural migration, 35 percent;interurban migration, 23 percent; and rural-to-urban, 10 percent.9
Internal migrants maintain links with their hometowns. Even whenthey are away, they contribute to the development of their indigenouscommunities through the payment of levies and transfers. Caldwell (1969)observed that migration may lead to a decline in family ties, but it rarelyremoves migrants from their communities, and few Ghanaians woulddesire that. These hometown connections are fostered through visits dur-ing funerals, festivals, and marriage ceremonies. There is a view that if onemigrates and does not return, then he or she is “aimless.” Thus, the purposeof migration is to acquire wealth and experience to benefit the hometown.
Remittance SourcesMost of the remittances to Ghana are sent by Ghanaian migrants living out-side the African continent, primarily from the United States and Canada(Quartey and Blankson 2004). In 2004, remittances received throughmoney transfer institutions amounted to almost $970 million—$665.7 mil-lion of which came from those two countries. The United Kingdom is thethird-largest source, with $163.3 million; followed by the European Union,with $96.8 million; and other countries, which accounted for $25.1 million.The United Kingdom and European Union account for 18 percent and14.6 percent of remittances to Ghana, respectively.
The Economic Community of West African States (ECOWAS) andthe rest of Africa accounted for $11.7 million and $7.5 million, respec-tively (Bank of Ghana 2004). Data from the central bank show that theUnited States and Canada accounted for a combined 76 percent in 2005,63 percent in 2006, and 59 percent in 2007.10 The amount of money sentfrom the United States and Canada has been decreasing over the three-year period, while figures from other regions are on the rise. Remittancesfrom the United States may have declined because of stricter laws regard-ing the transfer of money.
Characteristics of the Remittance Industry
For the purpose of the 2008 RSP survey in Ghana,11 remittances werebroadly defined as “person-to-person” transfers of resources, whether
138 Remittance Markets in Africa
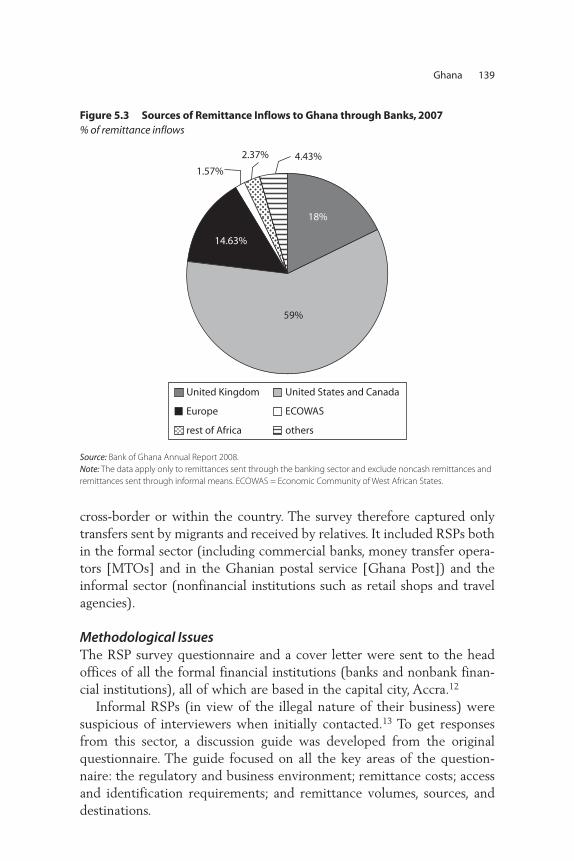
cross-border or within the country. The survey therefore captured onlytransfers sent by migrants and received by relatives. It included RSPs bothin the formal sector (including commercial banks, money transfer opera-tors [MTOs] and in the Ghanian postal service [Ghana Post]) and theinformal sector (nonfinancial institutions such as retail shops and travelagencies).
Methodological IssuesThe RSP survey questionnaire and a cover letter were sent to the headoffices of all the formal financial institutions (banks and nonbank finan-cial institutions), all of which are based in the capital city, Accra.12
Informal RSPs (in view of the illegal nature of their business) weresuspicious of interviewers when initially contacted.13 To get responsesfrom this sector, a discussion guide was developed from the originalquestionnaire. The guide focused on all the key areas of the question-naire: the regulatory and business environment; remittance costs; accessand identification requirements; and remittance volumes, sources, anddestinations.
Ghana 139
Figure 5.3 Sources of Remittance Inflows to Ghana through Banks, 2007% of remittance inflows
Source: Bank of Ghana Annual Report 2008.Note: The data apply only to remittances sent through the banking sector and exclude noncash remittances andremittances sent through informal means. ECOWAS = Economic Community of West African States.
18%
14.63%
59%
1.57%
2.37% 4.43%
United Kingdom United States and Canada
Europe ECOWAS
rest of Africa others
The definition of migrant remittances (as previously stated, person-to-person transfers of resources cross-border or within-country) was a bitproblematic because it was difficult for almost all the RSPs to disaggre-gate their migrant remittances from certain other capital flows; hence,they provided the bulk volumes. In addition, most of the RSPs lackedspecific remittance units or departments where data could be compiledand easily accessed. The gathering of data and other information fromRSPs in Ghana often required contacting various departments separatelybecause the RSPs lacked internal coordination on remittances, and thiscontributed to delays in completing the questionnaire.
Although the introduction of universal banking in Ghana hasenabled all the banks to engage in remittance services, the traditionalcommercial banks have the advantage of extensive branch networksand, therefore, more coverage. At the time of the survey, 22 banks and4 nonbank financial institutions were authorized to process inwardremittances. The nonbank financial institutions include MTOs andGhana Post. Some of these institutions are also authorized to processoutward remittances. Various informal businesses also offer remittanceservices. Nine banking institutions and two nonbank financial institu-tions responded to the questionnaire and are included in the survey—aresponse rate of about 50 percent.
Types and Coverage of Remittance FirmsPrivate commercial banks made up 73 percent of the responding RSPs.A state-owned bank, Ghana Post, and an MTO each accounted for about9 percent of the responding RSPs, as figure 5.4 depicts.
All of the firms engage in international remittances, and about 20 per-cent also exchange currencies for RSPs and for domestic and internationalmessaging services. About 36 percent of the firms receive domestic remit-tances, provide domestic settlement services, and send internationalremittances. Slightly fewer than 30 percent of the firms send domesticremittances and provide cross-border settlement services. Currencyexchanges are not allowed to operate remittance services, but they do soinformally because they have access to large amounts of currency and caneasily provide the services to their known clients.
Partnerships and Agreements with Money Transfer OperatorsAbout 82 percent of the RSP firms, comprising mainly private com-mercial banks and Ghana Post, operate in partnership with MTOs suchas Western Union, Vigo Money Transfer, and MoneyGram. However,
140 Remittance Markets in Africa
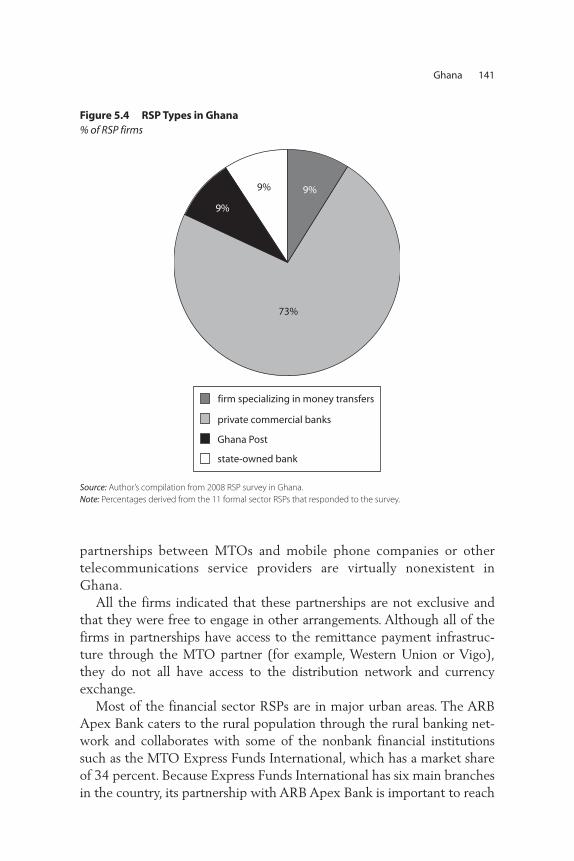
partnerships between MTOs and mobile phone companies or othertelecommunications service providers are virtually nonexistent inGhana.
All the firms indicated that these partnerships are not exclusive andthat they were free to engage in other arrangements. Although all of thefirms in partnerships have access to the remittance payment infrastruc-ture through the MTO partner (for example, Western Union or Vigo),they do not all have access to the distribution network and currencyexchange.
Most of the financial sector RSPs are in major urban areas. The ARBApex Bank caters to the rural population through the rural banking net-work and collaborates with some of the nonbank financial institutionssuch as the MTO Express Funds International, which has a market shareof 34 percent. Because Express Funds International has six main branchesin the country, its partnership with ARB Apex Bank is important to reach
Ghana 141
Figure 5.4 RSP Types in Ghana% of RSP firms
Source: Author’s compilation from 2008 RSP survey in Ghana.Note: Percentages derived from the 11 formal sector RSPs that responded to the survey.
73%
9%9%
9%
firm specializing in money transfers
private commercial banks
Ghana Post
state-owned bank
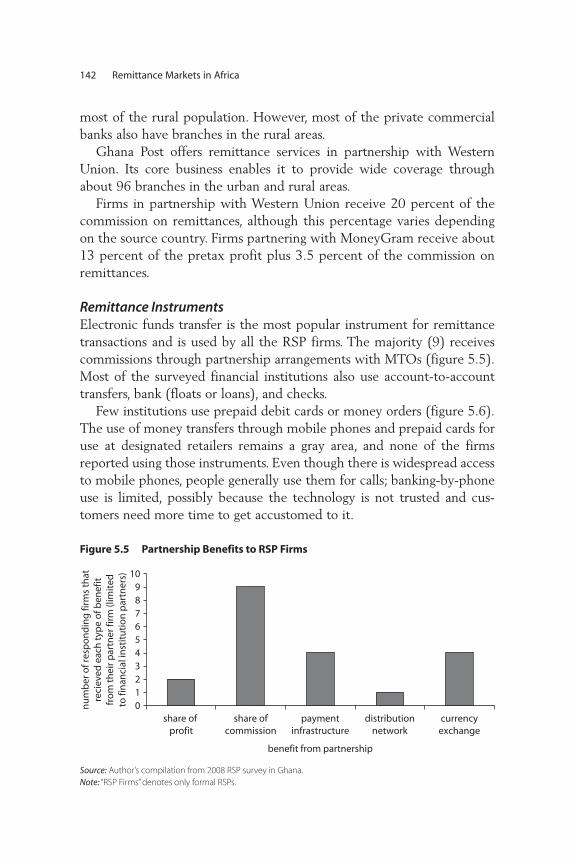
most of the rural population. However, most of the private commercialbanks also have branches in the rural areas.
Ghana Post offers remittance services in partnership with WesternUnion. Its core business enables it to provide wide coverage throughabout 96 branches in the urban and rural areas.
Firms in partnership with Western Union receive 20 percent of thecommission on remittances, although this percentage varies dependingon the source country. Firms partnering with MoneyGram receive about13 percent of the pretax profit plus 3.5 percent of the commission onremittances.
Remittance Instruments Electronic funds transfer is the most popular instrument for remittancetransactions and is used by all the RSP firms. The majority (9) receivescommissions through partnership arrangements with MTOs (figure 5.5).Most of the surveyed financial institutions also use account-to-accounttransfers, bank (floats or loans), and checks.
Few institutions use prepaid debit cards or money orders (figure 5.6).The use of money transfers through mobile phones and prepaid cards foruse at designated retailers remains a gray area, and none of the firmsreported using those instruments. Even though there is widespread accessto mobile phones, people generally use them for calls; banking-by-phoneuse is limited, possibly because the technology is not trusted and cus-tomers need more time to get accustomed to it.
142 Remittance Markets in Africa
Figure 5.5 Partnership Benefits to RSP Firms
Source: Author’s compilation from 2008 RSP survey in Ghana.Note: “RSP Firms” denotes only formal RSPs.
10987654
nu
mb
er o
f res
po
nd
ing
firm
s th
atre
ciev
ed e
ach
typ
e o
f ben
efit
fro
m t
hei
r par
tner
firm
(lim
ited
to fi
nan
cial
inst
itu
tio
n p
artn
ers)
3210
share of profit
share ofcommission
paymentinfrastructure
benefit from partnership
distributionnetwork
currencyexchange
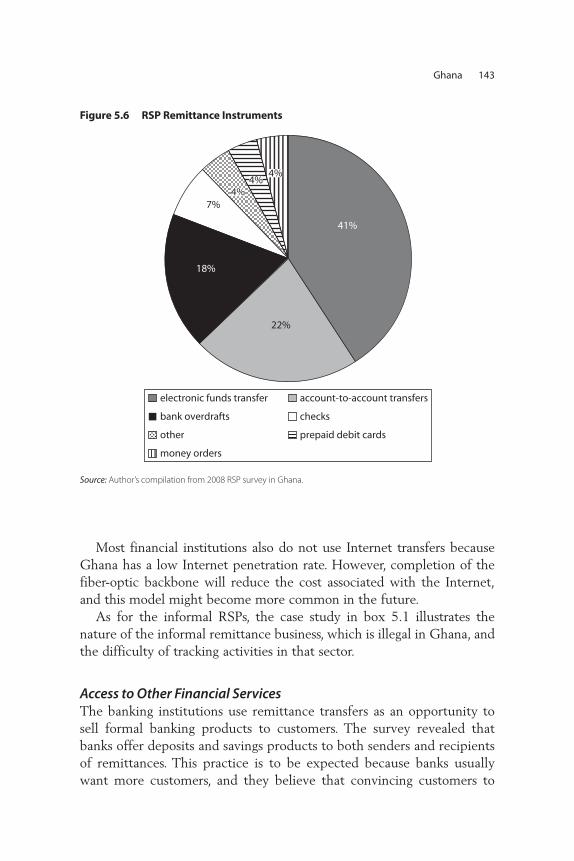
Most financial institutions also do not use Internet transfers becauseGhana has a low Internet penetration rate. However, completion of thefiber-optic backbone will reduce the cost associated with the Internet,and this model might become more common in the future.
As for the informal RSPs, the case study in box 5.1 illustrates thenature of the informal remittance business, which is illegal in Ghana, andthe difficulty of tracking activities in that sector.
Access to Other Financial ServicesThe banking institutions use remittance transfers as an opportunity tosell formal banking products to customers. The survey revealed thatbanks offer deposits and savings products to both senders and recipientsof remittances. This practice is to be expected because banks usuallywant more customers, and they believe that convincing customers to
Ghana 143
22%
18%
7%
41%
4%4%
4%
electronic funds transfer account-to-account transfers
bank overdrafts checks
money orders
other prepaid debit cards
Figure 5.6 RSP Remittance Instruments
Source: Author’s compilation from 2008 RSP survey in Ghana.
144 Remittance Markets in Africa
Box 5.1
Informal RSP Case Study: A Shoe Seller at Madina Market, Accra
The RSP survey interviewed two informal RSPs: a shoe seller and a pharmacy
operator. The shoe seller, permanently based in Ghana, sells men’s shoes and
clothes, which he usually imports from Italy with the help of a relative who lives in
Italy. He never goes to Italy himself. The relative buys and ships the goods to
Ghana, and the shop owner marks up the prices of the goods before selling them.
The relative in Italy is more interested in the repayment of the sum invested in
buying and shipping the goods than in the profits. To ensure the security of his
investment (in terms of repayment and devaluation effects), the migrant (the per-
son staying in Italy) collects money from friends and close relations who want to
remit money to Ghana and instructs his partner in Ghana to disburse the amount
collected in the local currency, Ghanian cedis (¢).
According to the shop owner, no commission is paid on the transaction. A form
of identification is typically required, and the payment is usually made in the retail
shop, but it is sometimes sent to the houses of the recipients, who normally reside
in Accra and its environs. On average, remittances of up to ¢4,000 ($1=¢1.2) could
be received in a month.
The shop owner revealed that he sometimes pays people before a settlement
is made to his partner in Italy. He began the remittance business about six years
ago and it is growing, but although business is good, he is not ready to venture
into full-time money transfer services.
Source: RSP survey 2008.
open a savings or other current account is easier than advising them toobtain a loan or buy insurance products.
Some nonbank financial institutions, in addition to remittance serv-ices, also provide deposit and savings products geared toward remittancereceivers and senders, including low-end insurance and credit facilitiesfor consumption purposes. Of the banks and other financial institutionssurveyed, only the state-owned banks reported using revenue from sell-ing other financial products to subsidize their remittance services.
Express Funds International noted that it helps both senders and recip-ients of remittances gain access to investment opportunities by providingadvice on Treasury bill and mutual fund rates. The company also offers itscustomers a service package called “MyMorgan Services,” which allows a
sender to allocate remittance funds to a specific purpose in Ghana—suchas purchasing real estate or paying hospital bills or school fees—on behalfof a designated beneficiary and even to invest in financial instrumentssuch as Treasury bills, mutual funds, and certificates of deposit. This prod-uct is popular among Ghanaian migrants in the United Kingdom.
The Regulatory and Business Environment
The Ghanian financial institutions reported that the country’s current lawsand regulations present no major challenges to their business activities,specifically in remittance transmission. Of the surveyed RSPs, 55 percentof the firms perceived these laws as a minor obstacle and 45 percent asno obstacle. Financial sector reforms, described in box 5.2, have made it eas-ier for institutions to engage in remittance services if they meet the regula-tory requirements.
Of all the financial institutions surveyed, most of the firms (89 percent)—including the private commercial banks and the state-owned banks—indicated that they pay no fee to conduct cross-bordermoney transfers. Ghana Post, by its articles of incorporation, is permit-ted to provide money transfer services, but because it is not a bank, itpays a $10,000 annual fee to conduct cross-border money transfers.
Ghana Post noted that, to fulfill anti-money-laundering (AML)requirements, the central bank limits currency exchange holdings andremittance inflows. This may also account for why some banks cited AMLlaws as a significant obstacle to their remittance service businesses. Bycentral bank directive, no cash exceeding $10,000 can be brought into thecountry. More than 90 percent of the RSP firms confirmed that they mustalso file currency transaction reports with the central bank and that thereports are required for any amount. More than 90 percent of the firmsindicated that they report suspicious activities to the central bank as theregulatory authority.
Entry BarriersThe primary regulatory burden for any RSP firm is the central bank’s ¢7million minimum capital requirement. Most of the survey respondentsconsider access to financial infrastructure, a distribution network, andcapital as barriers to starting a remittance service business. Because theserequirements are all within the service provider’s domain, any providerthat can satisfy them would not find obtaining a license to be difficult.The RSP survey respondents ranked AML laws, licensing regulations, and
Ghana 145
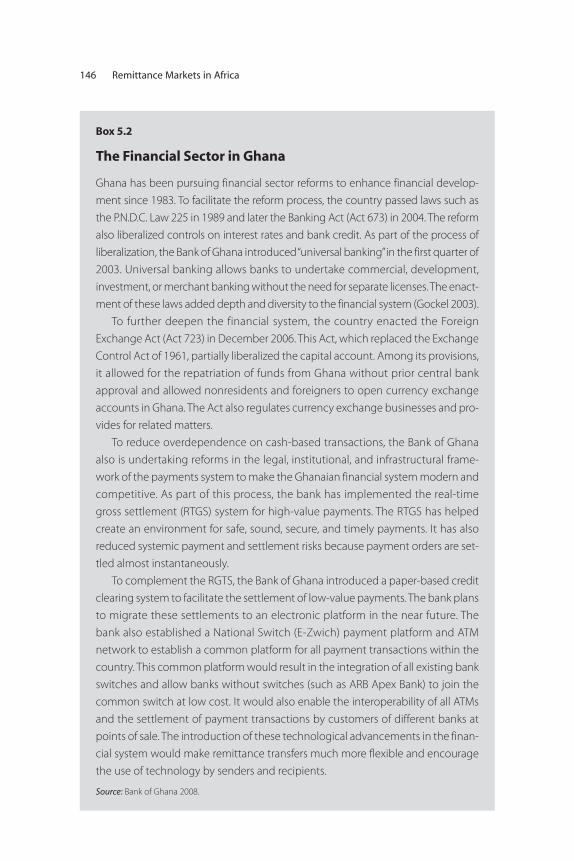
146 Remittance Markets in Africa
Box 5.2
The Financial Sector in Ghana
Ghana has been pursuing financial sector reforms to enhance financial develop-
ment since 1983. To facilitate the reform process, the country passed laws such as
the P.N.D.C. Law 225 in 1989 and later the Banking Act (Act 673) in 2004. The reform
also liberalized controls on interest rates and bank credit. As part of the process of
liberalization, the Bank of Ghana introduced “universal banking” in the first quarter of
2003. Universal banking allows banks to undertake commercial, development,
investment, or merchant banking without the need for separate licenses. The enact-
ment of these laws added depth and diversity to the financial system (Gockel 2003).
To further deepen the financial system, the country enacted the Foreign
Exchange Act (Act 723) in December 2006. This Act, which replaced the Exchange
Control Act of 1961, partially liberalized the capital account. Among its provisions,
it allowed for the repatriation of funds from Ghana without prior central bank
approval and allowed nonresidents and foreigners to open currency exchange
accounts in Ghana. The Act also regulates currency exchange businesses and pro-
vides for related matters.
To reduce overdependence on cash-based transactions, the Bank of Ghana
also is undertaking reforms in the legal, institutional, and infrastructural frame-
work of the payments system to make the Ghanaian financial system modern and
competitive. As part of this process, the bank has implemented the real-time
gross settlement (RTGS) system for high-value payments. The RTGS has helped
create an environment for safe, sound, secure, and timely payments. It has also
reduced systemic payment and settlement risks because payment orders are set-
tled almost instantaneously.
To complement the RGTS, the Bank of Ghana introduced a paper-based credit
clearing system to facilitate the settlement of low-value payments. The bank plans
to migrate these settlements to an electronic platform in the near future. The
bank also established a National Switch (E-Zwich) payment platform and ATM
network to establish a common platform for all payment transactions within the
country. This common platform would result in the integration of all existing bank
switches and allow banks without switches (such as ARB Apex Bank) to join the
common switch at low cost. It would also enable the interoperability of all ATMs
and the settlement of payment transactions by customers of different banks at
points of sale. The introduction of these technological advancements in the finan-
cial system would make remittance transfers much more flexible and encourage
the use of technology by senders and recipients.
Source: Bank of Ghana 2008.
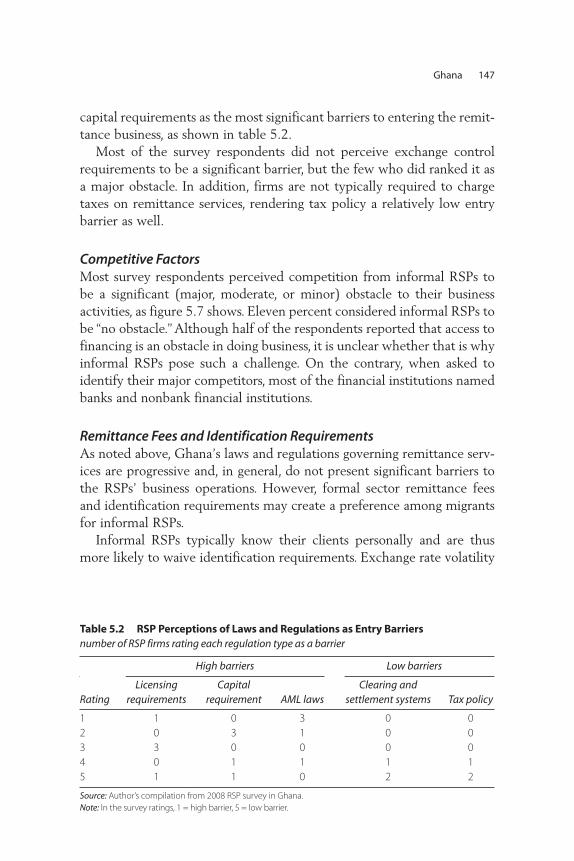
capital requirements as the most significant barriers to entering the remit-tance business, as shown in table 5.2.
Most of the survey respondents did not perceive exchange controlrequirements to be a significant barrier, but the few who did ranked it asa major obstacle. In addition, firms are not typically required to chargetaxes on remittance services, rendering tax policy a relatively low entrybarrier as well.
Competitive FactorsMost survey respondents perceived competition from informal RSPs tobe a significant (major, moderate, or minor) obstacle to their businessactivities, as figure 5.7 shows. Eleven percent considered informal RSPs tobe “no obstacle.” Although half of the respondents reported that access tofinancing is an obstacle in doing business, it is unclear whether that is whyinformal RSPs pose such a challenge. On the contrary, when asked toidentify their major competitors, most of the financial institutions namedbanks and nonbank financial institutions.
Remittance Fees and Identification RequirementsAs noted above, Ghana’s laws and regulations governing remittance serv-ices are progressive and, in general, do not present significant barriers tothe RSPs’ business operations. However, formal sector remittance feesand identification requirements may create a preference among migrantsfor informal RSPs.
Informal RSPs typically know their clients personally and are thusmore likely to waive identification requirements. Exchange rate volatility
Ghana 147
Table 5.2 RSP Perceptions of Laws and Regulations as Entry Barriersnumber of RSP firms rating each regulation type as a barrier
High barriers Low barriers
RatingLicensing
requirementsCapital
requirement AML lawsClearing and
settlement systems Tax policy
1 1 0 3 0 02 0 3 1 0 03 3 0 0 0 04 0 1 1 1 15 1 1 0 2 2
Source: Author’s compilation from 2008 RSP survey in Ghana.Note: In the survey ratings, 1 = high barrier, 5 = low barrier.
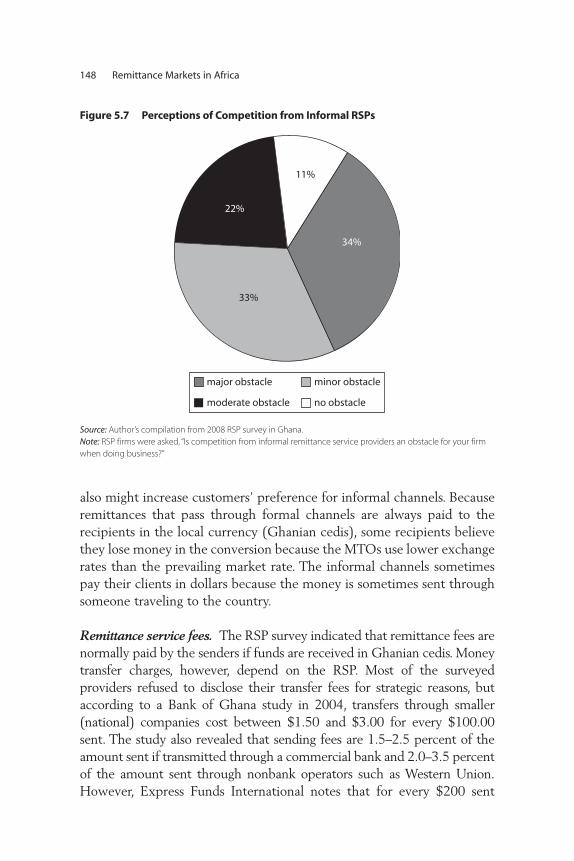
148 Remittance Markets in Africa
Figure 5.7 Perceptions of Competition from Informal RSPs
Source: Author’s compilation from 2008 RSP survey in Ghana.Note: RSP firms were asked, “Is competition from informal remittance service providers an obstacle for your firmwhen doing business?”
no obstacle
major obstacle
moderate obstacle
minor obstacle
11%
34%
33%
22%
also might increase customers’ preference for informal channels. Becauseremittances that pass through formal channels are always paid to therecipients in the local currency (Ghanian cedis), some recipients believethey lose money in the conversion because the MTOs use lower exchangerates than the prevailing market rate. The informal channels sometimespay their clients in dollars because the money is sometimes sent throughsomeone traveling to the country.
Remittance service fees. The RSP survey indicated that remittance fees arenormally paid by the senders if funds are received in Ghanian cedis. Moneytransfer charges, however, depend on the RSP. Most of the surveyedproviders refused to disclose their transfer fees for strategic reasons, butaccording to a Bank of Ghana study in 2004, transfers through smaller(national) companies cost between $1.50 and $3.00 for every $100.00sent. The study also revealed that sending fees are 1.5–2.5 percent of theamount sent if transmitted through a commercial bank and 2.0–3.5 percentof the amount sent through nonbank operators such as Western Union.However, Express Funds International notes that for every $200 sent
from the United Kingdom or the United States, the average fees are 4 per-cent and 5–6 percent, respectively.
Within the informal sector, remittance service fees are difficult toquantify and depend on the agreement between the sender and the agentbringing the money into the country. There are typically no commissioncharges.
Identification requirements. The financial institutions offering remittanceservices always require identification documents—a requirement that pre-vents poor households from using the formal sector. People with littlemeans can afford neither the time nor expense to obtain a passport or adrivers’ license. However, the Electoral Commission of Ghana opened thevoters’ register for the December 2008 elections, and the turnout was high.Henceforth, most recipients will be able to use the voter’s identificationcard that was issued as a form of identification when receiving a transfer.
Conclusions and Recommendations
The introduction of universal banking, as a result of the financial sectorreforms in Ghana, has favored banks in the remittance business. Accordingto the 2008 RSP survey, remittance flows through the banks increasedfrom 2005 through 2007, with the banks increasing their collectivemarket share of the private remittance business. Remittances through non-bank financial institutions decreased from 2005 through 2007, perhapsbecause people have more confidence in the banks or because the bankshave added rural branches. In addition, many of the nonbank financialinstitutions have relatively few branches and thus have to partner with thebanks to transfer money to customers in the rural areas.
The Remittance Instrument OutlookIn general, the remittance industry uses traditional instruments such aselectronic funds transfers, account-to-account transfers, and checks.Money orders and prepaid debit cards are used but are not popularamong the firms. The use of mobile phones for money transfers has notbeen introduced on any significant scale in Ghana even though mobilephone penetration is relatively high.
Nor are Internet transfers prevalent among most financial institutions,partly because the Internet penetration rate in the country is still low.However, customers may be more inclined to use online instruments whenthe fiber-optic backbone is completed and costs are reduced. In addition,
Ghana 149
the Bank of Ghana recently introduced National Switch (E-Zwich) toallow the establishment of a common platform for all payment transac-tions in the country. This would integrate all bank switches and allowbanks without switches to join the common switch at significantlyreduced costs. With the introduction of the E-Zwich card, financial insti-tutions are expected to launch a product that will enable remittancerecipients to access money transfers through the card.
The Regulatory Outlook The RSP survey respondents generally believe that the regulatory envi-ronment affecting remittance services is effective and that the currentlaws and regulations present no major challenges to business operations.Recent financial sector reforms have made it easier for institutions to pro-vide remittance services if they meet the regulatory requirements. Theformal RSPs’ requirement for a reliable form of identification, however,creates business for informal RSPs that do not require such identificationbecause they know their clients on a personal level.
The Remittance Fee OutlookThe survey also revealed that remittance senders usually pay the fees iffunds are received in Ghanian cedis, but the transfer charges vary by RSP.The survey could not gather enough specific information about the com-missions and charges paid by remittance senders, but a 2004 Bank ofGhana study found the charges to be high. Further study of the senders’transaction costs may provide a clearer picture.
The Remittance Source OutlookRemittance volumes from the United States and Canada have beendecreasing since 2005, while those from other regions of the world are onthe rise. U.S. remittances may be declining because of more stringentmoney transfer laws. That constraint notwithstanding, the increase inremittances from all the other regions presents potentially interestingopportunities for RSPs and policy makers.
RecommendationsRSPs provide valuable services in Ghana, significantly increasing thevolume of funds sent by migrants. However, high transfer fees andrestrictions on payment to recipients in foreign currencies are chal-lenges to the MTOs and have allowed informal transfer businesses to
150 Remittance Markets in Africa
thrive. It is therefore important that the monetary authorities provideincentives for people to receive transfers in any currency of their choice.
In addition, outward remittances through MTOs such as WesternUnion are outlawed in Ghana. This prohibition is a major limitation tomigrants who invest in Ghana and would like to transfer funds to theirdestination countries for emergency financial needs. A timely review ofthis policy will be beneficial, especially considering the effects of theglobal financial crisis on migrants.
Notes
1. The two sources’ widely differing figures have not been reconciled. Whereasthe Bank of Ghana bases its estimate on survey data from remittance serviceproviders in Ghana, the World Bank and International Monetary Fund useBalance of Payments estimates.
2. GSS (Ghana Statistical Service) 2000 Population and Housing Census Report.http://www.statsghana.gov.gh/surveys/CENSUS2000/survey0/index.html.
3. The upper end of the range (25 percent) would comprise all uses listed intable 5.1 except for living expenses and school fees.
4. The total is based on United Nations Development Programme 2000 popu-lation data.
5. This migration figure excludes an estimated 22,847 Ghanaians living inGermany during the same period, according to the Organisation forEconomic Co-operation and Development Continuous Reporting System ofMigration.
6. Compilation of data on Ghanaians abroad is ongoing, and the recent datawere obtained in September 2008.
7. GSS (Ghana Statistical Service) 2000 Population and Housing Census Report.http://www.statsghana.gov.gh/surveys/CENSUS2000/survey0/index.html.
8. GSS (Ghana Statistical Service) Ghana Living Standards Survey Round 4,1998–99. http://www.statsghana.gov.gh/surveys/GLSS1998/survey0/index.html.
9. GSS (Ghana Statistical Service) Core Welfare Indicator Questionnaire Report,2003. http://www.statsghana.gov.gh/surveys/CWIQ2003/survey0/index.html.
10. The data apply only to remittances sent through the banking sector andexclude noncash remittances and remittances sent through informal means.
11. The Ghana survey began on May 28, 2008, and was completed on August 9,2008. Follow-up surveys were conducted until November 2008 to supple-ment the information already gathered.
Ghana 151
12. Follow-up telephone calls (mostly to the offices of the chief executives andmanaging directors) were made to ask whether the questionnaire had beenreceived and was being completed. In most cases, the questionnaires weresent to the remittances, treasury, or research and strategic planning depart-ments. Appointments were booked to meet officials charged with complet-ing the questionnaire and to explain the importance of the survey. Becausethe completion of the questionnaire was not part of the officials’ regularduties, at least three phone calls had to be made weekly to remind respon-dents about the urgency of the questionnaire. In addition to the phone calls,weekly visits were made to the respondents’ offices. Another strategy was touse personal contacts at some of the banks to encourage officials to completethe questionnaire. Because of some major gaps in the data gathered from thesurvey, follow-up questionnaires were sent to most of the surveyed RSPs tofill in the gaps.
13. In Ghana, all informal RSPs are illegal because they are not licensed by theBank of Ghana to perform remittance services.
References
Anarfi, J., S. Kwankye, O-M Ababio, and R. Tiemoko. 2003. “Migration from andto Ghana: A Background Paper.” Working Paper C4, Development ResearchCentre on Migration, Globalisation and Poverty, University of Sussex,Brighton, England. http://www.migrationdrc.org/publications/working_papers/WP-C4.pdf.
Asiedu, A. 2005. “Some Benefits of Migrants’ Return Visits to Ghana.” Population,Space and Place 11 (1): 1–11. http://www.geog.sussex.ac.uk/transrede/workshop/IWMP7.pdf.
Bank of Ghana. 2004. “Annual Report 2004.” Bank of Ghana, Accra.
———. 2008. “Annual Report 2008.” Bank of Ghana, Accra.
Black, R., R. King, and R. Tiemoko. 2003. “Migration, Return, and Small EnterpriseDevelopment in Ghana: A Route Out of Poverty?” Working Paper 9, SussexCentre for Migration Research, University of Sussex, Brighton, England.http://www.sussex.ac.uk/migration/documents/mwp9.pdf.
Caldwell, J. C. 1969. African Rural-Urban Migration: The Movement to Ghana’sTowns. New York: Columbia University Press.
EU (European Union). 2005. The Cotonou Agreement, EU, Brussels.
Gockel, A. F. 2003. “Managing the Constraints to Development Finance: IsUniversal Banking the Solution?” Discussant’s comments at the 4th ISSER(Institute of Statistical, Social and Economic Research)-Merchant BankAnnual Economic Lectures, Accra, November 24.
152 Remittance Markets in Africa
Kabki, M. 2007. “Transnational Networks and Economic Principles in RuralCommunities of Origin of Ghanaian Migrants in the Netherlands.” VrijeUniversiteit, Amsterdam.
Maimbo, S. 2003. “The Money Exchange Dealers of Kabul: A Study of the HawalaSystem in Afghanistan.” Working Paper 13, World Bank, Washington, DC.
Mazzucato, V., B. van den Boom, and N. N. N. Nsowah-Nuamah. 2004. “TheImpact of International Remittances on Local Living Standards: Evidence forHouseholds and Rural Communities in Ghana.” Paper presented at the“Conference on Migration and Development in Ghana,” Accra, September14–16.
Orozco, M., M. Bump, R. Fedewa, and K. Sienkiewicz. 2005. “Diasporas, Develop -ment and Transnational Integration: Ghanaians in U.S., U.K. and Germany.”Report commissioned by Citizen International through the U.S. Agency forInternational Development, Institute for the Study of International Migrationand Inter-American Dialogue, Washington, DC. http://www.thedialogue.org/PublicationFiles/Ghanaian%20transnationalism.pdf.
Quartey, P. 2006. “The Impact of Migrant Remittances on Household Welfare inGhana.” AERC Research Paper 158, African Economic Consortium, Nairobi.
Quartey, P., and T. Blankson. 2004. “Do Migrant Remittances Reduce the Impactof Macro-Volatility on Poor Households in Ghana?” Final report to the GlobalDevelopment Network, International Monetary Fund, Washington, DC.http://cloud2.gdnet.org/cms.php?id=research_paper_abstract&research_paper_id=9035.
Sander, C. 2003. “Capturing a Market Share? Migrant Remittance Transfers &Commercialisation of Microfinance in Africa.” Paper prepared for “CurrentIssues in Microfinance” conference, Johannesburg, August 12–14. http://www.dai.com/pdf/Capturing_a_Market_Share.pdf.
Twum-Baah, K. 2005. “Volume and Characteristics of International GhanaianMigration.” In At Home in the World? International Migration and Developmentin Contemporary Ghana and West Africa, ed. T. Manuh, 55–77. Accra: Sub-Saharan Publishers.
World Bank. 2006. Global Economic Prospects. Washington, DC: World Bank.
———. 2008. Migration and Remittances Factbook. Washington, DC: World Bank.
Ghana 153

155155
Cross-border remittance inflows are an increasingly significant source ofdevelopment finance in Kenya. In 2009, recorded remittance inflowsequaled 5 percent of gross domestic product (GDP)—more than theprivate sector raised in capital markets for the corresponding period(World Bank 2011).
Numerous studies have shown a correlation between remittances andpoverty reduction (for example, Gupta, Pattillo, and Wagh 2007; Orozcoand Fedewa 2006; Lucas 2004; Adams and Page 2003). Remittanceinflows also correlate positively to human capital formation (Hanson andWoodruff 2003; Edwards and Ureta 2003). Because remittances enablehouseholds to access formal financial services, including savings productsand credit facilities, they promote financial deepening (Gupta, Pattillo,and Wagh 2007). However, remittances also can distort the functions ofthe formal capital and foreign exchange markets (Chimhowu, Piesse, andPinder 2003).
One analysis of the remittance service provider (RSP) market in Kenyafound service gaps, inefficiencies, and unmet demand, especially amonglow-income groups and micro- and small-business community members(Kabbucho, Sander, and Mukwana 2003). Similarly, most rural residentswere being served by the informal sector. Few of them enjoyed formal
C H A P T E R 6
Kenya
Rose W. Ngugi
banking services—a trend that worsened following the rationalization ofbank branches in the mid-1990s, when many banks closed their ruralbranches (FinScope Kenya 2007).
However, a follow-up study (FinScope Kenya 2007) found that themobile-phone money transfer service M-PESA—which entered thedomestic remittance market in 2007—had become the most popularmode of money transfer in the domestic market. This branchless bankingservice was developed for mobile telecom company Vodafone and is nowthe largest mobile-phone money transfer operator in Africa. M-PESAoffers domestic money transfer services in Kenya and is currently work-ing with Western Union to kick off cross-border money transfer services.In 2009, mobile telecommunications provider Zain also entered the mar-ket by offering mobile-phone money transfer services.
This chapter examines the money transfer services in Kenya, coveringthe type and scope of services offered; the networking arrangements; thecompetitive factors affecting the RSPs; and the opportunities to furtherimprove remittance services. The chapter also explores the possibility ofenhancing financial service access in the course of providing remittanceservices. Although remittances could be classified as person-to-person orbusiness-to-business transactions, this analysis does not do so because theRSPs report remittances as total money transfers. The RSPs survey uponwhich this study is based was carried out in 2008; since then, developmentshave included the expansion of M-PESA services and the entry of Zain.
Remittance and Migration Trends
The major findings from this study highlight the following remittanceindustry trends:
• Data collection. Remittance data collection in Kenya is not a well-developed process. Only recently (in 2006) were banks requested bythe central bank to collect remittance-flow data.
• RSP types. A diverse range of formal and informal providers offerremittance services. Among the new entrants, M-PESA and Zain arerevolutionizing the domestic and international money transfer mar-kets with popular mobile-phone money transfer services.
• Partnerships. RSP networks and partnerships are based on comple-mentary functions. Except for the community-based and transport-company RSPs, all providers have links to the banking sector. Morerecently (since 2008), however, banks have become more integratedwith M-PESA and Zain by extending their financial services.
156 Remittance Markets in Africa
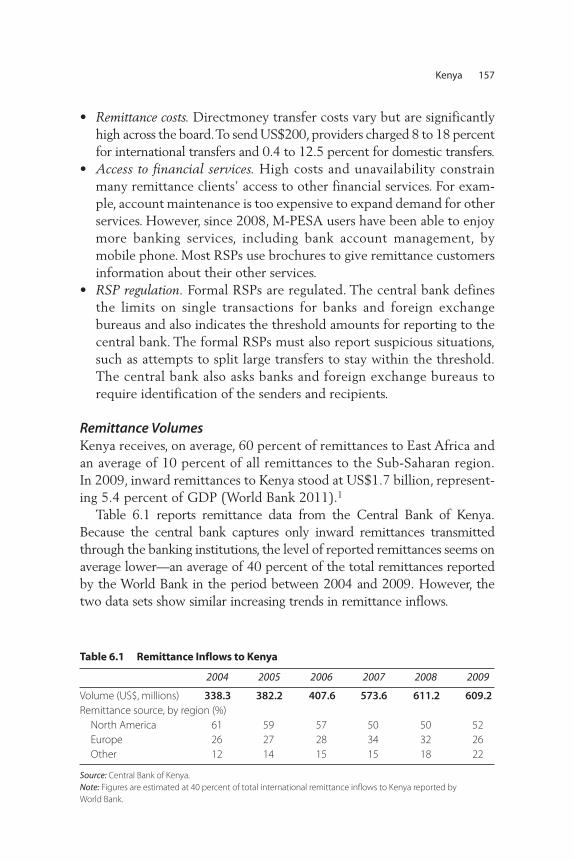
• Remittance costs. Directmoney transfer costs vary but are significantlyhigh across the board. To send US$200, providers charged 8 to 18 percentfor international transfers and 0.4 to 12.5 percent for domestic transfers.
• Access to financial services. High costs and unavailability constrainmany remittance clients’ access to other financial services. For exam-ple, account maintenance is too expensive to expand demand for otherservices. However, since 2008, M-PESA users have been able to enjoymore banking services, including bank account management, bymobile phone. Most RSPs use brochures to give remittance customersinformation about their other services.
• RSP regulation. Formal RSPs are regulated. The central bank definesthe limits on single transactions for banks and foreign exchangebureaus and also indicates the threshold amounts for reporting to thecentral bank. The formal RSPs must also report suspicious situations,such as attempts to split large transfers to stay within the threshold.The central bank also asks banks and foreign exchange bureaus torequire identification of the senders and recipients.
Remittance VolumesKenya receives, on average, 60 percent of remittances to East Africa andan average of 10 percent of all remittances to the Sub-Saharan region.In 2009, inward remittances to Kenya stood at US$1.7 billion, represent-ing 5.4 percent of GDP (World Bank 2011).1
Table 6.1 reports remittance data from the Central Bank of Kenya.Because the central bank captures only inward remittances transmittedthrough the banking institutions, the level of reported remittances seems onaverage lower—an average of 40 percent of the total remittances reportedby the World Bank in the period between 2004 and 2009. However, thetwo data sets show similar increasing trends in remittance inflows.
Kenya 157
Table 6.1 Remittance Inflows to Kenya
2004 2005 2006 2007 2008 2009
Volume (US$, millions) 338.3 382.2 407.6 573.6 611.2 609.2Remittance source, by region (%)
North America 61 59 57 50 50 52Europe 26 27 28 34 32 26Other 12 14 15 15 18 22
Source: Central Bank of Kenya. Note: Figures are estimated at 40 percent of total international remittance inflows to Kenya reported by World Bank.
Destinations of MigrantsAs of 2005, the number of emigrants from Kenya stood at 427,324, or1.2 percent of Kenya’s population (Ratha and Xu 2008). Their primarydestinations include (in descending order) the United Kingdom (33.7percent), Tanzania (25.6 percent), the United States (11.3 percent),Uganda (7.7 percent), Canada (5.2 percent), Germany (1.7 percent),and Australia (1.6 percent).
Migration to the United Kingdom has a historical link, given that Kenyais a former British colony. Kenyan migrants to Tanzania and Uganda aretaking advantage of the opportunities in those two neighboring economies.Economic links between Kenya and these other East African Community2
members are extensive; for example, about 25 percent of foreign directinvestment in Tanzania and Uganda originates in Kenya.
Internal migration is driven largely by the need for business or employ-ment opportunities, resources such as land, or a peaceful environmentduring times of insecurity. In Kenya, 19 percent of domestic migrantsseek employment opportunities, 9.4 percent seek business ventures, and7 percent seek land (KIHBS 2005).
Migrants seeking work have migrated to industrial or urban areas suchas Nairobi, Mombasa, and Nakuru. The Rift Valley region in Kenya is amajor destination in the search for land. Migrants who find formal sectoremployment elsewhere in the country often use the formal sector RSPssuch as banks and nonbank financial institutions to send money to theirfamilies, mainly for upkeep and settlement of school tuition. Migrantswho find work in the informal sector are more likely to send money homevia taxi and bus companies, or with traveling relatives and friends, or tocarry it themselves when they return home to visit their families.
Characteristics of the Remittance Industry
This research involved collecting primary and secondary data (wherepossible) from providers of remittances and also conducting specificcase studies for M-PESA, the transport industry, and the community-based Hawala. The sample was selected to represent all the segments ofthe market, but without a clear picture of the population, especially ofthe informal sector, the sample was selected purposively. The sampleincluded, banks, foreign currency exchanges, savings and credit cooper-ative organizations (SACCOs), microfinance institutions (MFIs), theKenya Post Office Savings Bank (Postbank), the Postal Corporation of
158 Remittance Markets in Africa
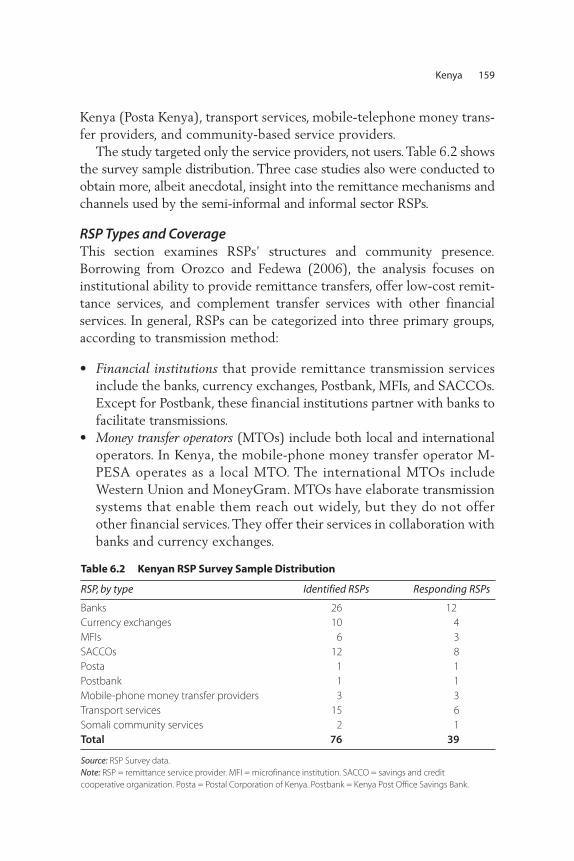
Kenya (Posta Kenya), transport services, mobile-telephone money trans-fer providers, and community-based service providers.
The study targeted only the service providers, not users. Table 6.2 showsthe survey sample distribution. Three case studies also were conducted toobtain more, albeit anecdotal, insight into the remittance mechanisms andchannels used by the semi-informal and informal sector RSPs.
RSP Types and CoverageThis section examines RSPs’ structures and community presence.Borrowing from Orozco and Fedewa (2006), the analysis focuses oninstitutional ability to provide remittance transfers, offer low-cost remit-tance services, and complement transfer services with other financialservices. In general, RSPs can be categorized into three primary groups,according to transmission method:
• Financial institutions that provide remittance transmission servicesinclude the banks, currency exchanges, Postbank, MFIs, and SACCOs.Except for Postbank, these financial institutions partner with banks tofacilitate transmissions.
• Money transfer operators (MTOs) include both local and internationaloperators. In Kenya, the mobile-phone money transfer operator M-PESA operates as a local MTO. The international MTOs includeWestern Union and MoneyGram. MTOs have elaborate transmissionsystems that enable them reach out widely, but they do not offerother financial services. They offer their services in collaboration withbanks and currency exchanges.
Kenya 159
Table 6.2 Kenyan RSP Survey Sample Distribution
RSP, by type Identified RSPs Responding RSPs
Banks 26 12 Currency exchanges 10 4MFIs 6 3SACCOs 12 8Posta 1 1Postbank 1 1Mobile-phone money transfer providers 3 3Transport services 15 6Somali community services 2 1Total 76 39
Source: RSP Survey data. Note: RSP = remittance service provider. MFI = microfinance institution. SACCO = savings and credit cooperative organization. Posta = Postal Corporation of Kenya. Postbank = Kenya Post Office Savings Bank.
• Community-based systems are based on social networks that generallyuse physical money transfers or systems that “float” funds without anelaborate transmission procedures (as some transport companiesoffer). They offer both domestic and international transfer services buttend not to offer other financial services. Examples of community-based systems include friends, relatives, village members, transportservices owned by community members, and traditional Somalicommunity-based systems.
Financial institutions. Although a diverse array of firms provide remit-tance services, the RSP survey indicates that the banking sector dominatesthe market, handling more than 80 percent of the volumes, especiallybecause banks conduct international transfers. In the local money transfersservices, though, banks face competition from other financial institutions—MFIs, SACCOs, currency exchanges, and Postbank—and the mobile-phoneMTO, M-PESA.
The international banks, because of their reach, dominate the remit-tance services market. The largest five international banks account formore than 30 percent of the remittance flow into Kenya, whereas the topfive local banks have a 10 percent share of the market.
Postbank was set up with a key objective to help alleviate poverty byencouraging thrift among the small savers. Its close partnership withPosta enables it to penetrate deeply into rural areas. Postbank also is themain agent for Western Union. Cooperative Bank of Kenya (includingthe SACCOs) partners with the MoneyGram and has a market share ofabout 8 percent.
The distribution of banking activities, detailed in table 6.3, shows con-centration in major towns and minimal outreach into the rural areas,. InKenya, despite the rapid expansion of bank branches—from 512 in 2003to 740 in 2007—the distribution is highly skewed geographically. NairobiProvince has both the highest number of bank branches and the highestpercentage of the population with bank accounts. North Eastern Provincehas the most limited financial services. Therefore, even for local transfers,many clients have limited choices because only a few can use facilitiesthat require bank accounts. Banks’ inaccessibility to rural populationsmay have led clients there to rely heavily on the informal sector (includ-ing the community-based and transport systems) for money transfers.
MTOs. The MTOs work in partnership with banks, currency exchanges,and Postbank. Thus, their distribution is proportional to the availability of
160 Remittance Markets in Africa
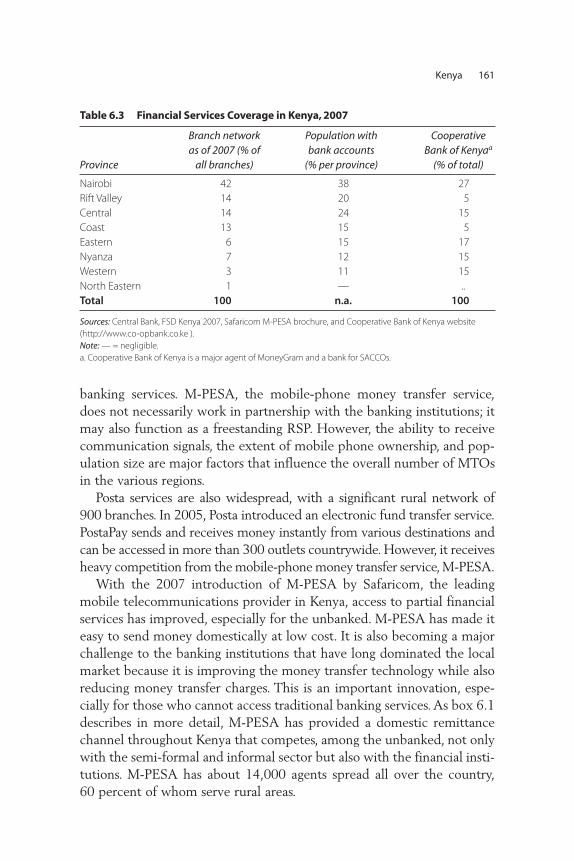
banking services. M-PESA, the mobile-phone money transfer service,does not necessarily work in partnership with the banking institutions; itmay also function as a freestanding RSP. However, the ability to receivecommunication signals, the extent of mobile phone ownership, and pop-ulation size are major factors that influence the overall number of MTOsin the various regions.
Posta services are also widespread, with a significant rural network of900 branches. In 2005, Posta introduced an electronic fund transfer service.PostaPay sends and receives money instantly from various destinations andcan be accessed in more than 300 outlets countrywide. However, it receivesheavy competition from the mobile-phone money transfer service, M-PESA.
With the 2007 introduction of M-PESA by Safaricom, the leadingmobile telecommunications provider in Kenya, access to partial financialservices has improved, especially for the unbanked. M-PESA has made iteasy to send money domestically at low cost. It is also becoming a majorchallenge to the banking institutions that have long dominated the localmarket because it is improving the money transfer technology while alsoreducing money transfer charges. This is an important innovation, espe-cially for those who cannot access traditional banking services. As box 6.1describes in more detail, M-PESA has provided a domestic remittancechannel throughout Kenya that competes, among the unbanked, not onlywith the semi-formal and informal sector but also with the financial insti-tutions. M-PESA has about 14,000 agents spread all over the country, 60 percent of whom serve rural areas.
Kenya 161
Table 6.3 Financial Services Coverage in Kenya, 2007
Province
Branch network as of 2007 (% of
all branches)
Population withbank accounts
(% per province)
Cooperative Bank of Kenyaa
(% of total)
Nairobi 42 38 27Rift Valley 14 20 5Central 14 24 15Coast 13 15 5Eastern 6 15 17Nyanza 7 12 15Western 3 11 15North Eastern 1 — ..Total 100 n.a. 100
Sources: Central Bank, FSD Kenya 2007, Safaricom M-PESA brochure, and Cooperative Bank of Kenya website(http://www.co-opbank.co.ke ). Note: — = negligible. a. Cooperative Bank of Kenya is a major agent of MoneyGram and a bank for SACCOs.
162 Remittance Markets in Africa
Box 6.1
The M-PESA Money Transfer System
Kenya is the first country in Africa to use M-PESA—a Safaricom service (in partner-
ship with Vodafone) that provides a fast, safe, and affordable way to transfer money
by mobile phone. Through M-PESA, one can deposit, withdraw, or transfer (send)
money; buy Safaricom prepaid airtime; or pay utility bills. The high number of
Safaricom airtime subscribers gives M-PESA a wide network, with more than 14,000
agents countrywide and 10 million customers. M-PESA is a domestic money trans-
fer system operating only within Kenya. Customers choose M-PESA because it is
convenient, efficient, fast, and cheap and provides a 100 percent guarantee that
the money will be delivered. M-PESA customers can transfer money to any other
network and can send money to or receive money from (unlike other means of
money transfer) any part of the country 24 hours a day. They can also keep money
in their phones and withdraw it, send it, or pay bills at their convenience.
An explanation of M-PESA operations must begin with its national network of
about 14,000 agents, who register customers and process cash deposits and with-
drawals on their behalf.a All agents have an existing business—for example, selling
groceries, Safaricom airtime, or fuel—so they already deal in cash. They purchase a
mobile money (e-money) float from M-PESA with a cash deposit. They also main-
tain a real cash float.
As cash-in/cash-out points, from the customer’s standpoint, the agents func-
tion much like human automated teller machines (ATMs). As they buy and sell this
e-money, they earn a commission for each customer transaction. M-PESA cus-
tomers can send up to K Sh 35,000 per transaction and keep up to K Sh 50,000 in
a virtual account. There is no minimum balance required, no monthly fees, and no
hidden charges. The maximum account balance is 50,000 K Sh, and the maximum
daily transaction is 70,000 K Sh.
An M-PESA money transfer involves these basic steps:
1. If not already registered, a customer can register for free at any M-PESA agent.
Nonregistered customers may receive but cannot send money unless the
agents allow them to use their account; MPESA is only for Safaricom customers
at the moment. Although customers may deposit funds in an M-PESA account
for free, registered customers pay lower withdrawal fees. All one needs to reg-
ister is a Safaricom SIM card, a mobile telephone, and an original ID or passport.
2. The sender hands funds to an attendant at an M-PESA agent (including
either Safaricom dealers or other registered businesses such as gas stations,
(continued)
Community-based systems. The transport system emerged because var-ious groups of the society found themselves without access to financialservices. Thus, transport services came in to fill a gap, particularly wherecommunication is a challenge and banking services are thin. Althoughtransport services are licensed specifically for package and parcel deliveryand not for funds transfer, the social networks on which they are basedhave facilitated their emergence, as box 6.2 describes.
Kenya has another community-based system, especially among theSomali community, that evolved because of the breakdown of law andorder that led Somalis to emigrate to various parts of the world. This elab-orate system for maintaining ties with their relatives back home is calledhawala. Box 6.3 explains how hawala remittances work.
Partnerships and Agreement with MTOsAlmost all of the RSPs network with banks. Local banks establish partner-ships with foreign corresponding banks to cover international transfer
Kenya 163
Box 6.1 (continued)
supermarkets, and retail outlets), who converts the funds into mobile money
(e-money).
3. The agent transfers the e-money by text to the recipient.
4. The recipient withdraws the funds as cash at another M-PESA agent’s location.
The transfer of money through the phone in Kenya is not regulated at all.
After assessing the operations of the Safaricom and Zain communication com-
panies, the Central Bank of Kenya found that there is little or no risk involved and
issued them a “letter of no objection” to operate. There is the danger of sending
cash to the wrong number and the recipient redeeming it straight away. How-
ever, disputes have been rare except in the case of network problems; when
they occur, Safaricom has sorted out the matter directly with customers.
The future of M-PESA is bright because the service is convenient; customers
can send money from any point within Kenya at any time. M-PESA is moving
toward e-banking whereby money can be moved from bank accounts to the
M-PESA virtual account. The growth in M-PESA use implies there is a huge market.
Furthermore, it is affordable to low-income customers, who are the majority of
the population.
Source: RSP Survey. a. The Safaricom M-PESA website provides greater detail about its operations. http://www.safaricom.co.ke/index.php?id=747.
164 Remittance Markets in Africa
Box 6.2
Transport Industry and Money Transfer Services in Kenya
People have sent and received money through the Kenyan transport system for a
long time. During the colonial period and after independence, many Kenyans
moved from rural to urban areas to seek work, leaving their families behind. Given
the lack of banking infrastructure in the rural areas, the only options for sending
money home were buses, matatus (Kenyan public transportation), and traveling
friends and relatives. Businesspeople send money this way to relatives in the
urban areas who, in turn, buy business merchandise and send it back as luggage.
Parents also use the transport system to send pocket money and fees to their
children in schools and colleges.
Customers view this method as convenient because the transactions are less
cumbersome than in the formal sector; no bank accounts or long, complicated
forms are required. Survey respondents believe that this system uniquely reaches
most of the poor, who live in underdeveloped areas with poor roads, communi-
cations, and banking infrastructure. By contrast, the transport system is efficient
and more personalized. The vehicle operators are generally well-known villagers
whom customers trust with money parcels. However, the entry of long-distance
route operators into the business has made it possible for migrants throughout
Kenya to use transport services for money transfers, and this expansion is weak-
ening the role of personal relationships and increasing the need for a well-defined
market operation.
The particulars of money transfers through the transport system differ from
one region to another. In some areas, the locals make arrangements with the
vehicle drivers who ply their major routes. The drivers receive money from rela-
tives in the urban areas and deliver it to the rural recipients. This option is favored
mostly by people who live in the country’s interior, where the banking or mobile
phone networks are poor or nonexistent. Senders enclose the money in an enve-
lope, confirm the amount with the driver, and pay the driver a commission of
K Sh 100, called a “stamp.” No identification is required because this system is used
by parties who know and trust each other. No inventories are kept.
A high risk of robbery and thefts on the roads, however, has caused other
transport companies to introduce a new money transfer method in which the
paying clerks on either end of the route keep an inventory, called a “float,” to pay
recipients even before the actual money has been received. The sending office
gives the sender a receipt and directs the receiving office, by phone, to pay
the recipient. The sender typically makes the transfer, and pays the fee (typically,
(continued)
Kenya 165
10 percent of the amount sent), through the driver or conductor. The amount
charged also covers the risk, because if the money gets lost, the accumulated fees
cover compensation. (Those companies that transfer money purely on the basis
of trust do not provide compensation; in such cases, the sender incurs the loss.)
To receive the money, the recipient can produce a national identity card, a pass-
port, or a driver’s license to the paying clerk for identification.
Money transfer through the transport system is unregulated. Most transport
companies register with the Communication Commission of Kenya to operate as
couriers (of parcels only) and join the money transport business behind the
scenes. However, the survey respondents agreed that the informal sector could
be regulated if the government were to develop adequate road, communication,
and banking infrastructure that would make the process affordable and efficient
to most Kenyans.
Source: RSP Survey.
Box 6.3
Hawala: The Somali Community-Based Remittance System
The indigenous Somali community-based money transfer system started many
years ago, but it expanded in the 1980s after many Somalis fled to seek asylum in
other countries.
Until recently, with the introduction of Muslim banks, the Somali community
opposed traditional banking because Islamic law prohibits the payment or
acceptance of interest. Hawala offers the advantages of convenience (operating
in close proximity to the Muslim community); trust (embedded in the Muslim
belief that people do not steal); and unregulated, tax-free status.
Anyone can send money through the hawala system, and the business in
Kenya is thriving—especially in the Eastleigh suburb of Nairobi, where about 90
percent of the residents are of Somali origin. The major hawala agencies include
Dahabshiil (goldmine), Barowaaqo, Frontier, and AMAL Express. Al-Barakat was
the biggest company operating globally, but after the U.S. Embassy bombing on
August 7, 1998, its accounts were frozen, immobilizing its activities. Several entre-
preneurs own these agencies, whose branch networks extend to Australia;
France; Germany; Hong Kong SAR, China; Indonesia; Malaysia; the Middle East;
(continued)
Box 6.2 (continued)
166 Remittance Markets in Africa
the Netherlands; the Republic of Korea; Scandinavia; South Africa; Uganda; and the
United Kingdom, in addition to the major towns and cities in Kenya.
Because government laws and regulations govern the formal remittance
industry, the Somali money transfer dealers have opened currency exchanges as
front offices to conduct legal money transactions; behind the scenes, however, a
lot of money transfers use the community-based systems. Thus currency
exchanges then operate as central points for other small hawala agencies. They
communicate by radio (in the remote parts of northeastern Africa and Somalia),
fax, mobile phones, e-mail, and the Internet. Most of the hawala agencies have
different branches in different parts of the world and, in the case of money trans-
fer, the person in charge of the agency on the other end is authorized to pay the
recipient. The sending agency calls the receiving agency and provides the recipi-
ent’s transaction number and telephone number and the amount being trans-
ferred. The receiving agent calls the recipient and tells him or her where to collect
the money. The recipient must produce identification; however, a third party may
receive money on behalf of the recipient if there is a witness, especially an elder.
The sender pays the fee, which depends on the amount of money sent. For every
US$100 (K Sh 6,300) sent, the sender must pay US$6 (K Sh 378) as commission. As
the amount increases, the average commission rate decreases. The recipient is
paid in Kenya shillings (K Sh), the local currency.
These businesses are usually located near large Somali populations. Remittances
are paid in cash, in total confidence, and there is no complex documentation. The
agency owner keeps a simple ledger, and customer service is adequate. Liquidity to
the Somali money transfer agencies is not a problem because they always have
money with them. Sometimes, the agencies transport huge sums by bus. They
are accountable only to themselves, and if there is a crackdown on the business,
everyone loses—both dealer and sender—with no means of compensation. If a
remittance is issued with fake currencies, Somalis resolve the issue by traditional
means, resolving disputes internally to keep the matter from leaking out to the
authorities.
These agencies compete among themselves. At the moment, several of them
are mushrooming in number because the business is so lucrative. Without any
formal framework, neither do regulations govern this sector—and whether the
Somali agents would want it regulated is uncertain.
Source: RSP Survey.
Box 6.3 (continued)
corridors. Generally the SACCOs work with the Cooperative Bank ofKenya. The banks also work with MTOs such as Western Union,MoneyGram, Mastrex International, XpressMoney, Instant Cash, andAmerican Express.
For their part, the international MTOs collaborate with local banks andcurrency exchanges. For example, Western Union’s major agent in Kenyais Postbank, and it also works with other banks and currency exchanges.MoneyGram’s main agents in Kenya include the Cooperative Bank andDiamond Trust Bank.
The range of services that RSPs can offer in Kenya depends on theirnetworks and access to payment systems—the latter of which are limitedto members of the Kenya Bankers Association. Nonmembers—which donot have access to the payment systems—include the MFIs, Postbank,SACCOs, currency exchanges, and MTOs. Although the central bank caneasily monitor the payment system, remittance industry regulations maybe weakened if the designated authorities fail to enforce them and if thetransactions are conducted outside of the national payment system. Forexample, the central bank expects the dealer banks to ensure that the cur-rency exchanges comply with statutory limits. However, because theexchanges collaborate with the MTOs, which do not fall under centralbank statutory management, compliance is difficult to monitor.Furthermore, because the transactions are not centralized, clients are freeto use alternative institutions to make their desired transfers.
Banks located in the local market have international correspondentbanks and Society for Worldwide Interbank Financial Telecommunication(SWIFT) membership. As such, they can offer remittance services abroadand cross-border settlement services. Thus, if banks had adequate branchnetworks throughout the country, all clients could access internationalremittance services more easily.
Posta and Postbank offer more services than the courier and transportcompanies, SACCOs, MFIs, and M-PESA. For example, Posta’s PostaPaysystem can offer instant international remittance services and settlementservices. Posta Kenya’s partnership with Posta Tanzania and Posta Uganda,through the Universal Postal Union network, enabled Posta to serve awider remittance corridor. Postbank works closely with Western Union,enabling its participation in the international remittance services.Postbank is not a member of the national payment system and thereforecannot provide settlement services. Similarly, the Somali community-based (hawala) services offer both cross-border and domestic remittanceservices. However, MFIs, M-PESA, SACCOs, and transport systems
Kenya 167
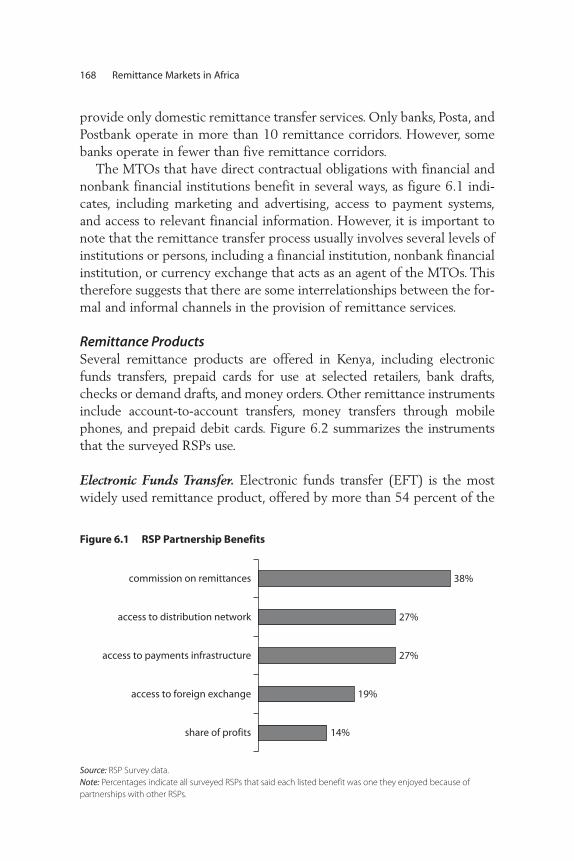
168 Remittance Markets in Africa
provide only domestic remittance transfer services. Only banks, Posta, andPostbank operate in more than 10 remittance corridors. However, somebanks operate in fewer than five remittance corridors.
The MTOs that have direct contractual obligations with financial andnonbank financial institutions benefit in several ways, as figure 6.1 indi-cates, including marketing and advertising, access to payment systems,and access to relevant financial information. However, it is important tonote that the remittance transfer process usually involves several levels ofinstitutions or persons, including a financial institution, nonbank financialinstitution, or currency exchange that acts as an agent of the MTOs. Thistherefore suggests that there are some interrelationships between the for-mal and informal channels in the provision of remittance services.
Remittance ProductsSeveral remittance products are offered in Kenya, including electronicfunds transfers, prepaid cards for use at selected retailers, bank drafts,checks or demand drafts, and money orders. Other remittance instrumentsinclude account-to-account transfers, money transfers through mobilephones, and prepaid debit cards. Figure 6.2 summarizes the instrumentsthat the surveyed RSPs use.
Electronic Funds Transfer. Electronic funds transfer (EFT) is the mostwidely used remittance product, offered by more than 54 percent of the
14%
19%
27%
27%
38%
share of profits
access to foreign exchange
access to payments infrastructure
access to distribution network
commission on remittances
Figure 6.1 RSP Partnership Benefits
Source: RSP Survey data. Note: Percentages indicate all surveyed RSPs that said each listed benefit was one they enjoyed because of partnerships with other RSPs.
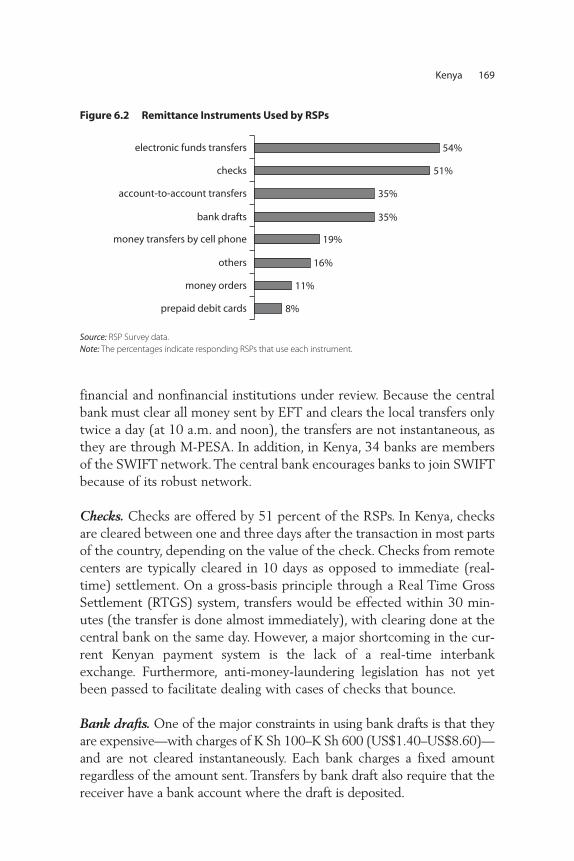
Kenya 169
financial and nonfinancial institutions under review. Because the centralbank must clear all money sent by EFT and clears the local transfers onlytwice a day (at 10 a.m. and noon), the transfers are not instantaneous, asthey are through M-PESA. In addition, in Kenya, 34 banks are membersof the SWIFT network. The central bank encourages banks to join SWIFTbecause of its robust network.
Checks. Checks are offered by 51 percent of the RSPs. In Kenya, checksare cleared between one and three days after the transaction in most partsof the country, depending on the value of the check. Checks from remotecenters are typically cleared in 10 days as opposed to immediate (real-time) settlement. On a gross-basis principle through a Real Time GrossSettlement (RTGS) system, transfers would be effected within 30 min-utes (the transfer is done almost immediately), with clearing done at thecentral bank on the same day. However, a major shortcoming in the cur-rent Kenyan payment system is the lack of a real-time interbankexchange. Furthermore, anti-money-laundering legislation has not yetbeen passed to facilitate dealing with cases of checks that bounce.
Bank drafts. One of the major constraints in using bank drafts is that theyare expensive—with charges of K Sh 100–K Sh 600 (US$1.40–US$8.60)—and are not cleared instantaneously. Each bank charges a fixed amountregardless of the amount sent. Transfers by bank draft also require that thereceiver have a bank account where the draft is deposited.
8%
11%
16%
19%
35%
35%
51%
54%
prepaid debit cards
money orders
others
money transfers by cell phone
bank drafts
account-to-account transfers
checks
electronic funds transfers
Figure 6.2 Remittance Instruments Used by RSPs
Source: RSP Survey data. Note: The percentages indicate responding RSPs that use each instrument.
Account-to-account transfers. Most banks (35 percent of all respondingRSPs) also offer account-to-account money transfers, although this instru-ment requires both the sender and the receiver to have access to a bankand the receiver to have a bank account. It also requires that a bank beable to network with all its branches, a feat made easier by technologicaldevelopment. Although banks do not charge to deposit funds in anotherpersonal account, the Know-Your-Customer (KYC) policy requires thesender to declare the sender and recipient names and contact information.Some banks can finalize the transaction instantly; others the followingday. With the entry of M-PESA into the market, competitive pressureshave pushed the banks to speed up their account-to-account transfers.
Direct debit. The Kenya Bankers Association introduced direct debit asa means of payment in 2003. However, few RSPs indicated they use thistool for remittance transfers. Direct debits are used primarily to payinsurance premiums, purchase installments, utility bills, and mortgagepayments.
Money orders. Posta, the only RSP that issues money orders for remit-tances, uses postal orders; interstate orders (tailored for use in Kenya,Tanzania, and Uganda); and international money orders (currentlyavailable for transfers only between Kenya and South Africa). Ordinarymoney orders identify the recipient and can be cashed only at specifiedpost offices. They can be drawn for any amount up to K Sh 35,000(US$500) per order. Telegraphic money orders guarantee customerssame-day value, while a postal order is a bearer instrument that can becashed at any post office. Posta is one of the most accessible RSPs,given its large distribution network that reaches almost every village inthe country.
Mobile-phone money transfers. As described in box 6.1, the mobile-phone money transfer facility M-PESA currently offers domestic servicesbased on virtual (e-money) accounts to facilitate transactions between twoparties. Plans are under way to enter the international market as well.
Access to Other Financial ServicesBoth banks and nonbank financial institutions provide several servicesgeared specifically toward the senders and receivers of remittances(box 6.4). The most widely offered services include deposits, other savings products, and credit facilities for consumers and small and large
170 Remittance Markets in Africa
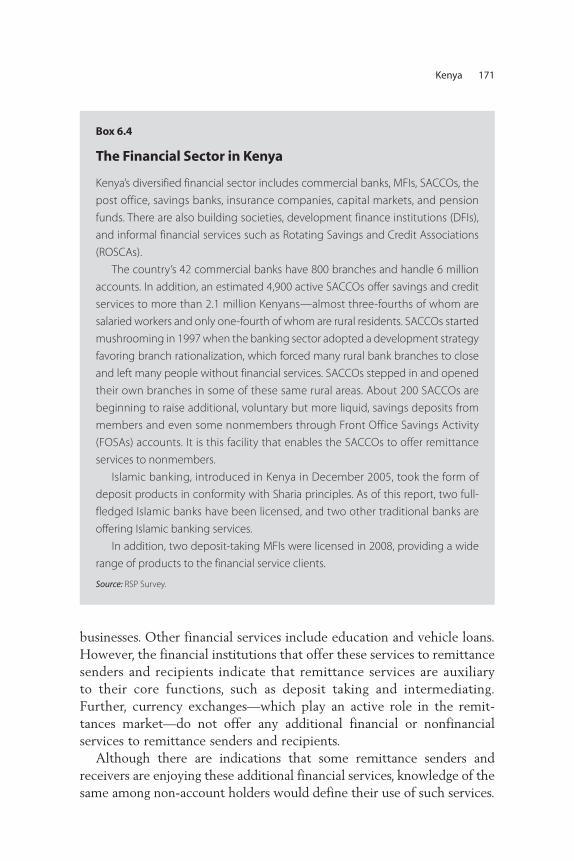
Kenya 171
businesses. Other financial services include education and vehicle loans.However, the financial institutions that offer these services to remittancesenders and recipients indicate that remittance services are auxiliaryto their core functions, such as deposit taking and intermediating.Further, currency exchanges—which play an active role in the remit-tances market—do not offer any additional financial or nonfinancialservices to remittance senders and recipients.
Although there are indications that some remittance senders andreceivers are enjoying these additional financial services, knowledge of thesame among non-account holders would define their use of such services.
Box 6.4
The Financial Sector in Kenya
Kenya’s diversified financial sector includes commercial banks, MFIs, SACCOs, the
post office, savings banks, insurance companies, capital markets, and pension
funds. There are also building societies, development finance institutions (DFIs),
and informal financial services such as Rotating Savings and Credit Associations
(ROSCAs).
The country’s 42 commercial banks have 800 branches and handle 6 million
accounts. In addition, an estimated 4,900 active SACCOs offer savings and credit
services to more than 2.1 million Kenyans—almost three-fourths of whom are
salaried workers and only one-fourth of whom are rural residents. SACCOs started
mushrooming in 1997 when the banking sector adopted a development strategy
favoring branch rationalization, which forced many rural bank branches to close
and left many people without financial services. SACCOs stepped in and opened
their own branches in some of these same rural areas. About 200 SACCOs are
beginning to raise additional, voluntary but more liquid, savings deposits from
members and even some nonmembers through Front Office Savings Activity
(FOSAs) accounts. It is this facility that enables the SACCOs to offer remittance
services to nonmembers.
Islamic banking, introduced in Kenya in December 2005, took the form of
deposit products in conformity with Sharia principles. As of this report, two full-
fledged Islamic banks have been licensed, and two other traditional banks are
offering Islamic banking services.
In addition, two deposit-taking MFIs were licensed in 2008, providing a wide
range of products to the financial service clients.
Source: RSP Survey.
172 Remittance Markets in Africa
For example, over 60 percent of the financial and nonfinancial institutionssurveyed indicate that the remittance transfer recipient must be anaccount holder of the institution. Most of the providers offer financial lit-eracy materials, including brochures, magazines, pamphlets, and posters.It would be interesting to find out how aware senders and receivers are ofthese other services and how much they use them.
These additional financial services have associated costs for remittancecustomers. For example, the charges for maintaining a deposit accountinclude maintenance of a minimum balance, the ledger fee, withdrawalcharges, and statements. For instance, the average monthly charges formaintaining an account with banks in Kenya range between K Sh 30 andK Sh 300 (US$0.40–US$4.30) for withdrawals and K Sh 100 and K Sh 2,000 (US$1.40–US$29.00) for monthly ledger fees if the accountbalance goes below a designated minimum, which varies by institutionbetween K Sh 3,000 and K Sh 50,000 (US$42–US$714).
The Regulatory and Business Environment
Market regulation incorporates self-regulation, which guides members’operations. Statutory regulation is expected to protect the customer byspelling out the rules of the game
The central bank regulates banks, deposit-taking MFIs, and currencyexchanges. However, MTOs, SACCOs, non-deposit-taking MFIs, transportservices, and mobile-telephone transfers are not under central bank or anyother statutory regulation. The challenge in the market, therefore, is mon-itoring the activities of those providers that operate outside any statutoryregulatory framework, especially to ensure that clients are protected.Although no serious issues have been reported with these services, consid-ering the increasing size of market share they are commanding, it isimportant to ensure that activities in the remittance market have a cen-tralized point of authority that facilitates monitoring and ensures that setguidelines are followed without circumvention by unregulated providers.
The enactment of the MFI Act (2006) and the entry into the marketof deposit-taking MFIs will extend the regulatory power of the centralbank to such institutions. SACCOs are governed by the Co-operativeSocieties Act (2004), but a proposed SACCOs bill is yet to be passed.That bill is expected to spell out the regulatory framework for theSACCOs. The current challenge is that the SACCOs are operatingFOSAs with nonmembers, which makes the SACCOs deposit-takinginstitutions outside the central bank’s regulatory framework.
Kenya 173
As authorized dealers, currency exchanges conduct business and areregulated under provisions of the central bank. Their sole activity is toconduct foreign exchange transactions, including the sale and purchaseof currencies, traveler’s checks, and products as licensed and approved bycentral bank.
M-PESA operates under a self-regulation framework, and the transportcompanies are under no regulatory framework. The CommunicationCommission of Kenya (CCK) issues a parcel license to transport com-panies operating in Kenya, but the license does not allow the couriercompanies to transfer or transport money. Posta is the only organizationthat, under CCK authority, can transfer money through the PostalFinancial Services.
Entry RequirementsGiven that most institutions offer remittance services, the entry andlicensing requirements are defined by their core businesses, as follows:
• Banks apply to the Ministry of Finance through the central bank,which is responsible for ensuring that the banking institutions perform their role. Banks are granted the license upon meeting theminimum requirement of K Sh 50 million (US$3.6 million) andlicensing fee of K Sh 400,000 (US$570). For branches, the fee rangesbetween K Sh 30,000 (US$450) to K Sh 150,000 (US$650) betweenurban councils and municipalities.
• Currency exchanges in Kenya pay a nonrefundable application fee and alicense fee and satisfy minimum core capital noninterest bearingdeposit requirements with the central bank. Exchanges must also holdforeign exchange accounts (a maximum of two) with authorized dealerbanks where they also maintain minimum balance requirements.
• MFIs in Kenya currently pay a license fee of K Sh 40,000 (US$570).However, under the MFI Act (2006), a deposit-taking MFI satisfiesvarying minimum capital requirements, depending on the tier it wantsto operate in. This minimum capital requirement may cause remit-tance costs to increase.
• Courier companies must pay a license fee, depending on the area ofoperations. They must also pay a one-time application fee. The otherrequirements are that 20 percent of the company shares must be heldby Kenyans (it can be 100 percent Kenyan-owned) and that the com-pany be tax compliant, pay a value added tax (VAT), file a form withthe CCK director, and show a certificate of registration.
174 Remittance Markets in Africa
Guiding RulesRSPs are expected to uphold the KYC policy and guard against unaccept-able transactions by observing thresholds on the amounts remitted andreporting suspicious cases. However, the ability to enforce some of theserules depends on the strength of the surveillance system and, even more,on the ability to share information across the RSPs at the settlement level.For example, although there are limits on the amounts per transaction, asender could either use more than one provider to transfer funds at thesame time or split the amount and send at different times.
In Kenya, the current currency exchange guidelines prohibit (1) theprocessing of transactions that are, or appear to have been, deliberatelysplit into small amounts of US$10,000 or less to avoid the documen-tation requirement or (2) the purchase of foreign currency in excess ofor equal to US$10,000. Identification documents such as passports andnational IDs also must be requested; transactions in excess of or equal toUS$10,000 per customer per day must be reported; and all remittancesshould be made through the authorized dealer banks (maximum oftwo), which must ensure all the requirements are followed. When act-ing as agents for MTOs such as Western Union or MoneyGram, currencyexchanges are expected to seek registration from the central bank bysending the signed contract.
Banks in Kenya are expected to keep up to 25 percent of core capitalas foreign exchange holdings. Anything above this amount is up to theindividual banks to decide. In contrast, the net open position in foreigncurrencies or in any specified foreign currency for financial institutions inKenya cannot exceed 25 percent of the core capital of the institution. Forbanks, the threshold for reporting to the central bank is US$50,000,and US$100,000 for any suspicious activities. Postbank is not under thebanking act requirement, and it has a transaction limit of US$7,500.
RSP Perspectives on the Regulations and RequirementsThe study asked RSPs how they perceive the laws and regulations asobstacles to doing business. The survey results indicate that most ofthe RSPs do not consider laws and regulations to pose an obstacle.However, currency exchanges in Kenya view the central bank as apply-ing double standards in its disclosure requirements. The exchange own-ers also felt that providing remittance services is time consuming forthem because they have to work with dealer banks and do not sendmoney directly. However, it is important that they understand that
Kenya 175
disclosure rules are important in reducing information asymmetry andenabling operational efficiency.
Most RSPs surveyed felt that access to capital or finance did constitutea major barrier to entry in providing remittance services. In Kenya, banksranked access to distribution networks as a barrier, while government cor-ruption was considered the least of obstacles.
Among the currency exchanges, SACCOs, and the transport sector, theprimary perceived problem was access to capital or finance. For the MFIs,it was access to financial infrastructure. For Postbank, it was the licensingrequirements, and for the M-PESA agencies, the main barrier is the min-imum capital requirement.
Currency exchanges also felt that the central bank took too long torespond to their application, thereby making it impossible to commencebusiness activities in a timely manner. Regarding the operational barriers,the currency exchanges especially indicated license and capital require-ments as significant obstacles to business. Lack of access to clearing andsettlement systems, anti-money-laundering requirements, and the centralbank’s reporting requirements are the other impediments to conductinga remittances-related business.
Competitive ForcesIt is not possible to measure the level of competition because the variousproviders seem to provide services to complementary groups of clients.However, the entry of M-PESA has heightened competition among RSPsbecause it not only serves the unbanked but also receives customers look-ing for cheap and quick service. As a result, other RSPs are reexaminingtheir fees and transfer times.
The RSP survey asked the providers to mention the institutions theyfelt were their major competitors and also to provide their views on var-ious competitors. All providers viewed MTOs such as MoneyGram andWestern Union as key competitors, while the nonbanking institutionsviewed the banks as their key competitors.
Given the high level of partnership among the RSPs, however, thelevel of competition may be described as a mutual interdependencerather than as rivalry. Nonetheless, banks have a variety of products andaccess to a wide transfer system, and their growing branch networks areputting them in a more competitive position. The informal market oper-ates only domestically, and therefore informal providers are viewed asthreats only by those operating in the same geographic corridor.
In Kenya, the transport companies indicated that M-PESA was a majorcompetitor, especially because of M-PESA’s remittance-transfer speed. Tomaintain market share, the transport sector must change its current modeof processing the transfers to effectively compete with M-PESA. Amongthe ongoing initiatives in the transport sector are the float system—whicheliminates the need for physical movement of money, as is the case withM-PESA—and the Somali community-based services. However, thetransport companies still have a market niche, particularly where commu-nication is still problematic. Rationalizing the cost of transfers is anotheraspect that should be considered by the transport sector if it is to remainin business.
Remittance Costs RSPs gather information from the users of remittance services. For thoseunder a statutory framework, the regulator dictates the kind of informa-tion to be gathered. The consequent extra time needed to finalize trans-actions may have implications on customers’ choice of service. Customersprefer immediate settlement of the transaction. For example, some banksindicated that because of the speed with which M-PESA was complet-ing transactions, they also had to reduce the time taken for account-to-account transfers from next-day delivery to same-day delivery. Some ofthe informal players also have changed their strategy of handling trans-fers; instead of the traditional physical transfers, they now operate witha float system.
The RSPs vary in their remittance service charges for the same amountand even for the same destination. However, a particular RSP couldcharge the same amount, regardless of the destination, and distinguishonly between local and international transfers. Charges are generally flatrates that vary across different ranges of payments. These form the RSPs’main sources of revenue. Some of the institutions, though, felt that remit-tance services operate on very narrow profit margins.
In Kenya, banks offer the lowest minimum charge while Postbank,which works in partnership with Western Union, has the highest maxi-mum charge for remittances abroad (table 6.4). M-PESA is the lessexpensive means of sending money domestically. In the past three years,rates have not changed. The expectation is that with the new entrants tothe market, especially the mobile-phone money transfer services, therates will go down.
The central bank has embarked on a deliberate effort to persuade thebanks not to charge recipients for remittance services. Although formalRSPs are not required to charge taxes such as VAT on financial transactions,
176 Remittance Markets in Africa
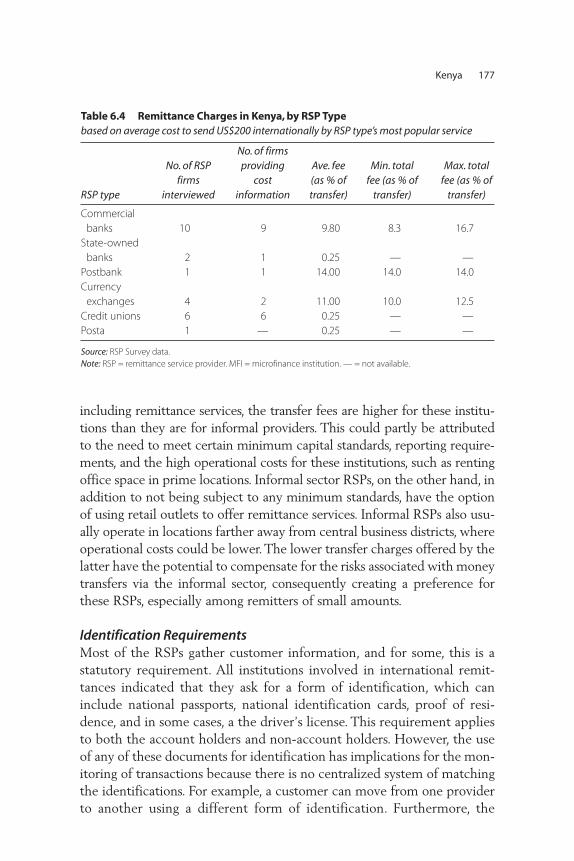
including remittance services, the transfer fees are higher for these institu-tions than they are for informal providers. This could partly be attributedto the need to meet certain minimum capital standards, reporting require-ments, and the high operational costs for these institutions, such as rentingoffice space in prime locations. Informal sector RSPs, on the other hand, inaddition to not being subject to any minimum standards, have the optionof using retail outlets to offer remittance services. Informal RSPs also usu-ally operate in locations farther away from central business districts, whereoperational costs could be lower. The lower transfer charges offered by thelatter have the potential to compensate for the risks associated with moneytransfers via the informal sector, consequently creating a preference forthese RSPs, especially among remitters of small amounts.
Identification RequirementsMost of the RSPs gather customer information, and for some, this is astatutory requirement. All institutions involved in international remit-tances indicated that they ask for a form of identification, which caninclude national passports, national identification cards, proof of resi-dence, and in some cases, a the driver’s license. This requirement appliesto both the account holders and non-account holders. However, the useof any of these documents for identification has implications for the mon-itoring of transactions because there is no centralized system of matchingthe identifications. For example, a customer can move from one providerto another using a different form of identification. Furthermore, the
Kenya 177
Table 6.4 Remittance Charges in Kenya, by RSP Type based on average cost to send US$200 internationally by RSP type’s most popular service
RSP type
No. of RSP firms
interviewed
No. of firms providing
cost information
Ave. fee (as % of transfer)
Min. total fee (as % of
transfer)
Max. total fee (as % of
transfer)
Commercialbanks 10 9 9.80 8.3 16.7
State-ownedbanks 2 1 0.25 — —
Postbank 1 1 14.00 14.0 14.0Currency
exchanges 4 2 11.00 10.0 12.5Credit unions 6 6 0.25 — —Posta 1 — 0.25 — —
Source: RSP Survey data. Note: RSP = remittance service provider. MFI = microfinance institution. — = not available.
178 Remittance Markets in Africa
personal identification is not fed to the payment system and is thereforenot matched to the transaction. Thus the chances of money launderingare high. Some banks insist that the money transfer service be used byaccount holders only.
Some of the institutions (62 percent), especially the banks inter-viewed and Postbank, typically inquire about the purpose of the moneybeing transferred. Although it is not possible to verify the final use of thetransfers, intended uses mentioned include the purchase of housing,land, food, medicine, fuel, and utilities. A big proportion of the firms(more than 75 percent) indicated that the remittances are used for the purchase of land and housing. The settlement of medical expenseswas indicated by 45 percent of firms in Kenya. The “other” categoryincludes construction of housing; purchase of supplies, equipment, andbusiness stock; importation of telecommunication equipment and motorvehicles; and loan repayments.
Addressing GrievancesAll RSPs indicated they have a system of dealing with grievances,although some firms indicated that they rarely receive grievances, andothers said they never have. Nonetheless, transfers may fail to reach theintended recipients, either because the sender provided incorrect infor-mation or because the details were suspicious.
In most cases of grievances (more than 80 percent), the institutionsverify the details with the sender. They also talk to the receiver for thesame purpose. In such a case, the money is not necessarily returned butheld until the details are clarified. Only when the case is suspicious wouldthe institutions talk to the local authorities.
Regarding the length of time it takes to address the grievances, mostRSPs indicated that the grievance is resolved immediately after the issueis raised if the issue is not complex and if information is provided imme-diately. About 50 percent indicated that it takes about a week to addressthe issue. The firms have a dedicated staff (most indicated two staff mem-bers) to deal with grievances or, alternatively, use all staff members involvedin the transfer of money. It is rare that remittances remain unclaimed.
Conclusions and Recommendations
The remittance services market in Kenya is thriving in terms of bothremittance volume and the diversity of the providers, both internationallyand domestically. As the industry evolves, it is capturing more segments
of the society and extending its reach to traditionally underserved popu-lations, especially in rural areas. This expansion provides access for someunbanked community members to financial services. As this chapter hasexplored the RSP market, it has focused on the attributes of good moneytransfer products and services—including accessibility, reliability, a sizableservice network (including external major urban centers), and affordabil-ity. The observations below are especially noteworthy:
• Data collection process on the flow of remittances is not well devel-oped. There is a growing volume of migrant remittances to Kenya,which correlates positively to the stock of migrants. For example,Kenyan migrants’ main destination is the United Kingdom and neigh-boring countries, and similarly these are the primary sources of inwardremittances. Currently, the Central Bank of Kenya’s data cover onlyremittance inflows through the banking institutions. Banks do not cat-egorize their money transfer items and instead treat remittances aspart of the money transfer. This is important in understanding thedynamics of the market.
• Remittance service providers are diverse, but some do not treat remit-tance services as a core service. Accessibility to remittance services isfacilitated by a wide range of institutions that provide transfer serv-ices. However, except for MTOs and mobile-phone money transferagencies (such as M-PESA), which consider remittance service to betheir core service, other RSPs treat remittances as an auxiliary service.The entry of nonbanking services responded to emerging gaps in theprovision of financial services. Currently, mobile-phone money trans-fer is gaining the entry of an additional provider while at the sametime trying to explore international services. This is expected to revo-lutionize the domestic and international money transfer services.
• RSPs’ networks and partnerships reflect significant complementarity.Except for the community-based and transport remittance serviceproviders, all the RSPs have a link to the banking sector because of itselaborate payment system, which enables them to reach a wider(domestic and international) market.
• Participation in the formal remittance market is limited to a propor-tion of clients. The distribution of RSPs indicates limited access to for-mal remittance transfer services by potential clients in various parts of
Kenya 179
180 Remittance Markets in Africa
the economy. Results show that most of the services are provided in themajor urban centers. The rural areas have a lower concentration of theformal providers. The informal market continues to take a significantproportion of the remittance transfers, and this is generally attributableto accessibility of the services and the cost of transfer.
• Direct costs of remittance transfers are significantly high across thevarious providers. To send US$200, the charge ranges between8.0 percent and 18.0 percent for international transfers and between0.4 percent and 12.5 percent for domestic transfers. The transfer feecovers processing charges, inventory costs, and delivery costs. Whenthere is a partnership in the use of some transfer facilities, the transferfee is shared in agreed-to proportions to cover the various costs.
• Access to a wide range of financial services is constrained byfinancial costs and availability. Most of the RSPs indicated thatthey offer a wide range of products to remittance clients amongtheir core services. However, the costs for such products, like the costof maintaining a bank account, may be prohibitive in expanding thedemand for other financial services. Furthermore, M-PESA may find itdifficult to widen the scope of financial services provided its clients ifbanks do not offer such services where the M-PESA agents operate.
• Formal RSPs operate under a statutory regulatory system. The cen-tral bank defines the limits on single transactions for banks and foreignexchange bureaus and also indicates the threshold amounts for report-ing to the central bank. RSPs are also expected to take note of situa-tions where the client seems to be splitting the transfers and any othersuspicious situations. The central bank also asks the banks and cur-rency exchanges to gather information from the customers by askingfor the identification of the senders and recipients.
To ensure that the remittance services provided are accessible, reliable,and affordable, one must focus on the networking and partnerships amongthe providers, technological development, regulatory systems, and datacollection. The study makes the following recommendations:
• Establish an elaborate system for remittance data collection. Thiscould include period surveys and a reporting system from the formalRSPs. Distinguishing the money transfers handled by the service
Kenya 181
providers will be useful in accurately depicting migrant remittances.Information on the costs of transfer should be shared publicly so thatthe client is aware and can choose across the providers. As thisincreases competition among the providers, the costs of the serviceswill potentially decrease.
• Treat money transfer as a core service and build its capacity. Mobile-phone money transfer is revolutionizing the money transfer industrywith its accessible and affordable services. Clients’ positive response tothis technological development indicates that money transfer is a sig-nificant financial service that has taken time to receive significantattention. A challenge to the banking sector is to elevate the servicefrom an auxiliary category and to adopt new technologies to facilitatequick and cheaper service.
• Banks and mobile-phone money transfer agents can make theirservices more complementary. Mobile-phone money transferrequires the development of the telecommunication system; it doesnot require the presence of banks in a particular locality. However,to expose the community being served to additional financial serv-ices, banking institutions would need to penetrate the locality withtheir services and capture the money transfer clients. The model ofestablishing banking services will depend on the size of the targetedcommunity.
• Develop the national payments system. The national payments sys-tem is a crucial structure in the remittance market. The speed of serv-ice delivery and the costs imposed depend on the level of sophistica-tion of the system. Ensuring that the system adapts quickly totechnological development will reduce transaction costs. Membershipin international systems is costly, especially at the individual institu-tion level, and such costs are included in the charges on money trans-fers. In the domestic market, a supportive regulatory system must beestablished to deal with money-laundering cases and other statutoryand regulatory violations.
• Educate remittance service clients about financial products. Financialeducation is crucial for the remittance service clients to understandthe financial products available to them. Similarly, banks can developproducts that are specific to the remittance clients.
• Ensure that the regulatory system keeps up with technological devel-opment. While the mobile-phone money transfer facility is not cur-rently at risk, it is important that the operational rules are fullyenforced. However, as these services go global, the regulatory frame-work must be able to address the regulatory challenges that may beenvisioned.
Notes
1. The corresponding GDP percentages for all developing countries and Sub-Saharan Africa during the same period were 1.9 percent and 1.6 percent,respectively.
2. The East African Community—headquartered in Arusha, Tanzania—is theregional intergovernmental organization of Burundi, Kenya, Rwanda,Tanzania, and Uganda. http://www.eac.int/.
References
Adams, R. H., and J. Page. 2003. “International Migration, Remittances, andPoverty in Developing Countries.” Policy Research Working Paper 3179,World Bank, Washington, DC.
Chimhowu, C., J. Piesse, and C. Pinder. 2003. “Assessing the Impact of MigrantWorkers’ Remittances on Poverty,” presented at the EDIAS Conference onNew Directions in Impact Assessment for Development Methods andPractice, November 24–25.
Edwards, A., and M. Ureta. 2003. “International Migration, Remittances, andSchooling: Evidence from El Salvador.” Journal of Development Economics72 (2): 429–61.
FinScope Kenya. 2007. “Results of a National Survey on Access to FinancialServices in Kenya.” Prepared for DFID’s (U.K. Department for InternationalDevelopment) Financial Sector Deepening (FSD) Kenya Project.http://www.fsdkenya.org/finaccess/.
Gupta, S., C. Pattillo, and S. Wagh 2007. “Impact of Remittances on Poverty andFinancial Development in Sub-Saharan Africa.” Working Paper 07/38,International Monetary Fund, Washington, DC.
Hanson, G., and C. Woodruff. 2003. “Emigration and Educational attainment inMexico.” Working Paper, University of California.
Kabbucho, K., C. Sander, and P. Mukwana. 2003. “Passing the Buck. MoneyTransfer Systems: The Practice and Potential for Products in Kenya.” Study forMicroSave-Africa, Nairobi. http://www.dai.com/pdf/Passing_the_Buck.pdf.
182 Remittance Markets in Africa
KIHBS. 2005. “Kenya Integrated Household Budget Survey 2005/06.” KenyaNational Bureau of Statistics, Ministry of Planning and National Development,Government of Kenya.
Lucas, R. 2004. “International Migration Regimes and Economic Development.”Paper prepared for the Expert Group Meeting on Development Issues,Stockholm, May 13.
Orozco, M., and R. Fedewa. 2006. “Leveraging Efforts on Remittances andFinancial Intermediation.” Working Paper 24, Institute for the Integration ofLatin America and the Caribbean and the Integration, Trade andHemispheric Issues Division, Inter-American Development Bank, Washington,DC. http://www.nalacc.org/fileadmin/Documents/Biblioteca_recursos/INCIDENCIA_TRANSNACIONAL/DESARROLLO_ECON/Financial_Intermediation_and_Remittances_Orozco.pdf.
Ratha, D., and Z. Xu. 2008. Migration and Remittances Factbook 2008.Washington, DC: World Bank.
World Bank. 2006. Global Economic Prospects: Economic Implications of Remittancesand Migration. Washington, DC: World Bank.
———. 2011. Migration and Remittances Factbook. Washington, DC: World Bank.
Kenya 183


185
Nigeria receives the highest amount of remittances in Africa. At an esti-mated $18 billion in formal flows in 2007 (CBN 2007), remittances haveoutpaced foreign direct investment (FDI), official development assistance(ODA), and other inflows into the country. They currently rank second tooil receipts as a foreign exchange earner. World Bank estimates are muchlower (figure 7.1) but still indicate higher inflows of remittances thanother forms of development finance. However, remittance services and theremittance market are poorly regulated, disparate, and little studied.
This chapter sheds more light on the potentials of and impediments tothe remittance industry in Nigeria. It examines remittance instrumentsand the relationships among the diverse players in the industry and iden-tifies opportunities for improving the operational environment and regu-lation of remittance services, particularly as they relate to improvingcompetition, reducing costs, improving access, and enhancing the use ofremittance proceeds.1
For a long time, attention has focused disproportionately on traditionalsources of funds such as ODA and FDI. Although migrant remittanceshave been acknowledged as increasingly important to developing coun-tries’ efforts to mobilize development resources, the remittance process,incentives, and markets have hardly been analyzed or constructively
C H A P T E R 7
Nigeria
Chukwuma Agu
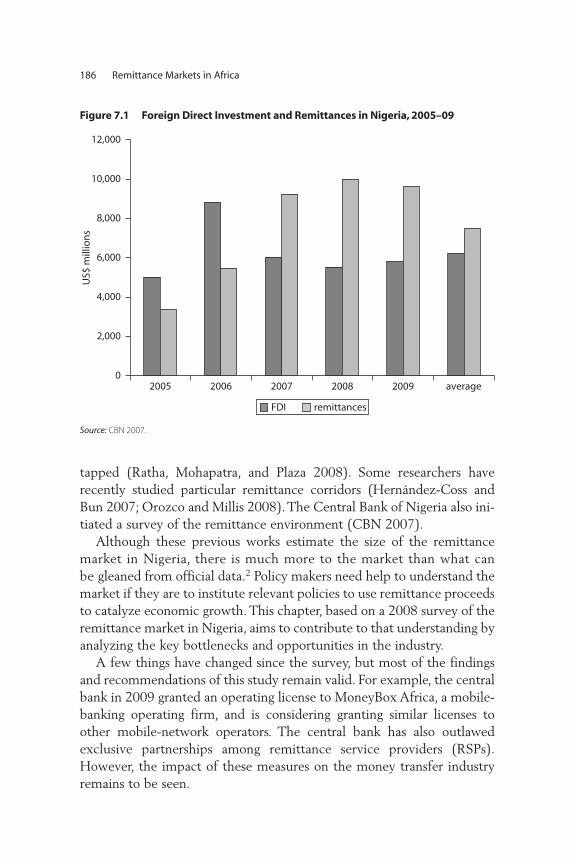
tapped (Ratha, Mohapatra, and Plaza 2008). Some researchers haverecently studied particular remittance corridors (Hernández-Coss andBun 2007; Orozco and Millis 2008). The Central Bank of Nigeria also ini-tiated a survey of the remittance environment (CBN 2007).
Although these previous works estimate the size of the remittancemarket in Nigeria, there is much more to the market than what canbe gleaned from official data.2 Policy makers need help to understand themarket if they are to institute relevant policies to use remittance proceedsto catalyze economic growth. This chapter, based on a 2008 survey of theremittance market in Nigeria, aims to contribute to that understanding byanalyzing the key bottlenecks and opportunities in the industry.
A few things have changed since the survey, but most of the findingsand recommendations of this study remain valid. For example, the centralbank in 2009 granted an operating license to MoneyBox Africa, a mobile-banking operating firm, and is considering granting similar licenses toother mobile-network operators. The central bank has also outlawedexclusive partnerships among remittance service providers (RSPs).However, the impact of these measures on the money transfer industryremains to be seen.
186 Remittance Markets in Africa
Figure 7.1 Foreign Direct Investment and Remittances in Nigeria, 2005–09
Source: CBN 2007.
2005 2006 2007 2008 average2009
12,000
10,000
8,000
6,000
4,000
2,000
0
US$
mill
ion
s
FDI remittances
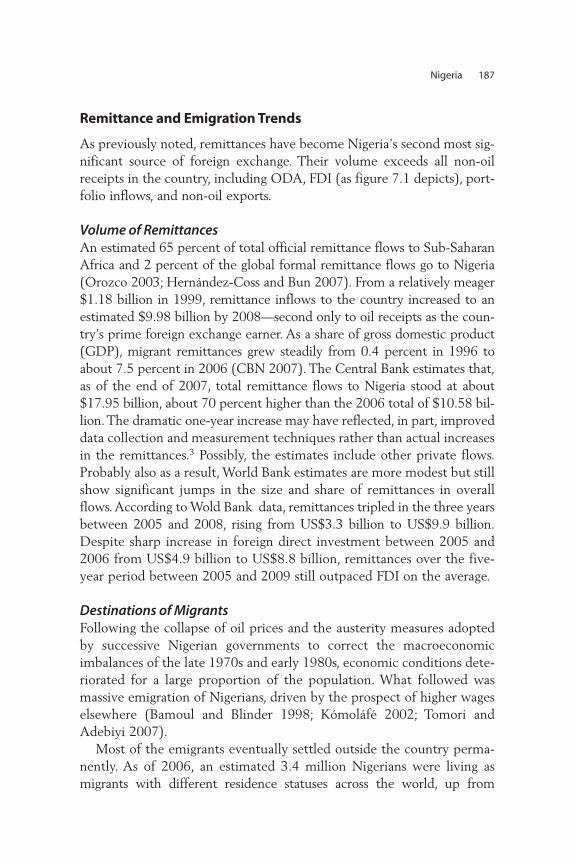
Remittance and Emigration Trends
As previously noted, remittances have become Nigeria’s second most sig-nificant source of foreign exchange. Their volume exceeds all non-oilreceipts in the country, including ODA, FDI (as figure 7.1 depicts), port-folio inflows, and non-oil exports.
Volume of RemittancesAn estimated 65 percent of total official remittance flows to Sub-SaharanAfrica and 2 percent of the global formal remittance flows go to Nigeria(Orozco 2003; Hernández-Coss and Bun 2007). From a relatively meager$1.18 billion in 1999, remittance inflows to the country increased to anestimated $9.98 billion by 2008—second only to oil receipts as the coun-try’s prime foreign exchange earner. As a share of gross domestic product(GDP), migrant remittances grew steadily from 0.4 percent in 1996 toabout 7.5 percent in 2006 (CBN 2007). The Central Bank estimates that,as of the end of 2007, total remittance flows to Nigeria stood at about$17.95 billion, about 70 percent higher than the 2006 total of $10.58 bil-lion. The dramatic one-year increase may have reflected, in part, improveddata collection and measurement techniques rather than actual increasesin the remittances.3 Possibly, the estimates include other private flows.Probably also as a result, World Bank estimates are more modest but stillshow significant jumps in the size and share of remittances in overallflows. According to Wold Bank data, remittances tripled in the three yearsbetween 2005 and 2008, rising from US$3.3 billion to US$9.9 billion.Despite sharp increase in foreign direct investment between 2005 and2006 from US$4.9 billion to US$8.8 billion, remittances over the five-year period between 2005 and 2009 still outpaced FDI on the average.
Destinations of Migrants Following the collapse of oil prices and the austerity measures adoptedby successive Nigerian governments to correct the macroeconomicimbalances of the late 1970s and early 1980s, economic conditions dete-riorated for a large proportion of the population. What followed wasmassive emigration of Nigerians, driven by the prospect of higher wageselsewhere (Bamoul and Blinder 1998; Kómoláfé 2002; Tomori andAdebiyi 2007).
Most of the emigrants eventually settled outside the country perma-nently. As of 2006, an estimated 3.4 million Nigerians were living asmigrants with different residence statuses across the world, up from
Nigeria 187
1.9 million in 2004 (Nwajiuba 2005; Tomori and Adebiyi 2007). Theprime destinations, in addition to the West and Southern African coun-tries (particularly Benin, Ghana, and South Africa), included NorthAmerica and English-speaking European countries—primarily theUnited Kingdom and the United States, followed by Italy, Spain,Germany, and Holland (Nwajiuba 2005) (box 7.1). More remittancescome to Nigeria from the United States than from any other single coun-try (CBN 2007). Other destinations include Brazil, Japan, the Republicof Korea, and Saudi Arabia.
Nigeria has a relatively large network of urban centers scattered acrossall regions of the country (Oluwasola 2007). From 1952 to 2006, the pro-portion of the Nigerian population living in urban centers grew from just11 percent to an estimated 46 percent—approximately 65 million of its140 million people (Oluwasola 2007; UN DESA 2008).
Despite the extent of migration within Nigeria, little to no data existabout the aggregate volume of internal migration or remittances—what
188 Remittance Markets in Africa
Box 7.1
Geographic Nuances of Nigerian Migration and Remittances
Nigeria’s geographic and ethnic diversity plays out in most national issues—includ-
ing migration and remittances. For example, within their broader Nigerian immi-
grant communities, Ireland has attracted a particularly strong community from
southwest Nigeria, and the United States a large contingent from southeast Nigeria.
Northern Nigerians’ affinity for Islam affects those migrants’ destinations.
Consequently, there are vibrant Nigerian communities in, and remittance flows
from, Saudi Arabia, its neighbors, and other parts of North and West Africa to
northern states in Nigeria.
Remittance flows mirror these differences in both the numbers and spatial
distribution of migrants. Interviews with RSPs in Nigeria suggest that remittance
flows to the south are far greater than flows to the north. When Hernández-Coss
and Bun (2007) mapped inflows from the UK corridor, they found about eight
major remittance destinations in Nigeria, spread along four major axes or areas:
Lagos-Ibadan (southwest), Enugu-Owerri (southeast), Benin and Port Harcourt
(south-south), and the Abuja Federal Capital Territory (FCT).
Source: Hernández-Coss and Bun 2007.
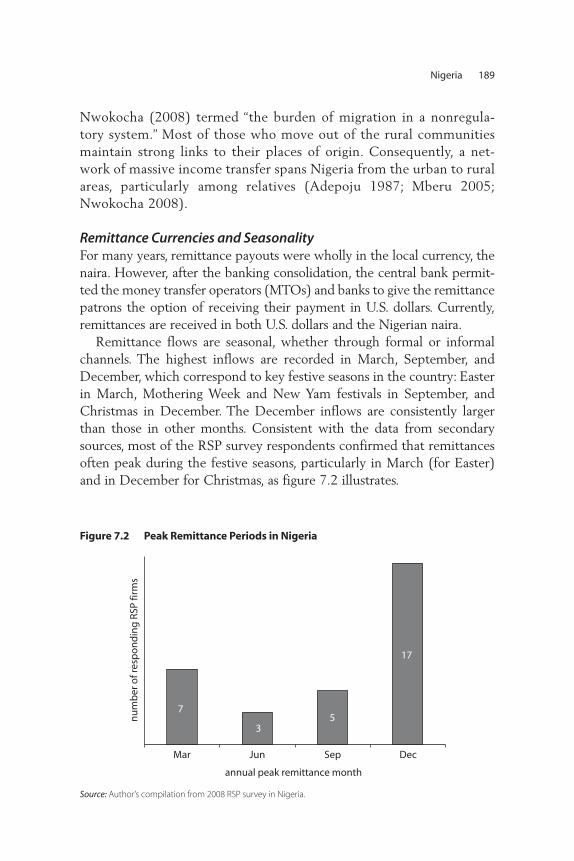
Nwokocha (2008) termed “the burden of migration in a nonregula-tory system.” Most of those who move out of the rural communitiesmaintain strong links to their places of origin. Consequently, a net-work of massive income transfer spans Nigeria from the urban to ruralareas, particularly among relatives (Adepoju 1987; Mberu 2005;Nwokocha 2008).
Remittance Currencies and SeasonalityFor many years, remittance payouts were wholly in the local currency, thenaira. However, after the banking consolidation, the central bank permit-ted the money transfer operators (MTOs) and banks to give the remittancepatrons the option of receiving their payment in U.S. dollars. Currently,remittances are received in both U.S. dollars and the Nigerian naira.
Remittance flows are seasonal, whether through formal or informalchannels. The highest inflows are recorded in March, September, andDecember, which correspond to key festive seasons in the country: Easterin March, Mothering Week and New Yam festivals in September, andChristmas in December. The December inflows are consistently largerthan those in other months. Consistent with the data from secondarysources, most of the RSP survey respondents confirmed that remittancesoften peak during the festive seasons, particularly in March (for Easter)and in December for Christmas, as figure 7.2 illustrates.
Nigeria 189
Figure 7.2 Peak Remittance Periods in Nigeria
Source: Author’s compilation from 2008 RSP survey in Nigeria.
7
35
17
Mar Jun Sep Dec
annual peak remittance month
nu
mb
er o
f res
po
nd
ing
RSP
firm
s
Characteristics of the Remittance Industry
The findings in subsequent sections of this chapter are based on theauthor’s 2008 survey of RSPs in Nigeria. The survey covered RSPs inthree major cities—Enugu, Lagos, and Abuja (the capital)—representingthree major geopolitical regions in the country (southeast, southwest,and north, respectively).
Survey MethodologyIn all, 30 firms were surveyed: 11 each from Lagos and Abuja and theremaining 8 from Enugu. Given the structure of the financial system inNigeria, banks handle a large proportion of remittances (particularlyformal transactions involving contact with the outside world).
Responses came either directly from the firms’ management or, in thecase of the 16 banks in the survey, from employees. Responses were alsoobtained from the Nigerian Postal Service (NIPOST), the sole publicsector postal agency, and from Peace Mass Transit (a private transportand courier service).
Types and Coverage of Remittance FirmsThe remittance service industry in Nigeria is quite segmented—betweena formal sector dominated by a few global MTOs and an informal sectorthat reflects the social network system of a typical African country.Table 7.1 below shows the firm types that are involved in remittances.
Other players in the formal remittance service in Nigeria includeNIPOST, the national postal carrier, which has a collaborative arrange-ment with Cash4Africa to provide remittance services. In the early1990s, NIPOST introduced initiatives such as remittance transfers toimprove and extend the range of its customer services. However, it facesstiff competition from the private sector, whose services are betterknown and more efficient.
After telecommunications operators became licensed in 2001, manyof them also provided indirect remittance instruments for consumers.Recharge cards quickly became instruments for funds transfers amongfamily members and acquaintances, as box 7.2 explains. However, theoutreach and depth of these institutions remain meager, especially rel-ative to the banks’ and MTOs’ operations. The current challenge is thatrecharge cards are always resold at significant discounts—sometimeslosing as much as 30 to 40 percent of their face value. This depreciationcan be quite discouraging and often makes people use recharge cardtransfers and resale only when they have no feasible, immediate funds-transfer alternative.
190 Remittance Markets in Africa
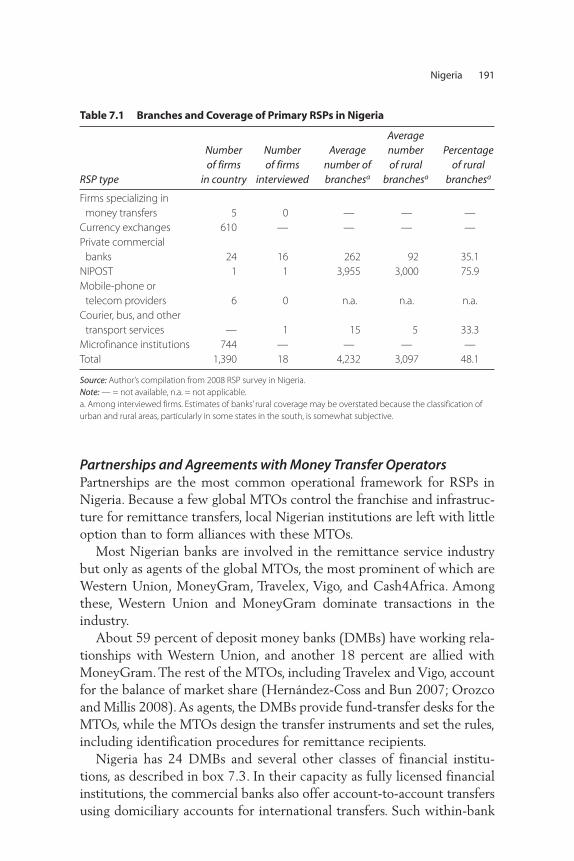
Partnerships and Agreements with Money Transfer OperatorsPartnerships are the most common operational framework for RSPs inNigeria. Because a few global MTOs control the franchise and infrastruc-ture for remittance transfers, local Nigerian institutions are left with littleoption than to form alliances with these MTOs.
Most Nigerian banks are involved in the remittance service industrybut only as agents of the global MTOs, the most prominent of which areWestern Union, MoneyGram, Travelex, Vigo, and Cash4Africa. Amongthese, Western Union and MoneyGram dominate transactions in theindustry.
About 59 percent of deposit money banks (DMBs) have working rela-tionships with Western Union, and another 18 percent are allied withMoneyGram. The rest of the MTOs, including Travelex and Vigo, accountfor the balance of market share (Hernández-Coss and Bun 2007; Orozcoand Millis 2008). As agents, the DMBs provide fund-transfer desks for theMTOs, while the MTOs design the transfer instruments and set the rules,including identification procedures for remittance recipients.
Nigeria has 24 DMBs and several other classes of financial institu-tions, as described in box 7.3. In their capacity as fully licensed financialinstitutions, the commercial banks also offer account-to-account transfersusing domiciliary accounts for international transfers. Such within-bank
Nigeria 191
Table 7.1 Branches and Coverage of Primary RSPs in Nigeria
RSP type
Number of firms
in country
Number of firms
interviewed
Average number of branchesa
Average number of rural
branchesa
Percentage of rural
branchesa
Firms specializing in money transfers 5 0 — — —
Currency exchanges 610 — — — —Private commercial
banks 24 16 262 92 35.1NIPOST 1 1 3,955 3,000 75.9Mobile-phone or
telecom providers 6 0 n.a. n.a. n.a.Courier, bus, and other
transport services — 1 15 5 33.3Microfinance institutions 744 — — — —Total 1,390 18 4,232 3,097 48.1
Source: Author’s compilation from 2008 RSP survey in Nigeria. Note: — = not available, n.a. = not applicable. a. Among interviewed firms. Estimates of banks’ rural coverage may be overstated because the classification of urban and rural areas, particularly in some states in the south, is somewhat subjective.
192 Remittance Markets in Africa
Box 7.2
Recharge Cards for Domestic and International Remittances: The MTN Model
Following the liberalization of the telecommunications sector, three firms were
originally licensed to operate as global system for mobile communications
(GSM) telecommunications operators: Econet, MTN, and MTEL. The first two were
foreign owned, and MTEL was the property of Nigeria’s sole public telephone oper-
ator, Nigerian Telecommunications Limited (NITEL). After a few months in opera-
tion, MTN clearly established itself as the leading network in Nigeria, while Econet
and MTEL struggled with diverse management and operational challenges. Later,
Globacom and Etisalat were licensed. Econet, meanwhile, has changed hands
three times and currently is owned and operated by the Zain network.
MTN’s telecom market share in Nigeria is estimated to exceed 60 percent.
After observing the high volume of purchase and transfer of card numbers
across the network by customers to remit funds, MTN introduced some innova-
tive products. Although some of the cards are used to make calls, for example, a
large proportion is resold at relatively high discounts to retailers in exchange for
cash. MTN therefore introduced its “share-and-sell” facility, which allows a cus-
tomer to define the amount that he or she would like to transfer into the phone
of a relative. After MTN introduced share-and-sell, it observed that some mis-
creants used the service to transfer credit from unsuspecting victims’ phones
without their knowledge. To remedy the problem, MTN started requiring the
owner of the phone to enter a personal identification number (PIN) code.
Share-and-sell has become a major channel of internal funds remittance among
friends and family members.
MTN is also part of the international remittance market through a top-up facil-
ity, which allows an emigrant to Europe or North America to purchase an MTN
card and text the number to a relative in Nigeria, who can resell or use the card.
This top-up service is much more convenient than money transfer services, par-
ticularly for those with little or no means of self-identification. In addition, the text
message comes directly to the recipient’s phone, eliminating transport costs,
queuing, and other hassles associated with formal remittance claims. However,
many recipients of these cards resell them either directly as cards or by using the
share-and-sell facility, often at a substantial discount (5 to 30 percent). This cost is
borne entirely by the recipient of the remittance service—a direct contrast to the
formal banking remittance service provision borne by the sender.
Source: Author.
Nigeria 193
Box 7.3
The Financial System in Nigeria
Nigeria has a dual financial sector—a formal sector (including deposit money
banks (DMBs)) coexisting with an informal sector. The formal system provides
services to the established formal institutions, informal businesses, and individu-
als, while the informal system attends to the needs of the less-organized, less-
recognized microagents and institutions. These informal institutions generate
microdeposits, keep few records, and conduct cash-dominated transactions
anchored on personal recognition with higher interest rates.
For many years, governments in Nigeria tried different policies and programs
to improve informal and small businesses’ access to financing. In the mid-1980s,
following the adoption of the structural adjustment program (SAP), the Ibrahim
Babangida administration established both the People’s Bank and the commu-
nity banking system with the mandate to provide banking to rural and under-
served areas. This policy allowed communities and groups to pool funds to
establish a bank where individuals from the community could access funds with
little or no collateral. Commercial banks were also required to open branches in
rural areas. However, most of these efforts yielded little in terms of establishing
banks nearer the rural areas or improving the informal sector’s access to banking
services.
Because of poor capitalization, poor management, and weak internal gover-
nance systems, many of the community banks were not viable and could not pro-
vide the services for which they were instituted. In 2005, therefore, the central
bank commissioned a study that resulted in a microfinance policy. With the
approval of the policy, all community banks were to become microfinance banks,
while new microfinance banks were licensed. Most of the microfinance banks are
still concentrated in the urban areas where market potentials are much higher.
Following liberalization in the late 1980s and the introduction of universal
banking in 2001, the financial system grew rapidly. Total branch networks of
commercial and merchant banks rose from 1,323 in 1985 to 3,492 in 2004. How-
ever, the sector remained fairly oligopolistic, with about 12 percent of banks
controlling more than 50 percent of total assets and deposit liabilities as well as
about 43 percent of total credit. In 2004, the central bank responded to this
anomaly by announcing far-reaching reforms in the sector, anchored on bank
consolidation and capital base restructuring. The 2004 and subsequent reforms
rationalized the financial system, leaving 1,558 financial institutions: 24 banks
(continued)
transfers are operated either in partnership with foreign banks orthrough foreign branches of the local transferring bank. The commercialbanks also offer other financial services such as foreign exchange,money transfer, credit, and loans alongside their traditional roles. Manyalso have specialized subsidiaries engaged in insurance, mortgage loans,and stock trading. In effect, a number of the country’s banks serve asfinancial one-stop shops. Many of the interviewed banks have desig-nated foreign exchange desks that render the same services as licensedcurrency exchanges.
For international in-bound transfers, DMBs are the principal agentsfor the MTOs. However, institutions such as NIPOST also work withsome MTOs to provide remittance services. Most of the DMBs admit toworking through international partnerships, mainly with the globalMTOs (for example, Western Union, MoneyGram, and Cash4Africa).Most of the Nigerian banks, which have little or no external infrastruc-ture for collecting remittances, serve as distribution points for globalMTOs in return for commissions from fees and access to foreignexchange. In such partnerships, the global MTO collects the remit-tances while the local bank provides the distribution outlet in Nigeria.The sender can use any of the MTO agents in the country where he orshe resides. The recipient, upon notification of a transfer, can go to anybank in Nigeria that has a working relationship with the particularMTO. The central bank does not permit outward remittances through
194 Remittance Markets in Africa
(with about 3,535 branches), 610 currency exchanges (from innumerable small
operators), 76 finance companies, 93 primary mortgage institutions, 744 micro-
finance institutions, 5 discount houses, and 6 development finance institutions.
Even though the microfinancing and other deposit mobilization and funds-
transfer institutions are being strengthened, the bulk of financial transactions—
including the sending and receiving of migrant remittances in the country—go
through the DMBs in the formal sector. The electronic card payment system has
grown significantly in recent years, but as with other aspects of the financial
sector, competition in the provision of electronic card payments is still weak.
For example, the local horizon is dominated by InterSwitch, while foreign
(mainly dollar-denominated) payment is dominated by MasterCard.
Sources: Central Bank of Nigeria Annual Report and Statement of Account, various issues.
Box 7.3 (continued)
Nigeria 195
the MTOs, so banks rely on other means, including checks, drafts, andaccount-to-account transfers (domiciliary accounts) for all forms of out-ward remittances.
Nearly 90 percent of the RSP firms interviewed noted that they usesome form of partnership to provide remittance services. In addition topartnerships with MTOs, there are partnerships with banks (60 percentof respondents), with mobile phone companies (about 23 percent ofrespondents), and between banks and retail stores and supermarkets.The convenient partnership arrangements between banks and globalMTOs also enable banks to cover multiple remittance corridors. Nearly50 percent of respondents indicated that their institutions cover morethan 10 remittance corridors.
A potentially problematic aspect of the partnerships among NigerianRSP firms is the exclusivity clause. (As noted earlier, the Nigerian cen-tral bank has outlawed exclusive partnerships between RSPs, although64 percent of the 2008 RSP survey respondents indicated that they hadexclusive partnerships.) In the struggle for market share and the reduc-tion of potential attribution conflicts, most of the MTOs ostensibly hadexclusive arrangements with the banks. Consequently, it is now commonto associate particular banks with particular MTOs (for example, theUnited Bank for Africa with MoneyGram or the First Bank of Nigeriawith Western Union).
NIPOST has a partnership arrangement with Cash4Africa, but it is notexclusive. In addition to that arrangement, NIPOST operates a NetPost4
program with Western Union through Oceanic Bank. NIPOST’s opera-tions are relatively recent and have low market penetration comparedwith that of the DMBs. As such, its overall remittance operations are aminuscule part of transactions in the industry.
Informal RemittancesRemittances through informal channels are sent not only as cash, but alsoin the form of valuables such as jewelry, electronics, cars, and clothing—usually carried by traveling individuals. These travelers may be acquain-tances of the senders, receivers, or both. Alternatively, they might beeither private merchants who also provide remittance services or justgood Samaritans.
The benefits of remittances through informal channels includereduced fees for senders and favorable exchange rates for recipients(Osili 2004). But whatever the means used to send informal remittances,the associated risks (and sometimes costs) can be substantial. Among the
196 Remittance Markets in Africa
disadvantages, Osili notes, are the risk of losing the money, a relianceon informal contracts, and the search costs to find someone to take themoney abroad. Ultimately, many informal transactions do not cost lessthan the formal ones. For example, merchant RSPs charge rates thatcould be as high as 20 percent of the value of the funds or materialsbeing sent (Osili 2004).
Remittance Instruments Banks dominate inward international remittance transfers, and their prin-cipal transaction instrument is electronic funds transfer. The MTO withwhich the bank has a contract usually notifies the bank whenever a trans-fer is made, providing details of the transfer, the necessary codes, and therequired identification for the recipient. The bank then pays the recipientand debits its account with the MTO. Physical identification is requiredfor the recipient (such as a passport or identity card), but nearly everyother aspect of the process of transfer and collection is electronic.
Domestic fund transfers are at least as significant, if not more signifi-cant, than international transfers in Nigeria. Both bank and nonbank RSPshave designed a host of instruments and products for domestic transfers.Indeed, there is stiff competition among RSPs, particularly banks, to offerinnovative domestic funds transfer products.
For example, to widen the customer base for funds transfers and toincrease their market shares, most banks have, since the consolidation ofthe banking sector, expanded their efforts to ensure that remittance andfunds transfer services are not limited to current account holders. Bankdrafts and account-to-account transfers, therefore, are now among themost prominent remittance instruments. Because almost all Nigerianbanks now have integrated banking facilities, they can charge little ornothing for account-to-account transfers within the same bank (includingbetween different branches).
In addition, products are designed for remitting funds in the samemode as international remittances by many banks. Several banks currentlyhave fairly convenient, online, real-time funds transfer products thatenable the recipient to identify oneself with a given code or other meansand to collect remittance funds even without an account with the bank.NIPOST also offers prepaid cards (as box 7.4 notes), and the telecomfirms offer recharge cards. MTN, as previously noted, has developed itsown card instruments for remittances.
Outward remittance services are both more closely regulated and lesswidespread (Nigeria being generally considered an inward remittance
Nigeria 197
Box 7.4
NIPOST’s Potential to Revolutionize the Nigerian Remittance Market
NIPOST is a potentially powerful institution for the remittance industry. For many
years, it held sway as the principal institution, with massive infrastructure, for mail
delivery (about 955 post offices and 3,000 postal agencies) across the country.
However, with a weak incentive structure and a lackadaisical, poorly motivated
workforce, it got enmeshed in corruption. While management embezzled funds
allocated for the institution, the workforce regularly tampered with and stole
from mail entrusted to their care. Turnaround time for mail delivery in NIPOST
became one of the longest in the world and, before long, the general public lost
confidence in the institution.
As NIPOST reeled under the combined burden of these institutional chal-
lenges, the postal system was liberalized, private courier firms were licensed, and
the Internet (and e-mail) emerged to deliver real-time mail services. It became
clear that NIPOST’s fate was sealed, and its future was in a cruel balance. For many
years, NIPOST remained no more than a hollow national carrier, and patronage
was left to only those who could not afford any of the numerous alternatives.
During the mid-1990s, NIPOST was reinvigorated and its service delivery tied
to market indicators. The management adopted a zero-tolerance policy con-
cerning corruption, making the institution relevant again. With its old delivery
infrastructure still intact—a substantial portion of which is in rural areas—the
institution doubtless still holds great potential as a significant player in the remit-
tance market. It has taken some steps such as instituting partnerships with
Cash4Africa and Oceanic Bank. However, the firm’s share of the market is still
infinitesimal, with payments made only in local currency.
Despite having initiated a number of remittance products, the institution is
still plagued by numerous challenges. In 2006, total remittance disbursement by
NIPOST was less than $4,000, with recorded patronage in only three cities: Abuja,
Oyo, and Edo. While it is true that the general public has yet to shake the old tag
of inefficient, slow, and corrupt NIPOST from their minds, a critical challenge for
NIPOST’s remittance business has to do with publicity, efficiency, and information
technology. In the course of the survey, field officers were surprised to find that
NIPOST actually offers effective remittance services, with designated remittance
products, but little is known about these NIPOST products. Equally important,
NIPOST’s electronic payments infrastructure is weak and unreliable, suffering from
(continued)
198 Remittance Markets in Africa
corridor). The two major instruments for outward remittances are bankdrafts and account-to-account transfers (in this case, domiciliaryaccounts). Some banks provide prepaid debit cards, in collaboration withprepaid card service institutions such as MasterCard and InterSwitch,that can be used for both inward and outward transactions. However,these have limited use for fund transfers, given the preponderance ofcash-based transactions.
Bank drafts are important instruments for outbound fund transfers,offered in collaboration with foreign banks, but the drafts are oftenrelatively expensive for low-value transfers. For transfers using bankdrafts, there is a fixed cost and a variable cost. When the amount isless than $50, the combination of such fixed and variable costs canexceed 50 percent of the total value of the transfer. This high cost ofdrafts reduces their appeal to bank customers.
incessant breakdowns. Consequently, its capacity to pay out remittances effec-
tively is limited.
NIPOST has the capacity to design and deliver remittance services through
numerous instruments. Nigeria has been designated the hub for West African
postal service by the United Nations Universal Postal Union, which ensures that
mail to other West African countries passes through NIPOST. As a result, NIPOST
can position itself as a principal RSP for other countries in West Africa, collaborat-
ing with other postal services globally to deliver quick, efficient, and reliable remit-
tance services to numerous Nigerians abroad. It can also design payment cards
(in the same way that it currently gives identity cards to its customers) for remit-
tance senders and recipients, boosting its activity and income spectrum to go
beyond regular mail delivery.
NIPOST’s existing and new infrastructural facilities could make it the solution
to rural remittance bottlenecks and even force down the price of remittance
services. But this approach requires attention to its payment system and inter-
connectivity; innovation in the design of relevant products for its clients; and
massive media packaging and investment in image-making, both for itself as
an institution and for the products and reach that it offers to its customers. To
this end, the institution needs help, particularly from regulatory and funding
authorities. It is strictly an understatement to say that NIPOST is worth inten-
sive reexamination if the remittance industry in Nigeria is to have a facelift.
Source: Author.
Box 7.4 (continued)
Access to Other Financial ServicesIn Nigeria, remittance services are nearly entirely independent of otherfinancial services in the formal banking sector. Most banks have a remit-tance service desk solely to administer the contract between the bank andits partner MTO. Such desks deal with all issues relating to remittancesfrom outside the country through the MTOs. Consequently, many remit-tance recipients do not use other formal banking services except wherethey are already customers, in part because it is generally not a require-ment to be an account holder to receive remittance services. Once in awhile, banks go out of their way to convert a remittance service recipientto an account holder, but this is the exception rather than the rule, andusually, only high net-worth remittance recipients are so targeted.
Although the banks have exclusive commitments to certain MTOs, aremittance recipient can walk into any other bank with the logo of thesame MTO to cash funds. Consequently, banks do not feel obliged to giveany special treatment to remittance recipients, particularly in the case ofsmall flows. In effect, remittance services are not designed in any way tohelp patrons become long-term users of the formal banking system forcredit and savings purposes. What many RSP survey respondents reportedas services available to remittance service patrons are identical to theproducts available to all other customers—and only if they become bankcustomers. They are not specifically marketed to either remittancesenders or recipients.
The Regulatory and Business Environment
Improved regulations and policies have fostered the growth of the Nigerianfinancial system, but little of that improvement has been applied to theremittance market. Because of a sharp rise in bank branches over the pastdecade, however, RSPs now serve nearly all major cities in the country.
The Central Bank of Nigeria is the principal institution for financial(and consequently remittance) service regulation. Nearly every remit-tance-providing firm (about 96 percent of the respondents in the RSPsurvey, excluding NIPOST) must be registered with the Central Bank ofNigeria. For NIPOST and the courier companies, the Ministry ofInformation and Communication makes the rules, with occasional inputsfrom the Ministry of Finance and the central bank. For other serviceproviders in the informal sector, however, regulation is almost, if notwholly, nonexistent.
Remittances in Nigeria have grown in value in spite of, rather thanbecause of, appropriate policies specific to the industry. Aside from the
Nigeria 199
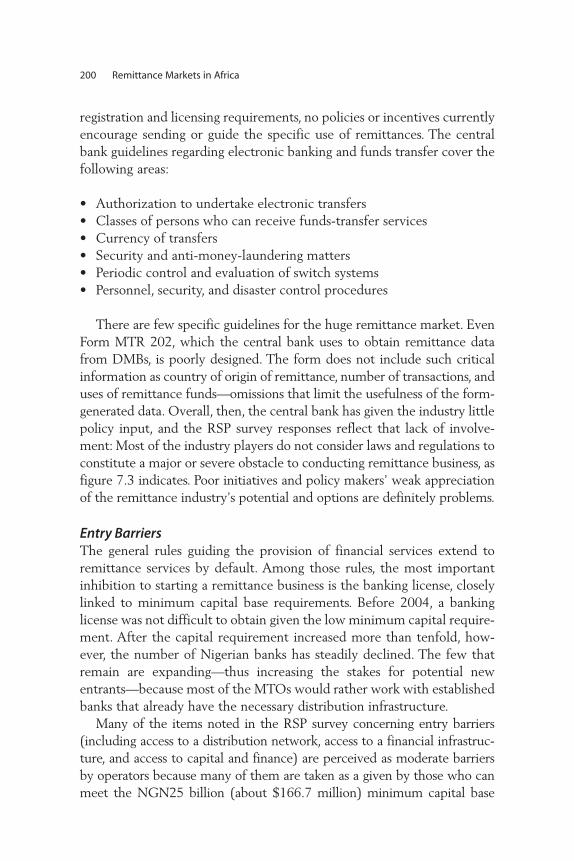
registration and licensing requirements, no policies or incentives currentlyencourage sending or guide the specific use of remittances. The centralbank guidelines regarding electronic banking and funds transfer cover thefollowing areas:
• Authorization to undertake electronic transfers• Classes of persons who can receive funds-transfer services• Currency of transfers• Security and anti-money-laundering matters• Periodic control and evaluation of switch systems • Personnel, security, and disaster control procedures
There are few specific guidelines for the huge remittance market. EvenForm MTR 202, which the central bank uses to obtain remittance datafrom DMBs, is poorly designed. The form does not include such criticalinformation as country of origin of remittance, number of transactions, anduses of remittance funds—omissions that limit the usefulness of the form-generated data. Overall, then, the central bank has given the industry littlepolicy input, and the RSP survey responses reflect that lack of involve-ment: Most of the industry players do not consider laws and regulations toconstitute a major or severe obstacle to conducting remittance business, asfigure 7.3 indicates. Poor initiatives and policy makers’ weak appreciationof the remittance industry’s potential and options are definitely problems.
Entry BarriersThe general rules guiding the provision of financial services extend toremittance services by default. Among those rules, the most importantinhibition to starting a remittance business is the banking license, closelylinked to minimum capital base requirements. Before 2004, a bankinglicense was not difficult to obtain given the low minimum capital require-ment. After the capital requirement increased more than tenfold, how-ever, the number of Nigerian banks has steadily declined. The few thatremain are expanding—thus increasing the stakes for potential newentrants—because most of the MTOs would rather work with establishedbanks that already have the necessary distribution infrastructure.
Many of the items noted in the RSP survey concerning entry barriers(including access to a distribution network, access to a financial infrastruc-ture, and access to capital and finance) are perceived as moderate barriersby operators because many of them are taken as a given by those who canmeet the NGN25 billion (about $166.7 million) minimum capital base
200 Remittance Markets in Africa
requirement for banks. The only other significant barrier to entry, therespondents noted, is corruption in government circles. This seems easyto understand in the Nigerian context, where corruption always ranksamong the top business impediments, but the specific mechanism in rela-tion to remittance business licensing could not be established in thecourse of this study.
A number of the guidelines for electronic transfers and other financialtransactions apply to remittances. For example, the central bank guide-lines on electronic banking came into force in August 2003. They stipu-late, in part, that only authorized financial institutions can undertakeelectronic funds transfers on behalf of customers and that the productsand services can be offered only to residents with a specific residency des-ignation. The rest are to use automatic teller machines, point-of-sale ter-minals, and other channels. The guidelines also state that the naira shouldbe the only currency for such operations and that foreign currency shouldbe used only for domiciliary account transactions.
In addition to complying with minimum capital base requirements,every firm is also required to report any suspicious activity or transactionsthat are above the authorized minimum (in most cases, NGN1 million forindividual transactions and NGN5 million for corporate transactions). Thisrequirement generally ties entry into the remittance business to becominga financial services institution, with all the applicable requirements.
Nigeria 201
Figure 7.3 RSP Perceptions of Laws and Regulations as Obstacles to Remittance Business
Source: Author’s compilation from 2008 RSP survey in Nigeria.
severe obstacle
major obstacle
moderate obstacle
minor obstacle
no obstacle
6.67
16.67
26.67
23.33
16.67
0 10 20 305 15 25
% of surveyed RSP firms

The situation is slightly different when operational barriers are consid-ered with respect not only to the service provider, but also to the serviceuser. At that level, in addition to licensing and capital requirements (whichmany industry players still think are critical), RSPs give weighty consider-ation to the following matters:
• Reporting requirements• Exchange controls• Anti-money-laundering (AML) and combating the financing of ter-
rorism (CFT) requirements• Government tax policies (concerning value added taxes, operational
taxes, and other levies)
In fact, with respect to remittance service operations, more respon-dents give greater weight to AML requirements than to capital and licens-ing requirements, as figure 7.4 shows.
202 Remittance Markets in Africa
Figure 7.4 RSP Perceptions of Barriers to Remittance Business, by Type
Source: Author’s compilation from 2008 RSP survey in Nigeria.
regulation type
licensin
g
capita
l
reporti
ng
exchange co
ntrols
AML
clearin
g and settl
ement
syste
ms
tax p
olicy
banking fa
cility
access
government c
orruptio
n
nu
mb
er o
f RSP
firm
s ci
ting
barr
ier
14
12
10
8
6
4
2
0
Among the RSPs surveyed, exchange controls and tax policy rankedsecond to licensing requirements as an operational barrier. In part, thisreflects the volume of paperwork and care that each RSP firm must exer-cise to avoid a conflict with the myriad laws guiding international trans-fers. Following Nigeria’s attempt and eventual success at being delistedfrom the Financial Action Task Force (FATF) list in 2004,5 the country hasparticularly pursued AML laws with renewed vigor. The next sectionexamines this issue more closely.
Exchange Controls and Other Reporting RequirementsThe central bank requires and receives regular financial reports from allfinancial institutions, particularly the banks. Such notifications are neces-sary to keep track of suspicious financial transactions. At least 93 percentof all respondents to the RSP survey said they are required to file currencytransactions with one or more regulators regularly. About 90 percent indi-cated they must report all suspicious transactions to the central bank. Inaddition, 46 percent of the respondents stated that the central bank lim-its RSPs’ foreign exchange holdings.
Nevertheless, capital controls in Nigeria are, relatively speaking, nottoo strict. The guidelines for electronic transfers outlined in the previoussection are more or less generic provisions to ensure orderliness and effec-tive recording of financial transactions and are hardly specific to theremittance industry. Although limits are applicable in some cases, they arenot so much limits on transfers as they are limits concerning notificationabout such transactions. When such limits are reached or exceeded, thebank does not have to stop the transaction but must simply notify thecentral bank for possible follow-up actions such as investigations whenneeded. Sometimes, such follow-up actions do not happen—a fact thatsome industry players conveniently exploit.
AML, CFT, and know-your-customer (KYC) requirements. To improveits image, Nigeria has exerted more than average efforts to rid its financialsystem of systemic corruption, distortions, and loopholes. Since 1995, ithas amended its Money Laundering Act several times. The 2003 Anti-Money Laundering Act, for example, extended the scope of the 1995 Actto cover all financial crimes.
The 1991 Banks and Other Financial Institutions Decree (BOFID) wasequally amended to cover stock and foreign currency exchange transac-tions. Under BOFID, the central bank gained greater power to issue, deny,and withdraw bank licenses and to freeze suspicious accounts.
Nigeria 203
The country also enacted an Economic and Financial Crimes Act,which criminalized terrorist financing and established the Economic andFinancial Crimes Commission (EFCC) to investigate and prosecute vio-lations. Suspicious transactions are statutorily reported to both the cen-tral bank and the EFCC.
Many of the operational guidelines for electronic transfers aim toensure a safe and sound electronic funds transfer network-switching envi-ronment, with adequate internal controls to discourage fraud and providean adequate audit trail.
Electronic banking products must also be in compliance with AML andKYC rules. The operational burden that this compliance places on opera-tors is not insignificant. Banks routinely photocopy every foreign bill theypay out and must complete a number of forms for transactions involvingforeign exchange before payouts. Other forms of recording, includingmicrofilming, are also regularly used to counteract loopholes that mayarise from improper completion of forms. Many of these laws are applica-ble even for domiciliary account holders who ordinarily may be excusedon the ground that they are also regular customers of the banks.
Exchange controls. In addition, there is a ban on the sale of foreignexchange by banks except to traveling individuals, for whom attempts aremade to confirm every detail, including possession of a travel visa (whereapplicable) and air ticket. Even with this documentation, there is a limitof no more than $5,000 per individual traveler, and the bank is requiredto transmit regular reports to the central bank on all such transactions.
All of these documentation and reporting requirements representattempts to limit opportunities for money laundering and terrorist financ-ing. Eventually, these laws tighten exchange controls, even when theymay not have been intended for such purposes.
Competitive Factors The remittance industry in Nigeria is oligopolistic, dominated by a fewMTOs and a small number of banks. In particular, the capital requirementsfor banking licenses and permission to engage in international fundstransfers restrict entry for many individuals and institutions. Regardingremittances, where franchise and infrastructure requirements are heavy,even the banks must collaborate among themselves and with the MTOsto participate. The fees are determined almost exclusively by the MTOs(with little provision for the banks to add tax-related and other chargesof their own without authorization). In the RSP survey interviews,
204 Remittance Markets in Africa
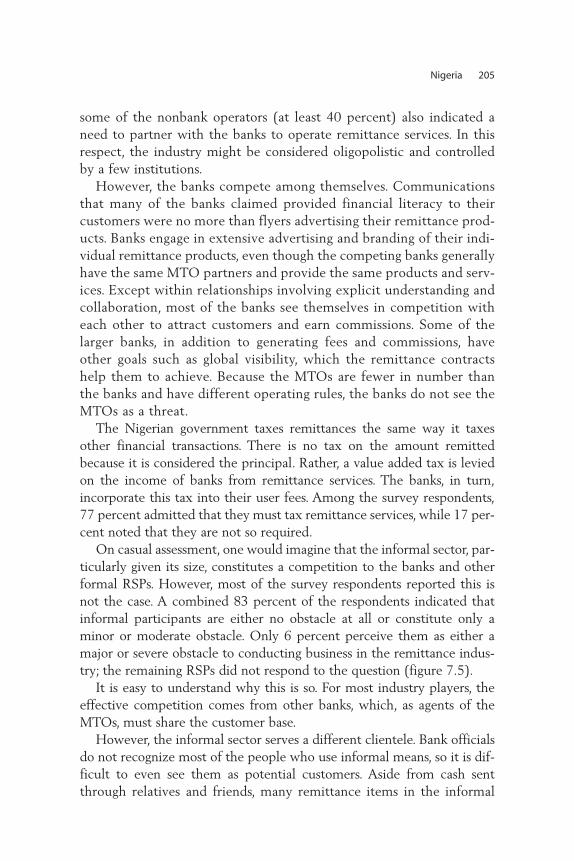
some of the nonbank operators (at least 40 percent) also indicated aneed to partner with the banks to operate remittance services. In thisrespect, the industry might be considered oligopolistic and controlledby a few institutions.
However, the banks compete among themselves. Communicationsthat many of the banks claimed provided financial literacy to theircustomers were no more than flyers advertising their remittance prod-ucts. Banks engage in extensive advertising and branding of their indi-vidual remittance products, even though the competing banks generallyhave the same MTO partners and provide the same products and serv-ices. Except within relationships involving explicit understanding andcollaboration, most of the banks see themselves in competition witheach other to attract customers and earn commissions. Some of thelarger banks, in addition to generating fees and commissions, haveother goals such as global visibility, which the remittance contractshelp them to achieve. Because the MTOs are fewer in number thanthe banks and have different operating rules, the banks do not see theMTOs as a threat.
The Nigerian government taxes remittances the same way it taxesother financial transactions. There is no tax on the amount remittedbecause it is considered the principal. Rather, a value added tax is leviedon the income of banks from remittance services. The banks, in turn,incorporate this tax into their user fees. Among the survey respondents,77 percent admitted that they must tax remittance services, while 17 per-cent noted that they are not so required.
On casual assessment, one would imagine that the informal sector, par-ticularly given its size, constitutes a competition to the banks and otherformal RSPs. However, most of the survey respondents reported this isnot the case. A combined 83 percent of the respondents indicated thatinformal participants are either no obstacle at all or constitute only aminor or moderate obstacle. Only 6 percent perceive them as either amajor or severe obstacle to conducting business in the remittance indus-try; the remaining RSPs did not respond to the question (figure 7.5).
It is easy to understand why this is so. For most industry players, theeffective competition comes from other banks, which, as agents of theMTOs, must share the customer base.
However, the informal sector serves a different clientele. Bank officialsdo not recognize most of the people who use informal means, so it is dif-ficult to even see them as potential customers. Aside from cash sentthrough relatives and friends, many remittance items in the informal
Nigeria 205
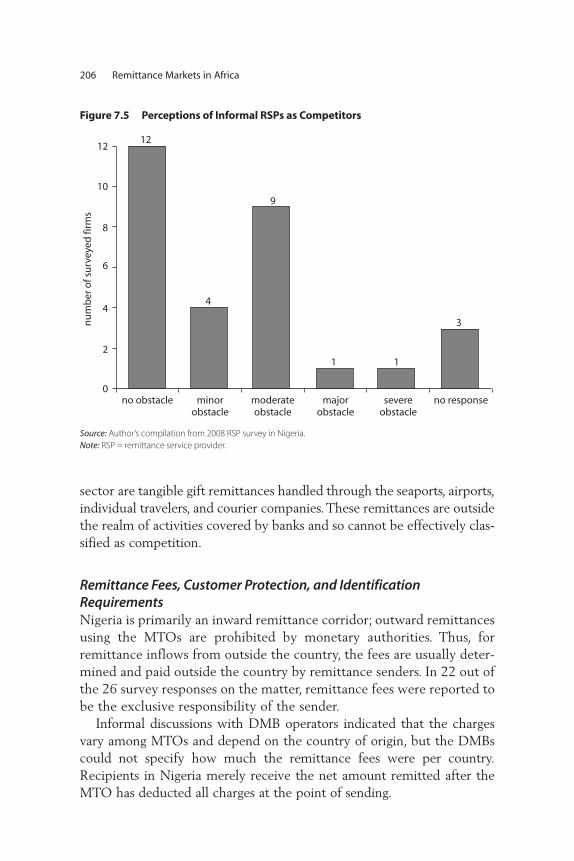
sector are tangible gift remittances handled through the seaports, airports,individual travelers, and courier companies. These remittances are outsidethe realm of activities covered by banks and so cannot be effectively clas-sified as competition.
Remittance Fees, Customer Protection, and Identification RequirementsNigeria is primarily an inward remittance corridor; outward remittancesusing the MTOs are prohibited by monetary authorities. Thus, forremittance inflows from outside the country, the fees are usually deter-mined and paid outside the country by remittance senders. In 22 out ofthe 26 survey responses on the matter, remittance fees were reported tobe the exclusive responsibility of the sender.
Informal discussions with DMB operators indicated that the chargesvary among MTOs and depend on the country of origin, but the DMBscould not specify how much the remittance fees were per country.Recipients in Nigeria merely receive the net amount remitted after theMTO has deducted all charges at the point of sending.
206 Remittance Markets in Africa
Figure 7.5 Perceptions of Informal RSPs as Competitors
Source: Author’s compilation from 2008 RSP survey in Nigeria. Note: RSP = remittance service provider.
severeobstacle
majorobstacle
moderateobstacle
minorobstacle
no obstacle no response
12
44
6
8
10
12
2
0
9
1 1
3nu
mb
er o
f su
rvey
ed fi
rms
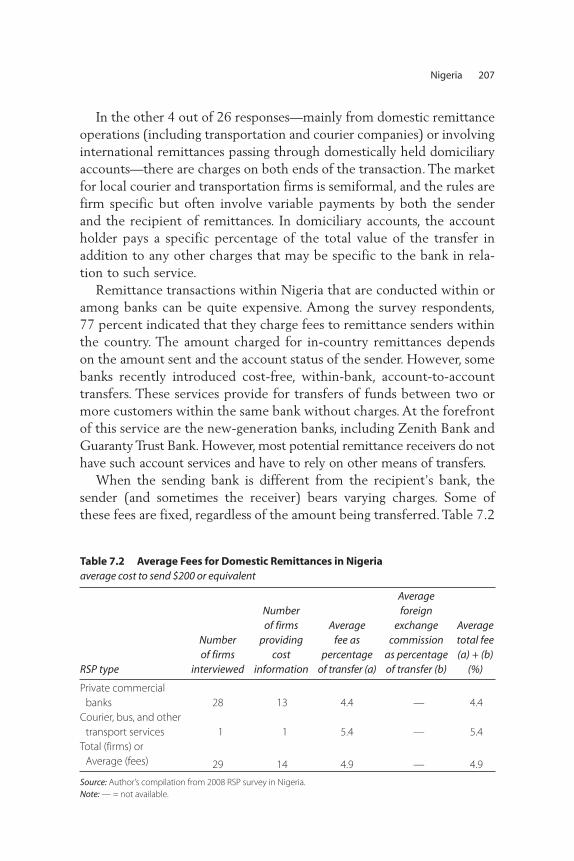
In the other 4 out of 26 responses—mainly from domestic remittanceoperations (including transportation and courier companies) or involvinginternational remittances passing through domestically held domiciliaryaccounts—there are charges on both ends of the transaction. The marketfor local courier and transportation firms is semiformal, and the rules arefirm specific but often involve variable payments by both the senderand the recipient of remittances. In domiciliary accounts, the accountholder pays a specific percentage of the total value of the transfer inaddition to any other charges that may be specific to the bank in rela-tion to such service.
Remittance transactions within Nigeria that are conducted within oramong banks can be quite expensive. Among the survey respondents, 77 percent indicated that they charge fees to remittance senders withinthe country. The amount charged for in-country remittances dependson the amount sent and the account status of the sender. However, somebanks recently introduced cost-free, within-bank, account-to-accounttransfers. These services provide for transfers of funds between two ormore customers within the same bank without charges. At the forefrontof this service are the new-generation banks, including Zenith Bank andGuaranty Trust Bank. However, most potential remittance receivers do nothave such account services and have to rely on other means of transfers.
When the sending bank is different from the recipient’s bank, thesender (and sometimes the receiver) bears varying charges. Some ofthese fees are fixed, regardless of the amount being transferred. Table 7.2
Nigeria 207
Table 7.2 Average Fees for Domestic Remittances in Nigeria average cost to send $200 or equivalent
RSP type
Number of firms
interviewed
Number of firms
providing cost
information
Average fee as
percentageof transfer (a)
Average foreign
exchange commission
as percentage of transfer (b)
Averagetotal fee (a) + (b)
(%)
Private commercial banks 28 13 4.4 — 4.4
Courier, bus, and othertransport services 1 1 5.4 — 5.4
Total (firms) or Average (fees) 29 14 4.9 — 4.9
Source: Author’s compilation from 2008 RSP survey in Nigeria. Note: — = not available.
summarizes the average fees obtained from the respondents, disaggre-gated between banks and courier services. (NIPOST did not providefigures in response to this question.) The average bank fee for trans-fers was 4.4 percent. The only transport company that responded to thequestion approximated its own average at 5.4 percent.
For outward international remittances, the charges differ significantlyand depend on a number of factors, including the bank handling thetransaction, country of destination, nature of relationship between thetransferor and the bank (including whether the transferor has a domicil-iary account), and availability of corresponding banks in the country ofdestination. Table 7.3 summarizes the average sums and proportionsobtained from the survey responses about charges for outbound remit-tance services.
Many banks charge fixed fees irrespective of the transfer amount. Formany banks, a proportion of the funds being transferred is also chargedas fee—and, as some respondents indicated, such proportions could beas high as 10 percent. Charges vary significantly among the key opera-tors for this service. As shown in table 7.3 (reflecting the banks’ surveyresponses), fixed fees remained flat at about $15 between 2007 and2008, while the proportion of the amount being transferred decreasedfrom 7.45 percent to 5.6 percent.
As such, the highest proportional charges are borne by those who areremitting small amounts. These charges are in addition to whatever otheroperational and routine charges are levied on the domiciliary account.Some banks provide the alternative of using drafts issued by the remittingbank from Nigeria, but that option is fraught with several challenges, suchas delays in draft preparation, and little, if any, guarantee that the foreign
208 Remittance Markets in Africa
Table 7.3 Bank Fees for Outward International Remittances in Nigeria, 2007–08average cost to send $200 or equivalent
Number of
respondents
Number
of firms
providing
cost
information
Average
fixed fee
(US$)
Average
fee as
percentage
of
transfer (a)
Average
foreign
exchange
commission
as
percentage
of transfer (b)
Average
total
fee as
percentage
of transfer
(a) + (b)
Minimum
total
fee as
percentage
of transfer
Maximum
total
fee as
percentage
of transfer
2008 28 9 15.28 5.6 0.63 6.23 7.64 13.87
2007 28 9 15.33 7.45 0.38 7.83 7.67 15.49
Source: Author’s compilation from 2008 RSP survey in Nigeria. Note: Data are from responses of nine bank respondents.
bank to which it is being issued will honor it. For many banks, the draftoption does not exist at all.
Customer grievance procedures. Some of the regulatory loopholes in theremittance industry are found in the RSPs’ customer grievance resolutionsystem. Official policies to address customer grievances are largely non-existent. Given the relatively high efficiency of electronic transfer sys-tems, though, customer satisfaction is fairly high, and the RSP surveyrespondents noted relatively low frequency of complaints.
Many RSPs have help desks (almost all respondents said they had a sys-tem for dealing with customer grievances)—usually the same customerservice unit that caters to the rest of the bank’s customers and clients.When an MTO agent receives notification of a problem, it simply takesthe complaint to the MTO. In some cases, depending on the urgency theMTO attaches to the issue, the customer has to call the bank repeatedly,to no avail, because the bank cannot pay out or resolve a problem with-out the MTO’s approval.
In sum, there is no established mechanism for handling customergrievances within Nigeria. All powers for conflict resolution are vested inthe MTO, and the banks have to take instructions from them or take anyadditional action at their own risk. So conflict resolution is only as effi-cient as the invisible hand of the market; there is as yet no formal mech-anism for regulatory intervention into conflict and grievance resolution inthe remittance industry in Nigeria.
Identification requirements. Remittance recipients do not usually needto hold an account or be registered with an RSP to receive remittances.Individual banks work hard to increase market share and establish astrong presence in remittances. Consequently, most do not requireremittance recipients to have an account with them. Only 6 out of the30 survey respondents indicated this is a requirement.
But paying banks need to secure the integrity of remittance servicesand check impersonation during collection of remittances. Therefore,they accept only selected means of identification such as the interna-tional passport, national driver’s license, or national identity card forpaying out remittances. For collections in the bank for which a recipientholds an account, the bank can use the photo attached to an accountfor identification.
With a few exceptions, banks routinely reject employee identity cardsand other plastic identity cards as forms of identification. In some cases,
Nigeria 209
the banks ask for additional identification items such as utility (electricity,water, or accommodation) bills to supplement the standard requirementsor when potential remittance recipients present dubious identificationdocuments. Banks also seek information about the remittance sender andrecipient, country of origin of funds, amount sent, and a secret code(expected to have been sent to the recipient by the remittance sender atthe point of notification of sending funds).
These identification requirements lead to the exclusion of some seg-ments of the Nigerian society from formal remittance services. For exam-ple, only a small proportion of Nigerians own international passports ordriver’s licenses. A national ID card project was undertaken by theMinistry of Internal Affairs in early 2000, but a significant proportion ofNigerians have yet to get their identity cards.
For those so excluded, the options are few. Even in cases whereemployee identity cards could be accepted, most people in this categoryare either self-employed with no official identity cards or are employedby small businesses in the informal sector that do not give official iden-tity cards to employees. Another excluded group are those casuallyemployed with formal firms who are not entitled to identity cards. Proof-of-residence documents and utility bills do not hold any respite becausemany of these either do not display clearly designated and identifiableresidences, or people share utility bills with others, making presentationof such in their own names impossible.
Moreover, the ability to complete the forms also poses a threat tosome of these excluded groups. Typically, many low-income personswho could not afford the identification requirements prefer to usethird-party go-betweens in whose name the remittances would be sentfrom the outset. Sometimes such arrangements are made on thestrength of social capital; at other times, the go-betweens must be paidto claim transferred funds, making poor people especially vulnerable tofraud—which, as box 7.5 explains, affects Nigerians using both formaland informal remittance channels.
Conclusions and Recommendations
The remittance market in Nigeria is large but not yet well managed, andthere is substantial room for growth and change. To summarize, the sta-tus quo is as follows:
• Global MTOs remain the major players, employing the banks asintermediaries.
210 Remittance Markets in Africa
Nigeria 211
Box 7.5
The Plague of Fraud in Remittance and Other ElectronicFund Transfers
A major impediment to robust development of the remittance industry in Nigeria
is fraud. Electronic communication is critical to the remittance industry. Mobile
telephone networks, e-mail, and the Internet have come to play central roles in
moving funds across borders or within countries—whether between MTOs and
banks, between banks and recipients, or between senders and recipients. Transfer
times, identification processes, and payment modalities have all been greatly
enhanced by electronic communication.
In Nigeria, fraudsters, through varied means, exploit every loophole in the
system to impersonate unsuspecting persons or defraud them of their entitle-
ments. For example, in a situation where the communication flows mostly from the
remittance sender, they can tell the recipient about a remittance in cash or in kind
(say, a car) that may require small counterpart payments by the recipient (for exam-
ple, for clearing at the wharf ), to be deposited with a designated friend assigned
the task of finishing the work. It is also not uncommon to receive notifications of a
large sum of money through an MTO (sometimes Western Union) and be asked to
visit a particular Web site (designed for that purpose) for necessary confirmations.
Interception of text and e-mail messages and presentation of false identification
to receive a remittance in the stead of the rightful owner is also common. Another
regular means of laying hands on the personal electronic payment infrastructure of
individuals—one for which many have fallen—are phony notifications by “Inter-
switch” of changes to a customer’s personal identification number (PIN), with a
requirement to register old cards and PIN numbers at a particular Web site or send
the information to a particular e-mail address.
Fraud is one of the greatest threats to the effective development of electronic
transfers of remittances (and, indeed, of all funds). Individual and corporate busi-
nesses around the world are continually targeted by fraudsters. The system can
sometimes be extremely organized. For example, as the EFCC tries to combat the
use of cyber cafés for fraudulent activities, the fraudsters have had to resort to
installing their own Internet servers. They are mostly young men who use amaz-
ing personal initiative to explore new means of keeping ahead of the law and
exploiting loopholes in the payment system. So far, the EFCC has been only mar-
ginally successful in stopping them. A few of the bigger names have been nabbed
in the past. However, most of the smaller operators in the business are still at
large, keeping senders and recipients on their toes.
Source: Author.
• Nigerian banks compete among themselves but not in a way thatchanges the market.
• There is an informal sector, but it seems to work for a different set ofconsumers.
• NIPOST has struggled to break into the industry but faces challenges. • The remittance market in Nigeria has few transfer instruments beyond
cash-to-cash transfers, and they are expensive, with charges as high as20 percent for inward-bound remittances.
• Telecom firms offer recharge cards, which are regularly used to sendand receive remittances.
• Remittance services are seldom linked to regular bank services in away that improves either the use of remittance funds or access toother financial services.
• Outward remittances are highly regulated, with limits placed on trans-actions, and the fees to send internal remittances can be exorbitantexcept for account-to-account transfers within the same bank.
• The regulatory framework for inbound remittances is weak. Financialreforms have regularized currency exchange activities, but theexchanges are not allowed to handle remittance transactions.
Recorded remittances in Sub-Saharan Africa are relatively smallmainly because of inaccurate data (Grabel 2008). Therefore, before pro-ceeding to the recommendations below, it is important to note thatincentives to improve the Nigerian remittance market, its size, or its usecannot be effective without a meaningful database (CBN 2007). Anoverarching concern is the need for a remittance industry database andombudsman. Some (arguably disparate) studies of Nigerian RSPs andthe remittance market are linked only weakly, and there is a near-absenceof structured takeoff points for market analyses.6 Neither the CentralBank of Nigeria’s Form MTR 202 nor data returns from banks are com-prehensive, and a remittance ombudsman who collaborates with theEFCC could help not only to resolve conflicts, but also to share informa-tion about potential sources of confidence-weakening fraud.
The remaining recommendations fall within three areas: (a) increas-ing competition to reduce remittance service costs, (b) improving accessto remittance services, and (c) enhancing the use of remittance proceeds.
Increase Competition to Reduce Remittance Service Costs As in many other financial transactions, the fees to send and receiveremittances should not exceed 2 percent of the amount sent. In Nigeria,
212 Remittance Markets in Africa
formal RSPs currently charge more than 10 percent, and the fees vary(but are often even higher) through informal channels. Increased compe-tition is one prerequisite for reducing these costs.
Enact and enforce regulation to expunge exclusivity from RSP con-tracts. In line with the Central Bank of Nigeria’s recent initiative to out-law exclusivity in remittance service partnerships with MTOs, regulationto set maximum charges for international transfers could be useful(Hernández-Coss and Bun 2007; Orozco and Millis 2008; Watson andFortescue 2008).
Increase the number of industry players. To increase competition, banks(for example, through targeted incentives from the central bank) shouldbe encouraged to open remittance outlets in source countries.7 In addi-tion to the regular services offered by MTOs, patronage of these outletsshould automatically qualify the remittance sender and receiver to beaccount holders in the bank.
In addition, selected currency exchanges and microfinance institu-tions (MFIs) should be accredited and licensed to partner with other for-eign and local MTOs and banks to provide remittance services.8 Theminimum conditions to license currency exchanges and MFIs as inde-pendent RSPs could include their ability to arrange adequate partner-ships or increase institutional infrastructure to set up remittance outletsoutside the country as well as proposals to ensure minimal costs, highefficiency, and reliability.9
Exchange rate–related costs also must stabilize to reduce costs to thesender, recipient, and service provider. Despite significant progress in clos-ing the gap between the parallel and official exchange rates in recentyears, exchange rates remain highly variable, imposing substantial searchand information costs on operators.
An examination of the settlement rates and practices of banks andMTOs in remittance-related transactions may also prove useful.
Improve Access to Remittance Services The effective deployment of NIPOST’s infrastructure across the entirecountry can go a long way toward improving rural access to remittanceservices. NIPOST should be empowered, through initial funding andlogistical support, to fully compete as an RSP. Because most of NIPOST’sservices are affordable to rural dwellers, its growth as an RSP also couldexert downward pressure on tariffs industrywide.
Nigeria 213
To the extent that the informal sector fills gaps in access to formalremittance services, it also complicates data capture and policy transmis-sion.10 Most formal RSPs do not consider the informal sector to be a for-midable competitor, but informal players are serving a large market shareof cost-conscious remittance patrons who cannot meet formal RSPs’identification requirements for various reasons. It is difficult to simplifythe identification process to deal with informal flows without compro-mising the AML and KYC rules, so a one-off identification of the sortneeded for account opening (entitling the recipient of remittances to anaccount and subsequent rights of an account holder) can help to resolvethe dilemma. The system needn’t treat every remittance transaction as aone-off event, but it should encourage and reward the regular use of for-mal banking services in remittance transactions.
Licensing MFIs can help to increase rural outlets for remittance serv-ices given that some of the most regular remittance recipients are ruralresidents. In addition, the central bank can provide incentives (for exam-ple, tax waivers) to encourage RSPs and banks to establish remittance dis-bursement points (not necessarily bank branches) near remote villages.
Enhance the Use of Remittance Proceeds Related to the access issues are challenges involving Nigeria’s cash-basedpayment system in which remittance services are primarily cash-to-cashtransfers. Strengthening the card and credit system and promoting theiruse in remittance transfers will go a long way toward increasing remit-tance volume, reducing remittance costs, and using remittance proceedswith greater effect on national growth and development.
Without question, remittances are a potential source of developmentcapital for the continent. For example, the Nigerian stock market has beena major destination of remittances in recent years (Agu 2010). Therefore,the Nigerian government, the central bank, and RSPs must explore theseways of ensuring that remittances benefit the entire country:
• Provide incentives and otherwise urge banks to package remittance-spe-cific instruments exclusively for remittance patrons, not just for regularbank customers. For example, in response to Obasanjo’s Nigerians inDiaspora Organization (NIDO),11 the United Bank for Africadesigned a “nonresident Nigerian” banking service, offering productssuch as local account maintenance, loan facilities for real estate devel-opment, asset management products, and private equity facilities(Kimani-Lucas 2007).
214 Remittance Markets in Africa
• Develop financial literacy programs and allied money and capital marketinstruments for remittance patrons that go beyond mere advertising ofalliances with Western Union or MoneyGram. After making remit-tance recipients account holders, advising them on effective use ofremittance funds, and linking them to products to securitize thosefunds, banks should follow up by offering specific bank-designedinstruments that will encourage savings and investment.
• Offer specialized loan packages that are tied to remittance receipts, in alliancewith mortgage firms and, if possible, linked to the National HousingFund. This alone can boost the housing investment significantly.
• Harness the power of remittances to fuel growth by offering incentives tothe untapped communities and clusters of remittance senders and recipi-ents. In southeast Nigeria, for example, remittance funds support a sig-nificant number of self-help community development projects.12
Specialized products designed for and marketed to these clusters—emphasizing specific aspects of development such as mortgages,stocks, community electrification projects, road construction, andsmall and mid-size enterprises—will redirect a substantial share ofremittance funds away from consumption and toward investment anddevelopment. The central bank can aid banks and mortgage firms inthis effort by directly providing (or coordinating with relevant govern-ment institutions to provide) matching funds through options such asdiaspora bonds and repatriable foreign exchange accounts (Adenugaand Bala-keffi 2005; Ratha, Mohapatra, and Plaza 2008).
The literature is replete with findings that both human and physi-cal capital investments increase (or at least should increase) alongwith remittances (for example, Glytsos 2002 on six countries in theMediterranean; Adams 2006 on Guatemala). It is the central bank’sjob to ensure that RSPs, particularly banks, have incentives to think inthis direction.
Remittances in Nigeria hold great promise—to benefit the remittancesenders and receivers (microagents) as well as to achieve the largermacroeconomic goal of mobilizing development resources for improvedgrowth. These microagents are already doing their best to affect theeconomy, given the constraints of maximizing personal utility within thebusiness environment under which they operate.
Making remittances more useful—both economically and socially—isthe responsibility of industry operators and macroeconomic policy mak-ers. Although the efforts to meet this challenge have so far been minimal,
Nigeria 215
those who have achieved many other recent positive developments inNigeria can attest that success is not impossible.
Notes
1. The author is most grateful to Uchenna Amaeze, Ositadinma Uba, Nath Urama,and Gold Nwokeocha for research assistance at various levels of this work.
2. Several studies have estimated that informal-sector remittance transfers todeveloping countries make up between 40 and 75 percent of total remit-tances. A big task ahead is to design methods of capturing these informal flowsand putting policies in place to formalize or at least boost them.
3. In addition to disaggregating remittance flows from other aspects of the cap-ital account, the Central Bank of Nigeria Research Department designedForm MTR 202 to elicit information from financial institutions about specificflows of remittances as opposed to other flows.
4. NetPost Nigeria Ltd. is a joint venture partnership between NIPOST and twoprivate sector companies. See http://www.netpostnig.com/.
5. See Financial Action Task Force, http://www.fatf-gafi.org/.
6. The central bank’s first major work on remittances is yet to be published.
7. Such targeted incentives can come in different forms. For example, theCentral Bank of Nigeria can work with the relevant authorities in the partnercountries to enhance the registration process for a Nigerian RSP. This is con-sistent with the recommendation for increased partnership between Nigeriaand its partners in working out a better environment for remittance services(Hernández-Coss and Bun 2007).
8. The experience with the conversion of informal money changers into licensedcurrency exchanges in 2005 shows the potential that can be harnessedthrough this kind of formalization policy. Previously, the Nigerian foreignexchange system had been littered with informal, unregistered players, mak-ing foreign exchange policy transmission nearly impossible and creating sig-nificant premiums on foreign exchange transactions arising from informationasymmetry and uncoordinated activities. In 2005, however, the central bankdesigned minimum criteria for currency exchange operations and forced theseoperators to formally register. Ever since, foreign exchange policies in Nigeriahave stabilized, and the exchange rate was relatively stable until late 2008.
9. Orozco and Millis (2008) recognize five conditions as necessary to demon-strate capacity for remittance payments: (a) compliance with internationalregulatory norms on money transfers (AML, KYC, and so on), (b) minimumcash flow equivalent to four daily remittance payments, (c) trained staff ableto perform retail payments in foreign currency, and (d) technological systems
216 Remittance Markets in Africa
and hardware to adopt or adapt the payment platform. MFIs and currencyexchanges would find the cash flow requirement to be the main challenge. Tomeet it may entail “further consolidation” in the industry, which for compe-tence purposes would benefit the entire economy even more.
10. The distinction between formal and informal segments of the remittanceservice industry could be misleading (World Bank 2007). Without going intothe details of Nigeria’s informal remittance service industry, we simply notethat the use of “informal sector” here is meant to include illegal providers thatare not licensed to provide remittance services as well as small and unincor-porated institutional and individual players.
11. The erstwhile president of Nigeria, Olusegun Obasanjo, instituted a processfor Nigerians abroad to contribute more closely to the development of thecountry. NIDO was the umbrella organization that worked to bring thisvision to reality.
12. Osili (2004) also reports a substantial number of personal and communityhousing projects supported by remittances.
References
Adams, Richard H., Jr., 2006. “Remittances, Poverty and Investment inGuatemala.” In International Migration, Remittances and the Brain Drain, ed.Caglar Ozden and Maurice Schiff, 53–80. Washington, DC: World Bank andPalgrave Macmillan.
Adenuga, A. O., and L. Bala-keffi. 2005. “Inward Remittances and EconomicDevelopment in Nigeria: Issues and Policy Options.” Journal of Banking andFinance 7 (2). Financial Institutions Training Centre, Lagos.
Adepoju, A. 1987. “Demographic Aspects of Internal Migration Politics inNigeria.” In Population et développement en Afrique, ed. Hedi Jemai, 353–89.Dakar: Conseil pour le Développement de la Recherche Économique etSociale en Afrique.
Agu, C., 2010. “Nigeria’s Market Crisis, Fundamentals, and Stock Pricing: AReview for Africa.” Paper presented at the International Academy of Businessand Economics 2010 Summer Conference, Pattaya, Thailand, June 4–6.
Baumol, W. J., and A. S. Blinder. 1998. “Recent Developments in the U.S. LabourMarket.” In Economics: Principles and Policy, ed. W. J. Baumol, 398–99. NewYork: Dryden Press.
CBN (Central Bank of Nigeria). 2007. “The Remittance Environment in Nigeria.”Unpublished study by the Research and Statistics Department, CBN, Abuja,Nigeria.
Glytsos, Nicholas P. 2002. “A Macroeconometric Model of the Effects of MigrantRemittances in Mediterranean Countries.” In Human Capital: Population
Nigeria 217
Economics in the Middle East, ed. Ismail Abdel-Hamid Sirageldin, 299–349.London: I.B. Tauris; Cairo: American University of Cairo Press.
Grabel, Ilene. 2008. “The Political Economy of Remittances: What Do We Know?What Do We Need to Know?” Working Paper 184, Political EconomyResearch Institute, University of Massachusetts, Amherst.
Hernández-Coss, Raúl, and Chinyere Egwuagu Bun. 2007. “The UK–NigeriaRemittance Corridor: Challenges of Embracing Formal Transfer Systems in aDual Financial Environment.” Working Paper 92, World Bank, Washington, DC.
Kimani-Lucas. M. 2007. “Harnessing African Diaspora Remittances and Skills toDrive Growth in Africa.” Paper for CAPAfrique. http://www.capafrique.org/pdf/20071711NMaureenKimani.pdf.
Kómoláfé, J. 2002. “Searching for Fortune: The Geographical Process of NigerianMigration to Dublin, Ireland.” Irinkerindo: A Journal of African MigrationIssue 1, September. http://www. africamigration.com/archive_01/j_komolafe_searching.htm.
Mberu, Blessing U. 2005. “Who Moves and Who Stays? Rural Out-migration inNigeria.” Journal of Population Research (Brown University) 22 (2): 141–61.
Nwajiuba, C. 2005. “International Migration and Livelihood in SoutheasternNigeria.” Global Migration Perspectives 50, Global Commission on InternationalMigration.
Nwokocha, Ezebunwa E. 2008. “Engaging the Burden of Rural-Urban Migrationin a Nonregulatory System: The Case of Nigeria.” Unpublished paper,Department of Sociology, University of Ibadan, Nigeria. http://www.irmgard-coninx-stiftung.de/fileadmin/user_upload/pdf/urbanplanet/Nwokocha.pdf.
Oluwasola, Oluwemimo. 2007. “Social Systems, Institutions, and Structures:Urbanization, Poverty, and Changing Quality of Life.” Paper presented attraining session of the Foundation for Environmental Development andEducation in Nigeria, Obafemi Awolowo University, Ile-Ife, Nigeria,February 22.
Orozco, M. 2003. “Worker Remittances: An International Comparison.” Workingpaper commissioned by the Multilateral Investment Fund of the Inter-American Development Bank, Washington, DC.
Orozco, Manuel, and Bryanna Millis. 2008. “Remittances, Competition, and FairFinancial Access Opportunities in Nigeria.” USAID AMAP MicroReport 86,U.S. Agency for International Development, Washington, DC.
Osili, U. O. 2004. “Migrants and Housing Investments: Theory and Evidence fromNigeria.” Economic Development and Cultural Change 52 (4): 821–49.
Ratha, Dilip, Sanket Mohapatra, and Sonia Plaza. 2008. “Beyond Aid: NewSources and Innovative Mechanisms for Financing Development in Sub-Saharan Africa.” Policy Research Working Paper 4609, DevelopmentProspects Group, World Bank, Washington, DC.
218 Remittance Markets in Africa
Tomori, S., and M. A. Adebiyi. 2007. “Migrants’ Remittances and the Economy:Theoretical and Impact Issues.” In Toward Africa’s Renewal, ed. J. C. Senghorand N. K. Poku, 295–319. London: Ashgate.
UN DESA (United Nations Department of Economic and Social Affairs). 2008.“An Overview of Urbanization, Internal Migration, Population Distributionand Development in the World.” Paper UN/POP/EGM-URB/2008/01 for theUN Expert Group Meeting on Population Distribution, Urbanization,Internal Migration, and Development, New York, January 21–23.
Watson, Gregory, and Seymour Fortescue. 2008. “International RemittanceMarket Reforms in Nigeria.” Presentation by World Bank Payment Systemsand Remittances Team Mission in Nigeria, February.
World Bank. 2007. “General Principles for International Remittance Services.”Report for the Committee on Payment and Settlement Systems and theWorld Bank, Washington, DC. http://www.bis.org/publ/cpss76.pdf.
Nigeria 219

221
Remittances from migrants abroad have become a viable means fordeveloping countries to finance their development and reduce poverty.1
Remittance transfers to developing countries amounted to approximatelyUS$325 billion in 2010—four times greater than in 2000 (World Bank2011). Overall, remittances have become more significant than officialdevelopment assistance (ODA) and, in certain developing countries, haveoutstripped foreign direct investment (FDI). This increase in remittanceshas led many authors to view them as potentially beneficial for develop-ment (Kapur 2004). The transfer of foreign currency through remittancesalso has a positive effect on national income, savings, and investment; byhelping to finance imports, remittances reduce imbalances and thus sim-ilarly affect private and public capital flows (Russell 1986).
This chapter analyzes migrant remittances in Senegal, specifically theirvolume, methods of transfer, regulatory framework, environment, andoperating procedures and costs. The study methodology included bothprimary sources (particularly, a survey of remittance service providers[RSPs]) and secondary sources (consultation of relevant documents).
C H A P T E R 8
Senegal
Fatou Cisse
The author wishes to thank Gaye Daffe for his contribution and useful comments.
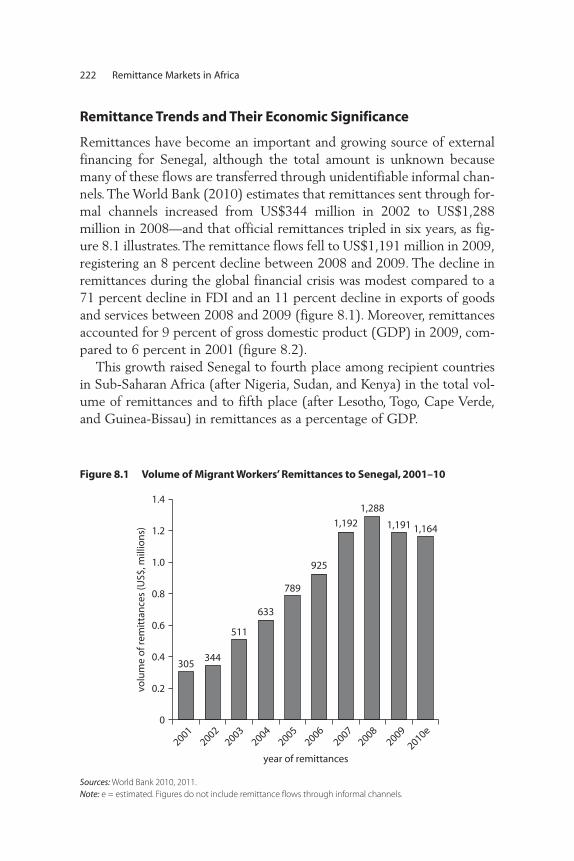
Remittance Trends and Their Economic Significance
Remittances have become an important and growing source of externalfinancing for Senegal, although the total amount is unknown becausemany of these flows are transferred through unidentifiable informal chan-nels. The World Bank (2010) estimates that remittances sent through for-mal channels increased from US$344 million in 2002 to US$1,288million in 2008—and that official remittances tripled in six years, as fig-ure 8.1 illustrates. The remittance flows fell to US$1,191 million in 2009,registering an 8 percent decline between 2008 and 2009. The decline inremittances during the global financial crisis was modest compared to a71 percent decline in FDI and an 11 percent decline in exports of goodsand services between 2008 and 2009 (figure 8.1). Moreover, remittancesaccounted for 9 percent of gross domestic product (GDP) in 2009, com-pared to 6 percent in 2001 (figure 8.2).
This growth raised Senegal to fourth place among recipient countriesin Sub-Saharan Africa (after Nigeria, Sudan, and Kenya) in the total vol-ume of remittances and to fifth place (after Lesotho, Togo, Cape Verde,and Guinea-Bissau) in remittances as a percentage of GDP.
222 Remittance Markets in Africa
305344
year of remittances
511
633
789
925
1,192
1,288
1,191 1,164
0
20012002
20032004
20052006
20072008
2009
2010e
0.2
0.4
0.6
0.8
1.0
volu
me
of r
emit
tan
ces
(US$
, mill
ion
s) 1.2
1.4
Sources: World Bank 2010, 2011. Note: e = estimated. Figures do not include remittance flows through informal channels.
Figure 8.1 Volume of Migrant Workers’ Remittances to Senegal, 2001–10
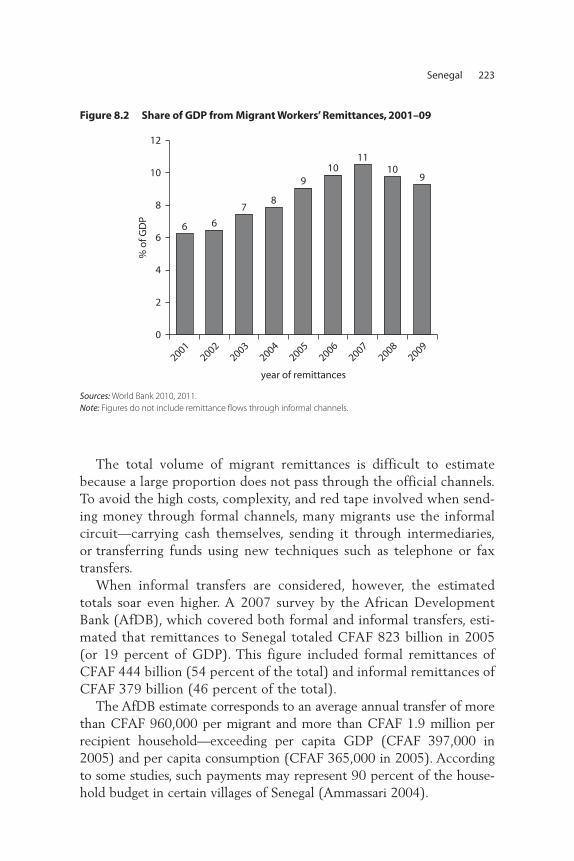
The total volume of migrant remittances is difficult to estimatebecause a large proportion does not pass through the official channels.To avoid the high costs, complexity, and red tape involved when send-ing money through formal channels, many migrants use the informalcircuit—carrying cash themselves, sending it through intermediaries,or transferring funds using new techniques such as telephone or faxtransfers.
When informal transfers are considered, however, the estimatedtotals soar even higher. A 2007 survey by the African DevelopmentBank (AfDB), which covered both formal and informal transfers, esti-mated that remittances to Senegal totaled CFAF 823 billion in 2005(or 19 percent of GDP). This figure included formal remittances ofCFAF 444 billion (54 percent of the total) and informal remittances ofCFAF 379 billion (46 percent of the total).
The AfDB estimate corresponds to an average annual transfer of morethan CFAF 960,000 per migrant and more than CFAF 1.9 million perrecipient household—exceeding per capita GDP (CFAF 397,000 in2005) and per capita consumption (CFAF 365,000 in 2005). Accordingto some studies, such payments may represent 90 percent of the house-hold budget in certain villages of Senegal (Ammassari 2004).
Senegal 223
6 6
7
year of remittances
8
910
1110
9
0
2
4
6
8
10
% o
f GD
P12
20012002
20032004
20052006
20072008
2009
Sources: World Bank 2010, 2011. Note: Figures do not include remittance flows through informal channels.
Figure 8.2 Share of GDP from Migrant Workers’ Remittances, 2001–09
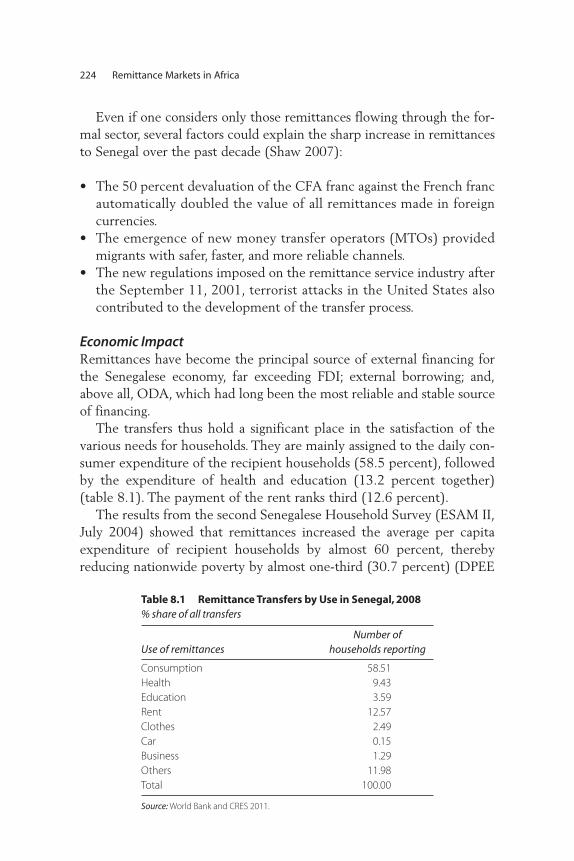
Even if one considers only those remittances flowing through the for-mal sector, several factors could explain the sharp increase in remittancesto Senegal over the past decade (Shaw 2007):
• The 50 percent devaluation of the CFA franc against the French francautomatically doubled the value of all remittances made in foreigncurrencies.
• The emergence of new money transfer operators (MTOs) providedmigrants with safer, faster, and more reliable channels.
• The new regulations imposed on the remittance service industry afterthe September 11, 2001, terrorist attacks in the United States alsocontributed to the development of the transfer process.
Economic ImpactRemittances have become the principal source of external financing forthe Senegalese economy, far exceeding FDI; external borrowing; and,above all, ODA, which had long been the most reliable and stable sourceof financing.
The transfers thus hold a significant place in the satisfaction of thevarious needs for households. They are mainly assigned to the daily con-sumer expenditure of the recipient households (58.5 percent), followedby the expenditure of health and education (13.2 percent together)(table 8.1). The payment of the rent ranks third (12.6 percent).
The results from the second Senegalese Household Survey (ESAM II,July 2004) showed that remittances increased the average per capitaexpenditure of recipient households by almost 60 percent, therebyreducing nationwide poverty by almost one-third (30.7 percent) (DPEE
224 Remittance Markets in Africa
Table 8.1 Remittance Transfers by Use in Senegal, 2008 % share of all transfers
Use of remittances Number of
households reporting
Consumption 58.51Health 9.43Education 3.59Rent 12.57Clothes 2.49Car 0.15Business 1.29Others 11.98Total 100.00
Source: World Bank and CRES 2011.
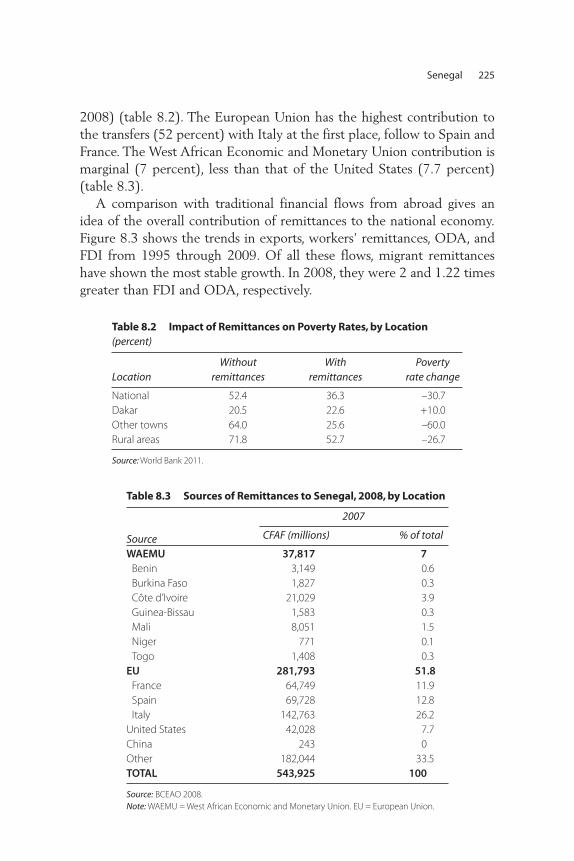
2008) (table 8.2). The European Union has the highest contribution tothe transfers (52 percent) with Italy at the first place, follow to Spain andFrance. The West African Economic and Monetary Union contribution ismarginal (7 percent), less than that of the United States (7.7 percent)(table 8.3).
A comparison with traditional financial flows from abroad gives anidea of the overall contribution of remittances to the national economy.Figure 8.3 shows the trends in exports, workers’ remittances, ODA, andFDI from 1995 through 2009. Of all these flows, migrant remittanceshave shown the most stable growth. In 2008, they were 2 and 1.22 timesgreater than FDI and ODA, respectively.
Senegal 225
Table 8.2 Impact of Remittances on Poverty Rates, by Location (percent)
LocationWithout
remittancesWith
remittancesPoverty
rate change
National 52.4 36.3 –30.7Dakar 20.5 22.6 +10.0Other towns 64.0 25.6 –60.0Rural areas 71.8 52.7 –26.7
Source: World Bank 2011.
Table 8.3 Sources of Remittances to Senegal, 2008, by Location
Source
2007
CFAF (millions) % of total
WAEMU 37,817 7Benin 3,149 0.6Burkina Faso 1,827 0.3Côte d’Ivoire 21,029 3.9Guinea-Bissau 1,583 0.3Mali 8,051 1.5Niger 771 0.1Togo 1,408 0.3
EU 281,793 51.8France 64,749 11.9Spain 69,728 12.8Italy 142,763 26.2
United States 42,028 7.7China 243 0Other 182,044 33.5TOTAL 543,925 100
Source: BCEAO 2008.Note: WAEMU = West African Economic and Monetary Union. EU = European Union.
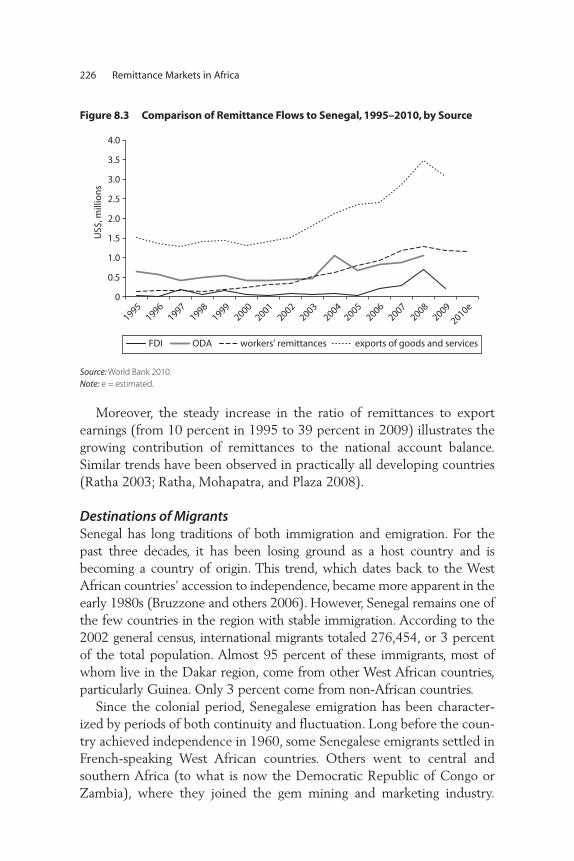
Moreover, the steady increase in the ratio of remittances to exportearnings (from 10 percent in 1995 to 39 percent in 2009) illustrates thegrowing contribution of remittances to the national account balance.Similar trends have been observed in practically all developing countries(Ratha 2003; Ratha, Mohapatra, and Plaza 2008).
Destinations of MigrantsSenegal has long traditions of both immigration and emigration. For thepast three decades, it has been losing ground as a host country and isbecoming a country of origin. This trend, which dates back to the WestAfrican countries’ accession to independence, became more apparent in theearly 1980s (Bruzzone and others 2006). However, Senegal remains one ofthe few countries in the region with stable immigration. According to the2002 general census, international migrants totaled 276,454, or 3 percentof the total population. Almost 95 percent of these immigrants, most ofwhom live in the Dakar region, come from other West African countries,particularly Guinea. Only 3 percent come from non-African countries.
Since the colonial period, Senegalese emigration has been character-ized by periods of both continuity and fluctuation. Long before the coun-try achieved independence in 1960, some Senegalese emigrants settled inFrench-speaking West African countries. Others went to central andsouthern Africa (to what is now the Democratic Republic of Congo orZambia), where they joined the gem mining and marketing industry.
226 Remittance Markets in Africa
0
0.5
1.0
1.5
2.0
2.5
3.0
3.5
4.0
US$
, mill
ion
s
20012000
19991998
19971996
19952002
20032004
20052006
20072008
2009
2010e
FDI ODA workers’ remittances exports of goods and services
Source: World Bank 2010. Note: e = estimated.
Figure 8.3 Comparison of Remittance Flows to Senegal, 1995–2010, by Source
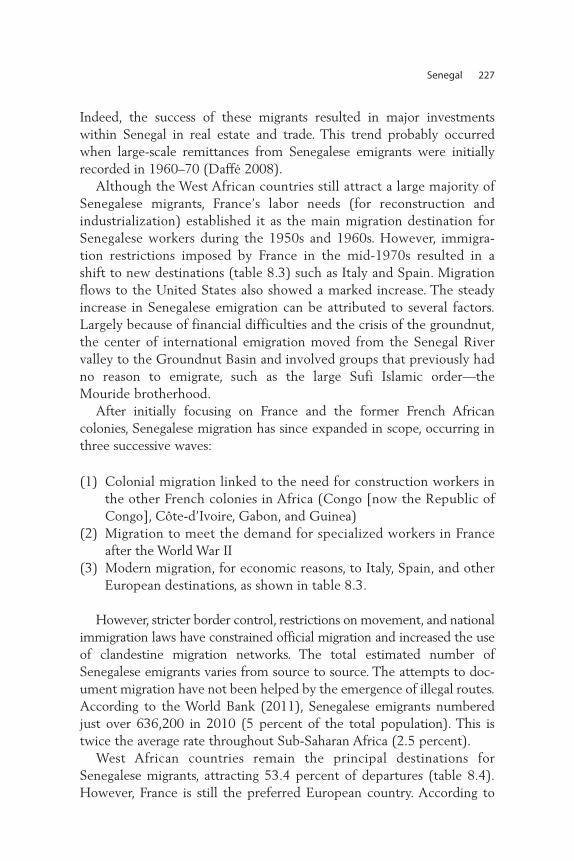
Indeed, the success of these migrants resulted in major investmentswithin Senegal in real estate and trade. This trend probably occurredwhen large-scale remittances from Senegalese emigrants were initiallyrecorded in 1960–70 (Daffé 2008).
Although the West African countries still attract a large majority ofSenegalese migrants, France’s labor needs (for reconstruction andindustrialization) established it as the main migration destination forSenegalese workers during the 1950s and 1960s. However, immigra-tion restrictions imposed by France in the mid-1970s resulted in ashift to new destinations (table 8.3) such as Italy and Spain. Migrationflows to the United States also showed a marked increase. The steadyincrease in Senegalese emigration can be attributed to several factors.Largely because of financial difficulties and the crisis of the groundnut,the center of international emigration moved from the Senegal Rivervalley to the Groundnut Basin and involved groups that previously hadno reason to emigrate, such as the large Sufi Islamic order—theMouride brotherhood.
After initially focusing on France and the former French Africancolonies, Senegalese migration has since expanded in scope, occurring inthree successive waves:
(1) Colonial migration linked to the need for construction workers inthe other French colonies in Africa (Congo [now the Republic ofCongo], Côte-d’Ivoire, Gabon, and Guinea)
(2) Migration to meet the demand for specialized workers in France after the World War II
(3) Modern migration, for economic reasons, to Italy, Spain, and otherEuropean destinations, as shown in table 8.3.
However, stricter border control, restrictions on movement, and nationalimmigration laws have constrained official migration and increased the useof clandestine migration networks. The total estimated number ofSenegalese emigrants varies from source to source. The attempts to doc-ument migration have not been helped by the emergence of illegal routes.According to the World Bank (2011), Senegalese emigrants numberedjust over 636,200 in 2010 (5 percent of the total population). This istwice the average rate throughout Sub-Saharan Africa (2.5 percent).
West African countries remain the principal destinations forSenegalese migrants, attracting 53.4 percent of departures (table 8.4).However, France is still the preferred European country. According to
Senegal 227
official statistics,2 France had almost 91,446 Senegalese immigrants in2010—36 percent the population of Senegalese migrants in theOrganization for Economic Cooperation and Development (OECD)countries.
Senegalese migrants choose their destinations no longer based only oneconomic, historic, or linguistic factors but also on the immigration poli-cies of the host countries. Since the 1980s, the migrants’ regions of originhave also become more diverse, with the Dakar and Diourbel regions wellrepresented (31 percent and 19 percent, respectively) and the SenegalRiver valley (historically, the main departure region) no longer dominant(Saint-Louis 4.7 percent).
The Senegalese Migration and Remittances Survey (World Bankand CRES 2010) showed that in more than half out of the households(52 percent), at least one member had emigrated.
Internal Migration and RemittancesThe third general population and housing census (RecensementGeneral de la Population et de l’Habitat, RGPH-III 2002) conducted bythe National Agency of Statistics and Demography described internalmigration in Senegal as the most important form of migration because
228 Remittance Markets in Africa
Table 8.4 Principal Destinations of Senegalese InternationalMigrants, 2008
Countries of destination Number of migrants Percent
Africa 339,984.98 53.40Gambia, The 177,306.41 27.85Mauritania 64,556.94 10.14Côte d’Ivoire 33,250.24 5.22Gabon 21,959.42 3.45Mali 11,895.00 1.87Guinea Bissau 9,806.73 1.54Other Africa 21,210.24 3.33
OECD 255,463.39 40.13France 91,446.44 14.36Italy 81,423.63 12.79Spain 51,671.57 8.12United States 16,745.31 2.63Other OECD 14,176.45 2.23
Other 41,184.79 6.47
Source: World Bank and CRES 2011.Note: OECD = Organisation for Economic Co-operation and Development.
the exodus from rural to urban areas causes interregional imbalances.The census showed that 1.3 million (13 percent) of Senegal’s 9.9 millioncitizens live outside their birth regions. Between 1998 and 2002, inter-nal migration increased by an annual average of 2.1 percent.
The Dakar region was the principal destination for most of thesemigrants (47 percent). It was followed by the Diourbel (13 percent)and Thiès (12 percent) regions. People migrate primarily to the regionsof Dakar, Thiès, and Diourbel for economic development and employ-ment opportunities. Others move because of a shortage of food in therural areas or because of climatic reasons, such as inadequate rainfall.
However, relatives cannot continue to rely on migrants for help,and for many rural inhabitants, migration to urban areas is only a stop-gap solution. Interviews with residents revealed that 78 percent of theheads of household had received no assistance from their relativeswho migrated to other towns. The few transfers received in the villagewere typically sent by the younger relatives, particularly girlsemployed in domestic service in urban centers (Bruzzone and others2006). As the crisis in rural areas worsens, there is increased migrationto urban areas as people search for work and additional income.
Characteristics of the Remittance Industry in Senegal
In Senegal, remittances can be transferred either through formal moneytransfer services—such as the post office and banks—or through infor-mal channels where the transfers are made directly by migrants or aresent through relatives, friends, or other intermediaries (Bruzzone andothers 2006; AfDB 2007). The new money transfer models, whetherformal or informal, have enhanced their operations through informa-tion and communication technologies.
The Formal MarketThe most common formal channels are banks, MTOs, the post office, andmicrofinance institutions (MFIs). MTOs transfer money through consor-tiums with the other three.
Banks. The bancarization rate in Senegal’s remittance service industryis estimated to be only about 6 percent (Sander and Barro 2007).3
Transfers through the banking channels accounted for 10 percent of thetotal volume of remittances, or about CFAF 82 billion, as table 8.5shows (AfDB 2007).
Senegal 229
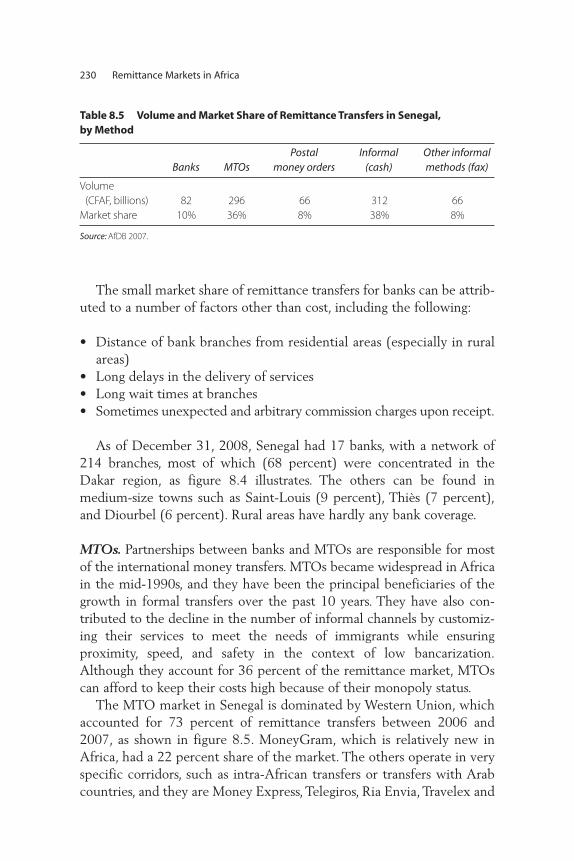
The small market share of remittance transfers for banks can be attrib-uted to a number of factors other than cost, including the following:
• Distance of bank branches from residential areas (especially in ruralareas)
• Long delays in the delivery of services• Long wait times at branches• Sometimes unexpected and arbitrary commission charges upon receipt.
As of December 31, 2008, Senegal had 17 banks, with a network of214 branches, most of which (68 percent) were concentrated in theDakar region, as figure 8.4 illustrates. The others can be found inmedium-size towns such as Saint-Louis (9 percent), Thiès (7 percent),and Diourbel (6 percent). Rural areas have hardly any bank coverage.
MTOs. Partnerships between banks and MTOs are responsible for mostof the international money transfers. MTOs became widespread in Africain the mid-1990s, and they have been the principal beneficiaries of thegrowth in formal transfers over the past 10 years. They have also con-tributed to the decline in the number of informal channels by customiz-ing their services to meet the needs of immigrants while ensuringproximity, speed, and safety in the context of low bancarization.Although they account for 36 percent of the remittance market, MTOscan afford to keep their costs high because of their monopoly status.
The MTO market in Senegal is dominated by Western Union, whichaccounted for 73 percent of remittance transfers between 2006 and2007, as shown in figure 8.5. MoneyGram, which is relatively new inAfrica, had a 22 percent share of the market. The others operate in veryspecific corridors, such as intra-African transfers or transfers with Arabcountries, and they are Money Express, Telegiros, Ria Envia, Travelex and
230 Remittance Markets in Africa
Table 8.5 Volume and Market Share of Remittance Transfers in Senegal, by Method
Banks MTOsPostal
money ordersInformal
(cash)Other informal methods (fax)
Volume (CFAF, billions) 82 296 66 312 66
Market share 10% 36% 8% 38% 8%
Source: AfDB 2007.
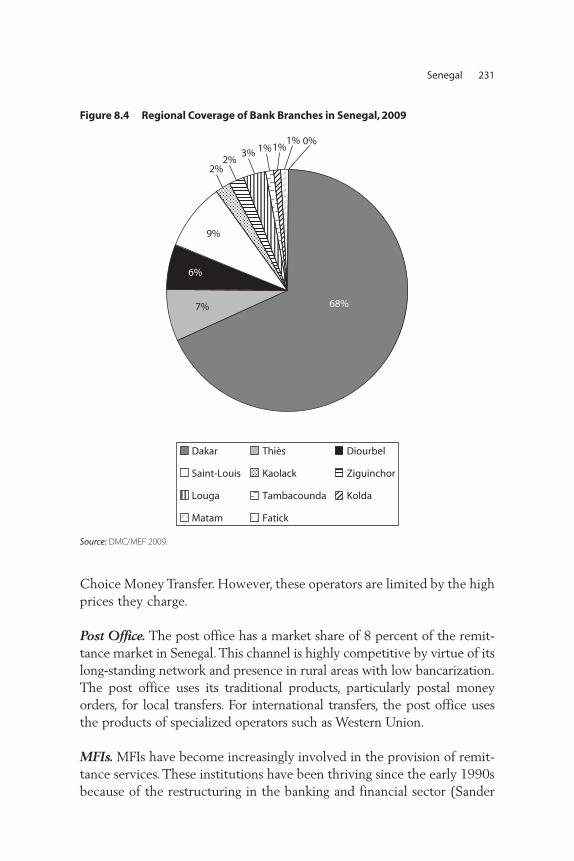
Choice Money Transfer. However, these operators are limited by the highprices they charge.
Post Office. The post office has a market share of 8 percent of the remit-tance market in Senegal. This channel is highly competitive by virtue of itslong-standing network and presence in rural areas with low bancarization.The post office uses its traditional products, particularly postal moneyorders, for local transfers. For international transfers, the post office usesthe products of specialized operators such as Western Union.
MFIs. MFIs have become increasingly involved in the provision of remit-tance services. These institutions have been thriving since the early 1990sbecause of the restructuring in the banking and financial sector (Sander
Senegal 231
Dakar Thiès Diourbel
Saint-Louis Kaolack Ziguinchor
Louga Tambacounda Kolda
Matam Fatick
6%
68%7%
9%
2%2%
3% 1%1%1% 0%
Figure 8.4 Regional Coverage of Bank Branches in Senegal, 2009
Source: DMC/MEF 2009.
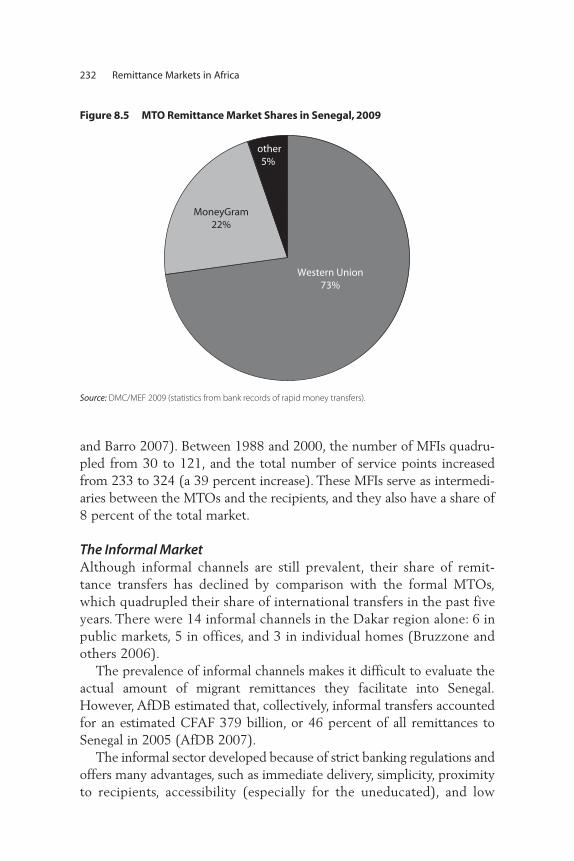
and Barro 2007). Between 1988 and 2000, the number of MFIs quadru-pled from 30 to 121, and the total number of service points increasedfrom 233 to 324 (a 39 percent increase). These MFIs serve as intermedi-aries between the MTOs and the recipients, and they also have a share of8 percent of the total market.
The Informal MarketAlthough informal channels are still prevalent, their share of remit-tance transfers has declined by comparison with the formal MTOs,which quadrupled their share of international transfers in the past fiveyears. There were 14 informal channels in the Dakar region alone: 6 inpublic markets, 5 in offices, and 3 in individual homes (Bruzzone andothers 2006).
The prevalence of informal channels makes it difficult to evaluate theactual amount of migrant remittances they facilitate into Senegal.However, AfDB estimated that, collectively, informal transfers accountedfor an estimated CFAF 379 billion, or 46 percent of all remittances toSenegal in 2005 (AfDB 2007).
The informal sector developed because of strict banking regulations andoffers many advantages, such as immediate delivery, simplicity, proximityto recipients, accessibility (especially for the uneducated), and low
232 Remittance Markets in Africa
Western Union73%
MoneyGram22%
other5%
Figure 8.5 MTO Remittance Market Shares in Senegal, 2009
Source: DMC/MEF 2009 (statistics from bank records of rapid money transfers).
costs. For customers who do not meet formal-sector identificationrequirements or cannot provide proof of residence, the informal chan-nel is often the only option. The reasons for use of informal channelsinclude exchange rate fluctuations, bank branch inaccessibility,national coverage, time spent at branches, cost, safety, low rate of bancarization, and the number of unauthorized foreign residents(AfDB 2007).
Partnerships and Exclusivity Contract IssuesAs specified in Article 2 of the regulations that guide the external finan-cial relations of member states of the West African Economic andMonetary Union (WAEMU), money transfer services may be conductedonly through the BCEAO (Banque Centrale des Etats de l’Afrique del’Ouest), the postal administration, and licensed intermediaries—banksestablished in a WAEMU-member state that are licensed to engage inforeign exchange operations.4 To comply with this regulation, the remit-tance market in Senegal is therefore characterized by partnerships, eitherbetween MTOs and banks or between banks and MFIs.
To ply their trade, MTOs must rely on a licensed intermediary withwhom they must sign a contract and confer on the intermediary status ofagent or subagent.
MFIs operating under the Project for the Regulation of Credit Unions(Projet d’Appui à la Réglementation sur les Mutuelles d’Épargne et deCrédit, or PARMEC) law may also engage in money transfer operations.However, they must first obtain a license from the Ministry of Finance(through the unit that provides technical assistance for popular savingsand credit banks) by submitting an application, stating their reasons, andproviding supporting documentation. Banks also use MFIs to expandtheir coverage, by issuing a memorandum of understanding that confersthe status of subagent on the MFI.
As the leading MTO in Senegal, Western Union established exclusivecontracts with the banks, as did the other MTOs established later. Thepost office, however, avoided exclusivity contracts; as a result, it has beenable to work with both Western Union and MoneyGram.
At one time, these contracts posed an entry barrier for new RSPsin view of the relatively small banking system. The resulting monopolysituation hindered competition and kept transfer costs high. Althoughthe arrival of new banks changed the landscape, the increased compet-itiveness was short-lived because the issue of exclusivity contractsarose again as the Senegalese remittance market developed. The
Senegal 233
Minister of Economy and Finance and the Currency and CreditDirectorate eventually informed all licensed intermediaries that exclu-sivity contracts were no longer permitted under the existing rules. Thisdirective was issued via a circular letter from the Minister of Economyand Finance addressed to managing directors of banks.
Remittance ProductsIn Senegal, remittances are transferred through several serviceproviders that employ different types of products or instruments.MTOs, the post office, and banks provide formal transfers as well aspayments to intermediaries for informal transfers. New informationand communications technologies have spurred development of newmoney transfer methods in both the formal and the informal sectors,including the following:
• International postal money orders. This system is widely used, althoughit is often slow and sometimes expensive. The post office uses its ownproducts in addition to the new products offered by the MTOs.
• Account-to-account transfers. A migrant with a bank account abroadcan transfer money from that account to any other account in thehome country through electronic transfers such as SWIFT or telexes.Such transfers are safe but not immediate. This method is also relativelyexpensive, particularly when the transactions involve two currencyzones.
• Transfers of funds via MTO networks. These are reliable and fast butalso expensive.
The post office is the medium for most domestic transfers, whichare made via faxed money orders or traditional money orders. The RSPsurvey in Senegal shows that electronic money transfer is the maininstrument used by almost all the formal operators. In addition to elec-tronic transfers, commercial banks use other instruments such as pre-paid usable cards, bank drafts, account-to-account transfers, andtransfers by check. Only one of the seven banks interviewed reportedusing prepaid debit cards. Cell-phone transfers have not yet been intro-duced in Senegal.
The post office also provides a variety of financial products, particu-larly for domestic transfers. In addition to postal money orders, it offerselectronic fund transfers, and users can also open savings, or “giro,”accounts. MFIs use only electronic fund transfers.
234 Remittance Markets in Africa
For their part, informal operators provide a variety of nonfinancialservices in addition to in-person fund transfers. Informal RSPs in Senegaluse three main products (AfDB 2007):
• Transfer by courier, which accounts for between 60 and 70 percent ofthe informal market, involves entrusting the remittances collectedfrom a migrant community to a single carrier. This medium relies onstrong social ties, and the transfer is made either by a member of thecommunity traveling home on vacation or through specialized couri-ers, who can transport over €10,000 in cash.
• Transfer by fax accounts for 30 percent of the informal market. It is apopular option and involves the collection of transfers at a collectionpoint (usually a tradesperson or a center). A tradesperson then distrib-utes the sum almost instantaneously to the recipients back home. Thissystem is similar to that used by MTOs and is less expensive, but it isriskier because the transactions are not documented.
• Transfer in kind through a tradesperson represents less than 5 percent ofthe informal market. It is particularly popular in rural areas and in-volves an agreement between the migrant and a tradesperson where-by the latter agrees to give credit to one or more recipients for staplegoods (such as rice, sugar, or oil). This system was created by migrantswho were concerned about misuse of their remittances.
Access to Other Financial Services In addition to remittance services, financial institutions also offerfinancial and nonfinancial products to both senders and recipients offunds. Of the surveyed RSPs, 42 percent of the firms reported thatthey provided additional services such as deposits and savings optionsto senders and recipients of funds (RSPs survey 2009). They also offerconsumer loans; business loans; credit cards; auto loans;5 and, morerecently, insurance products, mortgages, and education loans. On aver-age, 14 percent of operators indicated that they offered these productsin addition to their range of services.
The Regulatory and Business Environment
The RSP industry is strictly governed by laws and regulations. These reg-ulations restrict the emergence of new operators and limit the operationalcapacities of existing ones. Regulations preventing the establishment of
Senegal 235
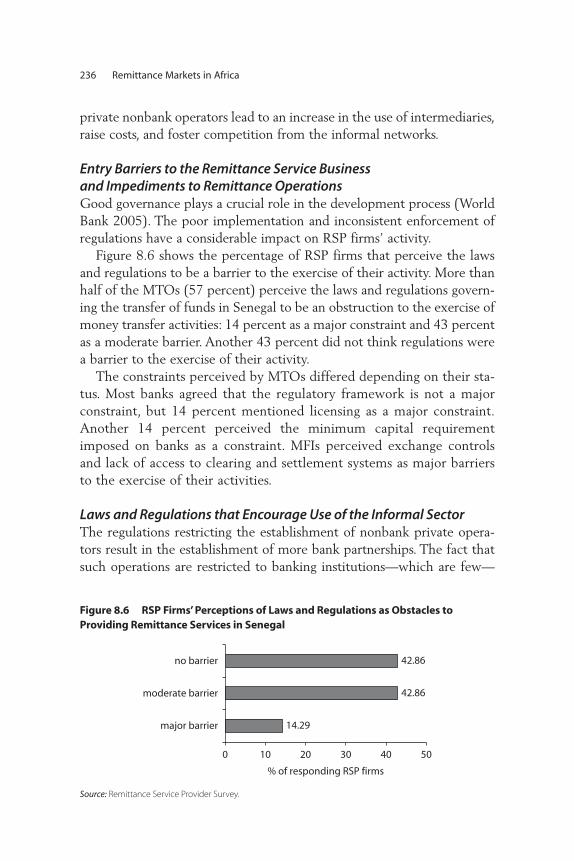
private nonbank operators lead to an increase in the use of intermediaries,raise costs, and foster competition from the informal networks.
Entry Barriers to the Remittance Service Business and Impediments to Remittance OperationsGood governance plays a crucial role in the development process (WorldBank 2005). The poor implementation and inconsistent enforcement ofregulations have a considerable impact on RSP firms’ activity.
Figure 8.6 shows the percentage of RSP firms that perceive the lawsand regulations to be a barrier to the exercise of their activity. More thanhalf of the MTOs (57 percent) perceive the laws and regulations govern-ing the transfer of funds in Senegal to be an obstruction to the exercise ofmoney transfer activities: 14 percent as a major constraint and 43 percentas a moderate barrier. Another 43 percent did not think regulations werea barrier to the exercise of their activity.
The constraints perceived by MTOs differed depending on their sta-tus. Most banks agreed that the regulatory framework is not a majorconstraint, but 14 percent mentioned licensing as a major constraint.Another 14 percent perceived the minimum capital requirementimposed on banks as a constraint. MFIs perceived exchange controlsand lack of access to clearing and settlement systems as major barriersto the exercise of their activities.
Laws and Regulations that Encourage Use of the Informal SectorThe regulations restricting the establishment of nonbank private opera-tors result in the establishment of more bank partnerships. The fact thatsuch operations are restricted to banking institutions—which are few—
236 Remittance Markets in Africa
14.29
42.86
42.86
0 10 20 30 40 50
major barrier
moderate barrier
no barrier
% of responding RSP firms
Figure 8.6 RSP Firms’ Perceptions of Laws and Regulations as Obstacles to Providing Remittance Services in Senegal
Source: Remittance Service Provider Survey.
increases costs because such institutions are forced to supplement theirnetworks with subagents with whom they share commissions (Sanderand Barro 2007).
In addition, the ceilings on transfers and the minimum capital require-ment encourage the use of informal networks, which are more difficultto monitor. Naturally, such informal transfers are not monitored by thecentral bank, and transfers are therefore not guaranteed. Even in caseswhere these requirements pose no problem for senders, particularly fordomestic and WAEMU transfers, MTOs still perceive the ceiling ontransfers outside the zone to be a problem. Migrants also consider theceiling too low because they sometimes have to make large transfers tofriends or partners living outside the WAEMU zone and are thus forcedby the system to split the transfers to stay below the ceiling. This can bevery costly.
The expansion of remittance services to meet demand has changed therelationship that customers have with their banks. Almost all MTOs(86 percent) have established branches to serve more customers. Anydelay in the receipt of remittances is reported to the customer servicedepartment, and the time taken to resolve customer grievances is quiteshort—usually not more than one week (RSP survey).
Formal RSPs face competition from the informal operators becausethe informal sector has many advantages—proximity to recipients,simplicity of operations, lack of overhead, and freedom from regulatoryconstraints—and offers low-cost products. Of the firms interviewed,29 percent acknowledged that competition from informal operators isa major obstacle.
Remittance Costs and Identification RequirementsFund transfers through formal networks (banks or specialized agents) arefast, reliable, and convenient. For example, a transfer sent by WesternUnion can take as little as 10 minutes to reach the recipient. In addition,neither the recipient nor the sender has to open a bank account to trans-fer money, and the sender does not need to provide identification, whichcould be an advantage for illegal immigrants who would rather remainanonymous (Sander and Barro 2007).
However, these services are expensive. The RSP survey revealed thatthe commission charged on an international transfer of US$200 is13 percent by banks and 15 percent by the post office. The commissioncharged by Western Union on a domestic transfer of US$96 is 9.75 percent, the commission charged on a transfer of US$435 within the
Senegal 237
WAEMU subregion is 7.36 percent, and the commission charged on aninternational transfer of US$483 is 10 percent (Sander and Barro 2007).
MTOs require both senders and recipients to provide proof of identi-fication. Commonly accepted documents are the national identity card,national passport, and driver’s license. Business cards and certificates ofresidence are not an acceptable form of identification.
The study makes specific recommendations on data collection, regula-tion of the market remittances services, and the cost of remittances.
To improve data collection on remittance flows, it recommendsestablishing an elaborate system for formal remittance data collection;designing a regular study on informal remittance flows to improveunderstanding of informal remittance networks; and designing periodhousehold surveys on migration and remittances.
To facilitate the access to the market of transfer of money, it recom-mends reducing the constraints of the regulation of the IMF in such areasas minimum capital requirements and the ceiling of transfers.
To lower transaction costs, it recommends stimulating competitionamong banks and other nonfinancial institutions to help reduce overalltransaction fees, as well as increasing the usage of new technologies formoney transfer.
Conclusion
According to this analysis of migrant remittances, some conclusions canbe drawn:
• The remittance market in Senegal consists of both formal and infor-mal operators, providing a wide range of services in the various part-nership arrangements.
• Of the many diversified origin countries of remittances, the Euro-pean Union ranks highest, with more than half of the total amount oftransfers.
• The remittance flows received by Senegal have increased considerablyin the past five years, becoming the principal source of external fi-nancing for the Senegalese economy—far exceeding FDI, externalborrowing, and, above all, ODA.
• As the principal source of external financing, remittances help in ad-justing the current account balance and play an important role in thefinancing of household budgets and poverty reduction.
238 Remittance Markets in Africa
• Informal remittances occupy an important place in the remittancemarket and have many advantages for the population, particularly thepoor, because of the proximity to recipients, simplicity of operations,lack of overhead costs, freedom from regulatory constraints, andlow-cost products.
Notes
1. The International Monetary Fund Balance of Payments Manual (which coversonly official channels) defines and measures remittances as the total of “work-ers’ remittances” abroad, “compensation of employees,” and “migrants’ trans-fers” (World Bank 2008). “Workers’ remittances” are transfers by migrantsconsidered to be residents (for at least one year) in the host country.“Compensation of employees” includes all earnings of migrants who havebeen in the host country for less than one year. “Migrants’ transfers” corre-spond to the net value of migrants’ assets transferred from the host countryto the country of origin.
2. World Bank 2011.
3. Bancarization is defined as the proportion of the population with a bankaccount. It is measured by an index called the rate of bancarization.
4. See R09/98/CM/UEMOA of December 20, 1998.
5. Twenty-nine percent of operators interviewed offer auto loans.
References
AfDB (African Development Bank). 2007. “Les transferts de fonds des migrants,un enjeu de développement: Les Comores, Mali, Maroc, Sénégal.” Rapportprovisoire, AfDB, Abidjan, Côte d’Ivoire. http://www.afdb.org.
ANSD (Agence Nationale de la Statistique et de la Démographie) du Sénégal.2002. Troisième Recensement de la Population et de l’Habita (RGPH-III).Rapport National. République du Sénégal, Ministère de l’Economie et desFinances.
———. 2004. Enquête Sénégalaise Auprès des Ménages (ESAM II). Rapportnational. République du Sénégal, Ministère de l’Economie et des Finances.
Ammassari, S. 2004. “Gestion des migrations et politiques de développement:Optimiser les bénéfices de la migration internationale en Afrique de l’Ouest.”Cahiers des migrations internationales,72 F, Genève, BIT.
BCEAO (Banque Centrale des Etats de l’Afrique de l’Ouest). Various years.Database.
Senegal 239
———. 2008.
Bruzzone T. P., D. Fall, M. Tall, C. Gueye. 2006. “Le milieu sénégalais et l’actiontransnationale des migrants.” Working paper, Rome.
CESPI (CentroStudidiPoliticaInternazionale). http://www.cespi.it.
Daffé, G. 2008. “Les transferts d’argent des migrants sénégalais entre espoir etrisques de dépendance.” In Le Sénégal des migrations: mobilités, identités etsociétés, ed. M. C. Diop, 105–32. Paris/Dakar: Research Center on Social Policy(CREPOS)/Karthala–ONU Habitat.
DMC (Direction de Monnaie et du Crédit)/MEF (Ministère de l’Economie et desFinances) du Sénégal. 2009. Database.
DPEE (Department of Forecasting and Economic Studies, Senegal Ministry ofEconomy and Finance). 2008. “Impact des transferts des migrants sur la pau-vreté au Sénégal.” Working Paper 7, DPEE, Dakar.
Kapur D. 2004. “Remittances, the New Development Mantra?” G-24 DiscussionPaper Series, United Nations, New York and Geneva.
Ratha D. 2003. “Workers’ Remittances: An Important and Stable Source ofExternal Development Finance.” In Global Development Finance: Striving forStability in Development Finance. Washington, DC: World Bank.
Ratha D., S. Mohapatra, and S. Plaza. 2008. “Beyond Aid: New Sources andInnovative Mechanisms for Financing Development in Sub-Saharan Africa.”Development Prospects Group, World Bank, Washington, DC.
Remittance Service Provider Survey. 2009.
République du Sénégal/Communauté Européenne. 2007. “Migration etdéveloppement: Opportunités et défis s’offrant aux décideurs.” Document destratégie pays et programme indicatif national pour la période 2008–2013.
Russell, S. S. 1986. “Remittances from International Migration: A Review inPerspective.” World Development, 14 (6): 677–96.
Sander, C., and I. Barro. 2007. “Étude sut le transfert d’argent des émigrés auSénégal et les services de transfert en microfinance.” Document de travail 40,Bureau International du Travail, Social Finance Program, Geneva.
Shaw W. 2007. “Migration in Africa: A Review of the Economic Literature onInternational Migration in 10 Countries.” Development Prospects Group,World Bank, Washington, DC.
World Bank. 2005. “Enquête Climat des Investissements au Sénégal.” Report37174 SE World Bank, Washington, DC.
———. 2008. “Recueil de statistiques 2008 sur les migrations et les envois defonds.” World Bank, Washington, DC. http://www.worldbank.org/prospects/migrationandremittances.
240 Remittance Markets in Africa
———. 2010. World Development Indicators 2010. Washington, DC: World Bank.http://data.worldbank.org/data-catalog/world-development-indicators/wdi-2010.
———. 2011. Migration and Remittances Factbook 2011. Washington, DC: WorldBank. http://go.worldbank.org/QGUCPJTOR0.
World Bank and CRES. 2011. “Migration and Remittances Survey in Senegal–2009.”Survey Report. World Bank and CRES, Washington, DC.
Senegal 241

243
Migrant remittances are increasingly becoming a significant source ofdevelopment finance in Uganda, which had a recorded amount of remit-tances equivalent to 5 percent of gross domestic product (GDP) in 2009(World Bank 2011). Users of money transfer services in Uganda includeindividuals, traders, firms, nongovernmental organizations (NGOs), andother users; however, research shows that the market for money transferservices in Uganda is underserviced (Sander, Mukwana, and Millinga2001). As the government becomes more decentralized and as the middleclass, which supports families in villages and builds houses up-country,continues to grow, the demand for domestic money transfer services isexpected to continue increasing.
This chapter explores the remittance service provider (RSP) market inUganda and focuses on various aspects of money transfer products orservices, including accessibility, reliability, service networks, competition,and affordability.1 The chapter explores the chances of enhancing accessto financial services by providing remittance services. A survey of RSPs inUganda was carried out in the second half of 2008, and it covered bothformal and informal RSPs.
C H A P T E R 9
Uganda
Rose W. Ngugi And Edward Sennoga
Some of the key conclusions of this chapter include the following:
• Data collection on the flows of remittances at the domestic-marketlevel is not well institutionalized. Even commercial banks do not havean elaborate system for reporting remittances.
• Remittance service providers are diverse, including formal and non-formal providers. Banks remain the core institutions in the moneytransfer market, because they work in partnership with all otherformal RSP providers (for both domestic and international remit-tances). Networking and partnership are common among theproviders of remittance services, reflecting a significant level of com-plementarity. However, money-transfer clients are constrained byhigh transaction costs in accessing additional financial services fromthe banking sector.
• Direct costs of remittance transfers are significantly high among thevarious providers. The cost for sending US$200 is between 10 percentand 17 percent for international transfers and between 0.4 percentand 12.5 percent for domestic transfers.
• Informal services, such as community-based firms and transportfirms, have evolved to fill the gaps left by banks, including the highcosts, limited accessibility, minimal coverage, and slow speed oftransfers.
• Mobile money transfer services, such as Simba Cash and MTN MobileMoney are gaining entry but they are well below the rate of adoptionseen in neighboring Kenya.
• Formal RSPs are under a regulatory mechanism of the central bank.The central bank requests that the banks and foreign exchange bureausgather information from the customers by asking for the identificationof the senders and recipients. In brochures, the RSPs also provide infor-mation to the customers on the type of services offered, includingother services.
The rest of the chapter is organized as follows. The first section dis-cusses trends and uses of remittances, the second section covers the char-acteristics of the remittance industry, the third section addresses theregulatory and business environment, the fourth section highlights thecosts and identification requirements for remittances, the fifth sectionexplores remittance sources and destinations, and the sixth sectionconcludes.
244 Remittance Markets in Africa
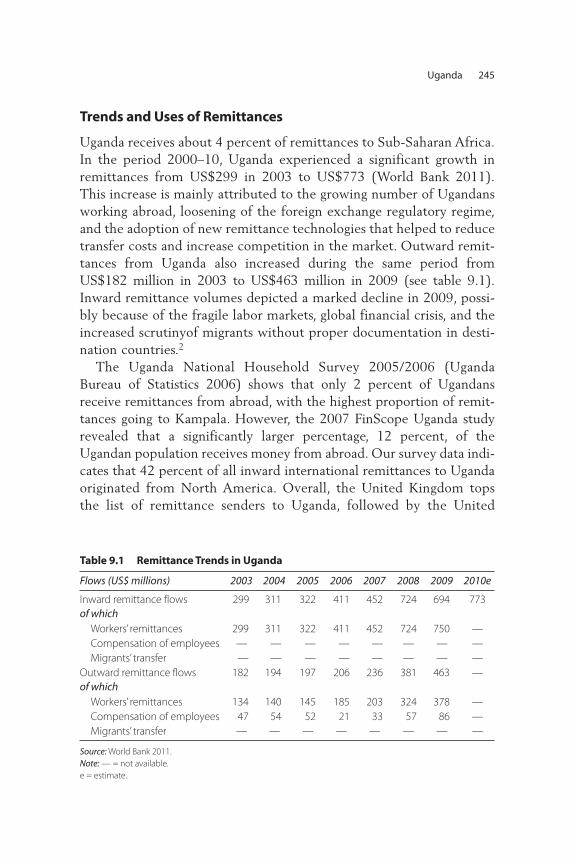
Trends and Uses of Remittances
Uganda receives about 4 percent of remittances to Sub-Saharan Africa.In the period 2000–10, Uganda experienced a significant growth inremittances from US$299 in 2003 to US$773 (World Bank 2011).This increase is mainly attributed to the growing number of Ugandansworking abroad, loosening of the foreign exchange regulatory regime,and the adoption of new remittance technologies that helped to reducetransfer costs and increase competition in the market. Outward remit-tances from Uganda also increased during the same period fromUS$182 million in 2003 to US$463 million in 2009 (see table 9.1).Inward remittance volumes depicted a marked decline in 2009, possi-bly because of the fragile labor markets, global financial crisis, and theincreased scrutinyof migrants without proper documentation in desti-nation countries.2
The Uganda National Household Survey 2005/2006 (UgandaBureau of Statistics 2006) shows that only 2 percent of Ugandansreceive remittances from abroad, with the highest proportion of remit-tances going to Kampala. However, the 2007 FinScope Uganda studyrevealed that a significantly larger percentage, 12 percent, of theUgandan population receives money from abroad. Our survey data indi-cates that 42 percent of all inward international remittances to Ugandaoriginated from North America. Overall, the United Kingdom topsthe list of remittance senders to Uganda, followed by the United
Uganda 245
Table 9.1 Remittance Trends in Uganda
Flows (US$ millions) 2003 2004 2005 2006 2007 2008 2009 2010e
Inward remittance flows 299 311 322 411 452 724 694 773of which
Workers’ remittances 299 311 322 411 452 724 750 —Compensation of employees — — — — — — — —Migrants’ transfer — — — — — — — —
Outward remittance flows 182 194 197 206 236 381 463 —of which
Workers’ remittances 134 140 145 185 203 324 378 —Compensation of employees 47 54 52 21 33 57 86 —Migrants’ transfer — — — — — — — —
Source: World Bank 2011. Note: — = not available. e = estimate.
States, Australia, Canada, and Kenya. Remittances are mainly used forconsumption (65 percent), education (31 percent), and health (29 per-cent) (note that the categories are not mutually exclusive and add upto more than 100 percent) (FinScope Uganda 2007). The UgandaNational Household Survey 2005/2006 also reports similar findingsthat half of recipients spent remittances on consumption, while 26 per-cent used remittances for education. Furthermore, the Bank of Uganda(2008) revealed that remittances were used for consumption, educa-tion, investment, and health. The main investment expenditure typesinclude acquisition of property (such as land and buildings), start-upbusinesses, and farming.
In Sub-Saharan Africa, the Democratic Republic of Congo, Kenya,South Africa, and Tanzania are the major remittance source countriesto Uganda. A sizeable population of students from Kenya and Tanzaniaattend universities and colleges in Uganda. Consequently, the observedremittance inflows could be transfers to offset tuition and relatedexpenses, including general upkeep. South Africa is a major destinationfor Ugandan workers seeking “greener” pastures within the Africancontinent. Inflows from South Africa could be transfers from immi-grants to their families and acquaintances in Uganda. Uganda is also abase for United Nations operations (such as the United NationsOrganization Mission in the Democratic Republic of Congo, or MONUC)in the great lakes region. Consequently, several Ugandan expatriatesand businessmen are working and doing business with their counter-parts in the Democratic Republic of Congo DRC. Thus, money trans-fers from the Democratic Republic of Congo could comprise bothmigrant remittances and payments in business settlements and busi-ness-related transactions.
As of 2010, the number of emigrants from Uganda was 757,500, or 2.2percent of Uganda’s population (World Bank 2011). The top destinationswere Kenya, the United Kingdom, Tanzania, the United States, Rwanda,Canada, Sweden, and Australia. It is important to note that emigrationfrom Uganda to the United Kingdom has a historical basis given thatUganda was a British colony.
According to the survey of RSPs, the main destination of remittancesfrom Uganda in 2007 was Kenya, followed by India, the United States,Tanzania, the Democratic Republic of Congo, South Africa, and theUnited Kingdom.
It is important to note that the top 25 percent of foreign direct invest-ment (FDI) firms in Uganda are of Kenyan origin. One limitation of our
246 Remittance Markets in Africa
RSP survey data is the inability to distinguish between remittances andother money transfers such as repatriation of profits, loan repayments,dividends, and royalties. As mentioned earlier, because of the vibranttrade, especially between Uganda and the Southeast Asian countries, mostof the money transfers to these countries could be for purchasing of mer-chandise and for other business-related purposes.
Results of the survey of RSPs are comparable to the results of the2005/2006 Uganda National Household Survey, which showed that themean monthly values received varied among regions, with Kampala reg-istering the highest value (U Sh 130,500, or US$75). The FinScopeUganda study (2007) found that almost 50 percent of remittance recipi-ents received US$200 or less, while only 13 percent received more thanUS$500.
Migrants in search of employment tend to move to industrial towns orurban centers such as Mbale, Jinja, and Kampala to work in factories, onplantations, and on exotic flower farms. Migrants who find employmentin the formal sector often use the formal sector RSPs, such as banks andnonbank financial institutions (box 9.1), to transfer money to their fami-lies mainly for upkeep and settlement of school fees. In contrast, migrantsin the informal sector transfer money using casual means such as taxis andbus companies, family members, and friends, or migrants transfer moneythemselves whenever they return to their region of origin. In addition,business people who move from one region to another in search of mer-chandise and agricultural products also provide informal money transferservices. This transfer method usually requires a very informal arrange-ment, largely based on trust, between the money remitter and the busi-nessperson; there is no guarantee of transfer or “insurance coverage” forthe money involved. Remittance volumes in Uganda range from smallamounts such as U Sh 50,000 for upkeep to millions of Ugandan shillingsfor purchasing merchandise and agricultural products such as coffee andfarm inputs. Therefore, remittance flows tend to peak at the beginning ofa new school trimester and at harvest season, especially for agriculturalproduce.
Characteristics of the Remittance Industry
The entry of new RSPs into the market reflects a response to existingmarket gaps. Differences among the scope of services, products pro-vided, and product costs exist. Sander, Mukwana, and Millinga (2001)underscore five key attributes for a good money-transfer product or
Uganda 247
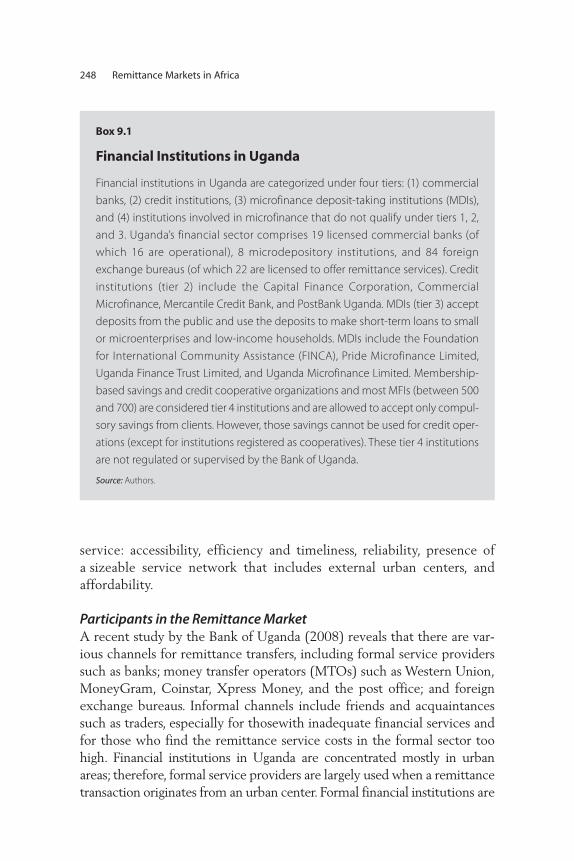
service: accessibility, efficiency and timeliness, reliability, presence ofa sizeable service network that includes external urban centers, andaffordability.
Participants in the Remittance MarketA recent study by the Bank of Uganda (2008) reveals that there are var-ious channels for remittance transfers, including formal service providerssuch as banks; money transfer operators (MTOs) such as Western Union,MoneyGram, Coinstar, Xpress Money, and the post office; and foreignexchange bureaus. Informal channels include friends and acquaintancessuch as traders, especially for thosewith inadequate financial services andfor those who find the remittance service costs in the formal sector toohigh. Financial institutions in Uganda are concentrated mostly in urbanareas; therefore, formal service providers are largely used when a remittancetransaction originates from an urban center. Formal financial institutions are
248 Remittance Markets in Africa
Box 9.1
Financial Institutions in Uganda
Financial institutions in Uganda are categorized under four tiers: (1) commercial
banks, (2) credit institutions, (3) microfinance deposit-taking institutions (MDIs),
and (4) institutions involved in microfinance that do not qualify under tiers 1, 2,
and 3. Uganda’s financial sector comprises 19 licensed commercial banks (of
which 16 are operational), 8 microdepository institutions, and 84 foreign
exchange bureaus (of which 22 are licensed to offer remittance services). Credit
institutions (tier 2) include the Capital Finance Corporation, Commercial
Microfinance, Mercantile Credit Bank, and PostBank Uganda. MDIs (tier 3) accept
deposits from the public and use the deposits to make short-term loans to small
or microenterprises and low-income households. MDIs include the Foundation
for International Community Assistance (FINCA), Pride Microfinance Limited,
Uganda Finance Trust Limited, and Uganda Microfinance Limited. Membership-
based savings and credit cooperative organizations and most MFIs (between 500
and 700) are considered tier 4 institutions and are allowed to accept only compul-
sory savings from clients. However, those savings cannot be used for credit oper-
ations (except for institutions registered as cooperatives). These tier 4 institutions
are not regulated or supervised by the Bank of Uganda.
Source: Authors.
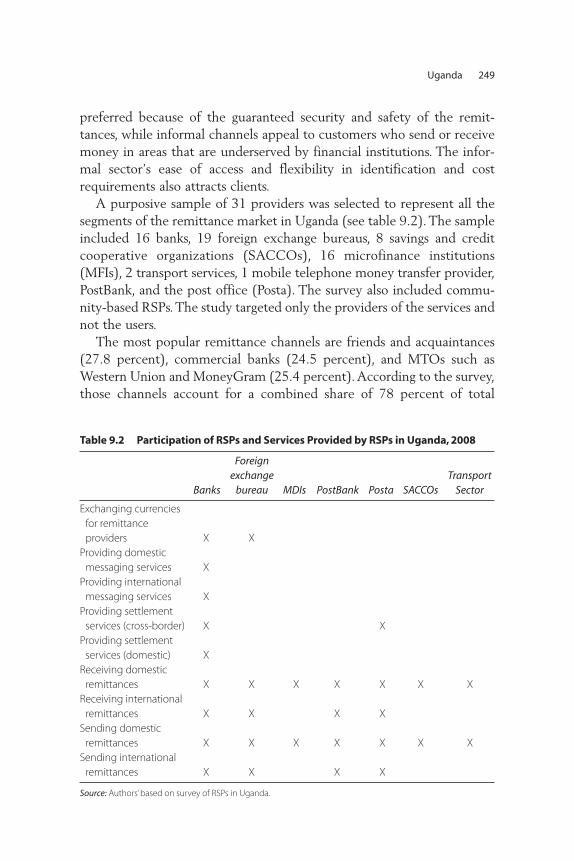
preferred because of the guaranteed security and safety of the remit-tances, while informal channels appeal to customers who send or receivemoney in areas that are underserved by financial institutions. The infor-mal sector’s ease of access and flexibility in identification and costrequirements also attracts clients.
A purposive sample of 31 providers was selected to represent all thesegments of the remittance market in Uganda (see table 9.2). The sampleincluded 16 banks, 19 foreign exchange bureaus, 8 savings and creditcooperative organizations (SACCOs), 16 microfinance institutions(MFIs), 2 transport services, 1 mobile telephone money transfer provider,PostBank, and the post office (Posta). The survey also included commu-nity-based RSPs. The study targeted only the providers of the services andnot the users.
The most popular remittance channels are friends and acquaintances(27.8 percent), commercial banks (24.5 percent), and MTOs such asWestern Union and MoneyGram (25.4 percent). According to the survey,those channels account for a combined share of 78 percent of total
Uganda 249
Table 9.2 Participation of RSPs and Services Provided by RSPs in Uganda, 2008
Banks
Foreignexchange
bureau MDIs PostBank Posta SACCOsTransport
Sector
Exchanging currenciesfor remittanceproviders X X
Providing domesticmessaging services X
Providing internationalmessaging services X
Providing settlementservices (cross-border) X X
Providing settlementservices (domestic) X
Receiving domestic remittances X X X X X X X
Receiving internationalremittances X X X X
Sending domestic remittances X X X X X X X
Sending internationalremittances X X X X
Source: Authors’ based on survey of RSPs in Uganda.
remittances received in 2006. Other channels reported include foreignexchange bureaus, the post office, traders, and MFIs. Informal moneytransfer services such as relatives or self-transfers are still the most com-monly used methods, especially for small transfer amounts, althoughsemi-formal providers such as bus and courier companies are making sub-stantial headway into a largely untapped domestic remittance market.MTN, a telecom service provider in Uganda, began a pilot service knownas MTN mobile money transfer service. This service allows customers totransfer money between phones on the MTN network.
The most common international money transfer agencies includeWestern Union, MoneyGram, and Express Money, and they operate withboth banks and foreign exchange bureaus in Uganda. Transfers throughthese agencies can be collected instantly at any location worldwide. Theseagencies offer an online tracking facility for transfers, and senders andrecipients do not have to be account holders with the financial institutionfacilitating the transfer. The sender usually pays the transfer fees, and therecipient is usually required to present an acceptable form of identifica-tion and to answer a security question before receiving the money.
The formal, semi-formal, and informal financial and nonfinancial sec-tors in Uganda play significant and diverse roles in international anddomestic remittances. International remittances are largely conductedthrough the formal sector and community-based systems (friends and rel-atives), while the semi-formal and informal sector providers play a sizablerole in the provision of domestic remittances. However, an accurate esti-mate of the actual size of the formal sector vis-à-vis the informal sector ishampered by the increased sophistication with which remittances aretransmitted in Uganda. In several instances, money received through for-mal financial institutions is transferred from large banks to smaller finan-cial institutions, including those in the informal sector such as MFIs andSACCOs, which have more intricate branch networks. Attributing andreconciling remittance amounts handled by any one of the four tiers (seeAppendix II) often leads to double counting and gross misrepresentation.
In Uganda, RSPs have a wide network across the country, but the thosein major urban centers dominate because of the large number of outletsand the mix of providers. Thirty-six percent of bank branches and 32 per-cent of the PostBank branches are located in Kampala, the capital city.The nonbank financial institutions are quite evenly distributed betweenurban and rural areas, with 26 percent of the branches in Kampala andEntebbe, 22 percent in the eastern region, and 25 percent in the westernregion. All 22 licensed money-remitting foreign exchange bureaus and
250 Remittance Markets in Africa
their branches are located in Kampala. Other RSPs in the formal sectorinclude the post office, as well as Simba Telecom, which offers remittanceservices through MTN Uganda’s telecommunications network. Over76 percent of Posta Uganda operations (Uganda’s postal system) are locatedin rural areas, making it the most widely distributed remittance serviceprovider in Uganda. The key semi-formal and informal sector players in thisindustry include MFIs, SACCOs, bus companies, commuter taxis, moneylenders, and prominent businesspersons. The Association of MicrofinanceInstitutions of Uganda and the Uganda Cooperative Savings and CreditUnion—the two major bodies that oversee the operations of MFIs andSACCOs, respectively—estimated the number of registered MFIs andSACCOs at more than 1,000 countrywide. However, most of these tier 4institutions are location specific with limited or no branch networks.
Simba Cash, a subsidiary of Simba Telecom Uganda Limited, is one ofthe more recent additions to the money remittance industry in Uganda.Simba Cash provides remittance services in partnership with MTNUganda and Nokia Uganda. Money remitted by any one of the 60 SimbaTelecom shops across the country is available for pick-up within minutesof completing the remittance transaction. Point-of-sale machines in thevarious shops are connected by server through Generic Packet RadioService (GPRS) lines to the head office shop in Kampala. Currently, onlydomestic money transfer services are provided. Simba Cash also offerscurrency exchange services to remittance senders and recipients. Thesender communicates details such as remittance amounts, passwords, andpayout locations to the recipient through the telephone.
Informal sector remittance providers such as bus companies andSACCOs also employ diverse modes of business operations. For instance,one of the SACCOs surveyed indicated that it uses partnerships withcommercial banks (for example, Stanbic Bank and Centenary Bank) toprovide remittance services to its members. Another bus companyrevealed that it uses its own network of office locations in various citiesand countries to offer remittance services. The transport system hasemerged as a mode of money transfer in response to unmet demand, par-ticularly among the unbanked population. Thus, transport services fill thevoid in areas where communication and access to banking services is lim-ited. Although the parcel licenses that transport industries hold do notallow them to transfer funds, social networking helped to facilitate thetransport sector’s entry into the remittance market.
The transport sector’s role in facilitating trade and commerce by link-ing communities through enhanced communication is both historical and
Uganda 251
significant, especially before the advent of mobile phones. In the past,individuals with families, friends, or business partners heading to therecipient’s area would negotiate with the driver or other attendant todeliver a piece of mail or a parcel to a specified destination for a fee.Often, these parcels contained low-value items; thus, the sender was notparticularly concerned about the risks associated with this mode of trans-fer, including the loss of luggage. The financial sector’s slow growth, cou-pled with the concentration of financial institutions in urban centers, hascontributed to the emergence of the transport sector as a key provider ofmoney transfer services in Uganda. This sector offers access to reliable,affordable, and risk-free money transfer services to some of the remoteregions of the country. Transfer charges can also be negotiated. Given theextensive coverage of buses and commuter taxis in Uganda, the transportsector is easily the most widespread remittance service provider. Thetransport sector caters to various clients, particularly those in regions withlimited or no access to financial services. Hence, the defining characteris-tic of clients served by the transport sector is that they are mainly fromregions underserved by financial service providers, especially money-transfer service providers.
Business ModelsThere are significant partnerships among the RSPs in Uganda. Localbanks work in partnership with foreign corresponding banks to reach outto various remittance transfer corridors. International money transferagencies work in collaboration with local banks and foreign exchangebureaus. Almost all the RSPs work closely with banking institutions. Allbut one of the financial and nonbank financial institutions surveyed indi-cated that they work with both international and domestic partners in theprovision of remittance services. These partnerships are mostly in theform of correspondent or participating financial institutions in the remit-tance source and destination countries.
For instance, Posta Uganda works in partnership with Posta Kenya andPosta Tanzania through the Universal Postal Union network. PostaUganda operates an electronic funds transfer (EFT) service Speedie inpartnership with PostBank Uganda. This service is accessible from anyone of PostBank’s 22 branches in Uganda and can be used to send andreceive both domestic and international remittances.
Formal sector RSPs also revealed that they operate with agents ofWestern Union, MoneyGram, Coinstar, and Xpress Money transferservices. In turn, Western Union works with Barclays Bank, Standard
252 Remittance Markets in Africa

Chartered Bank, and Centenary Bank in Uganda. Western Union alsoworks with a number of foreign exchange bureaus. MoneyGram’s mainagents include Stanbic Bank in Uganda. The financial and nonbank finan-cial institutions that have direct contractual obligations with the moneytransfer agents benefit in several ways, including through the provisionof marketing and advertisement, access to payment systems, and accessto relevant financial information. However, such partnership agreementsare often exclusive, suggesting that a financial or nonbank financial insti-tution can work only in partnership with one money transfer agent. Inturn, these institutions sub-contract their rights with an even wider net-work of nonbank financial institutions with explicit agreements on thesharing of the exchange-rate commission.
SACCOs and MFIs work in collaboration with microfinance deposit-taking institutions (MDIs), such as Commercial Microfinance in Uganda,to provide remittance services (especially when customers are fromdifferent SACCOs) (box 9.2). On the whole, SACCOs and MFIs holdaccounts with the bank and the nonbank financial institutions that facili-tate the remittance transfer process. This method has the advantage ofincreasing the accessibility of remittance services.
Access to the national payment system is limited for several types ofremittance service providers. For example, MFIs, PostBank, SACCOs, for-eign exchange bureaus, and money transfer agencies are not members ofthe national payment systems. The central bank expects the dealer banksto ensure that the limits set on the foreign exchange bureaus are met.However, because RSPs such as foreign exchange bureaus work in collab-oration with the money transfer agencies, this measure complicates thesituation because the foreign exchange bureaus do not operate undercentral bank statutory regulations and supervision.
Furthermore, because the transactions are not centralized, clients areat liberty to use alternative institutions to meet their needs. Currently,Simba Cash meets its reporting requirements through an MDI(Commercial Microfinance Limited); hence, Simba Cash’s transactionsare under the purview of the central bank.
The networking defines the range of remittance services provided bythe various institutions. For example, local banks with international cor-responding banks with membership in the Society for WorldwideInterbank Financial Telecommunication are able to offer remittance serv-ices overseas and provide settlement services across the border. Thus, withan adequate branch network in the country, banks could give the entirepopulation access to international remittance services.
Uganda 253
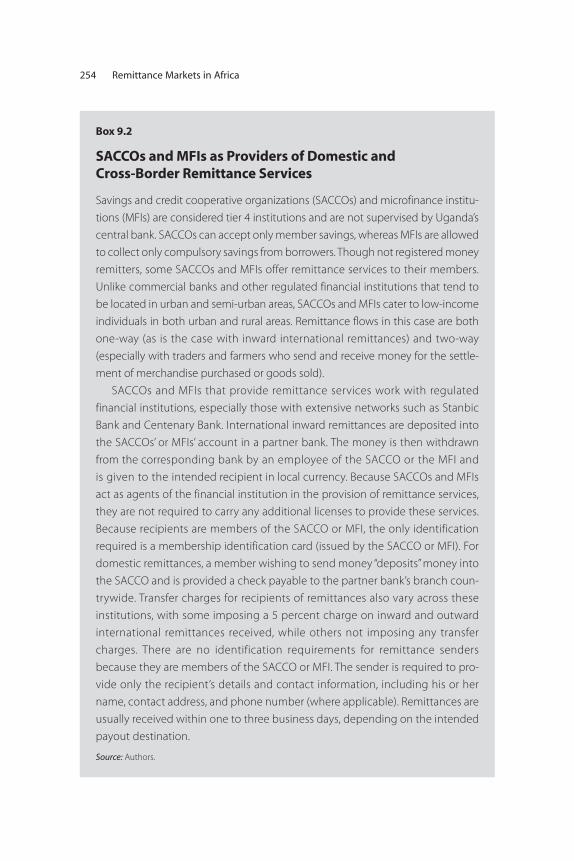
254 Remittance Markets in Africa
Box 9.2
SACCOs and MFIs as Providers of Domestic and Cross-Border Remittance Services
Savings and credit cooperative organizations (SACCOs) and microfinance institu-
tions (MFIs) are considered tier 4 institutions and are not supervised by Uganda’s
central bank. SACCOs can accept only member savings, whereas MFIs are allowed
to collect only compulsory savings from borrowers. Though not registered money
remitters, some SACCOs and MFIs offer remittance services to their members.
Unlike commercial banks and other regulated financial institutions that tend to
be located in urban and semi-urban areas, SACCOs and MFIs cater to low-income
individuals in both urban and rural areas. Remittance flows in this case are both
one-way (as is the case with inward international remittances) and two-way
(especially with traders and farmers who send and receive money for the settle-
ment of merchandise purchased or goods sold).
SACCOs and MFIs that provide remittance services work with regulated
financial institutions, especially those with extensive networks such as Stanbic
Bank and Centenary Bank. International inward remittances are deposited into
the SACCOs’ or MFIs’ account in a partner bank. The money is then withdrawn
from the corresponding bank by an employee of the SACCO or the MFI and
is given to the intended recipient in local currency. Because SACCOs and MFIs
act as agents of the financial institution in the provision of remittance services,
they are not required to carry any additional licenses to provide these services.
Because recipients are members of the SACCO or MFI, the only identification
required is a membership identification card (issued by the SACCO or MFI). For
domestic remittances, a member wishing to send money “deposits” money into
the SACCO and is provided a check payable to the partner bank’s branch coun-
trywide. Transfer charges for recipients of remittances also vary across these
institutions, with some imposing a 5 percent charge on inward and outward
international remittances received, while others not imposing any transfer
charges. There are no identification requirements for remittance senders
because they are members of the SACCO or MFI. The sender is required to pro-
vide only the recipient’s details and contact information, including his or her
name, contact address, and phone number (where applicable). Remittances are
usually received within one to three business days, depending on the intended
payout destination.
Source: Authors.
Remittance ProductsSeveral remittance products are offered in Uganda, including electroniccash transfers, pre-paid cards for use at selected retailers, bank drafts,checks or demand drafts, and money orders. Other remittance instrumentsinclude account-to-account transfers, money transfers through cellularphones, and pre-paid debit cards. Because of technological developments,a number of instruments are being used that finalize transactions at vari-ous speeds.
Electronic money transfer is the most widely available remittance prod-uct and is offered by 81 percent of the financial and nonfinancial institu-tions under review. The EFT has gained popularity in Uganda, especiallysince the introduction of a U Sh 20 million cap on checks in July 2007. Asof July 1, 2008, all government departments and agencies, including localgovernments, had adopted the EFT as the principal transaction method.According to the Bank of Uganda Clearing House rules, EFT transactionsshould reach the beneficiary’s account within 48 hours and, in the case ofany errors or omissions, the payer should be notified within 72 hours.
Checks and bank drafts are offered by 42 percent of all institutionsstudied. In Uganda, checks are cleared in three days in most parts of thecountry and one day for high-value checks. Checks from remote centersare cleared in 10 days. The real time gross settlement (RTGS) funds trans-fer system offers immediate, or “real time”, settlement options on a gross-basis principle. Instructions given to transfer money are effective within30 minutes (the transfer is done almost immediately). The central bankclears the money on the same day, and each transaction is done independ-ently. This system is used mostly for high-value payments that are at leastU Sh 10 million. In addition, checks for more than U Sh 20 million mustbe cleared throughan EFT or an RTGS. There are also issues withbounced checks. One of the major constraints in using a bank draft is thatit can be very expensive and is not cleared instantly. The amount chargedis usually fixed irrespective of the amount sent. A bank draft also requiresthe recipient to have a bank account in the country where the bank draftis deposited. In Uganda, bank drafts are used mostly by business peopleand by parents trying to settle their children’s tuition payments.
Account-to-account transfers are offered by 45 percent of all the insti-tutions studied. Banks do not charge for depositing in another person’saccount. Some banks finalize account-to-account transactions instantly,especially when the deposit is made in cash. When the deposit is bycheck, the transfer process takes up to four days. The mushrooming ofbank branches in rural areas and the ability of banks to provide additional
Uganda 255
services to the remittance recipients will help to expand access to finan-cial services. However, an account-to-account service requires that recip-ients have access to a bank account.
Posta uses various types of orders including money orders, postalorders, and interstate orders that are tailored for use in five East Africancountries (Burundi, Kenya, Rwanda, Tanzania, and Uganda). Ordinarymoney orders identify the recipient and can be cashed at only specifiedpost offices. Money orders can be drawn for any amount up to U Sh 7million for interstate transfers and U Sh 3 million for domestic transfers.The telegraphic money order guarantees customers same-day value, whilea postal order is a bearer instrument that can be cashed at any post office.Given the post office’s large distribution network (276 branches inUganda) and its ability to reach almost every village in the country, thepost office is the most widely accessible RSP.
Emerging Products: Mobile Money Transfers
Emerging products, such as mobile money (for example, Simba Cash andMTN mobile money) and debit and credit cards, are gaining popularitybecause of their versatility and affordability. Sixteen of the operationalfinancial institutions offer debit cards.3 In addition, one credit institution(Commercial Microfinance) and one MDI (Uganda Finance Trust) offerdebit card services as well. In Uganda, three of the financial institutionsstudied indicated that they offer prepaid cards that can be used at desig-nated retailers, particularly grocery stores, restaurants, and fuel stations.
The direct-debit mode of payment in Uganda has been used mainly byschools and colleges. Parents sign agreements that allow participatingcommercial banks to deduct specified amounts from a parent’s accounton behalf of the school or college to settle school tuition. Credit card useis quite limited in Uganda, with only a few banks offering this paymentmethod. Prepaid store value cards are currently not being offered by anyfinancial institution.4
Simba Cash, a subsidiary of Simba Telecom Uganda Limited, is one ofthe more recent additions to the money remittance industry in Uganda.Simba Cash provides remittance services in partnership with MTNUganda and Nokia Uganda. Money remitted at any of the Simba Telecomshops across the country is available for pick-up within minutes of com-pleting the remittance transaction. Money transferred through the net-work of Simba Cash shops involves inventory management (for smalltransfers) and account-to-account transfers (among the Simba Cash
256 Remittance Markets in Africa
shops) in cases of sizable payouts. The sending agent usually calls theagent at the expected payout location to inquire about the availability ofmoney. In the case of shortages at the expected payout locations, thesending agent initiates an account-to-account transfer to the shop receiv-ing the payout.
Parents use Simba Cash to send money for their children’s upkeep andto cover other incidentals, while workers use this medium to send tuition,upkeep money for their families, and other allowances such as paymentof farm workers and medical bills. Remittance flows are both one-way (asin the case of parents sending subsistence allowances to students) andtwo-way (as in the case of worker’s remittances).
Simba Cash is not regulated directly by the Bank of Uganda.Commercial Microfinance (CMF) reports remittance transactions thatare handled by Simba Cash to the Bank of Uganda. In essence, SimbaCash acts as an agent of CMF in the provision of money transfer services.Furthermore, as a subsidiary of Simba Telecom, operations of Simba Cashare currently regulated by the Companies Act. However, the CompaniesAct does not contain specific provisions regarding money remittanceoperations. Hence, there is no insurance coverage for money transferredthrough Simba Cash’s network.
Senders pay between 2 percent and 5 percent of remittance amountsas transfer charges. Small amounts such as U Sh 100,000 require transferfees of 5 percent, while large amounts (U Sh 1,000,000 and higher) incurlower transfer charges of 2 percent of the remittance amount.Identification requirements for both the sender and the recipient includea driver’s license, voter’s card, or village identification card. In addition,the recipient is required to provide a test question and answer, as well asthe secret code issued to the sender by Simba Cash.
MTN, one of the telecom service providers in Uganda has started amoney transfer service also referred to as MTN mobile money transferservice. This service allows customers to transfer money between phoneson the MTN network. A typical customer purchases U Sh 50,000(approximately US$30) worth of mobile money from an agent, and theagent then sets up a transaction indicating that this customer has“deposited” this amount on his or her mobile phone. The customer thenreceives a short message service SMS to confirm the transaction and isasked to select a personal identification number (PIN). A customer isissued a PIN for every transaction (both to send and to receive money),and both the sender and the recipient must present valid identification tocomplete the transaction. Though the customer is at liberty to send
Uganda 257
money to anyone across mobile telecommunication networks, only MTNcustomers can possess these mobile money accounts.
More than 6 million Ugandans own mobile phones, suggesting that themobile transfer service will become accessible to 6 million people. Thiscould, in essence, make mobile money transfer the most widely accessibletransaction method, particularly for the unbanked population.
Transport Service for Domestic Remittances
Transport companies deliver money physically or by maintaining a float(box 9.3). The vehicle operator receives money from the sender, and it isenclosed in an envelope or packaged for delivery. The driver then deliv-ers the money physically. However, because of the risks of insecurity and
258 Remittance Markets in Africa
Box 9.3
The Transport Sector as a Provider of Remittance Servicesin Uganda and in East Africa
The concentration of formal financial institutions in urban centers has con-
tributed to the emergence of the transport sector (buses and commuter taxis) as
a key provider of reliable, fast, and affordable money transfer services, especially
to remote regions of the country with limited or no access to financial services.
Clients include parents with students in country-side schools and workers in
urban centers with families in the rural areas. Average remittance amounts range
from between US$50 and US$200 for school tuition, student upkeep, and general
subsistence to U Sh 3 million for purchasing of traders’ merchandise. Inward and
outward remittances through transport companies tend to peak around
November and December and also near the commencement of school terms—
usually the beginning of February, May, and September. Money is sent from (and
received in) all major towns in Kenya, Tanzania, and Uganda.
Transfer charges are usually very competitive (sometimes 7 percent to 10 per-
cent of the amount sent or a fraction of the fare charged for the journey), but in
many cases, charges are subject to negotiation between the remittance sender
and the bus driver. To collect the remittance, the recipient is required to present
some form of valid identification such as a village identification card, a voter’s
(continued next page)
robberies, transport companies now maintain a float on either end of theroute so that money transfer is not dependent on the arrival of the vehi-cle and the recipient is guaranteed delivery. The sending office issues areceipt to the sender and makes a call to the receiving office, instructingit to make payment. The sender contacts the recipient to indicate themoney has been sent and can be collected from the office. This step hasmade the transfer process quicker. However, the process works only inareas where telecommunication is not an issue.
Remittances and Access to Financial Services
Remittances have been identified as a potential catalyst for financialgrowth in receiving countries and regions by providing greater access tobanking services for migrants’ families. Orozco and Fedewa (2006)observe that linking remittances to financial intermediation will harnessremittances’ influence on development. They concentrate on three fac-tors that define the ability to tap remittances more effectively for
Uganda 259
Box 9.3 (continued)
card, an employer-issued identification card, or a driver’s license. A consignment
or transaction number is used as a password between the remittance sender, the
recipient, and the company. The sender often communicates the consignment
number and other particulars to the recipient by telephone.
Remittances for prominent customers are usually transmitted instantly, and
the recipient can pick up the money within minutes of concluding the transac-
tion. This special consideration is typically accorded to traders and students. All
other remittances usually take one to three business days. Transport companies
manage inventories in several ways. For small payout amounts, branch offices
use available cash and are later reimbursed by the head office. For sizable remit-
tances (usually about U Sh 3 million), some transport companies move money
from one branch to another through chartered planes, buses, or commercial
bank networks.
However, in cases in which the remittance is not delivered, the sender usually
has little or no recourse. Transport companies offering remittance services are not
regulated by the Bank of Uganda and are not required to file any reports regard-
ing remittance transactions.
Source: Authors.
development: institutional ability to provide remittance transfers, institu-tional ability to offer low-cost remittance services, and institutional abilityto complement transfer services with other financial services. Ratha(2003) observed that credit unions and microfinance institutions can playa major role in delivering low-cost and convenient remittance services,encouraging more savings and investment.
Financial institutions and nonbank financial institutions in Ugandatreat remittance services like auxiliary services; hence, senders and recip-ients of remittances can also benefit from these institutions’ mainstreamservices such as deposits, savings products, and credit facilities forconsumers; small and large business loans; and education and vehicleloans. For international money-transfer institutions, remittance service isthe core business and senders and recipients can benefit from other serv-ices that their partner banking institutions provide. Foreign exchangebureaus also offer currency exchange services.
However, more than 60 percent of the financial and nonfinancial insti-tutions surveyed in Uganda indicate that the recipient needs to be anaccount holder in the institution. However, these services come at a costto remittance customers. For example, there are charges for maintainingof a deposit account, including a minimum balance that must be main-tained on the account, ledger fees, withdrawal charges, and, in some cases,statement fees. The average monthly charges for maintaining an accountwith a bank in Uganda range between U Sh 1,000 and U Sh 3,000 Ush.The minimum balance ranges between U Sh 50,000 and U Sh 100,000.These high fees can limit access to formal remittance services for low-income individuals.
Regulatory and Business Environment
The remittance market in Uganda has some RSPs providing money-transfer services under the purview of the central bank, which observesthe statutory regulatory framework. Other RSPs in the transport sectorand the community-based institutions either are not under a regulatoryframework or are based on a social network. Financial institutions inUganda operate under various regulatory frameworks. For example,commercial banks (tier 1) and credit institutions (tier 2) are licensed andregulated by the Bank of Uganda under the 2004 Financial InstitutionAct. MDIs (tier 3) are regulated under the 2003 MDI Act, while allother MFIs and SACCOs (tier 4) are not under the Bank of Uganda’spurview and supervision, yet they form the core of the microfinance
260 Remittance Markets in Africa
sector (see Annex 2). Foreign exchange bureaus are regulated andsupervised under the 2004 Foreign Exchange Act and the 2006 ForeignExchange Regulations. SACCOs and MFIs in Uganda operate underthree legal regimes: the Cooperative Societies Act, the CompaniesAct, and the NGO Act. However, tier 4 institutions operate in a super-visory and regulatory vacuum because those legal regimes do not distin-guish tier 4 institutions from cooperatives, which do not provide financialservices.
For transport companies, there are no additional requirements forestablishing this kind of remittance-related business besides obtaining alicense to provide transportation and parcel- and luggage-handlingservices and obtaining an operating license issued by the Registrar ofCompanies. Though money transfer is one of the services provided, trans-port companies offering remittance services are not regulated by the Bankof Uganda and are not required to file any reports regarding remittancetransactions, volumes, and destinations (see Annex 1).
In Uganda, the Financial Institutions Act (2004) states the minimumcapital requirement for banks and nonbank financial institutions as U Sh 4billion and U Sh 1 billion, respectively. In addition, financial institutions arerequired to observe minimum and on-going capital requirements, includingmaintaining a core capital of at least 8 percent of total risk-adjustedassets and a total capital of at least 12 percent of total risk-adjustedassets. This requirement is in addition to an annual license fee of U Sh 1million. Banks and nonbank financial institutions provide a variety ofservices; only the mobile transfer and international money-transfer agen-cies enter the market specifically to engage in money transfer services.
The two regulatory regimes that govern the operations of exchangebureaus issue four types of licenses for money-remitting foreign exchangebureaus. Each type of license allows for a different scope of operation,such as conducting international remittances, and minimum require-ments for the licenses vary.
In carrying out remittance business, RSPs are expected to uphold theknow-your-customer policy and to prevent unacceptable transactions byobserving thresholds on the amounts remitted and reporting suspiciousactivities. However, the ability to enforce some of these rules depends onthe strength of the surveillance system and the ability to share informa-tion across the RSPs at the settlement level.
There are no limits on how much money can be sent or received, butaverage remittance amounts range between US$50 and US$200 for schooltuition, student upkeep, and general subsistence, and remittances can be up
Uganda 261
to about U Sh 3 million for purchasing merchandise from traders. Themajor source and destination locations include all major towns in Kenya,Tanzania, and Uganda. Remittances for prominent customers are usuallytransmitted instantly, and the recipient can pick up the money within min-utes of the sender concluding the transaction. All other remittances usuallytake one to three business days, depending on the intended destination.
Regulations and RequirementsThe findings indicate that laws and regulations are not an obstacle formost RSPs in Uganda, with only one of the surveyed firms indicating oth-erwise. Regarding the barriers to entry into the remittance business, mostproviders felt that access to capital and finance was a major barrier toentry. In Uganda, however, license requirements and capital requirementsposed the most significant hindrance to starting a remittance servicesbusiness. Regarding operational barriers, RSPs indicated license and capi-tal requirements as significant obstacles to businesses. Lack of access toclearing and settlement systems, anti-money-laundering requirements,and reporting requirements imposed by the central bank are other imped-iments to conducting a remittance business. Firms consider the corruptionof government officials and the government’s tax policies to be the leastsignificant barriers to providing remittance services.
All RSPs viewed money-transfer agencies such as MoneyGram andWestern Union as key competitors, while nonbank institutions felt thebanks were key competitors. As indicated earlier, banks and foreignexchange bureaus work closely with money-transfer agencies, while for-eign exchange bureaus also work in partnership with local banks. Thus,competition between RSPs and nonbank institutions may be described asinterdependence rather than rivalry.
Consequently, Uganda’s RSP market can best be described as an oli-gopolistic market. This description is especially true given that there arerelatively few major players in the RSP market—mainly the banks andlicensed foreign exchange bureaus—but these market leaders work inpartnership with the relatively smaller RSPs, including credit institutions,MDIs SACCOs, MFIs and foreign exchange bureaus without remittanceservice licenses.
Remittance Costs and Identification Requirements
There are differences in charges for remittance services, for the samevolume and even for the same destination, across RSPs (table 9.3). On
262 Remittance Markets in Africa
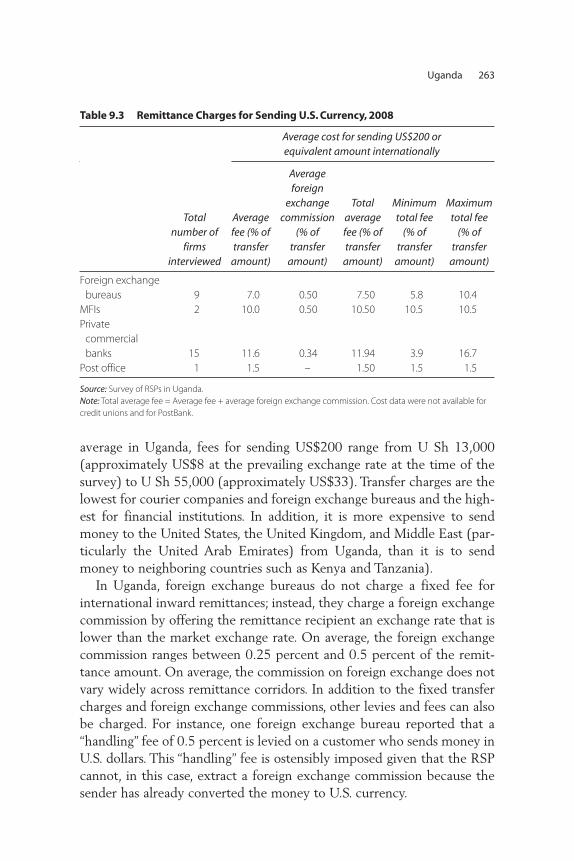
average in Uganda, fees for sending US$200 range from U Sh 13,000(approximately US$8 at the prevailing exchange rate at the time of thesurvey) to U Sh 55,000 (approximately US$33). Transfer charges are thelowest for courier companies and foreign exchange bureaus and the high-est for financial institutions. In addition, it is more expensive to sendmoney to the United States, the United Kingdom, and Middle East (par-ticularly the United Arab Emirates) from Uganda, than it is to sendmoney to neighboring countries such as Kenya and Tanzania).
In Uganda, foreign exchange bureaus do not charge a fixed fee forinternational inward remittances; instead, they charge a foreign exchangecommission by offering the remittance recipient an exchange rate that islower than the market exchange rate. On average, the foreign exchangecommission ranges between 0.25 percent and 0.5 percent of the remit-tance amount. On average, the commission on foreign exchange does notvary widely across remittance corridors. In addition to the fixed transfercharges and foreign exchange commissions, other levies and fees can alsobe charged. For instance, one foreign exchange bureau reported that a“handling” fee of 0.5 percent is levied on a customer who sends money inU.S. dollars. This “handling” fee is ostensibly imposed given that the RSPcannot, in this case, extract a foreign exchange commission because thesender has already converted the money to U.S. currency.
Uganda 263
Table 9.3 Remittance Charges for Sending U.S. Currency, 2008
Average cost for sending US$200 or equivalent amount internationally
Total number of
firms interviewed
Average fee (% of transfer
amount)
Average foreign
exchangecommission
(% of transfer
amount)
Total average fee (% of transfer
amount)
Minimumtotal fee
(% of transfer
amount)
Maximumtotal fee
(% of transfer
amount)
Foreign exchangebureaus 9 7.0 0.50 7.50 5.8 10.4
MFIs 2 10.0 0.50 10.50 10.5 10.5Private
commercial banks 15 11.6 0.34 11.94 3.9 16.7
Post office 1 1.5 – 1.50 1.5 1.5
Source: Survey of RSPs in Uganda. Note: Total average fee = Average fee + average foreign exchange commission. Cost data were not available forcredit unions and for PostBank.
The cross-border outward remittances market is highly concentratedin the formal sector. The only exceptions are outward remittances toKenya and Tanzania, which are also transferred through the informal sec-tor, such as bus companies. As mentioned, friends, family members, andacquaintances of the remittance senders are also used to transfer moneyacross the border. One explanation for the dominance of the formal sec-tor RSPs in the outward remittance market is that money is usually sentthrough a network of financial institutions, particularly banks. RSPs in theinformal sector have limited access to the bank network; as a result, send-ing money would call for expensive transfer charges that render the pro-vision of outward remittance services unfeasible for the informal sector.The minimum charge for sending remittances domestically in Uganda isU Sh 3,000 (approximately US$2), while the maximum charge is U Sh66,000 (approximately US$40). However, there is significant variabilityin domestic transfer charges, especially between formal-sector remittanceservice providers and their informal sector counterparts, with the infor-mal sector industries offering much lower rates, on average, than the for-mal sector. Banks and foreign exchange bureaus impose charges onreceivers that are almost 50 percent of the sending fees. In Uganda, thesecharges go by various names such as bank charges, ledger fees, or foreign-currency handling fees. They range from U Sh 2,500 to U Sh 33,000,while the foreign exchange commission ranges from 0.25 percent to 5.00percent of the remittance amount received. The RSPs surveyed also indi-cated that they charge either a fixed fee or a commission on remittancesreceived.
Though formal RSPs are not required to charge taxes (for example, avalue added tax) on financial transactions, including remittance services,transfer fees are higher than for informal RSPs. This higher fee could bepartly attributed to the need to meet minimum capital standards, report-ing requirements, and high operational costs (such as renting office spacein prime locations). Informal sector RSPs, however, in addition to notbeing subject to any minimum standards, could use a retail outlet to offerremittance services. RSPs in the informal sector also usually operate inlocations far away from the central business district where operationalcosts are lower. The lower transfer charges offered by the informal sectorhave the potential to more than compensate for the risks associated withtransfers made through this sector, consequently creating a preference forinformal transactions (especially for small remittance amounts).
RSPs gather information from users of remittance services. All theinstitutions involved in international remittances indicated that they ask
264 Remittance Markets in Africa
for various types of identification, including national passports, nationalidentification cards, verifications of residence, and driver’s licenses.Additional acceptable types of identifications include voter registrationcards and any other form of photo identification. Identification require-ments apply to both account and nonaccount holders, though therequirements are not so stringent for account holders. Some banks insistthat only account holders use money-transfer services. Some institutions,especially banks and PostBank, ask the sender to indicate the purpose ofthe money being transferred.
In urban areas, most international inward remittances reach theintended recipients in a day, as indicated by 58 percent of firms inter-viewed in Uganda. However, 23 percent report a next-day delivery. Nofirm reported a delivery period of more than five days. The trend slightlydiffers in rural areas, with 31 percent reporting that inward remittancesreach the intended recipients in one day. As with deliveries in urban areas,no firm reported a delivery period of more than five days. Banks indicatedthat international inward transfers could be paid out in both local and for-eign currency. However, Western Union payments are made in the localcurrency, and Western Union tells the sender the foreign-currency equiv-alent. There is a limit on the amount of money that customers canreceive. For example, banks have a US$10,000 limit, and the same limitapplies to the PostBank and Posta.
All providers indicated they have a system for dealing with grievances.Some of the firms indicated that they rarely receive grievances, and someindicated they have not received grievances. Transfer may fail to reach theintended recipient either because the information given was not corrector because the details were suspicious. When sending the money, thecompany dealing with the sender can indicate the time it will take toreach the recipient. In most cases (more than 80 percent), the institutionsask the sender and the recipient to verify the details to prevent discrep-ancies. In the case of a discrepancy, the money is not necessarily returned,but it is held until the details are clarified. Only when the transaction issuspicious would the institutions involve the local authorities. Regardingthe length of time to address grievances, most firms indicated that con-cerns are dealt with as soon as they are raised. A small fraction of the firmsindicated that it takes about a week to address grievances. The firms typ-ically have dedicated staff members (two members in most firms) to dealwith grievances, but firms can dedicate all staff members in the money-transfer section if the need arises. Only on very rare occasions are remit-tances not claimed.
Uganda 265
Conclusion
The remittance market in Uganda is experiencing significant growth interms of the volume and the diversity of the providers, in both interna-tional and domestic remittance markets. The following observations arenoteworthy.
Data collection for remittance flows is not well developed. A growingnumber of migrant remittances is flowing to Uganda, which is positivelycorrelated with increasing migration. However, data on migrant remit-tances is not collected regularly. Our RSP survey data do not allow for afine disaggregation of remittances and other capital inflows as RSPs donot distinguish the various types of money transfers for which they pro-vide services in their reporting to the central bank.
Participation in the formal remittance market is limited to a small pro-portion of remittance clients. The distribution of RSPs indicates limitedaccess to formal-remittance transfer services by potential clients in vari-ous parts of the country. Results show that most services are provided inthe major urban centers. Rural areas have a lower concentration ofproviders. The informal market continues to take a significant proportionof the remittance transfers, which can be attributed to the accessibility ofinformal services and the low cost of transfer.
Most remittance service providers do not treat remittance services as acore service. Except for money-transfer agencies, providers treat remit-tance services as auxiliary services.
Partnerships reflect a significant level of complementarity across remit-tance service providers. Except for community-based and transport-sectorremittance service providers, all providers have a link to the banking sec-tor because of its elaborate payment system that enables providers toreach a wider market both domestically and internationally.
Direct costs of remittance transfers are significantly high across thevarious providers. For sending US$200, the international transfer chargeranges between 10 percent and 17 percent, and the domestic transfercharge ranges between 0.4 percent and 12.5 percent for the domestictransfers. The fee covers processing charges, inventory costs, and deliverycosts. In the case of a partnership, the transfer fee is shared in the agreedproportions to cover the various costs.
Access to a wide range of financial services is constrained by financialcosts and availability. Most of the remittance providers indicated thatthey have a wide range of products in the menu of their core services tooffer to remittance clients. However, the costs for such products (for
266 Remittance Markets in Africa
example, the cost of maintaining an account) may be prohibitive forother financial services for remittance clients. Furthermore, Simba Cashmay find it difficult to widen the scope of financial services provided toits clients if banks do not offer core services in localities where SimbaCash operates.
Mobile money transfer services are entering the Ugandan market. Theentry of nonbanking services was a response to emerging gaps in the pro-vision of financial services. Currently, mobile money transfer is gainingentry into the market and gaining ground in domestic remittances.
The regulatory system is substantially developed but must catch upwith the technological developments. The central bank regulates only asmall proportion of remittance service providers in Uganda. However, theregulation of mobile-phone money transfer has yet to evolve.
Recommendations
For assurance that remittance services provided are accessible, reliableand affordable, it is important to focus on the network and partnershipamong the providers, the technological developments, the regulatory sys-tem, and the data collection.
Designing and improving collection of remittance data could includeadministering periodic surveys and developing a reporting system for for-mal RSPs. Categorizing money transfers handled by service providers willbe useful in accurately depicting migrant remittances.
Mobile-phone money transfer is revolutionizing the money transferindustry by providing accessible and affordable services. Client responseto this technological development indicates that money transfer is a sig-nificant financial service that has taken time to receive proper attention.This developing industry challenges the banking sector to elevate remit-tance services from auxiliary services to core services and to adopt newtechnologies that will facilitate quick and cheaper transactions.
The speed of service delivery and the costs imposed depend on thenational payment system’s level of development. Thus, ensuring that thesystem adapts quickly to technological development will help to reducethe cost of transactions.
Information on the costs of remittance transfer should be shared pub-lically so that clients are aware of charges and are able to choose theirservice provider wisely. Providing more information encourages competi-tion among providers, decreasing the costs of the services.
Uganda 267
To facilitate access to financial services, remittance clients should begiven financial education because it is crucial for the remittance clients tounderstand the products that are available. Similarly, banks can developproducts specifically for remittance clients.
Although the mobile-phone money transfer facility is currently notat risk, it is important that the operational rules are fully enforced.However, as these services become global, the regulatory frameworkmust be able to address the challenges that may arise.
Notes
1. Although remittances can be person-to-person and business-to-business, thisbook does not distinguish between the users of the services; analysis is fromthe providers’ perspective.
2. The Bank of Uganda (2008) records show that gross remittance receipts for2006 were estimated at U Sh 277.3 billion (approximately US$148.5 mil-lion), with urban households accounting for 73 percent of those receipts. Thisamount is significantly lower compared to World Bank data that estimatetotal remittances for the same year to be US$411 million (World Bank 2009).
3. Debit card services provided by United Bank of Africa, which started opera-tions early 2011, are yet to be tested as of April 2008.
4. The Advantage Card, a prepaid store value card issued by Standard CharteredBank Uganda for use at Total Uganda Limited fuel stations, was withdrawnfrom the market.
References
Bank of Uganda. 2008. “Survey on Workers’ Remittances to Uganda.”Unpublished report, Bank of Uganda, Kampala.
FinScope Uganda. 2007. “Results of a National Survey on Access to FinancialServices.” In Access to Financial Services in Uganda, Department forInternational Development’s Financial Sector Deepening Project: Kampala.
Orozco, Manuel, and Rachel Fedewa. 2006. “Leveraging Efforts on Remittancesand Financial Intermediation.” Working Paper, Inter-American DevelopmentBank, Washington DC.
Ratha, Dilip. 2003. “Workers’ Remittances: An Important and Stable Source ofExternal Development Finance.” Chapter 7 in Global Development Finance2003, World Bank, Washington, DC, 157–75.
Sander, Cerstin, Peter Mukwana, and Altemius Millinga. 2001. “Money TransferSystems: The Practice and Potential for Products in Tanzania and Uganda.”
268 Remittance Markets in Africa
MicroSave Africa. http://www.microsave.org/research_paper/passing-the-buck-money-transfer-systems-the-practice-and-potential-for-products-in-ta.
Uganda Bureau of Statistics. 2006. Uganda National Household Survey2005/2006. Uganda Bureau of Statistics, Kampala.
World Bank. 2011. Migration and Remittances Factbook 2011, World Bank,Washington, DC.
Uganda 269

PA R T I I I
Remittance Markets in Remittance-Source Countries

273
In 1962, only 20,000 immigrants from Sub-Saharan Africa were livingin France. This number increased to more than 580,000 by 2005. In justsix years, from 1999 to 2005, the number of migrants to France fromSub-Saharan Africa increased by more than 50 percent. Despite thisrapid growth, however, Sub-Saharan immigrants remain a minority,representing only 12 percent of the immigrant population in France.As of 2005, the number of immigrants to France from Sub-SaharanAfrica was approximately three times less than the number fromEuropean or North African countries, as figure 10.1 illustrates.
Remittance and Migration Trends
Money transfers from France increased by about 6 percent a year on aver-age from 1999–2007, balance of payment data show. However, remit-tance volumes may have declined over the past two to three yearsbecause of the global economic crisis since 2009. The crisis has affectedthe labor market in France, much as it has in the United States and therest of Europe, although its effect on immigration has not been well doc-umented. An impact on African migrant workers is likely, however,because they are widely employed in the building and other industrieswithin the most vulnerable sectors of the French economy.
C H A P T E R 1 0
France
Frederic Ponsot
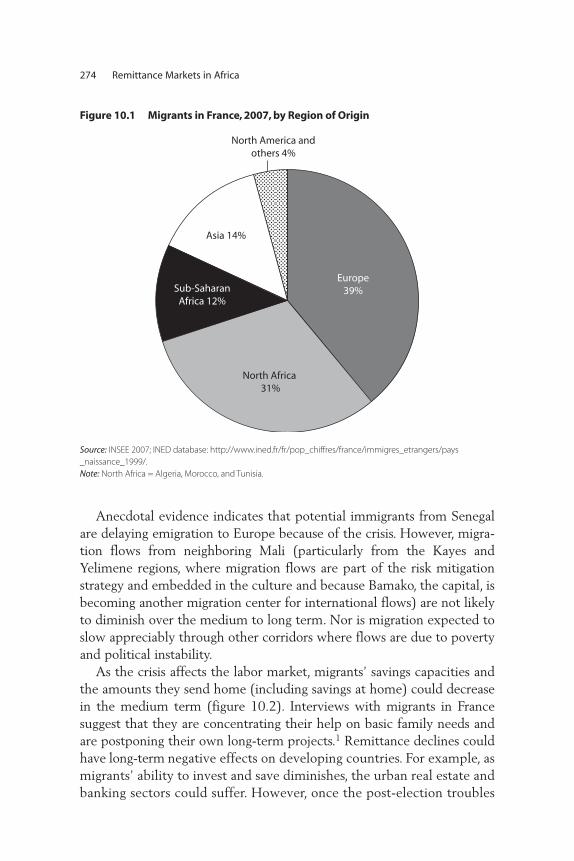
Anecdotal evidence indicates that potential immigrants from Senegalare delaying emigration to Europe because of the crisis. However, migra-tion flows from neighboring Mali (particularly from the Kayes andYelimene regions, where migration flows are part of the risk mitigationstrategy and embedded in the culture and because Bamako, the capital, isbecoming another migration center for international flows) are not likelyto diminish over the medium to long term. Nor is migration expected toslow appreciably through other corridors where flows are due to povertyand political instability.
As the crisis affects the labor market, migrants’ savings capacities andthe amounts they send home (including savings at home) could decreasein the medium term (figure 10.2). Interviews with migrants in Francesuggest that they are concentrating their help on basic family needs andare postponing their own long-term projects.1 Remittance declines couldhave long-term negative effects on developing countries. For example, asmigrants’ ability to invest and save diminishes, the urban real estate andbanking sectors could suffer. However, once the post-election troubles
274 Remittance Markets in Africa
North America andothers 4%
Europe39%
North Africa 31%
Sub-SaharanAfrica 12%
Asia 14%
Figure 10.1 Migrants in France, 2007, by Region of Origin
Source: INSEE 2007; INED database: http://www.ined.fr/fr/pop_chiffres/france/immigres_etrangers/pays_naissance_1999/. Note: North Africa = Algeria, Morocco, and Tunisia.
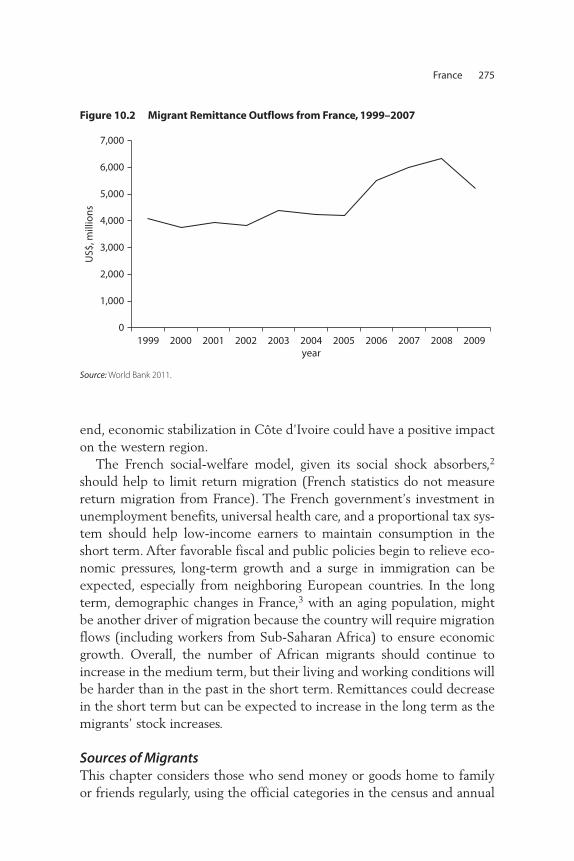
end, economic stabilization in Côte d’Ivoire could have a positive impacton the western region.
The French social-welfare model, given its social shock absorbers,2
should help to limit return migration (French statistics do not measurereturn migration from France). The French government’s investment inunemployment benefits, universal health care, and a proportional tax sys-tem should help low-income earners to maintain consumption in theshort term. After favorable fiscal and public policies begin to relieve eco-nomic pressures, long-term growth and a surge in immigration can beexpected, especially from neighboring European countries. In the longterm, demographic changes in France,3 with an aging population, mightbe another driver of migration because the country will require migrationflows (including workers from Sub-Saharan Africa) to ensure economicgrowth. Overall, the number of African migrants should continue toincrease in the medium term, but their living and working conditions willbe harder than in the past in the short term. Remittances could decreasein the short term but can be expected to increase in the long term as themigrants’ stock increases.
Sources of Migrants This chapter considers those who send money or goods home to familyor friends regularly, using the official categories in the census and annual
France 275
0
1,000
2,000
3,000
4,000
5,000
6,000
7,000
1999 2000 2001 2002 2003year
US$
, mill
ion
s
2004 2005 2006 2007 2008 2009
Figure 10.2 Migrant Remittance Outflows from France, 1999–2007
Source: World Bank 2011.
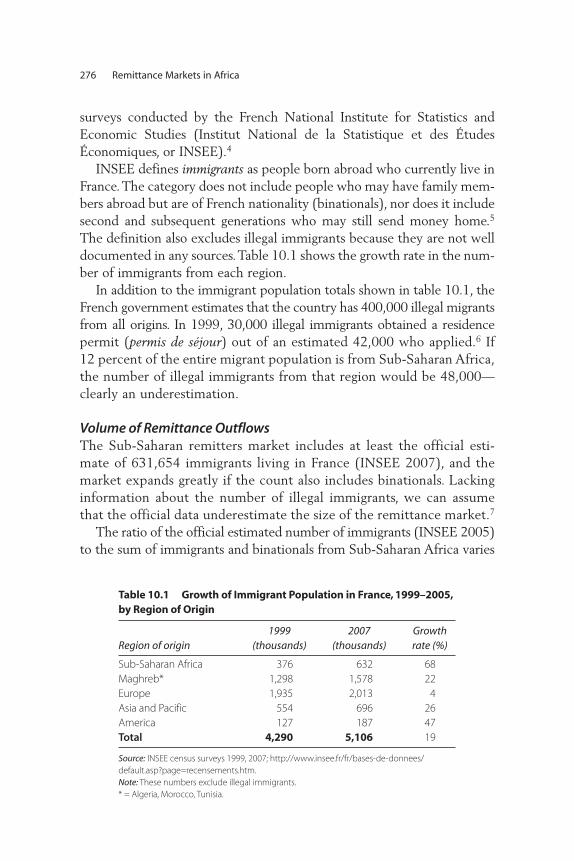
surveys conducted by the French National Institute for Statistics andEconomic Studies (Institut National de la Statistique et des ÉtudesÉconomiques, or INSEE).4
INSEE defines immigrants as people born abroad who currently live inFrance. The category does not include people who may have family mem-bers abroad but are of French nationality (binationals), nor does it includesecond and subsequent generations who may still send money home.5
The definition also excludes illegal immigrants because they are not welldocumented in any sources. Table 10.1 shows the growth rate in the num-ber of immigrants from each region.
In addition to the immigrant population totals shown in table 10.1, theFrench government estimates that the country has 400,000 illegal migrantsfrom all origins. In 1999, 30,000 illegal immigrants obtained a residencepermit (permis de séjour) out of an estimated 42,000 who applied.6 If12 percent of the entire migrant population is from Sub-Saharan Africa,the number of illegal immigrants from that region would be 48,000—clearly an underestimation.
Volume of Remittance OutflowsThe Sub-Saharan remitters market includes at least the official esti-mate of 631,654 immigrants living in France (INSEE 2007), and themarket expands greatly if the count also includes binationals. Lackinginformation about the number of illegal immigrants, we can assumethat the official data underestimate the size of the remittance market.7
The ratio of the official estimated number of immigrants (INSEE 2005)to the sum of immigrants and binationals from Sub-Saharan Africa varies
276 Remittance Markets in Africa
Table 10.1 Growth of Immigrant Population in France, 1999–2005,by Region of Origin
Region of origin1999
(thousands)2007
(thousands)Growth rate (%)
Sub-Saharan Africa 376 632 68Maghreb* 1,298 1,578 22Europe 1,935 2,013 4Asia and Pacific 554 696 26America 127 187 47Total 4,290 5,106 19
Source: INSEE census surveys 1999, 2007; http://www.insee.fr/fr/bases-de-donnees/default.asp?page=recensements.htm.Note: These numbers exclude illegal immigrants. * = Algeria, Morocco, Tunisia.
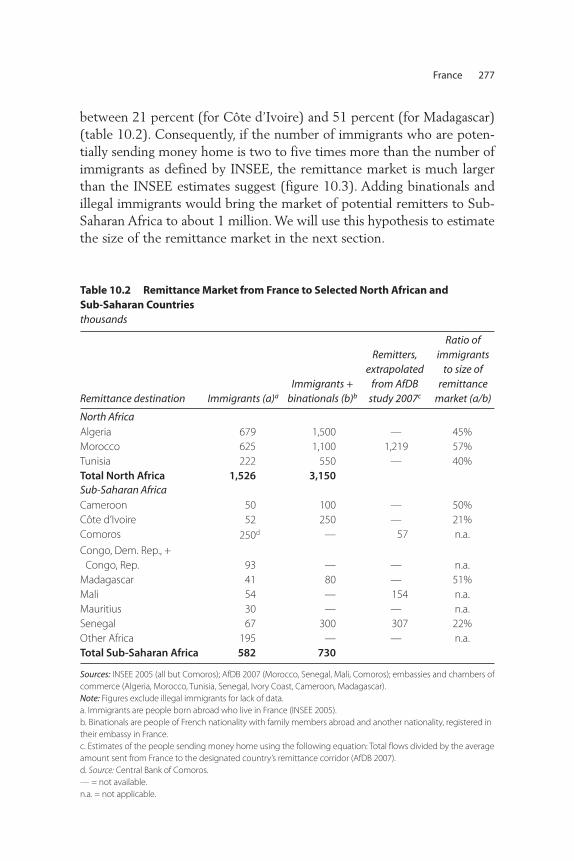
between 21 percent (for Côte d’Ivoire) and 51 percent (for Madagascar)(table 10.2). Consequently, if the number of immigrants who are poten-tially sending money home is two to five times more than the number ofimmigrants as defined by INSEE, the remittance market is much largerthan the INSEE estimates suggest (figure 10.3). Adding binationals andillegal immigrants would bring the market of potential remitters to Sub-Saharan Africa to about 1 million. We will use this hypothesis to estimatethe size of the remittance market in the next section.
France 277
Table 10.2 Remittance Market from France to Selected North African and Sub-Saharan Countries thousands
Remittance destination Immigrants (a)a
Immigrants +binationals (b)b
Remitters,extrapolated
from AfDB study 2007c
Ratio of immigrants
to size ofremittance
market (a/b)
North AfricaAlgeria 679 1,500 — 45%Morocco 625 1,100 1,219 57%Tunisia 222 550 — 40%Total North Africa 1,526 3,150Sub-Saharan AfricaCameroon 50 100 — 50%Côte d’Ivoire 52 250 — 21%Comoros 250d — 57 n.a.
Congo, Dem. Rep., +Congo, Rep. 93 — — n.a.
Madagascar 41 80 — 51%Mali 54 — 154 n.a.Mauritius 30 — — n.a.Senegal 67 300 307 22%Other Africa 195 — — n.a.Total Sub-Saharan Africa 582 730
Sources: INSEE 2005 (all but Comoros); AfDB 2007 (Morocco, Senegal, Mali, Comoros); embassies and chambers ofcommerce (Algeria, Morocco, Tunisia, Senegal, Ivory Coast, Cameroon, Madagascar). Note: Figures exclude illegal immigrants for lack of data.a. Immigrants are people born abroad who live in France (INSEE 2005).b. Binationals are people of French nationality with family members abroad and another nationality, registered intheir embassy in France.c. Estimates of the people sending money home using the following equation: Total flows divided by the averageamount sent from France to the designated country’s remittance corridor (AfDB 2007). d. Source: Central Bank of Comoros. — = not available.n.a. = not applicable.
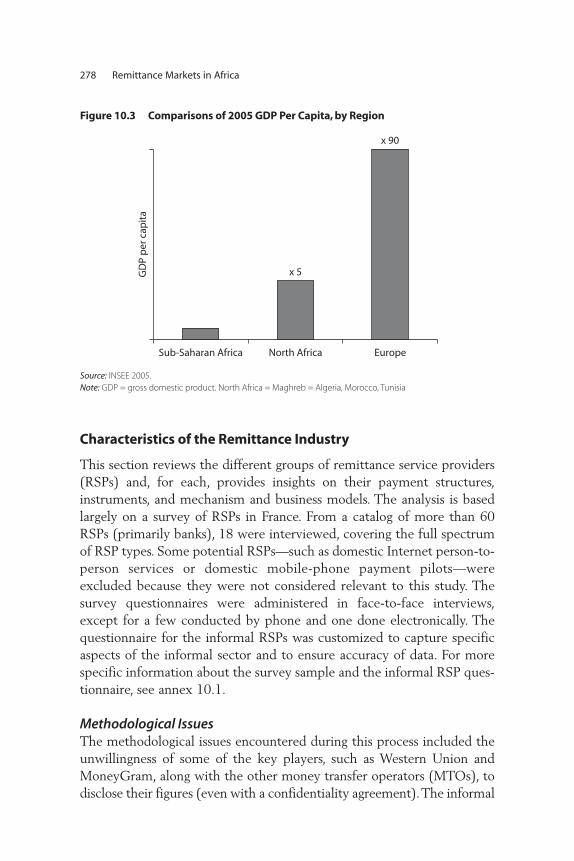
Characteristics of the Remittance Industry
This section reviews the different groups of remittance service providers(RSPs) and, for each, provides insights on their payment structures,instruments, and mechanism and business models. The analysis is basedlargely on a survey of RSPs in France. From a catalog of more than 60RSPs (primarily banks), 18 were interviewed, covering the full spectrumof RSP types. Some potential RSPs—such as domestic Internet person-to-person services or domestic mobile-phone payment pilots—wereexcluded because they were not considered relevant to this study. Thesurvey questionnaires were administered in face-to-face interviews,except for a few conducted by phone and one done electronically. Thequestionnaire for the informal RSPs was customized to capture specificaspects of the informal sector and to ensure accuracy of data. For morespecific information about the survey sample and the informal RSP ques-tionnaire, see annex 10.1.
Methodological IssuesThe methodological issues encountered during this process included theunwillingness of some of the key players, such as Western Union andMoneyGram, along with the other money transfer operators (MTOs), todisclose their figures (even with a confidentiality agreement). The informal
278 Remittance Markets in Africa
North Africa
GD
P p
er c
apit
a
Europe
x 5
x 90
Sub-Saharan Africa
Figure 10.3 Comparisons of 2005 GDP Per Capita, by Region
Source: INSEE 2005. Note: GDP = gross domestic product. North Africa = Maghreb = Algeria, Morocco, Tunisia
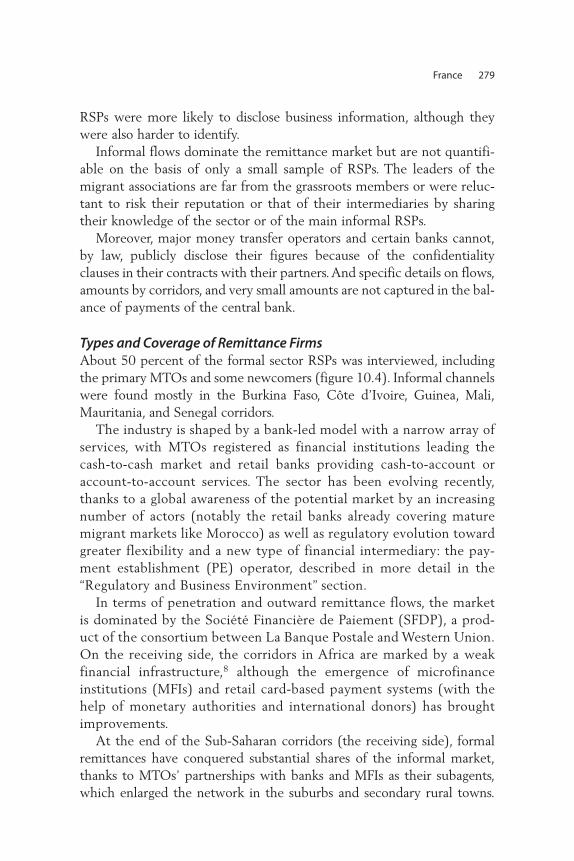
RSPs were more likely to disclose business information, although theywere also harder to identify.
Informal flows dominate the remittance market but are not quantifi-able on the basis of only a small sample of RSPs. The leaders of themigrant associations are far from the grassroots members or were reluc-tant to risk their reputation or that of their intermediaries by sharingtheir knowledge of the sector or of the main informal RSPs.
Moreover, major money transfer operators and certain banks cannot,by law, publicly disclose their figures because of the confidentialityclauses in their contracts with their partners. And specific details on flows,amounts by corridors, and very small amounts are not captured in the bal-ance of payments of the central bank.
Types and Coverage of Remittance Firms About 50 percent of the formal sector RSPs was interviewed, includingthe primary MTOs and some newcomers (figure 10.4). Informal channelswere found mostly in the Burkina Faso, Côte d’Ivoire, Guinea, Mali,Mauritania, and Senegal corridors.
The industry is shaped by a bank-led model with a narrow array ofservices, with MTOs registered as financial institutions leading thecash-to-cash market and retail banks providing cash-to-account oraccount-to-account services. The sector has been evolving recently,thanks to a global awareness of the potential market by an increasingnumber of actors (notably the retail banks already covering maturemigrant markets like Morocco) as well as regulatory evolution towardgreater flexibility and a new type of financial intermediary: the pay-ment establishment (PE) operator, described in more detail in the“Regulatory and Business Environment” section.
In terms of penetration and outward remittance flows, the marketis dominated by the Société Financière de Paiement (SFDP), a prod-uct of the consortium between La Banque Postale and Western Union.On the receiving side, the corridors in Africa are marked by a weakfinancial infrastructure,8 although the emergence of microfinance institutions (MFIs) and retail card-based payment systems (with thehelp of monetary authorities and international donors) has broughtimprovements.
At the end of the Sub-Saharan corridors (the receiving side), formalremittances have conquered substantial shares of the informal market,thanks to MTOs’ partnerships with banks and MFIs as their subagents,which enlarged the network in the suburbs and secondary rural towns.
France 279
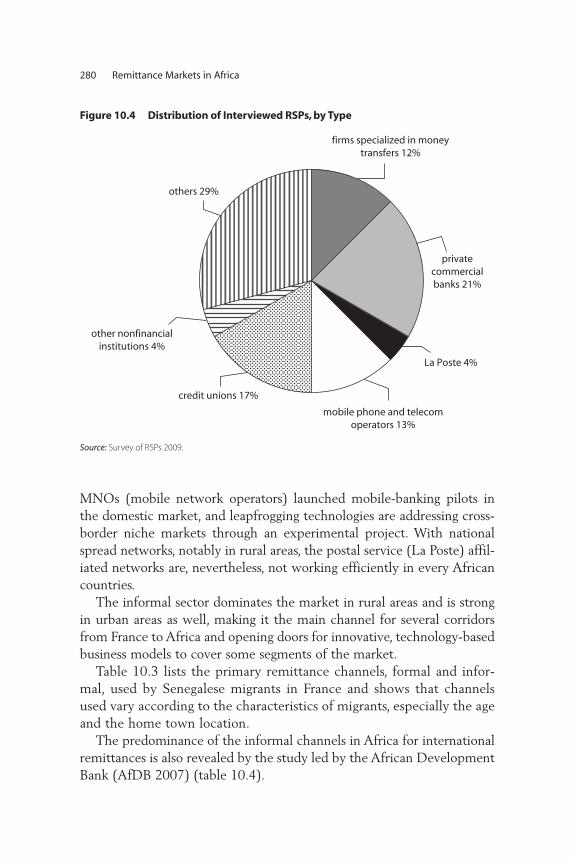
MNOs (mobile network operators) launched mobile-banking pilots inthe domestic market, and leapfrogging technologies are addressing cross-border niche markets through an experimental project. With nationalspread networks, notably in rural areas, the postal service (La Poste) affil-iated networks are, nevertheless, not working efficiently in every Africancountries.
The informal sector dominates the market in rural areas and is strongin urban areas as well, making it the main channel for several corridorsfrom France to Africa and opening doors for innovative, technology-basedbusiness models to cover some segments of the market.
Table 10.3 lists the primary remittance channels, formal and infor-mal, used by Senegalese migrants in France and shows that channelsused vary according to the characteristics of migrants, especially the ageand the home town location.
The predominance of the informal channels in Africa for internationalremittances is also revealed by the study led by the African DevelopmentBank (AfDB 2007) (table 10.4).
280 Remittance Markets in Africa
firms specialized in moneytransfers 12%
privatecommercialbanks 21%
La Poste 4%
mobile phone and telecomoperators 13%
credit unions 17%
other nonfinancialinstitutions 4%
others 29%
Figure 10.4 Distribution of Interviewed RSPs, by Type
Source: Survey of RSPs 2009.
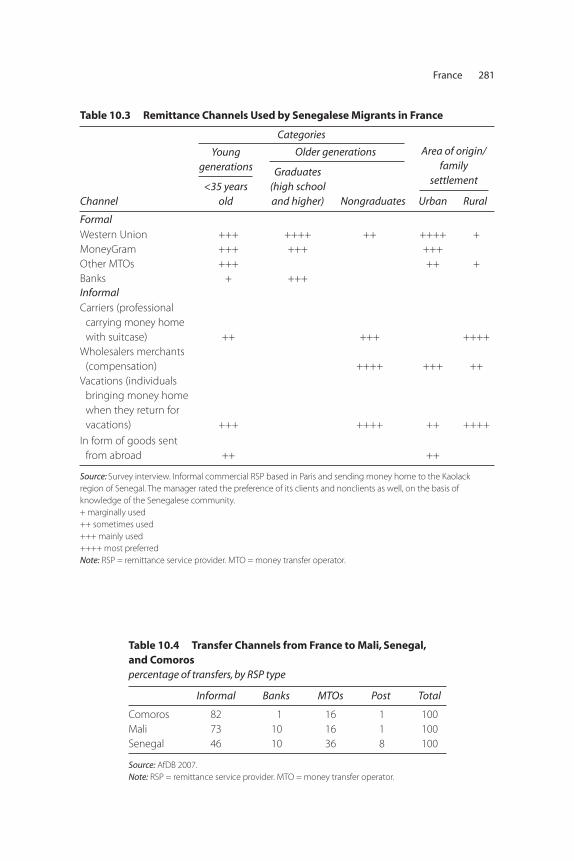
France 281
Table 10.3 Remittance Channels Used by Senegalese Migrants in France
Channel
Older generations
<35 years old
Graduates (high schooland higher) Nongraduates Urban Rural
FormalWestern Union +++ ++++ ++ ++++ +MoneyGram +++ +++ +++Other MTOs +++ ++ +Banks + +++InformalCarriers (professional
carrying money homewith suitcase) ++ +++ ++++
Wholesalers merchants(compensation) ++++ +++ ++
Vacations (individualsbringing money homewhen they return forvacations) +++ ++++ ++ ++++
In form of goods sentfrom abroad ++ ++
Source: Survey interview. Informal commercial RSP based in Paris and sending money home to the Kaolack region of Senegal. The manager rated the preference of its clients and nonclients as well, on the basis of knowledge of the Senegalese community. + marginally used++ sometimes used+++ mainly used++++ most preferredNote: RSP = remittance service provider. MTO = money transfer operator.
Young generations
Categories
Area of origin/family
settlement
Table 10.4 Transfer Channels from France to Mali, Senegal,and Comoros percentage of transfers, by RSP type
Informal Banks MTOs Post Total
Comoros 82 1 16 1 100Mali 73 10 16 1 100Senegal 46 10 36 8 100
Source: AfDB 2007.Note: RSP = remittance service provider. MTO = money transfer operator.
282 Remittance Markets in Africa
Box 10.1
French Banks and Sub-Saharan Migrants
As a whole, French banks are beginning to consider the migrants as a mass mar-
ket. For instance, low-cost transfers and a package of services for Moroccans are
now close to being standard offerings, and partnerships between French banks
and Moroccan banks are becoming ever more frequent.
For Sub-Saharan migrants, however, the market is not yet mature, and French
banks still face constraints such as the following:
• A migrant remittance market that is segmented among several countries, each
with its own specific financial regulation, infrastructure, and culture
• Reluctance to communicate aggressively like MTOs to capture migrant clients
• Desire to avoid the “reputation risk” of being considered by existing customers
as the “bank of the migrants” (migrants still perceived as being poor in France)
• Migrants’ preference for cash operations and a convivial atmosphere (staff
speaking their language)
• Migrants’ high illiteracy rates and a poor banking culture, which limits their
understanding of the benefit of using formal services
• The existence of a population of undocumented migrants not registered by a
French administration.
Source: Author, based on AfDB 2007.
Formal sector RSPs and partnerships. The formal French remittanceindustry is led by financial intermediaries registered as bank or financialestablishments providing cash-to-cash services for international MTOs,cash-to-account services for African banks registered in France or partner-ing with French banks, and account-to-account for French banks withAfrican subsidiaries. The retail French banks with African subsidiarieshave a client-focused approach and are reluctant to serve nonclients,especially in cash operations. The segmentation and the small size of theSub-Saharan African migrant markets are another hindrance to the estab-lishment of French retail banks, and partnerships seem to be the onlyalternative for those with no subsidiaries in African countries and viceversa for the African banks (box 10.1).
Société Générale (SG), one of the leading retail banks in France withsubsidiaries in Africa, developed its own package of products9 and hasdedicated three agencies to African migrants. Even though this package
is available at all SG branches in France, the potential market is notcompletely tapped into.
The anti-money-laundering (AML) regulations and regulations com-bating the financing of terrorism (CFT) impose additional constraints onthe occasional client who wants to deal in cash, especially when theimmigrant’s identity is not formally established with French administra-tion identifying papers, which is the standard of identification usuallyrequired by banks. Money-laundering risks are also perceived to behigher with cash transactions. As a result, instruments offered to immi-grants are mainly traditional wire transfers from an open account in thebank books. SG is the only French bank that offers a low-cost transferproduct for small transactions within its own large network, whichincludes subsidiaries in Africa.
Banque d’Escompte (BdE), with only a few branches in France, devel-oped a commission-based money transfer business model, thanks to part-nerships with African banks and regional MTOs. This bank is unique in theformal sector because it has developed a money transfer instrument espe-cially for migrants, called “BdE Cash” (box 10.2). BdE also seeks to develoployalty among the remitters and add value to its remittances services bylinking remittances services to financial products offered by its Africanpartners, including savings accounts and mortgages loans. Caisse d’EpargneIle-de-France also recently launched a new, low-cost money transfer serv-ice in partnership with Ecobank.
France 283
Box 10.2
The BdE Experience: Developing Agent Networks
BdE recently introduced an automatic cash transfer machine (collecting cash) for
direct transfers and is developing a program to hire 50 agents in France. Through
the program, agents in migrant communities can be provided with a cash trans-
fer machine and a specific identification and fidelization process providing the
migrants an identification smart card to facilitate its transfers. With its card, a mi-
grant can designate up to three preferred beneficiaries, and the money (up to
€3,000) deposited at a cash machine or by debit card is transferred directly into a
selected beneficiary’s account or remit in cash. Migrants must be registered by
the BdE but do not need bank accounts with BdE.
Source: Author.
Among the MTOs, which offer only cash-to-cash instruments, WesternUnion is the market leader because of its partnership with La BanquePostale, which has more than 6,600 branches.10 The French postal service,La Poste, exclusively delivers its own electronic money transfer products(Mandat Express and Mandat Express International) as well as WesternUnion’s product. Western Union’s network of 50 branches includesSFDP11 and other partnerships, notably since the PE directive transpositionwith change operators and callshops.12
Other MTOs’ networks are small by comparison. MoneyGram nowhas only 47 branches since its partnership with Caisse d’Epargne Rhones-Alpes ended, and its main partner is a financial subsidiary of Carrefour(the leading supermarket company), which has 17 branches. CréditAgricole du Nord Est and MoneyGram are working on a pilot branch.Coinstar has 16 branches throughout France and is partnering withAfrican MTOs such as Money Express. Ria Money Transfer has evenfewer branches (six), and they are concentrated in Paris although itspayment partners are mainly MFIs in Africa. Ria (especially) developedits agent networks thanks to the new PE directive and a more aggressivestrategy to address African corridors.
Regional MTOs—relatively minor players in this market—operate byforming partnerships with Coinstar and BdE. They include MoneyExpress (which partners are La Banque Postale in Côte d’Ivoire andSenegal, MFIs, La Poste, and several other small banks throughout fran-cophone Africa) and Express Union (a leader in Cameroon that is alsoestablished in other Economic and Monetary Community of CentralAfrican States [Communauté Économique et Monétaire de l’AfriqueCentrale, or CEMAC] countries).
African banks, despite their limited number of branches, are more inte-grated into the market than are the French banks with African sub-sidiaries because of the simplicity of their products and because theyaccept foreign identity papers from their clients. Some African banks haverepresentative offices in France—either under the umbrella of a Frenchpartner bank (such as CBIP) with capital from the African bank or byestablishing their own bank in France (for example, Attijariwafa Bank andthe Bank of Africa [BOA]). Through these representative offices,migrants can open accounts in their home countries and deposit fundsinto them from France. CBIP’s African partners usually pay a yearly feeand share a part of the commissions. Long-term or stable resources arethe banks’ main objective, and a presence in Paris is a decisive factor increating a relationship with migrants and international wholesalers fromthe home country. Certain Moroccan banks have a global strategy that
284 Remittance Markets in Africa
encompasses the migrant market, with subsidiaries in France andthroughout the African markets. (Attijariwafa Bank has subsidiaries inAfrica, and Banque Marocaine du Commerce Extérieur recentlyestablished subsidiaries in France by investing in the BOA group.) Inparticular, Attijariwafa bank bought the Senegalese CompagnieBancaire de l’Afrique Occidentale (CBAO)—CBIP’s main stake-holder—as well as the Banque Internationale pour le Mali (BIM), thesecond-largest bank in Mali, with a presence in eight Sub-SaharanAfrican countries.13
Informal sector RSPs. The informal sector includes diverse providers andindividuals for whom money transfer is not necessarily the main activity.Three types of models dominate, often in combination or even includingformal channels for efficiency:
• Individual (carrying money and goods on trips home)• Community-based • Business-oriented.
In the individual model, when a migrant worker returns home onvacation, he or she carries remittance money, not only for his or her ownfamily but also on behalf of fellow migrants or close friends. The nameof the sender, the receiver, and the amount are pasted on the banknotes. Costs are not formally fixed, but senders typically pay to thetransportation carrier 3 to 10 percent of the amount carried.
The community-based model involves a group of individuals (typically15 to 20 people) living in the same village or the same building who cre-ate an “association” (formal or not) to send money home and manage asmall shop in the village.14 This model is particularly prevalent amongmigrants from rural areas, where community ties are still strong. Themoney is collected within a small and close community group, and goodsare purchased in France or from wholesalers in the home countries. Retailorders for individual money transfers or goods purchases (for the family)are made daily by mobile phone or fax (if the village has a regular phoneconnection). The group must ensure that it can always finance the collec-tive village shop’s cash flow to remit money to relatives in the village andto buy goods for the community shop in bulk. The migrants’ regular vis-its to the village guarantee this minimum cash flow. Alternatively, bankwire transfers or cash advances from wholesalers in the home country canhelp to finance the cash flow. In turn, the revenue from sales and com-missions also pay the group’s shopkeeper, a collector in charge of
France 285
gathering funds in France and routing them to their destination by itsown means or by identifying a migrant going home, and accountant inFrance.15 Yearly remittances through these means could total €50,000and require a monthly cash flow of about €4,500. Table 10.5 summa-rizes each actor’s role in a community-based informal RSP.
The business-oriented model is a variant of the community-basedmodel, the main difference being that the money transfer activities areconducted by business-oriented individuals (such as wholesalers, retailers,or hostel collectors) instead of by the migrants themselves. Generally,these individuals have family members running the business in France, inthe home country, or in other countries. The scale of operation (mostlyinformal but including formal elements) depends on the strength ofthe relationship between the partners (typically family members) andthe ability to finance cash flows in a timely manner at different pointsof payment simultaneously. In the remittance recipient country, retail-ers are often found in the capital city and secondary towns. In France,funds are gathered through designated collectors or directly in retailshops or at wholesalers. The biggest retail players act as clearinghousesserving various small networks and can provide currencies for whole-salers. They have a strong reputation with the other players and helpto ensure the viability of the system. Monthly cash flows can amountto more than €30,000, and annual flows can add up to €500,000 for150 to 200 clients in one informal RSP. In the case of flexible exchangerates, speculation could affect revenue.16
Profit maximization is not the sole objective of business-orientedinformal providers. They are also interested in putting their capital tobest use and increasing their business volume by building interna-tional networks of correspondents. Commissions and fees are flexibleand do not always reflect the true costs of the transaction. (For exam-ple, the informal RSP generally does not pay the agent’s travel costsbut compensates the traveler in other ways.)17 Desirable features ofthis kind of informal service include confidence, discretion, immedi-ate delivery of cash, advance transfers for regular clients, and lowercommissions if problems arise. Compared with the formal channels,this channel’s accessibility and cordiality are also big advantages—andoften considered even more important than costs (which are some-times not competitive with the formal sector’s, especially for transfersof small amounts).
Some of the interviewed providers cited embezzlement, robbery, orloss as risks of the business-oriented model.18 In such cases, there is no
286 Remittance Markets in Africa
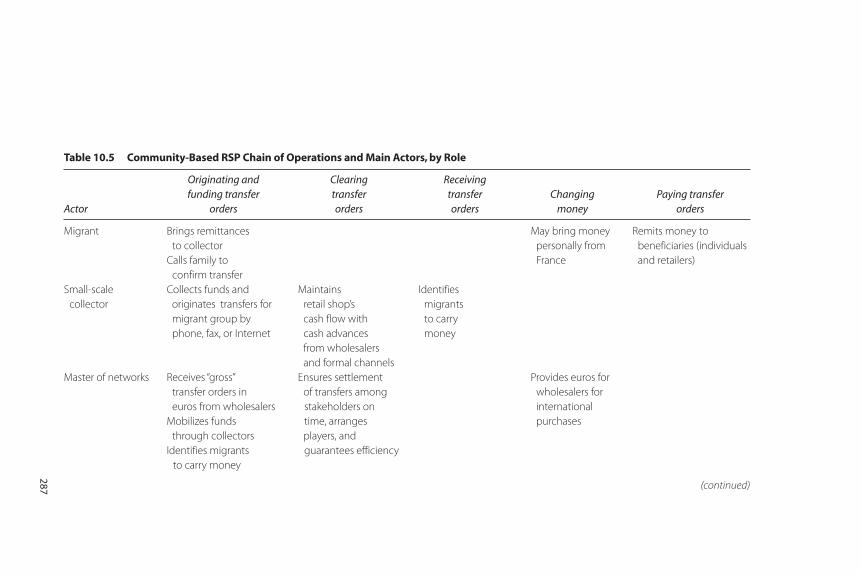
Table 10.5 Community-Based RSP Chain of Operations and Main Actors, by Role
Originating and Clearing Receivingfunding transfer transfer transfer Changing Paying transfer
Actor orders orders orders money orders
Migrant Brings remittances May bring money Remits money toto collector personally from beneficiaries (individuals
Calls family to France and retailers)confirm transfer
Small-scale Collects funds and Maintains Identifies collector originates transfers for retail shop’s migrants
migrant group by cash flow with to carryphone, fax, or Internet cash advances money
from wholesalersand formal channels
Master of networks Receives “gross” Ensures settlement Provides euros fortransfer orders in of transfers among wholesalers for euros from wholesalers stakeholders on international
Mobilizes funds time, arranges purchasesthrough collectors players, and
Identifies migrants guarantees efficiencyto carry money
(continued)
287
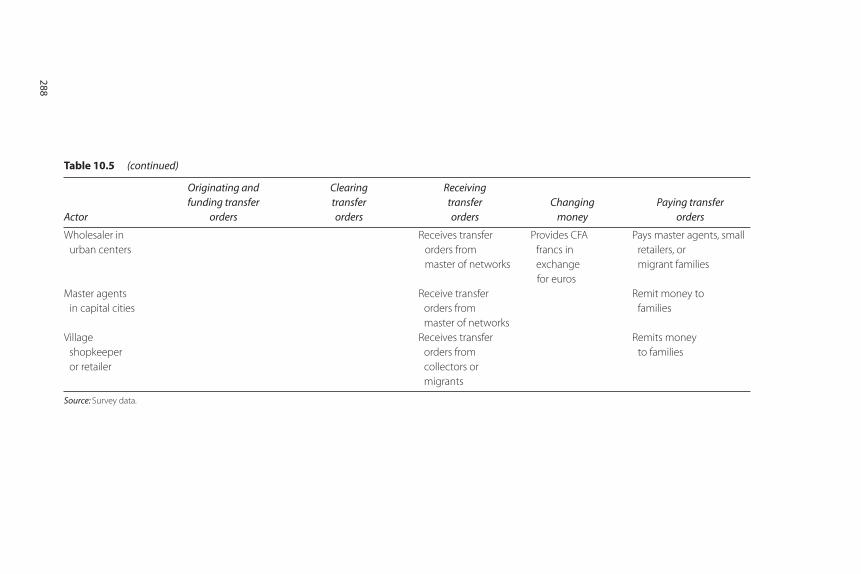
Wholesaler in Receives transfer Provides CFA Pays master agents, smallurban centers orders from francs in retailers, or
master of networks exchange migrant familiesfor euros
Master agents Receive transfer Remit money toin capital cities orders from families
master of networksVillage Receives transfer Remits money
shopkeeper orders from to familiesor retailer collectors or
migrants
Source: Survey data.
Table 10.5 (continued)
Originating and Clearing Receivingfunding transfer transfer transfer Changing Paying transfer
Actor orders orders orders money orders
288
attempt to recompense for the loss of one’s money. Specific operationscould be formalized, especially the collection and transfer of funds, toavoid these risks. Payments made through mobile phones at a low costper transaction could also be a convenient means of avoiding frequentcalls or the use of fax machines. Some RSPs interviewed are interestedin formalizing certain operations with the new PE regulations in mind,but they are concerned about potential fiscal losses from their inabilityto compete in a technologically advanced environment. Another con-straint is posed by some wholesalers who have a strong interest inhaving access to cash currencies to finance their international pur-chases. User preference, origin of migrants, and financial literacy arestrong determinants in the choice of channels and mechanisms used.19
Remittance Volumes, Sources, and DestinationsSeveral hypotheses were used to estimate the size of the French remit-tance market. The formal flows were then separated from the data gath-ered through primary and secondary sources. Two scenarios weremodeled for the entire market on the basis of estimated population ofmigrants. The data from the study were then aggregated to estimate thetotal formal market.
Model 1 was based on the average amount sent and the propensityto send. The model estimated a population of 1 million migrants, thepropensity (62 percent of migrants) to send money home, and an aver-age monthly transfer per capita. The estimate based on Model 1 isshown in table 10.6.
Model 2 was based on an African Development Bank (AfDB) studyfrom 2007, from which partial data were extrapolated. The estimatebased on Model 1 is shown in table 10.7.
Based on the estimates derived from both models, as shown in tables10.6 and 10.7, the size of the French remittance market for Sub-SaharanAfrica is between €1 billion (low hypothesis) and €1.8 billion.
Formal market estimates. The global formal market from the sample wasextrapolated by use of several hypotheses and complementary sources,including the following:
• 2006 data from La Banque Postale (from an official source), which isthe backbone of the market20
• Flows generated by MTOs, extrapolated from the volume of transac-tions of a typical Western Union branch
France 289
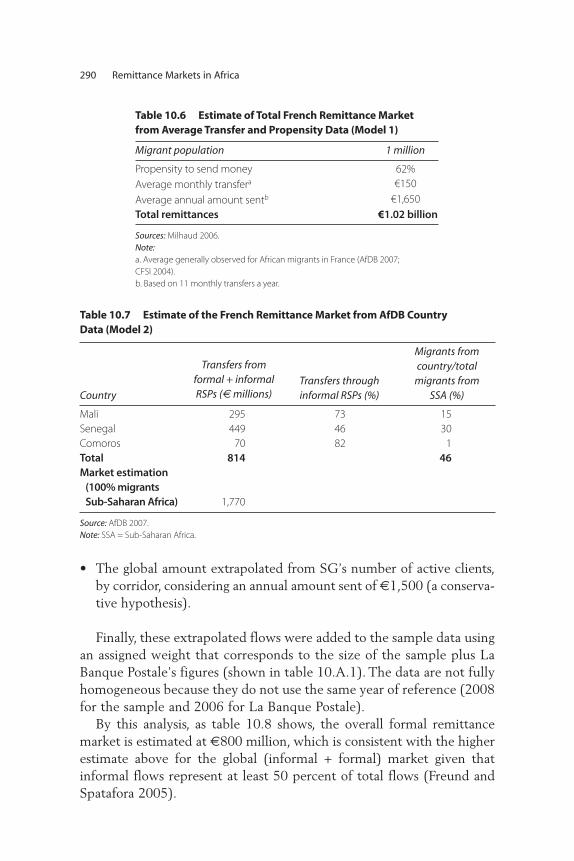
290 Remittance Markets in Africa
• The global amount extrapolated from SG’s number of active clients,by corridor, considering an annual amount sent of €1,500 (a conserva-tive hypothesis).
Finally, these extrapolated flows were added to the sample data usingan assigned weight that corresponds to the size of the sample plus LaBanque Postale’s figures (shown in table 10.A.1). The data are not fullyhomogeneous because they do not use the same year of reference (2008for the sample and 2006 for La Banque Postale).
By this analysis, as table 10.8 shows, the overall formal remittancemarket is estimated at €800 million, which is consistent with the higherestimate above for the global (informal + formal) market given thatinformal flows represent at least 50 percent of total flows (Freund andSpatafora 2005).
Table 10.6 Estimate of Total French Remittance Marketfrom Average Transfer and Propensity Data (Model 1)
Migrant population 1 million
Propensity to send money 62%Average monthly transfera €150
Average annual amount sentb €1,650Total remittances €1.02 billion
Sources: Milhaud 2006.Note:a. Average generally observed for African migrants in France (AfDB 2007; CFSI 2004). b. Based on 11 monthly transfers a year.
Table 10.7 Estimate of the French Remittance Market from AfDB Country Data (Model 2)
Country
Transfers from formal + informal RSPs (€ millions)
Transfers throughinformal RSPs (%)
Migrants fromcountry/total
migrants from SSA (%)
Mali 295 73 15Senegal 449 46 30Comoros 70 82 1Total 814 46Market estimation
(100% migrantsSub-Saharan Africa) 1,770
Source: AfDB 2007.Note: SSA = Sub-Saharan Africa.
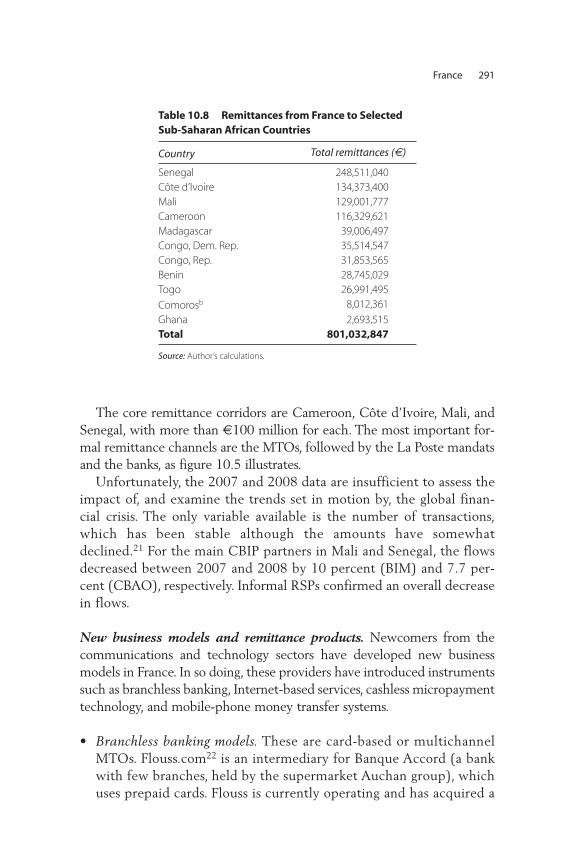
France 291
The core remittance corridors are Cameroon, Côte d’Ivoire, Mali, andSenegal, with more than €100 million for each. The most important for-mal remittance channels are the MTOs, followed by the La Poste mandatsand the banks, as figure 10.5 illustrates.
Unfortunately, the 2007 and 2008 data are insufficient to assess theimpact of, and examine the trends set in motion by, the global finan-cial crisis. The only variable available is the number of transactions,which has been stable although the amounts have somewhatdeclined.21 For the main CBIP partners in Mali and Senegal, the flowsdecreased between 2007 and 2008 by 10 percent (BIM) and 7.7 per-cent (CBAO), respectively. Informal RSPs confirmed an overall decreasein flows.
New business models and remittance products. Newcomers from thecommunications and technology sectors have developed new businessmodels in France. In so doing, these providers have introduced instrumentssuch as branchless banking, Internet-based services, cashless micropaymenttechnology, and mobile-phone money transfer systems.
• Branchless banking models. These are card-based or multichannelMTOs. Flouss.com22 is an intermediary for Banque Accord (a bankwith few branches, held by the supermarket Auchan group), whichuses prepaid cards. Flouss is currently operating and has acquired a
Table 10.8 Remittances from France to SelectedSub-Saharan African Countries
Country Total remittances (€)
Senegal 248,511,040Côte d’Ivoire 134,373,400Mali 129,001,777Cameroon 116,329,621Madagascar 39,006,497Congo, Dem. Rep. 35,514,547Congo, Rep. 31,853,565Benin 28,745,029Togo 26,991,495Comorosb 8,012,361Ghana 2,693,515Total 801,032,847
Source: Author’s calculations.
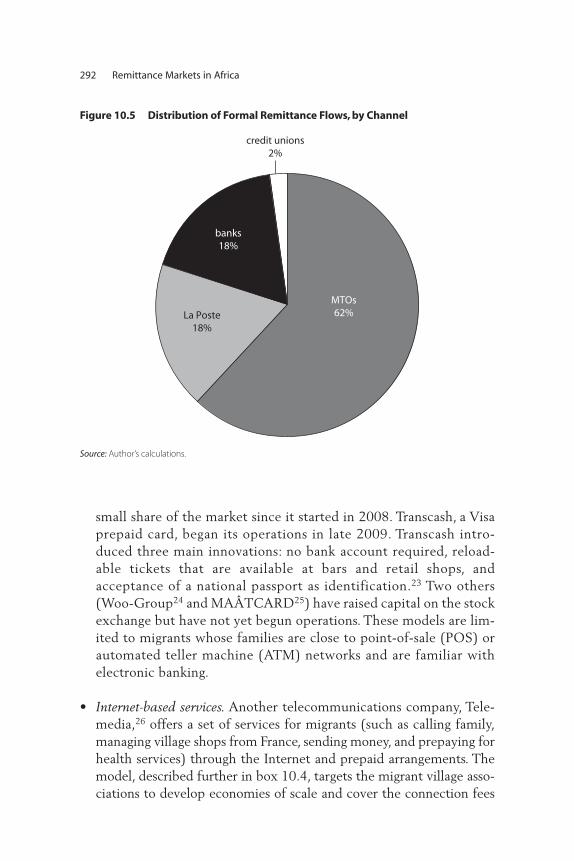
292 Remittance Markets in Africa
small share of the market since it started in 2008. Transcash, a Visaprepaid card, began its operations in late 2009. Transcash intro-duced three main innovations: no bank account required, reload-able tickets that are available at bars and retail shops, andacceptance of a national passport as identification.23 Two others(Woo-Group24 and MAÂTCARD25) have raised capital on the stockexchange but have not yet begun operations. These models are lim-ited to migrants whose families are close to point-of-sale (POS) orautomated teller machine (ATM) networks and are familiar withelectronic banking.
• Internet-based services. Another telecommunications company, Tele-media,26 offers a set of services for migrants (such as calling family,managing village shops from France, sending money, and prepaying forhealth services) through the Internet and prepaid arrangements. Themodel, described further in box 10.4, targets the migrant village asso-ciations to develop economies of scale and cover the connection fees
La Poste18%
banks18%
credit unions2%
MTOs62%
Figure 10.5 Distribution of Formal Remittance Flows, by Channel
Source: Author’s calculations.
France 293
in the village. It has a pilot in two rural villages in the Kayes region ofMali, which is partly financed with a €227,000 contribution from theFrench Ministry of National Identity, Immigration, Integration, andDevelopment.
• Micropayment operators. Tagattitude27 has developed a technology thatuses existing analog (voice) technology, as further described in box10.4. Its pilot project in Mali, supported by the World Bank, involvesa micropayment cashless system (for transactions of less than €150)built on an Internet platform that sells prepaid units to be transferredby mobile phone from France to Mali, where 25 Bamako retailers cur-rently accept it. Tagattitude is not registered to operate as a paymentestablishment or as a bank; therefore, the money has to be spent onlyin shops or pharmacies (for example, as a gift transfer).
• Orange. One of the big three licensed telecommunications firms inFrance, Orange is considering the international remittance market.Cross-border transfers are complex from a regulatory point of view;however, through its BNP Paribas subsidiaries in Africa, the companylaunched a pilot for national money transfer by mobile (OrangeMoney) in Côte d’Ivoire and Senegal.28 Sending prepaid airtime from
Box 10.3
Loro/Nostro Accounts Enable African Banks to Collect Deposits in France
French banking law does not allow the representative offices of African banks to
collect cash deposits in France. To address this limitation, these banks have signed
partnership agreements with some French banks to have their representative of-
fices considered legally as partner branches of the French banks, which are thus
able to collect deposits.
Under this arrangement, migrants’ deposits fund CFA franc accounts opened
on their behalf on the African bank’s books. In turn, the African bank also opens
a specific account, called a loro, that goes on the French bank’s books. This loro
can be cleared through an international wire transfer or used by the African bank
to fund its trade operations in euros.
Source: Rouchy and Gourvez 2006.
294 Remittance Markets in Africa
France to Africa and within Africa is already feasible, but Orange isalso testing contactless payment in France.
• Suncard Family. Suncard Family is a telecommunications firm in theFrench Caribbean that has developed a subsidiary allowing the pur-chase and delivery of food to families of the Haitian diaspora.29 Thecompany also recently set up a firm in France to cover the markets inCôte d’Ivoire, Mali, and Senegal. In addition to the purchase and de-livery of goods, Suncard plans to offer money transfers and to establishpartnerships with MTOs.
Box 10.4
Telemedia and Tagattitude: New Channels for Micropayments to Mali
Two telecommunications firms, Telemedia and Tagattitude, are testing innovative
channels to support Internet-based services for migrants and micropayments
through mobile phones and are working together to market their solutions to
Malian migrants’ associations in France.
Telemedia is testing an approach that puts migrant associations at the center.
In the business case set for migrants, Telemedia call shops managed by migrants
deliver a package of services that may include any or all of the following: interna-
tional calling by a VoIP channel; videoconferencing with family; microtransfers or
payments; retail shop management; and individual prepaid accounts for family
purchases, health care, and other needs. The model requires an existing Internet
connection in the village, and migrants would pay the recurrent connection costs.
The infrastructure would require a partnership with the public or private sector as
well as the contribution of the migrants’ association.
Tagattitude has developed a secure protocol to transfer information between
mobile phones and an Internet platform that uses the Global System for Mobile
Communications (GSM) network without requiring a specific mobile chip mech-
anism called NSDTTM (Near Sound Data Transfer). Prepaid units can be loaded
(cashed in) on mobile phones either with cash or from a bank card through Tagat-
titude’s Internet platform, called TagPay, and transferred by phone. Prepaid money
can then be spent within a private network of “merchant acceptors.” Retailers can
accept the m-payment thanks to a simple communication with the foreign plat-
form through the channel of their mobile phone. Compensation is made daily in
their bank accounts in Mali.
Source: Author.
France 295
Other new remittance products have emerged from innovative dias-pora initiatives. Hope Finance, an MFI, is developing a set of services(money transfer services, payment for goods, and payment for healthcare) dedicated to the African diaspora and their families.30 Formerly inpartnership with Money Express, Hope Finance now has developed itsown software for electronic cash-to-cash transfers, to be implementedthroughout its proprietary network of MFIs in Africa. These moneytransfer services are used to attract migrants to other services, mainlyhealth care programs.
La Mutuelle d’Epargne et de Crédit des Sénégalais de France(MECSEF) plans to offer money transfer services to Senegalesemigrants. MECSEF has entered into a partnership with Poste Financein Senegal, where it complies with the microfinance laws. Both insti-tutions, however, need to meet additional requirements to developtheir payment operations from France.
On the payment system side, there have been no solutions amongmajor operators (Visa, MasterCard, and SWIFT) for microtransfers toAfrica. However, Caisse d’Epargne is discussing plans to issue Visa cardswith an African bank that has a large network in several African coun-tries. MasterCard launched Money Send in the Asian corridors andcould transpose it to the African corridors if there is market demand.Initiatives not yet linked to major card issuers in France include theInterbank Electronic Banking Group of the Economic and MonetaryUnion of West Africa.31 Integration of French banks in the Single EuroPayments Area (SEPA)32 remains slow, and it is too early to examineopportunities for microtransfers in this area.
The Regulatory and Business Environment
In France, only financial institutions (établissement de crédit) canengage in services involving means of payment, such as settlement ofinternational person-to-person money transfers.33 The minimum cap-ital requirement for creating a financial institution is €2.2 million—aconstraint for MTOs that want to open branches in France, whetherthey are mobilizing funds to create the institution or maintaining therequired capital after the institution is established. Alternatively,MTOs can partner with financial institutions to deliver person-to-person transfer products. Nonbank institutions (intermediary bankoperations, or intermédiaire en operations de banque) can also managemeans of payment on behalf of financial institutions by offering card-to-card money transfers.
With a New Payment Services Directive, New Operators A new type of financial intermediary, called a payment establishment, isnow allowed to implement means of payment within the SEPA coun-tries.34 The new PE operators could become players in the African remit-tance market because operations outside SEPA are permitted and becausethe minimum capital requirement will be reduced to €20,000 for basicoperations. This new regulatory environment will also bring some flexibil-ity to the agent role because anyone can be a PE agent who complies withthe required procedures.
Several RSPs interviewed during the study (Flouss.com, Telemedia,and Suncard Family) are considering becoming PEs, and some informalRSPs are interested in either creating a PE or becoming an agent for aPE or an existing MTO. African banks, African MFIs, and regionalMTOs could also be interested in either creating PEs or collaboratingwith one as an alternative to the major MTOs and La Banque Postale(because of the latter’s exclusivity contract with Western Union and itsown products).
Among the implications of the new payment services law are thefollowing:
• It could present an opportunity for regional MTOs or African banksand MFIs to enter the market directly or through partnerships withthe new PEs.
• It could allow newcomers such as mobile-phone or Internet-basedniche market operators to create their own PEs and add money trans-fer operations to their core business services.
• It could enlarge the network of agents, especially through the estab-lishment of more retail shops and associations of migrants.
However, the delivery of new agreements could be gradual. With theintroduction of new types of operators in the market and greater compe-tition in terms of remittance instruments and technologies, new types ofrisks may also emerge. However, points of sale and innovative alliancesamong nonbank operators should increase and will cover a wider array ofspecific needs (table 10.9).
Entry and Coverage LimitationsAs previously mentioned, banks are reluctant to handle cash operations,especially for nonregistered clients. This aversion limits the coverage ofbasic electronic transfer services through their branch infrastructures.
296 Remittance Markets in Africa
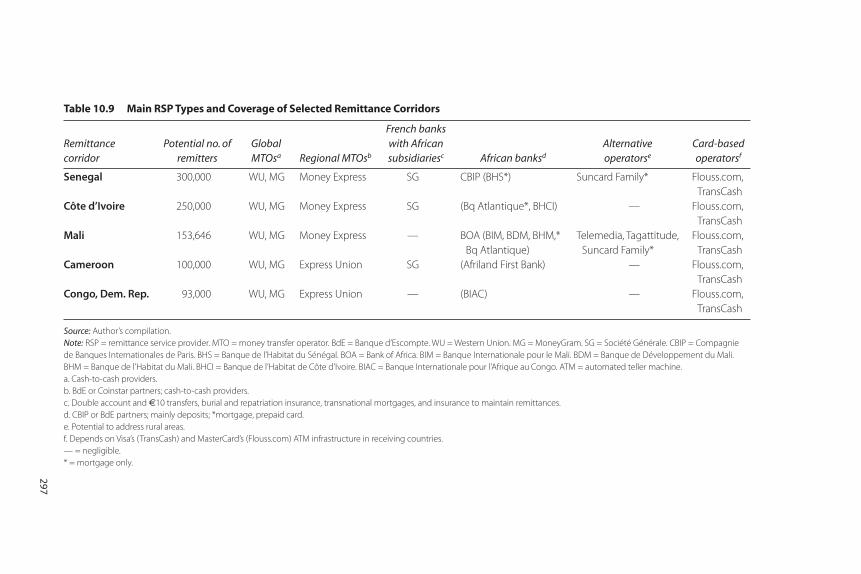
Table 10.9 Main RSP Types and Coverage of Selected Remittance Corridors
Remittance corridor
Potential no. ofremitters
GlobalMTOsa Regional MTOsb
French bankswith African subsidiariesc African banksd
Alternative operatorse
Card-based operatorsf
Senegal 300,000 WU, MG Money Express SG CBIP (BHS*) Suncard Family* Flouss.com, TransCash
Côte d’Ivoire 250,000 WU, MG Money Express SG (Bq Atlantique*, BHCI) — Flouss.com, TransCash
Mali 153,646 WU, MG Money Express — BOA (BIM, BDM, BHM,* Bq Atlantique)
Telemedia, Tagattitude,Suncard Family*
Flouss.com, TransCash
Cameroon 100,000 WU, MG Express Union SG (Afriland First Bank) — Flouss.com, TransCash
Congo, Dem. Rep. 93,000 WU, MG Express Union — (BIAC) — Flouss.com, TransCash
Source: Author’s compilation.Note: RSP = remittance service provider. MTO = money transfer operator. BdE = Banque d’Escompte. WU = Western Union. MG = MoneyGram. SG = Société Générale. CBIP = Compagniede Banques Internationales de Paris. BHS = Banque de l’Habitat du Sénégal. BOA = Bank of Africa. BIM = Banque Internationale pour le Mali. BDM = Banque de Développement du Mali.BHM = Banque de l’Habitat du Mali. BHCI = Banque de l’Habitat de Côte d’Ivoire. BIAC = Banque Internationale pour l’Afrique au Congo. ATM = automated teller machine.a. Cash-to-cash providers.b. BdE or Coinstar partners; cash-to-cash providers.c. Double account and €10 transfers, burial and repatriation insurance, transnational mortgages, and insurance to maintain remittances.d. CBIP or BdE partners; mainly deposits; *mortgage, prepaid card. e. Potential to address rural areas.f. Depends on Visa’s (TransCash) and MasterCard’s (Flouss.com) ATM infrastructure in receiving countries.— = negligible.* = mortgage only.
297
For niche market operators like Telemedia, the major barriers are lackof broadband access, high energy costs, and local telecom monopolies.Telecom regulators need to provide open access to their networks becauselicenses are expensive for firms that serve migrants from remote ruralcommunities. It is particularly difficult for smaller e-payment providersthat lack their own telecom infrastructures. Wi-Max can be an alternativemeans of connectivity for the small subregions from which migrants orig-inate, but there is little infrastructure to support this model. For example,energy costs for batteries can be up to 60 percent of the total cost ofoperating a dispensary and call shop. The lack of access to national tele-com networks means the provider has to build its own infrastructure.
During the RSP survey interviews, many of both the formal and infor-mal RSPs know their customers and their preferences but lack adequateinformation to help them better penetrate their markets because the abil-ity to offer money transfer services depends on transaction volume andsufficient investment to build secure branches.35 In addition, retail bankswith large networks seem unable to monitor small amounts of transfersin each corridor.36
Ever since the launch of the Send Money Web site (http://www.envoidargent.fr), which lists money transfer charges, overall public policyhas shifted toward reducing the cost of sending money home. This repre-sents an important evolution from the original approach, which focusedmainly on helping migrants leverage their savings toward development byinvesting in collective initiatives or local development and establishingsmall enterprises in their home countries. However, codevelopment—astrategy by which migrants contribute toward the development of theircountries of origin—remains an important public policy issue. Supportingfinancial innovation and the migrants’ efforts to invest in their homecountries or involving migrants in implementing social services (includingeducation, capacity building, health, and access to water) is at the fore-front of the French public strategy.
Remittance CostsThe cost to send €150 varies from €5 in the informal sector to €20 in thebanking (formal) sector. This does not include the costs of receivingthe transfer for the banks.
For both informal RSPs and MTOs, the fee to send money decreases asthe amount sent increases, in percentage. In the informal sector, the fee isunder €5 for any amount less than €150, increasing to €10 for any amountbeyond that. Informal RSPs do not include the cost of international travel
298 Remittance Markets in Africa
when the cash is carried in luggage. The lowest fee to send money throughWestern Union is €8.37 The other MTOs (including informal RSPs) havekept their charges slightly above Western Union’s. In the banking sector,fees to send money are generally fixed and vary from €10 to €20.
The banks offer three general types of services and pricing:
• French banks with African subsidiaries: Transfers are done within thenetwork, costs are lower and transparent, and the receiver bears nocosts.
• African bank representatives in France: The average deposit fee is be-tween €8 and €10, and the average withdrawal fee is €20.
• Banks with correspondent agents: Each transaction costs about €20, butthe receiving banks’ fees were not disclosed (estimated to be alsoabout €20).
Card-based providers generally charge three types of fees:
• Registration: €19 • Loading a prepaid card: €3 plus an additional 1.5 percent of the
amount• Withdrawals: €5.
Although the sender’s costs are not fully transparent (because of thedifferent prepaid card solutions), this solution could be more competi-tive and produce greater economies of scale if the withdrawal fees inAfrica were much lower. Similar services cost much less in Moroccobecause of a higher volume of transactions and revenue from better liq-uidity management.38 Overall, client preferences must be consideredwhen comparing costs. Indeed, small cash-to-cash transfers through allchannels remain the most used and the most expensive instrument,39
but alternative channels still exist. The banking channels40 are the mosteffective, charging a flat commission rate, considering the averageamount sent, as shown in table 10.10.
Micropayment by mobile phone remains the dominant means of pay-ment in rural remote areas. It is one of the cheapest instruments, and itholds potential for frequent microtransactions, even in remote areas, ifthere is a retailer and a GSM network. Prepaid cards are another con-venient instrument because they allow the recipient to withdraw moneyat any time of the day. However, they require a large and efficient paymentinfrastructure, making this model expensive and unusual, especially
France 299
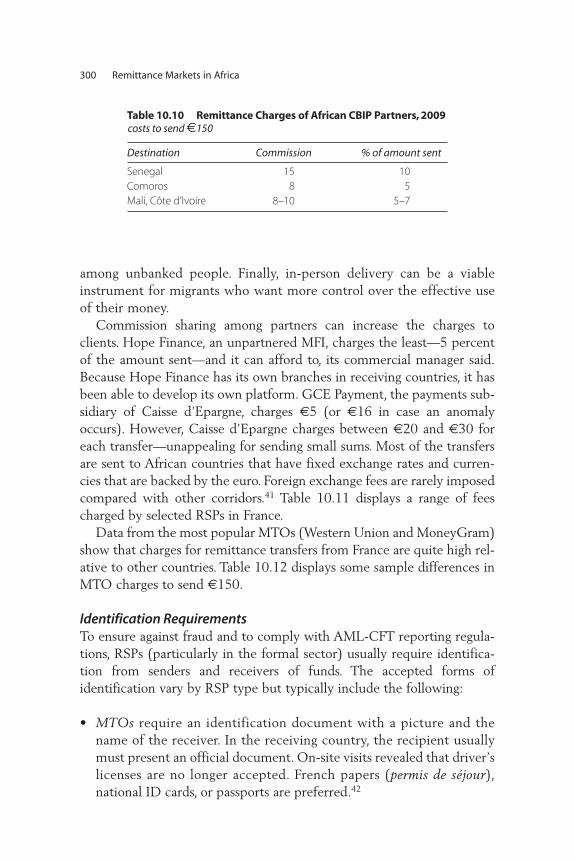
300 Remittance Markets in Africa
among unbanked people. Finally, in-person delivery can be a viableinstrument for migrants who want more control over the effective useof their money.
Commission sharing among partners can increase the charges toclients. Hope Finance, an unpartnered MFI, charges the least—5 percentof the amount sent—and it can afford to, its commercial manager said.Because Hope Finance has its own branches in receiving countries, it hasbeen able to develop its own platform. GCE Payment, the payments sub-sidiary of Caisse d’Epargne, charges €5 (or €16 in case an anomalyoccurs). However, Caisse d’Epargne charges between €20 and €30 foreach transfer—unappealing for sending small sums. Most of the transfersare sent to African countries that have fixed exchange rates and curren-cies that are backed by the euro. Foreign exchange fees are rarely imposedcompared with other corridors.41 Table 10.11 displays a range of feescharged by selected RSPs in France.
Data from the most popular MTOs (Western Union and MoneyGram)show that charges for remittance transfers from France are quite high rel-ative to other countries. Table 10.12 displays some sample differences inMTO charges to send €150.
Identification RequirementsTo ensure against fraud and to comply with AML-CFT reporting regula-tions, RSPs (particularly in the formal sector) usually require identifica-tion from senders and receivers of funds. The accepted forms ofidentification vary by RSP type but typically include the following:
• MTOs require an identification document with a picture and thename of the receiver. In the receiving country, the recipient usuallymust present an official document. On-site visits revealed that driver’slicenses are no longer accepted. French papers (permis de séjour), national ID cards, or passports are preferred.42
Table 10.10 Remittance Charges of African CBIP Partners, 2009
Destination Commission % of amount sent
Senegal 15 10Comoros 8 5Mali, Côte d’Ivoire 8–10 5–7
costs to send €150
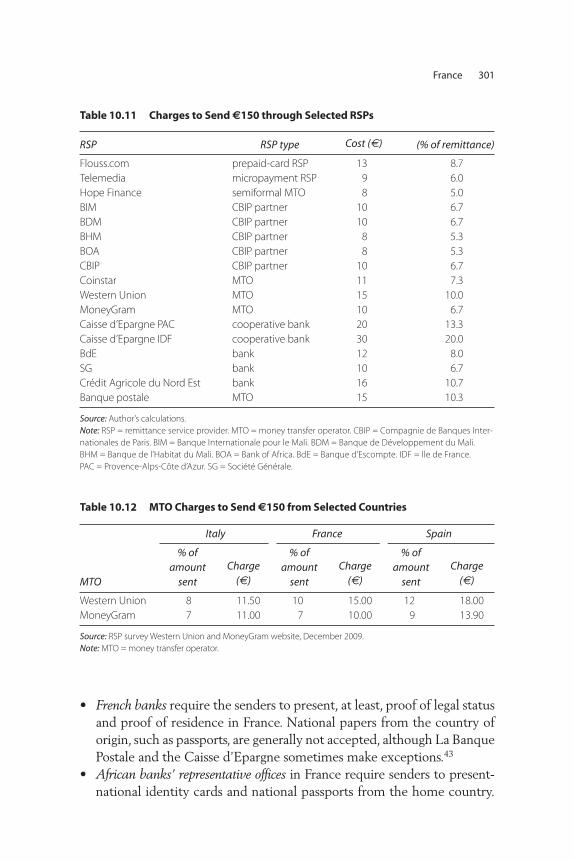
France 301
• French banks require the senders to present, at least, proof of legal statusand proof of residence in France. National papers from the country oforigin, such as passports, are generally not accepted, although La BanquePostale and the Caisse d’Epargne sometimes make exceptions.43
• African banks’ representative offices in France require senders to present-national identity cards and national passports from the home country.
Table 10.11 Charges to Send €150 through Selected RSPs
RSP RSP type Cost (€) (% of remittance)
Flouss.com prepaid-card RSP 13 8.7Telemedia micropayment RSP 9 6.0Hope Finance semiformal MTO 8 5.0BIM CBIP partner 10 6.7BDM CBIP partner 10 6.7BHM CBIP partner 8 5.3BOA CBIP partner 8 5.3CBIP CBIP partner 10 6.7Coinstar MTO 11 7.3Western Union MTO 15 10.0MoneyGram MTO 10 6.7Caisse d’Epargne PAC cooperative bank 20 13.3Caisse d’Epargne IDF cooperative bank 30 20.0BdE bank 12 8.0SG bank 10 6.7Crédit Agricole du Nord Est bank 16 10.7Banque postale MTO 15 10.3
Source: Author’s calculations.Note: RSP = remittance service provider. MTO = money transfer operator. CBIP = Compagnie de Banques Inter-nationales de Paris. BIM = Banque Internationale pour le Mali. BDM = Banque de Développement du Mali. BHM = Banque de l’Habitat du Mali. BOA = Bank of Africa. BdE = Banque d’Escompte. IDF = Ile de France. PAC = Provence-Alps-Côte d’Azur. SG = Société Générale.
Table 10.12 MTO Charges to Send €150 from Selected Countries
MTO
Italy France Spain
% ofamount
sent
Charge(€)
% ofamount
sent
Charge(€)
% ofamount
sent
Charge(€)
Western Union 8 11.50 10 15.00 12 18.00MoneyGram 7 11.00 7 10.00 9 13.90
Source: RSP survey Western Union and MoneyGram website, December 2009.Note: MTO = money transfer operator.
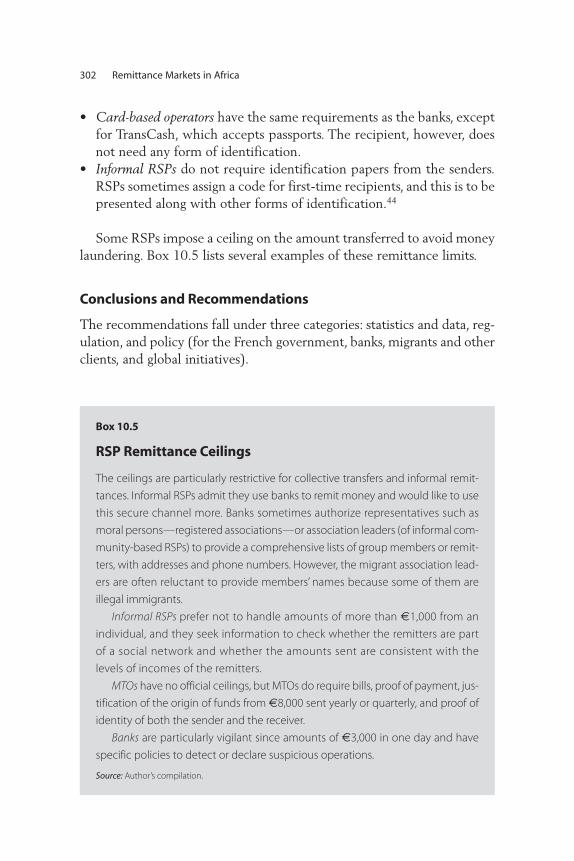
302 Remittance Markets in Africa
• Card-based operators have the same requirements as the banks, exceptfor TransCash, which accepts passports. The recipient, however, doesnot need any form of identification.
• Informal RSPs do not require identification papers from the senders.RSPs sometimes assign a code for first-time recipients, and this is to bepresented along with other forms of identification.44
Some RSPs impose a ceiling on the amount transferred to avoid moneylaundering. Box 10.5 lists several examples of these remittance limits.
Conclusions and Recommendations
The recommendations fall under three categories: statistics and data, reg-ulation, and policy (for the French government, banks, migrants and otherclients, and global initiatives).
Box 10.5
RSP Remittance Ceilings
The ceilings are particularly restrictive for collective transfers and informal remit-
tances. Informal RSPs admit they use banks to remit money and would like to use
this secure channel more. Banks sometimes authorize representatives such as
moral persons—registered associations—or association leaders (of informal com-
munity-based RSPs) to provide a comprehensive lists of group members or remit-
ters, with addresses and phone numbers. However, the migrant association lead-
ers are often reluctant to provide members’ names because some of them are
illegal immigrants.
Informal RSPs prefer not to handle amounts of more than €1,000 from an
individual, and they seek information to check whether the remitters are part
of a social network and whether the amounts sent are consistent with the
levels of incomes of the remitters.
MTOs have no official ceilings, but MTOs do require bills, proof of payment, jus-
tification of the origin of funds from €8,000 sent yearly or quarterly, and proof of
identity of both the sender and the receiver.
Banks are particularly vigilant since amounts of €3,000 in one day and have
specific policies to detect or declare suspicious operations.
Source: Author’s compilation.
Statistics and Data Statistics are the entry point for policy makers as well as market opera-tors. Knowing the amount of remittances by corridor is a prerequisite toleveraging their impact on development and encouraging formal opera-tors to enter the market with lower costs than major MTOs when afford-able. Remittances are a key resource for African countries that arepartners with France and can help to expand migrants’ access to finance.The following data and research activities would help policy makers bet-ter understand migrants’ preferences and remittance behaviors:
• Data on such should be reported by financial intermediaries to theMinistry of Economy, Industry, and Employment (which regularlymeets with its peers from the French-speaking African countries) on aconfidential basis. The aggregated figures should be disclosed by corri-dor, by channel, and by instrument used.
• A comprehensive survey also should be undertaken to assess and bet-ter understand the informal market, which is just as important as theformal market in certain corridors.
• Because formalizing flows is also a prerequisite to formulating poli-cies, it may help policy makers to compare the repartition betweenformal and informal figures, in addition to the costs of sending moneyhome with those from other European countries, and to assess the ef-forts to formalize the informal flows and to cut costs.
• Increased demographic and anthropologic research on migration andremittance patterns, by generation, could yield better understandingof migrants’ specific needs (if any) involving remittances to their fam-ilies or their ability to invest in their countries of origin.
• Access to existing demographic data is currently not available fromthe National Commission for Informatics and Liberties (CommissionNationale de l’Informatique et des Libertés, or CNIL), but the releaseof such data could help complete the market picture for financial intermediaries that are studying their own client bases.
• The national Send Money Web site (http://www.envoidargent.fr)could be another viable informational resource for migrants, regula-tors, policy makers, market operators, and organizations that supportmoney transfers from France. It should help to address relevantmigrant issues by providing information on the costs charged by theleading RSPs. Migrants’ preferences and each instrument’s featuresshould be highlighted as well as the services migrants could accessfrom supporting organizations. The list of operators should include
France 303
African banks’ representative offices in France (those that have animportant share of the market), and semestrial notes should be pro-vided to mention the progress toward the objective to reduce costs.
RegulationThe introduction of the payment establishment in the financial land-scape, and especially in the remittances industry, is a major innovationthat will encourage diversification and competition. Remittance bench-marks, including the level of costs, the range of institutional status forRSPs and the diversity of channels and instruments, could be undertakenin countries where African diasporas are important, such as France, Italy,Spain, and the United Kingdom. They should be analyzed now that theregulatory framework is harmonized to find a balance between flexibilityand risk control. In addition, the following steps would advance the devel-opment of a reliable, safe, and competitive remittance industry:
• A dialogue among central banks in France and Africa should be heldregularly to encourage the development of services in a secure envi-ronment for both RSPs and clients.
• The entry of new players should be explored, and adherence to regu-lations should be enforced.
• Certain MFIs (with strong enough solvability ratios, supervised by thebanking committee of their respective central banks) should be ableto make cash-to-account, international money transfers directly with-out partnering with local banks and MTOs as subagents. This willhelp to increase competition, reduce costs, and contribute to the expansion of the payment infrastructure as a result of their branchnetworks. Furthermore, it would leverage the potential for the biggestMFIs in countries with high international migration profiles to linkremittances with savings, loans, or insurance products in a develop-ment perspective.
• The regulations governing telecom operators that are already offeringmobile banking in the domestic market but want to offer cross-bordermoney transfers should be clarified.
• The contracts of MTOs in Africa should be scrutinized to assess andensure their conformity with all the legal requirements, notably thecompetitive issues. In particular, exclusivity clauses should be can-celed to ensure a safe competitive market environment.
• Communication and, when relevant, coordination among centralbanks should be improved to assure French financial intermediaries
304 Remittance Markets in Africa
that their African peers respect prudential measures, AML-CFT pro-cedures, and consumer protection standards.
• In Africa, the central banks’ capacity to monitor financial intermedi-aries (especially the biggest MFIs) and to gather harmonized data onremittances should be improved.
Policy Recommendations for the French government. Increasing the level ofinformation among policy makers in both France and Africa is a coreissue. Working groups that include policy makers and representatives inthe private sector and diaspora should be set up with a concerted agenda.Key players from France and Africa also should be brought together forpeer-to-peer meetings, where lessons from success stories such asMorocco could increase policy makers’ knowledge.
The enlargement and diversification of the infrastructure for remittancecollection in cash (cash being the main instrument used for remittances)are the primary means of reducing costs in France. Implementation of thefollowing proposals would start to improve the remittance infrastructure:
• The exclusivity contract between La Banque Postale and WesternUnion (which is not reciprocal; Western Union has other partners inFrance) should be canceled so that La Banque Postale (whose capitalis mainly public) can open its remittance services to other brands.
• Overall, promotion of the PEs and multibrand MTOs also should be encouraged to help to increase the points of payment, volume of transac-tions, and finally competition among global and regional MTOs—ultimately reducing the fixed costs and commissions that clients pay.
• Incentives should be offered to migrants’ associations to open bank ac-counts—for instance, through systematic, facilitated access to publicresources to finance collective projects and related technical support,leveraging migrant resources.
Recommendations for banks. Policy makers should consider the follow-ing recommendations:
• From a banking perspective, migrant associations’ collective transferscould be better handled using electronic banking devices (at points ofsale or by mobile phone) and formal agent managing identification is-sues, thus avoiding in-cash operations at branches or the need for in-formal collectors as agents for the bank.
France 305
• Partnerships between banks and information technology firms provid-ing smart card, mobile banking, or Internet-based services that wouldenable migrants to send money home using convenient instrumentsand channels going to a non-bank-agent outlet (grocery, callshop)without having to go to a bank branch with cash should be encouraged(branchless banking approach).
• Banks wanting to increase their market share with migrants could beinvolved in financial education campaigns for migrants to promoteand explain their own products.
Recommendations for migrants and clients. Both migrants and clientswould benefit from these recommendations:
• The new PE perspective is a pragmatic tool for motivating informalproviders to increase their awareness of the regulatory and fiscal envi-ronment. Training modules could be conceived thanks to focus groupsof informal RSPs, emphasizing regulation and technological innovationsor simply the benefit of formalizing certain activities. Training wouldalso include information about how to create or become an agent of aPE, negotiate commission sharing with banks as a representative agent,and finance individual or collective projects at home for home town associations involved in the informal money transfer business.
• Migrants in general (especially those living in hostels) could receive fi-nancial education from formal financial institutions. “Train the trainer”sessions for migrant leaders and major informal RSPs could dissemi-nate information and make evident the advantages of using a formalchannel or being a part of one.
Recommendations for global initiatives. Global organizations and otherstakeholders also can make important contributions toward greater for-malization of the remittance market. They are well positioned to act onthe following recommendations:
• Payment infrastructure development—a fundamental challenge inAfrican countries—is necessary to increase access and reduce margin-al costs. Development agencies should support private-public partner-ships to address the infrastructure challenge by implementing pilotprojects in specific corridors (for instance, the France-Mali [Kayes]and France-Comoros corridors) that financial intermediaries cannotfully reach.
306 Remittance Markets in Africa
France 307
• Financial literacy among migrants’ families should be enhanced,and access to formal financial services and technologies should bepromoted.
• Innovative financing for development, including securitization of future flow receivables, diaspora bonds, and GDP-indexed bonds,should be developed and implemented (Ketkar and Ratha 2008).Addressing migrants’ basic financial needs in a competitive and secureenvironment is a first step toward instilling confidence among theplayers and achieving the economies of scale that will lay the founda-tion for that development.
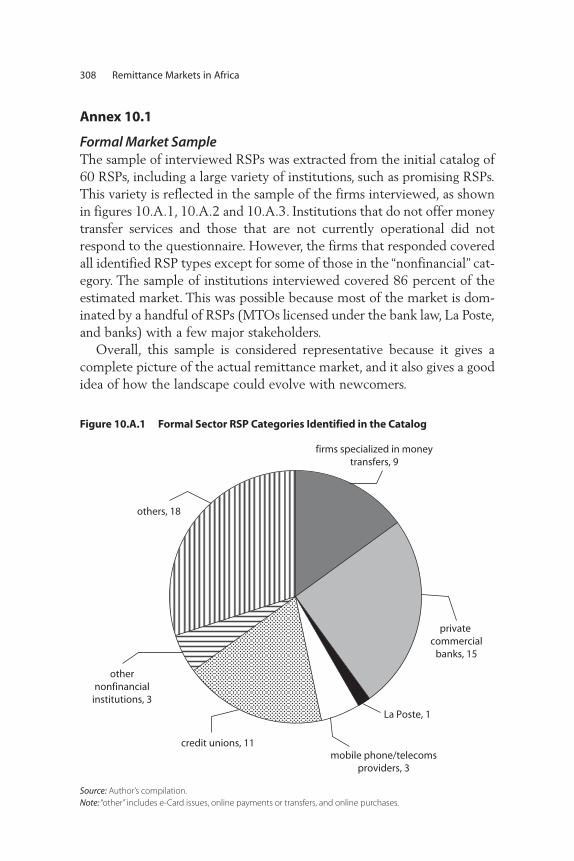
308 Remittance Markets in Africa
Annex 10.1
Formal Market SampleThe sample of interviewed RSPs was extracted from the initial catalog of60 RSPs, including a large variety of institutions, such as promising RSPs.This variety is reflected in the sample of the firms interviewed, as shownin figures 10.A.1, 10.A.2 and 10.A.3. Institutions that do not offer moneytransfer services and those that are not currently operational did notrespond to the questionnaire. However, the firms that responded coveredall identified RSP types except for some of those in the “nonfinancial” cat-egory. The sample of institutions interviewed covered 86 percent of theestimated market. This was possible because most of the market is dom-inated by a handful of RSPs (MTOs licensed under the bank law, La Poste,and banks) with a few major stakeholders.
Overall, this sample is considered representative because it gives acomplete picture of the actual remittance market, and it also gives a goodidea of how the landscape could evolve with newcomers.
firms specialized in moneytransfers, 9
private commercial
banks, 15
La Poste, 1
mobile phone/telecomsproviders, 3
credit unions, 11
others, 18
othernonfinancial
institutions, 3
Figure 10.A.1 Formal Sector RSP Categories Identified in the Catalog
Source: Author’s compilation.Note: “other” includes e-Card issues, online payments or transfers, and online purchases.
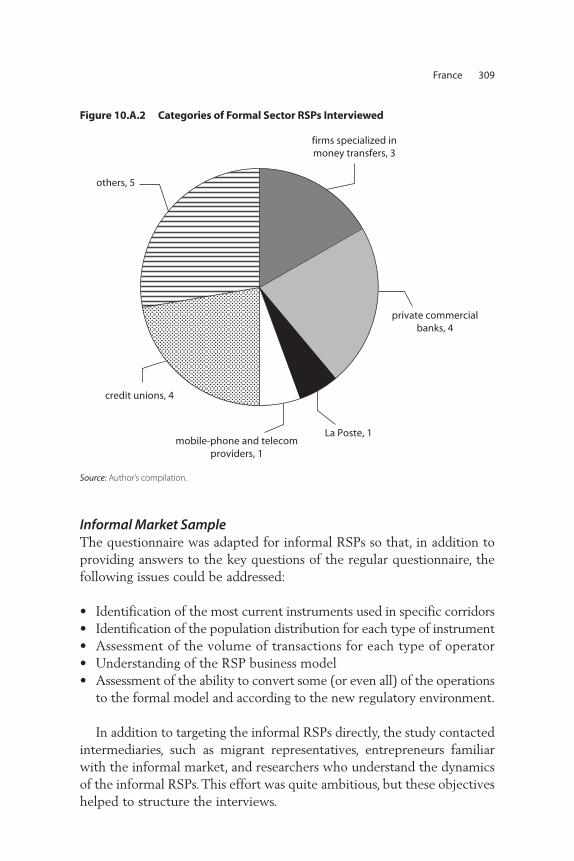
France 309
Informal Market SampleThe questionnaire was adapted for informal RSPs so that, in addition toproviding answers to the key questions of the regular questionnaire, thefollowing issues could be addressed:
• Identification of the most current instruments used in specific corridors • Identification of the population distribution for each type of instrument• Assessment of the volume of transactions for each type of operator• Understanding of the RSP business model• Assessment of the ability to convert some (or even all) of the operations
to the formal model and according to the new regulatory environment.
In addition to targeting the informal RSPs directly, the study contactedintermediaries, such as migrant representatives, entrepreneurs familiarwith the informal market, and researchers who understand the dynamicsof the informal RSPs. This effort was quite ambitious, but these objectiveshelped to structure the interviews.
firms specialized inmoney transfers, 3
private commercialbanks, 4
La Poste, 1mobile-phone and telecom
providers, 1
credit unions, 4
others, 5
Figure 10.A.2 Categories of Formal Sector RSPs Interviewed
Source: Author’s compilation.
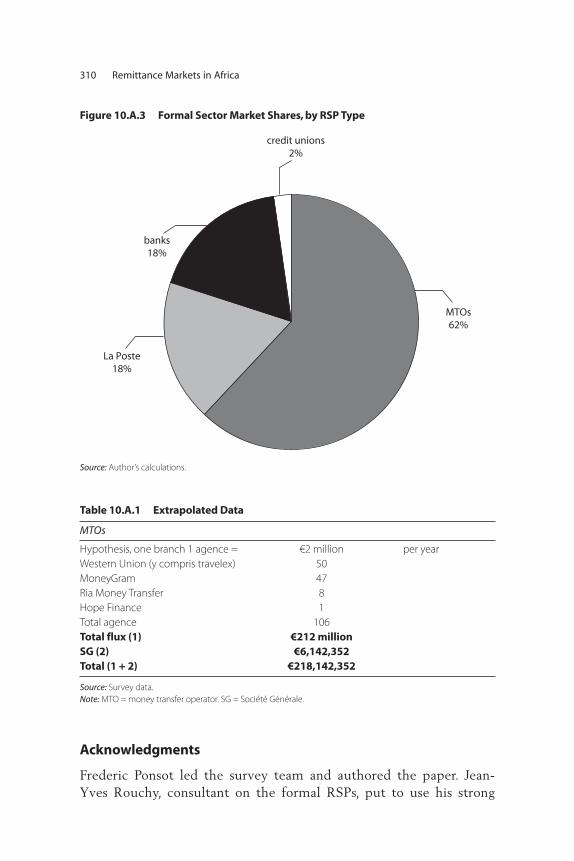
310 Remittance Markets in Africa
Acknowledgments
Frederic Ponsot led the survey team and authored the paper. Jean-Yves Rouchy, consultant on the formal RSPs, put to use his strong
Table 10.A.1 Extrapolated Data
MTOs
Hypothesis, one branch 1 agence = €2 million per yearWestern Union (y compris travelex) 50MoneyGram 47Ria Money Transfer 8Hope Finance 1Total agence 106Total flux (1) €212 millionSG (2) €6,142,352Total (1 + 2) €218,142,352
Source: Survey data. Note: MTO = money transfer operator. SG = Société Générale.
La Poste18%
banks18%
credit unions2%
MTOs62%
Figure 10.A.3 Formal Sector Market Shares, by RSP Type
Source: Author’s calculations.
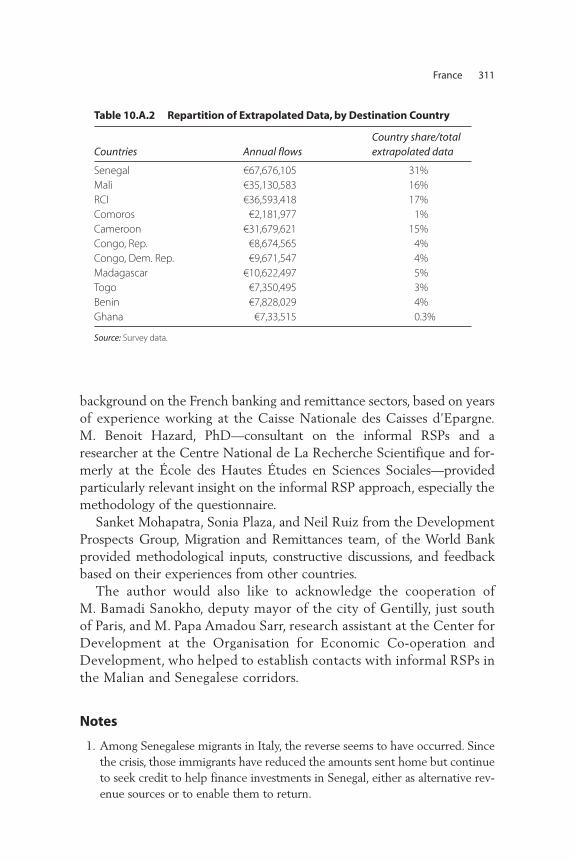
France 311
background on the French banking and remittance sectors, based on yearsof experience working at the Caisse Nationale des Caisses d’Epargne.M. Benoit Hazard, PhD—consultant on the informal RSPs and aresearcher at the Centre National de La Recherche Scientifique and for-merly at the École des Hautes Études en Sciences Sociales—providedparticularly relevant insight on the informal RSP approach, especially themethodology of the questionnaire.
Sanket Mohapatra, Sonia Plaza, and Neil Ruiz from the DevelopmentProspects Group, Migration and Remittances team, of the World Bankprovided methodological inputs, constructive discussions, and feedbackbased on their experiences from other countries.
The author would also like to acknowledge the cooperation of M. Bamadi Sanokho, deputy mayor of the city of Gentilly, just southof Paris, and M. Papa Amadou Sarr, research assistant at the Center forDevelopment at the Organisation for Economic Co-operation andDevelopment, who helped to establish contacts with informal RSPs inthe Malian and Senegalese corridors.
Notes
1. Among Senegalese migrants in Italy, the reverse seems to have occurred. Sincethe crisis, those immigrants have reduced the amounts sent home but continueto seek credit to help finance investments in Senegal, either as alternative rev-enue sources or to enable them to return.
Table 10.A.2 Repartition of Extrapolated Data, by Destination Country
Countries Annual flowsCountry share/total extrapolated data
Senegal €67,676,105 31%Mali €35,130,583 16%RCI €36,593,418 17%Comoros €2,181,977 1%Cameroon €31,679,621 15%Congo, Rep. €8,674,565 4%Congo, Dem. Rep. €9,671,547 4%Madagascar €10,622,497 5%Togo €7,350,495 3%Benin €7,828,029 4%Ghana €7,33,515 0.3%
Source: Survey data.
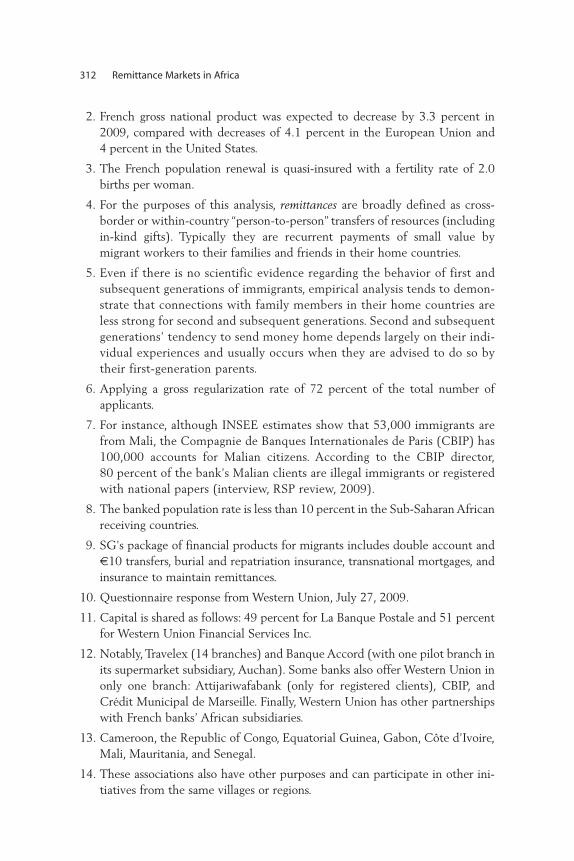
312 Remittance Markets in Africa
2. French gross national product was expected to decrease by 3.3 percent in2009, compared with decreases of 4.1 percent in the European Union and4 percent in the United States.
3. The French population renewal is quasi-insured with a fertility rate of 2.0births per woman.
4. For the purposes of this analysis, remittances are broadly defined as cross-border or within-country “person-to-person” transfers of resources (includingin-kind gifts). Typically they are recurrent payments of small value bymigrant workers to their families and friends in their home countries.
5. Even if there is no scientific evidence regarding the behavior of first andsubsequent generations of immigrants, empirical analysis tends to demon-strate that connections with family members in their home countries areless strong for second and subsequent generations. Second and subsequentgenerations’ tendency to send money home depends largely on their indi-vidual experiences and usually occurs when they are advised to do so bytheir first-generation parents.
6. Applying a gross regularization rate of 72 percent of the total number ofapplicants.
7. For instance, although INSEE estimates show that 53,000 immigrants arefrom Mali, the Compagnie de Banques Internationales de Paris (CBIP) has100,000 accounts for Malian citizens. According to the CBIP director, 80 percent of the bank’s Malian clients are illegal immigrants or registeredwith national papers (interview, RSP review, 2009).
8. The banked population rate is less than 10 percent in the Sub-Saharan Africanreceiving countries.
9. SG’s package of financial products for migrants includes double account and€10 transfers, burial and repatriation insurance, transnational mortgages, andinsurance to maintain remittances.
10. Questionnaire response from Western Union, July 27, 2009.
11. Capital is shared as follows: 49 percent for La Banque Postale and 51 percentfor Western Union Financial Services Inc.
12. Notably, Travelex (14 branches) and Banque Accord (with one pilot branch inits supermarket subsidiary, Auchan). Some banks also offer Western Union inonly one branch: Attijariwafabank (only for registered clients), CBIP, andCrédit Municipal de Marseille. Finally, Western Union has other partnershipswith French banks’ African subsidiaries.
13. Cameroon, the Republic of Congo, Equatorial Guinea, Gabon, Côte d’Ivoire,Mali, Mauritania, and Senegal.
14. These associations also have other purposes and can participate in other ini-tiatives from the same villages or regions.
France 313
15. Other benefits, if any, can be allocated to collective initiatives such as invest-ment in the shop.
16. By 3 percent, in the case of an informal RSP in Mauritania.
17. In Malian associations, for example, the suitcase carrier can be paid from thegains when he sells euros to wholesalers against the CFA francs in Bamako orKayes. Indeed, banknotes of €200 and more are overvalued by wholesalers.These gains can represent 1 percent of the amount changed.
18. The riskiest operation of the informal remittances chain is the transportationof cash from the home-country airport to the final destination.
19. To get a good picture of the market, one should perform a corridor-by-corridor analysis to account for individual peculiarities and specificitiesregarding the following characteristics: generations or cohorts by migra-tion waves or cycles; levels of education, financial infrastructure, and lit-eracy in the home country; sectors of employment and nature ofcontracts; and geographical areas of settlement or origin.
20. These data include Western Union transfers delivered through La BanquePostale branches plus its proprietary Mandat Express service. These remit-tance channels represent 45 percent of the estimated formal market.
21. Western Union interview, July 24, 2009.
22. See http://www.flouss.com.
23. TransCash cards are distributed by Raphael Bank and MFTEL in France, a lead-ing firm specializing in selling prepaid airtime in supermarkets. TransCash is anAmerican brand that has been particularly successful on the U.S.-Mexico corri-dor. MFTEL plans to sell 100, 000 packs in 2010. See http://www.trans-cash.fr.
24. See http://www.woo-group.com.
25. See http://www.maatcard.com.
26. See http://www.telemedia.fr. Telemedia is quoted on the market stockexchange.
27. Tagattatitude, created in 2005, is financed by Innovacom, a capital venture vehi-cle of France Telecom. Tagattitude won an Innovation Award in the “ConsumerApplication or Services” category at the World GSM de Barcelone in February2008. It has facilitated domestic and international transfers in more than25 countries, including South Africa (MobiCash) and Tunisia (CasyCash, whichallows withdrawals from cell phones at distributors). It is currently exploringtransfers to Pakistan (from the United Kingdom and the United States); toIndia, through a pilot with a small bank in Delhi; to Bangladesh; and toKazakhstan. See http://www.tagattitude.fr and http://www.tagpay.fr/.
28. Orange wants to launch such a pilot in Cameroon with SG, but the CEMACCentral Bank requires a specific license. SG also plans to launch a pilot withMTN in Côte d’Ivoire called Mobile Money.
29. See http://www.suncardfamily.com.
30. See http://www.hopefinance.org.
31. The Interbank Electronic Banking Group of the Economic and MonetaryUnion of West Africa is a regional platform promoted by the Central Bank ofthe States of West Africa (BCEAO) to support interoperability among banksin the West African Economic and Monetary Union (WAEMU) region usingEMV norms at lower costs.
32. SEPA is an integrated retail payment market created in 2009 to enable con-sumers using the euro “to allow cashless payments throughout the euro areafrom a single account under the same basic conditions, regardless of location”(ECB 2009). SEPA comprises (a) 32 member states from the EuropeanEconomic Area and the European Union (EU) in addition to Switzerland andMonaco and (b) several territories and jurisdictions considered to be part ofthe EU or that use the euro by agreement with the EU.
33. Article L. 311–3, Monetary and Financial Code.
34. The European directive (Directive 2007/64/CE) was introduced in theNational Regulatory Framework with the ordonnance n˚2009-866 du 15 juil-let 2009 relative aux conditions régissant la fourniture de services depaiement et portant création des établissements de paiement and the arrêtédu 29 octobre 2009 relatif à la réglementation prudentielle des établissementsde paiement («l’arrêté»), publié au JORF N˚0253 du 31/10/2009, disponiblessur le site http://www.legifrance.gouv. PEs will be supervised by the centralbank and agreed to by the Credit Institutions and Investment FirmsCommittee (Comité des Établissements de Crédit et des Entreprises d’in-vestissement, or CECEI) under the same prudential regulations that enforceAML-CFT procedures and other reporting requirements.
35. One interviewed RSP mentioned that it needs 450,000 transactions a year,with a fixed cost of €125,000 per branch, to break even.
36. For Caisse d’Epargne, international transfers are handled by GCE Payment,which is part of the Caisse d’Epargne Group. GCE Payment has agreed tomake some retreatments by country for the study on the major corridorscovered.
37. Western Union’s transfer prices are higher in Poste Finance branches. WesternUnion has also the lowest offer (48-hour delay if the transaction is done overthe Internet). Interestingly, commissions are lowest in the Moroccan andSenegalese corridors (December 2009), where competition is higher.
38. At Attijariwafa Bank in Morocco, loading the card costs €2.00, withdrawalscost €0.60, and annual fees are €4.00. Float is a significant source of revenue(interview with Attijariwafa Bank, June 30, 2009).
39. The average transfer amount for the only MTO that volunteered this infor-mation is €280. It is €180 for reloading operations with Flouss.com. The
314 Remittance Markets in Africa
AfDB study and other studies mention an average transfer of around €150per transaction (among all instruments).
40. This channel is preferred for savings and for collective transfers, notablywholesalers’ payments for food purchases (interviews with CBIP and itspartners).
41. For informal RSPs covering the Mauritanian corridor, exchange fees arearound 3 percent.
42. Cases of fraud have been associated with false driver’s licenses in Côted’Ivoire.
43. The COMOFI (Code Monétaire et Financier) does not require an officialpaper delivered by an administrative official (but an official paper with apicture from the French administration or another official administra-tion). Because many illegal migrants use papers of others or false papers,banks do not consider foreign papers as reliable enough to identify theclient.
44. The person must be introduced by a client well-known to the informal RSP,and the funds must not exceed the imposed limit.
References
AfDB (African Development Bank). 2007. “Annual Report.” AfDB, Tunis.
ECB (European Central Bank). 2009. “The Single Euro Payments Area (SEPA): AnIntegrated Retail Payment Market.” Brochure, ECB, Main, Germany. http://www.ecb.int/pub/pdf/other/sepa_brochure_2009en.pdf.
Freund, Caroline, and Nikola Spatafora. 2008. “Remittances, Transaction Costs,and Informality.” Journal of Development Economics 86: 356–66.
GCE (Caisse d’Epargne Group). 2008. “Annual Report,” GCE, Paris.
IMF (International Monetary Fund). 2008. Balance of Payments Statistics Yearbook.Washington, DC: IMF.
INSEE (French National Institute for Statistics and Economic Studies). 2005.“Census and Annual Survey.” INSEE, Paris.
Ketkar, Suhas, and Dilip K. Ratha, eds. 2008. Innovative Financing for Development.Washington, DC: World Bank.
La Banque Postale. 2008. “Annual Report.” La Banque Postale, Paris.
Milhaud, Charles. 2006. L’intégration économique des migrants et la valorisation deleur épargne.
Official Gazette No. 162 of 2009, Text 12, “Report to the President of theRepublic on Ordinance No. 2009–866 on the Conditions Governing theProvision of Payment Services.”
France 315
Ponsot, Frederic. 2007. Le rôle des institutions de microfinance dans l’offre de pro-duits financiers spécifiques aux migrants dans leurs pays d’origine. PRIME,Epargne sans frontière.
Ratha, Dilip. 2003. “Workers’ Remittances: An Important and Stable Source ofExternal Development Finance.” In Global Development Finance. Washington,DC: World Bank.
Rouchy, Jean-Yves, and Jean-Yves Gourvez. 2006. “Étude sur la valorisation del’épargne des migrants maliens en France.”
World Bank. 2011. Migration and Remittances Factbook 2011. Washington, DC:World Bank.
316 Remittance Markets in Africa
317
This chapter provides an overview of the U.K. market for sending remit-tances to Sub-Saharan Africa—part of a wider study of migration andremittances by the African Development Bank and the World Bank. Thefindings here are based on a survey of U.K. remittance service providers(RSPs) that serve the Sub-Saharan African market conducted in mid-2008.1 The chapter provides insight into the marketplace from an opera-tor’s viewpoint and outlines remittance market characteristics such ascompetitive factors, barriers to entry, regulatory constraints, and pricingapproaches. Although other market surveys from the consumer view-point and studies of pricing to specific markets such as Nigeria have beenconducted earlier (DMA 2007), this is the first systematic survey ofproviders in the U.K. market that transmit remittances to a wide range ofcountries in Africa.
Migration and Remittance Trends
The primary driver of remittances is migration. The United Kingdom hasbeen a major destination for migrants for centuries, and traditionally mostmigrants to the United Kingdom have originated from countries that werepart of the British Empire and are now mostly part of the Commonwealthof Nations. However, this trend has changed in recent years.
C H A P T E R 1 1
United Kingdom
Leon Isaacs
Sources of MigrantsThe current stock of migrants in the United Kingdom is 7 million people,whose main countries of birth (from largest to smallest number of immi-grants) are India, Poland, Pakistan, Ireland, Germany, South Africa,Bangladesh, the United States, Jamaica, and Kenya (World Bank 2011).
In recent years, the composition of immigrants in the United Kingdomhas shifted toward Eastern and Central Europe. Since the last census in2001, the European Union (EU) was enlarged to include countries fromCentral and Eastern Europe. The United Kingdom was among the few EUcountries that did not place barriers to stop migrants from the enlargedEurope from entering and working. As a result, an estimated 1 million ormore people from Poland alone moved to the United Kingdom in thepast four years, accompanied by large influxes from the Czech Republic,Estonia, Lithuania, and the Slovak Republic. In 2007, the EU was furtherenlarged with the accession of Bulgaria and Romania. This time, however,the U.K. government made it more difficult for people to move to theUnited Kingdom, resulting in fewer new arrivals than from the previousaccession countries. The growth from Central and Eastern Europe hasbeen accompanied, coincidentally, by a reduction in the number of asy-lum seekers—in particular, from Africa. As the U.K. migrant profilechanges, so also do the remittance destinations.
Initial anecdotal evidence shows that, as a result of the 2008–09financial crisis, many migrants returned to Eastern Europe, while peoplefrom Africa have tended to remain in the United Kingdom. Box 11.1tells the story of one formal remittance service provider (RSP) thatserves several major African remittance corridors in the wake of the eco-nomic downturn.
The 2001 census identified 850,000 migrants from Africa living inthe United Kingdom. Anecdotal evidence suggests that immigrationfrom most of Sub-Saharan Africa has grown since then. The largestcommunities currently are from Ghana, Kenya, Nigeria, Somalia, SouthAfrica, Uganda, and Zimbabwe. Significant migrant communities alsohave come from the Democratic Republic of Congo, Sierra Leone, andTanzania. Data have not been gathered about how much money thesegroups remit from the United Kingdom to their home countries, butdiscussions with these African communities confirm that the immi-grants consider the sending of remittances to be an important feature oftheir life in the United Kingdom.
Although the number of officially recorded new migration from Africahas declined in recent years, there is significant evidence of continuedgrowth from African countries, such as from Somalia and Zimbabwe. In
318 Remittance Markets in Africa
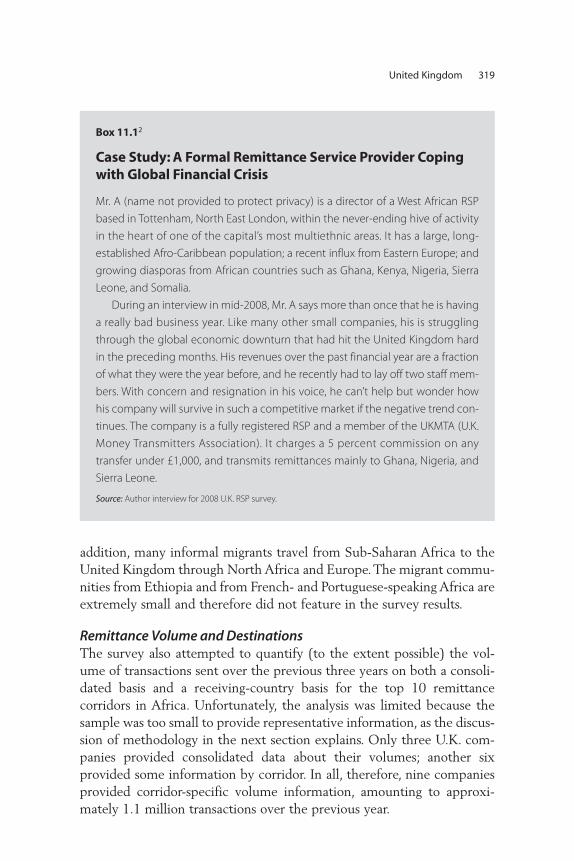
addition, many informal migrants travel from Sub-Saharan Africa to theUnited Kingdom through North Africa and Europe. The migrant commu-nities from Ethiopia and from French- and Portuguese-speaking Africa areextremely small and therefore did not feature in the survey results.
Remittance Volume and DestinationsThe survey also attempted to quantify (to the extent possible) the vol-ume of transactions sent over the previous three years on both a consoli-dated basis and a receiving-country basis for the top 10 remittancecorridors in Africa. Unfortunately, the analysis was limited because thesample was too small to provide representative information, as the discus-sion of methodology in the next section explains. Only three U.K. com-panies provided consolidated data about their volumes; another sixprovided some information by corridor. In all, therefore, nine companiesprovided corridor-specific volume information, amounting to approxi-mately 1.1 million transactions over the previous year.
United Kingdom 319
Box 11.12
Case Study: A Formal Remittance Service Provider Copingwith Global Financial Crisis
Mr. A (name not provided to protect privacy) is a director of a West African RSP
based in Tottenham, North East London, within the never-ending hive of activity
in the heart of one of the capital’s most multiethnic areas. It has a large, long-
established Afro-Caribbean population; a recent influx from Eastern Europe; and
growing diasporas from African countries such as Ghana, Kenya, Nigeria, Sierra
Leone, and Somalia.
During an interview in mid-2008, Mr. A says more than once that he is having
a really bad business year. Like many other small companies, his is struggling
through the global economic downturn that had hit the United Kingdom hard
in the preceding months. His revenues over the past financial year are a fraction
of what they were the year before, and he recently had to lay off two staff mem-
bers. With concern and resignation in his voice, he can’t help but wonder how
his company will survive in such a competitive market if the negative trend con-
tinues. The company is a fully registered RSP and a member of the UKMTA (U.K.
Money Transmitters Association). It charges a 5 percent commission on any
transfer under £1,000, and transmits remittances mainly to Ghana, Nigeria, and
Sierra Leone.
Source: Author interview for 2008 U.K. RSP survey.
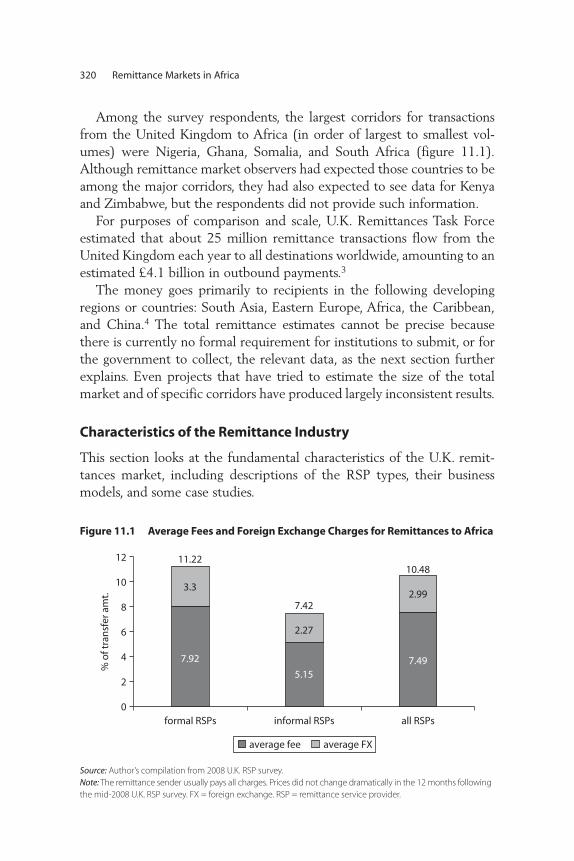
Among the survey respondents, the largest corridors for transactionsfrom the United Kingdom to Africa (in order of largest to smallest vol-umes) were Nigeria, Ghana, Somalia, and South Africa (figure 11.1).Although remittance market observers had expected those countries to beamong the major corridors, they had also expected to see data for Kenyaand Zimbabwe, but the respondents did not provide such information.
For purposes of comparison and scale, U.K. Remittances Task Forceestimated that about 25 million remittance transactions flow from theUnited Kingdom each year to all destinations worldwide, amounting to anestimated £4.1 billion in outbound payments.3
The money goes primarily to recipients in the following developingregions or countries: South Asia, Eastern Europe, Africa, the Caribbean,and China.4 The total remittance estimates cannot be precise becausethere is currently no formal requirement for institutions to submit, or forthe government to collect, the relevant data, as the next section furtherexplains. Even projects that have tried to estimate the size of the totalmarket and of specific corridors have produced largely inconsistent results.
Characteristics of the Remittance Industry
This section looks at the fundamental characteristics of the U.K. remit-tances market, including descriptions of the RSP types, their businessmodels, and some case studies.
320 Remittance Markets in Africa
formal RSPs
% o
f tra
nsf
er a
mt.
11.22
3.3
7.92 7.49
2.27
2.99
12
10
8
6
4
2
0
5.15
10.48
7.42
informal RSPs all RSPs
average fee average FX
Figure 11.1 Average Fees and Foreign Exchange Charges for Remittances to Africa
Source: Author’s compilation from 2008 U.K. RSP survey. Note: The remittance sender usually pays all charges. Prices did not change dramatically in the 12 months followingthe mid-2008 U.K. RSP survey. FX = foreign exchange. RSP = remittance service provider.
MethodologyFor the RSP survey, remittances were defined broadly as cross-border,“person-to-person” transfers of resources (including in-kind gifts)—typically small, recurrent payments by migrant workers to familiesand friends in their home countries. An informal RSP was defined asa provider unregistered with either the Financial Services Authority(FSA) or Her Majesty’s Revenue and Customs (HMRC), the twoU.K. bodies that regulate RSP firms.
The primary data were gathered in June and July 2008, and thischapter broadly reflects that data set. However, significant changes thathave occurred since the survey have been noted to the extent that theyaffect the recommendations (for instance, regarding new regulations orprice changes).
Although the survey was broadly qualitative, the chapter includes gen-eral attempts to provide a quantitative assessment based on the researchdata. These quantifications should be treated as indicative and not statis-tically significant.
Objectives. The survey aimed to meet the following objectives:
• Develop a catalog of companies that send money to Sub-Saharan Africa.• Obtain in-depth, high-quality feedback from a broad range of
providers, including both formal and informal money transfer opera-tors (MTOs).
• Develop a coherent market view of the regulatory, competitive, andoperational environment within the U.K. market.
• Provide recommendations to help policy makers improve the U.K. remit-tance market by reducing the costs of remittances to Africa and channel-ing more of these flows through formal rather than informal channels.
Methodological issues. An unfortunate by-product of an open market,in which RSPs are not required to report remittance transactions, is thatit is challenging to obtain data from individual firms. In the UnitedKingdom, all limited companies must submit accounts annually for pub-lic scrutiny. However, these accounts provide no detail about the volumeor value of remittance transactions, which are often consolidated withother products. Therefore the reports’ value is quite limited. Additionally,many of the formal businesses did not want to release information, evenwhen it was available, because they considered it to be commercially sen-sitive and saw limited value in providing it.
United Kingdom 321
Types and Coverage of Remittance FirmsGeographically, more than half of the U.K. remittance market5 is basedin London, where some two-thirds of the African immigrants in theUnited Kingdom live. The other main source cities of African remit-tances are Birmingham, Liverpool, and Leeds.
A “light touch”6 regulatory regime makes it is relatively easy for abusiness to legally provide money transfer services, so a broad range ofbusiness types send money to Africa:
• Money transfer operators. MTOs such as Western Union and Money-Gram provide remittance services through their own locations, net-works of agents, and other methods, including Internet-basedremittances.
• Banks. Banks can offer a broad range of financial services but providemoney transfer services only to their account holders.
• Nonbank financial institutions. At these outlets, such as currencyexchanges, a consumer can transfer money either through its ownmoney transfer service or as an agent for an RSP.7
• Informal operators. Individuals or businesses such as transportationcompanies are not regulated or registered with the authorities butprovide a variety of remittance services.
MTOs dominate the market for remittances, which, more often thannot, constitute their main business. For example, Western Union is likelyto be the single most dominant player for remittances from the UnitedKingdom to Sub-Saharan Africa based on the prominence of the brandand previous private sector research that showed high awareness for thatcompany (DFID 2005).
Some companies, particularly in the informal sector, offer money trans-fer services on their business premises, which are often small retail estab-lishments, convenience stores, Internet cafés, or freight forwardingcompanies (as described in box 11.2). The informal operators do notadvertise their services through traditional media but instead rely onword-of-mouth referrals in their communities.
Just over half of the U.K. RSPs both send money and receive money.A much smaller number handle domestic remittances. Foreign exchangeand settlement are handled predominantly by the banks. Few MTOs offersuch services, suggesting that RSP roles are relatively clearly defined fortransactions to Africa from the United Kingdom.
322 Remittance Markets in Africa
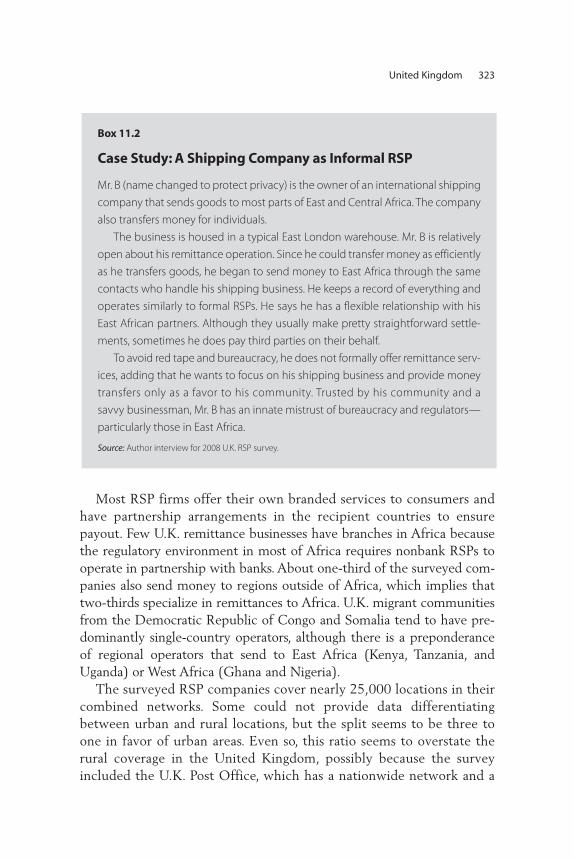
Most RSP firms offer their own branded services to consumers andhave partnership arrangements in the recipient countries to ensurepayout. Few U.K. remittance businesses have branches in Africa becausethe regulatory environment in most of Africa requires nonbank RSPs tooperate in partnership with banks. About one-third of the surveyed com-panies also send money to regions outside of Africa, which implies thattwo-thirds specialize in remittances to Africa. U.K. migrant communitiesfrom the Democratic Republic of Congo and Somalia tend to have pre-dominantly single-country operators, although there is a preponderanceof regional operators that send to East Africa (Kenya, Tanzania, andUganda) or West Africa (Ghana and Nigeria).
The surveyed RSP companies cover nearly 25,000 locations in theircombined networks. Some could not provide data differentiatingbetween urban and rural locations, but the split seems to be three toone in favor of urban areas. Even so, this ratio seems to overstate therural coverage in the United Kingdom, possibly because the surveyincluded the U.K. Post Office, which has a nationwide network and a
United Kingdom 323
Box 11.2
Case Study: A Shipping Company as Informal RSP
Mr. B (name changed to protect privacy) is the owner of an international shipping
company that sends goods to most parts of East and Central Africa. The company
also transfers money for individuals.
The business is housed in a typical East London warehouse. Mr. B is relatively
open about his remittance operation. Since he could transfer money as efficiently
as he transfers goods, he began to send money to East Africa through the same
contacts who handle his shipping business. He keeps a record of everything and
operates similarly to formal RSPs. He says he has a flexible relationship with his
East African partners. Although they usually make pretty straightforward settle-
ments, sometimes he does pay third parties on their behalf.
To avoid red tape and bureaucracy, he does not formally offer remittance serv-
ices, adding that he wants to focus on his shipping business and provide money
transfers only as a favor to his community. Trusted by his community and a
savvy businessman, Mr. B has an innate mistrust of bureaucracy and regulators—
particularly those in East Africa.
Source: Author interview for 2008 U.K. RSP survey.
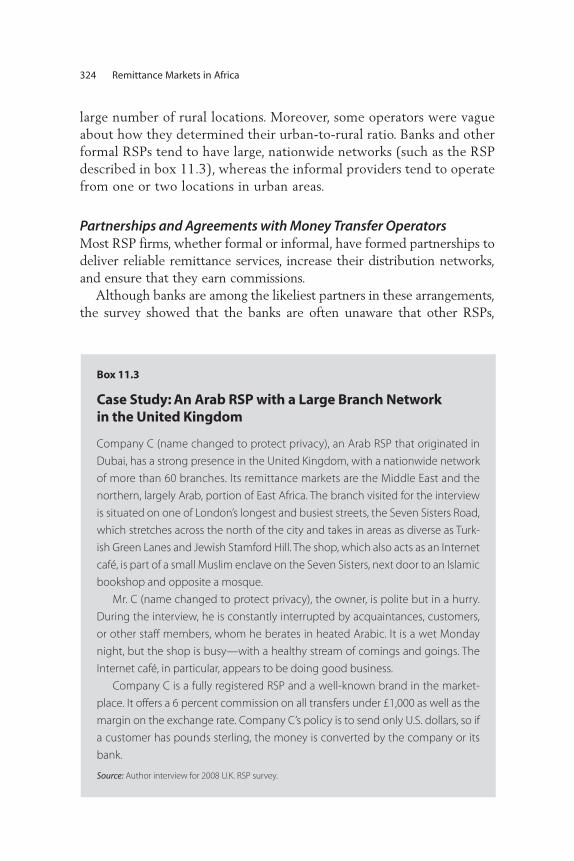
large number of rural locations. Moreover, some operators were vagueabout how they determined their urban-to-rural ratio. Banks and otherformal RSPs tend to have large, nationwide networks (such as the RSPdescribed in box 11.3), whereas the informal providers tend to operatefrom one or two locations in urban areas.
Partnerships and Agreements with Money Transfer OperatorsMost RSP firms, whether formal or informal, have formed partnerships todeliver reliable remittance services, increase their distribution networks,and ensure that they earn commissions.
Although banks are among the likeliest partners in these arrangements,the survey showed that the banks are often unaware that other RSPs,
324 Remittance Markets in Africa
Box 11.3
Case Study: An Arab RSP with a Large Branch Network in the United Kingdom
Company C (name changed to protect privacy), an Arab RSP that originated in
Dubai, has a strong presence in the United Kingdom, with a nationwide network
of more than 60 branches. Its remittance markets are the Middle East and the
northern, largely Arab, portion of East Africa. The branch visited for the interview
is situated on one of London’s longest and busiest streets, the Seven Sisters Road,
which stretches across the north of the city and takes in areas as diverse as Turk-
ish Green Lanes and Jewish Stamford Hill. The shop, which also acts as an Internet
café, is part of a small Muslim enclave on the Seven Sisters, next door to an Islamic
bookshop and opposite a mosque.
Mr. C (name changed to protect privacy), the owner, is polite but in a hurry.
During the interview, he is constantly interrupted by acquaintances, customers,
or other staff members, whom he berates in heated Arabic. It is a wet Monday
night, but the shop is busy—with a healthy stream of comings and goings. The
Internet café, in particular, appears to be doing good business.
Company C is a fully registered RSP and a well-known brand in the market-
place. It offers a 6 percent commission on all transfers under £1,000 as well as the
margin on the exchange rate. Company C’s policy is to send only U.S. dollars, so if
a customer has pounds sterling, the money is converted by the company or its
bank.
Source: Author interview for 2008 U.K. RSP survey.
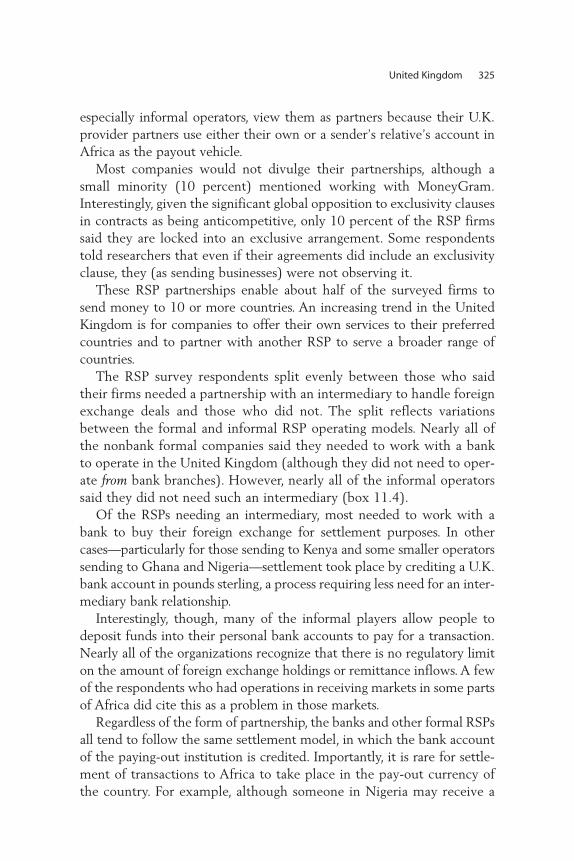
especially informal operators, view them as partners because their U.K.provider partners use either their own or a sender’s relative’s account inAfrica as the payout vehicle.
Most companies would not divulge their partnerships, although asmall minority (10 percent) mentioned working with MoneyGram.Interestingly, given the significant global opposition to exclusivity clausesin contracts as being anticompetitive, only 10 percent of the RSP firmssaid they are locked into an exclusive arrangement. Some respondentstold researchers that even if their agreements did include an exclusivityclause, they (as sending businesses) were not observing it.
These RSP partnerships enable about half of the surveyed firms tosend money to 10 or more countries. An increasing trend in the UnitedKingdom is for companies to offer their own services to their preferredcountries and to partner with another RSP to serve a broader range ofcountries.
The RSP survey respondents split evenly between those who saidtheir firms needed a partnership with an intermediary to handle foreignexchange deals and those who did not. The split reflects variationsbetween the formal and informal RSP operating models. Nearly all ofthe nonbank formal companies said they needed to work with a bankto operate in the United Kingdom (although they did not need to oper-ate from bank branches). However, nearly all of the informal operatorssaid they did not need such an intermediary (box 11.4).
Of the RSPs needing an intermediary, most needed to work with abank to buy their foreign exchange for settlement purposes. In othercases—particularly for those sending to Kenya and some smaller operatorssending to Ghana and Nigeria—settlement took place by crediting a U.K.bank account in pounds sterling, a process requiring less need for an inter-mediary bank relationship.
Interestingly, though, many of the informal players allow people todeposit funds into their personal bank accounts to pay for a transaction.Nearly all of the organizations recognize that there is no regulatory limiton the amount of foreign exchange holdings or remittance inflows. A fewof the respondents who had operations in receiving markets in some partsof Africa did cite this as a problem in those markets.
Regardless of the form of partnership, the banks and other formal RSPsall tend to follow the same settlement model, in which the bank accountof the paying-out institution is credited. Importantly, it is rare for settle-ment of transactions to Africa to take place in the pay-out currency ofthe country. For example, although someone in Nigeria may receive a
United Kingdom 325
remittance in Nigerian naira, the RSP’s business partner would havereceived the payment in U.S. dollars or pounds sterling. Settlementalmost always occurs in deposits of either pounds sterling or U.S. dollarsto an offshore account. Thus, for many African businesses, the attractionof paying out remittances is that they receive hard currency that they cansell to their own clients at a significant profit.
The timing of settlement varies between the same day and sevendays—and is usually between one and two days. Some informal opera-tors use the same settlement method as the formal sector. However, oth-ers use a “netting” method whereby the money that would have goneto the paying-out entity in the receiving country is instead paid to a thirdparty to settle an outstanding invoice. For example, a Ghanian shoeimporter who also serves as a money transfer agent may ask the RSP inthe sending country to send the funds to an Italian exporter to pay for aprevious shoe shipment.
One or two informal RSPs in the U.K. survey said they paid when theircounterparty asked them to do so but that settlement was spasmodic.
326 Remittance Markets in Africa
Box 11.4
Case Study: A Competitive Small Formal RSP
Company D (name changed to protect privacy) is a registered money service
business in Finsbury Park, north London—a bustling, ethnically diverse area
where one is never far from an MTO. There are numerous agents for Western
Union, MoneyGram, and Ria Envia as well as smaller, independent operators
such as Company D that survive by knowing their market (and their customers)
and by providing competitive rates. The company’s premises comprise two
small offices above a fast-food shop (also an independent retailer). Its Nigerian
owner, Mr. D (name changed to protect privacy), is a forthright but soft-spoken
man whose telephone never stops ringing while he works under a mountain of
paperwork.
The walls of Mr. D’s office are adorned with religious iconography, advertise-
ments for his travel company, and posters for Chequepoint and Ria Envia, for
which he acts as an agent for certain remittance corridors. Company D’s primary
market is the U.K.-to-Nigeria corridor, where it costs £5 plus the exchange-rate
margin (about 2 percent) to send £100 to a Nigerian bank account. Although the
office’s atmosphere is informal, even chaotic, its remittance service is efficient.
Source: Author interview for 2008 U.K. RSP survey.
One said that it even paid in advance to help the paying-out agent withcash flow.
Remittance InstrumentsRemittances are currently sent in a variety of forms: cash to cash, accountto account, cash to card, card to card, cash to mobile phone, mobilephone to mobile phone, cash sent through the post, and cash carried by afriend or relative.
As with the market size estimation, no official data are available aboutthe amounts of money sent through each method. Indeed, at least two ofthe methods would be termed informal and thus are particularly chal-lenging to measure. However, market experience and feedback from thesurveyed RSPs leads to the conclusion that most remittances are sent cashto cash. Cash sent through friends and other informal methods make upmost of the remainder. The cash-to-account method would be the fourthmost-used means of transfer, although it accounts only for an estimated5 percent or less of the total.
The landscape is changing, however. Interest in remittances hasincreased as awareness has grown about the global size of the market—estimated at $325 billion sent to developing countries in 2010 (WorldBank 2011). This growth, combined with the increased use of new tech-nologies in the financial services arena, means that new approaches toremittance transmissions are being applied.
Not all providers offer a broad range of remittance products to theconsumer. Unsurprisingly, the banks offer the widest range of transferproducts, including account to account, prepaid debit cards, and bankdrafts. The rest of the providers that send remittances to Africa focus onelectronic cash transfers, with cash both paid and received in the benefi-ciary’s country.
A reasonable number of nonbank financial institutions offer credit-to-account transfers, although the informal operators generally stick to cash-to-cash payments. Africa has a low bank-account penetration, so mosttransactions are collected in cash (except for those sent to South Africa,where bank-account penetration is significantly higher). Most banks offermoney transfer services only to their own account holders, making it dif-ficult for consumers to shop around for the best deal when looking tocredit a bank account.
Some RSPs now offer services through the Internet whereby cus-tomers either pay by card or deposit the money directly in the RSP’sbank account. Companies such as uTransfer, Global Link, Double
United Kingdom 327
Crown, and Western Union all offer online services. The model is effec-tive and becoming increasingly attractive to consumers, although thereceiving markets still use traditional payout methods. Interestingly,except for the banks, few of these Internet providers offer any otherfinancial services.
Around one-third of the survey respondents said their firms allowremittance transmissions for specific purposes, mostly for land andhousing payments. One interesting phenomenon was seen in theZimbabwe corridor. Given the massive political and economic problemspresent in that market, many firms stopped sending money. With infla-tion running at over 10 million percent, the value of funds oftendecreased dramatically between the time of sending and the time ofcollection. As a result, companies such as Mukuru and Premier 786arranged for people to collect food, fuel, and phone minutes as alterna-tives to cash. These organizations sourced the goods through contacts inSouth Africa and Zimbabwe and made them available to beneficiaries.The senders’ costs were relatively low, and the beneficiaries receivedtangible goods that were worth more than the cash they otherwisewould have received. Costs for cash collections were relatively high,with foreign exchange margins of around 10 percent. Since the U.S. dol-lar and South African rand were declared as legal tender in Zimbabwein mid-2009, it is likely that the share of cash transactions has increased,and the share sent as goods has become smaller. The extraordinarilyhigh foreign exchange margins charged for conversion to local currencyare also have likely to have declined or disappeared altogether.
The use of new technologies for domestic payments has grown withinsome African countries, most notably in Kenya and South Africa. Surveysalso have found that new technology can financially enfranchise migrantsin the United Kingdom (DMA 2008). As consumer attitudes change andwillingness to adopt new technologies increases, opportunities havearisen to introduce new technological solutions in the U.K.-to-Africacorridors in markets where the appropriate conditions exist. Given thatautomated teller machine (ATM) and electronic point-of-sale systemsare limited in large parts of Africa, mobile-phone-based solutions will bemore likely to succeed. Currently, only one active scheme is in place forinternational payments from the United Kingdom to Africa: a pilotinvolving M-PESA8 in Kenya and some remittance-sending operators inselected parts of the United Kingdom. Any development in this areawould require an RSP firm to meet the appropriate regulatory approval,as the next section further describes.
328 Remittance Markets in Africa
The Regulatory and Business Environment
The United Kingdom is commonly considered the easiest Europeancountry in which to establish a remittance business because the U.K. reg-ulatory environment for money transfer providers is based on HerMajesty’s Treasury’s “light-touch” approach. At the time of the survey,two different regulators oversaw the market, depending on the type ofbusiness offering money transfer services.
Until 1997, remittance companies—whether individual, location-based operations or global RSPs—had to register with HMRC to becomea money service business (MSB). Thus, HMRC had been the main finan-cial authority for remittance providers (primarily MTOs). Since 1997,however, banks have been regulated by the FSA under a more onerousand a much-regimented process.
After the survey was conducted, the EU Payments Services Directive(PSD) came into force, as box 11.5 describes further. The PSD will affectregulation moving forward. The following sections summarize the RSPs’responses regarding regulatory, customer identification, and other report-ing requirements as well as the RSP business environment and remit-tance fee structures. These responses were obtained before theintroduction of the PSD—before many PSD-related details were knownor understood.
Registration and Licensing RequirementsU.K. regulatory bodies do not set many significant restrictions on remit-tance providers. Even so, the RSPs’ understanding of remittance marketregulations in general was not good. Although surveyed providers gener-ally knew that some regulatory requirements existed, their knowledgeabout specifics showed room for improvement.
Most, but not all, of the surveyed companies knew that some form ofregistration was required to operate a remittance business. Most of thecompanies that did not know of a registration requirement were from theformal sector, perhaps because they misunderstood the terms “centralbank” or “financial authority” as the questionnaire defined them. Thoserespondents that did know about the registration requirement also knewthe appropriate regulatory body. The vast majority of respondents are reg-istered with HMRC, as expected.
The RSP firms also generally lacked understanding about whetherthey were required to file currency reports with the regulators. In fact,there is no such requirement. Most of the confusion occurred in the
United Kingdom 329
330 Remittance Markets in Africa
Box 11.5
The EU Payment Services Directive
Since November 1, 2009, RSPs in the United Kingdom have been regulated and
approved by the FSA. Under the new EU Payments Services Directive, however,
a new category of institutions has been created, called payment institutions
(PIs). Among the PIs are two subcategories: authorized PIs and small PIs (also
known as registered PIs). The requirements to become an authorized PI are rela-
tively onerous, whereas is the process to become a small PI is relatively straight-
forward.
All organizations that transact more than €3 million per month must apply for
authorization. Those that transfer less have the option to apply for either full
authorization or small PI status. The transition period for businesses operating
before December 25, 2007, will end on April 30, 2011. An authorized PI can “pass-
port” its license to other European Economic Area (EEA) countries without obtain-
ing separate local licenses in those host countries.
The PSD brings much-needed transparency to the market, albeit only for
transactions from one EU country to another. In addition, remittance transactions
will come under the U.K. Financial Ombudsman Service for the first time, mean-
ing that a consumer who cannot gain redress for a complaint from the service
provider can ask the financial ombudsman to investigate the case. If the case is
investigated, the ombudsman’s decision is binding. The PSD also gives consumers
an incentive to use authorized PIs, which will safeguard the clients’ money until
the receivers collect it. However, a small PI safeguards funds only if it opts to do
so—and it is generally assumed that most will not.
Since November 1, 2010—when the PSD came into force—more than 60
authorized PIs and more than 500 registered PIs (small PIs) have been approved
and placed on the register. The introduction has not been without its chal-
lenges, and there is a large backlog of applications, although the number of
applications is considerably less than the size of the market. The delay is driven
by the transition-period provision, which states that all organizations must be
either registered or authorized by April 2011, after which they will be operating
illegally if they have not been approved. A large increase in applications to the
FSA is expected by the end of 2010.
Throughout Europe, most countries have introduced their PSD regulations
and have taken a reasonably consistent approach. Only the United Kingdom has
introduced the two-tier registration status—of “authorized” and “registered” PIs. All
(continued)
informal sector. Nearly all the African providers knew they needed to filesuspicious transaction reports, but most were hazy about the amountthreshold. In fact, there is none; if a cashier is suspicious about a trans-action of any amount, a Suspicious Activity Report must be completed.
Most of the surveyed providers knew that there are currently nofinancial regulatory requirements for operating money transfer busi-nesses, although there are stringent requirements for banks. Even withthe introduction of the PSD, companies are still required to registerwith HMRC for anti-money-laundering (AML) compliance. MSBsmust pay a £120 licensing fee (per outlet that operates the service,whether owned by the MSB or operating as an agent). Many of the for-mal operators knew this (and formal operators across a range of corri-dors as diverse as Kenya, Nigeria, Somalia, and South Africa all notetheir MSB licenses on their websites), but most of the informal opera-tors were unaware of both the requirement and the cost. They knewthere were some regulatory restrictions but had made no effort to findout what they were. By contrast, nearly every company knew there isno requirement to charge a value added tax on remittances becausethey are zero-rated products.
The regulatory landscape for new technologies may present somenew challenges as well. No additional barriers arise for RSPs that offermoney transfers by mobile phone if no value is stored on a device.However, when value is stored, an electronic money license (EML) isrequired. Obtaining a full license is a complicated process and requiresinitial capital of €1 million, although this figure will be lowered to€350,000 in 2011. The capital requirement clearly limits the numberof businesses that apply for an EML.
United Kingdom 331
other countries have only an authorized status, making it harder for many busi-
nesses to gain approval in those countries.
Operators in many countries are using the passporting element of service
(whereby an authorized PI can use the same authorization in any EEA member
country). Initial feedback is that this is operating as intended in the legislation, but
there are concerns that the full implications are not yet understood by the regu-
latory authorities in every country.
Source: Author.
Box 11.5 (continued)
Barriers to EntryMost of the RSP firms (especially banks and informal companies) feltthat, in general, the existing regulatory environment was not a barrier toentry. However, more than one-third of the nonbank formal operators,particularly those sending to West African countries such as Nigeria andSierra Leone, did consider the regulatory environment to be a major bar-rier. Much of their concern regarded interpretation of the AML regula-tions rather than the registration aspects.
AML compliance. In fact, all of the formal operators considered AMLcompliance to be the biggest regulatory barrier to remittance operations,particularly because of the number of new regulations and requirementsin this area. (Understandably, the informal operators did not consider it tobe a major barrier at all.) Compliance with the U.S. Office of ForeignAssets Control lists, EU lists, the (U.S.) Patriot Act, the AML Directive,and so on consumes extensive resources, causing many RSPs to view themany requirements as major barriers and as disproportionate to the per-ceived risks of the typical transaction.
Based on general feedback, established businesses view some form ofAML regulation as necessary but believe the industry is being made ascapegoat. Because most remittance transactions are of low value, theysaid, the procedures unduly restrict profitability. Furthermore, as a widevariety of bodies introduce more and more restrictions, it becomesextremely challenging to keep up with all the changes. This concern wasmentioned by all companies but particularly by those that send to Ghana,Kenya, and South Africa.
Cross-border registration. All surveyed RSP firms except banks alsowere concerned about registration in other markets, such as France andGermany, rather than being connected specifically to the UnitedKingdom. Most companies felt that access to distribution networks (par-ticularly in payout countries) and financial systems (for example, the U.K.clearing system) were big barriers to entry. This seemed to be applicableto all operators who send to a single corridor. Some single-corridor play-ers were also concerned that they could not expand their networks easilyin their recipient markets. Providers to Kenya, Nigeria, South Africa, andUganda mentioned this particularly. No organization mentioned contrac-tual exclusivity clauses as a barrier, however.
Capital and finance access. Access to capital and finance was a reason-ably strong concern for the informal companies but not considered an
332 Remittance Markets in Africa
issue by the formal RSPs. Note that this survey was completed before thecredit crunch began to affect businesses. However, most well-run RSPsgenerate a positive cash flow.
Most MSBs have come under intense scrutiny from their banks and citelack of access to the banking system as a major challenge. Furthermore,when they have explored the possibility of opening accounts at otherbanks, they found that most do not want to open accounts for MSBsbecause they are concerned about possible AML violations. This issue wasan emotive one for many MSBs, particularly those serving communitiesfrom conflict-ridden countries such as Somalia and Zimbabwe.9 Some ofthe formal operators said the lack of access to clearing and settlement sys-tems was a major concern, particularly in the paying-out countries, andthat this obstacle had stopped their expansion, as highlighted by compa-nies that sent money to South Africa in particular.
Competitive FactorsMost of the firms surveyed did not view informal RSPs as major competi-tors, although some providers to Cameroon, South Africa, and Zimbabwedid perceive a competitive threat. Most notably, the informal operatorsthemselves did not see other informal RSPs as competitive obstaclesbecause they felt securely positioned within their own communityniches and believed it would be hard for other operators to take theirmarkets away from them.
The MTOs interviewed were asked to rate, by provider type, whichRSPs they regarded as their primary competitors. Not surprisingly, themain ones listed were Western Union, MoneyGram, Chequepoint,10
and some corridor-specific players such as Dahabshiil and KaahExpress to Somalia. Some of the banks (particularly those from themigrants’ country of origin) and informal providers rounded out thelist of competitors. Although the United Kingdom has around 400credit unions, they generally have small memberships and many do notoffer remittances. Therefore, the MTOs did not consider them to be amajor competitive threat.
Remittance Fees, Customer Protection, and Identification RequirementsThis section discusses the fees and foreign exchange margins applied toremittances to Africa and compares those costs to those cited in previousstudies. It also discusses the ways that RSPs address customer grievancesand the customer identification requirements for compliance with AMLand other regulations.
United Kingdom 333
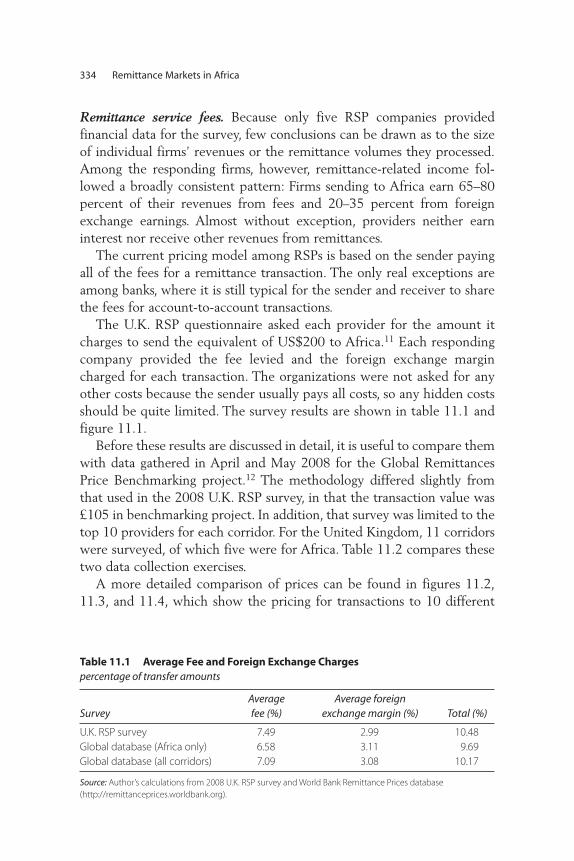
Remittance service fees. Because only five RSP companies providedfinancial data for the survey, few conclusions can be drawn as to the sizeof individual firms’ revenues or the remittance volumes they processed.Among the responding firms, however, remittance-related income fol-lowed a broadly consistent pattern: Firms sending to Africa earn 65–80percent of their revenues from fees and 20–35 percent from foreignexchange earnings. Almost without exception, providers neither earninterest nor receive other revenues from remittances.
The current pricing model among RSPs is based on the sender payingall of the fees for a remittance transaction. The only real exceptions areamong banks, where it is still typical for the sender and receiver to sharethe fees for account-to-account transactions.
The U.K. RSP questionnaire asked each provider for the amount itcharges to send the equivalent of US$200 to Africa.11 Each respondingcompany provided the fee levied and the foreign exchange margincharged for each transaction. The organizations were not asked for anyother costs because the sender usually pays all costs, so any hidden costsshould be quite limited. The survey results are shown in table 11.1 andfigure 11.1.
Before these results are discussed in detail, it is useful to compare themwith data gathered in April and May 2008 for the Global RemittancesPrice Benchmarking project.12 The methodology differed slightly fromthat used in the 2008 U.K. RSP survey, in that the transaction value was£105 in benchmarking project. In addition, that survey was limited to thetop 10 providers for each corridor. For the United Kingdom, 11 corridorswere surveyed, of which five were for Africa. Table 11.2 compares thesetwo data collection exercises.
A more detailed comparison of prices can be found in figures 11.2,11.3, and 11.4, which show the pricing for transactions to 10 different
334 Remittance Markets in Africa
Table 11.1 Average Fee and Foreign Exchange Charges percentage of transfer amounts
SurveyAverage fee (%)
Average foreign exchange margin (%) Total (%)
U.K. RSP survey 7.49 2.99 10.48 Global database (Africa only) 6.58 3.11 9.69Global database (all corridors) 7.09 3.08 10.17
Source: Author’s calculations from 2008 U.K. RSP survey and World Bank Remittance Prices database (http://remittanceprices.worldbank.org).
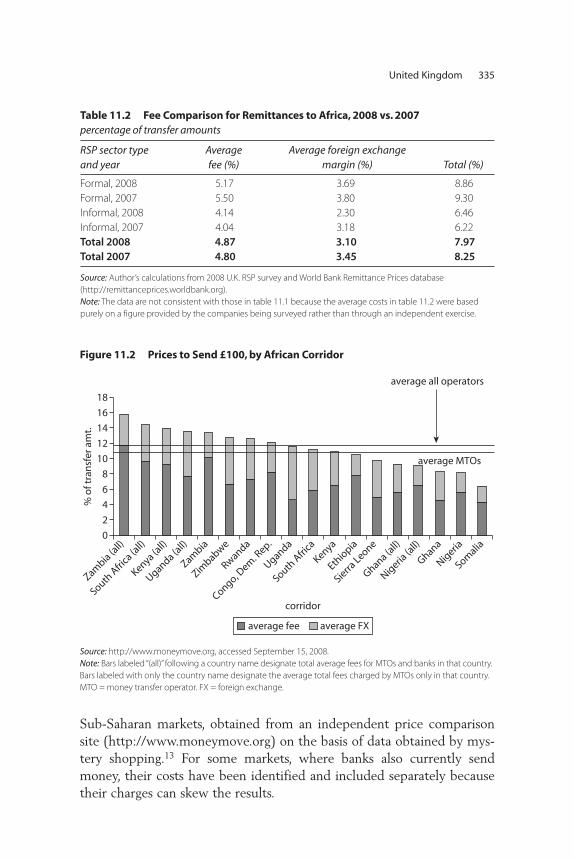
Sub-Saharan markets, obtained from an independent price comparisonsite (http://www.moneymove.org) on the basis of data obtained by mys-tery shopping.13 For some markets, where banks also currently sendmoney, their costs have been identified and included separately becausetheir charges can skew the results.
United Kingdom 335
Table 11.2 Fee Comparison for Remittances to Africa, 2008 vs. 2007 percentage of transfer amounts
RSP sector type and year
Average fee (%)
Average foreign exchange margin (%) Total (%)
Formal, 2008 5.17 3.69 8.86Formal, 2007 5.50 3.80 9.30Informal, 2008 4.14 2.30 6.46Informal, 2007 4.04 3.18 6.22Total 2008 4.87 3.10 7.97Total 2007 4.80 3.45 8.25
Source: Author’s calculations from 2008 U.K. RSP survey and World Bank Remittance Prices database (http://remittanceprices.worldbank.org). Note: The data are not consistent with those in table 11.1 because the average costs in table 11.2 were basedpurely on a figure provided by the companies being surveyed rather than through an independent exercise.
Figure 11.2 Prices to Send £100, by African Corridor
average all operators
average MTOs
average fee average FX
% o
f tra
nsf
er a
mt.
12
14
16
18
10
8
6
4
2
0
corridor
Zambia (a
ll)
Zambia
Zimbabwe
Rwanda
Uganda
Congo, Dem
. Rep.
South A
frica
(all)
South A
frica
Kenya (all)
Kenya
Ethio
pia
Sierra Leone
Ghana (all)
Ghana
Nigeria
(all)
Nigeria
Somalia
Uganda (all)
Source: http://www.moneymove.org, accessed September 15, 2008. Note: Bars labeled “(all)” following a country name designate total average fees for MTOs and banks in that country.Bars labeled with only the country name designate the average total fees charged by MTOs only in that country.MTO = money transfer operator. FX = foreign exchange.
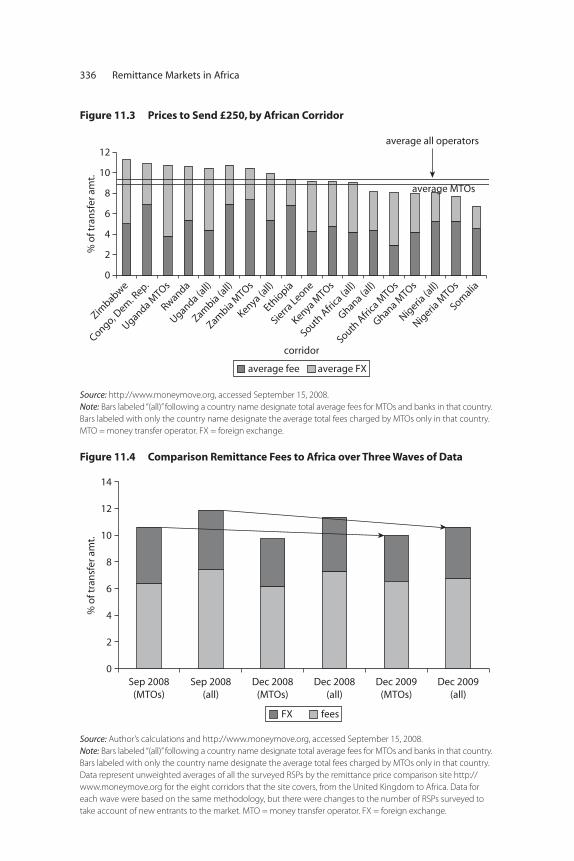
336 Remittance Markets in Africa
Figure 11.3 Prices to Send £250, by African Corridor
average fee average FX
% o
f tra
nsf
er a
mt.
12
10
8
6
4
2
0
average all operators
average MTOs
Zambia (a
ll)
Zambia M
TOs
Zimbabwe
Rwanda
Uganda MTOs
Congo, Dem
. Rep.
South A
frica
(all)
South A
frica
MTOs
Kenya (all)
Kenya MTOs
Ethio
pia
Sierra Leone
Ghana (all)
Ghana MTOs
Nigeria
(all)
Nigeria
MTOs
Somalia
Uganda (all)
corridor
Source: http://www.moneymove.org, accessed September 15, 2008. Note: Bars labeled “(all)” following a country name designate total average fees for MTOs and banks in that country.Bars labeled with only the country name designate the average total fees charged by MTOs only in that country.MTO = money transfer operator. FX = foreign exchange.
FX fees
% o
f tra
nsf
er a
mt.
12
14
10
8
6
4
2
0Sep 2008
(MTOs)Dec 2008
(MTOs)Dec 2009
(MTOs)Sep 2008
(all)Dec 2008
(all)Dec 2009
(all)
Figure 11.4 Comparison Remittance Fees to Africa over Three Waves of Data
Source: Author’s calculations and http://www.moneymove.org, accessed September 15, 2008. Note: Bars labeled “(all)” following a country name designate total average fees for MTOs and banks in that country.Bars labeled with only the country name designate the average total fees charged by MTOs only in that country.Data represent unweighted averages of all the surveyed RSPs by the remittance price comparison site http://www.moneymove.org for the eight corridors that the site covers, from the United Kingdom to Africa. Data foreach wave were based on the same methodology, but there were changes to the number of RSPs surveyed totake account of new entrants to the market. MTO = money transfer operator. FX = foreign exchange.
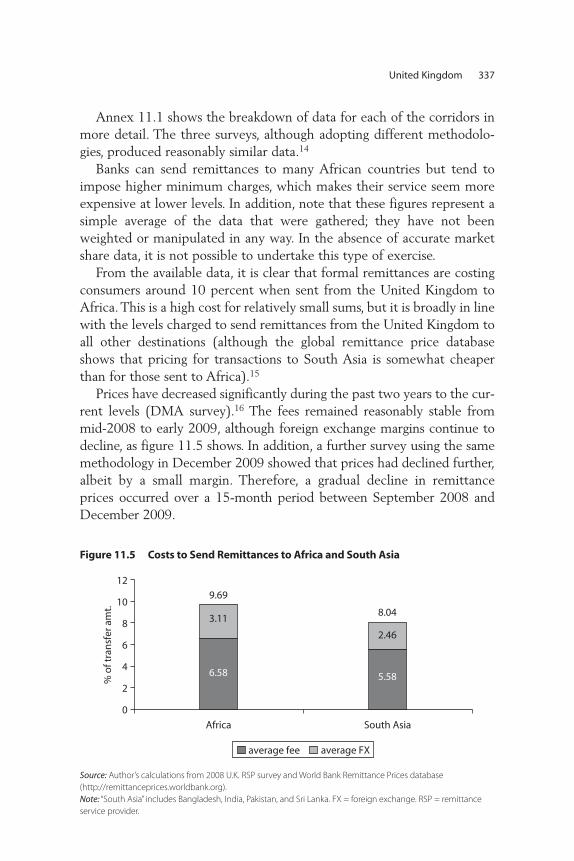
United Kingdom 337
Annex 11.1 shows the breakdown of data for each of the corridors inmore detail. The three surveys, although adopting different methodolo-gies, produced reasonably similar data.14
Banks can send remittances to many African countries but tend toimpose higher minimum charges, which makes their service seem moreexpensive at lower levels. In addition, note that these figures represent asimple average of the data that were gathered; they have not beenweighted or manipulated in any way. In the absence of accurate marketshare data, it is not possible to undertake this type of exercise.
From the available data, it is clear that formal remittances are costingconsumers around 10 percent when sent from the United Kingdom toAfrica. This is a high cost for relatively small sums, but it is broadly in linewith the levels charged to send remittances from the United Kingdom toall other destinations (although the global remittance price databaseshows that pricing for transactions to South Asia is somewhat cheaperthan for those sent to Africa).15
Prices have decreased significantly during the past two years to the cur-rent levels (DMA survey).16 The fees remained reasonably stable frommid-2008 to early 2009, although foreign exchange margins continue todecline, as figure 11.5 shows. In addition, a further survey using the samemethodology in December 2009 showed that prices had declined further,albeit by a small margin. Therefore, a gradual decline in remittanceprices occurred over a 15-month period between September 2008 andDecember 2009.
average fee average FX
% o
f tra
nsf
er a
mt.
12
10
8
6
4
2
6.58
9.69
8.04
5.58
2.46
3.11
0
Africa South Asia
Figure 11.5 Costs to Send Remittances to Africa and South Asia
Source: Author’s calculations from 2008 U.K. RSP survey and World Bank Remittance Prices database (http://remittanceprices.worldbank.org).Note: “South Asia” includes Bangladesh, India, Pakistan, and Sri Lanka. FX = foreign exchange. RSP = remittanceservice provider.
Some banks in the U.K. market offer fee-free remittance services toattract customers in the Indian and Polish communities. Interviews indi-cate that banks are also planning to do this for some African communi-ties, in particular for Ghanaians and Kenyans.
Informal operators are charging lower fees and foreign exchange mar-gins than formal operators do. On average, the difference is just under 4 percent, or around one-third of the total cost. This price differentialhelps to explain why informal operators can attract remittance volume.Annex 11.1 shows that, in general, banks charge more for lower-valueremittances. For example, it is not uncommon for banks to charge a flatfee of £20 for all transactions from £1 to £2,000. Thus banks are seen asless competitive at the average remittance transaction amounts.
Annex 11.1 also shows that, on a country-specific basis, the moreproviders a country has, the more competitive the pricing. Ghana andNigeria provide good examples of competitive pricing structures. In thosecorridors with fewer formal players, such as Rwanda and Zambia, thepricing is higher. Normal market forces are at work here, and because theRwandan and Zambian communities in the United Kingdom are muchsmaller than the Ghanian and Nigerian communities, this result is notunexpected. However, Zimbabwe also has a large population in theUnited Kingdom (estimated at over 1 million), and yet few formal com-panies are serving this market and the pricing is high, largely because ofthe extreme political and economic instability in Zimbabwe. Measures toimprove the situation must be taken in Zimbabwe before more formalcompanies will enter the market.
The 2008 U.K. survey also asked RSPs whether they had changed theirpricing over the previous 12 months. Half the companies responded, asshown previously in table 11.2, that there had been a small drop in over-all costs, driven largely by formal sector price cuts.
Customer service and grievance procedures. The significant majority ofsurveyed RSP firms said they had a system for handling complaints.Indeed, the sending agent is normally the point of contact for complaints,although a reasonable number encouraged the beneficiary to talk to thereceiving agent.
Many companies said they did not track the number of complaintsreceived; the few that did respond said the number of complaintsranged between 1 and 10 per month. Most complaints are resolved inless than a week. Just under half of the companies surveyed had dedi-cated full-time staff to address customer grievances. Many advised that
338 Remittance Markets in Africa
team members shared these duties, which form only a part of eachemployee’s workload. Reassuringly, the companies also responded thatfew transactions go missing at any stage.
Most of the businesses surveyed stated that they provide financial lit-eracy material to their customers. Upon closer inspection, however,these materials were normally described as leaflets, posters, orbrochures. Most of the items, where available, were marketing pieces oflimited educational value. African consumers would benefit fromgreater understanding about how financial products work and the costsassociated with them.
Identification requirements. Most of the businesses surveyed said theyrequired identification documents from their customers to be able totransfer money overseas. (Strictly speaking, this is not a necessity for aone-off transaction below €1,000 in value that does not arouse suspicion,so this response was interesting.)
All of the banks and nearly all of the formal operators responded thatthey require documentation. Surprisingly, one-third of the informal oper-ators said they required identification as well, perhaps because they oftenoperate in partnership with formal organizations in the payout market.This response does, however, question the assumption that the informalsector neither understands nor operates within the AML environment.One-third of the informal operators said they did not require documen-tation. These companies served a variety of corridors, including Nigeria,Somalia, and Zimbabwe.
When identification is required, the most commonly accepted formswere a passport, followed by a driver’s license, national ID, and proof ofresidency. The companies sending money to South Africa are more likelyto accept national ID cards than are operators sending to other countries.Operators did not distinguish between existing customers and new cus-tomers (not previously registered with the operator) in terms of the IDthat was required.
The United Kingdom does not have a national identity card system,so it is interesting to observe that there is a common approach to theaccepted type of ID. In some of the migrant communities—amongSomalians, for example—the availability of ID is variable. Althoughthe Somalia-based businesses use the same process as other U.K. oper-ators to identify their customers in the United Kingdom, theirapproach in Somalia is more localized. There, when individuals lackformal identification, they use community contacts and the clan-based
United Kingdom 339
system: A respected clan elder accompanies the receiver on his or herfirst visit to collect the money, formally identifies the individual, andvouches for him or her—a serious commitment in Somali society.
Conclusions and Recommendations
This section outlines some recommendations that, if implemented, wouldimprove the remittance market from the United Kingdom to Sub-Saharan Africa for operators and consumers.
Africa-Specific Recommendations• Regulators in African countries should recognize the benefit of intro-
ducing regulations that encourage competition. To this end, theyshould consider broadening the types of business that can provideremittances to include not only banks but also other classes of trade,including nonbank financial service providers and retail businesses.
• Mechanisms to establish a dialogue between remittance industry andthe central banks and governments of the origin and destination coun-tries should be developed, which will help to shape regulation andmarket operations to the benefit of all stakeholders. Such mechanismscan also help to examine how to facilitate the introduction of newservices and expand the reach of existing services.
• Research on specific remittance-receiving markets (such as theAfrica country studies included in the previous chapters of this vol-ume) could produce more detailed data—about volumes, revenues,and market challenges—that would help policy makers to developeffective action plans. For example, the parallel (informal) market inNigeria currently may give consumers better value than the formalmarket, but it also fails to protect consumers, and the governmentcannot monitor volumes. As circumstances improve in Zimbabwe,there should be efforts to include the Zimbabwean money transfercompanies in designing remittance solutions that will work for thecommunity.
• Specific, consumer-oriented financial literacy materials should be pro-duced and promoted—probably through a campaign initiated by theU.K. government and the governments of recipient countries, in con-junction with the remittance industry. Financial literacy efforts shouldbe part of a broader financial inclusion initiative that educates remit-ters about the optional ways to send money as well as the options avail-able to their families back home about what to do with the money.
340 Remittance Markets in Africa
General Market Recommendations• A useful tool for RSPs to form win-win partnerships with organiza-
tions in the receiving markets would be the establishment of a communications program including development of a website, con-ferences, and dissemination of general information. In the customerservice arena, although many companies have procedures for address-ing complaints, other research has shown that customers are notalways aware of the appropriate policies. All remittance serviceproviders should be encouraged to sign up with the U.K. RemittancesCustomer Charter (see figure 11.6), launched in January 2008, whichrequires firms to comply with service standards. More than half of theRSP industry already voluntarily complies with the charter, but otherorganizations should be encouraged to do so. Wherever consumerssee the charter displayed, they know they will receive a certain stan-dard of service. The change in regulation brought about by the PSDin November 2009 means that consumers can file complaints with theFinancial Ombudsman Service. Because the charter requires signatoriesto give this information to consumers, signing up by RSPs could be auseful tool to engender further trust in operators.
Regulatory and Business Recommendations• Many of the informal operators already run their businesses like for-
mal operators but remain unaware of the RSP industry regulations.Regulatory authorities should work with diaspora organizations andcommunity groups to communicate with informal operators abouthow straightforward it is to comply with the regulations and operatewithin the law.
• HMRC and UKMTA have made significant efforts to explain theAML regulations and the risk-based approach. However, RSPs stilllack clarity about what is and is not acceptable. A continuation ofthese efforts, together with the establishment of clearer answerswherever possible, would be beneficial.
• Money transfer companies find it difficult to obtain new bankaccounts because of some banks’ approach to AML concerns. This isparticularly true for MTOs from Somalia and Sudan. UKMTA is work-ing closely with the banks, but further input and guidance from theregulatory bodies would help to provide workable guidelines thatwould make it easier for banks to operate.
• The PSD went into force on November 1, 2009. All businesses thathave not applied should be actively encouraged to do so.
United Kingdom 341
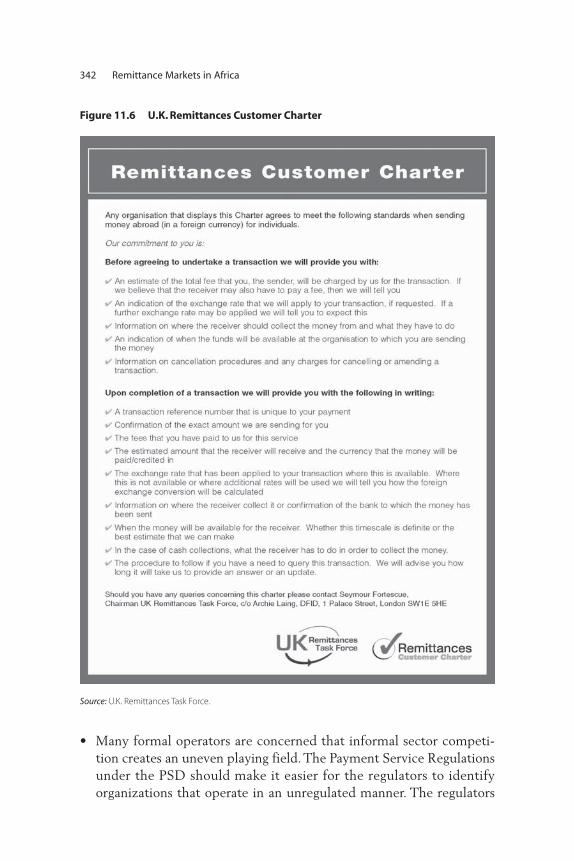
• Many formal operators are concerned that informal sector competi-tion creates an uneven playing field. The Payment Service Regulationsunder the PSD should make it easier for the regulators to identifyorganizations that operate in an unregulated manner. The regulators
342 Remittance Markets in Africa
Figure 11.6 U.K. Remittances Customer Charter
Source: U.K. Remittances Task Force.
United Kingdom 343
should proactively and publicly clamp down on informal operatorswherever they are identified and enforce the regulations.
• The cost to send £100 is more than 10 percent of face value, which ishigh for a competitive market. Options to raise consumer awarenessinclude price comparison websites that provide unbiased and currentinformation, such as http://www.moneymove.org and http://remittanceprices.worldbank.org. A communication campaign with the Africandiaspora groups and communities also could be arranged in conjunc-tion with the first regulatory recommendation listed.
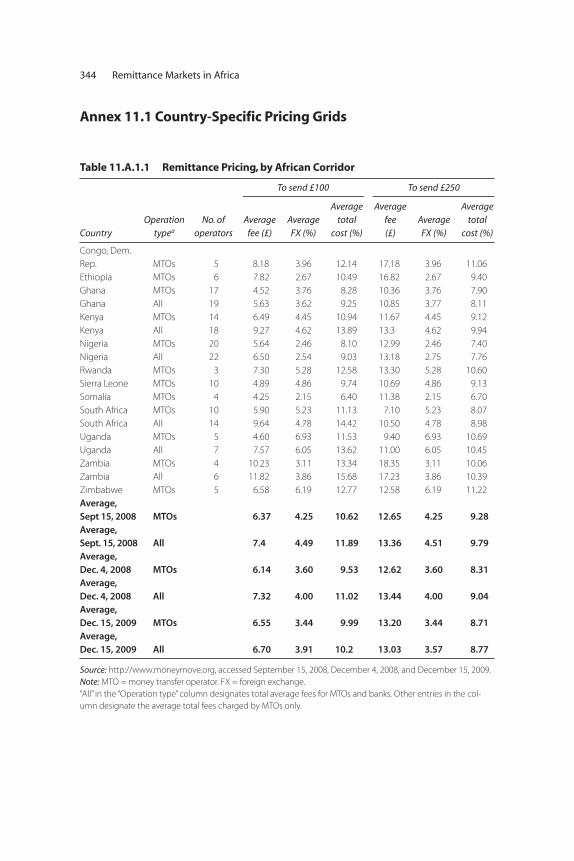
344 Remittance Markets in Africa
Table 11.A.1.1 Remittance Pricing, by African Corridor
To send £100 To send £250
CountryOperation
typea
No. of operators
Average fee (£)
Average FX (%)
Averagetotal
cost (%)
Average fee (£)
Average FX (%)
Averagetotal
cost (%)
Congo, Dem.Rep. MTOs 5 8.18 3.96 12.14 17.18 3.96 11.06Ethiopia MTOs 6 7.82 2.67 10.49 16.82 2.67 9.40Ghana MTOs 17 4.52 3.76 8.28 10.36 3.76 7.90Ghana All 19 5.63 3.62 9.25 10.85 3.77 8.11Kenya MTOs 14 6.49 4.45 10.94 11.67 4.45 9.12Kenya All 18 9.27 4.62 13.89 13.3 4.62 9.94Nigeria MTOs 20 5.64 2.46 8.10 12.99 2.46 7.40Nigeria All 22 6.50 2.54 9.03 13.18 2.75 7.76Rwanda MTOs 3 7.30 5.28 12.58 13.30 5.28 10.60Sierra Leone MTOs 10 4.89 4.86 9.74 10.69 4.86 9.13Somalia MTOs 4 4.25 2.15 6.40 11.38 2.15 6.70South Africa MTOs 10 5.90 5.23 11.13 7.10 5.23 8.07South Africa All 14 9.64 4.78 14.42 10.50 4.78 8.98Uganda MTOs 5 4.60 6.93 11.53 9.40 6.93 10.69Uganda All 7 7.57 6.05 13.62 11.00 6.05 10.45Zambia MTOs 4 10.23 3.11 13.34 18.35 3.11 10.06Zambia All 6 11.82 3.86 15.68 17.23 3.86 10.39Zimbabwe MTOs 5 6.58 6.19 12.77 12.58 6.19 11.22Average, Sept 15, 2008 MTOs 6.37 4.25 10.62 12.65 4.25 9.28Average, Sept. 15, 2008 All 7.4 4.49 11.89 13.36 4.51 9.79Average, Dec. 4, 2008 MTOs 6.14 3.60 9.53 12.62 3.60 8.31Average, Dec. 4, 2008 All 7.32 4.00 11.02 13.44 4.00 9.04Average, Dec. 15, 2009 MTOs 6.55 3.44 9.99 13.20 3.44 8.71Average, Dec. 15, 2009 All 6.70 3.91 10.2 13.03 3.57 8.77
Source: http://www.moneymove.org, accessed September 15, 2008, December 4, 2008, and December 15, 2009.Note: MTO = money transfer operator. FX = foreign exchange. “All” in the “Operation type” column designates total average fees for MTOs and banks. Other entries in the col-umn designate the average total fees charged by MTOs only.
Annex 11.1 Country-Specific Pricing Grids
United Kingdom 345
Notes
1. The survey was conducted by Developing Markets Associates Ltd (DMA).(http://www.developingmarkets.com/dma). DMA provides advice andmanagement services to donor agencies, governments, and the wider busi-ness community in three areas of expertise: remittances, investment pro-grams, and international development events. Its goal within theremittance market is to encourage greater amounts of funds to be remittedthrough formal channels at the lowest possible cost and at the greatest pos-sible efficiency.
2. The four case studies in the chapter boxes are based on interviews at busi-nesses visited during the RSP survey. The companies’ identities have not beendivulged to protect the firms’ privacy.
3. The £4.1 billion estimate was included in a statement from Her Majesty’sTreasury that was read in the House of Commons.
4. The U.K. Office of National Statistics identifies these other key receiving mar-kets (in order of largest to smallest remittance volumes): Germany, Ireland,the United States, France, and Australia. These countries do receive significantremittance volumes from the United Kingdom but are not considered devel-oping markets.
5. Unless otherwise stated, findings about the RSP market refer to both formal(including banks) and informal providers.
6. “Light touch” is Her Majesty’s Treasury’s term to describe its regulatoryapproach.
7. All money service businesses in the United Kingdom—including MTOs, cur-rency exchanges, and other nonbank financial institutions—are registeredwith HMRC. As of June 2008, there were 1,751 registered money servicebusinesses in the United Kingdom.
8. M-PESA, a mobile-phone money transfer service, has become the most pop-ular mode of money transfer in the Kenyan domestic market. Its branchlessbanking service was developed for mobile telecom company Vodafone. Nowthe largest mobile-phone money transfer operator in Africa, M-PESA offersdomestic money transfer services in Kenya and is currently working withWestern Union to kick off cross-border money transfer services.
9. Subsequent anecdotal discussions with MTOs have shown that they hope thePSD will enable banks to look upon authorized PIs more favorably.
10. Although Chequepoint was a large RSP at the time of the survey, it stoppedoperating in the United Kingdom in 2009 because of the PSD.
11. The US$200 was assumed to be the equivalent of £100 (at the time of thesurvey), which, coincidentally, is about the mode for transactions made fromthe United Kingdom. The average transaction size is estimated to be £275.
12. Base data come from the World Bank Remittance Prices database,http://www.remittanceprices.worldbank.org.
13. Data obtained by DMA, which provides mystery shopping services (see note 1).
14. The global database survey was based on five African corridors. Within thatsurvey, the data for Nigeria distorted the overall findings more than was thecase with the U.K. RSP survey conducted by the author. (During the AfricanRSP survey, Nigeria had a negative foreign exchange market because of theparallel market.) In addition, the U.K. RSP survey included banks and infor-mal companies distorted the overall findings more than was the case withthe U.K. RSP survey conducted by the author. (During the African RSP sur-vey, Nigeria had a negative foreign exchange market because of the parallelmarket.) In addition, the U.K. RSP survey included banks and informalcompanies.
15. Data come from the World Bank Remittance Prices database, http://www.remittanceprices.worldbank.org.
16. DMA market surveys based on historic data are found at http://www.moneymove.org.
References
DFID (U.K. Department for International Development). 2005. “Sending MoneyHome? A Survey of Remittance Products and Services in the U.K.” London:DFID.
DMA (Developing Markets Associates). 2007. “Mystery Shopping Exercise forTransactions from U.K. to Nigeria.” Report to the U.K. Remittances TaskForce, DMA, London.
———. 2008. “Migrant Remittances and Linkage to Broader Access to FinancialServices.” Research for the U.K. Remittances Task Force, DMA, London.http://www.moneymove.org/Images/Documents/ACF1AD2.pdf.
World Bank. 2011. Migration and Remittances Factbook 2011. Migration andRemittances Unit. Washington, DC: World Bank.
346 Remittance Markets in Africa
347
Chukwuma Agu coordinates Research and Publications at the AfricanInstitute for Applied Economics in Enugu, Nigeria. His research inter-ests are mainly in openeconomy macroeconomics, international eco-nomic coordination and finance, trade and regional integration, andmacroeconomic policy reforms. He also has deep interests in and famil-iarity with tools of macroeconometric and systems modeling and fore-casting. Mr. Agu has attended several specialized trainings, includingthe Cambridge Advanced Programme on Rethinking DevelopmentEconomics as well as the training program on Financial Programmingand Policies of the International Monetary Fund (IMF) He has publishedseveral journal articles, and he has coedited and contributed to books inhis areas of interest. He has been actively involved in development pol-icy making, being part of the team that developed Nigeria’s current eco-nomic policy reforms program. Mr. Agu consults for several economicpolicy groups and serves as external reviewer for a number of interna-tional academic and policy journals. He holds a Ph.D. in cconomics fromthe University of Nigeria.
Yiriyibin Bambio is a Lecturer at the Faculty of Economics andManagement, University of Ouagadougou, Burkina Faso. His current
Contributors
348 Contributors
research examines the effects of migration and remittances on povertyand inequality in rural Burkina Faso. His research interests includepoverty analysis, impact evaluation, and microcredit. He has beeninvolved in many research or development projects, elaborating surveymethodologies, and conducting surveys and data analysis. He holds aPh.D. in Economics from the University of Ouagadougou.
Fatou Cisse is a Lecturer and researcher at the Faculty of Economicsand Management at the Cheikh Anta Diop University and Consortiumpour la Recherche Économique et Sociale (CRES) in Dakar, Senegal.Her fields of interest are dynamics of poverty, education, labor mar-kets, and migration. She specializes in general equilibrium modelingand microsimulation. She has authored or coauthored several pub-lished papers on the implications of regional integration and trade lib-eralization on poverty and income distribution and on determinants ofdemand for education.
Alemayehu Geda is Professor of Economics at the Department ofEconomics, Addis Ababa University. He is also a research associate of theUniversity of London (School of Oriental and African Studies [SOAS],London), the African Economic Research Consortium (Nairobi), andThe Kenyan Institute for Public Policy Research and Analysis (KIPPRA),Nairobi. He has worked as a consultant for a number of internationalorganizations including the United Nations Economic Commission forAfrica (UNECA), the United Nations Development Programme(UNDP), the World Bank, the Swedish International DevelopmentCooperation Agency (Sida), and the U.K. Department for InternationalDevelopment (DFID), as well as the governments of Ethiopia, Kenya,Tanzania, Uganda, and Zambia. He has taught macroeconomics, macro-econometric modeling, and international economics at the University ofLondon, Addis Ababa University, and the African Economic ResearchConsortium. He has published widely on African, Kenyan, and Ethiopianeconomies in major international journals and has authored severalbooks, including Applied Time Series Econometrics for Africa (Addis AbabaUniversity and AERC 2006) and Readings on Ethiopian Economy.
Jacqueline Irving is a consultant economist in the DevelopmentProspects Group at the World Bank. She has also worked for the WorldBank’s African Department on local sources of infrastructure finance inAfrica and its Development Prospects Group’s Global Development
Finance report as a coauthor on topics including South-South bank lend-ing and foreign investment in African bond markets. She has participatedin operational work and published papers, including for the IMF, onAfrican countries’ access to foreign private capital and regional integra-tion of African securities markets. Previous experience includes sevenyears with the Economist Intelligence Unit (EIU), most recently leadinga team of analysts for the country report series, Financing ForeignOperations. She has continued to contribute articles on African financialmarkets to the EIU and has also consulted for the United Nations, includ-ing the Development Financing Unit and the UNECA. She has a Master’sdegree from Columbia University.
Leon Isaacs is a Chief Executive of Developing Markets Associates(DMA), a firm specializing in consultancy services in and around theinternational remittance market. He is acknowledged as one of theworld’s leading private-sector experts on remittances. In addition to hisposition at DMA, he is Managing Director of the InternationalAssociation of Money Transfer Networks (IAMTN). His role includesliaising with international regulators, technology companies, consumers,and stakeholders who have an interest in the remittance market. He is amember of the Steering Group of the U.K. Remittances Task Force andsits on the Consultative Committee of the World Bank’s G8 PublicPrivate Partnership on remittances. Prior to establishing DMA, he workedfor 15 years at a senior level for a number of international money trans-fer companies, including MoneyGram, Travelex Thomas Cook, andCoinstar.
Sanket Mohapatra is an economist with the Development ProspectsGroup of the World Bank. His research interests include internationalcapital flows, sovereign and subsovereign ratings, corporate financingpatterns, poverty, inequality and growth, and the development impactof remittances and migration. He has contributed to various issuesof the World Bank’s flagship Global Development Finance and GlobalEconomic Prospects reports. He is a core team member of the Africaregional flagship report, Leveraging Migration for Africa: Remittances,Skills, and Investments. He work has been published in peer-reviewedjournals and working papers. He holds a Ph.D. in Economics fromColumbia University and has a Master’s degree from the Delhi School ofEconomics.
Contributors 349
Rose W. Ngugi is an Adviser to the Executive Director for Africa at theInternational Monetary Fund. She has been a Senior Lecturer at theSchool of Economics at the University of Nairobi in Kenya. She has alsoserved as member of the Monetary Policy Advisory Committee of theCentral Bank of Kenya and participated as a member in the Police ReformTask Force under the Office of the President and the Private SectorDevelopment Strategy Technical Committee under Kenya’s Ministry ofTrade and Industry. Her research areas are financial sector issues, private-sector development issues, and economic reforms in general. Her researchhas been published in refereed journals and as working papers and discus-sion papers. She holds a Ph.D. in Financial Economics from the Universityof Birmingham.
Frederic Ponsot is an inclusive finance expert and independent consult-ant based in Paris, with a specialization in microfinance and remittances.He has worked in Africa for CAPAF, a microfinance capacity buildingConsultative Group to Assist the Poor (CGAP) program based in Dakar,Senegal, and with the GRET in Paris, a French international nongovern-mental organization, as a program manager in the Microfinance andSmall Enterprise Department in charge of a program aiming to set uphousing finance products for Senegalese migrants in Italy with the sup-port of the International Fund for Agricultural Development (IFAD) andthe Financial Facility for Remittances. He has led several studies target-ing Europe-to-Africa remittance corridors covering West African remit-tance markets, as well as feasibility studies to set up remittance channelswith microfinance institutions in Africa using new technologies, regula-tory issues, and financial products for migrants for the World Bank, theAfrican Development Bank, the European Union, the Cooperation ofLuxembourg and the French development agency (AFD). Mr. Ponsot hasan M.B.A. in macroeconomics and development economics.
Georgiana Pop is an Economist with the Poverty Reduction andEconomic Management Network in the Africa Region, World Bank. Shejoined the World Bank in 2008 and has substantive operational experi-ence with growth, competitiveness, and infrastructure issues in severalWest African countries. Before joining the World Bank, she specialized incompetition and investment policies at the Organisation for EconomicCo-operation and Development (OECD) in Paris, the EuropeanCommission Delegation in Bucharest, and the Competition Council ofRomania. She also has in-depth expertise in economic issues in several
350 Contributors
emerging markets from Southeast Europe and Central Asia. She hasauthored papers on growth and competitiveness, export promotion, infra-structure, competition, and investment policies. She holds an M.P.A. inEconomic Policy Management from Columbia University and an M.A. inEuropean Economics and International Affairs from the National Schoolof Politics and Public Administration in Bucharest.
Peter Quartey is a Senior Research Fellow at the Institute of Statistical,Social, and Economic Research (ISSER), University of Ghana. He is alsothe Deputy Head at the Centre for Migration Studies, University of Ghana.His research interests include private sector development, developmentfinance, monetary economics, migration and remittances, and povertyanalysis. He is an active member of the African Economic ResearchConsortium (EARC) and the Global Development Network (GDN). Heholds a Ph.D. in Development Economics from the University ofManchester, an M.Sc. in Quantitative Development Economics (Universityof Warwick), and a M.Phil. and B.A. in Economics from the Universityof Ghana.
Dilip Ratha is a Lead Economist and Manager of the Migration andRemittances Team in the Development Prospects Group of the WorldBank. He is also the CEO of Migrating Out of Poverty research consortiumand a Visiting Professor of Economics at the University of Sussex. He wasa lead author of the World Bank flagship Global Economic Prospects 2006and editor of Remittances: Development Impact and Future Prospects. He isthe lead author of the regional flagship report, Leveraging Migration forAfrica: Remittances, Skills, and Investments. He has advised many govern-ments and played a role in international and intergovernmental forums,including the Global Forum on Migration and Development, the G8Global Remittances Working Group, and the World Economic ForumCouncil on migration. Reflecting his deep interest in financing develop-ment in poor countries, he recently edited Innovative Financing forDevelopment featuring his work on shadow sovereign rating, diasporabonds, and future-flow securitization. Prior to joining the World Bank, heworked as a Regional Economist for Asia at Credit Agricole Indosuez; anAssistant Professor of Economics at the Indian Institute of Management,Ahmedabad; and an Economist at the Policy Group, New Delhi.
Edward Sennoga is a country economist at the African DevelopmentBank (AfDB). His research interests are in the fields of public finance, tax
Contributors 351
policy, economics of developing countries, and applied econometrics. Hisresearch has been published in economics journals such as the EconomicInquiry, FinanzArchiv, and the National Tax Journal. He is responsible forthe Economic and Sector Work agenda of the Uganda Country Office. Dr.Sennoga has also provided research and technical support to Georgia’sDepartment of Labor, the Georgia Legislature, Uganda’s NationalPlanning Authority, the New Partnership for Africa’s Development(NEPAD), and the World Bank. He has also taught various courses atboth undergraduate and graduate levels, including macroeconomics,microeconomics, public sector economics, and econometrics at theUniversity of North Texas, Georgia State University, and MakerereUniversity. Dr. Sennoga obtained his Ph.D. from Georgia State Universityin Atlanta, Georgia.
352 Contributors

ECO-AUDIT
Environmental Benefits Statement
The World Bank is committed to preservingendangered forests and natural resources. TheOffice of the Publisher has chosen to printRemittance Markets in Africa on recycledpaper with 50 percent postconsumer fiber inaccordance with the recommended standardsfor paper usage set by the Green PressInitiative, a nonprofit program supportingpublishers in using fiber that is not sourcedfrom endangered forests. For more informa-tion, visit www.greenpressinitiative.org.
Saved:• 7 trees• 2 million BTU’s of
total energy• 702 lbs of CO2
equivalent of greenhouse gases
• 3,379 gallons of waste water
• 205 pounds of solidwaste

ISBN 978-0-8213-8475-6
SKU 18475
Remittances sent by migrant workers provide a lifeline for the poor in many African
countries. These fl ows exceed foreign direct investment and private debt and equity fl ows;
in some cases, the fl ows are similar in size to offi cial aid from multilateral and bilateral
donors. Yet, remittance markets in the continent continue to be characterized by high
levels of informality (especially for South-South migration corridors), high transfer costs of
formal remittance services, and insuffi cient access by the poor in rural areas. At the same
time, the remittance landscape in Africa is rapidly changing with the introduction of new
technologies, in particular, the rapid adoption of mobile money transfers.
The edited volume, Remittance Markets, draws on primary surveys of remittance service
providers in eight Sub-Saharan African countries and two key migrant-destination
countries (France and the United Kingdom) to discuss the policy and institutional
challenges and emerging opportunities in African remittance markets. It presents fi ndings
on types of remittance services, barriers to entry and exit, industry structure, legal and
regulatory environments, and innovations in remittance markets.
The studies include a wide variety of remittance service providers in Africa—including
banks, money transfer companies, post offi ces, microfi nance institutions, savings
and credit cooperatives, mobile telecommunications operators, and informal service
providers—and cover the entire value-chain of sending, intermediating, and receiving
remittances. Policy options for improving the effi ciency of African remittance markets;
reducing costs; and facilitating the fl ows for the benefi t of migrants, the recipients, and
the countries of origin are presented.
This book will be of interest to the remittance industry, governments, the international
development community, and international organizations, as well as researchers.