remediation system evaluation, former occidental facility ... · independent of the site,...
TRANSCRIPT

REMEDIATION SYSTEM EVALUATION
FORMER OCCIDENTAL FACILITY
TACOMA, WASHINGTON
Report of the Remediation System Evaluation,Site Visit Conducted at the Former Occidental Facility, Tacoma, Washington
July 8, 2003

This page is intentionally left blank.

Office of Solid Waste EPA 542-F-04-026and Emergency Response August 2004 (5102G) www.epa.gov/tio clu-in.org/optimization
Remediation System EvaluationFormer Occidental Facility
Tacoma, Washington

This page is intentionally left blank.
NOTICE AND DISCLAIMER
The U.S. Environmental Protection Agency (U.S. EPA) funded the work described herein and preparation of this document by GeoTrans, Inc. under General Service Administration contract GS06T02BND0723 to S&K Technologies Inc., Bremerton, Washington and under EPA contract 68-C-02-092 to Dynamac Corporation, Ada, Oklahoma. This report has undergone review by the EPA site managers and EPA headquarters staff. For more infomation about this project, contact: Mike Fitzpatrick (703-308-8411 or [email protected]) or Kathy Yager (617-918-8362 or [email protected]).
EXECUTIVE SUMMARY
A Remediation System Evaluation (RSE) involves a team of expert hydrogeologists and engineers, independent of the site, conducting a third-party evaluation of site operations. It is a broad evaluation that considers the goals of the remedy, site conceptual model, above-ground and subsurface performance, effectiveness in protecting human health and the environment, and site exit strategy. The evaluation includes reviewing site documents, visiting the site for up to 1.5 days, and compiling a report that includes recommendations to improve the system. Recommendations, including estimates of resulting net cost impacts, are provided in the following four categories:
• improvements in remedy effectiveness in protecting human health and the environment • reductions in operation and maintenance costs • technical improvements • gaining site closeout
The recommendations are intended to help the site team (the responsible party and the regulators) identify opportunities for improvements. In many cases, further analysis of a recommendation, beyond that provided in this report, might be needed prior to implementation of the recommendation. Note that the recommendations are based on an independent evaluation by the RSE team, and represent the opinions of the RSE team. These recommendations do not constitute requirements for future action, but rather are provided for the consideration of all site stakeholders. This RSE report pertains to conditions that existed at the time of the RSE site visit, and any site activities that have occurred subsequent to the RSE site visit are not reflected in this RSE report (unless otherwise noted).
The former Occidental Chemical Corporation (OCC) property (“site”) is approximately 37 acres in extent and is located at 605 Alexander Avenue in Tacoma, Washington along the Hylebos Waterway. Between 1947 and 1973, OCC operated a chlorinated solvents plant. OCC transferred the facility to Pioneer Americas, Inc. in 1997 but retained the environmental liability. A portion of the site was also leased to the Navy in the 1940s and 1950s as part of their ship building and dismantling operations. The facility is currently used as a terminal for shipping and storage of chemicals, but chemical production operations are idle. Remediation oversight was provided by the EPA RCRA program through 1998 when oversight was transferred to the Washington State Department of Ecology (“Ecology”). At the time of the RSE site visit, Ecology and OCC were negotiating a scope of work to be incorporated into a Model Toxics Control Act (MTCA) agreed order, which will become part of a new RCRA permit. In addition to the oversight provided by Ecology, the EPA RCRA program remains involved, particularly in regard to determining the attainment of the RCRA Environmental Indicators (EIs). The EPA Superfund Program also has a vested interest in the site. It is overseeing remediation to address contaminated sediments within the Mouth of the Hylebos Waterway Problem Area of the Commencement Bay/Nearshore Tideflats Superfund Site. This includes two non-time critical removal actions along with the remedial action of dredging the Hylebos channel to the native sediment interface.
Site contamination predominantly consists of volatile organic compounds (VOCs) and elevated pH in the ground water. The primary VOCs are tetrachloroethylene (PCE), trichloroethylene (TCE), and breakdown products including cis-1,2-dichloroethylene (cis-1,2-DCE) and vinyl chloride. A pump and treat (P&T) system has operated at the site since 1996, extracting contaminated ground water, treating it, reinjecting a portion of the treated water to the subsurface, and discharging the remaining treated water to the Hylebos Waterway. The RSE at this site focuses on this P&T system but considers other aspects of the site as they relate to this system.
i
The observations and recommendations contained in this report are not intended to imply a deficiency in the work of either the system designers or operators but are offered as constructive suggestions in the best interest of the EPA, the public, and the facility. These recommendations have the obvious benefit of being formulated based upon operational data unavailable to the original designers.
Recommendations are provided in all four categories: effectiveness, cost reduction, technical improvement, and site closeout. The recommendations to improve effectiveness include the following:
• Plume capture should be enhanced by abandoning the current injection system and increasing extraction throughout the site, where practicable.
• Evaluation of plume capture through the use of potentiometric surface maps developed from site-wide water level measurements and tidal corrections should be discontinued and replaced with more cost-effective and reliable approaches.
• Evaluation of plume capture should be improved by conducting regular water budget analyses in which the amount of water recharging to the site from precipitation, underlying aquifers, and other sources is compared with the amount of ground water extracted.
• Evaluation of plume capture and ground water flow should be improved by installing additional monitoring wells to establish well pairs that surround the VOC plume. During each gauging event, the water levels from the two monitoring wells in a well pair should be gauged simultaneously to avoid the need to correct for tidal influence. In addition, the measurements should be made at least four evenly spaced times per day. This will allow the site team to determine the direction of ground water flow at each well pair location at various parts of the tidal cycle. This approach should provide more reliable information regarding capture and should eliminate the need to collect 72-hour continuous water levels at 28 locations, which has required substantial effort and cost and has not added substantially to the understanding of capture at the site.
• Additional monitoring wells are needed to delineate the VOC plume to the north approximately 100 feet below ground surface. The RSE team estimates that approximately four wells to this depth will be needed.
• Institutional controls should be considered to notify current and future property owners of the contamination beneath their properties. In addition, a preliminary look at on-site and off-site building information is merited to determine the potential for vapor intrusion.
Recommendations for cost reduction include the following:
• Adding a second air stripper in series will provide more thorough and reliable mass removal, which will eliminate the need for GAC, reduce the sludge handling requirements, and reduce the process monitoring frequency. Implementing this recommendation may require a capital expense of $150,000, but annual savings of over $160,000 per year are likely.
• The ground water monitoring program can be revised to more clearly focus on plume capture. The current program addresses both capture and progress toward cleanup; however, cleanup at this site will likely take several decades and frequent ground water monitoring in the plume interior does not provide beneficial information for the expense. Implementing this
ii

recommendation may provide annual savings of approximately $75,000 per year in sampling costs and may reduce analytical costs associated with ground water monitoring by up to 40%.
The remaining recommendations pertain to technical improvement and site closeout. Notable recommendations include improving the performance reports and continuing with P&T as the remedy. The RSE team provides its reasons for continuing with P&T and increasing extraction rather implementing alternate remediation technologies.
A table summarizing the recommendations, including estimated costs and/or savings associated with those recommendations, is presented in Section 7.0 of this report.
iii

PREFACE
This report was prepared as part of a pilot project conducted by the U.S. EPA Office of Solid Waste and Office of Superfund Remediation and Technology Innovation (OSRTI). The objective of this project is to conduct Remediation System Evaluations (RSEs) of pump and treat systems under the Resource Conservation and Recovery Act. The following organizations are implementing this project.
Organization Key Contact Contact Information
U.S. EPA Office of Solid Waste (U.S. EPA OSW)
Mike Fitzpatrick 5303W USEPA Headquarters Ariel Rios Building 1200 Pennsylvania Avenue, N. W. Washington, DC 20460 phone: [email protected]
U.S. EPA Office of Superfund Remediation and Technology Innovation (U.S. EPA OSRTI)
Kathy Yager 11 Technology Drive (ECA/OEME) North Chelmsford, MA 01863 phone: 617-918-8362 fax: 617-918-8427 [email protected]
U.S. EPA Office of Superfund Remediation and Technology Innovation (U.S. EPA OSRTI)
Ellen Rubin EPA Headquarters 5102G Ariel Rios Building 1200 Pennsylvania Avenue, N. W. Washington, DC 20460 phone: 703-603-0141 [email protected]
Dynamac Corporation (Contractor to U.S. EPA)
Daniel F. Pope Dynamac Corporation 3601 Oakridge Boulevard Ada, OK 74820 phone: 580-436-5740 fax: 580-436-6496 [email protected]
GeoTrans, Inc. (Contractor to Dynamac)
Doug Sutton GeoTrans, Inc. 2 Paragon Way Freehold, NJ 07728 phone: 732-409-0344 fax: 732-409-3020 [email protected]
iv

TABLE OF CONTENTS
EXECUTIVE SUMMARY . . . . . . . . . . . . . . . . . . . . . . . . . . . . . . . . . . . . . . . . . . . . . . . . . . . . . . . . . . . . . . . . . . . . . i
PREFACE . . . . . . . . . . . . . . . . . . . . . . . . . . . . . . . . . . . . . . . . . . . . . . . . . . . . . . . . . . . . . . . . . . . . . . . . . . . . . . . . . iv
TABLE OF CONTENTS . . . . . . . . . . . . . . . . . . . . . . . . . . . . . . . . . . . . . . . . . . . . . . . . . . . . . . . . . . . . . . . . . . . . . . v
1.0 INTRODUCTION . . . . . . . . . . . . . . . . . . . . . . . . . . . . . . . . . . . . . . . . . . . . . . . . . . . . . . . . . . . . . . . . . . . . . . . . 11.1 PURPOSE . . . . . . . . . . . . . . . . . . . . . . . . . . . . . . . . . . . . . . . . . . . . . . . . . . . . . . . . . . . . . . . . . . . . . . . . . . . . 11.2 TEAM COMPOSITION . . . . . . . . . . . . . . . . . . . . . . . . . . . . . . . . . . . . . . . . . . . . . . . . . . . . . . . . . . . . . . . . . . . 21.3 DOCUMENTS REVIEWED . . . . . . . . . . . . . . . . . . . . . . . . . . . . . . . . . . . . . . . . . . . . . . . . . . . . . . . . . . . . . . . . 21.4 PERSONS CONTACTED . . . . . . . . . . . . . . . . . . . . . . . . . . . . . . . . . . . . . . . . . . . . . . . . . . . . . . . . . . . . . . . . . . 31.5 SITE LOCATION, HISTORY, AND CHARACTERISTICS . . . . . . . . . . . . . . . . . . . . . . . . . . . . . . . . . . . . . . . . . . . . 3
1.5.1 LOCATION . . . . . . . . . . . . . . . . . . . . . . . . . . . . . . . . . . . . . . . . . . . . . . . . . . . . . . . . . . . . . . . . . . . . 31.5.2 POTENTIAL SOURCES . . . . . . . . . . . . . . . . . . . . . . . . . . . . . . . . . . . . . . . . . . . . . . . . . . . . . . . . . . . 41.5.3 HYDROGEOLOGIC SETTING . . . . . . . . . . . . . . . . . . . . . . . . . . . . . . . . . . . . . . . . . . . . . . . . . . . . . . . 51.5.4 POTENTIAL RECEPTORS . . . . . . . . . . . . . . . . . . . . . . . . . . . . . . . . . . . . . . . . . . . . . . . . . . . . . . . . . 51.5.5 DESCRIPTION OF GROUND WATER PLUME . . . . . . . . . . . . . . . . . . . . . . . . . . . . . . . . . . . . . . . . . . . 6
2.0 SYSTEM DESCRIPTION . . . . . . . . . . . . . . . . . . . . . . . . . . . . . . . . . . . . . . . . . . . . . . . . . . . . . . . . . . . . . . . . . 72.1 SYSTEM OVERVIEW . . . . . . . . . . . . . . . . . . . . . . . . . . . . . . . . . . . . . . . . . . . . . . . . . . . . . . . . . . . . . . . . . . . 72.2 EXTRACTION AND INJECTION SYSTEMS . . . . . . . . . . . . . . . . . . . . . . . . . . . . . . . . . . . . . . . . . . . . . . . . . . . . . 72.3 TREATMENT SYSTEM . . . . . . . . . . . . . . . . . . . . . . . . . . . . . . . . . . . . . . . . . . . . . . . . . . . . . . . . . . . . . . . . . . 82.4 MONITORING PROGRAM . . . . . . . . . . . . . . . . . . . . . . . . . . . . . . . . . . . . . . . . . . . . . . . . . . . . . . . . . . . . . . . . 9
3.0 SYSTEM OBJECTIVES, PERFORMANCE AND CLOSURE CRITERIA . . . . . . . . . . . . . . . . . . . . . . . . . . 103.1 CURRENT SYSTEM OBJECTIVES AND CLOSURE CRITERIA . . . . . . . . . . . . . . . . . . . . . . . . . . . . . . . . . . . . . . 103.2 TREATMENT PLANT DISCHARGE CRITERIA . . . . . . . . . . . . . . . . . . . . . . . . . . . . . . . . . . . . . . . . . . . . . . . . . 11
4.0 FINDINGS AND OBSERVATIONS FROM THE RSE SITE VISIT . . . . . . . . . . . . . . . . . . . . . . . . . . . . . . . 134.1 FINDINGS . . . . . . . . . . . . . . . . . . . . . . . . . . . . . . . . . . . . . . . . . . . . . . . . . . . . . . . . . . . . . . . . . . . . . . . . . . 134.2 SUBSURFACE PERFORMANCE AND RESPONSE . . . . . . . . . . . . . . . . . . . . . . . . . . . . . . . . . . . . . . . . . . . . . . . 13
4.2.1 WATER LEVELS . . . . . . . . . . . . . . . . . . . . . . . . . . . . . . . . . . . . . . . . . . . . . . . . . . . . . . . . . . . . . . 134.2.2 CAPTURE ZONES . . . . . . . . . . . . . . . . . . . . . . . . . . . . . . . . . . . . . . . . . . . . . . . . . . . . . . . . . . . . . . 144.2.3 CONTAMINANT LEVELS . . . . . . . . . . . . . . . . . . . . . . . . . . . . . . . . . . . . . . . . . . . . . . . . . . . . . . . . 15
4.3 COMPONENT PERFORMANCE . . . . . . . . . . . . . . . . . . . . . . . . . . . . . . . . . . . . . . . . . . . . . . . . . . . . . . . . . . . . 164.3.1 EXTRACTION SYSTEM WELLS AND VACUUM PUMP . . . . . . . . . . . . . . . . . . . . . . . . . . . . . . . . . . . 164.3.2 AIR STRIPPER . . . . . . . . . . . . . . . . . . . . . . . . . . . . . . . . . . . . . . . . . . . . . . . . . . . . . . . . . . . . . . . . 174.3.3 GAC . . . . . . . . . . . . . . . . . . . . . . . . . . . . . . . . . . . . . . . . . . . . . . . . . . . . . . . . . . . . . . . . . . . . . . . 174.3.4 FILTER PRESS AND SLUDGE DRYER . . . . . . . . . . . . . . . . . . . . . . . . . . . . . . . . . . . . . . . . . . . . . . . 174.3.5 CATALYTIC OXIDIZER . . . . . . . . . . . . . . . . . . . . . . . . . . . . . . . . . . . . . . . . . . . . . . . . . . . . . . . . . . 184.3.6 INJECTION SYSTEM . . . . . . . . . . . . . . . . . . . . . . . . . . . . . . . . . . . . . . . . . . . . . . . . . . . . . . . . . . . . 184.3.7 CONTROL SYSTEM . . . . . . . . . . . . . . . . . . . . . . . . . . . . . . . . . . . . . . . . . . . . . . . . . . . . . . . . . . . . 18
4.4 COMPONENTS OR PROCESSES THAT ACCOUNT FOR MAJORITY OF MONTHLY COSTS . . . . . . . . . . . . . . . . . 184.4.1 UTILITIES . . . . . . . . . . . . . . . . . . . . . . . . . . . . . . . . . . . . . . . . . . . . . . . . . . . . . . . . . . . . . . . . . . . 194.4.2 NON-UTILITY CONSUMABLES . . . . . . . . . . . . . . . . . . . . . . . . . . . . . . . . . . . . . . . . . . . . . . . . . . . . 194.4.3 LABOR . . . . . . . . . . . . . . . . . . . . . . . . . . . . . . . . . . . . . . . . . . . . . . . . . . . . . . . . . . . . . . . . . . . . . 194.4.4 CHEMICAL ANALYSIS . . . . . . . . . . . . . . . . . . . . . . . . . . . . . . . . . . . . . . . . . . . . . . . . . . . . . . . . . . 19
4.5 RECURRING PROBLEMS OR ISSUES . . . . . . . . . . . . . . . . . . . . . . . . . . . . . . . . . . . . . . . . . . . . . . . . . . . . . . . 194.6 REGULATORY COMPLIANCE . . . . . . . . . . . . . . . . . . . . . . . . . . . . . . . . . . . . . . . . . . . . . . . . . . . . . . . . . . . . 204.7 TREATMENT PROCESS EXCURSIONS AND UPSETS, ACCIDENTAL CONTAMINANT/REAGENT RELEASES . . . . 204.8 SAFETY RECORD . . . . . . . . . . . . . . . . . . . . . . . . . . . . . . . . . . . . . . . . . . . . . . . . . . . . . . . . . . . . . . . . . . . . . 20
v

5.0 EFFECTIVENESS OF THE SYSTEM TO PROTECT HUMAN HEALTH AND THE ENVIRONMENT . 215.1 GROUND WATER . . . . . . . . . . . . . . . . . . . . . . . . . . . . . . . . . . . . . . . . . . . . . . . . . . . . . . . . . . . . . . . . . . . . 215.2 SURFACE WATER . . . . . . . . . . . . . . . . . . . . . . . . . . . . . . . . . . . . . . . . . . . . . . . . . . . . . . . . . . . . . . . . . . . . 215.3 AIR . . . . . . . . . . . . . . . . . . . . . . . . . . . . . . . . . . . . . . . . . . . . . . . . . . . . . . . . . . . . . . . . . . . . . . . . . . . . . . . 215.4 SOILS . . . . . . . . . . . . . . . . . . . . . . . . . . . . . . . . . . . . . . . . . . . . . . . . . . . . . . . . . . . . . . . . . . . . . . . . . . . . . 215.5 WETLANDS AND SEDIMENTS . . . . . . . . . . . . . . . . . . . . . . . . . . . . . . . . . . . . . . . . . . . . . . . . . . . . . . . . . . . . 22
6.0 RECOMMENDATIONS . . . . . . . . . . . . . . . . . . . . . . . . . . . . . . . . . . . . . . . . . . . . . . . . . . . . . . . . . . . . . . . . . 236.1 RECOMMENDATIONS TO IMPROVE EFFECTIVENESS . . . . . . . . . . . . . . . . . . . . . . . . . . . . . . . . . . . . . . . . . . . 23
6.1.1 ELIMINATE INJECTION SYSTEM AND USE EXTRACTION TO ENHANCE CAPTURE . . . . . . . . . . . . . . 246.1.2 DISCONTINUE CURRENT APPROACH OF USING POTENTIOMETRIC SURFACE MAPS TO EVALUATE
CAPTURE . . . . . . . . . . . . . . . . . . . . . . . . . . . . . . . . . . . . . . . . . . . . . . . . . . . . . . . . . . . . . . . . . . . 266.1.3 CONDUCT AND REPORT A WATER BUDGET ANALYSIS . . . . . . . . . . . . . . . . . . . . . . . . . . . . . . . . . 276.1.4 INSTALL ADDITIONAL MONITORING WELLS AND USE PAIRS OF MONITORING WELLS TO
DEMONSTRATE CAPTURE WITH INWARD GRADIENTS . . . . . . . . . . . . . . . . . . . . . . . . . . . . . . . . . . 276.1.5 DELINEATE THE VOC PLUME TO THE NORTH AT THE 100-FOOT DEPTH INTERVAL . . . . . . . . . . . . 296.1.6 CONSIDER INSTITUTIONAL CONTROLS AND A PRELIMINARY VAPOR EVALUATION . . . . . . . . . . . . 29
6.2 RECOMMENDATIONS TO REDUCE COSTS . . . . . . . . . . . . . . . . . . . . . . . . . . . . . . . . . . . . . . . . . . . . . . . . . . . 306.2.1 ADD A SECOND AIR STRIPPER IN SERIES AND ELIMINATE THE USE OF GAC . . . . . . . . . . . . . . . . . 306.2.2 MODIFY GROUND WATER MONITORING PROGRAM . . . . . . . . . . . . . . . . . . . . . . . . . . . . . . . . . . . 31
6.3 MODIFICATIONS INTENDED FOR TECHNICAL IMPROVEMENT . . . . . . . . . . . . . . . . . . . . . . . . . . . . . . . . . . . . 326.3.1 IMPROVE QUARTERLY AND ANNUAL PERFORMANCE REPORTS . . . . . . . . . . . . . . . . . . . . . . . . . . 326.3.2 CONSIDER ABANDONING AND NOT REPLACING THE SLUDGE DRYER WHEN IT FAILS . . . . . . . . . . 33
6.4 CONSIDERATIONS FOR GAINING SITE CLOSE OUT . . . . . . . . . . . . . . . . . . . . . . . . . . . . . . . . . . . . . . . . . . . . 336.4.1 CONSIDERATIONS FOR AN EXIT STRATEGY . . . . . . . . . . . . . . . . . . . . . . . . . . . . . . . . . . . . . . . . . . 336.4.2 ADDRESS PLUME AND SOURCE CONTROL PRIOR TO INSTALLING A SEDIMENT CAP . . . . . . . . . . . 34
7.0 SUMMARY . . . . . . . . . . . . . . . . . . . . . . . . . . . . . . . . . . . . . . . . . . . . . . . . . . . . . . . . . . . . . . . . . . . . . . . . . . . 36
List of Tables
Table 7-1.
List of Figures
Figure 1-1. Figure 1-2. Figure 1-3. Figure 1-4. Figure 1-5. Figure 1-6. Figure 4-1.
Cost Summary Table
Site Location Map The Former OCC Facility and Current Well Locations Plant East/West Geologic Cross-Section Extent of Contamination at 25 Feet Below Ground Surface - August 2002 Extent of Contamination at 50 Feet Below Ground Surface - August 2002 Extent of Contamination at 100 Feet Below Ground Surface - August 2002 Example Potentiometric Surface Map for the 25-foot Interval (January 2002) Submitted as Part of an Annual Performance Evaluation Report
vi

1.0 INTRODUCTION
1.1 PURPOSE
During fiscal years 2000, 2001, and 2002 Remediation System Evaluations (RSEs) were conducted at 24 Fund-lead pump and treat (P&T) sites (i.e., those sites with pump and treat systems funded and managed by Superfund and the States). Due to the opportunities for system optimization that arose from those RSEs, EPA OSRTI and OSW are performing a pilot study of conducting RSEs at RCRA sites. During fiscal year 2003, RSEs at up to five RCRA sites are planned in an effort to evaluate the effectiveness of this optimization tool for this class of sites. GeoTrans, Inc. is conducting these evaluations, and representatives from EPA OSW and OSRTI, attend most of the RSEs as observers.
The Remediation System Evaluation (RSE) process was developed by the U.S. Army Corps of Engineers (USACE) and is documented on the following website:
http://www.environmental.usace.army.mil/library/guide/rsechk/rsechk.html
An RSE involves a team of expert hydrogeologists and engineers, independent of the site, conducting a third-party evaluation of site operations. It is a broad evaluation that considers the goals of the remedy, site conceptual model, above-ground and subsurface performance, effectiveness in protecting human health and the environment, and site exit strategy. The evaluation includes reviewing site documents, visiting the site for 1 to 1.5 days, and compiling a report that includes recommendations to improve the system. Recommendations with cost and cost savings estimates are provided in the following four categories:
• improvements in remedy effectiveness in protecting human health and the environment • reductions in operation and maintenance costs • technical improvements • gaining site closeout
The recommendations are intended to help the site team (the responsible party and the regulators) identify opportunities for improvements. In many cases, further analysis of a recommendation, beyond that provided in this report, might be needed prior to implementation of the recommendation. Note that the recommendations are based on an independent evaluation by the RSE team, and represent the opinions of the RSE team. These recommendations do not constitute requirements for future action, but rather are provided for the consideration of all site stakeholders. This RSE report pertains to conditions that existed at the time of the RSE site visit, and any site activities that have occurred subsequent to the RSE site visit are not reflected in this RSE report (unless otherwise noted).
The former Occidental Tacoma, Washington facility was selected by EPA OSW based on progress made toward Environmental Indicators and input from EPA Region 10. This report provides a brief background on the site and current operations, a summary of the observations made during a site visit, and recommendations for changes and additional studies. The cost impacts of the recommendations are also discussed.
1

1.2 TEAM COMPOSITION
The team conducting the RSE consisted of the following individuals:
Rob Greenwald, Hydrogeologist, GeoTrans, Inc.Peter Rich, Civil and Environmental Engineer, GeoTrans, Inc.Doug Sutton, Water Resources Engineer, GeoTrans, Inc.
1.3 DOCUMENTS REVIEWED
Author Date Title
CRA 3/1989 RCRA Facility Investigation I, Volume 1
CRA 2/24/1993 Estimation of Chemical Migration Rate
CRA 11/29/1993 Engineering Report, Groundwater Remediation
CRA 10/28/1994 Preliminary Extraction System Layout and Operating Design
CRA 3/23/1995 Preliminary Design Model Development Report
CRA 7/21/1995 Conceptual Design, Proposed Groundwater Extraction and Injection Systems
CRA 8/1995 Final Report, Extraction System Pilot Testing Program
CRA 12/11/1995 Injection Testing
CRA 2/26/1996 PRI Source Identification Program Report
CRA 3/24/1997 pH Data Summary
CRA 5/6/1997 Correction of Water Levels for Density Effects
CRA 11/5/1996 Final Construction and System Startup Report
OCC Tacoma, Inc., and Pioneer Chlor Alkali Company, Inc.
5/20/1998 Renewal Application for Groundwater Treatment Facility Corrective Action
CRA 12/21/2000 Annual Performance Evaluation Report, October 1999 through September 2000
CRA 12/21/2000 Bi-Annual Hydraulic Conductivity Assessment -2000
CRA 3/16/2001 January 2001 Well Redevelopment Report
CRA 11/29/2001 Annual Performance Evaluation Report, October 2000 through September 2001
2
Author Date Title
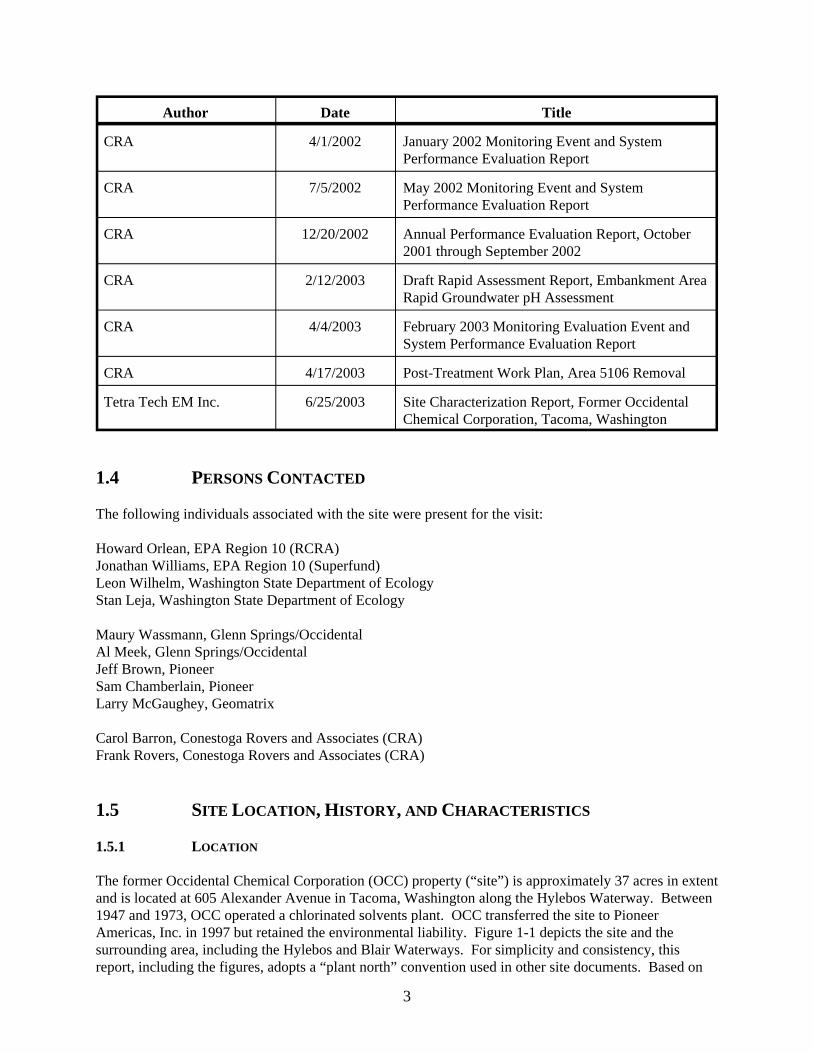
CRA 4/1/2002 January 2002 Monitoring Event and System Performance Evaluation Report
CRA 7/5/2002 May 2002 Monitoring Event and System Performance Evaluation Report
CRA 12/20/2002 Annual Performance Evaluation Report, October 2001 through September 2002
CRA 2/12/2003 Draft Rapid Assessment Report, Embankment Area Rapid Groundwater pH Assessment
CRA 4/4/2003 February 2003 Monitoring Evaluation Event and System Performance Evaluation Report
CRA 4/17/2003 Post-Treatment Work Plan, Area 5106 Removal
Tetra Tech EM Inc. 6/25/2003 Site Characterization Report, Former Occidental Chemical Corporation, Tacoma, Washington
1.4 PERSONS CONTACTED
The following individuals associated with the site were present for the visit:
Howard Orlean, EPA Region 10 (RCRA)Jonathan Williams, EPA Region 10 (Superfund)Leon Wilhelm, Washington State Department of EcologyStan Leja, Washington State Department of Ecology
Maury Wassmann, Glenn Springs/OccidentalAl Meek, Glenn Springs/OccidentalJeff Brown, PioneerSam Chamberlain, PioneerLarry McGaughey, Geomatrix
Carol Barron, Conestoga Rovers and Associates (CRA)Frank Rovers, Conestoga Rovers and Associates (CRA)
1.5 SITE LOCATION, HISTORY, AND CHARACTERISTICS
1.5.1 LOCATION
The former Occidental Chemical Corporation (OCC) property (“site”) is approximately 37 acres in extent and is located at 605 Alexander Avenue in Tacoma, Washington along the Hylebos Waterway. Between 1947 and 1973, OCC operated a chlorinated solvents plant. OCC transferred the site to Pioneer Americas, Inc. in 1997 but retained the environmental liability. Figure 1-1 depicts the site and the surrounding area, including the Hylebos and Blair Waterways. For simplicity and consistency, this report, including the figures, adopts a “plant north” convention used in other site documents. Based on
3

this “plant north”, the site is bordered to the east by the Hylebos Waterway, which is part of Commencement Bay. The site is bordered to the north by Port of Tacoma property, to the south by Port of Tacoma and Department of the Navy property and to the west by Alexander Avenue. In addition, a portion of the site was also leased to the Navy in the 1940s and 1950s as part of their ship building and dismantling operations. Across Alexander Avenue is additional Port of Tacoma property and the Blair Waterway. The facility is currently used as a terminal for shipping and storage of chemicals, and chemical production operations are idle. Figure 1-2 depicts the infrastructure at the site, the well networks, and other select items.
Remediation oversight was provided by the EPA RCRA program through 1998 when oversight was transferred to the Washington State Department of Ecology (“Ecology”). Ecology and OCC are currently negotiating a scope of work to be incorporated into a Model Toxics Control Act (MTCA) agreed order, which will become part of a new RCRA permit. In addition to the oversight provided by Ecology, the EPA RCRA program remains involved, particularly in regard to determining the attainment of the RCRA Environmental Indicators (EIs). The EPA Superfund Program also has a vested interest in the site. It is overseeing remediation to address contaminated sediments within the Mouth of the Hylebos Waterway Problem Area of the Commencement Bay/Nearshore Tideflats Superfund Site. This includes two non-time critical removal actions (one for the Embankment area and the other for Area 5106) along with the remedial action of dredging the Hylebos channel to the native sediment interface. Approximately 36,000 cubic yards of contaminated subtidal sediment from Area 5106 was hydraulically dredged and thermally treated before disposal in a confined disposal facility between October 2002 and March 2003. Additional work, however, will be required to meet sediment quality objectives and contaminant concentrations are sufficiently high that a standard sand cap would become contaminated over time and would not prevent the flow of contaminated ground water into the Hylebos Waterway. Additional characterization and remedy selection efforts are underway but are not discussed in this RSE report. The EPA Superfund program is working with Ecology to ensure that a remedy for the site is developed that will remediate contaminated sediments, prevent sediment recontamination, and prevent discharges of ground water into the Hylebos Waterway above applicable regulatory thresholds.
Site contamination predominantly consists of volatile organic compounds (VOCs) and elevated pH in the ground water. The primary VOCs are tetrachloroethylene (PCE), trichloroethylene (TCE), and breakdown products including cis-1,2-dichloroethylene (cis-1,2-DCE) and vinyl chloride. A pump and treat (P&T) system has operated at the site since 1996, extracting contaminated ground water, treating it, reinjecting a portion of the treated water to the subsurface, and discharging the remaining treated water to the Hylebos Waterway. The elevated pH (8.5 to 13+) is widespread across the site and discharges to the Hylebos Waterway. In addition to discharging to surface water above regulatory limits, the elevated pH, particularly above 9.5, limits the effectiveness of injection and extraction systems due to fouling. The RSE at this site addresses this P&T system but also considers other aspects of the site as they relate to this system.
POTENTIAL SOURCES
Based on a review of facility operations and the extent of elevated pH, the June 2003 Site Characterization Report suggests 14 potential locations for sources of the elevated pH. These locations include waste management units (WMUs) C and H, which are adjacent to the Hylebos Waterway. In all instances, it is presumed that caustic material (e.g., spent lime from processing activities or unspent lime) was released into the environment during processing, transport, storage, or disposal activities. These caustic materials have a high density compared to water and will tend to migrate vertically downward over time, which offers a potential explanation for the “pH blob” found at a depth of over 100 feet.
4
1.5.2

The same Site Characterization Report identifies 12 potential source locations for the VOC contamination. At each location, the release of chlorinated solvents may have occurred. The report suggests that the most likely sources are the former settling pond areas, where effluent from the PCE and TCE processing was released. These areas are all located in the general area between Dock 1 and Alexander Avenue. Although soils were removed from one of these locations (WMU H), remaining total chlorinated organic compound concentrations in soil were as high as 150 mg/kg. Another area, near Dock 2, may provide an additional source of VOC contamination; however, VOC concentrations in shallow groundwater are relatively low in this area, suggesting that the other sources are likely responsible for the majority of the VOC plume.
VOCs in the form of DNAPL are likely present. Although DNAPL has not been directly observed in multiple locations, the concentrations of some individual VOCs in ground water exceed 1% of their solubility. Furthermore, substantial contamination exists at depth, and the presence of DNAPL provides a reasonable explanation for this deep contamination.
1.5.3 HYDROGEOLOGIC SETTING
The June 2003 Site Characterization Report describes the shallow subsurface as a thick sequence (about 150 feet) of fluvial deltaic deposits, underlain by the less permeable Vashon Till unit and overlain by fill. The fluvial deposits consist mainly of sand and silty sand with discontinuous, thin layers of clayey silt, silt, and silty sand. The lower portion of this aquifer also contains some gravel zones. The overlying fill is likely dredge material and is discontinuous and variable across the site. The Vashon Till likely provides a lower confining unit to the fluvial deposits. The horizontal hydraulic conductivity of the fluvial deposits is estimated to range between 10-4 and 10-2 cm/s (approximately 0.3 to 30 feet per day).
Ground water recharge to the shallow aquifer comes from two sources: infiltration from precipitation and flow from the Vashon Till that is recharged by precipitation in the highlands to the north. Surface recharge is likely limited by asphalt and concrete over much of the site and the neighboring properties, and is estimated at 2 to 8 inches per year in the 1996 Corrective Action Plan. In the absence of pumping, ground water flow in the upper 50 feet of the aquifer is dominated by this limited surface recharge, which creates a ground water divide parallel to Alexander Avenue. Ground water east of the divide discharges to the Hylebos Waterway, and ground water west of the divide discharges to the Blair Waterway. Ground water flow in the 50 to 100-foot depths is dominated by regional flow and generally flows west. Although two distinct ground water flow patterns exist at the site in the fluvial deposits, it is generally understood that there is no continuous confining unit separating the areas with the different flow patterns. Discontinuous clay layers are likely present however. A cross-sectional conceptual diagram of ground water flow is presented in Figure 1-3.
Water levels are influenced by both tidal and density effects and have been corrected for in historical site documents. In general, the tide ranges from -4 to 14 feet NGVD and ground surface at the site is approximately 20 feet NGVD. The June 2003 Site Characterization Report calculates an approximate ground water velocity of 0.4 to 4 feet per day. During pumping vertical gradients suggest an upward component of ground water flow, particularly between the 100 and 50-foot depths.
1.5.4 POTENTIAL RECEPTORS
Ground water in the area surrounding the site is not used for drinking water. The primary receptors are the Blair and Hylebos Waterways, with most emphasis on the Hylebos Waterway because of the proximity to the site, the observed contamination seeps (discussed in Section 1.5.5), and the ongoing Superfund remedy for the embankment. The primary potential human exposure is through the consumption of fish caught in the Hylebos Waterway.
5

1.5.5 DESCRIPTION OF GROUND WATER PLUME
Ground water contamination at the site is extensive both horizontally and vertically, with contamination extending from the surface to over 100 feet in depth and VOC contamination extending beyond the horizontal boundaries of the 37-acre OCC property.
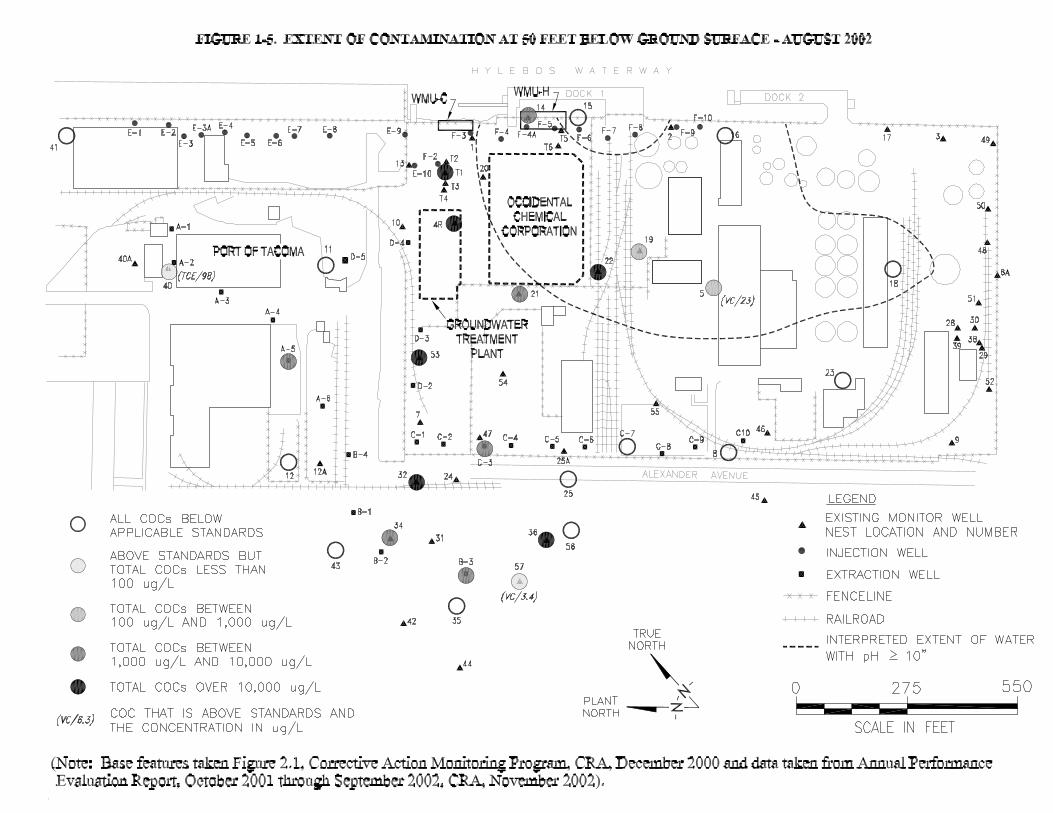
Most of the site monitoring wells are screened in three intervals that are approximately 25, 50, or 100 feet below ground surface within the fluvial deposits. Ground water contamination is generally tracked in each of these intervals but a number of wells are also completed at greater depths. Figures 1-4 through 1-6 show the extent of VOC contamination and the areas with pH over 10 for the 25, 50, and 100-foot depth intervals, respectively. The elevated pH at the 100-foot interval corresponds to the “pH blob” identified in Figure 1-3.
As is evident from the figures, the VOC contamination is adjacent to, and likely discharges to, the Hylebos Waterway to the east. The VOC contamination also extends onto the Port of Tacoma property to the north and west. At the 25 and 50-foot intervals, the VOC contamination appears delineated; however, at the 100-foot depth interval, the VOC plume extends to the north and is not fully delineated. Many locations in all intervals have individual and/or total VOC concentrations greater than 10,000 ug/L. In general, however, the greatest VOC contamination appears to be at the 100-foot depth interval with concentrations indicative of dense non-aqueous phase liquid (DNAPL).
The elevated pH in the 25 and 50-foot intervals appears more limited in extent than the VOC contamination. Investigation during the 2003 Rapid Groundwater pH Assessment included pH sampling at the 75-foot interval. These results at the 75-foot interval (not shown in this report) suggest that the elevated pH at the 100-foot interval is distinct from the elevated pH plumes at shallower depths.
Ground water discharges to the Hylebos Waterway, and two distinct types of seeps have been identified: the flowing seeps and the milky seeps. The pH of the flowing seeps is approximately 8.5 and the pH of the milky seeps ranges from 8 to 11.2. The flowing seeps (also referred to as the bank seeps) have similar chemistry to the Waterway and likely represent bank storage associated with the tidal cycle. The milky seeps, however, are identified by the presence of suspended white solids or encrusted white solids at the discharge point. The solids are likely the result of high pH ground water discharging to the waterway causing calcium and magnesium to precipitate. The milky seeps are also contaminated with VOCs. During the rapid pH assessment, PCE and TCE were detected in the pore water at concentrations of 200 ug/L and 110 ug/L, respectively. In addition, nearby ground water (as determined from direct-push samples) had PCE concentrations of 420 ug/L and 99 ug/L. The sediments along the embankment are also contaminated with PCE and TCE. Sediment samples during the rapid pH assessment indicated PCE and TCE concentrations of up to 6,100 mg/kg and 3,190 mg/kg, respectively, that remain after dredging.
Subsequent to the RSE site visit, EPA reported to the RSE team that the properties to the south (i.e., the Mariana Property and the U.S. Navy and Port of Tacoma Properties) also have shallow ground water contaminated by PCE and high pH. The site team has reportedly been reviewing data from these properties to better characterize the OCC site.
6
2.0 SYSTEM DESCRIPTION
2.1 SYSTEM OVERVIEW
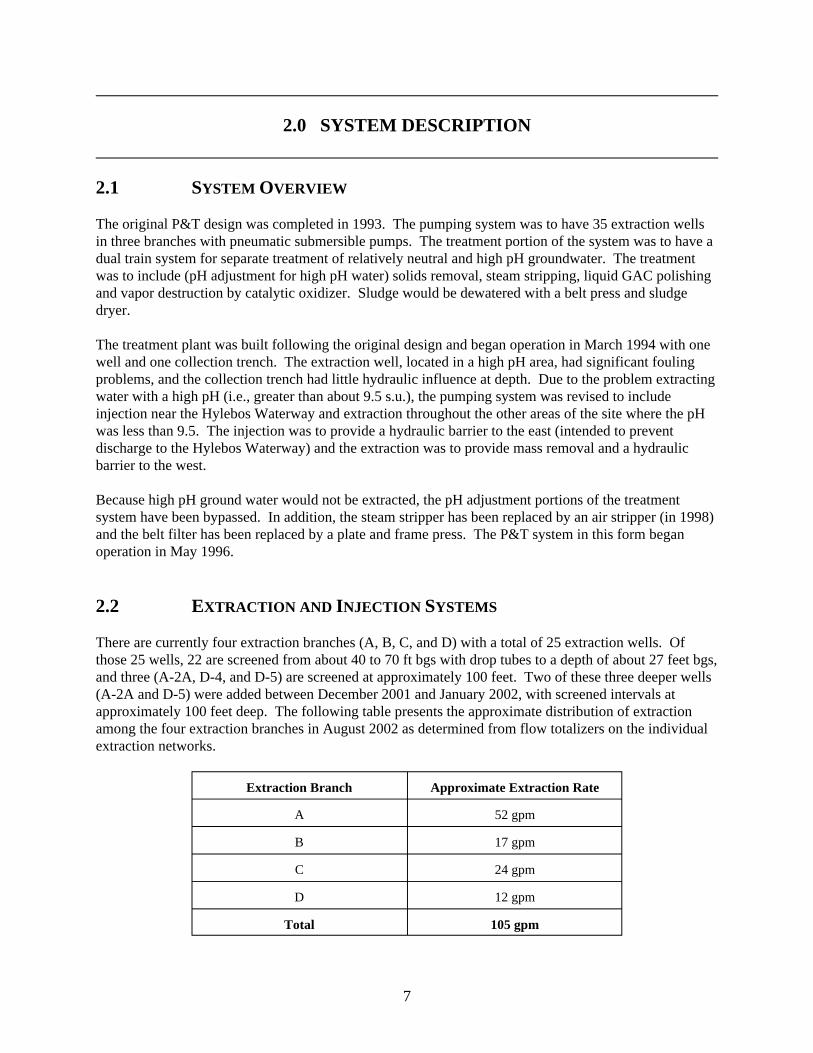
The original P&T design was completed in 1993. The pumping system was to have 35 extraction wells in three branches with pneumatic submersible pumps. The treatment portion of the system was to have a dual train system for separate treatment of relatively neutral and high pH groundwater. The treatment was to include (pH adjustment for high pH water) solids removal, steam stripping, liquid GAC polishing and vapor destruction by catalytic oxidizer. Sludge would be dewatered with a belt press and sludge dryer.
The treatment plant was built following the original design and began operation in March 1994 with one well and one collection trench. The extraction well, located in a high pH area, had significant fouling problems, and the collection trench had little hydraulic influence at depth. Due to the problem extracting water with a high pH (i.e., greater than about 9.5 s.u.), the pumping system was revised to include injection near the Hylebos Waterway and extraction throughout the other areas of the site where the pH was less than 9.5. The injection was to provide a hydraulic barrier to the east (intended to prevent discharge to the Hylebos Waterway) and the extraction was to provide mass removal and a hydraulic barrier to the west.
Because high pH ground water would not be extracted, the pH adjustment portions of the treatment system have been bypassed. In addition, the steam stripper has been replaced by an air stripper (in 1998) and the belt filter has been replaced by a plate and frame press. The P&T system in this form began operation in May 1996.
2.2 EXTRACTION AND INJECTION SYSTEMS
There are currently four extraction branches (A, B, C, and D) with a total of 25 extraction wells. Of those 25 wells, 22 are screened from about 40 to 70 ft bgs with drop tubes to a depth of about 27 feet bgs, and three (A-2A, D-4, and D-5) are screened at approximately 100 feet. Two of these three deeper wells (A-2A and D-5) were added between December 2001 and January 2002, with screened intervals at approximately 100 feet deep. The following table presents the approximate distribution of extraction among the four extraction branches in August 2002 as determined from flow totalizers on the individual extraction networks.
Extraction Branch Approximate Extraction Rate
A 52 gpm
B 17 gpm
C 24 gpm
D 12 gpm
Total 105 gpm
7

2.3
A small portion of the treated water is reinjected by gravity through two injection branches (E and F) located along the Hylebos Waterway, with a total of 21 injection wells. The remainder of the extracted water is discharged to the Hylebos Waterway under a NPDES permit. Figure 1-2 depicts the locations of each extraction and injection well along with the NPDES outfall.
The extraction rate is approximately 105 to 110 gpm and has previously been over 140 gpm. After treatment, less than 5 gpm (and likely less than 2 gpm) is reinjected. The injection system is operated to maintain a level of 2.5 ft MSL or greater in the wells. A flow meter, actuated valve and manual valve and transducer are included at each injection well. The actuated valve is opened automatically based on the water level to allow flow to the well. The injection rate has been decreasing over time as a result of fouling. For example, the initial injection rate in 1996 was approximately 20 gpm. In addition, most of the water is reinjected through injection branch E.
TREATMENT SYSTEM
The treatment system is currently treating about 110 gpm. It has hydraulic capacity for about 200 gpm and possibly higher with pump replacements. The treatment system includes the following components:
• 20 HP vacuum assisted centrifugal pump for ground water extraction • 20,000 gallon decanter tank (no DNAPL has been collected) • lamella settler with sludge pump • 8,500 pumping tank with 10 HP pump • 100,000 gallon holding tank with 30 HP pump • Hazleton Maxi-StripTM air stripper with (5) 7.5HP circulation pumps and a ~15 HP effluent pump • two 20,000 pound GAC vessels arranged in series • injection holding tank • catalytic oxidizer with scrubber and 100-foot stack (for treating ~700 cfm air from the air
stripper and a small amount of additional system air) • DURCOTM plate and frame filter press for dewatering sludge • sludge drier • Allen-BradleyTM control logics system with a PC interface
Solids from the settler and GAC backwash are pumped to a holding tank then through the filter press and sludge drier. The solids from the settler account for approximately 5% of this volume and the GAC backwash accounts for approximately 95% of this volume. Tank levels and flow rates can be monitored through the control system, and an autodialer is present to alert operators to alarm conditions in off-hours.
Prior to the addition of A-2A and D-5, the influent concentration of total contaminants of concern (COCs) was between 15,000 and 20,000 ug/L, which translates to an approximate COC mass removal rate of 18 to 24 pounds of per day. After the addition of A-2A and D-5, the influent concentration of COCs has ranged from 25,000 ug/L to 40,000 ug/L, which translates to a COC mass removal rate of well over 30 pounds per day. This increase in influent concentrations caused an NPDES exceedance for chloroform and 1,1,2-TCA in early 2002 because the system could not remove sufficient contaminant mass. The GAC changeout frequency has been increased to address the added influent mass, and no further NPDES exceedances have occurred. Pumping from these two wells is also throttled to prevent the extraction of more contaminant mass than the treatment system can handle.
8

2.4 MONITORING PROGRAM
The system effluent is sampled and analyzed weekly for VOCs and monthly for select inorganics per NPDES requirements. Additionally the system influent, stripper influent, stripper effluent, and first GAC unit effluent are sampled and analyzed weekly for VOCs.
Approximately 38 monitoring wells are sampled on a quarterly frequency and 37 additional wells are sampled semi-annually. The monitoring wells and sample frequency from the February 2003 Monitoring Event and System Evaluation Report are summarized in the following table.
Quarterly Sampling Semi-Annual Sampling
25-foot* 50-foot* 100-foot* 25-foot* 50-foot* 100-foot*
14-25R 15-25R 16-25 12-25 25-25 5-25 8-23
35-25 36-25
40A-25 43-25
14-50R 15-50R 12-45
18-50R 23-50 25-50 5-50
56-50 57-50 8-54
35-50 36-50 40-50 43-50
5-100 15-120 12-160 8-99R
36-100R 40-100R 40A-100
T1-25 19-25
21-25R 22-25R 4-25R 53-25
T1-50 16-50 41-50
19-50R 21-48 22-50 22-70 A-5 B-3 C-3 C-7
4-45R 11-45
32-50R 34-50 53-50
T1-100 1-100R 41-100 41-138 A-2A D-4
4-83R 4-115R 4-175R 11-100 11-183 35-100 53-100
six additional new wells are proposed for quarterly two additional new wells are proposed with semi-monitoring annual sampling
* Approximate depth of screened interval.
In addition to water quality sampling and analysis, the monitoring program includes regular measurements of water level. Water levels are collected quarterly from all injection wells, seven extraction wells, 65 monitoring wells, and the Hylebos Waterway. In addition, on a quarterly basis, water levels are measured continuously for 72 hours in 28 of the above wells to provide a correction for tidal influence. All water levels are converted to fresh water equivalent heads to account for the spatial variation in density. The extraction wells are also sounded on a regular basis and potentiometric surface maps are generated on a quarterly basis primarily using water levels from injection wells, extraction wells, and a limited number of monitoring wells.
The monitoring program also includes a bi-annual hydraulic conductivity assessments for the monitoring wells included in the monitoring program and redevelopment of those wells where the hydraulic conductivity has decreased by more than 50% from its baseline.
9

3.1
3.0 SYSTEM OBJECTIVES, PERFORMANCE AND CLOSURECRITERIA
CURRENT SYSTEM OBJECTIVES AND CLOSURE CRITERIA
At the time of the RSE site visit, the site remedy was operating under an expired RCRA permit while an Agreed Order and new permit were being negotiated. The expired permit specified four requirements that will likely be included in some form in the negotiated order:
• creation, through the operation of the injection wells, a continuous hydraulic barrier to the flow of site ground water into the Hylebos Waterway
• interception, by the extraction system, of ground water flowing from the injection system toward the Blair Waterway
• containment and recovery of the ground water containing chemicals of concern west of Alexander Avenue
• adequate progress toward achieving ground water cleanup
Adequate progress toward achieving ground water cleanup is defined in the permit as continuing to meet cleanup standards in wells where the standards are already met and observing a declining trend in wells where the standards are not met.
Although this permit has expired due to the transfer of oversight from EPA to Ecology, the same requirements listed above apply and will likely be included in the new Agreed Order under the Model Toxics Control Act (MTCA) and Ecology oversight. One set of cleanup standards has applied under the RCRA permit, and another set of standards will apply under the MTCA. The following table summarizes the both sets of standards for a subset of the site COCs. The appropriate cleanup standards for the site have not been determined and are a current topic of discussion for the site team.
Parameter RCRA Permit Standard (ug/L)
Proposed MTCA Standard* (ug/L)
Methylene chloride 5.0 960
trans-1,2-Dichloroethylene 5.0 32,800
Trichloroethylene 5.0 55.6
1,1,2,2-Tetrachloroethane 5.0 6.48
Tetrachloroethylene 7.0 5**
Carbon tetrachloride 5.0 5**
1,1-Dichloroethylene 5.0 5**
Chloroform 6.0 283
1,1,2-Trichloroethane 6.0 25.3
Vinyl chloride 10.0 5** *Model Toxics Control Act, Method B Surface Water Cleanup Levels, February 2001 ** Practical quantitation limit, SW-846 Method 8260.
10

3.2
In addition to the above objectives, the site has the following objectives under the EPA RCRA Program and the EPA Superfund Program.
• demonstrate that there are no human exposures to site-related contamination (human exposures RCRA Environmental Indicator)
• demonstrate the migration of contaminated ground water is under control (ground water RCRA Environmental Indicator)
• prevent remediated sediment or a sediment cap for the Hylebos Waterway embankment from becoming recontaminated by VOCs or adversely affected by solids fouling due to the elevated pH (implied objective for Commencement Bay Superfund Site)
Because the only expected human exposure is through consumption of fish from the Hylebos Waterway, human exposures can be eliminated if complete containment can be achieved and demonstrated. However, because contamination and contaminant source material likely remains between the current injection line and waterway, the complete containment cannot likely be provided by injection. As a result, it appears that potential human exposure and contamination of the cap could occur if injection continues. It is noted that as a nominal value, the Superfund Program indicates that a PCE concentration of greater than 20 ug/L discharging to the waterway would be sufficient to cause sediment contamination in excess of the applicable standard (57 mg/kg) and that this PCE concentration could continue to discharge to the waterway, even if the injection system operates as intended.
It should be noted that subsequent to the RSE site visit, EPA noted that the site team (including OCC) agreed that the sediment planned cap for the embankment area would not chemically isolate or adequately attenuate VOC contaminated ground water. The site team is discussing how to approach sediment remediation.
TREATMENT PLANT DISCHARGE CRITERIA
The discharge criteria for the treatment plant effluent are stipulated by an NPDES permit that currently applies to both reinjected water and water discharged to the Hylebos Waterway. The discharge limits are provided in the following table:
Parameter Concentration (ug/L)
Vinyl chloride NA
1,1-Dichloroethylene 5
Methylene chloride 185
trans-1,2-Dichloroethylene NA
cis-1,2-Dichloroethylene NA
Chloroform 75
Carbon tetrachloride 10
Trichloroethylene 440
1,1,2-Trichloroethane 5
Tetrachloroethylene 50
1,1,2,2-Tetrachloroethane 180
11

The RSE team notes that the NPDES discharge limits for some parameters, such as TCE and PCE, are higher than the cleanup standards detailed in the former RCRA permit and the proposed MTCA cleanup standards. In addition, the discharge standard for PCE (50 ug/L) is greater than the 20 ug/L that Superfund says can contaminate a sediment cap. Under the current system, this represents an inconsistency given that injection of water with concentrations above cleanup standards would be allowed. Fortunately, the responsible party voluntarily treats extracted water to concentrations that are lower than both the cleanup standards and the discharge standards.
Other limits for treatment plant effluent are established for inorganics, including pH in the range of 6 to 9. Flow is required to be less than 24,500,000 gallons per day (over 10,000 gpm), which is orders of magnitude higher than is practicable to extract from ground water and treat at this site.
12
4.0 FINDINGS AND OBSERVATIONS FROM THE RSE SITE VISIT
4.1 FINDINGS
The RSE team observed a site with complex hydrogeology and substantial subsurface contamination. The observations provided below are not intended to imply a deficiency in the work of the system designers, system operators, or site managers but are offered as constructive suggestions in the best interest of the EPA and the public. These observations obviously have the benefit of being formulated based upon operational data unavailable to the original designers. Furthermore, it is likely that site conditions and general knowledge of ground water remediation have changed over time.
4.2 SUBSURFACE PERFORMANCE AND RESPONSE
4.2.1 WATER LEVELS
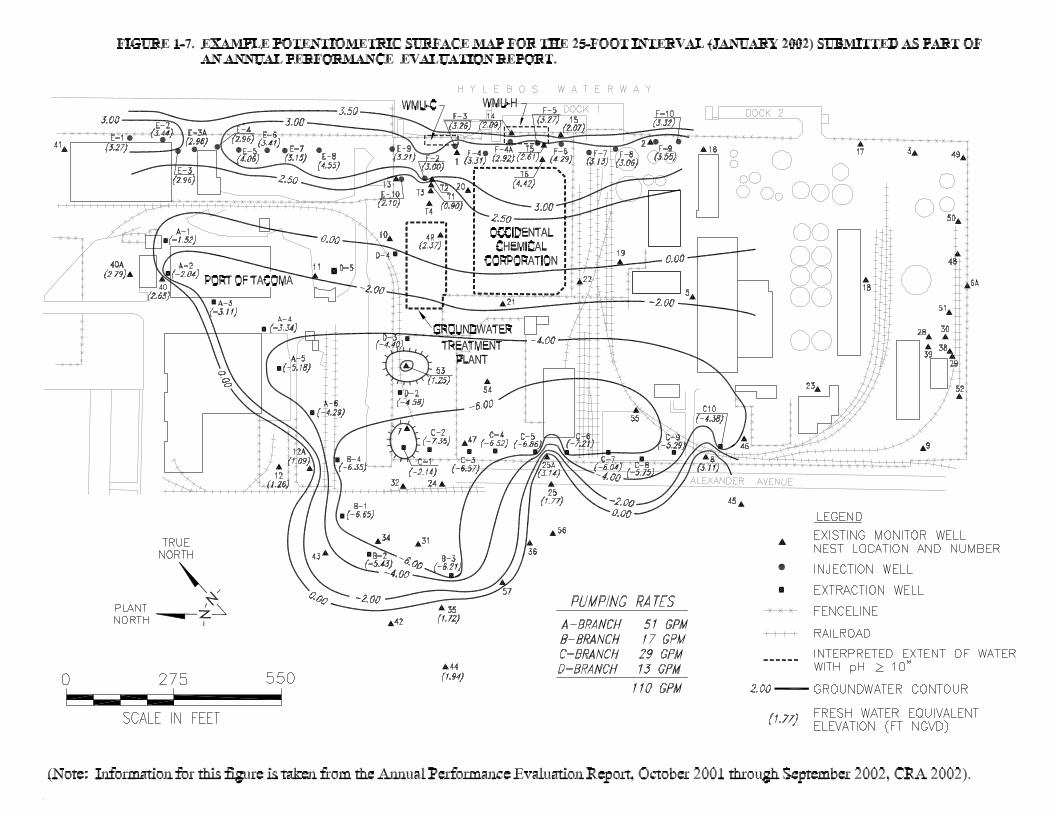
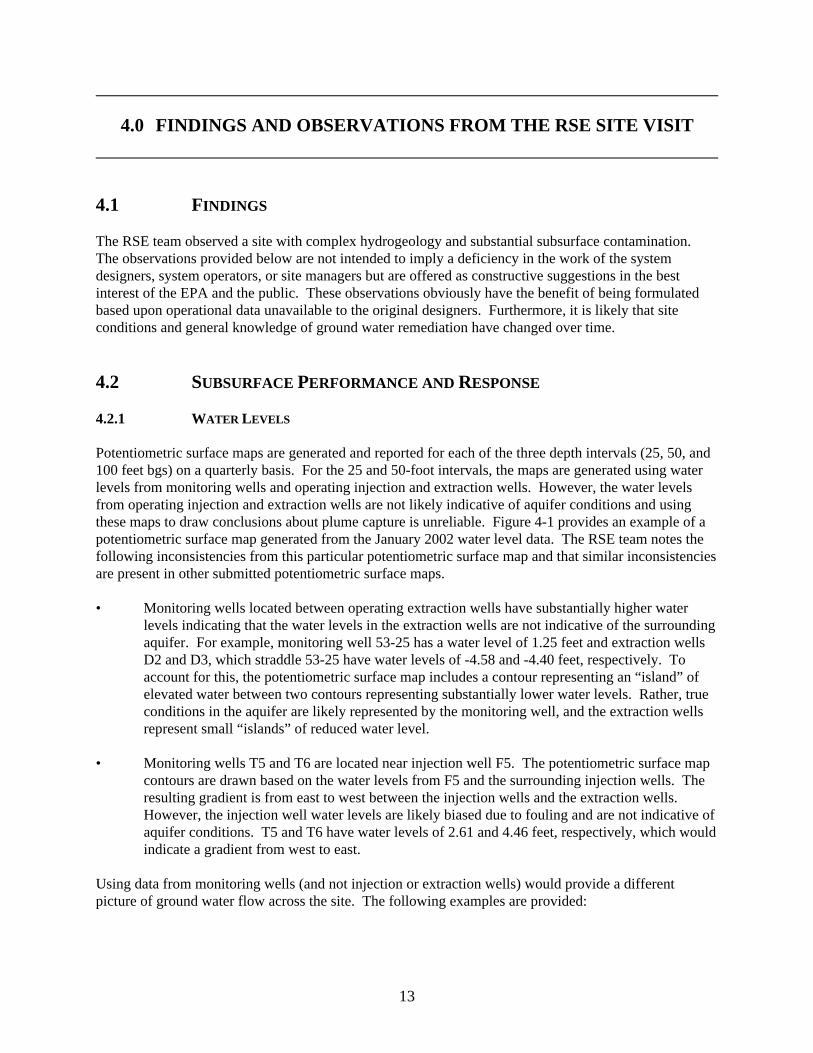
Potentiometric surface maps are generated and reported for each of the three depth intervals (25, 50, and 100 feet bgs) on a quarterly basis. For the 25 and 50-foot intervals, the maps are generated using water levels from monitoring wells and operating injection and extraction wells. However, the water levels from operating injection and extraction wells are not likely indicative of aquifer conditions and using these maps to draw conclusions about plume capture is unreliable. Figure 4-1 provides an example of a potentiometric surface map generated from the January 2002 water level data. The RSE team notes the following inconsistencies from this particular potentiometric surface map and that similar inconsistencies are present in other submitted potentiometric surface maps.
• Monitoring wells located between operating extraction wells have substantially higher water levels indicating that the water levels in the extraction wells are not indicative of the surrounding aquifer. For example, monitoring well 53-25 has a water level of 1.25 feet and extraction wells D2 and D3, which straddle 53-25 have water levels of -4.58 and -4.40 feet, respectively. To account for this, the potentiometric surface map includes a contour representing an “island” of elevated water between two contours representing substantially lower water levels. Rather, true conditions in the aquifer are likely represented by the monitoring well, and the extraction wells represent small “islands” of reduced water level.
• Monitoring wells T5 and T6 are located near injection well F5. The potentiometric surface map contours are drawn based on the water levels from F5 and the surrounding injection wells. The resulting gradient is from east to west between the injection wells and the extraction wells. However, the injection well water levels are likely biased due to fouling and are not indicative of aquifer conditions. T5 and T6 have water levels of 2.61 and 4.46 feet, respectively, which would indicate a gradient from west to east.
Using data from monitoring wells (and not injection or extraction wells) would provide a different picture of ground water flow across the site. The following examples are provided:
13

• Referring to monitoring wells T1, 4R, and 53, there is a flow divide near 4R with water east of the divide flowing east and water west of the divide flowing west. Such a flow divide may also be present near T6, however, insufficient water level data is available to make this conclusion.
• Referring to 25A and 25, ground water apparently flows from east to west away from extraction wells C5 and C6. This could suggest that the influence from C5 and C6 is relatively small and providing ineffective capture. An additional piezometer between 25A and 25 might indicate that there is a flow divide between the two wells, suggesting that capture might be sufficient.
• In general, the water levels on the southern end of the site appear higher than those on the northern end of the site. Monitoring wells 8 and 25A have levels of over 3 feet while 40A, 40, 12, 12A, and 53 have levels of under 3 feet. This suggests that there may be a northward component of ground water flow. This northward component could be due to natural ground water flow patterns but could also be due to preferential extraction from branches A, B, and D compared to extraction at branch C. This is consistent with reports during the RSE site visit that the C branch has been dewatered frequently from pumping. It is also consistent with extraction records that show that in 2002 the A branch is responsible for the majority of the extraction.
Water level data from existing monitoring wells generally support some of the conclusions made from the existing potentiometric surface map. The following examples are provided using the January 2002 data.
• Referring to 40A and 40 ground water apparently flows from north to south toward extraction at A-1, A-2, and A-3.
• Referring to 12 and 12A, ground water apparently flows from north to south toward extraction at B-4.
• Referring to 44 and 35, ground water apparently flows from west to east toward extraction at B3.
These three examples support inward gradients toward the extraction wells for this January 2002 data set for the 25-foot interval. Other data sets appear in general agreement, but there may be a few exceptions. In conclusion, however, the above examples clearly indicate that the potentiometric surface maps for the 25 and 50-foot intervals (both of which rely on operating extraction and injection wells for data) are likely not representative but that capture in some areas is likely sufficient.
4.2.2 CAPTURE ZONES
Given that the potentiometric surface maps are unreliable, using these maps for interpreting plume capture is also unreliable. In addition, insufficient data are available for fully evaluating plume capture. There is, however, ample evidence that a degree of capture is provided in the 25-foot depth interval (and likely the 50-foot interval). As stated above, there appears to be a flow divide near 4R and potentially near T6. Therefore, contamination to the west of these wells is likely captured and prevented from flowing east into the waterway. On the other hand, it is reasonable to conclude that contaminated ground water to the east of this apparent divide continues to flow into the waterway.
For capture in other directions, the water level data from well pairs and water quality data from sentinel wells provide useful information. Three of the well pairs noted in the previous section (40A/40, 12/12A, and 44/35) indicated capture to the north and west. Well pair 25A and 25 indicates a potential lack of capture, but the absence of contaminants above cleanup standards at 25 supports capture (provided that
14

4.2.3
the concentrations do not increase over time). Other ground water quality data also support capture at the 25-foot depth interval, including monitoring wells 40A-25, 12-25, 42-25, and 44-25. However, monitoring wells 43-25 and 36-25 have detectable VOCs concentrations that are higher than previous data, suggesting the potential for migration in these areas. The above analyses only apply to the 25-foot depth interval during January 2002, but similar analyses and likely similar conclusions can be made regarding the 50-foot depth interval and other sampling events
Capture at the 100-foot depth interval is inconclusive due to a lack of data, and a thorough capture evaluation at this depth is also complicated by the lack of plume delineation. In particular, the concentrations at monitoring wells 41-138, 40A-100, and 40-100 all have VOCs well above relevant cleanup standards, and there are no monitoring wells or extraction wells downgradient of these locations to provide delineation. The substantial decrease in VOC concentrations in 41-138 could be interpreted as an indication of capture, but the decrease started well before the addition of A-2A. Therefore, the decrease is likely due to dilution from the injection of clean water at E-1 and the movement of contaminated water further from the site. The increases in VOC concentrations at 40A-100 and 40-100 might indicate that these wells are within the capture zones of nearby extraction wells and that contaminated ground water is passing through these monitoring wells on route to extraction at A-2A. It could also potentially represent uncaptured contamination. Moreover, substantial contamination may exist beyond 40A-100 and 40-100 given that these two wells have substantial concentrations (38,000 ug/L of total contaminants of concern at 40-100 and 9,800 ug/L of total contaminants of concern at 40A-100 in August 2002) and no monitoring points are available to the north.
CONTAMINANT LEVELS
Elevated pH
The areas with elevated pH have not changed substantially since the operation of the treatment system began. One benefit of this lack of change, is that the elevated pH is not migrating toward the extraction system. If the extraction wells begin extracting water with elevated pH, substantial solids fouling of both the extraction wells and the treatment system will likely occur. The relatively slow migration or lack of migration of the elevated pH may result from the natural buffering capacity of the soil.
VOC Plume
Trends in contaminant concentrations have been observed in a number of site wells. Some wells have increased in concentration while others have decreased in concentration. Some wells have shown large variations in concentrations between 1996 and 2002 with no discernible trend, perhaps indicating the influence of nearby injection or extraction.
Select Perimeter Wells Some of the perimeter wells that have decreases in concentrations include 19-25, 35-25, and 57-50. In general, these wells provide evidence of some control over the plume to the west and the south. Other perimeter wells that show decreases in concentration include the T1 series, 14-50, and 41-138. The decreases in these wells are likely due to dilution from injecting treated water. While this is a desired effect for T1, it is not likely desirable at 14-50, which is adjacent to the waterway, or 41-138, which has no nearby extraction wells to capture the contaminated ground water that might be spreading. Some perimeter wells are also increasing in concentration, including 40-100, 40A-100, 15-25R, and 36-50. These increases may be of concern if there is no nearby extraction (e.g., 36-50) or if the wells are on the waterway side of the injection system (e.g., 15-25R).
15
Select Interior Wells A number of the interior wells have shown decreasing trends including many of the wells in the 4 series, 11-45, 11-100, 21-25R, 32-50, 34-50, 53-25, and 53-50. Although decreases are evident, contamination in many of these wells remains elevated, with some concentrations exceeding 10,000 ug/L of total COCs. Other interior wells have either fluctuated without a discernible trend or have remained largely unchanged since pumping began.
Treatment Plant Influent
The monitoring of the influent to the treatment plant indicates that substantial contaminant mass is being removed from the subsurface. On average between October 1997 and September 2002 approximately 750 pounds of contaminants have been removed from the subsurface per month. Although new extraction wells A-2A and D-5 provide extra potential to remove contaminant mass, the current treatment system is not designed to cost-effectively remove this much additional mass.
Summary of Contaminant Levels
In general, the ground water quality monitoring provides a mixed interpretation for capture. In some areas, capture appears adequate (e.g., some areas to the west), in other locations capture might not be adequate (e.g., to the north at the 100-foot depth interval and along the waterway), and in still other areas insufficient data are available for a thorough capture evaluation (e.g., some areas to the southwest).
Ground water quality monitoring and process monitoring demonstrate that substantial contaminant mass is being removed, and additional mass can be removed with additional extraction if the treatment system is upgraded. Decreasing concentrations have been evident in some locations along the perimeter of the plume and in the interior of the plume, but substantial contamination remains. For example, at monitoring well 4-25R, the concentration of contaminants of concern has decreased from 120,000 ug/L but has stabilized at over 50,000 ug/L. At 11-100, the concentration of contaminants of concern has decreased from 450,000 ug/L but has stabilized at over 250,000 ug/L (including TCE at over 100,000 ug/L). With these persistent, elevated concentrations, it is likely that DNAPL is present as a continuing source of dissolved ground water contamination and that remediation might occur indefinitely. Therefore, demonstrating meaningful progress toward complete cleanup is difficult.
4.3 COMPONENT PERFORMANCE
4.3.1 EXTRACTION SYSTEM WELLS AND VACUUM PUMP
The extraction system continues to extract approximately 105-110 gpm, and based on this information alone, there is no indication of a problem with the extraction system. However, the extraction system is a network of vacuum extraction wells manifolded to one 20 HP vacuum pump. If fouling of one well occurs the flow rate could be made up by other wells resulting in reduced extraction in some areas and additional extraction in others. For a containment remedy with relatively evenly spaced wells, localized reductions in extraction could result in a reduction in plume capture. Of particular concern is extraction branch C, which has reportedly been running dry over the previous months prior to the RSE site visit. In addition, flow rates in extraction branch C have declined from 55 gpm in 1999 (approximately 40% of the total system extraction) to 24 gpm in August 2002 (approximately 23% of the total system extraction).
16

The October 2001 through September 2002 Annual Performance Evaluation Report also provides evidence of decreasing well efficiency. For example, the report explains, “The horizontal gradient across the cone of depression in May and August 2002 was approximately 12 feet, from an approximate elevation of 0 feet NGVD at the perimeter of the plume and 3 feet NGVD along the injection system to an elevation of approximately -11 feet NGVD at the center of the cone of depression. This gradient has increased by approximately one foot in each of the least two reporting periods.” This increased gradient is based on increased drawdowns in extraction wells. This increased drawdown is likely due to a decrease in well efficiency due to fouling and is representative of the water in the operating extraction well but is not likely representative of the surrounding aquifer.
4.3.2 AIR STRIPPER
The air stripper provides the primary mechanism for removing VOCs from the extracted ground water, and its efficiency is lower than the original design efficiency despite cleaning on a monthly or bimonthly basis. The two problematic constituents are chloroform and 1,1,2-TCA. The stripper efficiency for chloroform has generally been well below the design efficiency. For example, in June 2003 the efficiency for chloroform was 97.65% compared to a design efficiency of 99.18%. With the design influent concentration of chloroform over 1,000 ug/L, a further increase in the chloroform influent concentration or a further decrease in the efficiency will lead to increased reliance on GAC to meet the NPDES requirements. The 1,1,2-TCA is generally undetectable in the plant influent due to the high concentrations of the other constituents that require samples to be diluted. Historical data have indicated that the influent 1,1,2-TCA concentration is less than 50 ug/L, but the recent increases of VOCs in the influent due to extraction from D-5 suggests that the influent concentration of 1,1,2-TCA may be up to 100 ug/L. Rather than approximately 5 ug/L, the stripper effluent for 1,1,2-TCA is now approximately 15 ug/L. The stripper now rarely meets the discharge criteria of 5 ug/L and the treatment plant is reliant on the GAC to meet discharge standards.
4.3.3 GAC
Approximately 17,000 pounds of GAC is replaced every two months, primarily due to the breakthrough of 1,1,2-TCA, which has a relatively low isotherm for adsorption to GAC. Breakthrough of 1,1,2-TCA through the GAC is likely also enhanced by channeling through the GAC caused by solids in the process water. Backwashing of the GAC is required approximately once every five days and is conducted manually by connecting the units to hydrants with hoses. The solids from the GAC backwash represent the majority of the solids that require dewatering and disposal.
4.3.4 FILTER PRESS AND SLUDGE DRYER
Solids removal and associated sludge handling are necessary at this site especially when extraction wells closer to the high pH (and highest VOC) areas are pumped. However, the amount of solids removed (about 200 lbs/day of sludge) is significantly less than the original design value of 13 tons/day as dry solids. The current system includes a plate and frame filter press that replaced a belt press (an effective optimization effort by the site team). The original sludge drier is still used even though it would not be warranted unless it were already in place. Since it requires relatively little energy it is reasonable to continue using it. Removal of the unit should be considered if any major maintenance to it is required. The plate and frame press use should continue because the alternative of collecting the sludge in a thickener tank and having it processed by a mobile service is not feasible due to the large volume of dilute sludge. Maintaining the filter press also allows the flexibility of handling additional solids if extraction wells are added.
17
4.3.5 CATALYTIC OXIDIZER
The catalytic oxidizer requires regular maintenance and is likely nearing the end of its useful life, primarily due to corrosion. It typically receives approximately 700 scfm of flow and a contaminant mass of approximately 25 pounds per day. It is the leading cause of system down time, which is generally less than 5% per year.
4.3.6 INJECTION SYSTEM
As stated in Section 2.2 of this report, the injection wells are fouled, which has substantially reduced the amount of water that can be reinjected. Rather than the original 20 gpm injection rate, the current injection rate is approximately 2 gpm. The majority of the injection occurs along the E injection branch.
4.3.7 CONTROL SYSTEM
The control system is an Allen-BradleyTM control logics system with a PC interface. The operator can track a number of individual plant parameters including the extraction rate from each extraction branch and the injection rate of each injection well. Data can be downloaded and reviewed but trends are generally not analyzed. Most plant functions are automated, but items such as GAC backwash and solids handling are manual. The system is equipped with an autodialer that calls an operator in case any of the 10 system alarms sound. The PC records the alarms to facilitate the diagnosis of problems.
4.4 COMPONENTS OR PROCESSES THAT ACCOUNT FOR MAJORITY OF MONTHLY COSTS
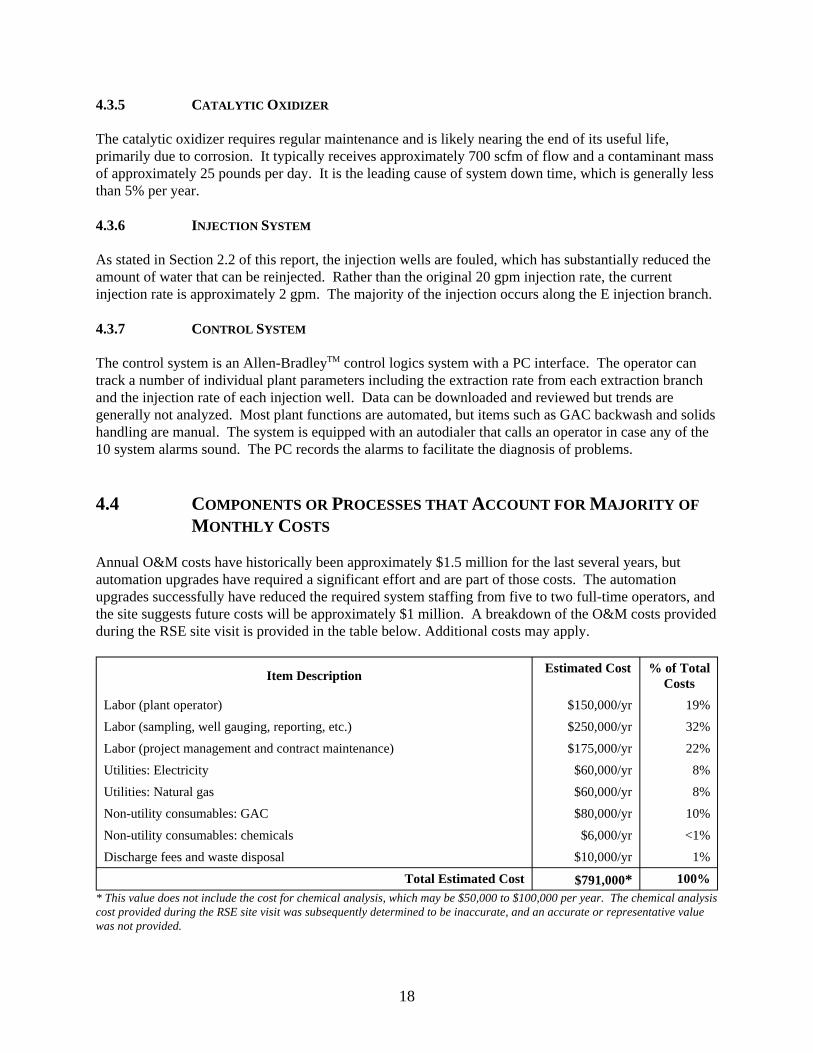
Annual O&M costs have historically been approximately $1.5 million for the last several years, but automation upgrades have required a significant effort and are part of those costs. The automation upgrades successfully have reduced the required system staffing from five to two full-time operators, and the site suggests future costs will be approximately $1 million. A breakdown of the O&M costs provided during the RSE site visit is provided in the table below. Additional costs may apply.
Item Description Estimated Cost % of Total Costs
Labor (plant operator)
Labor (sampling, well gauging, reporting, etc.)
Labor (project management and contract maintenance)
Utilities: Electricity
Utilities: Natural gas
Non-utility consumables: GAC
Non-utility consumables: chemicals
Discharge fees and waste disposal
$150,000/yr
$250,000/yr
$175,000/yr
$60,000/yr
$60,000/yr
$80,000/yr
$6,000/yr
$10,000/yr
19%
32%
22%
8%
8%
10%
<1%
1%
Total Estimated Cost $791,000* 100% * This value does not include the cost for chemical analysis, which may be $50,000 to $100,000 per year. The chemical analysis cost provided during the RSE site visit was subsequently determined to be inaccurate, and an accurate or representative value was not provided.
18

4.4.1 UTILITIES
The treatment plant, including the vacuum pump for the extraction system, utilizes approximately 112.5 HP of pumps and blowers. At approximately $0.06 per kWh, this accounts for the majority of the electricity cost. The natural gas at the plant is primarily used for the catalytic oxidizer and sludge dryer.
4.4.2 NON-UTILITY CONSUMABLES AND DISPOSAL COSTS
The GAC is the primary consumables expense at approximately $80,000 per year. Approximately 17,000 pounds of GAC is replaced every two months, and this frequency is increasing given the added mass extracted from D-5. The only chemical added to the treatment plant is a defoamer that is added to the air stripper. Hydrochloric acid from the catalytic oxidizer scrubber is recycled through the plant to neutralize the process water. For disposal, approximately 200 pounds of sludge is produced per day, which is dewatered with the filter press and sludge drier and then disposed of as non-hazardous waste.
4.4.3 LABOR
The two system operators that are employees of Glenn Springs/Occidental each work 40 hours per week such that the plant is manned seven days per week. This means that there is overlap between the operators three days per week (Wednesday, Thursday, and Friday). This double coverage allows the operators to conduct a number of two-person tasks, including cleaning the filter press and GAC backwashes. Other operator tasks include taking water levels, transferring solids from the settling tank, dewatering sludge, permitting, taking PID readings from the catalytic oxidizer stack, and routine maintenance. The system operators spend significant time on backwashing the GAC vessels about once every five days due to solids fouling and emptying the filter press about once per week.
Ground water sampling consists of four events per year: one large event, one medium event, and two smaller events. Staff from Vancouver, British Columbia and Stockton, California conduct the sampling. Approximately three people are required for three weeks for the large event, three people for two to three weeks for the medium event, and two people for two weeks for the smaller events. The site team is currently discussing the option of establishing a local office, which could reduce travel costs associated with sampling. This translates to approximately 1,225 man-hours per year. Additional hours are required for reporting and the bi-annual well performance testing.
4.4.4 CHEMICAL ANALYSIS
As indicated in the footnote to the table, the chemical analysis cost provided during the RSE site visit was subsequently determined to be inaccurate. Therefore, chemical analysis costs are not included in the annual O&M cost provided in the above table.
4.5 RECURRING PROBLEMS OR ISSUES
Although not stated in the site reports, well fouling is likely one of the most significant issues for the remedy. Well fouling reduces the amount of water that can be injected and therefore adversely affects the attempt to establish a hydraulic barrier along the Hylebos Waterway. Well fouling also likely results in preferential extraction from some extraction wells compared to others and reduced extraction overall. This may compromise capture in some areas.
19

The tidal influence on the water levels is also problematic. Unlike many sites, collecting water levels at this site is more expensive than water quality sampling. This is primarily associated with the requirement to collect continuous water levels over 72 hours at many locations, to calculate corrected site-wide water levels from that data, and to frequently recalibrate those probes.
The exceptionally high total VOC concentrations in the extracted water from D-5 also provides a problem given the current efficiency of the air stripper. Without an increase in the efficiency, extraction from D-5 will be purposely limited to avoid unreasonable expense associated with GAC replacement. The catalytic oxidizer also requires increasing maintenance due to corrosion and has been the primary cause of system downtime.
4.6 REGULATORY COMPLIANCE
The treatment plant has had one exceedance of its NPDES discharge criteria for chloroform and 1,1,2-TCA, and this was shortly after D-5 was brought on line. The site team has prevented further exceedances of the NPDES permit by throttling back D-5 and increasing the frequency of GAC changeout.
4.7 TREATMENT PROCESS EXCURSIONS AND UPSETS, ACCIDENTAL CONTAMINANT/REAGENT RELEASES
No specific incidents were reported during the RSE site visit.
4.8 SAFETY RECORD
No specific incidents were reported during the RSE site visit.
20

5.0 EFFECTIVENESS OF THE SYSTEM TO PROTECT HUMANHEALTH AND THE ENVIRONMENT
5.1 GROUND WATER
The only receptor for the site is the Hylebos Waterway. Contaminated ground water continues to discharge to the waterway as evidenced by the milky seeps and likely through other areas (primarily near WMU H). Preventing this discharge is a difficult task. Extraction near the waterway has been piloted but not implemented full time because of the high pH and the related rapid fouling of the wells with solids. Similarly, injection in this area also causes fouling, which reduces the amount of water that can be injected and therefore hampers the ability to create a hydraulic barrier between the bulk of the contamination and the waterway. Even if injection were feasible at greater volumes, contamination is apparently present between the injection wells and the waterway, and injection would be expected to push that contamination into the waterway.
5.2 SURFACE WATER
In addition to the discussion above, it is important to note that surface water represents the only known human exposure pathway for the site. Native Americans are known to fish in the Hylebos Waterway, and consumption of the fish could result in consumption of site-related contamination, particularly if bioaccumulation occurs. No noticeable impacts have been found in surface water, but fish may feed on organisms that live in the pore spaces or on the sediments, which have measurable VOC contamination. Contaminated sediments are still present at the site, and ground water is discharging through sediment pore space at concentrations above regulatory limits.
5.3 AIR
Although VOC concentrations at the site are high and the water table is relatively shallow, indoor air has not been raised as a concern at the site. The majority of the facility is outside, however, some buildings are present on site. The RSE team did not collect information regarding the construction of each building at the site and cannot further evaluate the potential for indoor air exposures. Areas of particular concern might include (but would not be limited to) those areas surrounding the following monitoring wells:
• 4R-25 (11,000 ug/L of PCE and 25,000 ug/L of TCE in August 2002) • 21-25R (5,400 ug/L of PCE and 3,800 ug/L of TCE in August 2002) • 53-25 (16,000 ug/L of PCE and 2,900 ug/L of TCE in August 2002)
5.4 SOILS
The majority of soils at the site are covered by concrete and asphalt and should not provide a route of exposure, unless trenching or other subsurface activities are conducted. The RSE team did not fully investigate the ground covering throughout the site.
21

5.5 WETLANDS AND SEDIMENTS
Sediments as a receptor are discussed above in Section 5.2. Much of the contaminated sediments at the site have been dredged, but some areas of contamination remain because not all areas were feasible to dredge. A sediment cap was planned along the entire embankment; however, subsequent to the RSE site visit, EPA noted that the site team (including OCC) agreed that the sediment planned cap for the embankment area would not chemically isolate or adequately attenuate VOC contaminated ground water. The site team is discussing how to approach sediment remediation.
22

6.1
6.0 RECOMMENDATIONS
Cost estimates provided herein have levels of certainty comparable to those done for CERCLA Feasibility Studies (-30/+50%), and these cost estimates have been prepared in a manner consistent with EPA 540-R-00-002, A Guide to Developing and Documenting Cost Estimates During the Feasibility Study, July 2000.
RECOMMENDATIONS TO IMPROVE EFFECTIVENESS IN PROTECTING HUMAN HEALTH AND THE ENVIRONMENT
The recommendations in this category primarily involve enhancing plume capture and improving the evaluation of plume capture. Enhancing plume capture to the east would reduce the discharge of contaminated water to the Hylebos Waterway, and complete plume capture in the other directions would prevent further migration of the plume toward the Blair Waterway. These recommendations are based on the following opinions of the RSE team.
• The current capture zone analyses are not reliable, primarily due to bias caused by the extensive use of water levels at operating injection and extraction wells and relative lack of water levels from monitoring wells or piezometers.
• With the substantial decrease observed in water injected through the injection wells, it is likely that the intended hydraulic barrier along the Hylebos Waterway is not effective and that further attempts to create a hydraulic barrier through injection would similarly not be effective.
• Capture to the north and west in the 25 and 50-foot interval is likely sufficient but the current capture zone evaluations do not credibly present this position.
• There is a degree of capture to the north in the 100-foot interval, but it is difficult to determine if it is sufficient due to a lack of water quality data in this area that precludes complete delineation.
In addition, it is the RSE team’s opinion that source removal actions along the waterway would likely be unable to completely remove the source. Based on sampling from monitoring well 14-50, contamination is present at more than 50 feet below ground surface and more than 25 feet below the water table during low tide. Based on sampling from monitoring well 1-100, DNAPL may be present at 100 feet below ground surface and more than 75 feet below the water table during low tide. The combination of the depth of the contamination, the extent of overlying saturated soil, the horizontal extent of the contamination, the steep embankment, the existing infrastructure, and the variable tide would make complete source removal extremely difficult and likely impracticable. The RSE is concerned that even after substantial source removal efforts, source material would still remain. Therefore, the RSE team generally favors a remedial approach that focuses on containment and best efforts to establish an inward gradient. The site team may, however, determine that source removal in spot locations may be beneficial. If the site team opts for source removal in spot locations, the RSE team would suggest piloting in-situ approaches rather than excavation that extends many feet below the water line.
23

6.1.1 ELIMINATE INJECTION SYSTEM AND USE EXTRACTION TO ENHANCE CAPTURE
Along the site boundary with the Hylebos Waterway, only two monitoring well pairs (non-injection wells) are present to indicate hydraulic gradients. These are the 4R/T1 pair and the T5/T6 pair. At the 25-foot interval, both of these pairs routinely suggest a gradient toward the Hylebos Waterway, suggesting the hydraulic barrier is ineffective. At the 50-foot interval the 4R/T1 pair also suggests a hydraulic gradient toward the waterway, but the T5/T6 pair suggests an inward gradient that favors capture. At the 100-foot interval, both well pairs show flow toward the waterway. Although injection may have originally been sufficient to create an effective hydraulic barrier, well fouling and reduced flow since 1996 have suggested that the current injection system is not adequate and that future injection systems will likely suffer from the same problems.
The RSE team envisions the following four primary strategies for improving containment in this direction, but only one of these appears practicable.
Rehabilitate the existing injection system and increase the injection rate (not recommended)
Rehabilitating the existing injection system will likely improve the injection rate; however, the wells are likely fouled to such a degree that the improvement will be small and insufficient. If rehabilitation is conducted, additional monitoring wells would be required to determine if a suitable hydraulic barrier is established. The addition and analysis of data from these wells is discussed in Section 6.1.4. The contaminant mass on the waterway side of the injection line would need to be remediated to prevent further discharge, or be allowed to discharge as it has since 1996. The elevated pH and associated solids fouling would likely hamper most remediation activities, including sparging, injection of nutrients, and extraction.
Install another injection system, perhaps with the use of a trench (not recommended)
This approach would involve trenching in the saturated zone. It would disrupt above-ground facility operations, and would have a limited influence at greater depths (as suggested in the extraction pilot test in 1994). This lack of influence at depth is a significant limitation and one of the primary reasons the RSE team does not recommend this approach. Furthermore, the same issues regarding additional monitoring wells and remediation of contaminant mass on the waterway side of the injection line would still apply. The trench itself would likely cost under $1 million.
Install sheet piling or some other impermeable barrier (not recommended)
This approach would have the same drawbacks as the injection trench with the added problem of needing to extend the sheet piling to approximately 200 feet to the nearest confining unit. If it is feasible to drive sheet pile to a depth of 200 feet given the surrounding infrastructure and waterway bank, the estimated cost for this type of approach would likely be approximately $5 million. Without meeting a confining unit, the potential would exist for water to discharge through the gaps between the sheet piling and the confining unit. As with the injection system, there would be a portion of the contaminated aquifer that would remain on the waterway side of the barrier. The RSE team believes that this approach offers little benefit in meeting site objectives.
Increase extraction to enhance inward gradients and provide capture (recommended)
In the opinion of the RSE team, increased extraction likely provides the most effective and efficient method for enhancing containment of the plume. The RSE team acknowledges that containment of the
24

plume up to the waterway boundary may not be provided at all portions of the tidal cycle, but based on the reviewed documents and the site visit, believes that this approach offers the greatest benefit to the site team.
• Increasing extraction will push the east/west flow divide further to the east.
• If complete containment is not provided, increasing extraction represents an improvement in reducing the discharge of contaminated water to the waterway.
• Increasing extraction will increase the overall amount of mass removal from the subsurface.
• Increasing extraction will make it easier to evaluate plume capture through the use of water levels and water budgets.
Efforts should be taken to extract additional water from areas with a pH less than 9.5 (extraction in areas with a higher pH is impracticable due to solids fouling) in the attempt to establish an inward gradient throughout the site. The first step to accomplishing this increased extraction is to rehabilitate and/or redevelop the existing extraction wells. Additional study would be needed to determine the capacity for increasing extraction from existing extraction wells and to determine the optimal locations and extraction rates for additional wells. If possible, some wells should likely be located near the Hylebos and others should likely be located in other areas that require enhanced extraction, and extraction at all depth intervals can be considered. Some wells, such as the southernmost wells in the C extraction branch, could also be taken off line to arrange for more capacity in other more pertinent areas.
Increasing extraction will require modifications to the treatment system, but such modifications would likely be required anyway given the inefficiency of the air stripper and the condition of the catalytic oxidizer. These modifications are discussed in Section 6.2.1. Though the RSE team believes that consistent pumping is preferred, the site team could consider varying the extraction rate with the tide, increasing the rate when the tide is low and decreasing the rate when the tide is high. The large influent tank should allow for this type of variation. As with the other approaches, additional monitoring points, especially along the waterway, would likely be necessary to demonstrate capture.
Adopting the enhanced extraction approach would require a modification to one of the remedy objectives in the RCRA permit (i.e., the first remedy objective listed in Section 3.1 of this report). The objective could potentially be reworded as follows:
extracting ground water at an average rate of 150 to 200 gpm from within the VOC plume boundary in a concerted attempt to establish an inward gradient from the waterway to the site as determined by hydraulic gradients measured from a series of monitoring well pairs located along the waterway, oriented perpendicular to the site, and screened at approximately 25, 50, and 100 feet below ground surface
The objective could be further clarified to state that extraction need not occur within an area with pH over 9.5 and that the “monitoring wells” refers to wells where routine extraction and injection do not occur. Further clarification could even include specific monitoring well pairs.
Enhancing extraction will require capital costs to rehabilitate/redevelop existing wells, to investigate other potential areas and depth intervals for new extraction wells, installing the new extraction wells, and connecting them to the current treatment system. The scope of work could vary and the cost for full implementation is difficult to estimate. The RSE team therefore only provides an estimated cost of $285,000 for the following assumptions:
25

6.1.2
• analyzing historical extraction well water levels and extraction branch pumping rates to determine those wells in greatest need of redeveloping and/or rehabilitating up to 20 wells ($50,000)
• analyzing plume maps and bi-annual slug test data to determine productive and practicable locations within the VOC plume (and preferably near the waterway) to add extraction wells ($15,000)
• adding two extraction wells for each of the three depth intervals for a total of 6 extraction wells ($120,000)
• connecting these wells to the pumping system with an assumed piping/trenching length of 1,000 feet and double-contained piping ($100,000)
Furthermore, the site team could consider developing a three-dimensional ground water flow model to help evaluate various pumping scenarios. The site is relatively complex. Developing and calibrating a ground water flow model would likely require substantial effort and might cost up to $50,000. Use of this model in conducting simulations would likely be an extra cost depending on how the model was used. However, using the model to assist in locating extraction wells could potentially reduce the number of wells installed and the associated costs. The estimated cost of $50,000 is not included in Table 7-1.
DISCONTINUE CURRENT APPROACH OF USING POTENTIOMETRIC SURFACE MAPS TO EVALUATE CAPTURE
Potentiometric surface maps are used to evaluate capture at this site, and this current approach has the following two primary complications that make it both unreliable and very expensive:
• The current capture zone analyses are not reliable, primarily due to bias caused by the extensive use of water levels at operating injection and extraction wells and relative lack of water levels from monitoring wells or piezometers.
• Because a potentiometric surface map requires site-wide water level data that are not biased by tidal influence, extensive effort is required to continuously measure water levels for a 72-hour period at 28 locations and to use the resulting data to eliminate the tidal influence from the site-wide data. The resulting potentiometric surface maps are not necessarily representative of net ground water flow and capture throughout the tidal cycle.
The RSE team suggests abandoning the effort to evaluate capture based on potentiometric surface maps and to use three alternative approaches to evaluate capture. These alternative approaches include the following:
• analysis of water quality data at sentinel wells, which is currently done at the site and reported in the performance reports but is further discussed in Section 6.2.2
• calculation of a water budget that compares ground water flow through the site with ground water extraction (discussed in Section 6.1.3)
• use of monitoring well or piezometer pairs to demonstrate inward gradients along the plume boundaries (discussed in Section 6.1.4)
26

Implementing this recommendation would involve substantial cost savings that may be as high as $125,000 per year if approximately half of the current $250,000 of sampling and reporting cost is devoted to collection and interpretation of site-wide and continuous water level measurements. This recommendation, however, is provided in the context of protecting human health and the environment because the RSE team believes that the current approach to evaluating capture is unreliable, and in many cases, misleading.
6.1.3 CONDUCT AND REPORT A WATER BUDGET ANALYSIS
Although the site team referred to a water budget analysis during the RSE site visit, such an analysis does not appear to be conducted regularly and is not reported in the quarterly or annual performance reports. An analysis was conducted as part of the 1996 Corrective Action Plan, which suggested approximately 14 gpm would be needed for capture. The O&M data (e.g., the water level information discussed in Section 4.2.1) suggests that this is likely low and that the analysis should be repeated given the improved understanding of the site. A demonstration that more water is extracted from the plume than flows through the area requiring capture would support plume capture. It is generally agreed that flow through this site is provided both through infiltration of precipitation and through contributions from the underlying aquifers. With the initiation of pumping, water is also recharged from the surrounding horizontal areas (providing inward gradients). With injection, water is also recharged through the injection wells.
The analysis should include a revised calculation of the amount of recharge provided through the surface and from the underlying formations. This recharge should then be compared to the extraction rate. As a rule of thumb, it would be preferable for the extraction rate to exceed the recharge rate by a factor of 1.5 to 2.0. The necessary information is already collected. Infiltration could be estimated from local weather information and surface cover. Recharge from the underlying formations could be calculated with Darcy’s Law using estimated vertical gradients between the 100-foot and 50-foot intervals and an appropriate hydraulic conductivity. The RSE team suggests using the lower estimate of the horizontal hydraulic conductivity (approximately 10-4 cm/s). Simulations with the ground water flow model mentioned in Section 6.1.1 could be used in place of this water budget analysis.
As stated by the site contractor, this approach is one of the most straightforward methods of evaluating capture at this site. The RSE team estimates that these evaluations should not add significantly to the current annual evaluation and reporting costs since the majority of the work is already done but not discussed in the reports.
6.1.4 INSTALL ADDITIONAL MONITORING WELLS AND USE PAIRS OF MONITORING WELLS TO DEMONSTRATE CAPTURE WITH INWARD GRADIENTS
Comparing water levels from monitoring well pairs (two nearby monitoring wells) helps determine the direction of ground water flow in that area. This is particularly useful at the plume boundary because an inward gradient supports capture in that area. By monitoring gradients at well pairs along the entire plume boundary, the capture of the entire plume can be evaluated without generating potentiometric surface maps. A number of such monitoring well pairs are located around the site and can be used. The RSE team notes the following existing well pairs that may be useful for this approach:
• eastern plume boundary: T1/T3, T6/T5 • southern plume boundary: none • southwestern boundary: 8/45, 25/25A, 8/55, 36/56, 36/57
27

• western boundary: 35/44 • northwestern boundary: 34/43, 12/12A • northern boundary: 40A/40
Based on these current well pairs there are significant gaps, primarily along the eastern boundary. Approximately 15 piezometers (to be used for measuring water levels only and likely not for sampling ground water quality) could be added as follows:
• a piezometer cluster located west of (and to be paired with) the monitoring well 2 cluster with screened intervals at 25, 50, and 100 feet bgs
• two piezometer clusters located between E-7 and E-8 and perpendicular to the embankment with screened intervals at 25, 50, and 100 feet bgs
• two piezometer clusters located near E-3/E-3A and perpendicular to the embankment with screened intervals at 25, 50, and 100 feet bgs
These additional piezometers provide a total of 14 well-pair locations with three depth intervals per well pair (a total of 42 well pairs or 84 wells). Water levels in these well pairs could be measured and compared in order to determine the flow direction of ground water at the plume boundaries. Because using well pairs is a new approach for this site, the RSE team suggests a quarterly frequency for the first year and a semi-annual frequency thereafter. A further decrease in the sampling frequency to annual events could be implemented if data from the quarterly and semi-annual events support a further reduction.
Because this approach is based on one water level relative to only one other nearby water level, the water level measurements from a particular well pair can be taken nearly simultaneously. Because there is little or no time difference between the two water level measurements from a single well pair, the measurements do not need to be corrected for tidal influence. However, steps should be taken to demonstrate inward gradients at each well pair throughout the tidal cycle. For each gauging event, the water levels for a particular well pair should be measured at least four times evenly spaced over the course of 24 hours (e.g., a measurement every 6 hours). This could involve three shifts of two to four individuals each working one 8-hour day or two shifts of two to four individuals each working a 12-hour day.
The water levels from many of the well pairs will likely show an inward gradient for all portions of the tidal cycle, confirming capture. For the well pairs along the Hylebos Waterway, an inward gradient may be maintained for portions of the tidal cycle (i.e., during increasing tide and high tide, and perhaps the decreasing tide); however, it will likely be impossible to maintain an inward gradient over the entire tidal cycle. In general, the hope is that the multiple measurements will indicate a net flow of ground water directed inward. This information should not only be used to evaluate capture but should also be used to potentially optimize the remedy in the future.
Over time, the site team may be able to correlate successful or adequate capture with certain extraction rates. This correlation could be useful in helping the site team determine if capture is adequate. If the extraction rate falls below the minimal rate where capture is adequate, then the site team will know that increased extraction is necessary, perhaps through rehabilitation of existing wells or the addition of new wells. Although this type of correlation is helpful, the RSE team does not suggest that the team rely on it for evaluating capture. Over time, hydrogeologic conditions may change due to regional changes in infiltration or pumping, which would invalidate the capture/extraction rate correlation.
28

The estimated capital cost for installing the new piezometers is approximately $90,000 based on an estimated cost of $100 per foot drilled and should include associated work plans, health and safety plans, and reporting. The RSE team notes, however, that the responsible party could better estimate this cost based on the previous costs of installing monitoring wells at this site. The annual costs of implementing this well-pair monitoring approach would be approximately $36,000 in the first year and $18,000 in the following years. For each gauging event, this assumes approximately $3,000 per 8-hour day for three technicians and equipment multiplied by three to account for the rotating shifts over the course of 24 hours. Compared to the estimated annual cost of $125,000 per year (assuming one half of the $250,000 sampling/reporting cost), this recommendation represents a net savings. Additional savings could be realized if the site team is successful in using pressure transducers to automatically collect information over the tidal cycle during each event. Historically, the site team has had difficulty with automated water levels due to corrosion and fouling; however, there may be some locations where transducers can be used during the event to eliminate the need for multiple shifts throughout a 24-hour period.
In Table 7-1, the first year cost is considered a capital cost of $36,000 and the other years are assigned an annual O&M cost of $18,000. Recommendation 6.1.2 already accounts for the reduction of $125,000 associated with discontinuing the current well gauging approach; therefore, implementation of this recommendation is considered a cost rather than a cost savings.
6.1.5 DELINEATE THE VOC PLUME TO THE NORTH AT THE 100-FOOT DEPTH INTERVAL
Ground water quality data from monitoring wells 40A-100 (7,100 ug/L vinyl chloride in August 2002) and 41-138 (12,000 ug/L vinyl chloride in November 1996 and 63 ug/L vinyl chloride in August 2002) suggest that contamination is not delineated to the north. As stated previously in this report, 40A-100 is likely within the capture zone of A-2A and contamination 41-138 is likely diluted by injection from E-1. The site team should discuss the merits of delineating beyond 40A-100 and 41-138 to determine the true extent of contamination and the potential need to expand the extraction network to the north. The RSE team estimates that a total of four additional monitoring wells at approximately 100 feet will be required to delineate contamination in these areas.
The estimated cost for implementing this recommendation is approximately $50,000 based on an estimated cost of approximately $100 per foot drilled. This estimated cost includes the cost for developing a work/health and safety plans, conducting two rounds of sampling, and reporting the results. The RSE team notes, however, that the responsible party can better estimate these costs based on previous costs for monitoring well installation and sampling.
6.1.6 CONSIDER INSTITUTIONAL CONTROLS AND A PRELIMINARY VAPOR EVALUATION
To prevent potential future exposures to site-related contamination, the site team should consider implementing institutional controls for the site and surrounding properties. The controls could likely consist of notices attached to the relevant property deeds describing the contamination and the potential routes of exposure. The purpose is to notify current and future property owners of the existing contamination so that workers are not exposed to contaminated ground water, soil, or vapor.
The site team should also consider evaluating the potential for vapor intrusion into site buildings. Significant VOC contamination exists at shallow depths, and some buildings on or off site may be affected. The RSE team suggests that the site team identify all buildings overlying the plume and determine the ventilation information, construction, and uses of those buildings. This collected information should then be reviewed to determine the need for further vapor intrusion evaluations.
29

The RSE team estimates that implementing the institutional controls and the preliminary vapor intrusion work might require a one-time cost of approximately $30,000.
6.2 RECOMMENDATIONS TO REDUCE COSTS
6.2.1 ADD A SECOND AIR STRIPPER IN SERIES AND ELIMINATE THE USE OF GAC
The ability of the current system to remove mass is limited by the efficiency of the air stripper. The relatively low efficiency requires frequent GAC changeouts and a reliance on the GAC to meet discharge standards, especially the 1,1,2-TCA standard.
The existing air stripper VOC removal efficiency is lower than the design values causing the GAC vessels to remove VOCs in order to meet the discharge requirements. This has resulted in an increased cost for GAC changeouts and an increased reliance on manual GAC unit backwashes, which require substantial operator time. The air stripper efficiency should be improved with a goal of bypassing the GAC vessels mainly to eliminate change out costs. Bypassing the GAC vessels will also reduce operator labor and reduce generated solids.
Vendor literature indicates that additional modules might be added to the existing system to improve efficiency, but with increased extraction and likely an increased influent concentration, this will not likely be sufficient. The RSE team suggests the use of two tray type strippers arranged in series. The first unit would remove over 99% of the contaminant mass and send that mass to the catalytic oxidizer. The second unit would have a very high air flow rate and would act as a polishing stage for the more recalcitrant contaminants, such as 1,1,2-TCA.
Both air strippers should be rated for at least 200 gpm. The existing air stripper is likely sufficient to serve as the first air stripper, but, for illustration purposes, the RSE team presents this dual air stripper approach with two new CarbonairTM models. The RSE team is not necessarily recommending CarbonairTM models. Other air stripper brands, including North East Environmental ProductsTM, could provide similar results. According to the Carbonair software, the first stripper should have six trays and an air to water ratio of 24:1 (i.e., 650 cfm of air flow for 200 gpm of water flow). The second unit should also have six trays but should have an increased air to water ratio of 67:1 (i.e., 1,800 cfm of air flow for 200 gpm of water flow). The first unit should only require a 10 HP blower, and the second unit would require a 20 HP blower. The following table provides the stripper influent concentrations from June 2003, the calculated effluent for each constituent from the first air stripper, the calculated effluent for each constituent from the second air stripper, the mass removal rate for the second air stripper, and the effluent criteria.
Parameter June 2003 Stripper Influent
(ug/L)
1st Air Stripper Effluent
(ug/L)
2nd Air Stripper Effluent
(ug/L)
NPDES Criteria (ug/L)
2nd Air Stripper
Mass Removal (lbs/day)
Vinyl chloride 3,032 1.6 0.0 NA 0.00
1,1-Dichloroethylene 100 0.2 0.0 5 0.00
Methylene Chloride 600 105 1.3 185 0.25
t-1,2-Dichloroethylene 500 15 0.0 NA 0.04
30

Parameter June 2003 Stripper Influent
(ug/L)
1st Air Stripper Effluent
(ug/L)
2nd Air Stripper Effluent
(ug/L)
NPDES Criteria (ug/L)
2nd Air Stripper
Mass Removal (lbs/day)
c-1,2-Dichloroethylene 17,280 927 2 NA 2.22
Chloroform 3,020 182 0.5 75 0.44
Carbon tetrachloride 100 0.3 0.0 10 0.00
Trichloroethylene 11,908 140 0.1 440 0.34
1,1,2-Trichloroethane 100 40 3.2 5 0.09
Tetrachloroethylene 1,304 9.5 0.0 50 0.02
1,1,2,2-Tetrachloroethane 100 76 35 180 0.10
Totals 38,044 1,495 41.9 NA 3.50
As demonstrated in the table, these two air strippers would allow the treatment plant to reliably meet all of its discharge criteria, even at the extremely high influent concentrations recorded in June 2003 and an extraction rate of 200 gpm. A stripper with a higher air flow rate could also be used for the first unit (such as one that provides a 34:1 air to water ratio with 900 cfm of air flow) provided that the current or eventual replacement catalytic oxidizer can handle the additional flow. Based on the data provided in the table, the off gas from this polishing stage would contain less than 3.5 pounds of total VOCs per day (of which 2.2 pounds per day is cis-1,2-DCE). Under any national regulations, this emission rate should not require treatment; however, local air regulations may differ and should be considered by the site team. Using the current air stripper as the first unit, the ground water effluent concentration would likely be much less than that in the table, and the emission rate from the second/polishing unit would likely be under 1 pound per day.
With this approach, the current system for treating off gas can be used, and the tray strippers would likely only require monthly or bimonthly cleaning. The GAC and the time consuming backwashing could be eliminated, which would substantially reduce operator labor and offer minor savings associated with sludge disposal. The logical choice is to use the current air stripper as the first unit in this two-air stripper system, and to replace that unit only when necessary. Making this choice, the second air stripper could be purchased for about $50,000. With installation, the capital investment would be approximately $150,000. Eliminating GAC vessel changeouts would save about $80,000 per year. The electrical costs would be increased by approximately $10,500 per year (20 HP at $0.06 per kWh) unless the current air stripper effluent pump is downsized. The monitoring of the system influent and the influent and the effluent from the first stripper could be reduced to monthly. The system effluent monitoring would need to remain at weekly per the discharge permit. Therefore, the total number of VOC process samples (including QA/QC) should be approximately 152 rather than 312, representing a savings of at least $16,000. Operator labor could possibly be reduced to one full time employee, which would represent a cost savings of approximately $75,000 per year.
MODIFY GROUND WATER MONITORING PROGRAM
Ground water cleanup at this site will take several decades; therefore, sampling within the plume on a frequent basis provides extraneous information. The ground water monitoring program should be tailored to evaluate capture on a quarterly or semi-annual basis. Monitoring for plume cleanup can be conducted on an annual or biannual basis from a limited number of wells. If the site nears cleanup in the
31
6.2.2
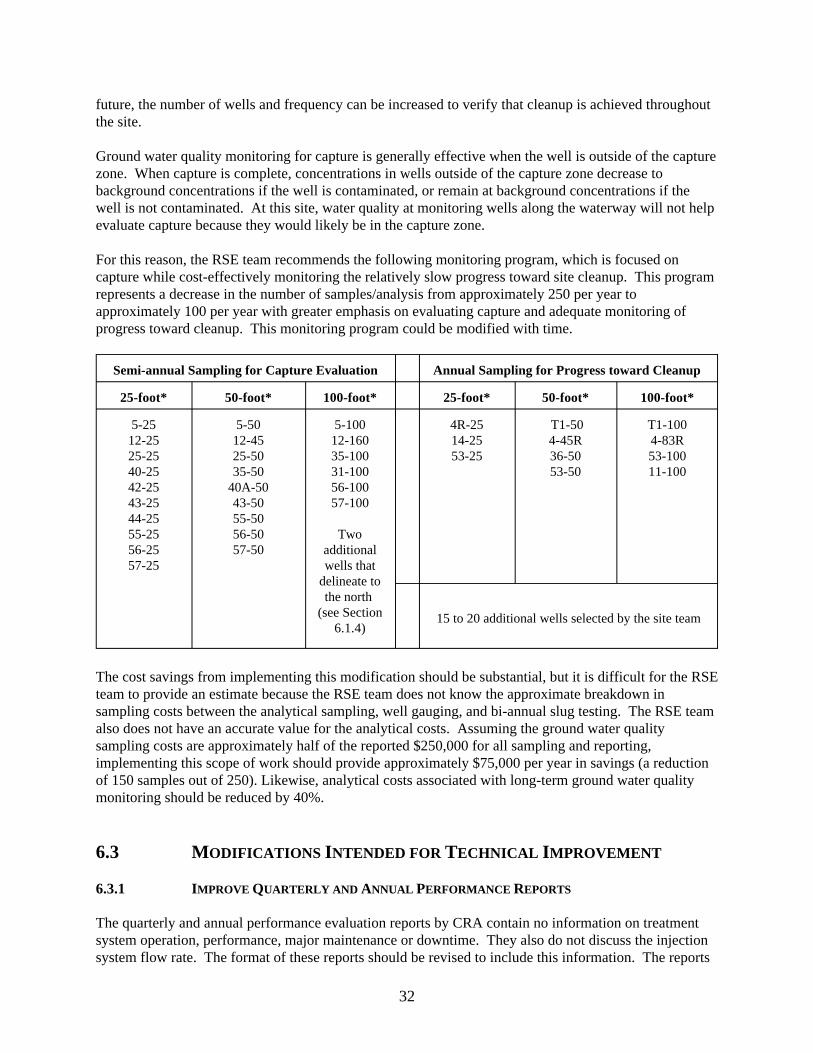
future, the number of wells and frequency can be increased to verify that cleanup is achieved throughout the site.
Ground water quality monitoring for capture is generally effective when the well is outside of the capture zone. When capture is complete, concentrations in wells outside of the capture zone decrease to background concentrations if the well is contaminated, or remain at background concentrations if the well is not contaminated. At this site, water quality at monitoring wells along the waterway will not help evaluate capture because they would likely be in the capture zone.
For this reason, the RSE team recommends the following monitoring program, which is focused on capture while cost-effectively monitoring the relatively slow progress toward site cleanup. This program represents a decrease in the number of samples/analysis from approximately 250 per year to approximately 100 per year with greater emphasis on evaluating capture and adequate monitoring of progress toward cleanup. This monitoring program could be modified with time.
Semi-annual Sampling for Capture Evaluation Annual Sampling for Progress toward Cleanup
25-foot* 50-foot* 100-foot* 25-foot* 50-foot* 100-foot*
5-25 5-50 5-100 4R-25 T1-50 T1-100 12-25 12-45 12-160 14-25 4-45R 4-83R 25-25 25-50 35-100 53-25 36-50 53-100 40-25 35-50 31-100 53-50 11-100 42-25 40A-50 56-100 43-25 43-50 57-100 44-25 55-50 55-25 56-50 Two 56-25 57-50 additional 57-25 wells that
delineate to the north
(see Section 6.1.4)
15 to 20 additional wells selected by the site team
The cost savings from implementing this modification should be substantial, but it is difficult for the RSE team to provide an estimate because the RSE team does not know the approximate breakdown in sampling costs between the analytical sampling, well gauging, and bi-annual slug testing. The RSE team also does not have an accurate value for the analytical costs. Assuming the ground water quality sampling costs are approximately half of the reported $250,000 for all sampling and reporting, implementing this scope of work should provide approximately $75,000 per year in savings (a reduction of 150 samples out of 250). Likewise, analytical costs associated with long-term ground water quality monitoring should be reduced by 40%.
6.3 MODIFICATIONS INTENDED FOR TECHNICAL IMPROVEMENT
6.3.1 IMPROVE QUARTERLY AND ANNUAL PERFORMANCE REPORTS
The quarterly and annual performance evaluation reports by CRA contain no information on treatment system operation, performance, major maintenance or downtime. They also do not discuss the injection system flow rate. The format of these reports should be revised to include this information. The reports
32

should also be modified to discuss the containment/capture as detailed in Sections 6.1.2, 6.1.3, and 6.1.4. The RSE team estimates that implementing this recommendation might cost an additional $10,000 per year with an extra $5,000 for the first report, with the change in cost primarily due to the addition of the treatment plant information.
6.3.2 CONSIDER ABANDONING AND NOT REPLACING THE SLUDGE DRYER WHEN IT FAILS
Solids removal and associated sludge handling are necessary at this site, especially when extraction wells closer to the high pH (and highest VOC) areas are pumped. However, the volume of solids removed of about 200 lbs/day of sludge is significantly less than the original design value of 13 tons/day as dry solids. The current system includes a plate and frame filter press that replaced a belt press (an effective optimization effort by the site). The original sludge drier is still used even though it would not be warranted unless it were already in place. Since it requires relatively little energy, it is reasonable to continue using it. Removal of the unit should be considered if any major maintenance is required. The plate and frame press use should continue because the alternative of collecting the sludge in a thickener tank and having it processed by a mobile service is not feasible due to the large volume of dilute sludge. Maintaining the filter press also allows the flexibility of handling additional solids if extraction wells are added. The cost savings from implementing this recommendation is likely negligible.
6.4 CONSIDERATIONS FOR GAINING SITE CLOSE OUT
6.4.1 CONSIDERATIONS FOR AN EXIT STRATEGY
Although P&T will take decades (or possibly centuries) to reach clean-up goals, the P&T approach has the potential to provide plume capture that cannot be duplicated by other technologies. In many P&T systems, contaminant removal technologies such as sparging, bioaugmentation/biostimulation, chemical oxidation, thermal technologies and excavation can be used for source removal to lessen the operating life span of a P&T system. However, this site has a plume that occupies a very large volume of the subsurface (over 20 acres and over 100 feet deep) with extremely high VOC concentrations and substantial infrastructure at the surface. In addition, for large portion of the plume, the water table is close to the surface preventing the use of soil vapor extraction that might accompany a sparging system. It is doubtful that other technologies could be applied to the site and provide any meaningful remediation (i.e., remediation that would significantly shorten the time to cleanup) for less than $50 million because removing only a portion of the source material would not substantially reduce the duration of the remedy. The limitations of a few common technologies are provided below.
• Sparging/SVE or ground water recirculation: Fouling problems would likely occur and insufficient room is available to extract the sparged vapors in the unsaturated zone. Even if sparging were possible, about 400 sparge wells would likely be required at a 25 foot radius of influence with air lines and vapor extraction lines, and this would likely only apply to the 25-foot and possibly the 50-foot depth intervals. This installation is infeasible at an operating facility.
• Bioremediation/Bioaugmentation: Distributing the amount of nutrients throughout the subsurface would be impracticable based on the water injection problems as has been noticed with the injection wells. Also, the concentrations indicate significant residual DNAPL mass which would not degrade readily and would require a substantial amount of nutrient that is difficult to inject.
33

6.4.2
• Chemical Oxidation: As with bioaugmentation and air sparging, distributing oxidizing chemicals would require a substantial subsurface network that is infeasible at an operating facility. Millions of pounds of chemicals would be necessary due to the substantial contaminant mass, and injection would be hampered by fouling.
• Thermal Technologies: Thermal heating technologies are extremely expensive due to energy use. The RSE team has seen six-phase heating pilot tests with approximate costs of $150 per cubic yard and higher. This unit cost would translate to over $100 million for only a portion of the plume. In addition, an SVE system would be required to capture the VOC off gas from heating the saturated zone. As mentioned previously, SVE would not be effective with the limited unsaturated zone.
Rather than experimenting with these other technologies, the RSE team would support the installation and operation of additional extraction wells to enhance capture and increase mass removal. The capital costs would likely be much smaller than the above options, and the annual costs for P&T O&M will be required for containment regardless. The RSE team notes that other technologies may develop over time that may be applicable to this site. These technologies could be evaluated at that time.
ADDRESS PLUME AND SOURCE CONTROL PRIOR TO INSTALLING A SEDIMENT CAP
At the time of the RSE site visit, sediment removal along the Hybelos Waterway bank in the 5106 area had been accomplished and a sediment cap is planned. During the site visit, EPA Superfund expressed concern that the cap would be recontaminated by ground water if it is installed or adversely affected due to solids fouling associated with the high pH. The RSE team shares this concern and recommends delaying cap installation until the pumping rate is increased as suggested in Section 6.1.1 and the degree of plume capture has been evaluated as described in Sections 6.1.2, 6.1.3, and 6.1.4. Subsequent to the RSE site visit, EPA noted that the site team (including OCC) agreed that the cap would not chemically isolate sediments or discharging ground water that are contaminated by VOCs.
If containment along the waterway cannot be provided through extraction alone, as described in Section 6.1.1, other technologies would be required to remove mass along the waterway such that the plume is drawn back from the waterway and can be captured by extraction. This mass removal would be difficult to achieve as demonstrated by the dredging activity where some hot spots could not be reached due to infrastructure and the steep slope of the embankment. These same types of limitations would also likely apply to other technologies that may be applied nearby. Although some mass might be removed, other mass would likely persist in some areas. With respect to WMU H, further excavation would likely provide little benefit, since the area was already excavated to the water table. The majority of mass has likely already migrated downward into the saturated zone and removing only a portion would not be beneficial if substantial mass is left in place.
Therefore, it appears impracticable to guarantee that a new sediment cap will not become contaminated unless a constant inward gradient can be established. As improvements are made to the P&T system, the Superfund Program can consider the degree of capture and the benefits of installing the cap or selecting another remedial approach. The site team may determine that the benefits of covering the existing hot spots may greatly outweigh the potential drawbacks of limited recontamination.
34

6.5 SUGGESTED APPROACH TO IMPLEMENTATION
The RSE team would recommend proceeding with recommendations 6.1.2, 6.1.3, 6.1.4, 6.1.5, 6.2.1, 6.2.2, 6.3.1, and the analysis part of 6.1.1 immediately and concurrently. Evaluation of capture under current conditions using the recommended approaches might better inform the site team of areas where additional extraction is most needed. While capture under current conditions is evaluated, the treatment system can be improved to accommodate the increased flow. Once the treatment system can better accommodate the increased capacity, recommendation 6.1.1 can be fully implemented and capture can be reevaluated on an ongoing basis as recommended.
At this point, which may be one or two years from the time of the RSE site visit, Superfund could better evaluate the conditions for sediment remediation given the improved understanding of ground water flow under enhanced extraction/capture (6.4.2). Recommendation 6.1.6 should be implemented prior to full-scale operations at the Pioneer Americas plant, and recommendations 6.3.2 and 6.4.1 are for long term consideration.
The effectiveness recommendations provided in this report focus on the VOC plume but consider the elevated pH. As described in Section 6.1.1, the RSE team suggests approaching the VOC plume by increasing extraction in an attempt to create an inward gradient that captures the plume. This inward gradient might also capture the elevated pH. The RSE team recommends that extraction take place in areas with a pH less than 9.5 to reduce problems with fouling. Over time, the elevated pH may migrate toward the extraction wells, but historical data suggests that migration of the elevated pH is minimal, and the natural buffering capacity of the soil should offer a degree of protection to these extraction wells. If the site has to inject reagents to neutralize the elevated pH to protect the extraction wells, the mass of reagents needed and the degree of fouling might be lower than attempting to neutralize the pH source area.
35

7.0 SUMMARY
The observations and recommendations contained in this report are not intended to imply a deficiency in the work of either the system designers or operators but are offered as constructive suggestions in the best interest of the EPA and the public. These recommendations have the obvious benefit of being formulated based upon operational data unavailable to the original designers.
Recommendations are provided in all four categories: effectiveness, cost reduction, technical improvement, and site closeout. Recommendations for effectiveness are primarily focused on enhancing capture and improving the plume capture evaluations. Recommendations for cost reduction include adding a second air stripper in series to eliminate the need for GAC and solids handling. They also include modifications to the process monitoring and ground water monitoring programs. The technical improvement recommendations include improving the performance report and avoiding replacement of the sludge drier when it eventually fails. The recommendations for site closeout document the RSE team’s positions on the use of alternative technologies at this site and the implications of the RSE recommendations on the remediation of sediments under the Superfund Program.
Table 7-1 summarizes the costs and cost savings associated with each recommendation in Sections 6.1 through 6.4. Both capital and annual costs are presented. Also presented is the expected change in life-cycle costs over a 30-year period for each recommendation both with discounting (i.e., net present value) and without it.
36

Table 7-1. Cost Summary Table (Part 1 of 2)
Estimated Estimated Estimated Estimated Additional
Capital Costs
Change in Annual Costs
Change In Life-cycle
Costs
Change In Life-cycle
CostsRecommendation Reason ($) ($/yr) ($) 1 ($) 2
6.1.1 Eliminate Injection System and Use Extraction to Effectiveness $285,000 negligible $285,000 $285,000 Enhance Capture
6.1.2 Discontinue Current Approach of Using Potentiometric Surface Maps
Effectiveness negligible ($125,000) ($3,750,000) ($2,018,000)
to Evaluate Capture
6.1.3 Conduct and Report a Water Budget Analysis
Effectiveness negligible negligible negligible negligible
6.1.4 Install Additional Monitoring Wells and Use Pairs of Monitoring Wells to Effectiveness $126,000 $18,000 $666,000 $417,000 Demonstrate Capture with Inward Gradients
6.1.5 Delineate the VOC Plume to the North at the Effectiveness $50,000 negligible $50,000 $50,000 100-foot Depth Interval
6.1.6 Consider Institutional Controls and a Preliminary Effectiveness $30,000 negligible $30,000 $30,000 Vapor Evaluation
6.2.1 Add a Second Air Stripper in Series and Eliminate the Use of GAC
Cost Reduction
$150,000 (>$160,000) (>$4,650,000) (>$2,432,000)
6.2.2 Modify Ground Water Monitoring Program
Cost Reduction
$0 (>$75,000) (>$2,250,000) (>$1,211,000)
6.3.1 Improve Quarterly and Annual Performance Reports
Technical Improvement
$5,000 $10,000 $305,000 $166,000
6.3.2 Consider Abandoning and not Replacing the Sludge Dryer
Technical Improvement
$0 unquantified
decrease unquantified
decrease unquantified
decrease when it Fails
37

Table 7-1 Cost Summary Table (Part 2 of 2)
Recommendation Reason
Estimated Additional
Capital Costs
($)
Estimated Change in
Annual Costs ($/yr)
Estimated Change
In Life-cycle Costs ($) 1
Estimated Change
In Life-cycle Costs ($) 2
6.4.1 Considerations for an Exit Strategy
Site Closeout $0 $0 $0 $0
6.4.2 Address Plume and Source Control Prior to Installing Sediment Cap
Site Closeout $0 $0 $0 $0
Costs in parentheses imply cost reductions.1 assumes 30 years of operation with a discount rate of 0% (i.e., no discounting)2 assumes 30 years of operation with a discount rate of 5% and no discounting in the first year

FIGURES