remediation focused feasibility study draft natural ... · selected remedies included in-situ...
TRANSCRIPT

2890 E. Cottonwood Parkway TEL 801 617 3200 Suite 300 FAX 801 617 4200 Salt Lake City, Utah 84121 www.mwhglobal.com
February 2, 2016 Mr. Sam Garcia USEPA - Region VIII 1595 Wynkoop Street Denver, CO 80202 Mr. Tony Howes Utah Department of Environmental Quality 168 North 1950 West Salt Lake City, UT 84116 SUBJECT: Wasatch Chemical Site Progress Report No. 104 Dear Sam and Tony: This semiannual report was prepared by MWH to summarize environmental remediation activities conducted at the Wasatch Chemical Site (Site) in Salt Lake City, Utah from June through December, 2015. Primary activities conducted during this reporting period include routine semiannual groundwater monitoring, well and piezometer abandonment, and indoor air sampling. This progress report includes the following sections:
1.0 Site Background and Summary of Progress 2.0 Activities Conducted During Current Reporting Period 3.0 Routine Groundwater Monitoring Results 4.0 Shallow Groundwater Analytical Data Evaluation 5.0 Deeper Groundwater Analytical Data Evaluation 6.0 Groundwater Natural Attenuation Assessment 7.0 Recommendations 8.0 Deliverables Submitted During Current Reporting Period 9.0 Actions to be Completed During Next Reporting Period
The November 2015 groundwater data verification report and historical time series groundwater data are attached as Appendices A and B, respectively. December 2015 indoor air sampling data will be presented and evaluated in a separate report (Draft Indoor Air Sampling Report), scheduled to be submitted to the regulatory agencies in February 2016. 1.0 SITE BACKGROUND AND SUMMARY OF PROGRESS A number of remedial actions have been implemented at the Site since 1985, for both soils and groundwater. A brief summary of background information and highlights of environmental remediation history at the Site are provided in this section; however, for a more thorough presentation of Site history refer to historical documents such as the Record of Decision (USEPA,

Page 2 of 16
1991), the Fourth Five-Year Review Report (USEPA, 2012), the Remedial Action Completion Report (Interstate Land Company, 1998) and the Draft Wasatch Chemical Site Natural Attenuation Evaluation (MWH, 2011). 1.1 History Beginning in 1957 the Site was used for producing, packaging, and distributing industrial chemical products such as pesticides, herbicides, fertilizers, industrial chemicals, and cleaners. A remedial investigation was conducted in the late 1980s and a feasibility study for both soil and groundwater remediation alternatives was completed in August 1990 (Harding Lawson, 1990 and 1990a). Selected remedies included in-situ vitrification of soils and sludges, landfarming of hydrocarbon contaminated soils, and extraction and treatment of contaminated shallow groundwater. A Record of Decision (ROD) (USEPA, 1991) and Consent Decree (U.S. District Court, 1991) were signed in 1991. The Site was added to the National Priorities List in 1991 and continues to be federally regulated under the Comprehensive Environmental Response, Compensation, and Liability Act (CERCLA). The United States Environmental Protection Agency (USEPA) and Utah Department of Environmental Quality (UDEQ) certified completion of the land farm remedy for soils in January 1994 and the in-situ vitrification remedial action work in May 1996 (Interstate Land, 1998). Shallow groundwater remediation and monitoring has been ongoing since 1995. Performance standards for shallow groundwater remediation at the Site are outlined in the Site Consent Decree (U.S. District Court, 1991) and state that “indicator chemical” concentrations are to be reduced to established drinking water maximum contaminant levels (MCLs), or proposed Alternative Performance Standards. Additionally, concentrations were to be reduced within the first five years of remediation by at least 50 percent of baseline concentrations established at the beginning of the groundwater remedial action (March 1995). Groundwater remediation “indicator chemicals” identified in the ROD (USEPA, 1991) as performance monitoring parameters include tetrachloroethene (PCE), trichloroethene (TCE), 1,1-dichloroethene (1,1-DCE), pentachlorophenol (PCP), and 2,4-dichlorophenoxyacetic acid (2,4-D). 1.2 Shallow Groundwater Remediation Progress Concentrations of indicator chemicals in shallow groundwater (down to 25 feet below ground surface) have decreased by two and three orders of magnitude since 1995 as more than 99 percent of the estimated dissolved contaminant mass in the shallow groundwater was estimated to have been removed by 2011 (Progress Report No. 95 [MWH, 2011a]). The 50 percent reduction requirement for shallow groundwater has been met for all monitoring locations and indicator chemicals established in the ROD. Groundwater concentrations of 2,4-D reached the performance standard (MCL) across the Site by 1996, and as approved by the regulatory agencies, this indicator chemical has not been monitored since 2004. Significant progress has been made towards stabilizing the shallow groundwater plumes at the Site. Statistical analyses conducted for data collected through April 2015 indicate concentrations of the remaining groundwater indicator chemicals across the Site are either below MCLs, or above MCLs and stable (MWH, 2015). Foreseeing potential difficulties in meeting performance standards with pump-and-treat technology, the Site Consent Decree (U.S. District Court, 1991, Section VII, part 17) provides an avenue to “waive or modify” groundwater treatment performance standards that are demonstrated to be “technically impracticable from an engineering perspective” to achieve. To

Page 3 of 16
provide justification, the Consent Decree requires a demonstration for each contaminant for which a waiver or modification is sought that illustrates contaminant concentrations remain “at statistically significant asymptotic values above MCLs” for at least the eight most recent data points. 1.2.1 Best Efforts As outlined in the Site Consent Decree, “best efforts” to attain MCLs have been made to “maximize the performance of the shallow groundwater Remedial Action to attain the performance standards” (U.S. District Court, 1991). At the Site, “best efforts” have included implementation of three different groundwater remediation technologies:
Groundwater extraction and treatment (including operation of extraction wells and trenches and modified system operations such as pulse pumping)
Monitored natural attenuation (MNA)
Enhanced biodegradation. 1.2.1.1. Groundwater Extraction and Treatment. An active pump-and-treat remedy was implemented for eight years until significant mass removal was no longer occurring and a period of MNA was approved by the USEPA. The history and performance of that system are included in progress reports submitted from 1995 to 2003. 1.2.1.2. Monitored Natural Attenuation. MNA was implemented beginning in 2003 to assess whether natural biodegradation processes could successfully decrease remaining contaminant mass in the shallow groundwater. Data collected since the groundwater extraction and treatment system was shut down in 2003, including the presence of degradation products that were not released at the Site (e.g., DCE isomers and vinyl chloride [VC]), indicate natural attenuation of chlorinated solvents has occurred and continues to occur at the Site. Since 2003, all indicator chemicals established in the ROD plus VC have been monitored and time series data evaluated. This list of chemicals (PCE, TCE, 1,1-DCE, VC, and PCP) is referred to as the primary constituents of concern (COCs) hereafter in this report. 1.2.1.3. Enhanced Biodegradation. In an effort to accelerate the degradation of chlorinated hydrocarbons at the Site, biodegradation enhancing products were injected near monitoring points across the core of the plume in 2004 and 2006, and monitoring was conducted to assess whether biodegradation was impacted as a result. Results from these pilot tests indicate substantial mass reductions of the COCs in portions of the aquifer with relatively higher permeability (such as the two gravel-filled extraction trenches), but very limited impact in the prevalent native silts and clays of the Site (Progress Report No. 89 [MWH, 2008]). 1.2.2 Focused Feasibility Study for Shallow Groundwater Due to the demonstrated limitations of the pump-and-treat remedy at the Site, a Draft Groundwater Remediation Focused Feasibility Study (FFS) (MWH, 2010) was prepared and submitted in February 2010 to evaluate alternative groundwater remediation technologies to remediate the remaining contaminants in the shallow groundwater at the Site. MNA along with maintenance of institutional controls as outlined in the Site Environmental Covenant (UDEQ, 2009) is one of the alternatives considered in the draft FFS. The potential to move to a MNA remedy prompted the development of the Draft Natural Attenuation Evaluation in October 2011 (MWH, 2011). The USEPA reviewed this report and provided comments to Questar in February 2013, and Questar submitted responses
Page 4 of 16
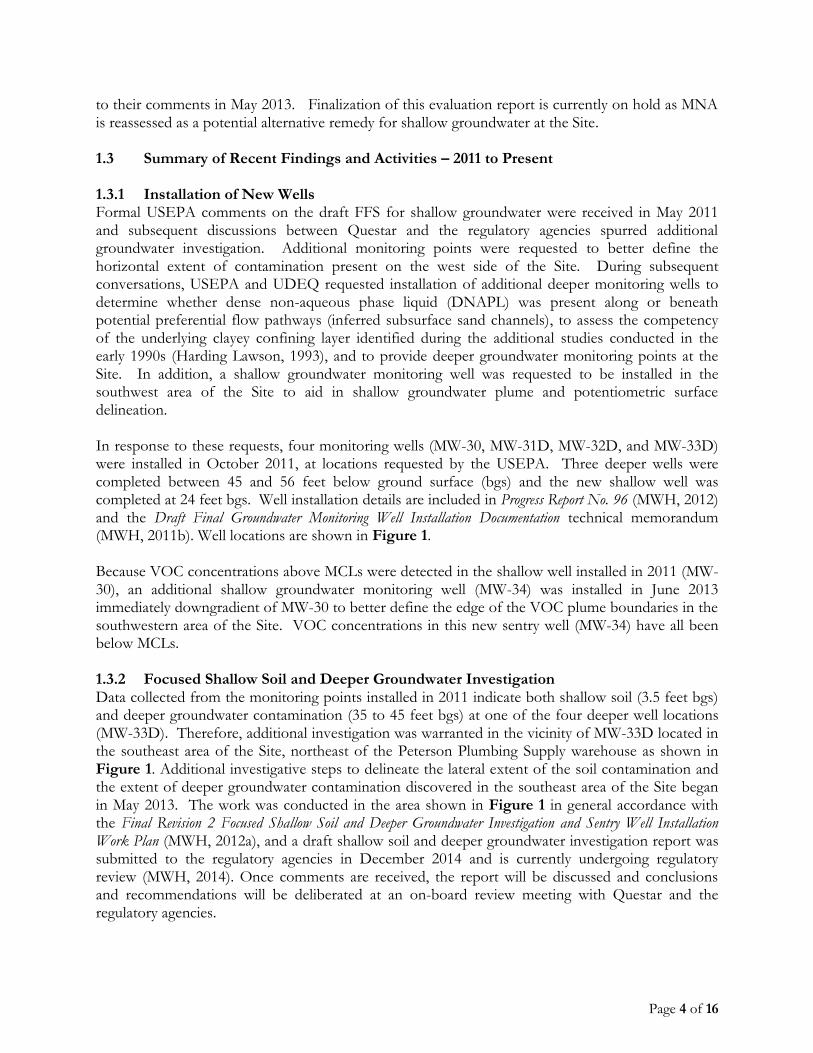
to their comments in May 2013. Finalization of this evaluation report is currently on hold as MNA is reassessed as a potential alternative remedy for shallow groundwater at the Site. 1.3 Summary of Recent Findings and Activities – 2011 to Present 1.3.1 Installation of New Wells Formal USEPA comments on the draft FFS for shallow groundwater were received in May 2011 and subsequent discussions between Questar and the regulatory agencies spurred additional groundwater investigation. Additional monitoring points were requested to better define the horizontal extent of contamination present on the west side of the Site. During subsequent conversations, USEPA and UDEQ requested installation of additional deeper monitoring wells to determine whether dense non-aqueous phase liquid (DNAPL) was present along or beneath potential preferential flow pathways (inferred subsurface sand channels), to assess the competency of the underlying clayey confining layer identified during the additional studies conducted in the early 1990s (Harding Lawson, 1993), and to provide deeper groundwater monitoring points at the Site. In addition, a shallow groundwater monitoring well was requested to be installed in the southwest area of the Site to aid in shallow groundwater plume and potentiometric surface delineation. In response to these requests, four monitoring wells (MW-30, MW-31D, MW-32D, and MW-33D) were installed in October 2011, at locations requested by the USEPA. Three deeper wells were completed between 45 and 56 feet below ground surface (bgs) and the new shallow well was completed at 24 feet bgs. Well installation details are included in Progress Report No. 96 (MWH, 2012) and the Draft Final Groundwater Monitoring Well Installation Documentation technical memorandum (MWH, 2011b). Well locations are shown in Figure 1. Because VOC concentrations above MCLs were detected in the shallow well installed in 2011 (MW-30), an additional shallow groundwater monitoring well (MW-34) was installed in June 2013 immediately downgradient of MW-30 to better define the edge of the VOC plume boundaries in the southwestern area of the Site. VOC concentrations in this new sentry well (MW-34) have all been below MCLs. 1.3.2 Focused Shallow Soil and Deeper Groundwater Investigation Data collected from the monitoring points installed in 2011 indicate both shallow soil (3.5 feet bgs) and deeper groundwater contamination (35 to 45 feet bgs) at one of the four deeper well locations (MW-33D). Therefore, additional investigation was warranted in the vicinity of MW-33D located in the southeast area of the Site, northeast of the Peterson Plumbing Supply warehouse as shown in Figure 1. Additional investigative steps to delineate the lateral extent of the soil contamination and the extent of deeper groundwater contamination discovered in the southeast area of the Site began in May 2013. The work was conducted in the area shown in Figure 1 in general accordance with the Final Revision 2 Focused Shallow Soil and Deeper Groundwater Investigation and Sentry Well Installation Work Plan (MWH, 2012a), and a draft shallow soil and deeper groundwater investigation report was submitted to the regulatory agencies in December 2014 and is currently undergoing regulatory review (MWH, 2014). Once comments are received, the report will be discussed and conclusions and recommendations will be deliberated at an on-board review meeting with Questar and the regulatory agencies.

Page 5 of 16
1.3.2.1. Focused Shallow Soil Investigation. The focused shallow soil investigation was conducted in May 2013 to assess the nature and extent of impacted shallow subsurface soils in the vicinity of monitoring well MW-33D (Figure 1) where concentrations above USEPA industrial screening levels were detected in samples collected at 3.5 feet bgs during October 2011 drilling activities. Direct-push soil borings were completed at a total of 53 locations, beginning adjacent to the MW-33D location and moving outward from locations where sampling results were above screening levels. PCE, TCE, ethylbenzene, xylenes, and/or PCP were detected at concentrations above generic industrial screening levels in 18 of the 53 boring locations. Soil samples with constituent concentrations above screening levels were collected from borings along the north-south trending corridor east of Peterson Plumbing Supply warehouse and northward along the historical industrial process wastewater pipeline (process drain line) alignment that runs parallel to the Site boundary (Figure 1). All shallow soil data are presented and evaluated in the draft focused investigation report (MWH, 2014) that is currently being reviewed by the regulators. 1.3.2.2. Focused Deeper Groundwater Investigation. The focused deeper groundwater investigation began in May 2013 with cone penetrometer testing (CPT) and direct-push groundwater sampling and was completed in July 2014. The purpose of the focused groundwater investigation was to assess the nature and extent of groundwater contamination identified at monitoring well MW-33D where VOCs were initially detected above MCLs in a deeper interval (35-45 feet bgs). CPT methodology was used to profile subsurface characteristics and to collect direct-push groundwater samples at 12 locations at depths up to 160 feet bgs on the following dates:
May 20 through 24, 2013 (five locations) July 23 and 24, 2013 (three locations) August 19, 2013 (one location) February 19, 2014 (two locations) June 30 and July 1, 2014 (one location)
Direct-push groundwater samples were collected at the more hydraulically conductive intervals (typically interpreted as silts and sands) at two to five different depths at each of the twelve CPT boring locations. Laboratory analytical results include detections of some VOCs and/or PCP above MCLs at four locations, between depths of approximately 70 and 130 feet bgs. All lithological, groundwater, and pore dissipation test data are presented and evaluated in the draft focused investigation report that was submitted to the regulatory agencies in December 2014 (MWH, 2014). 1.3.3 Indoor Air Sampling Due to shallow groundwater VOC contamination near occupied buildings, the potential for vapor intrusion and potential health risk to workers were evaluated in the spring of 2012. Air samples collected with SUMMA® canisters in the three occupied buildings on the Site (Figure 1) were analyzed for TCE, DCE isomers and VC, and results were all below laboratory reporting limits. Therefore, no significant risk to worker health was concluded. A description of the investigation methods, results, and conclusions is presented in the Final Indoor Air Investigation Summary Report (MWH, 2013). An additional round of indoor air sampling was conducted in December 2015 to assess human health risk from potential vapor intrusion in the three buildings. The analyte list for the December 2015 indoor air sampling round has been expanded to include all VOCs detected in shallow soil in

Page 6 of 16
2013 (within 100 feet of the Peterson Plumbing Warehouse) and benzene. Though benzene was not detected in shallow soil samples collected during the focused shallow soil investigation, detection limits for benzene were above the industrial soil screening level for benzene in a number of the 2013 soil samples (MWH, 2015a). Results and a human health risk evaluation will be included in the December 2015 Indoor Air Sampling Report, scheduled for submittal in February 2016. 2.0 ACTIVITIES CONDUCTED DURING CURRENT REPORTING PERIOD 2.1 Shallow Groundwater Treatment System Operation The groundwater extraction and treatment system was not operated during the reporting period. Operation of the groundwater extraction and treatment system was discontinued in January 2003 in accordance with the USEPA’s approval letter dated January 9, 2003. 2.2 Groundwater Monitoring Overall, the groundwater monitoring program is designed to provide data to assess natural attenuation processes of contaminants in the shallow groundwater as described in the Monitored Natural Attenuation Work Plan (MWH, 2002) and to assess potential groundwater contaminant migration. Both hydrogeological and constituent concentration data were collected and evaluated. Routine semiannual groundwater monitoring was conducted in November 2015 at 17 shallow groundwater monitoring locations (with well screens installed to 25 feet bgs) and three deeper monitoring points (with well screens installed down to 56 feet bgs). November 2015 groundwater monitoring results are presented in Section 3.0. 2.3 Well and Piezometer Abandonment Piezometers PZ-6, PZ-7, PZ-8, PZ-9, and PZ-10 and monitoring well MW-14 were abandoned on November 4, 2015. These abandonments were approved by USEPA in email communications to Questar dated August 7 and 10, 2015. The five piezometers were located north of Peterson Plumbing Supply warehouse, and monitoring well MW-14 was located on the Intsel Steel West Property southeast of the Intsel Steel West warehouse, as shown in Figure 1. The piezometers were designed for water-level monitoring only, and MW-14 was not part of the shallow groundwater sampling network. The water level monitoring network remaining after the abandonments will be sufficient for the purpose of assessing groundwater flow direction and hydraulic gradient of the shallow aquifer because water level data historically collected from the abandoned well and piezometers are very similar to data collected from nearby monitoring points that remain in the monitoring network (i.e., MW-20, EX-01 and ES-01). The five abandoned piezometers were located in a paved area where surface water ponding has been observed during wet weather events and potential stormwater infiltration into piezometer casings was a concern. Measurements from a number of shallow groundwater monitoring points (i.e., ES-01, EX-01, MW-09, MW-05, and EX-07) in the vicinity of these five piezometers provide sufficient data to assess the groundwater levels in this area. The five piezometers were closely spaced around extraction trench ES-01, and were installed in 1997 to assess the groundwater table response during initial startup of the extraction trench.

Page 7 of 16
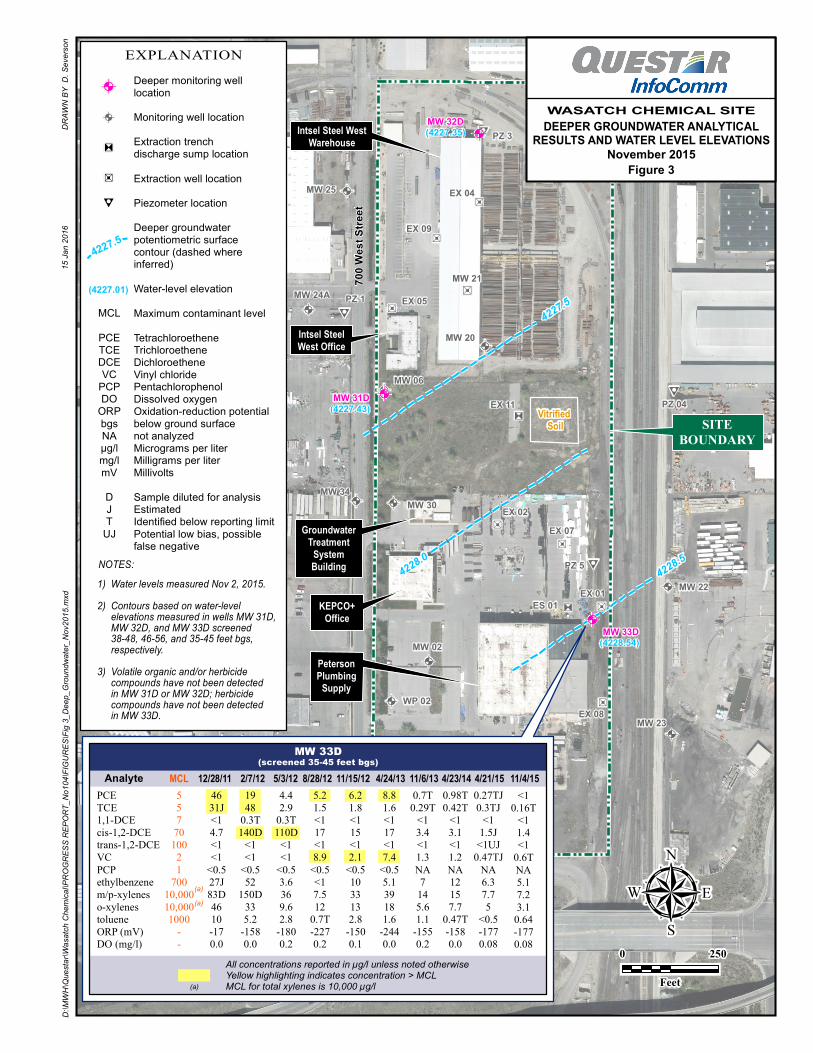
Water-level measurements from monitoring well MW-14 were not necessary because data collected at nearby monitoring well MW-20 has been sufficient to assess the shallow groundwater table and shallow groundwater flow direction. Access to MW-14 is located on the southeastern edge of Intsel’s outdoor heavy steel storage yard and access is often obstructed. 2.4 Indoor Air Sampling Indoor air sampling was conducted during the first week of December, 2015. Twenty-four hour time-weighted whole air samples were collected inside each occupied building located above the impacted shallow groundwater and/or adjacent to shallow soil contamination. Laboratory analytical data and a human health risk evaluation will be included in an indoor air sampling report scheduled to be submitted to the regulatory agencies in February 2016. 3.0 ROUTINE GROUNDWATER MONITORING RESULTS 3.1 Shallow Groundwater Level Monitoring Results Shallow groundwater wells and piezometers at the Site are completed to depths of 25 feet bgs or less. Groundwater elevation contours drawn from shallow groundwater monitoring data collected on November 2, 2015 are illustrated in Figure 2. In general, groundwater elevations measured at the shallow monitoring points continue to indicate an overall groundwater flow direction of west to northwest. The average depth to shallow groundwater across the Site in November 2015 was approximately 4.2 feet bgs, which is 0.9 feet lower than the average depth reported for April 2015 and 0.3 feet lower than the average measured in November 2014. Shallower groundwater depths were measured on the southeast side of the Site (i.e., approximately 3 feet bgs at EX-08 and ES-01, respectively), and greater depths were measured to the north and west (i.e., nearly 6 feet bgs at EX-04 and EX-05, respectively). 3.2 Deeper Groundwater Level Monitoring Results Groundwater level data for the deeper wells (MW-31D, MW-32D, and MW-33D completed to depths between 45 and 56 feet bgs) were collected on November 2, 2015. The average depth to water measured in the three deeper wells was approximately 2.5 feet bgs, which is comparable to the average depth measured in April 2015, and approximately 0.2 feet higher than the average depths to water measured in April and November of 2014. Water-level data from these three points indicate an overall direction of horizontal flow towards the northwest in these deeper zones. November 2015 groundwater level elevations for the deeper wells are shown in Figure 3. Each deeper well is located close to a shallow well, providing three well pairs where the vertical component of groundwater flow can be assessed. The calculated vertical hydraulic gradient and resulting direction of the vertical component of groundwater flow for each nested well pair are listed in Table 1. Water-level data collected in November 2015 indicate an upward vertical component of groundwater flow for all three nested well pairs, indicating the deeper groundwater is under pressure at these locations.

Page 8 of 16
3.3 Shallow Groundwater Sampling Results Shallow groundwater samples were collected from 17 monitoring locations from November 2 through 5 for the second semiannual monitoring round of 2015. Samples were analyzed for the COCs PCE, TCE, DCE isomers, VC, PCP, plus geochemical parameters pertinent to the assessment of biotransformation of chlorinated solvents (sulfate, sulfide, nitrate, nitrite, and ferrous iron). Dissolved oxygen (DO), pH, and oxidation-reduction potential (ORP) were measured in the field during sampling activities. Laboratory analytical methods and sampling results for wells completed in the shallow zones for this sampling round are presented in Table 2. A detailed data verification report is included in Appendix A for all November 2015 laboratory analytical data, and time series data dating back to 1995 are presented in Appendix B. 3.3.1 Shallow Groundwater VOC and PCP Results A summary of November 2014 laboratory analytical results for shallow groundwater relative to MCLs and laboratory reporting limits are tabulated below. Maximum concentrations detected for each constituent are listed, with the corresponding monitoring point location indicated in parentheses.
Shallow Groundwater Analytical Data Summary November 2015
Constituent
Drinking Water MCL
g/l)
No. of Monitoring
Points Sampled
No. of Results Above MCL
Maximum Concentration
Detected
(g/l)
No. of Results at or Above Reporting
Limit
No. of Results Below
Reporting Limit
PCE 5 17 0 No detections 0 17
TCE 5 17 0 2.5 (EX-07) 4 13
1,1-DCE 7 17 1 8.3 (EX-05) 7 10
cis-1,2-DCE(a) 70 17 2 200 D (EX-02) 10 7
trans-1,2-DCE(a) 100 17 1 120 D (EX-05) 9 8
VC 2 17 6 47 D (EX-02) 7 10
PCP(b) 1 5 1 2.2 D (EX-02) 2 3
(a) Although cis- and trans- DCE isomers are not designated as “indicator chemicals” in the ROD (USEPA, 1991), they have been monitored since April 2009 to aid in the evaluation of natural attenuation processes.
(b) Based on historical data, the PCP monitoring network is limited to five monitoring points.
D Sample was diluted
In general, the November 2015 data are very similar to those reported for the April 2015 and November 2014 monitoring rounds as illustrated in the time series data tables and graphs included in Appendix B. 3.3.2 Geochemical Parameters Geochemical parameters including pH, ORP, DO, nitrate, nitrite, ferrous iron, sulfate, and sulfide were collected to assess whether conditions in the aquifer are conducive to biotransformation processes. November 2015 results for these parameters for shallow groundwater monitoring points

Page 9 of 16
are listed in Table 2. Data for pH, ORP, DO, nitrate, and ferrous iron throughout the Site indicate generally favorable conditions for anaerobic reductive dechlorination in shallow groundwater. Historically, ORP values have been low (typically negative millivolts), DO concentrations have been low (below 0.5 mg/l), and ferrous iron results have been relatively high (greater than 1 mg/l). November 2015 ORP values are consistent with historical results and are within the expected range that correlates to their respective November 2015 DO. Ferrous iron concentrations also indicate conditions generally consistent with the DO and ORP results, with the exception of one relatively lower ferrous iron result for ES-01 (0.91 mg/l). Geochemical parameter results shown in bold type on Table 2 indicate geochemical conditions are conducive to biodegradation. 3.4 Deeper Groundwater Sampling Results Groundwater samples were collected on November 4 and 5, 2015 from the three wells completed in deeper zones. The three deeper wells, MW-31D, MW-32D, and MW-33D, were installed in 2011 and are screened at 38-48, 46-56, and 35-45 feet bgs, respectively. Groundwater samples collected from these three wells were analyzed for VOCs and geochemical parameters pertinent to the assessment of biotransformation of chlorinated solvents (sulfate, sulfide, nitrate, nitrite, and ferrous iron). Additionally, DO, pH, and ORP were measured in the field. Results and laboratory analytical methods used are presented in Table 3 where concentrations of the primary COCs and additional VOCs initially detected in MW-33D groundwater samples (i.e., ethylbenzene, xylenes, toluene) are listed. Time series data for all three wells are presented in Exhibits B-15 through B-17 of Appendix B. Detailed sampling and data validation information is included in Appendix A where the complete list of VOC analytes for MW-33D is presented. Consistent with historical data, VOCs were detected in the deeper groundwater only at MW-33D. Historical VOC and PCP data (2011 to present) for MW-33D are listed on Figure 3. VOC results for MW-33D have remained below MCLs over the past two years (Exhibit B-17 for MW-33D time series data table and graphs). Hydrocarbon concentrations continued to be detected at MW-33D, though results continue to be orders of magnitude below Utah Leaking Underground Storage Tank Program (LUST) initial screening levels and drinking water MCLs, as listed in the table below:
November 2015 Hydrocarbon Concentrations Detected in MW-33D Groundwater Compared to Utah LUST Regulatory Limits and MCLs
Hydrocarbon Detected November 2015
Concentration (µg/l)
Utah LUST Screening Level(a) and Federal/State MCL
(µg/l)
Ethylbenzene 5.1 700
m,p,o-Xylene (sum of isomers) 7.2 10,000
Toluene 0.64 1,000
Guidelines for Utah’s Corrective Action Process for Leaking Underground Storage Tank Sites (UDEQ, 2015).
Geochemical parameters measured in November 2015 for all three deeper wells illustrate conditions conducive to natural attenuation with consistently negative ORP readings, low DO concentrations, and neutral pH readings. Laboratory analytical results for nitrate, ferrous iron, and sulfate for MW-33D fall in the biodegradation indicator ranges presented in USEPA natural attenuation guidance (USEPA, 1998).

Page 10 of 16
4.0 SHALLOW GROUNDWATER ANALYTICAL DATA EVALUATION 4.1 Introduction Foreseeing potential difficulties in meeting performance standards with pump-and-treat technology, the Site Consent Decree (U.S. District Court, 1991, Section VII, part 17) provides an avenue to “waive or modify” groundwater treatment performance standards (equivalent to MCLs as defined in the ROD) that are demonstrated to be “technically impracticable from an engineering perspective” to achieve, as reflected in “asymptotic conditions” at the Site. To provide justification for a performance standard waiver or modification, the Consent Decree requires a demonstration for each contaminant for which a waiver or modification is sought that illustrates contaminant concentrations remain “at statistically significant asymptotic values above MCLs” for at least the eight most recent data points. Therefore, statistical analyses and shallow groundwater plume stability evaluations (utilizing Mann-Kendall and Theil-Sen statistical tests) are currently conducted on an annual basis, after each spring monitoring round. An evaluation of the most recently conducted statistical evaluation is included in Progress Report No. 103 (MWH, 2015). Evaluation of groundwater constituent concentration trends are useful for:
Assessing overall plume stability
Evaluating the groundwater monitoring program
Identifying locations where constituent concentrations have stabilized above MCLs such that petitioning for Alternative Performance Standards may be justified as outlined in the Site Consent Decree (U.S. District Court, 1991).
Historical shallow groundwater data extending back to 1995 are presented below, in Section 4.2. 4.2 Shallow Groundwater Historical Time Series Data Tables and graphs of historical time series data for the current monitoring network are included in Appendix B where very significant decreases in shallow groundwater concentrations over time are illustrated. Since 1995, contaminant concentrations have decreased two to four orders of magnitude for the original VOC indicator chemicals designated in the ROD (i.e., PCE, TCE, and 1,1-DCE). For example, TCE concentrations have decreased by four orders of magnitude at monitoring points EX-05 and MW-20, by three orders of magnitude at EX-09, and by two orders of magnitude at EX-07. Also, concentrations of PCE have decreased by four orders of magnitude at monitoring points ES-01 and EX-11, and by two orders of magnitude at EX-05, EX-07, and MW-20. Concentrations at most wells have decreased exponentially over time, as shown in the B2 Exhibits located in Appendix B. 5.0 DEEPER GROUNDWATER ANALYTICAL DATA EVALUATION 5.1 Introduction The deeper groundwater monitoring wells (MW-31D, MW-32D, and MW-33D completed to depths of 48, 56, and 45 feet bgs, respectively) have been sampled eleven times since their installation in 2011. Statistical analyses and shallow groundwater plume stability evaluations (utilizing Mann-

Page 11 of 16
Kendall and Theil-Sen statistical tests) are conducted for these three deeper monitoring wells on an annual basis, after each spring monitoring round. The most recently conducted statistical evaluation is included in Progress Report No. 103 (MWH, 2015). Deeper groundwater data extending back to 2011 are presented in the following subsection (5.2). 5.2 Deeper Groundwater Historical Time Series Data As shown in Figure 3 and in Exhibit B-17 of Appendix B, PCE and TCE were initially detected above their respective MCLs in MW-33D. However, concentrations of these COCs have decreased to trace concentrations (below laboratory reporting limits) over the past five monitoring rounds. Though not detected initially, VC was detected above its MCL three times in the middle of the time series (August 2012, November 2012, and April 2013) and has been detected at concentrations below its MCL over the past five monitoring rounds. Ethylbenzene, xylenes and toluene have also been detected in groundwater samples from MW-33D, though at concentrations one to four orders of magnitude below their Utah LUST screening levels and drinking water MCLs as presented in Section 3.4 of this report. 6.0 NATURAL ATTENUATION ASSESSMENT 6.1 Shallow Groundwater Geochemical parameters indicative of anaerobic microbial growth and reductive dechlorination of PCE and TCE are presented in Table 2 as biodegradation indicators. November 2015 data shown in bold type in Table 2 indicate favorable conditions for reductive dechlorination as defined in the USEPA’s guidance on evaluating natural attenuation of chlorinated solvents (USEPA, 1998). As discussed in the Groundwater Sampling Results section of this report (Section 3.3), November 2015 values for ORP, nitrate, and DO are generally low and ferrous iron elevated in areas of contamination, indicating overall favorable conditions for reductive dechlorination at the Site. The presence of reductive dechlorination daughter products (i.e., DCE isomers and VC) indicates natural attenuation has been occurring at the Site. Though shallow groundwater data indicate that natural attenuation has been occurring at the Site and has contributed to overall shallow groundwater plume stability, MNA as an alternative remedy is currently being reassessed due to the presence of residual contamination in shallow soils at and near the water table northeast of the Peterson Plumbing Supply warehouse. Matrix diffusion of residual contamination can lengthen the remediation time frame for MNA, particularly for contaminated aquifers with inter-bedded low-permeability zones. Therefore, evaluating plume stability based on statistical analyses will continue to be conducted after each spring monitoring round, and the practicability of MNA as an alternative remedy will continue to be evaluated. 6.2 Deeper Groundwater Groundwater data from the three monitoring wells completed to depths between 45 and 56 feet bgs (MW-31D, MW-32D, and MW-33D) indicate the occurrence of reductive dechlorination in deeper groundwater. The anoxic environment, negative ORP conditions, nitrate, ferrous iron, and sulfate concentrations in all three deeper wells, plus the presence of daughter products TCE, cis-1,2-DCE, and VC at MW-33D indicate natural attenuation is occurring at deeper groundwater depths of the Site.

Page 12 of 16
7.0 RECOMMENDATIONS
1. Reduce Frequency of Shallow Groundwater Monitoring for Interior and Upgradient Shallow Wells. A reduced shallow groundwater monitoring frequency is warranted because concentration data are stable and more than 50 data points have already been collected over a 20-year period for most shallow groundwater monitoring locations. Continuing to collect semiannual data, particularly in the central areas of the plumes, will not add value to Site remedial action performance evaluations. Reducing the sampling frequency for eight of the shallow groundwater monitoring points located in the central and upgradient areas of the shallow groundwater plumes is recommended. Interior wells are proposed to be monitored once a year in the springtime, while downgradient and sentry wells continue to be monitored semiannually. The proposed monitoring schedule is outlined below:
Shallow Groundwater
Proposed Sampling Frequency
Reduce Frequency to Annual
(Sample spring only)
Frequency to Remain Semiannual
(Sample spring and fall)
ES-01 (interior) EX-04 (downgradient)
EX-02 (interior) EX-05 (downgradient)
EX-07 (interior) MW-06 (downgradient)
EX-08 (interior) MW-30 (downgradient)
EX-09 (interior) PZ-1 (downgradient
EX-11 (interior) MW-34 (sentry)
MW-20 (interior) MW-24A (sentry)
MW-23 (upgradient) MW-25 (sentry)
PZ-3 (sentry)
Data evaluations will be included in progress reports prepared after each spring monitoring round. These reports will include results of statistical analyses of shallow groundwater data (i.e., Mann-Kendall and Theil-Sen analyses) and shallow groundwater contaminant plume contour maps. Continued semiannual monitoring is recommended for the three deeper groundwater monitoring wells (MW-31D, MW-32D, and MW-33D) at this time.
8.0 DELIVERABLES SUBMITTED DURING CURRENT REPORTING PERIOD The following deliverables were submitted to the regulatory agencies during the reporting period.
Written responses to EPA’s comments on the Well and Piezometer Abandonment Proposal memorandum were submitted on July 1, 2015.
Page 13 of 16
Wasatch Chemical Site Progress Report No. 103 (MWH, 2015) was submitted on July 20, 2015. 9.0 ACTIONS TO BE COMPLETED DURING NEXT REPORTING PERIOD The following project activities are scheduled to be conducted within the next six-month reporting period.
1. Conduct Focused Investigation On-Board Review Meeting. A meeting to include participants from USEPA, UDEQ, Questar, and MWH is anticipated to be held in 2016. The objectives of this meeting are to discuss regulators’ comments not yet received on the Draft Focused Shallow Soil and Deeper Groundwater Investigation and Sentry Well Installation Report (MWH, 2014) and to agree on recommended further action(s) based on the focused investigation and shallow sentry well installation results. Specific goals for this meeting include:
Determine the locations and depths of proposed deep monitoring wells based on lithologic and groundwater sampling data collected during focused investigation activities in 2013-2014.
Determine shallow soil remedial action levels, delineation of any impacted shallow soils recommended for further action, and discuss actions to address concerns regarding potential human health risks.
Discuss next steps for shallow groundwater remediation at the Site (shallow groundwater plumes have been defined with more certainty since the new shallow groundwater sentry well [MW-34] was installed in June 2013).
2. Finalize the Focused Shallow Soil and Deeper Groundwater Investigation and Sentry
Well Installation Report. Incorporate comments made by UDEQ and USEPA and revise recommendations as agreed upon during the on-board review meeting (described above).
3. Install New Deep Monitoring Wells. New deep monitoring wells will be installed as agreed upon by Questar and the regulatory agencies based on the deeper groundwater investigation results presented in the draft investigation report (MWH, 2014). Locations and depths will be determined during the focused investigation report on-board review meeting with the regulatory agencies described above.
4. Conduct Human Health Risk Evaluation for Indoor Air. Using validated December
2015 air sampling data collected at three buildings on the Site, a human health risk evaluation will be performed. This evaluation will assess whether human health risks fall beneath the USEPA acceptable risk range of 1x10⁻⁴ to 1x10⁻⁶ for carcinogenic constituents and a hazard index of 1 for non-carcinogenic constituents. Results will be reported in the Indoor Air Sampling Report (see item #5 below).
5. Prepare and Submit the Indoor Air Sampling Report. Indoor air sampling data and
human health risk evaluation results will be presented and evaluated. This report is scheduled for submittal to regulatory agencies in February 2016.
6. Conduct Routine Groundwater Monitoring. Groundwater contaminant concentrations,
geochemical parameters, and water levels will continue to be monitored. Routine monitoring

Page 14 of 16
activities will include groundwater monitoring and sampling of both shallow and deeper groundwater compliance monitoring locations in November 2015 in accordance with the Monitored Natural Attenuation Work Plan (MWH, 2002), the Final Quality Assurance Project Plan Revision 2.0 (MWH, 2012b), and recommendations for groundwater monitoring provided in this progress report.
7. Progress Reports. Site Progress reports will continue to be submitted semiannually for 6-
month reporting periods of January through June and July through December. The first semiannual progress report for 2016 is scheduled to be submitted in July 2016.
If you have any questions or concerns, please do not hesitate to contact me at (801) 617-3242. Sincerely, MWH
Susan Eyzaguirre, PE, PG, PMP Project Manager cc: S. Bassett, Questar Corp. H. Pos, Parsons Behle & Latimer Utah Dept. of Natural Resources

Page 15 of 16
REFERENCES
Harding Lawson, 1990. Remedial Investigation Report, Wasatch Chemical Site, Salt Lake City, Utah. March 30, 1990.
Harding Lawson, 1990a. Feasibility Study Report, Wasatch Chemical Site, Salt Lake City, Utah. August 22, 1990.
Harding Lawson, 1993. Draft Final Additional Studies and Design Basis Report for Remedial Design and Remedial Action, Wasatch Chemical Site, Salt Lake City, Utah. Volume II of II. March 17, 1993.
Interstate Land Company, 1998. Remedial Action Completion Report, Wasatch Chemical Site, Salt Lake City, Utah. January 29, 1998.
MWH, 2002. Monitored Natural Attenuation Work Plan, Wasatch Chemical Site Addendum to the Final Extraction and Treatment System Performance Standards, Milestones, and Shutdown Procedures. November 14, 2002.
MWH, 2008. Progress Report No. 89, Wasatch Chemical Site. Letter report submitted July 18, 2008.
MWH, 2010. Draft Groundwater Remediation Focused Feasibility Study Report, Wasatch Chemical Site. February 2010.
MWH, 2011. Draft Wasatch Chemical Site Natural Attenuation Evaluation, Wasatch Chemical Site. October 2011
MWH, 2011a. Progress Report No. 95, Wasatch Chemical Site. Letter report submitted July 27, 2011.
MWH, 2011b. Draft Final Groundwater Monitoring Well Installation Documentation technical memorandum, Wasatch Chemical Site. December 30, 2011.
MWH, 2012. Progress Report No. 96, Wasatch Chemical Site. Letter report submitted January 24, 2012.
MWH, 2012a. Final Revision 2 Focused Shallow Soil and Deeper Groundwater Investigation and Sentry Well Installation Work Plan. November 2012.
MWH, 2012b. Final Quality Assurance Project Plan Revision 2.0, Wasatch Chemical Site. July 2012.
MWH, 2013. Final Indoor Air Investigation Summary Report, Wasatch Chemical Site. January 2013.
MWH, 2014. Draft Focused Shallow Soil and Deeper Groundwater Investigation and Sentry Well Installation Report, Wasatch Chemical Site. December 2014.
MWH, 2015. Progress Report No. 103, Wasatch Chemical Site. Letter report submitted July 20, 2015.
MWH, 2015a. Final Indoor Air Sampling Work Plan, Wasatch Chemical Site. April 2015.
UDEQ, 2009. Environmental Covenant entered into by Questar InfoComm, Inc., USEPA, and UDEQ pursuant to Utah Code Ann. 57-25-101. Recorded January 14, 2009.

Page 16 of 16
UDEQ, 2015. Guidelines for Utah’s Corrective Action Process for Leaking Underground Storage Tank Sites, Updated March 2015.
U.S. District Court, 1991. Remedial Design / Remedial Action Consent Decree for Civil Actions No. 86-C-0023G and 91-C-11945. United States District Court for the District of Utah Central Division. Signed by Entrada Industries and the State of Utah on September 30, 1991.
USEPA, 1991. Record of Decision, Wasatch Chemical Site, Salt Lake City, Utah. March 29, 1991.
USEPA, 1998. Technical Protocol for Evaluating Natural Attenuation of Chlorinated Solvents in Ground Water. EPA/600/R-98/128. September 1998.
USEPA, 2012. Fourth Five-Year Review Report for Wasatch Chemical National Priority List Site, Salt Lake City, Utah. September 25, 2012.

TABLE 1
NOVEMBER 2015 VERTICAL HYDRAULIC GRADIENT ASSESSMENT
USING DATA FROM NESTED SHALLOW AND DEEPER WELL PAIRS
WASATCH CHEMICAL SITE, SALT LAKE CITY, UTAH
Well Pair
IdentificationWell Screened Interval
Groundwater
Elevation (ft)
Groundwater
Elevation
Difference(a)
(ft)
Vertical
Hydraulic
Gradient(b)
(ft/ft)
Vertical Component
of Groundwater Flow
Direction
Western MW-06 14 - 24 ft bgs 4225.70
MW-31D 38 - 48 ft bgs 4227.43
Northern PZ-3 5 - 25 ft bgs 4226.16
MW-32D 46 - 56 ft bgs 4227.35
Southeastern EX-01 5 - 15 ft bgs 4227.49
MW-33D 35 - 45 ft bgs 4228.54
Water levels measured on November 2, 2015
(a) Calculated by subtracting the water level elevation of the shallow well from that of the deeper well.
(b) Calculated by dividing the difference in water-level elevations by the distance calculated between the middle of each screened interval.
Vertical distances between the middle of screened intervals are 24, 36, and 30 ft bgs for the Western, Northern, and Southeastern
well pairs, respectively.
bgs - below ground surface
ft - feet
1.05
1.73
1.19
0.04 Upward
0.07 Upward
0.03 Upward

TABLE 2
SHALLOW GROUNDWATER SAMPLING RESULTS AND NATURAL ATTENUATION INDICATORS
NOVEMBER 2015
WASATCH CHEMICAL SITE, SALT LAKE CITY, UTAH
Natural Attenuation Assessment
Sample Identification ES-01 EX-02 EX-04 EX-05 EX-07 EX-08 EX-09 EX-11 MW-06 MW-20 MW-23 MW-30 MW-34 PZ-1 MW-24A MW-25 PZ-3(b)
Biodegradation
Date Collected 11/3/15 11/2/15 11/3/15 11/2/15 11/3/15 11/4/15 11/3/15 11/3/15 11/5/15 11/3/15 11/4/15 11/5/15 11/5/15 11/4/15 11/4/15 11/4/15 11/4/15 Indicator Purpose and/or Interpretation
Volatile Organic Compounds (µg/l) Analytical Method
Tetrachloroethene (PCE) 5 SW8260B <1 <1 <1 <1 <1 <1 <1 <1 <1 <1 <1 <1 <1 <1 <1 <1 <1 Not Applicable Indicator chemical(d)
Trichloroethene (TCE) 5 SW8260B 1.3 2.4 0.62 T 0.35 T 2.5 0.16 T 0.19 T 0.84 T 0.24 T 0.51 T <1 1.6 0.31 T <1 <1 <1 <1 detection Indicator chemical(d)
; degradation product of PCE
1,1-Dichloroethene (1,1-DCE) 7 SW8260B <1 4.8 1.2 8.3 0.49 T <1 1.7 <1 3.1 1.3 <1 4.8 <1 <1 <1 <1 <1 detection Indicator chemical(d)
; degradation product of trichloroethene
cis-1,2-Dichloroethene (cis-1,2-DCE) 70 SW8260B 0.67 T 200 D 22 150 D 13 0.11 T 27 7 26 24 <1 70 1.9 <1 <1 0.19 T <1 detection Degradation product of trichloroethene
trans-1,2-Dichloroethene (trans-1,2-DCE) 100 SW8260B 0.55 T 9.3 5.2 120 D 3.5 <1 7.3 37 4.9 7.4 <1 1.2 0.49 T <1 <1 <1 <1 detection Degradation product of trichloroethene
Vinyl chloride (VC) 2 SW8260B 0.63 T 47 0.69 T 7.1 9.3 <1 0.16 T 41 1 5.4 <1 22 <1 <1 <1 <1 <1 detection Degradation product of dichloroethenes
Pesticides (µg/l)
Pentachlorophenol (PCP) 1 SW8151A <0.5 2.2 D NA NA <0.5 0.90 NA <0.5 NA NA NA NA NA NA NA NA NA Not Applicable Indicator chemical(d)
Geochemical Parameters
pH (standard units) na field measurement 7.5 6.4 7.0 6.8 6.9 6.9 6.7 6.9 6.8 6.7 7.1 6.8 6.9 6.8 6.8 6.8 6.7 5 to 9(c) Optimal range for reductive pathway
Oxidation-reduction Potential (mV) na field measurement -279 -19 -180 -27 -127 -73 -28 -255 -117 -118 -255 -131 -227 -158 -111 -138 -66 <50(c) Reductive pathway possible
Dissolved Oxygen (mg/l) na field measurement 0.08 0.21 0.12 0.16 0.20 0.06 0.19 0.07 0.14 0.08 0.1 0.05 0.05 0.06 0.07 0.06 0.15 <0.5(c) Reductive pathway possible
Nitrate (mg/l) 10 E300.0 0.18 0.0655 T 0.218 0.0588 T 0.0579 T 3.03 D 0.0602 T 0.0514 T 0.0587 T 0.0612 T 0.394 TD 0.0542 T 0.0589 T 0.0636 T 0.0627 T 0.0545 T 0.0687 T <1(c) Reductive pathway possible
Nitrite (mg/l) 1 E300.0 <0.1 <0.4 D <0.1 <0.3 D <0.3 D <1.6 D <0.1 <0.4 D <0.1 <0.4 D <5 D <0.4 D <0.1 <0.1 <0.1 <0.1 <0.2 D >1 Evidence of nitrate reduction
Iron II (mg/l)(a) na Hach 8146 0.91 >3.00 >3.00 >3.00 >3.00 2.23 >3.00 >3.00 >3.00 >3.30 >3.30 >3.30 >3.30 >3.30 >3.30 >3.30 >3.30 >1
(c) Reductive pathway possible
Sulfate (mg/l) na E300.0 20.3 D 1250 D 437 D 1430 D 265 D 556 D 1180 D 594 D 563 D 1380 D 415 D 1030 D 836 D 202 D 211 D 575 D 2370 D <20(c) At higher concentrations may compete with reductive
pathway
Sulfide, total (mg/l) na E376.2 0.36 <0.1 <0.1 <0.1 0.0149 T 0.0248 T <0.1 0.103 0.0219 T 0.0136 T 0.172 0.0656 T 0.0308 T 0.0856 T <0.1 0.0186 T 0.0211 T >1(c) Evidence of sulfate reduction
(a)Iron II was measured in the field using Hach kits; a number of samples exceeded the maximum instrument reading.
(b)Replacement monitoring point for MW-26A which was destroyed during construction activities on the SteelCo (now Intsel) property in October 2004. Data for piezometer PZ-3, located approximately 100 ft south of the location of former monitoring well MW-26A, is reported in place of data for MW-26A.
(c)From Technical Protocol for Evaluating Natural Attenuation of Chlorinated Solvents in Groundwater , USEPA, 1998.
(d)The "most prevalent, mobile, persistent, and toxic compounds" found at the Site during remedial investigation activities in the late 1980s were selected and presented in the Site Record of Decision (USEPA, 1991) as Site indicator chemicals.
Laboratory results highlighted in yellow are greater than the analyte's MCL.
MCL Regulatory drinking water maximum contaminant level
mg/l milligrams per liter
mV millivolts
µg/l micrograms per liter
Bold Values in bold suggest biodegradation is possible.
NA Not analyzed
D Sample dilution required for analysis; reported values reflect the dilution.
T Analyte was positively identified but the reported concentration is estimated; reported concentration is less than the reporting limit, but greater than the method detection limit.
Analytical Results
MCLAnalyte/Parameter

TABLE 3
GROUNDWATER SAMPLING RESULTS AND NATURAL ATTENUATION INDICATORS FOR DEEPER WELLS
NOVEMBER 2015
WASATCH CHEMICAL SITE, SALT LAKE CITY, UTAH
Sample Identification MW-31D MW-32D MW-33D
Screened Interval (feet bgs) 38 - 48 46 - 56 35 - 45 Biodegradation
Date Collected 11/5/15 11/4/15 11/4/15 Indicator Purpose and/or Interpretation
Volatile Organic Compounds (µg/l) Analytical Method
Tetrachloroethene (PCE) SW8260B 5 <1 <1 <1 na Indicator chemical(d)
Trichloroethene (TCE) SW8260B 5 <1 <1 0.16 T detection Indicator chemical(d)
; degradation product of PCE
1,1-Dichloroethene (1,1-DCE) SW8260B 7 <1 <1 <1 detection Indicator chemical(d)
; degradation product of TCE
cis-1,2-Dichloroethene (cis-1,2-DCE) SW8260B 70 <1 <1 1.4 detection Degradation product of trichloroethene
trans-1,2-Dichloroethene (trans-1,2-DCE) SW8260B 100 <1 <1 <1 detection Degradation product of trichloroethene
Vinyl chloride (VC) SW8260B 2 <1 <1 0.6 T detection Degradation product of dichloroethenes
Benzene SW8260B 5 NA NA <0.5 na na
Ethylbenzene SW8260B 700 NA NA 5.1 na na
m,p-Xylene (Sum of Isomers) SW8260B 10,000(b) NA NA 7.2 na na
o-Xylene SW8260B 10,000(b) NA NA 3.1 na na
Naphthalene SW8260B na NA NA <1 na na
Toluene SW8260B 1,000 NA NA 0.64 na na
Geochemical parameters
pH (standard units) field measurement na 7.8 7.5 7.8 5 to 9(c) Optimal range for reductive pathway
Oxidation-reduction Potential (mV) field measurement na -171 -151 -177 <50(c) Reductive pathway possible
Dissolved Oxygen (mg/l) field measurement na 0.2 0.15 0.08 <0.5(c) Reductive pathway possible
Nitrate (mg/l) E300.0 10 0.0519 T 0.0518 T 0.0462 T <1(c) Reductive pathway possible
Nitrite (mg/l) E300.0 1 < 0.1 < 0.1 < 0.1 >1 Evidence of nitrate reduction
Iron II (mg/l) Hach 8146 na 0.50 1.03 1.08 >1(c) Reductive pathway possible
Sulfate (mg/l) E300.0 na 0.443 T 0.688 1.08 <20(c) At higher concentrations may compete with reductive pathway
Sulfide, total (mg/l) E376.2 na 0.0643 T 0.0608 T 0.0548 T >1(c) Evidence of sulfate reduction
Note: Deeper wells MW-31D, MW-32D, and MW-33D were installed in October 2011.
(a) Greater than the maximum reading on the field instrument.
(b) MCL listed is for the sum of o, m, and p xylenes.
(c) From Technical Protocol for Evaluating Natural Attenuation of Chlorinated Solvents in Groundwater , USEPA, 1998.
(d) The "most prevalent, mobile, persistent, and toxic compounds" found at the Site during remedial investigation activities were selected and presented in the Site Record of Decision (USEPA, 1991) as Site indicator chemicals.
µg/l micrograms per liter
bgs below ground surface
Bold Values in bold suggest biodegradation is possible.
D Sample dilution required for analysis; reported values reflect the dilution.
J Data estimated
MCL Regulatory drinking water maximum contaminant level
mg/l milligrams per liter
mV millivolts
na Not applicable
NA Not analyzed
T
UB
UJ Potential low bias, possible false negative
Analytical Results Natural Attenuation Assessment
MCL
Analyte was positively identified but reported concentration is estimated; reported concentration is less than the reporting limit, but greater than the method detection limit.
Analyte deemed not detected due to detection in associated blank sample.

#
!
#
!
#
! #
!#
! #
! #
!
#
!
#
!(A
(A
(A
(A
(A
(A
Í@
"
Í@
"
Í@
"
Í@
"
Í@
"
Í@"
Í@
"
Í@
"
ÍB
ÍB
(A
(A
(A
(A
(A
(A
(A
Ó
(A
Vitrified Soil
Intsel SteelWest Office
GroundwaterTreatment
SystemBuilding
SITEBOUNDARY
PetersonPlumbing Supply
MW 06
2100 South Street
70
0 W
es
t S
tre
et
Intsel Steel WestWarehouse
PZ 5
PZ 8
PZ 7
PZ 6 PZ 9
PZ 1
PZ 3
EX 11
MW 20
PZ 04
MW 22
MW 23
EX 01
WP 02
EX 02
EX 07
PZ 10
MW 25
MW 14
EX 04
MW 21
EX 05
EX 09
MW 30
MW 33D
MW 24A
MW 32D
MW 31D
ES 01
MW 34
MW 02
EX 08
μ0 250
Feet
15 J
an
20
16EXPLANATION
Shallow monitoring welllocation
Deeper monitoring welllocation
Extraction trenchdischarge sump location
Extraction well location
Piezometer location
Buildings of potentialconcern for vapor intrusion
Deeper groundwater andshallow soil investigationarea
Abandoned Nov 4, 2015
(A
Í@
"
#
!
ÍB
KEPCO+Office
D:\
MW
H\Q
uest
ar\W
asat
ch C
hem
ical
\PR
OG
RE
SS
RE
PO
RT
_No1
04\F
IGU
RE
S\F
ig 1
_F
ocu
sed
Inve
stig
atio
n A
rea_
Nov
2015
.mxd
WASATCH CHEMICAL SITE
GROUNDWATER MONITORING NETWORKAND FOCUSED INVESTIGATION AREA
Figure 1
Grayed symbols denote locationsused for shallow groundwater
level monitoring only
DR
AW
N B
Y
D. S
eve
rso
n
(A

Vitrified Soil
Intsel Steel WestOffice
SITEBOUNDARY
PetersonPlumbing Supply
GroundwaterTreatment
SystemBuilding
KEPCO+Office
700 WestDitch
2100 South Street
70
0 W
es
t S
tre
et
Intsel Steel WestWarehouse
PZ 5
PZ 1
PZ 3
EX 11
MW 20
PZ 04
MW 22
MW 23
EX 01
EX 08
WP 02
EX 02
EX 07
MW 02
MW 25 EX 04
MW 21
EX 05
EX 09
MW 30
MW 06
MW 33D
MW 24A
MW 32D
MW 31D
ES 01
(4226.31)
(4226.11)
(4225.84)
(4226.22)
(4226.38)(4227.04)
(4225.90)
(4225.99)
(4226.20)
(4226.26)
(4227.92)
(4227.49)
(4227.38)
(4227.50)
(4228.08)
(4227.77)
(4226.71)
(4225.98)
(4225.83)
(4225.70)
(4225.47) (4226.18)
(4226.16)
(4226.35) MW 34
4226.0
4225.5
4226.0
4225.5
4226.5
4227.0
4227.5
4228.0
4226.5
4227.0
μ0 250
Feet
MAPAREA
EXPLANATION
Shallow monitoring well location
Deep monitoring well location
Extraction trench discharge sump location
Extraction well location
Shallow piezometer location
Groundwater contours(dashed where inferred)
Water level elevation
Not measured
(A
Í@
"
#
!
ÍB
4225.5
(A
(4226.20)
D:\
MW
H\Q
uest
ar\
Wa
satc
h C
hem
ica
l\PR
OG
RE
SS
RE
PO
RT
_N
o1
04
\FIG
UR
ES
\Fig
2_
Sh
allo
w_
GW
_E
lev_
No
v20
15.
mxd
15 J
an
20
16
NM
WASATCH CHEMICAL SITE
SHALLOW GROUNDWATER ELEVATIONSNovember 2015
Figure 2
GeneralShallow Groundwater
Flow Direction
NOTES:
Grayed symbols are locations not includedin shallow groundwater level monitoringnetwork.
Shallow monitoring wells, piezometers,extraction wells, and trenches are less than25 feet deep.
Water levels measured Nov 2, 2015, priorto groundwater sampling.
1)
2)
3)
DR
AW
N B
Y
D. S
eve
rso
n
(A
(A
#
!
Í@
"
Í@
"
Í@
"
Í@
"
(A
(A
#
!
(A
ÍB
#
!
Í@
"
Í@"
(A
Í@
"
Í@
"
(A
(A
#
!
(A
ÍB
(A
(A
(A
(A
Vitrified Soil
Intsel SteelWest Office
SITEBOUNDARY
70
0 W
es
t S
tre
et
Intsel Steel WestWarehouse
PZ 5
PZ 1
PZ 3
EX 11
MW 20
PZ 04
MW 22
MW 23
EX 01
EX 08
WP 02
EX 02
EX 07
MW 02
MW 25 EX 04
MW 21
EX 05
EX 09
MW 30
MW 06
MW 33D(4228.54)
MW 24A
MW 32D (4227.35)
MW 31D(4227.43)
ES 01
MW 34
4228.0
4227.5
4228.5
μ
EXPLANATION
Deeper monitoring welllocation
Monitoring well location
Extraction trench discharge sump location
Extraction well location
Piezometer location
Deeper groundwater potentiometric surfacecontour (dashed whereinferred)
Water-level elevation
Maximum contaminant level
TetrachloroetheneTrichloroethene Dichloroethene Vinyl chloridePentachlorophenolDissolved oxygenOxidation-reduction potentialbelow ground surfacenot analyzedMicrograms per literMilligrams per literMillivolts
Sample diluted for analysisEstimatedIdentified below reporting limitPotential low bias, possiblefalse negative
(A
Í@
"
#
!
ÍB
15 J
an
20
16
(A
(4227.01)
PCETCEDCEVC
PCPDO
ORPbgsNAµg/lmg/lmV
DJT
UJ
D:\
MW
H\Q
uest
ar\
Wa
satc
h C
hem
ica
l\PR
OG
RE
SS
RE
PO
RT
_N
o1
04
\FIG
UR
ES
\Fig
3_
De
ep
_G
rou
nd
wa
ter_
No
v20
15
.mxd
4227.5
WASATCH CHEMICAL SITE
DEEPER GROUNDWATER ANALYTICALRESULTS AND WATER LEVEL ELEVATIONS
Figure 3November 2015
0 250
Feet
MCL
Water levels measured Nov 2, 2015.
Contours based on water-levelelevations measured in wells MW 31D,MW 32D, and MW 33D screened38-48, 46-56, and 35-45 feet bgs,respectively.
Volatile organic and/or herbicidecompounds have not been detectedin MW 31D or MW 32D; herbicidecompounds have not been detectedin MW 33D.
GroundwaterTreatment
SystemBuildingNOTES:
1)
2)
3)PetersonPlumbing
Supply
KEPCO+Office
DR
AW
N B
Y
D. S
eve
rso
n
Analyte 4/24/13
PCETCE1,1-DCEcis-1,2-DCEtrans-1,2-DCEVCPCPethylbenzenem/p-xyleneso-xylenestolueneORP (mV)DO (mg/l)
11/6/13MCL
557
7010021
70010,00010,0001000
--
0.7T0.29T
<13.4<11.3NA7
145.61.1
-1550.2
4631J<14.7<1<1
<0.527J83D4610-170.0
1948
0.3T140D
<1<1
<0.552
150D335.2
-1580.0
4.42.9
0.3T110D
<1<1
<0.53.6369.62.8
-1800.2
5.21.5<117<18.9
<0.5<17.512
0.7T-2270.2
6.21.8<115<12.1
<0.51033132.8
-1500.1
8.81.6<117<17.4
<0.55.139181.6
-2440.0
(a)
(a)
4/23/14
0.98T0.42T
<13.1<11.2NA12157.7
0.47T-1580.0
All concentrations reported in µg/l unless noted otherwiseYellow highlighting indicates concentration > MCLMCL for total xylenes is 10,000 µg/l(a)
MW 33D(screened 35-45 feet bgs)
12/28/11 2/7/12 5/3/12 8/28/12 11/15/12 4/21/15
0.27TJ0.3TJ
<11.5J
<1UJ0.47TJ
NA6.37.75
<0.5-1770.08
11/4/15
<10.16T
<11.4<1
0.6TNA5.17.23.1
0.64-1770.08

APPENDIX A
DATA VERIFICATION

A-1
APPENDIX A
DATA VERIFICATION
FALL 2015 GROUNDWATER SAMPLING
Introduction. Groundwater samples were collected as listed in Table A-1 at the Wasatch
Chemical Site November 2 through 5, 2015. A summary of the analytical data is
presented in Table A-2. The following paragraphs summarize the results of the data
validation.
Sampling Procedures. All groundwater samples were collected as scheduled and in
accordance with the Quality Assurance Project Plan (QAPP) Revision 2 (MWH, 2012),
the Monitored Natural Attenuation Work Plan (MWH, 2002), and the Focused Shallow
Soil and Deeper Groundwater Investigation and Sentry Well Installation Work Plan
(MWH, 2012a).
Analytical Procedures and Detection Limits. All samples were analyzed in accordance
with the methodology, detection limits, and quality control (QC) criteria specified in the
project QAPP (MWH, 2012). EMAX Laboratories Inc. provided analytical services.
Holding times were evaluated and are presented in Table A-3. All holding times met
method criteria.
Two field duplicate (FD) samples were collected. A summary of the field duplicate
results as compared with the normal sample results for these locations is presented in
Table A-4. Requested matrix spike (MS) and/or matrix spike duplicate (MSD) analyses
were performed on groundwater samples collected from monitoring well EX-11. The
additional two MS samples listed in Table A-1 were analyzed for laboratory batch QC.
The following occurred during sample analysis resulting in flagged or qualified data;
however, there was no impact to data usability:
Dilutions were required during VOC and general chemistry analyses due to the
high concentrations of analyte(s). The affected sample results are flagged with
a “D” to indicate sample dilution in Table A-2.
The ambient blank collected November 3, 2015 contained sulfate and the
equipment blank collected November 5, 2015 contained sulfate. The sulfate
concentrations in the associated samples are greater than 10X the blank
concentration and are not qualified. Non-conforming data are presented in
Table A-5.
Data Verification Process. The data were validated based on the criteria specified in the
project QAPP (MWH, 2012). The results of the data verification are summarized in the
following tables:

A-2
Table A-1, Summary of Groundwater Samples
Table A-2, Sample Data Summary
Table A-3, Holding Time Summary
Table A-4, Field Duplicate Data Summary
All holding times, reporting limits, accuracy, precision, and representativeness criteria, as
specified in the QAPP (MWH, 2012), were met with the exceptions presented in Table
A-5.
Conclusions. Based on the results of the data verification, the data are considered
precise, accurate, and representative. Sampling completeness for this project is 100
percent, and analytical completeness for this sampling round is 100 percent, which meets
the completeness goal of 85 percent.
References.
MWH, 1996. Final Ground-water Monitoring Plan, Wasatch Chemical Site. August
1996.
MWH, 2002. Monitored Natural Attenuation Work Plan, Wasatch Chemical Site
Addendum to the Final Extraction and Treatment System Performance Standards,
Milestones, and Shutdown Procedures document. November 14, 2002.
MWH, 2011. Final Groundwater Monitoring Well Installation and Sampling Plan,
Wasatch Chemical Site. October 2011.
MWH, 2012. Quality Assurance Project Plan, Revision 2, Wasatch Chemical Site.
March 2012.
MWH, 2012a. Final Focused Shallow Soil and Deeper Groundwater Investigation and
Sentry Well Installation Work Plan, Revision 2.0. November 2012.

TABLE A-1
SUMMARY OF GROUNDWATER SAMPLES
Q-83, NOVEMBER 2015
WASATCH CHEMICAL SITE, SALT LAKE CITY, UTAH
(Page 1 of 1)
Location
Identification
Field Sample
Identification
Date
Collected
Sample
Matrix
Sampling
Technique
Sample
Type
VOCs
SW-846
8260B
PCP
SW-846
8151A
Anions
E300
Sulfide
E376.2
ES-01 ES-01-83 3-Nov-15 WG G N X X X X
EX-02 EX-02-83 2-Nov-15 WG G N X X X X
EX-04 EX-04-83 3-Nov-15 WG G N X -- X X
EX-05 EX-05-83 2-Nov-15 WG G N X -- X X
EX-07 EX-07-83 3-Nov-15 WG G N X X X X
EX-07 EZ-13-83 3-Nov-15 WG G FD X X X X
EX-08 EX-08-83 4-Nov-15 WG G N X X X X
EX-09 EX-09-83 3-Nov-15 WG G N X -- X X
EX-11 EX-11-83 3-Nov-15 WG G N X X X X
EX-11 EX-11-83 3-Nov-15 WG G MS X X X X
EX-11 EX-11-83 3-Nov-15 WG G SD X X -- --
EX-11 EX-11-83 3-Nov-15 WG G LR -- -- X X
MW-06 MW-06-83 5-Nov-15 WG G N X -- X X
MW-20 MW-20-83 3-Nov-15 WG G N X -- X X
MW-23 MW-23-83 4-Nov-15 WG G N X -- X X
MW-23 MW-23-83 4-Nov-15 WG G MS -- -- X --
MW-23 MW-23-83 4-Nov-15 WG G LR -- -- X --
MW-24A MW-24A-83 4-Nov-15 WG G N X -- X X
MW-25 MW-25-83 4-Nov-15 WG G N X -- X X
MW-30 MW-30-83 5-Nov-15 WG G N X -- X X
MW-30 EX-14-83 5-Nov-15 WG G FD X -- X X
MW-31D MW-31D-83 5-Nov-15 WG G N X -- X X
MW-31D MW-31D-83 5-Nov-15 WG G MS -- -- -- X
MW-31D MW-31D-83 5-Nov-15 WG G LR -- -- -- X
MW-32D MW-32D-83 4-Nov-15 WG G N X -- X X
MW-33D MW-33D-83 4-Nov-15 WG G N X -- X X
MW-34 MW-34-83 5-Nov-15 WG G N X -- X X
PZ-1 PZ-1-83 4-Nov-15 WG G N X -- X X
PZ-3 PZ-3-83 4-Nov-15 WG G N X -- X X
FIELDQC FB-11-03-2015 3-Nov-15 WQ G AB X -- X X
FIELDQC RB-11-05-2015 5-Nov-15 WQ G EB X -- X X
FIELDQC TB021115 2-Nov-15 WQ G TB X -- -- --
FIELDQC TB031115 3-Nov-15 WQ G TB X -- -- --
FIELDQC TB041115 4-Nov-15 WQ G TB X -- -- --
FIELDQC TB051115 5-Nov-15 WQ G TB X -- -- --
AB Ambient blank MSD Matrix spike duplicate TB Trip blank
EB Equipment rinseate blank N Compliance sample VOCs Volatile organic compounds
FD Field Duplicate NA Not applicable WG Groundwater
G Grab sample NS Not sampled WQ Reagent Grade water or distilled water
LR Laboratory replicate PCP Pentachlorophenol X Sampled
MS Matrix spike -- Not collected

TABLE A-2
GROUNDWATER SAMPLE DATA SUMMARY
Q-83, NOVEMBER 2015
WASATCH CHEMICAL COMPANY, SALT LAKE CITY, UTAH
(Page 1 of 5)
Location Identification ES-01 EX-02 EX-04 EX-05 EX-07
Field Sample Identification ES-01-83 EX-02-83 EX-04-83 EX-05-83 EX-07-83
Sample Type Normal Normal Normal Normal Normal
Date Collected 11/3/2015 11/2/2015 11/3/2015 11/2/2015 11/3/2015
Analyte/Methods (Units)
Herbicides (µg/l)
Pentachlorophenol <0.5 2.2 D -- -- <0.5
Surrogate (Percent)
2,4-Dichlorophenylacetic Acid 115 62.4 -- -- 108
Chemistry Parameters (mg/l)
Nitrogen, Nitrate (as N) 0.18 0.0655 T 0.218 0.0588 T 0.0579 T
Nitrogen, Nitrite <0.1 <0.4 D <0.1 <0.3 D <0.3 D
Sulfate (as SO4) 20.3 D 1250 D 437 D 1430 D 265 D
Sulfide 0.36 <0.1 <0.1 <0.1 0.0149 T
Volatile Organic Compounds (µg/l)
1,1-Dichloroethene <1 4.8 1.2 8.3 0.49 T
Benzene -- -- -- -- --
cis-1,2-Dichloroethene 0.67 T 200 D 22 150 D 13
Ethylbenzene -- -- -- -- --
m,p-Xylene (Sum of isomers) -- -- -- -- --
Naphthalene -- -- -- -- --
o-Xylene (1,2-Dimethylbenzene) -- -- -- -- --
Tetrachloroethene (PCE) <1 <1 <1 <1 <1
Toluene -- -- -- -- --
trans-1,2-Dichloroethene 0.55 T 9.3 5.2 120 D 3.5
Trichloroethene (TCE) 1.3 24 0.62 T 0.35 T 2.5
Vinyl chloride 0.63 T 47 0.69 T 7.1 9.3
Surrogate (Percent)
1,2-Dichloroethane-d4 91.7 92.9 91 88.9 107
4-Bromofluorobenzene 108 105 109 108 108
Toluene-D8 103 103 105 106 106
µg/l micrograms per liter.
mg/l milligrams per liter.
Bold Bolded result indicates positively identified compound.
-- Not scheduled.
D Sample dilution required for analysis; reported values reflect the dilution.
T Analyte was positively identified but the reported concentration is estimated; reported concentration is less
than the reporting limit, but greater than the method detection limit.

TABLE A-2
GROUNDWATER SAMPLE DATA SUMMARY
Q-83, NOVEMBER 2015
WASATCH CHEMICAL COMPANY, SALT LAKE CITY, UTAH
(Page 2 of 5)
Location Identification EX-07 Dup EX-08 EX-09 EX-11 MW-06
Field Sample Identification EZ-13-83 EX-08-83 EX-09-83 EX-11-83 MW-06-83
Sample Type Field Duplicate Normal Normal Normal Normal
Date Collected 11/3/2015 11/4/2015 11/3/2015 11/3/2015 11/5/2015
Analyte/Methods (Units)
Herbicides (µg/l)
Pentachlorophenol <0.5 0.9 -- <0.5 --
Surrogate (Percent)
2,4-Dichlorophenylacetic Acid 103 127 -- 121 --
Chemistry Parameters (mg/l)
Nitrogen, Nitrate (as N) 0.0557 T 3.03 D 0.0602 T 0.0514 T 0.0587 T
Nitrogen, Nitrite <0.3 D <1.6 D <0.1 <0.4 D <0.1
Sulfate (as SO4) 259 D 556 D 1180 D 594 D 563 D
Sulfide 0.0186 T 0.0248 T <0.1 0.103 0.0219 T
Volatile Organic Compounds (µg/l)
1,1-Dichloroethene 0.48 T <1 1.7 <1 3.1
Benzene -- -- -- -- --
cis-1,2-Dichloroethene 12 0.11 T 27 7 26
Ethylbenzene -- -- -- -- --
m,p-Xylene (Sum of isomers) -- -- -- -- --
Naphthalene -- -- -- -- --
o-Xylene (1,2-Dimethylbenzene) -- -- -- -- --
Tetrachloroethene (PCE) <1 <1 <1 <1 <1
Toluene -- -- -- -- --
trans-1,2-Dichloroethene 3.4 <1 7.3 37 4.9
Trichloroethene (TCE) 2.8 0.16 T 0.19 T 0.84 T 0.24 T
Vinyl chloride 8.4 <1 0.16 T 41 1
Surrogate (Percent)
1,2-Dichloroethane-d4 91.1 111 92.3 88.2 83.2
4-Bromofluorobenzene 109 112 109 108 102
Toluene-D8 106 105 104 104 96.1
µg/l micrograms per liter.
mg/l milligrams per liter.
Bold Bolded result indicates positively identified compound.
-- Not scheduled.
D Sample dilution required for analysis; reported values reflect the dilution.
T Analyte was positively identified but the reported concentration is estimated; reported concentration is less
than the reporting limit, but greater than the method detection limit.
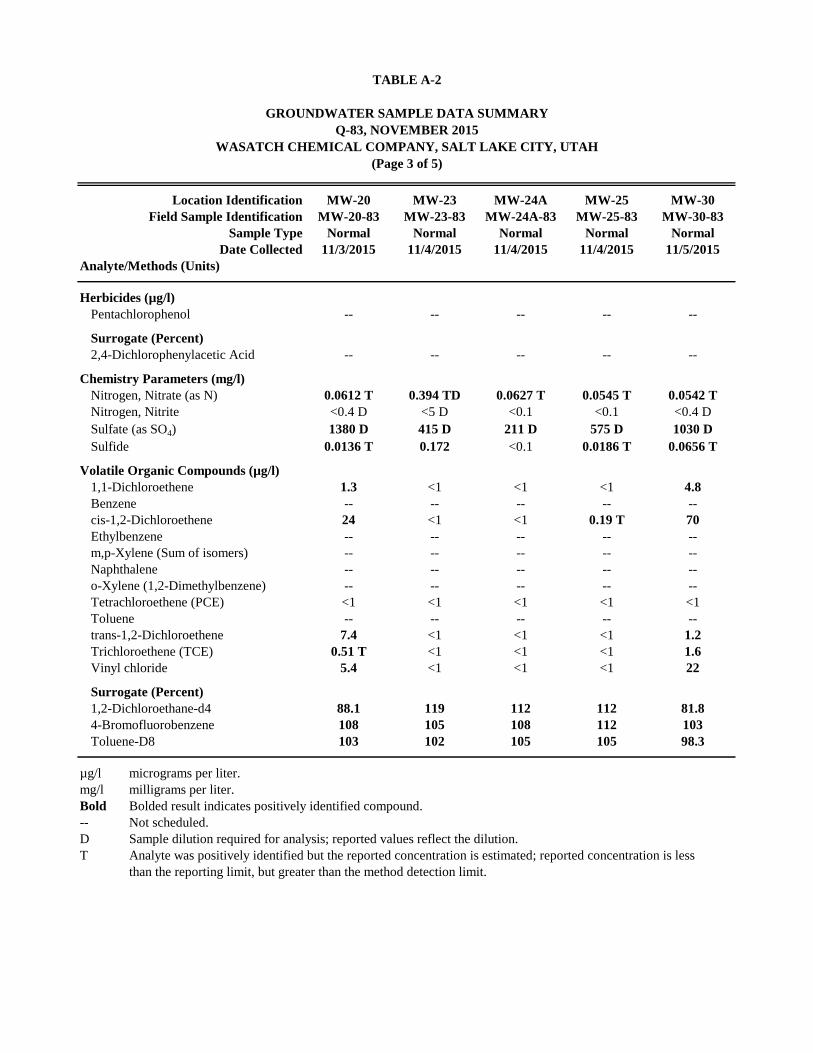
TABLE A-2
GROUNDWATER SAMPLE DATA SUMMARY
Q-83, NOVEMBER 2015
WASATCH CHEMICAL COMPANY, SALT LAKE CITY, UTAH
(Page 3 of 5)
Location Identification MW-20 MW-23 MW-24A MW-25 MW-30
Field Sample Identification MW-20-83 MW-23-83 MW-24A-83 MW-25-83 MW-30-83
Sample Type Normal Normal Normal Normal Normal
Date Collected 11/3/2015 11/4/2015 11/4/2015 11/4/2015 11/5/2015
Analyte/Methods (Units)
Herbicides (µg/l)
Pentachlorophenol -- -- -- -- --
Surrogate (Percent)
2,4-Dichlorophenylacetic Acid -- -- -- -- --
Chemistry Parameters (mg/l)
Nitrogen, Nitrate (as N) 0.0612 T 0.394 TD 0.0627 T 0.0545 T 0.0542 T
Nitrogen, Nitrite <0.4 D <5 D <0.1 <0.1 <0.4 D
Sulfate (as SO4) 1380 D 415 D 211 D 575 D 1030 D
Sulfide 0.0136 T 0.172 <0.1 0.0186 T 0.0656 T
Volatile Organic Compounds (µg/l)
1,1-Dichloroethene 1.3 <1 <1 <1 4.8
Benzene -- -- -- -- --
cis-1,2-Dichloroethene 24 <1 <1 0.19 T 70
Ethylbenzene -- -- -- -- --
m,p-Xylene (Sum of isomers) -- -- -- -- --
Naphthalene -- -- -- -- --
o-Xylene (1,2-Dimethylbenzene) -- -- -- -- --
Tetrachloroethene (PCE) <1 <1 <1 <1 <1
Toluene -- -- -- -- --
trans-1,2-Dichloroethene 7.4 <1 <1 <1 1.2
Trichloroethene (TCE) 0.51 T <1 <1 <1 1.6
Vinyl chloride 5.4 <1 <1 <1 22
Surrogate (Percent)
1,2-Dichloroethane-d4 88.1 119 112 112 81.8
4-Bromofluorobenzene 108 105 108 112 103
Toluene-D8 103 102 105 105 98.3
µg/l micrograms per liter.
mg/l milligrams per liter.
Bold Bolded result indicates positively identified compound.
-- Not scheduled.
D Sample dilution required for analysis; reported values reflect the dilution.
T Analyte was positively identified but the reported concentration is estimated; reported concentration is less
than the reporting limit, but greater than the method detection limit.

TABLE A-2
GROUNDWATER SAMPLE DATA SUMMARY
Q-83, NOVEMBER 2015
WASATCH CHEMICAL COMPANY, SALT LAKE CITY, UTAH
(Page 4 of 5)
Location Identification MW-30 Dup MW-31D MW-32D MW-33D MW-34
Field Sample Identification EX-14-83 MW-31D-83 MW-32D-83 MW-33D-83 MW-34-83
Sample Type Field Duplicate Normal Normal Normal Normal
Date Collected 11/5/2015 11/5/2015 11/4/2015 11/4/2015 11/5/2015
Analyte/Methods (Units)
Herbicides (µg/l)
Pentachlorophenol -- -- -- -- --
Surrogate (Percent)
2,4-Dichlorophenylacetic Acid -- -- -- -- --
Chemistry Parameters (mg/l)
Nitrogen, Nitrate (as N) 0.0527 T 0.0519 T 0.0518 T 0.0512 T 0.0589 T
Nitrogen, Nitrite <0.4 D <0.1 <0.1 <0.1 <0.1
Sulfate (as SO4) 1100 D 0.443 T 0.688 1.12 836 D
Sulfide 0.0617 T 0.0643 T 0.0608 T 0.0496 T 0.0308 T
Volatile Organic Compounds (µg/l)
1,1-Dichloroethene 4.3 <1 <1 <1 <1
Benzene -- -- -- <0.5 --
cis-1,2-Dichloroethene 71 <1 <1 1.4 1.9
Ethylbenzene -- -- -- 5.1 --
m,p-Xylene (Sum of isomers) -- -- -- 7.2 --
Naphthalene -- -- -- <1 --
o-Xylene (1,2-Dimethylbenzene) -- -- -- 3.1 --
Tetrachloroethene (PCE) <1 <1 <1 <1 <1
Toluene -- -- -- 0.64 --
trans-1,2-Dichloroethene 1.2 <1 <1 <1 0.49 T
Trichloroethene (TCE) 1.5 <1 <1 0.16 T 0.31 T
Vinyl chloride 22 <1 <1 0.6 T <1
Surrogate (Percent)
1,2-Dichloroethane-d4 83.4 89 109 111 83.2
4-Bromofluorobenzene 102 105 108 111 102
Toluene-D8 96.3 94.6 103 101 95.7
µg/l micrograms per liter.
mg/l milligrams per liter.
Bold Bolded result indicates positively identified compound.
-- Not scheduled.
D Sample dilution required for analysis; reported values reflect the dilution.
T Analyte was positively identified but the reported concentration is estimated; reported concentration is less
than the reporting limit, but greater than the method detection limit.

TABLE A-2
GROUNDWATER SAMPLE DATA SUMMARY
Q-83, NOVEMBER 2015
WASATCH CHEMICAL COMPANY, SALT LAKE CITY, UTAH
(Page 5 of 5)
Location Identification PZ-1 PZ-3
Field Sample Identification PZ-1-83 PZ-3-83
Sample Type Normal Normal
Date Collected 11/4/2015 11/4/2015
Analyte/Methods (Units)
Herbicides (µg/l)
Pentachlorophenol -- --
Surrogate (Percent)
2,4-Dichlorophenylacetic Acid -- --
Chemistry Parameters (mg/l)
Nitrogen, Nitrate (as N) 0.0636 T 0.0687 T
Nitrogen, Nitrite <0.1 <0.2 D
Sulfate (as SO4) 202 D 2370 D
Sulfide 0.0856 T 0.0211 T
Volatile Organic Compounds (µg/l)
1,1-Dichloroethene <1 <1
Benzene -- --
cis-1,2-Dichloroethene <1 <1
Ethylbenzene -- --
m,p-Xylene (Sum of isomers) -- --
Naphthalene -- --
o-Xylene (1,2-Dimethylbenzene) -- --
Tetrachloroethene (PCE) <1 <1
Toluene -- --
trans-1,2-Dichloroethene <1 <1
Trichloroethene (TCE) <1 <1
Vinyl chloride <1 <1
Surrogate (Percent)
1,2-Dichloroethane-d4 108 113
4-Bromofluorobenzene 111 105
Toluene-D8 106 103
µg/l micrograms per liter.
mg/l milligrams per liter.
Bold Bolded result indicates positively identified compound.
-- Not scheduled.
D Sample dilution required for analysis; reported values reflect the dilution.
T Analyte was positively identified but the reported concentration is estimated; reported concentration is less
than the reporting limit, but greater than the method detection limit.

TABLE A-3
HOLDING TIME SUMMARY
Q-83, NOVEMBER 2015
WASATCH CHEMICAL COMPANY, SALT LAKE CITY, UTAH
(Page 1 of 4)
Location
Identification
Field
Identification
Sample
Date
Sample
Time
Analysis
Code
Preparation
Date
Preparation
Holding
Time
(Days)
Method
Holding
Time
(Days)
Analysis
Date
Analysis
Time
Analysis
Holding
Time
(Days)
Method
Holding
Time
(Days)
ES-01 ES-01-83 3-Nov-15 1055 E300 N/A N/A N/A 4-Nov-15 1329 1 28
ES-01 ES-01-83 3-Nov-15 1055 E300 N/A N/A N/A 4-Nov-15 1748 1 28
ES-01 ES-01-83 3-Nov-15 1055 E376.2 N/A N/A N/A 6-Nov-15 1417 3 7
ES-01 ES-01-83 3-Nov-15 1055 SW8151A 5-Nov-15 2 7 6-Nov-15 207 1 40
ES-01 ES-01-83 3-Nov-15 1055 SW8260B 4-Nov-15 1 7 4-Nov-15 1451 1 7
EX-02 EX-02-83 2-Nov-15 1545 E300 N/A N/A N/A 3-Nov-15 1140 1 28
EX-02 EX-02-83 2-Nov-15 1545 E300 N/A N/A N/A 3-Nov-15 1211 1 28
EX-02 EX-02-83 2-Nov-15 1545 E300 N/A N/A N/A 3-Nov-15 1241 1 28
EX-02 EX-02-83 2-Nov-15 1545 E376.2 N/A N/A N/A 3-Nov-15 1839 1 7
EX-02 EX-02-83 2-Nov-15 1545 SW8151A 5-Nov-15 3 7 6-Nov-15 1324 1 40
EX-02 EX-02-83 2-Nov-15 1545 SW8260B 3-Nov-15 1 7 3-Nov-15 1641 1 7
EX-02 EX-02-83 2-Nov-15 1545 SW8260B 3-Nov-15 1 7 3-Nov-15 1914 1 7
EX-04 EX-04-83 3-Nov-15 1200 E300 N/A N/A N/A 4-Nov-15 1313 1 28
EX-04 EX-04-83 3-Nov-15 1200 E300 N/A N/A N/A 4-Nov-15 1803 1 28
EX-04 EX-04-83 3-Nov-15 1200 E376.2 N/A N/A N/A 6-Nov-15 1417 3 7
EX-04 EX-04-83 3-Nov-15 1200 SW8260B 4-Nov-15 1 7 4-Nov-15 1906 1 7
EX-05 EX-05-83 2-Nov-15 1700 E300 N/A N/A N/A 3-Nov-15 1155 1 28
EX-05 EX-05-83 2-Nov-15 1700 E300 N/A N/A N/A 3-Nov-15 1226 1 28
EX-05 EX-05-83 2-Nov-15 1700 E300 N/A N/A N/A 3-Nov-15 1256 1 28
EX-05 EX-05-83 2-Nov-15 1700 E376.2 N/A N/A N/A 3-Nov-15 1839 1 7
EX-05 EX-05-83 2-Nov-15 1700 SW8260B 3-Nov-15 1 7 3-Nov-15 1707 1 7
EX-05 EX-05-83 2-Nov-15 1700 SW8260B 3-Nov-15 1 7 3-Nov-15 1940 1 7
EX-07 EX-07-83 3-Nov-15 1550 E300 N/A N/A N/A 4-Nov-15 1243 1 28
EX-07 EX-07-83 3-Nov-15 1550 E300 N/A N/A N/A 4-Nov-15 1647 1 28
EX-07 EX-07-83 3-Nov-15 1550 E300 N/A N/A N/A 4-Nov-15 1919 1 28
EX-07 EX-07-83 3-Nov-15 1550 E376.2 N/A N/A N/A 6-Nov-15 1421 3 7
EX-07 EX-07-83 3-Nov-15 1550 SW8151A 5-Nov-15 2 7 6-Nov-15 555 1 40
EX-07 EX-07-83 3-Nov-15 1550 SW8260B 5-Nov-15 2 7 5-Nov-15 1336 2 7
EX-07 EZ-13-83 3-Nov-15 1550 E300 N/A N/A N/A 4-Nov-15 1258 1 28
EX-07 EZ-13-83 3-Nov-15 1550 E300 N/A N/A N/A 4-Nov-15 1632 1 28
EX-07 EZ-13-83 3-Nov-15 1550 E300 N/A N/A N/A 4-Nov-15 1904 1 28
EX-07 EZ-13-83 3-Nov-15 1550 E376.2 N/A N/A N/A 6-Nov-15 1420 3 7
EX-07 EZ-13-83 3-Nov-15 1550 SW8151A 5-Nov-15 2 7 6-Nov-15 526 1 40
EX-07 EZ-13-83 3-Nov-15 1550 SW8260B 4-Nov-15 1 7 4-Nov-15 1932 1 7
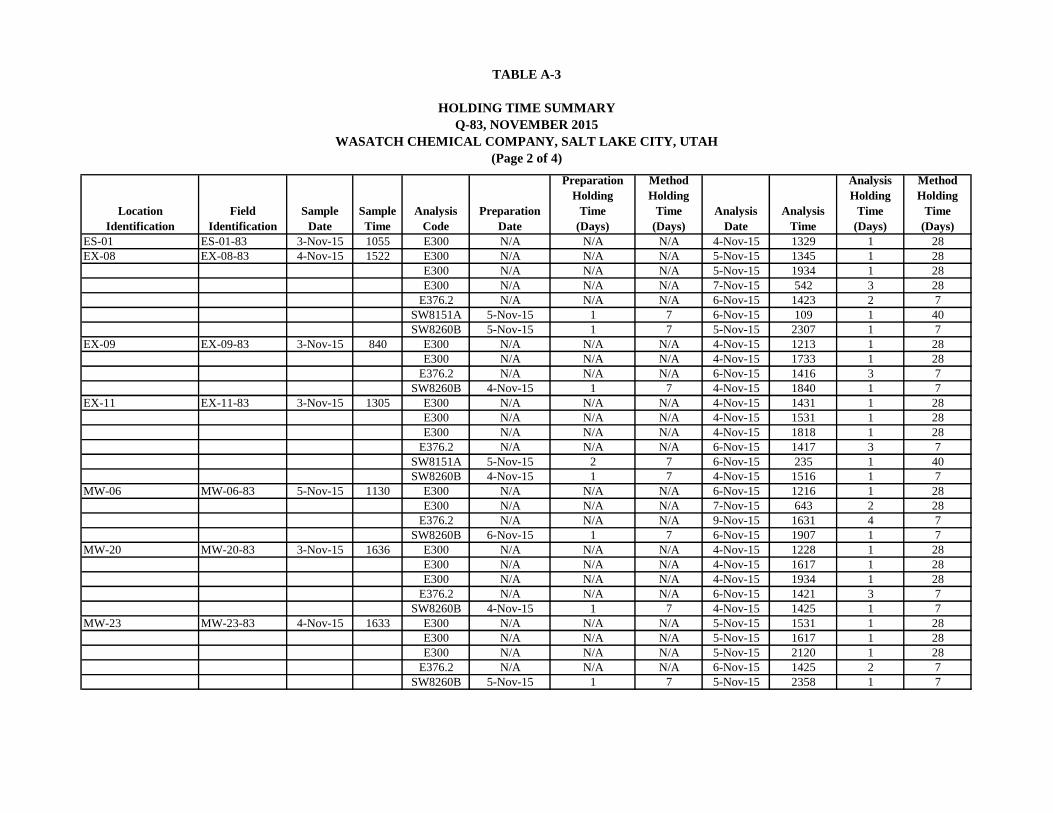
TABLE A-3
HOLDING TIME SUMMARY
Q-83, NOVEMBER 2015
WASATCH CHEMICAL COMPANY, SALT LAKE CITY, UTAH
(Page 2 of 4)
Location
Identification
Field
Identification
Sample
Date
Sample
Time
Analysis
Code
Preparation
Date
Preparation
Holding
Time
(Days)
Method
Holding
Time
(Days)
Analysis
Date
Analysis
Time
Analysis
Holding
Time
(Days)
Method
Holding
Time
(Days)
ES-01 ES-01-83 3-Nov-15 1055 E300 N/A N/A N/A 4-Nov-15 1329 1 28
EX-08 EX-08-83 4-Nov-15 1522 E300 N/A N/A N/A 5-Nov-15 1345 1 28
EX-08 EX-08-83 4-Nov-15 1522 E300 N/A N/A N/A 5-Nov-15 1934 1 28
EX-08 EX-08-83 4-Nov-15 1522 E300 N/A N/A N/A 7-Nov-15 542 3 28
EX-08 EX-08-83 4-Nov-15 1522 E376.2 N/A N/A N/A 6-Nov-15 1423 2 7
EX-08 EX-08-83 4-Nov-15 1522 SW8151A 5-Nov-15 1 7 6-Nov-15 109 1 40
EX-08 EX-08-83 4-Nov-15 1522 SW8260B 5-Nov-15 1 7 5-Nov-15 2307 1 7
EX-09 EX-09-83 3-Nov-15 840 E300 N/A N/A N/A 4-Nov-15 1213 1 28
EX-09 EX-09-83 3-Nov-15 840 E300 N/A N/A N/A 4-Nov-15 1733 1 28
EX-09 EX-09-83 3-Nov-15 840 E376.2 N/A N/A N/A 6-Nov-15 1416 3 7
EX-09 EX-09-83 3-Nov-15 840 SW8260B 4-Nov-15 1 7 4-Nov-15 1840 1 7
EX-11 EX-11-83 3-Nov-15 1305 E300 N/A N/A N/A 4-Nov-15 1431 1 28
EX-11 EX-11-83 3-Nov-15 1305 E300 N/A N/A N/A 4-Nov-15 1531 1 28
EX-11 EX-11-83 3-Nov-15 1305 E300 N/A N/A N/A 4-Nov-15 1818 1 28
EX-11 EX-11-83 3-Nov-15 1305 E376.2 N/A N/A N/A 6-Nov-15 1417 3 7
EX-11 EX-11-83 3-Nov-15 1305 SW8151A 5-Nov-15 2 7 6-Nov-15 235 1 40
EX-11 EX-11-83 3-Nov-15 1305 SW8260B 4-Nov-15 1 7 4-Nov-15 1516 1 7
MW-06 MW-06-83 5-Nov-15 1130 E300 N/A N/A N/A 6-Nov-15 1216 1 28
MW-06 MW-06-83 5-Nov-15 1130 E300 N/A N/A N/A 7-Nov-15 643 2 28
MW-06 MW-06-83 5-Nov-15 1130 E376.2 N/A N/A N/A 9-Nov-15 1631 4 7
MW-06 MW-06-83 5-Nov-15 1130 SW8260B 6-Nov-15 1 7 6-Nov-15 1907 1 7
MW-20 MW-20-83 3-Nov-15 1636 E300 N/A N/A N/A 4-Nov-15 1228 1 28
MW-20 MW-20-83 3-Nov-15 1636 E300 N/A N/A N/A 4-Nov-15 1617 1 28
MW-20 MW-20-83 3-Nov-15 1636 E300 N/A N/A N/A 4-Nov-15 1934 1 28
MW-20 MW-20-83 3-Nov-15 1636 E376.2 N/A N/A N/A 6-Nov-15 1421 3 7
MW-20 MW-20-83 3-Nov-15 1636 SW8260B 4-Nov-15 1 7 4-Nov-15 1425 1 7
MW-23 MW-23-83 4-Nov-15 1633 E300 N/A N/A N/A 5-Nov-15 1531 1 28
MW-23 MW-23-83 4-Nov-15 1633 E300 N/A N/A N/A 5-Nov-15 1617 1 28
MW-23 MW-23-83 4-Nov-15 1633 E300 N/A N/A N/A 5-Nov-15 2120 1 28
MW-23 MW-23-83 4-Nov-15 1633 E376.2 N/A N/A N/A 6-Nov-15 1425 2 7
MW-23 MW-23-83 4-Nov-15 1633 SW8260B 5-Nov-15 1 7 5-Nov-15 2358 1 7
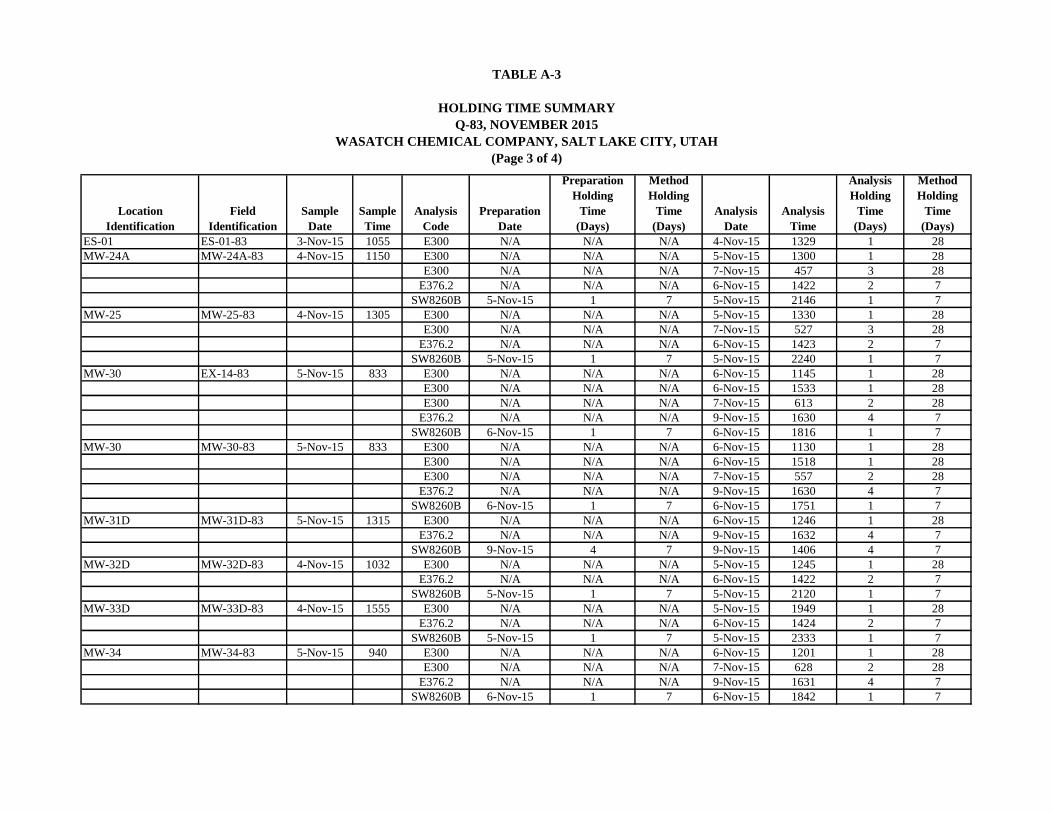
TABLE A-3
HOLDING TIME SUMMARY
Q-83, NOVEMBER 2015
WASATCH CHEMICAL COMPANY, SALT LAKE CITY, UTAH
(Page 3 of 4)
Location
Identification
Field
Identification
Sample
Date
Sample
Time
Analysis
Code
Preparation
Date
Preparation
Holding
Time
(Days)
Method
Holding
Time
(Days)
Analysis
Date
Analysis
Time
Analysis
Holding
Time
(Days)
Method
Holding
Time
(Days)
ES-01 ES-01-83 3-Nov-15 1055 E300 N/A N/A N/A 4-Nov-15 1329 1 28
MW-24A MW-24A-83 4-Nov-15 1150 E300 N/A N/A N/A 5-Nov-15 1300 1 28
MW-24A MW-24A-83 4-Nov-15 1150 E300 N/A N/A N/A 7-Nov-15 457 3 28
MW-24A MW-24A-83 4-Nov-15 1150 E376.2 N/A N/A N/A 6-Nov-15 1422 2 7
MW-24A MW-24A-83 4-Nov-15 1150 SW8260B 5-Nov-15 1 7 5-Nov-15 2146 1 7
MW-25 MW-25-83 4-Nov-15 1305 E300 N/A N/A N/A 5-Nov-15 1330 1 28
MW-25 MW-25-83 4-Nov-15 1305 E300 N/A N/A N/A 7-Nov-15 527 3 28
MW-25 MW-25-83 4-Nov-15 1305 E376.2 N/A N/A N/A 6-Nov-15 1423 2 7
MW-25 MW-25-83 4-Nov-15 1305 SW8260B 5-Nov-15 1 7 5-Nov-15 2240 1 7
MW-30 EX-14-83 5-Nov-15 833 E300 N/A N/A N/A 6-Nov-15 1145 1 28
MW-30 EX-14-83 5-Nov-15 833 E300 N/A N/A N/A 6-Nov-15 1533 1 28
MW-30 EX-14-83 5-Nov-15 833 E300 N/A N/A N/A 7-Nov-15 613 2 28
MW-30 EX-14-83 5-Nov-15 833 E376.2 N/A N/A N/A 9-Nov-15 1630 4 7
MW-30 EX-14-83 5-Nov-15 833 SW8260B 6-Nov-15 1 7 6-Nov-15 1816 1 7
MW-30 MW-30-83 5-Nov-15 833 E300 N/A N/A N/A 6-Nov-15 1130 1 28
MW-30 MW-30-83 5-Nov-15 833 E300 N/A N/A N/A 6-Nov-15 1518 1 28
MW-30 MW-30-83 5-Nov-15 833 E300 N/A N/A N/A 7-Nov-15 557 2 28
MW-30 MW-30-83 5-Nov-15 833 E376.2 N/A N/A N/A 9-Nov-15 1630 4 7
MW-30 MW-30-83 5-Nov-15 833 SW8260B 6-Nov-15 1 7 6-Nov-15 1751 1 7
MW-31D MW-31D-83 5-Nov-15 1315 E300 N/A N/A N/A 6-Nov-15 1246 1 28
MW-31D MW-31D-83 5-Nov-15 1315 E376.2 N/A N/A N/A 9-Nov-15 1632 4 7
MW-31D MW-31D-83 5-Nov-15 1315 SW8260B 9-Nov-15 4 7 9-Nov-15 1406 4 7
MW-32D MW-32D-83 4-Nov-15 1032 E300 N/A N/A N/A 5-Nov-15 1245 1 28
MW-32D MW-32D-83 4-Nov-15 1032 E376.2 N/A N/A N/A 6-Nov-15 1422 2 7
MW-32D MW-32D-83 4-Nov-15 1032 SW8260B 5-Nov-15 1 7 5-Nov-15 2120 1 7
MW-33D MW-33D-83 4-Nov-15 1555 E300 N/A N/A N/A 5-Nov-15 1949 1 28
MW-33D MW-33D-83 4-Nov-15 1555 E376.2 N/A N/A N/A 6-Nov-15 1424 2 7
MW-33D MW-33D-83 4-Nov-15 1555 SW8260B 5-Nov-15 1 7 5-Nov-15 2333 1 7
MW-34 MW-34-83 5-Nov-15 940 E300 N/A N/A N/A 6-Nov-15 1201 1 28
MW-34 MW-34-83 5-Nov-15 940 E300 N/A N/A N/A 7-Nov-15 628 2 28
MW-34 MW-34-83 5-Nov-15 940 E376.2 N/A N/A N/A 9-Nov-15 1631 4 7
MW-34 MW-34-83 5-Nov-15 940 SW8260B 6-Nov-15 1 7 6-Nov-15 1842 1 7

TABLE A-3
HOLDING TIME SUMMARY
Q-83, NOVEMBER 2015
WASATCH CHEMICAL COMPANY, SALT LAKE CITY, UTAH
(Page 4 of 4)
Location
Identification
Field
Identification
Sample
Date
Sample
Time
Analysis
Code
Preparation
Date
Preparation
Holding
Time
(Days)
Method
Holding
Time
(Days)
Analysis
Date
Analysis
Time
Analysis
Holding
Time
(Days)
Method
Holding
Time
(Days)
ES-01 ES-01-83 3-Nov-15 1055 E300 N/A N/A N/A 4-Nov-15 1329 1 28
PZ-1 PZ-1-83 4-Nov-15 1225 E300 N/A N/A N/A 5-Nov-15 1315 1 28
PZ-1 PZ-1-83 4-Nov-15 1225 E300 N/A N/A N/A 7-Nov-15 512 3 28
PZ-1 PZ-1-83 4-Nov-15 1225 E376.2 N/A N/A N/A 6-Nov-15 1423 2 7
PZ-1 PZ-1-83 4-Nov-15 1225 SW8260B 5-Nov-15 1 7 5-Nov-15 2213 1 7
PZ-3 PZ-3-83 4-Nov-15 1000 E300 N/A N/A N/A 5-Nov-15 1230 1 28
PZ-3 PZ-3-83 4-Nov-15 1000 E300 N/A N/A N/A 5-Nov-15 1401 1 28
PZ-3 PZ-3-83 4-Nov-15 1000 E300 N/A N/A N/A 7-Nov-15 442 3 28
PZ-3 PZ-3-83 4-Nov-15 1000 E376.2 N/A N/A N/A 6-Nov-15 1421 2 7
PZ-3 PZ-3-83 4-Nov-15 1000 SW8260B 5-Nov-15 1 7 5-Nov-15 2055 1 7
N/A Not applicable

TABLE A-4
FIELD DUPLICATE DATA SUMMARY
Q-83, NOVEMBER 2015
WASATCH CHEMICAL COMPANY, SALT LAKE CITY, UTAH
Location Identification EX-07 EX-07 Dup MW-30 MW-30 Dup
Field Sample Identification EX-07-83 EZ-13-83 MW-30-83 EX-14-83
Sample Type Normal Field Duplicate Normal Field Duplicate
Date Collected 11/3/2015 11/3/2015 11/5/2015 11/5/2015
Analyte/Methods (Units) RPD RPD
Herbicides (µg/l)
Pentachlorophenol <0.5 <0.5 NC -- -- --
Surrogate (Percent)
2,4-Dichlorophenylacetic Acid 108 103 NC -- -- --
Chemistry Parameters (mg/l)
Nitrogen, Nitrate (as N) 0.0579 T 0.0557 T NC 0.0542 T 0.0527 T NC
Nitrogen, Nitrite <0.3 D <0.3 D NC <0.4 D <0.4 D NC
Sulfate (as SO4) 265 259 2.29 1030 D 1100 D 6.57
Sulfide 0.0149 T 0.0186 T NC 0.0656 T 0.0617 T NC
Volatile Organic Compounds (µg/l)
1,1-Dichloroethene 0.49 T 0.48 T NC 4.8 4.3 10.99
cis-1,2-Dichloroethene 13 12 8 70 71 1.42
Tetrachloroethene (PCE) <1 <1 NC <1 <1 NC
trans-1,2-Dichloroethene 3.5 3.4 2.9 1.2 1.2 0
Trichloroethene (TCE) 2.5 2.8 11.32 1.6 1.5 6.45
Vinyl chloride 9.3 8.4 10.17 22 22 0
Surrogate (Percent)
1,2-Dichloroethane-d4 107 91.1 NC 81.8 83.4 NC
4-Bromofluorobenzene 108 109 NC 103 102 NC
Toluene-D8 106 106 NC 98.3 96.3 NC
µg/l micrograms per liter.
mg/l milligrams per liter.
Bold Bolded result indicates positively identified compound.
-- Not scheduled.
NC Not calculated.
D Sample dilution required for analysis; reported values reflect the dilution.
RPD relative percent difference
T Analyte was positively identified but the reported concentration is estimated; reported concentration is less
than the reporting limit, but greater than the method detection limit.

TABLE A-5
NON-CONFORMING DATA SUMMARY
Q-83, NOVEMBER 2015
WASATCH CHEMICAL, SALT LAKE CITY, UTAH
(Page 1 of 3)
Location
Identification
Sample
Identification
Sample
Date Analysis Analyte
Sample
Result
Sample
Units
QC
Type
QC
Result Bias Comment
EX-14 EX-14-83 5-Nov-15 E300 Sulfate (as SO4) 1100 mg/L EB 0.366
mg/L
High Analyte detected in
associated blank.
Sample
concentration >10X
concentration. Data
not qualified.
MW-34 MW-34-83 5-Nov-15 E300 Sulfate (as SO4) 836 mg/L EB 0.366
mg/L
High Analyte detected in
associated blank.
Sample
concentration >10X
concentration. Data
not qualified.
MW-30 MW-30-83 5-Nov-15 E300 Sulfate (as SO4) 1030 µg/L EB 0.366
mg/L
Low Analyte detected in
associated blank.
Sample
concentration >10X
concentration. Data
not qualified.
EX-07 EX-07-83 3-Nov-15 E300 Sulfate (as SO4) 265 µg/L AB 0.828
mg/L
Low Analyte detected in
associated blank.
Sample
concentration >10X
concentration. Data
not qualified.

TABLE A-5
NON-CONFORMING DATA SUMMARY
Q-83, NOVEMBER 2015
WASATCH CHEMICAL, SALT LAKE CITY, UTAH
(Page 2 of 3)
Location
Identification
Sample
Identification
Sample
Date Analysis Analyte
Sample
Result
Sample
Units
QC
Type
QC
Result Bias Comment
EZ-13 EZ-13-83 3-Nov-15 E300 Sulfate (as SO4) 259 µg/L AB 0.828
mg/L
Low Analyte detected in
associated blank.
Sample
concentration >10X
concentration. Data
not qualified.
MW-20 MW-20-83 21-Apr-15 E300 Sulfate (as SO4) 1380 mg/L AB 0.828
mg/L
Low Analyte detected in
associated blank.
Sample
concentration >10X
concentration. Data
not qualified.
ES-01 ES-01-83 21-Apr-15 E300 Sulfate (as SO4) 20.3 mg/L AB 0.828
mg/L
Low Analyte detected in
associated blank.
Sample
concentration >10X
concentration. Data
not qualified.
EX-04 EX-04-83 21-Apr-15 E300 Sulfate (as SO4) 437 mg/L AB 0.828
mg/L
Low Analyte detected in
associated blank.
Sample
concentration >10X
concentration. Data
not qualified.

TABLE A-5
NON-CONFORMING DATA SUMMARY
Q-83, NOVEMBER 2015
WASATCH CHEMICAL, SALT LAKE CITY, UTAH
(Page 3 of 3)
Location
Identification
Sample
Identification
Sample
Date Analysis Analyte
Sample
Result
Sample
Units
QC
Type
QC
Result Bias Comment
EX-09 EX-09-83 21-Apr-15 E300 Sulfate (as SO4) 1180 mg/L AB 0.828
mg/L
Low Analyte detected in
associated blank.
Sample
concentration >10X
concentration. Data
not qualified.
EX-11 EX-11-83 21-Apr-15 E300 Sulfate (as SO4) 594 mg/L AB 0.828
mg/L
Low Analyte detected in
associated blank.
Sample
concentration >10X
concentration. Data
not qualified.
mg/L milligrams per liter
AB ambient blank
EB equipment blank
QC quality control
APPENDIX B
HISTORICAL TIME SERIES GROUNDWATER MONITORING DATA

APPENDIX B
GROUNDWATER ANALYTICAL DATA
HISTORICAL TIME SERIES TABLES AND PLOTS
WASATCH CHEMICAL SITE
List of Exhibits
Exhibit B-1 Historical Time Series Data Extraction Trench ES-01
Exhibit B-2 Historical Time Series Data Extraction Well EX-02
Exhibit B-3 Historical Time Series Data Extraction Well EX-04
Exhibit B-4 Historical Time Series Data Extraction Well EX-05
Exhibit B-5 Historical Time Series Data Extraction Well EX-07
Exhibit B-6 Historical Time Series Data Extraction Well EX-08
Exhibit B-7 Historical Time Series Data Extraction Well EX-09
Exhibit B-8 Historical Time Series Data Extraction Trench EX-11
Exhibit B-9 Historical Time Series Data Monitoring Well MW-06
Exhibit B-10 Historical Time Series Data Monitoring Well MW-20
Exhibit B-11 Historical Time Series Data Monitoring Well MW-23
Exhibit B-12 Historical Time Series Data Monitoring Well MW-24A
Exhibit B-13 Historical Time Series Data Monitoring Well MW-25
Exhibit B-14 Historical Time Series Data Monitoring Well MW-30
Exhibit B-15 Historical Time Series Data Monitoring Well MW-31D
Exhibit B-16 Historical Time Series Data Monitoring Well MW-32D
Exhibit B-17 Historical Time Series Data Monitoring Well MW-33D
Exhibit B-18 Historical Time Series Data Monitoring Well MW-34
Exhibit B-19 Historical Time Series Data Piezometer PZ-1
Exhibit B-20 Historical Time Series Data Piezometer PZ-3

APPENDIX B
LIST OF ACRONYMS AND DATA QUALIFIERS
g/l micrograms per liter
2,4-D 2,4-dichlorophenoxyacetic acid
B Analyte was detected in associated blank sample
BZ benzene
BZME toluene
D Sample dilution was conducted
DCE dichloroethene
EBZ ethylbenzene
G Data qualifier definition is unknown
J Value was estimated
J+ Value was estimated, biased high
J- Value was estimated, biased low
PCE tetrachloroethene
PCP pentachlorophenol
T Analyte was positively identified but reported concentration is estimated; reported
concentration is less than the reporting limit, but greater than the method detection limit
TCE trichloroethene
U Analyte not detected above the method detection limit
UB Analyte deemed not detected due to detection in associated blank sample
UJ Potential low bias, possible false negative

EXHIBIT B-1WASATCH CHEMICAL SITEHISTORICAL DATA TRENDSEXTRACTION TRENCH ES-01
Page 1 of 77
SampleDate
PCE(µg/l)
TCE(µg/l)
1,1-DCE(µg/l)
cis-1,2-DCE(µg/l)
trans-1,2-DCE(µg/l)
VC(µg/l)
2,4-D(µg/l)
PCP(µg/l)
6-Nov-97 2200 890 270 -- -- -- 260 470012-Feb-98 850 B 310 B 53 -- -- -- 33 870 JG19-May-98 1300 620 140 -- -- -- 38 110012-Aug-98 2000 770 100 -- -- -- 65 98017-Nov-98 2000 690 87 -- -- -- 48 100023-Feb-99 1600 J 750 J 82 J -- -- -- 30 67026-May-99 1200 660 < 500 G -- -- -- 55 64025-Aug-99 1200 410 33 T -- -- -- 35 24017-Nov-99 1000 590 36 T -- -- -- 16 38022-Feb-00 730 270 18 T -- -- -- 11.4 7923-May-00 690 570 28 T -- -- -- 14.2 2106-Oct-00 670 D 460 D 36 D -- -- -- 25 J 120 D
23-May-01 450 D 410 D 30 D -- -- -- 13 360 D19-Nov-01 603 D 555 D 33 D -- -- -- 10 13015-May-02 907 D 524 D 33 D -- -- -- 7.9 10020-Nov-02 280 D 100 D < 50 D -- -- -- 8.6 43 T25-Feb-03 30 59 3.5 -- -- 64 1.6 8 T6-May-03 130 D 100 D 3 TD -- -- 31 D 1.7 1.312-Aug-03 5.7 14 2.2 -- -- 505 D < 0.5 0.3 TJ5-Nov-03 4.0 TD 6 TD < 10 D -- -- 51 D < 2.4 0.07 TJ
14-May-04 80 DJ 106 D 9.7 -- -- 80 D -- 21 D3-Nov-04 18 19 0.7 T -- -- 6.1 -- 3.2
10-May-05 < 50 D 35 TD < 50 D -- -- 70 D -- 5.1 J31-Oct-05 < 25 D < 25 D < 25 D -- -- < 25 D -- < 0.5 16-May-06 3.6 24 5.7 -- -- 60 D -- 8 D6-Nov-06 2 4.5 0.55 T -- -- 10 J- -- < 0.5 9-Apr-07 23 39 1.9 -- -- 11 -- 1.529-Oct-07 1.4 2 < 1 -- -- 2.4 -- 0.11 T28-Apr-08 13 62 D 6.1 -- -- 85 D -- 16 D14-Oct-08 1.2 2.4 < 1 -- -- 1.6 -- < 0.5 7-Apr-09 70 D 150 D 10 J 210 D 1.8 J 75 D -- 42 TDJ3-Nov-09 0.37 T 1.7 < 1 0.81 T 0.5 T 0.73 T -- < 0.5 26-Apr-10 14 47 6.7 78 0.77 T 30 J -- 26 D26-Oct-10 0.21 T 0.44 T < 1 0.45 T < 1 0.35 T -- < 0.5 11-Apr-11 4.7 19 2.6 48 0.64 T 18 -- 8.6 D9-Nov-11 0.29 T 2.3 < 1 1.4 0.39 T 1.2 -- < 0.5 1-May-12 1.6 10 1.5 64 0.8 T 60 D -- 10 D12-Nov-12 0.31 T 1.4 < 1 0.6 T < 1 0.44 T -- < 0.5 23-Apr-13 5 29 2.9 26 0.42 T 13 -- 4.0 D5-Nov-13 < 1 0.76 T 0.27 T 0.74 T 0.37 T 0.83 T -- < 0.5 22-Apr-14 1.1 59 1.1 44 0.87 T 39 -- < 0.5 4-Nov-14 < 1 0.89 T 0.38 T 0.7 T 1.1 0.82 T -- < 0.5 22-Apr-15 0.16 T 11 0.46 T 4.3 0.71 T 3 -- < 0.5 3-Nov-15 < 1 1.3 < 1 0.67 T 0.55 T 0.63 T -- < 0.5
Data qualifiers are defined in laboratory reports. For data collected since 2001, a list of data qualifier definitions is includedat the front of this appendix.-- Not analyzed
LABORATORY PARAMETERS
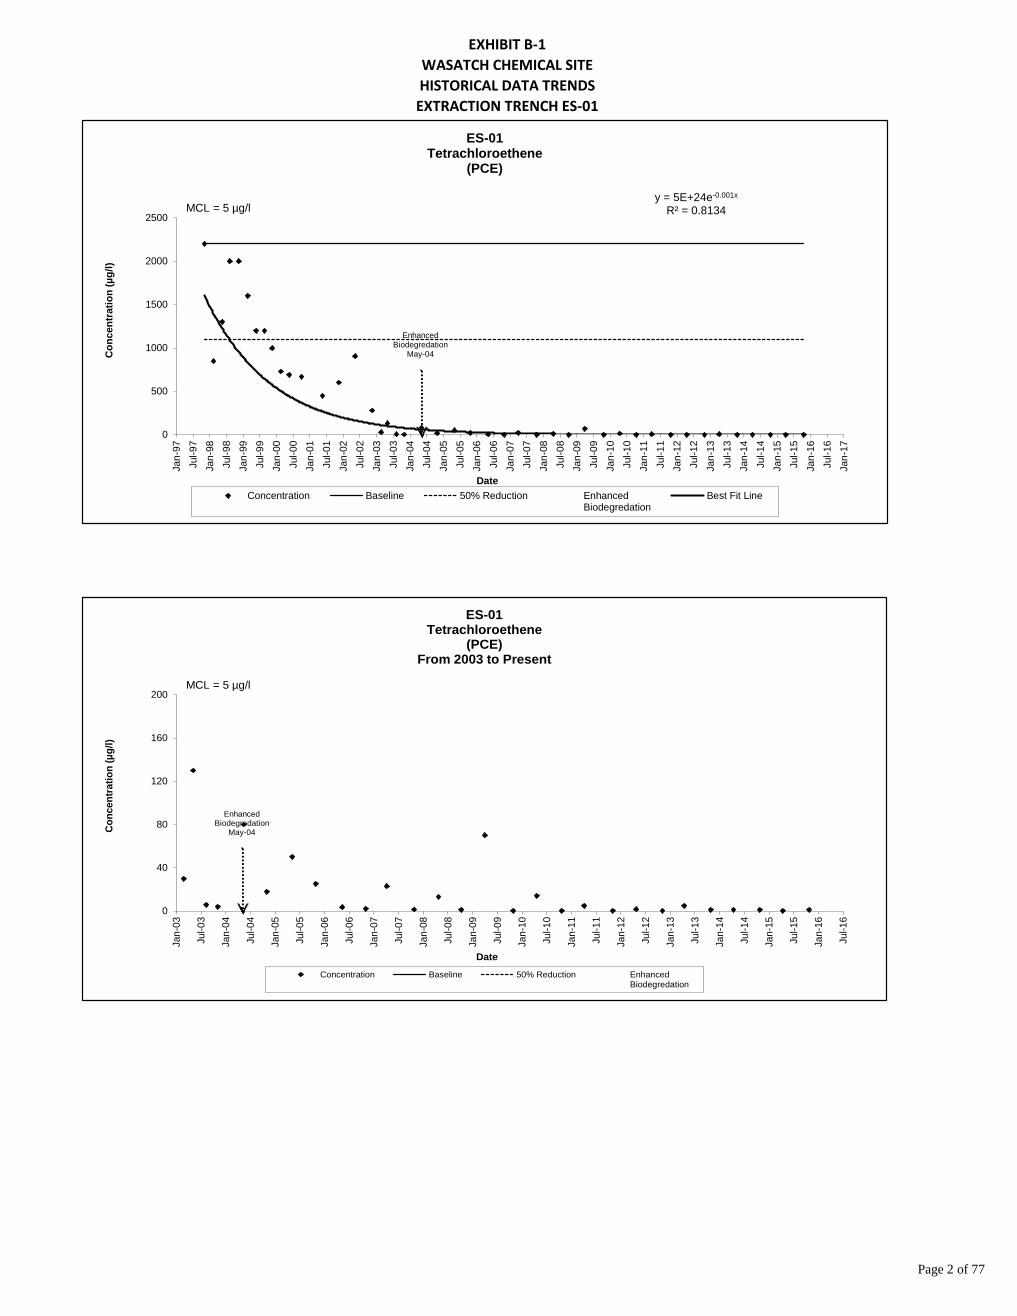
EXHIBIT B-1WASATCH CHEMICAL SITEHISTORICAL DATA TRENDSEXTRACTION TRENCH ES-01
Page 2 of 77
EnhancedBiodegredation
May-04
y = 5E+24e-0.001x
R² = 0.8134
0
500
1000
1500
2000
2500
Jan-
97Ju
l-97
Jan-
98Ju
l-98
Jan-
99Ju
l-99
Jan-
00Ju
l-00
Jan-
01Ju
l-01
Jan-
02Ju
l-02
Jan-
03Ju
l-03
Jan-
04Ju
l-04
Jan-
05Ju
l-05
Jan-
06Ju
l-06
Jan-
07Ju
l-07
Jan-
08Ju
l-08
Jan-
09Ju
l-09
Jan-
10Ju
l-10
Jan-
11Ju
l-11
Jan-
12Ju
l-12
Jan-
13Ju
l-13
Jan-
14Ju
l-14
Jan-
15Ju
l-15
Jan-
16Ju
l-16
Jan-
17
Con
cent
ratio
n (µ
g/l)
Date
ES-01Tetrachloroethene
(PCE)
Concentration Baseline 50% Reduction EnhancedBiodegredation
Best Fit Line
MCL = 5 µg/l
EnhancedBiodegredation
May-04
0
40
80
120
160
200
Jan-
03
Jul-0
3
Jan-
04
Jul-0
4
Jan-
05
Jul-0
5
Jan-
06
Jul-0
6
Jan-
07
Jul-0
7
Jan-
08
Jul-0
8
Jan-
09
Jul-0
9
Jan-
10
Jul-1
0
Jan-
11
Jul-1
1
Jan-
12
Jul-1
2
Jan-
13
Jul-1
3
Jan-
14
Jul-1
4
Jan-
15
Jul-1
5
Jan-
16
Jul-1
6
Con
cent
ratio
n (µ
g/l)
Date
ES-01Tetrachloroethene
(PCE)From 2003 to Present
Concentration Baseline 50% Reduction EnhancedBiodegredation
MCL = 5 µg/l

EXHIBIT B-1WASATCH CHEMICAL SITEHISTORICAL DATA TRENDSEXTRACTION TRENCH ES-01
Page 3 of 77
EnhancedBiodegredation
May-04
y = 2E+17e-9E-04x
R² = 0.6597
0
200
400
600
800
1000
Jan-
97Ju
l-97
Jan-
98Ju
l-98
Jan-
99Ju
l-99
Jan-
00Ju
l-00
Jan-
01Ju
l-01
Jan-
02Ju
l-02
Jan-
03Ju
l-03
Jan-
04Ju
l-04
Jan-
05Ju
l-05
Jan-
06Ju
l-06
Jan-
07Ju
l-07
Jan-
08Ju
l-08
Jan-
09Ju
l-09
Jan-
10Ju
l-10
Jan-
11Ju
l-11
Jan-
12Ju
l-12
Jan-
13Ju
l-13
Jan-
14Ju
l-14
Jan-
15Ju
l-15
Jan-
16Ju
l-16
Jan-
17
Con
cent
ratio
n (µ
g/l)
Date
ES-01Trichloroethene
(TCE)
Concentration Baseline 50% Reduction EnhancedBiodegredation
Best Fit Line
MCL = 5 µg/l
EnhancedBiodegredation
May-04
0
40
80
120
160
200
Jan-
03
Jul-0
3
Jan-
04
Jul-0
4
Jan-
05
Jul-0
5
Jan-
06
Jul-0
6
Jan-
07
Jul-0
7
Jan-
08
Jul-0
8
Jan-
09
Jul-0
9
Jan-
10
Jul-1
0
Jan-
11
Jul-1
1
Jan-
12
Jul-1
2
Jan-
13
Jul-1
3
Jan-
14
Jul-1
4
Jan-
15
Jul-1
5
Jan-
16
Jul-1
6
Con
cent
ratio
n (µ
g/l)
Date
ES-01Trichloroethene
(TCE)From 2003 to Present
Concentration Baseline 50% Reduction EnhancedBiodegredation
MCL = 5 µg/l

EXHIBIT B-1WASATCH CHEMICAL SITEHISTORICAL DATA TRENDSEXTRACTION TRENCH ES-01
Page 4 of 77
EnhancedBiodegredation
May-04
0
20
40
60
80
100
Jan-
03
Jul-0
3
Jan-
04
Jul-0
4
Jan-
05
Jul-0
5
Jan-
06
Jul-0
6
Jan-
07
Jul-0
7
Jan-
08
Jul-0
8
Jan-
09
Jul-0
9
Jan-
10
Jul-1
0
Jan-
11
Jul-1
1
Jan-
12
Jul-1
2
Jan-
13
Jul-1
3
Jan-
14
Jul-1
4
Jan-
15
Jul-1
5
Jan-
16
Jul-1
6
Con
cent
ratio
n (µ
g/l)
Date
ES-011,1-Dichloroethene
(1,1-DCE)From 2003 to Present
Concentration Baseline 50% Reduction EnhancedBiodegredation
MCL = 7 µg/l
EnhancedBiodegredation
May-04
y = 4E+14e-8E-04x
R² = 0.7089
0
120
240
360
480
600
Jan-
97Ju
l-97
Jan-
98Ju
l-98
Jan-
99Ju
l-99
Jan-
00Ju
l-00
Jan-
01Ju
l-01
Jan-
02Ju
l-02
Jan-
03Ju
l-03
Jan-
04Ju
l-04
Jan-
05Ju
l-05
Jan-
06Ju
l-06
Jan-
07Ju
l-07
Jan-
08Ju
l-08
Jan-
09Ju
l-09
Jan-
10Ju
l-10
Jan-
11Ju
l-11
Jan-
12Ju
l-12
Jan-
13Ju
l-13
Jan-
14Ju
l-14
Jan-
15Ju
l-15
Jan-
16Ju
l-16
Jan-
17
Con
cent
ratio
n (µ
g/l)
Date
ES-011,1-Dichloroethene
(1,1-DCE)
Concentration Baseline 50% Reduction EnhancedBiodegredation
Best Fit Line
MCL = 7 µg/l
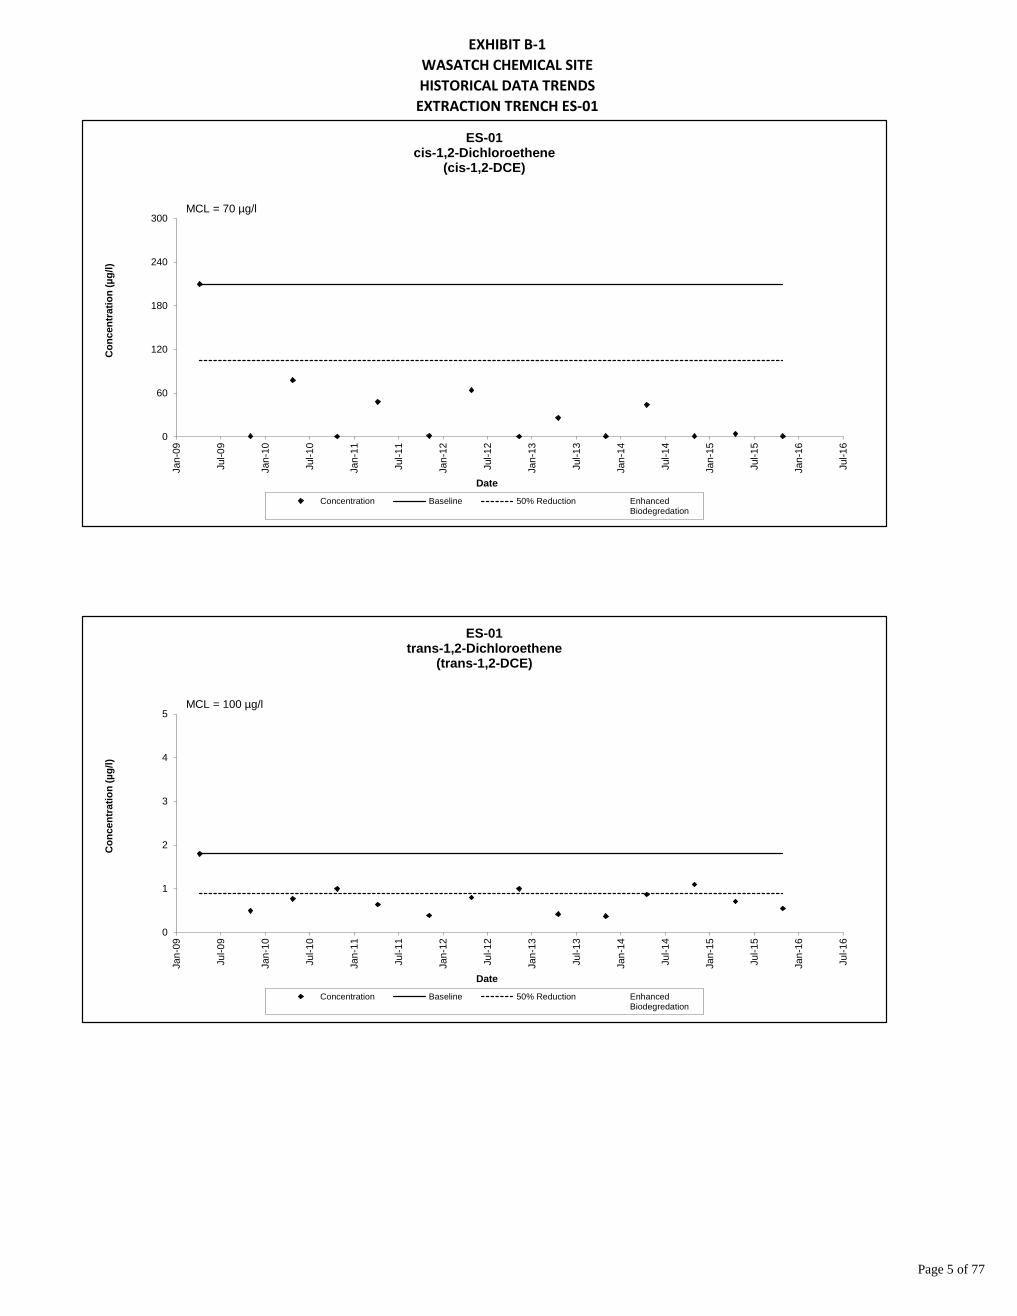
EXHIBIT B-1WASATCH CHEMICAL SITEHISTORICAL DATA TRENDSEXTRACTION TRENCH ES-01
Page 5 of 77
0
60
120
180
240
300
Jan-
09
Jul-0
9
Jan-
10
Jul-1
0
Jan-
11
Jul-1
1
Jan-
12
Jul-1
2
Jan-
13
Jul-1
3
Jan-
14
Jul-1
4
Jan-
15
Jul-1
5
Jan-
16
Jul-1
6
Con
cent
ratio
n (µ
g/l)
Date
ES-01cis-1,2-Dichloroethene
(cis-1,2-DCE)
Concentration Baseline 50% Reduction EnhancedBiodegredation
MCL = 70 µg/l
0
1
2
3
4
5
Jan-
09
Jul-0
9
Jan-
10
Jul-1
0
Jan-
11
Jul-1
1
Jan-
12
Jul-1
2
Jan-
13
Jul-1
3
Jan-
14
Jul-1
4
Jan-
15
Jul-1
5
Jan-
16
Jul-1
6
Con
cent
ratio
n (µ
g/l)
Date
ES-01trans-1,2-Dichloroethene
(trans-1,2-DCE)
Concentration Baseline 50% Reduction EnhancedBiodegredation
MCL = 100 µg/l

EXHIBIT B-1WASATCH CHEMICAL SITEHISTORICAL DATA TRENDSEXTRACTION TRENCH ES-01
Page 6 of 77
EnhancedBiodegredation
May-04
y = 2E+15e-8E-04x
R² = 0.3569
0
120
240
360
480
600
Jan-
03
Jul-0
3
Jan-
04
Jul-0
4
Jan-
05
Jul-0
5
Jan-
06
Jul-0
6
Jan-
07
Jul-0
7
Jan-
08
Jul-0
8
Jan-
09
Jul-0
9
Jan-
10
Jul-1
0
Jan-
11
Jul-1
1
Jan-
12
Jul-1
2
Jan-
13
Jul-1
3
Jan-
14
Jul-1
4
Jan-
15
Jul-1
5
Jan-
16
Jul-1
6
Con
cent
ratio
n (µ
g/l)
Date
ES-01Vinyl Chloride
(VC)
Concentration Baseline 50% Reduction EnhancedBiodegredation
Best Fit Line
MCL = 2 µg/l

EXHIBIT B-1WASATCH CHEMICAL SITEHISTORICAL DATA TRENDSEXTRACTION TRENCH ES-01
Page 7 of 77
EnhancedBiodegredation
May-04
y = 3E+20e-0.001x
R² = 0.5797
0
2000
4000
6000
8000
10000
Jan-
97Ju
l-97
Jan-
98Ju
l-98
Jan-
99Ju
l-99
Jan-
00Ju
l-00
Jan-
01Ju
l-01
Jan-
02Ju
l-02
Jan-
03Ju
l-03
Jan-
04Ju
l-04
Jan-
05Ju
l-05
Jan-
06Ju
l-06
Jan-
07Ju
l-07
Jan-
08Ju
l-08
Jan-
09Ju
l-09
Jan-
10Ju
l-10
Jan-
11Ju
l-11
Jan-
12Ju
l-12
Jan-
13Ju
l-13
Jan-
14Ju
l-14
Jan-
15Ju
l-15
Jan-
16Ju
l-16
Jan-
17
Con
cent
ratio
n (µ
g/l)
Date
ES-01Pentachlorophenol
(PCP)
Concentration Baseline 50% Reduction EnhancedBiodegredation
Best Fit Line
MCL = 1 µg/l
EnhancedBiodegredation
May-04
0
20
40
60
80
100
Jan-
03
Jul-0
3
Jan-
04
Jul-0
4
Jan-
05
Jul-0
5
Jan-
06
Jul-0
6
Jan-
07
Jul-0
7
Jan-
08
Jul-0
8
Jan-
09
Jul-0
9
Jan-
10
Jul-1
0
Jan-
11
Jul-1
1
Jan-
12
Jul-1
2
Jan-
13
Jul-1
3
Jan-
14
Jul-1
4
Jan-
15
Jul-1
5
Jan-
16
Jul-1
6
Con
cent
ratio
n (µ
g/l)
Date
ES-01Pentachlorophenol
(PCP)From 2003 to Present
Concentration Baseline 50% Reduction EnhancedBiodegredation
MCL = 1 µg/l
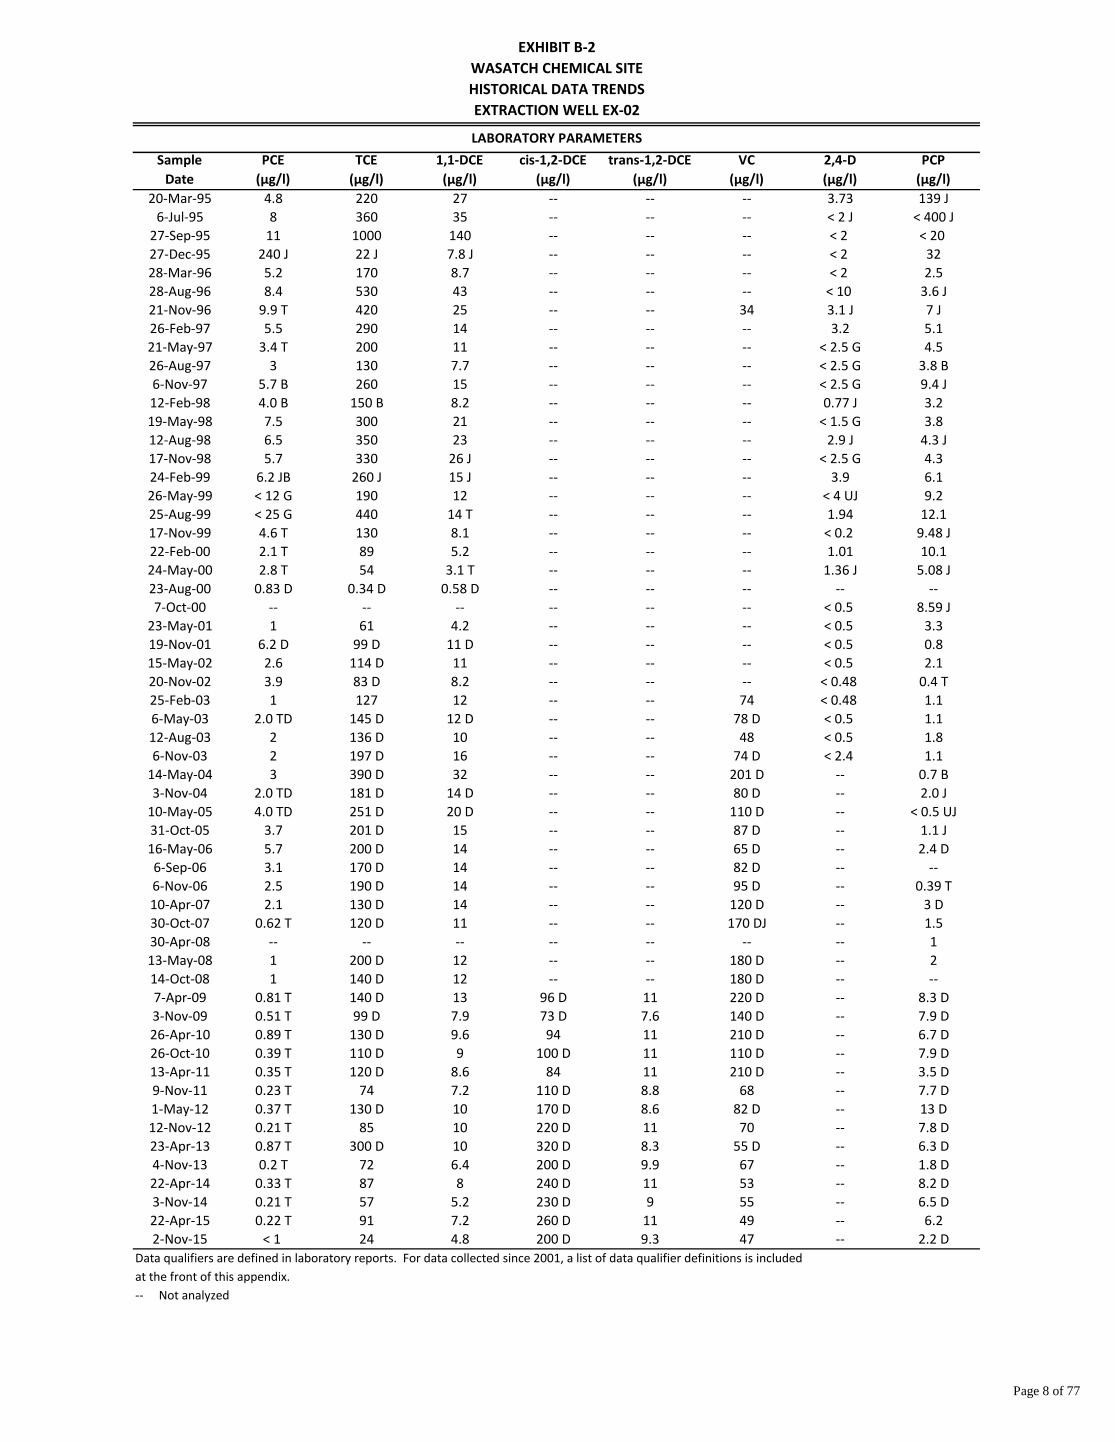
EXHIBIT B-2WASATCH CHEMICAL SITEHISTORICAL DATA TRENDSEXTRACTION WELL EX-02
Page 8 of 77
SampleDate
PCE(µg/l)
TCE(µg/l)
1,1-DCE(µg/l)
cis-1,2-DCE(µg/l)
trans-1,2-DCE(µg/l)
VC(µg/l)
2,4-D(µg/l)
PCP(µg/l)
20-Mar-95 4.8 220 27 -- -- -- 3.73 139 J6-Jul-95 8 360 35 -- -- -- < 2 J < 400 J
27-Sep-95 11 1000 140 -- -- -- < 2 < 20 27-Dec-95 240 J 22 J 7.8 J -- -- -- < 2 3228-Mar-96 5.2 170 8.7 -- -- -- < 2 2.528-Aug-96 8.4 530 43 -- -- -- < 10 3.6 J21-Nov-96 9.9 T 420 25 -- -- 34 3.1 J 7 J26-Feb-97 5.5 290 14 -- -- -- 3.2 5.121-May-97 3.4 T 200 11 -- -- -- < 2.5 G 4.526-Aug-97 3 130 7.7 -- -- -- < 2.5 G 3.8 B6-Nov-97 5.7 B 260 15 -- -- -- < 2.5 G 9.4 J12-Feb-98 4.0 B 150 B 8.2 -- -- -- 0.77 J 3.219-May-98 7.5 300 21 -- -- -- < 1.5 G 3.812-Aug-98 6.5 350 23 -- -- -- 2.9 J 4.3 J17-Nov-98 5.7 330 26 J -- -- -- < 2.5 G 4.324-Feb-99 6.2 JB 260 J 15 J -- -- -- 3.9 6.126-May-99 < 12 G 190 12 -- -- -- < 4 UJ 9.225-Aug-99 < 25 G 440 14 T -- -- -- 1.94 12.117-Nov-99 4.6 T 130 8.1 -- -- -- < 0.2 9.48 J22-Feb-00 2.1 T 89 5.2 -- -- -- 1.01 10.124-May-00 2.8 T 54 3.1 T -- -- -- 1.36 J 5.08 J23-Aug-00 0.83 D 0.34 D 0.58 D -- -- -- -- --7-Oct-00 -- -- -- -- -- -- < 0.5 8.59 J
23-May-01 1 61 4.2 -- -- -- < 0.5 3.319-Nov-01 6.2 D 99 D 11 D -- -- -- < 0.5 0.815-May-02 2.6 114 D 11 -- -- -- < 0.5 2.120-Nov-02 3.9 83 D 8.2 -- -- -- < 0.48 0.4 T25-Feb-03 1 127 12 -- -- 74 < 0.48 1.16-May-03 2.0 TD 145 D 12 D -- -- 78 D < 0.5 1.112-Aug-03 2 136 D 10 -- -- 48 < 0.5 1.86-Nov-03 2 197 D 16 -- -- 74 D < 2.4 1.1
14-May-04 3 390 D 32 -- -- 201 D -- 0.7 B3-Nov-04 2.0 TD 181 D 14 D -- -- 80 D -- 2.0 J
10-May-05 4.0 TD 251 D 20 D -- -- 110 D -- < 0.5 UJ31-Oct-05 3.7 201 D 15 -- -- 87 D -- 1.1 J16-May-06 5.7 200 D 14 -- -- 65 D -- 2.4 D6-Sep-06 3.1 170 D 14 -- -- 82 D -- --6-Nov-06 2.5 190 D 14 -- -- 95 D -- 0.39 T10-Apr-07 2.1 130 D 14 -- -- 120 D -- 3 D30-Oct-07 0.62 T 120 D 11 -- -- 170 DJ -- 1.530-Apr-08 -- -- -- -- -- -- -- 113-May-08 1 200 D 12 -- -- 180 D -- 214-Oct-08 1 140 D 12 -- -- 180 D -- --7-Apr-09 0.81 T 140 D 13 96 D 11 220 D -- 8.3 D3-Nov-09 0.51 T 99 D 7.9 73 D 7.6 140 D -- 7.9 D26-Apr-10 0.89 T 130 D 9.6 94 11 210 D -- 6.7 D26-Oct-10 0.39 T 110 D 9 100 D 11 110 D -- 7.9 D13-Apr-11 0.35 T 120 D 8.6 84 11 210 D -- 3.5 D9-Nov-11 0.23 T 74 7.2 110 D 8.8 68 -- 7.7 D1-May-12 0.37 T 130 D 10 170 D 8.6 82 D -- 13 D12-Nov-12 0.21 T 85 10 220 D 11 70 -- 7.8 D23-Apr-13 0.87 T 300 D 10 320 D 8.3 55 D -- 6.3 D4-Nov-13 0.2 T 72 6.4 200 D 9.9 67 -- 1.8 D22-Apr-14 0.33 T 87 8 240 D 11 53 -- 8.2 D3-Nov-14 0.21 T 57 5.2 230 D 9 55 -- 6.5 D22-Apr-15 0.22 T 91 7.2 260 D 11 49 -- 6.22-Nov-15 < 1 24 4.8 200 D 9.3 47 -- 2.2 D
Data qualifiers are defined in laboratory reports. For data collected since 2001, a list of data qualifier definitions is includedat the front of this appendix.-- Not analyzed
LABORATORY PARAMETERS

EXHIBIT B-2WASATCH CHEMICAL SITEHISTORICAL DATA TRENDSEXTRACTION WELL EX-02
Page 9 of 77
EnhancedBiodegredation
May-04
EnhancedBiodegredation
July-06
y = 4E+08e-5E-04x
R² = 0.6732
0
60
120
180
240
300Ja
n-95
Jul-9
5Ja
n-96
Jul-9
6Ja
n-97
Jul-9
7Ja
n-98
Jul-9
8Ja
n-99
Jul-9
9Ja
n-00
Jul-0
0Ja
n-01
Jul-0
1Ja
n-02
Jul-0
2Ja
n-03
Jul-0
3Ja
n-04
Jul-0
4Ja
n-05
Jul-0
5Ja
n-06
Jul-0
6Ja
n-07
Jul-0
7Ja
n-08
Jul-0
8Ja
n-09
Jul-0
9Ja
n-10
Jul-1
0Ja
n-11
Jul-1
1Ja
n-12
Jul-1
2Ja
n-13
Jul-1
3Ja
n-14
Jul-1
4Ja
n-15
Jul-1
5Ja
n-16
Jul-1
6Ja
n-17
Con
cent
ratio
n (µ
g/l)
Date
EX-02Tetrachloroethene
(PCE)
Concentration Baseline 50% Reduction EnhancedBiodegredation
Best Fit Line
MCL = 5 µg/l
EnhancedBiodegredation
May-04
EnhancedBiodegredation
July-06
0
2
4
6
8
10
Jan-
03
Jul-0
3
Jan-
04
Jul-0
4
Jan-
05
Jul-0
5
Jan-
06
Jul-0
6
Jan-
07
Jul-0
7
Jan-
08
Jul-0
8
Jan-
09
Jul-0
9
Jan-
10
Jul-1
0
Jan-
11
Jul-1
1
Jan-
12
Jul-1
2
Jan-
13
Jul-1
3
Jan-
14
Jul-1
4
Jan-
15
Jul-1
5
Jan-
16
Jul-1
6
Con
cent
ratio
n (µ
g/l)
Date
EX-02Tetrachloroethene
(PCE)From 2003 to Present
Concentration Baseline 50% Reduction EnhancedBiodegredation
MCL = 5 µg/l

EXHIBIT B-2WASATCH CHEMICAL SITEHISTORICAL DATA TRENDSEXTRACTION WELL EX-02
Page 10 of 77
EnhancedBiodegredation
May-04
EnhancedBiodegredation
July-06
y = 11394e-1E-04x
R² = 0.0584
0
240
480
720
960
1200
Jan-
95Ju
l-95
Jan-
96Ju
l-96
Jan-
97Ju
l-97
Jan-
98Ju
l-98
Jan-
99Ju
l-99
Jan-
00Ju
l-00
Jan-
01Ju
l-01
Jan-
02Ju
l-02
Jan-
03Ju
l-03
Jan-
04Ju
l-04
Jan-
05Ju
l-05
Jan-
06Ju
l-06
Jan-
07Ju
l-07
Jan-
08Ju
l-08
Jan-
09Ju
l-09
Jan-
10Ju
l-10
Jan-
11Ju
l-11
Jan-
12Ju
l-12
Jan-
13Ju
l-13
Jan-
14Ju
l-14
Jan-
15Ju
l-15
Jan-
16Ju
l-16
Jan-
17
Con
cent
ratio
n (µ
g/l)
Date
EX-02Trichloroethene
(TCE)
Concentration Baseline 50% Reduction EnhancedBiodegredation
Best Fit Line
MCL = 5 µg/l
EnhancedBiodegredation
May-04
EnhancedBiodegredation
July-06
0
100
200
300
400
500
Jan-
03
Jul-0
3
Jan-
04
Jul-0
4
Jan-
05
Jul-0
5
Jan-
06
Jul-0
6
Jan-
07
Jul-0
7
Jan-
08
Jul-0
8
Jan-
09
Jul-0
9
Jan-
10
Jul-1
0
Jan-
11
Jul-1
1
Jan-
12
Jul-1
2
Jan-
13
Jul-1
3
Jan-
14
Jul-1
4
Jan-
15
Jul-1
5
Jan-
16
Jul-1
6
Con
cent
ratio
n (µ
g/l)
Date
EX-02Trichloroethene
(TCE)From 2003 to Present
Concentration Baseline 50% Reduction EnhancedBiodegredation
MCL = 5 µg/l

EXHIBIT B-2WASATCH CHEMICAL SITEHISTORICAL DATA TRENDSEXTRACTION WELL EX-02
Page 11 of 77
EnhancedBiodegredation
May-04
EnhancedBiodegredation
July-06
y = 669.72e-1E-04x
R² = 0.1055
0
40
80
120
160
200Ja
n-95
Jul-9
5Ja
n-96
Jul-9
6Ja
n-97
Jul-9
7Ja
n-98
Jul-9
8Ja
n-99
Jul-9
9Ja
n-00
Jul-0
0Ja
n-01
Jul-0
1Ja
n-02
Jul-0
2Ja
n-03
Jul-0
3Ja
n-04
Jul-0
4Ja
n-05
Jul-0
5Ja
n-06
Jul-0
6Ja
n-07
Jul-0
7Ja
n-08
Jul-0
8Ja
n-09
Jul-0
9Ja
n-10
Jul-1
0Ja
n-11
Jul-1
1Ja
n-12
Jul-1
2Ja
n-13
Jul-1
3Ja
n-14
Jul-1
4Ja
n-15
Jul-1
5Ja
n-16
Jul-1
6Ja
n-17
Con
cent
ratio
n (µ
g/l)
Date
EX-021,1-Dichloroethene
(1,1-DCE)
Concentration Baseline 50% Reduction EnhancedBiodegredation
Best Fit Line
MCL = 7 µg/l
EnhancedBiodegredation
May-04
EnhancedBiodegredation
July-06
0
10
20
30
40
50
Jan-
03
Jul-0
3
Jan-
04
Jul-0
4
Jan-
05
Jul-0
5
Jan-
06
Jul-0
6
Jan-
07
Jul-0
7
Jan-
08
Jul-0
8
Jan-
09
Jul-0
9
Jan-
10
Jul-1
0
Jan-
11
Jul-1
1
Jan-
12
Jul-1
2
Jan-
13
Jul-1
3
Jan-
14
Jul-1
4
Jan-
15
Jul-1
5
Jan-
16
Jul-1
6
Con
cent
ratio
n (µ
g/l)
Date
EX-021,1-Dichloroethene
(1,1-DCE)From 2003 to Present
Concentration Baseline 50% Reduction EnhancedBiodegredation
MCL = 7 µg/l

EXHIBIT B-2WASATCH CHEMICAL SITEHISTORICAL DATA TRENDSEXTRACTION WELL EX-02
Page 12 of 77
0
80
160
240
320
400Ja
n-09
Jul-0
9
Jan-
10
Jul-1
0
Jan-
11
Jul-1
1
Jan-
12
Jul-1
2
Jan-
13
Jul-1
3
Jan-
14
Jul-1
4
Jan-
15
Jul-1
5
Jan-
16
Jul-1
6
Con
cent
ratio
n (µ
g/l)
Date
EX-02cis-1,2-Dichloroethene
(cis-1,2-DCE)
Concentration Baseline 50% Reduction EnhancedBiodegredation
MCL = 70 µg/l
0
5
10
15
20
25
Jan-
09
Jul-0
9
Jan-
10
Jul-1
0
Jan-
11
Jul-1
1
Jan-
12
Jul-1
2
Jan-
13
Jul-1
3
Jan-
14
Jul-1
4
Jan-
15
Jul-1
5
Jan-
16
Jul-1
6
Con
cent
ratio
n (µ
g/l)
Date
EX-02trans-1,2-Dichloroethene
(trans-1,2-DCE)
Concentration Baseline 50% Reduction EnhancedBiodegredation
MCL = 100 µg/l

EXHIBIT B-2WASATCH CHEMICAL SITEHISTORICAL DATA TRENDSEXTRACTION WELL EX-02
Page 13 of 77
EnhancedBiodegredation
May-04
EnhancedBiodegredation
July-06
y = 133.77e-1E-05x
R² = 0.0009
0
60
120
180
240
300Ja
n-96
Jul-9
6Ja
n-97
Jul-9
7Ja
n-98
Jul-9
8Ja
n-99
Jul-9
9Ja
n-00
Jul-0
0Ja
n-01
Jul-0
1Ja
n-02
Jul-0
2Ja
n-03
Jul-0
3Ja
n-04
Jul-0
4Ja
n-05
Jul-0
5Ja
n-06
Jul-0
6Ja
n-07
Jul-0
7Ja
n-08
Jul-0
8Ja
n-09
Jul-0
9Ja
n-10
Jul-1
0Ja
n-11
Jul-1
1Ja
n-12
Jul-1
2Ja
n-13
Jul-1
3Ja
n-14
Jul-1
4Ja
n-15
Jul-1
5Ja
n-16
Jul-1
6Ja
n-17
Con
cent
ratio
n (µ
g/l)
Date
EX-02Vinyl Chloride
(VC)
Concentration Baseline 50% Reduction EnhancedBiodegredation
Best Fit Line
MCL = 2 µg/l
EnhancedBiodegredation
May-04
EnhancedBiodegredation
July-06
0
60
120
180
240
300
Jan-
03
Jul-0
3
Jan-
04
Jul-0
4
Jan-
05
Jul-0
5
Jan-
06
Jul-0
6
Jan-
07
Jul-0
7
Jan-
08
Jul-0
8
Jan-
09
Jul-0
9
Jan-
10
Jul-1
0
Jan-
11
Jul-1
1
Jan-
12
Jul-1
2
Jan-
13
Jul-1
3
Jan-
14
Jul-1
4
Jan-
15
Jul-1
5
Jan-
16
Jul-1
6
Con
cent
ratio
n (µ
g/l)
Date
EX-02Vinyl Chloride
(VC)From 2003 to Present
Concentration Baseline 50% Reduction EnhancedBiodegredation
MCL = 2 µg/l

EXHIBIT B-2WASATCH CHEMICAL SITEHISTORICAL DATA TRENDSEXTRACTION WELL EX-02
Page 14 of 77
EnhancedBiodegredation
May-04
EnhancedBiodegredation
July-06
y = 616.63e-1E-04x
R² = 0.0548
0
100
200
300
400
500Ja
n-95
Jul-9
5Ja
n-96
Jul-9
6Ja
n-97
Jul-9
7Ja
n-98
Jul-9
8Ja
n-99
Jul-9
9Ja
n-00
Jul-0
0Ja
n-01
Jul-0
1Ja
n-02
Jul-0
2Ja
n-03
Jul-0
3Ja
n-04
Jul-0
4Ja
n-05
Jul-0
5Ja
n-06
Jul-0
6Ja
n-07
Jul-0
7Ja
n-08
Jul-0
8Ja
n-09
Jul-0
9Ja
n-10
Jul-1
0Ja
n-11
Jul-1
1Ja
n-12
Jul-1
2Ja
n-13
Jul-1
3Ja
n-14
Jul-1
4Ja
n-15
Jul-1
5Ja
n-16
Jul-1
6Ja
n-17
Con
cent
ratio
n (µ
g/l)
Date
EX-02Pentachlorophenol
(PCP)
Concentration Baseline 50% Reduction EnhancedBiodegredation
Best Fit Line
MCL = 1 µg/l
EnhancedBiodegredation
May-04
EnhancedBiodegredation
July-06
0
5
10
15
20
25
Jan-
03
Jul-0
3
Jan-
04
Jul-0
4
Jan-
05
Jul-0
5
Jan-
06
Jul-0
6
Jan-
07
Jul-0
7
Jan-
08
Jul-0
8
Jan-
09
Jul-0
9
Jan-
10
Jul-1
0
Jan-
11
Jul-1
1
Jan-
12
Jul-1
2
Jan-
13
Jul-1
3
Jan-
14
Jul-1
4
Jan-
15
Jul-1
5
Jan-
16
Jul-1
6
Con
cent
ratio
n (µ
g/l)
Date
EX-02Pentachlorophenol
(PCP)From 2003 to Present
Concentration Baseline 50% Reduction EnhancedBiodegredation
MCL = 1 µg/l

EXHIBIT B-3WASATCH CHEMICAL SITEHISTORICAL DATA TRENDSEXTRACTION WELL EX-04
Page 15 of 77
SampleDate
PCE(µg/l)
TCE(µg/l)
1,1-DCE(µg/l)
cis-1,2-DCE(µg/l)
trans-1,2-DCE(µg/l)
VC(µg/l)
2,4-D(µg/l)
PCP(µg/l)
20-Mar-95 < 2 J 680 130 -- -- -- < 2 < 0.2 J6-Jul-95 < 2 180 21 -- -- -- < 2 J < 0.2 J
27-Sep-95 < 2 190 48 -- -- -- < 2 < 0.2 27-Dec-95 130 390 49 -- -- -- 2.1 8.428-Mar-96 < 2 360 23 -- -- -- < 2 < 0.2 28-Aug-96 2.2 330 38 -- -- -- 1.2 T 0.063 TJ21-Nov-96 < 2.2 T 290 21 -- -- -- < 0.25 < 1 UJ26-Feb-97 0.33 T 54 3.2 -- -- -- < 0.25 < 1 27-May-97 0.31 T 91 6.1 -- -- -- < 0.25 < 1 26-Aug-97 < 5 280 17 -- -- -- < 0.25 < 1 6-Nov-97 0.99 140 9 -- -- -- < 0.25 < 1 12-Feb-98 < 1 51 4 -- -- -- < 0.25 < 1 19-May-98 < 1 75 4.8 -- -- -- 0.03 J < 1 12-Aug-98 1.8 J 190 11 -- -- -- < 0.25 < 1 17-Nov-98 < 2.5 170 14 -- -- -- < 0.25 < 0.5 24-Feb-99 < 2 140 8.5 -- -- -- < 0.25 < 0.5 26-May-99 < 2 110 5.5 Q -- -- -- < 4 < 0.5 25-Aug-99 < 25 G 120 7.6 T -- -- -- < 0.2 < 0.1 17-Nov-99 7.5 200 11 -- -- -- < 0.2 0.522-Feb-00 < 5 110 8.8 -- -- -- < 0.2 < 0.1 24-May-00 < 10 96 5.4 -- -- -- < 0.2 < 0.1 23-Aug-00 2.7 D 150 D 13 D -- -- -- -- --7-Oct-00 -- -- -- -- -- -- 0.63 J < 0.5 UJ
23-May-01 < 1 59 8.4 -- -- -- < 0.5 0.4 T19-Nov-01 < 1 35 9 -- -- -- < 0.5 < 0.5 15-May-02 < 1 76 10 -- -- -- < 0.5 0.09 T20-Nov-02 < 1 50 12 -- -- -- < 0.48 < 0.48 25-Feb-03 < 1 59 9.9 -- -- < 1 < 0.48 < 0.48 6-May-03 < 1 61 8.2 -- -- < 1 < 0.5 < 0.5 12-Aug-03 < 1 56 8.8 -- -- 2 < 0.5 < 0.5 6-Nov-03 < 1 74 D 10 -- -- < 1 < 2.4 < 0.48
14-May-04 < 1 88 D 15 -- -- < 1 -- < 0.48 UB3-Nov-04 < 1 55 8.3 -- -- < 1 -- < 0.48
10-May-05 < 5 D 81 D 10 D -- -- < 5 D -- < 0.5 1-Nov-05 < 1 118 D 13 -- -- 0.4 T -- < 0.5
16-May-06 < 1 81 D 9.8 -- -- 0.31 T -- 0.26 T6-Sep-06 < 1 130 D 18 -- -- 0.75 T -- --6-Nov-06 < 1 180 D 20 -- -- 0.7 T -- < 0.5 UJ10-Apr-07 < 1 110 D 16 -- -- 1 -- < 0.5 30-Oct-07 < 1 52 D 14 -- -- 0.71 T -- < 0.5 30-Apr-08 < 1 85 D 14 -- -- 0.92 T -- < 0.5 14-Oct-08 < 1 83 D 13 -- -- 0.91 T -- < 0.5 6-Apr-09 < 1 54 D 11 110 D 16 1.6 -- < 0.5 2-Nov-09 < 1 58 D 12 110 D 20 1.9 -- < 0.5 26-Apr-10 < 1 48 12 150 D 20 1.9 -- < 0.5 26-Oct-10 < 1 55 17 180 D 29 2.9 -- < 0.5 14-Apr-11 < 1 29 12 180 D 20 2.3 -- < 0.5 10-Nov-11 < 1 15 6.6 84 9.8 0.74 T -- < 0.5 21-Dec-11 -- -- -- -- -- -- -- < 0.5 1-May-12 < 1 21 9.4 130 D 16 1.4 -- --13-Nov-12 < 1 20 8.7 140 D 18 1.3 -- --23-Apr-13 < 1 7.1 4.9 66 12 0.84 T -- --5-Nov-13 < 1 2.9 3 57 D 28 5.2 -- --22-Apr-14 < 1 0.84 T 2.4 31 7.8 0.89 T -- --4-Nov-14 < 1 2.9 2.7 46 19 4.5 -- --22-Apr-15 < 1 0.21 T 1 18 4.1 0.51 T -- --3-Nov-15 < 1 0.62 T 1.2 22 5.2 0.69 T -- --
Data qualifiers are defined in laboratory reports. For data collected since 2001, a list of data qualifier definitions is includedat the front of this appendix.-- Not analyzed
LABORATORY PARAMETERS

EXHIBIT B-3WASATCH CHEMICAL SITEHISTORICAL DATA TRENDSEXTRACTION WELL EX-04
Page 16 of 77
EnhancedBiodegredation
July-06
y = 801.01e-2E-04x
R² = 0.1476
0
40
80
120
160
200Ja
n-95
Jul-9
5Ja
n-96
Jul-9
6Ja
n-97
Jul-9
7Ja
n-98
Jul-9
8Ja
n-99
Jul-9
9Ja
n-00
Jul-0
0Ja
n-01
Jul-0
1Ja
n-02
Jul-0
2Ja
n-03
Jul-0
3Ja
n-04
Jul-0
4Ja
n-05
Jul-0
5Ja
n-06
Jul-0
6Ja
n-07
Jul-0
7Ja
n-08
Jul-0
8Ja
n-09
Jul-0
9Ja
n-10
Jul-1
0Ja
n-11
Jul-1
1Ja
n-12
Jul-1
2Ja
n-13
Jul-1
3Ja
n-14
Jul-1
4Ja
n-15
Jul-1
5Ja
n-16
Jul-1
6Ja
n-17
Con
cent
ratio
n (µ
g/l)
Date
EX-04Tetrachloroethene
(PCE)
Concentration Baseline 50% Reduction EnhancedBiodegredation
Best Fit Line
MCL = 5 µg/l
EnhancedBiodegredation
July-06
0
2
4
6
8
10
Jan-
03
Jul-0
3
Jan-
04
Jul-0
4
Jan-
05
Jul-0
5
Jan-
06
Jul-0
6
Jan-
07
Jul-0
7
Jan-
08
Jul-0
8
Jan-
09
Jul-0
9
Jan-
10
Jul-1
0
Jan-
11
Jul-1
1
Jan-
12
Jul-1
2
Jan-
13
Jul-1
3
Jan-
14
Jul-1
4
Jan-
15
Jul-1
5
Jan-
16
Jul-1
6
Con
cent
ratio
n (µ
g/l)
Date
EX-04Tetrachloroethene
(PCE)From 2003 to Present
Concentration Baseline 50% Reduction EnhancedBiodegredation
MCL = 5 µg/l

EXHIBIT B-3WASATCH CHEMICAL SITEHISTORICAL DATA TRENDSEXTRACTION WELL EX-04
Page 17 of 77
EnhancedBiodegredation
July-06
0
40
80
120
160
200
Jan-
03
Jul-0
3
Jan-
04
Jul-0
4
Jan-
05
Jul-0
5
Jan-
06
Jul-0
6
Jan-
07
Jul-0
7
Jan-
08
Jul-0
8
Jan-
09
Jul-0
9
Jan-
10
Jul-1
0
Jan-
11
Jul-1
1
Jan-
12
Jul-1
2
Jan-
13
Jul-1
3
Jan-
14
Jul-1
4
Jan-
15
Jul-1
5
Jan-
16
Jul-1
6
Con
cent
ratio
n (µ
g/l)
Date
EX-04Trichloroethene
(TCE)From 2003 to Present
Concentration Baseline 50% Reduction EnhancedBiodegredation
MCL = 5 µg/l
EnhancedBiodegredation
July-06
y = 7E+10e-6E-04x
R² = 0.6222
0
160
320
480
640
800Ja
n-95
Jul-9
5Ja
n-96
Jul-9
6Ja
n-97
Jul-9
7Ja
n-98
Jul-9
8Ja
n-99
Jul-9
9Ja
n-00
Jul-0
0Ja
n-01
Jul-0
1Ja
n-02
Jul-0
2Ja
n-03
Jul-0
3Ja
n-04
Jul-0
4Ja
n-05
Jul-0
5Ja
n-06
Jul-0
6Ja
n-07
Jul-0
7Ja
n-08
Jul-0
8Ja
n-09
Jul-0
9Ja
n-10
Jul-1
0Ja
n-11
Jul-1
1Ja
n-12
Jul-1
2Ja
n-13
Jul-1
3Ja
n-14
Jul-1
4Ja
n-15
Jul-1
5Ja
n-16
Jul-1
6Ja
n-17
Con
cent
ratio
n (µ
g/l)
Date
EX-04Trichloroethene
(TCE)
Concentration Baseline 50% Reduction EnhancedBiodegredation
Best Fit Line
MCL = 5 µg/l

EXHIBIT B-3WASATCH CHEMICAL SITEHISTORICAL DATA TRENDSEXTRACTION WELL EX-04
Page 18 of 77
EnhancedBiodegredation
July-06
y = 12063e-2E-04x
R² = 0.2562
0
40
80
120
160
200Ja
n-95
Jul-9
5Ja
n-96
Jul-9
6Ja
n-97
Jul-9
7Ja
n-98
Jul-9
8Ja
n-99
Jul-9
9Ja
n-00
Jul-0
0Ja
n-01
Jul-0
1Ja
n-02
Jul-0
2Ja
n-03
Jul-0
3Ja
n-04
Jul-0
4Ja
n-05
Jul-0
5Ja
n-06
Jul-0
6Ja
n-07
Jul-0
7Ja
n-08
Jul-0
8Ja
n-09
Jul-0
9Ja
n-10
Jul-1
0Ja
n-11
Jul-1
1Ja
n-12
Jul-1
2Ja
n-13
Jul-1
3Ja
n-14
Jul-1
4Ja
n-15
Jul-1
5Ja
n-16
Jul-1
6Ja
n-17
Con
cent
ratio
n (µ
g/l)
Date
EX-041,1-Dichloroethene
(1,1-DCE)
Concentration Baseline 50% Reduction EnhancedBiodegredation
Best Fit Line
MCL = 7 µg/l
EnhancedBiodegredation
July-06
0
5
10
15
20
25
Jan-
03
Jul-0
3
Jan-
04
Jul-0
4
Jan-
05
Jul-0
5
Jan-
06
Jul-0
6
Jan-
07
Jul-0
7
Jan-
08
Jul-0
8
Jan-
09
Jul-0
9
Jan-
10
Jul-1
0
Jan-
11
Jul-1
1
Jan-
12
Jul-1
2
Jan-
13
Jul-1
3
Jan-
14
Jul-1
4
Jan-
15
Jul-1
5
Jan-
16
Jul-1
6
Con
cent
ratio
n (µ
g/l)
Date
EX-041,1-Dichloroethene
(1,1-DCE)From 2003 to Present
Concentration Baseline 50% Reduction EnhancedBiodegredation
MCL = 7 µg/l

EXHIBIT B-3WASATCH CHEMICAL SITEHISTORICAL DATA TRENDSEXTRACTION WELL EX-04
Page 19 of 77
0
40
80
120
160
200Ja
n-09
Jul-0
9
Jan-
10
Jul-1
0
Jan-
11
Jul-1
1
Jan-
12
Jul-1
2
Jan-
13
Jul-1
3
Jan-
14
Jul-1
4
Jan-
15
Jul-1
5
Jan-
16
Jul-1
6
Con
cent
ratio
n (µ
g/l)
Date
EX-04cis-1,2-Dichloroethene
(cis-1,2-DCE)
Concentration Baseline 50% Reduction EnhancedBiodegredation
MCL = 70 µg/l
0
10
20
30
40
50
Jan-
09
Jul-0
9
Jan-
10
Jul-1
0
Jan-
11
Jul-1
1
Jan-
12
Jul-1
2
Jan-
13
Jul-1
3
Jan-
14
Jul-1
4
Jan-
15
Jul-1
5
Jan-
16
Jul-1
6
Con
cent
ratio
n (µ
g/l)
Date
EX-04trans-1,2-Dichloroethene
(trans-1,2-DCE)
Concentration Baseline 50% Reduction EnhancedBiodegredation
MCL = 100 µg/l

EXHIBIT B-3WASATCH CHEMICAL SITEHISTORICAL DATA TRENDSEXTRACTION WELL EX-04
Page 20 of 77
EnhancedBiodegredation
July-06
y = 0.0444e8E-05x
R² = 0.0294
0
2
4
6
8
10
Jan-
03
Jul-0
3
Jan-
04
Jul-0
4
Jan-
05
Jul-0
5
Jan-
06
Jul-0
6
Jan-
07
Jul-0
7
Jan-
08
Jul-0
8
Jan-
09
Jul-0
9
Jan-
10
Jul-1
0
Jan-
11
Jul-1
1
Jan-
12
Jul-1
2
Jan-
13
Jul-1
3
Jan-
14
Jul-1
4
Jan-
15
Jul-1
5
Jan-
16
Jul-1
6
Con
cent
ratio
n (µ
g/l)
Date
EX-04Vinyl Chloride
(VC)
Concentration Baseline 50% Reduction EnhancedBiodegredation
Best Fit Line
MCL = 2 µg/l

EXHIBIT B-4WASATCH CHEMICAL SITEHISTORICAL DATA TRENDSEXTRACTION WELL EX-05
Page 21 of 77
SampleDate
PCE(µg/l)
TCE(µg/l)
1,1-DCE(µg/l)
cis-1,2-DCE(µg/l)
trans-1,2-DCE(µg/l)
VC(µg/l)
2,4-D(µg/l)
PCP(µg/l)
20-Mar-95 13 5500 450 -- -- -- < 20 < 2 J6-Jul-95 3.7 1900 110 -- -- -- < 2 < 0.2
27-Sep-95 < 2 1900 320 -- -- -- < 2 < 0.2 27-Dec-95 < 5 1000 62 -- -- -- < 2 < 0.2 28-Mar-96 < 2 1100 55 -- -- -- < 2 < 0.2 28-Aug-96 < 4 180 9.5 -- -- -- < 10 < 0.2 21-Nov-96 < 5 200 10 -- -- 1 T < 0.25 < 1 UJ26-Feb-97 < 10 520 23 -- -- -- < 0.25 < 1 21-May-97 < 10 850 43 -- -- -- < 0.25 126-Aug-97 < 5 250 13 -- -- -- < 0.25 16-Nov-97 < 5 260 11 -- -- -- < 0.25 < 1 12-Feb-98 < 5 430 B 27 -- -- -- < 0.25 < 1 19-May-98 < 5 280 16 -- -- -- < 0.25 < 1 12-Aug-98 1.8 J 190 11 -- -- -- < 0.25 < 1 17-Nov-98 < 5 360 20 J -- -- -- < 0.25 < 0.5 24-Feb-99 < 5 330 JB 14 J -- -- -- < 0.25 < 0.5 26-May-99 < 5 G 220 J 9.6 -- -- -- < 4 UJ < 0.5 25-Aug-99 < 25 G 140 6.8 T -- -- -- 1.04 < 0.1 17-Nov-99 < 5 130 6.4 -- -- -- < 0.2 < 0.1 22-Feb-00 < 5 130 6.3 -- -- -- < 0.2 < 0.1 24-May-00 < 10 98 4 -- -- -- 0.431 < 0.1 23-Aug-00 < 0.83 D 77 D 4.7 D -- -- -- -- --7-Oct-00 -- -- -- -- -- -- 1.34 J < 0.5 UJ
23-May-01 < 1 58 3 -- -- -- < 0.5 0.519-Nov-01 < 1 26 2 -- -- -- < 0.5 < 0.5 15-May-02 < 1 74 D 5 -- -- -- < 0.5 0.04 T20-Nov-02 < 1 2 1 -- -- -- < 0.48 < 0.48 25-Feb-03 < 1 0.9 T 1 -- -- < 1 < 0.48 0.1 T6-May-03 < 1 31 4.1 -- -- 0.4 T < 0.5 0.712-Aug-03 < 1 53 7.5 -- -- 2.1 < 0.5 < 0.5 6-Nov-03 < 1 20 8.7 -- -- 0.7 T < 2.4 < 0.48
13-May-04 < 1 140 D 23 -- -- 2.6 -- < 0.48 3-Nov-04 < 5 D 20 D 11 D -- -- 3 TD -- < 0.48
10-May-05 < 10 D 34 D 10 D -- -- < 10 D -- < 0.5 1-Nov-05 < 1 2 13 -- -- 0.9 T -- < 0.5
16-May-06 < 1 6 12 -- -- 0.68 T -- < 0.5 7-Nov-06 < 1 0.6 T 19 -- -- 1.1 -- < 0.5 9-Apr-07 < 1 0.76 T 20 -- -- 2 -- < 0.5
30-Oct-07 < 1 0.5 T 17 -- -- 9.3 J -- < 0.5 29-Apr-08 < 1 0.37 T 10 -- -- 44 D -- < 0.5 14-Oct-08 < 1 0.45 T 13 -- -- 40 -- < 0.5 7-Apr-09 < 1 0.44 T 12 180 D 210 D 47 -- < 0.5 2-Nov-09 < 1 0.43 T 8.5 150 D 170 D 27 -- < 0.5 26-Apr-10 < 1 0.44 T 5.8 140 D 130 D 20 -- < 0.5 26-Oct-10 < 1 0.5 T 9.9 170 D 170 D 16 -- < 0.5 13-Apr-11 < 1 0.37 T 9 140 D 150 D 17 -- < 0.5 9-Nov-11 < 1 0.36 T 8.6 140 D 150 D 12 -- < 0.5 1-May-12 < 1 0.47 T 8.3 150 D 140 D 13 -- --13-Nov-12 < 1 0.53 T 9.1 150 D 150 D 11 -- --23-Apr-13 < 1 0.51 T 9.3 150 D 160 D 11 -- --4-Nov-13 < 1 0.32 T 8.2 130 D 120 D 8.2 -- --22-Apr-14 < 1 0.38 T 13 180 D 180 D 12 -- --3-Nov-14 < 1 0.37 T 8.4 180 D 150 D 11 -- --22-Apr-15 < 1 0.39 T 11 170 D 130 D 9.8 -- --2-Nov-15 < 1 0.35 T 8.3 150 D 120 D 7.1 -- --
Data qualifiers are defined in laboratory reports. For data collected since 2001, a list of data qualifier definitions is includedat the front of this appendix.-- Not analyzed
LABORATORY PARAMETERS

EXHIBIT B-4WASATCH CHEMICAL SITEHISTORICAL DATA TRENDSEXTRACTION WELL EX-05
Page 22 of 77
0
5
10
15
20
25
Jan-
03
Jul-0
3
Jan-
04
Jul-0
4
Dec
-04
Jul-0
5
Dec
-05
Jul-0
6
Dec
-06
Jul-0
7
Dec
-07
Jun-
08
Dec
-08
Jun-
09
Dec
-09
Jun-
10
Dec
-10
Jun-
11
Dec
-11
Jun-
12
Dec
-12
Jun-
13
Dec
-13
Jun-
14
Dec
-14
Jun-
15
Dec
-15
Jun-
16
Con
cent
ratio
n (µ
g/l)
Date
EX-05Tetrachloroethene
(PCE)From 2003 to Present
Concentration Baseline 50% Reduction EnhancedBiodegredation
MCL = 5 µg/l
y = 82261e-3E-04x
R² = 0.4578
0
10
20
30
40
50
Jan-
95Ju
l-95
Jan-
96Ju
l-96
Jan-
97Ju
l-97
Jan-
98Ju
l-98
Jan-
99Ju
l-99
Jan-
00Ju
l-00
Jan-
01Ju
l-01
Jan-
02Ju
l-02
Jan-
03Ju
l-03
Jan-
04Ju
l-04
Jan-
05Ju
l-05
Jan-
06Ju
l-06
Jan-
07Ju
l-07
Jan-
08Ju
l-08
Jan-
09Ju
l-09
Jan-
10Ju
l-10
Jan-
11Ju
l-11
Jan-
12Ju
l-12
Jan-
13Ju
l-13
Jan-
14Ju
l-14
Jan-
15Ju
l-15
Jan-
16Ju
l-16
Jan-
17
Con
cent
ratio
n (µ
g/l)
Date
EX-05Tetrachloroethene
(PCE)
Concentration Baseline 50% Reduction EnhancedBiodegredation
Best Fit Line
MCL = 5 µg/l

EXHIBIT B-4WASATCH CHEMICAL SITEHISTORICAL DATA TRENDSEXTRACTION WELL EX-05
Page 23 of 77
0
40
80
120
160
200
Jan-
03
Jul-0
3
Jan-
04
Jul-0
4
Dec
-04
Jul-0
5
Dec
-05
Jul-0
6
Dec
-06
Jul-0
7
Dec
-07
Jun-
08
Dec
-08
Jun-
09
Dec
-09
Jun-
10
Dec
-10
Jun-
11
Dec
-11
Jun-
12
Dec
-12
Jun-
13
Dec
-13
Jun-
14
Dec
-14
Jun-
15
Dec
-15
Jun-
16
Con
cent
ratio
n (µ
g/l)
Date
EX-05Trichloroethene
(TCE)From 2003 to Present
Concentration Baseline 50% Reduction EnhancedBiodegredation
MCL = 5 µg/l
y = 3E+22e-0.001x
R² = 0.8746
0
2000
4000
6000
8000
10000Ja
n-95
Jul-9
5Ja
n-96
Jul-9
6Ja
n-97
Jul-9
7Ja
n-98
Jul-9
8Ja
n-99
Jul-9
9Ja
n-00
Jul-0
0Ja
n-01
Jul-0
1Ja
n-02
Jul-0
2Ja
n-03
Jul-0
3Ja
n-04
Jul-0
4Ja
n-05
Jul-0
5Ja
n-06
Jul-0
6Ja
n-07
Jul-0
7Ja
n-08
Jul-0
8Ja
n-09
Jul-0
9Ja
n-10
Jul-1
0Ja
n-11
Jul-1
1Ja
n-12
Jul-1
2Ja
n-13
Jul-1
3Ja
n-14
Jul-1
4Ja
n-15
Jul-1
5Ja
n-16
Jul-1
6Ja
n-17
Con
cent
ratio
n (µ
g/l)
Date
EX-05Trichloroethene
(TCE)
Concentration Baseline 50% Reduction EnhancedBiodegredation
Best Fit Line
MCL = 5 µg/l

EXHIBIT B-4WASATCH CHEMICAL SITEHISTORICAL DATA TRENDSEXTRACTION WELL EX-05
Page 24 of 77
0
10
20
30
40
50
Jan-
03
Jul-0
3
Jan-
04
Jul-0
4
Dec
-04
Jul-0
5
Dec
-05
Jul-0
6
Dec
-06
Jul-0
7
Dec
-07
Jun-
08
Dec
-08
Jun-
09
Dec
-09
Jun-
10
Dec
-10
Jun-
11
Dec
-11
Jun-
12
Dec
-12
Jun-
13
Dec
-13
Jun-
14
Dec
-14
Jun-
15
Dec
-15
Jun-
16
Con
cent
ratio
n (µ
g/l)
Date
EX-051,1-Dichloroethene
(1,1-DCE)From 2003 to Present
Concentration Baseline 50% Reduction EnhancedBiodegredation
MCL = 7 µg/l
y = 5243.2e-2E-04x
R² = 0.1126
0
100
200
300
400
500Ja
n-95
Jul-9
5Ja
n-96
Jul-9
6Ja
n-97
Jul-9
7Ja
n-98
Jul-9
8Ja
n-99
Jul-9
9Ja
n-00
Jul-0
0Ja
n-01
Jul-0
1Ja
n-02
Jul-0
2Ja
n-03
Jul-0
3Ja
n-04
Jul-0
4Ja
n-05
Jul-0
5Ja
n-06
Jul-0
6Ja
n-07
Jul-0
7Ja
n-08
Jul-0
8Ja
n-09
Jul-0
9Ja
n-10
Jul-1
0Ja
n-11
Jul-1
1Ja
n-12
Jul-1
2Ja
n-13
Jul-1
3Ja
n-14
Jul-1
4Ja
n-15
Jul-1
5Ja
n-16
Jul-1
6Ja
n-17
Con
cent
ratio
n (µ
g/l)
Date
EX-051,1-Dichloroethene
(1,1-DCE)
Concentration Baseline 50% Reduction EnhancedBiodegredation
Best Fit Line
MCL = 7 µg/l

EXHIBIT B-4WASATCH CHEMICAL SITEHISTORICAL DATA TRENDSEXTRACTION WELL EX-05
Page 25 of 77
0
40
80
120
160
200Ja
n-09
Jul-0
9
Jan-
10
Jul-1
0
Jan-
11
Jul-1
1
Jan-
12
Jul-1
2
Jan-
13
Jul-1
3
Jan-
14
Jul-1
4
Jan-
15
Jul-1
5
Jan-
16
Jul-1
6
Con
cent
ratio
n (µ
g/l)
Date
EX-05cis-1,2-Dichloroethene
(cis-1,2-DCE)
Concentration Baseline 50% Reduction EnhancedBiodegredation
MCL = 70 µg/l
0
60
120
180
240
300
Jan-
09
Jul-0
9
Jan-
10
Jul-1
0
Jan-
11
Jul-1
1
Jan-
12
Jul-1
2
Jan-
13
Jul-1
3
Jan-
14
Jul-1
4
Jan-
15
Jul-1
5
Jan-
16
Jul-1
6
Con
cent
ratio
n (µ
g/l)
Date
EX-05trans-1,2-Dichloroethene
(trans-1,2-DCE)
Concentration Baseline 50% Reduction EnhancedBiodegredation
MCL = 100 µg/l

EXHIBIT B-4WASATCH CHEMICAL SITEHISTORICAL DATA TRENDSEXTRACTION WELL EX-05
Page 26 of 77
0
20
40
60
80
100
Jan-
03
Jul-0
3
Jan-
04
Jul-0
4
Dec
-04
Jul-0
5
Dec
-05
Jul-0
6
Dec
-06
Jul-0
7
Dec
-07
Jun-
08
Dec
-08
Jun-
09
Dec
-09
Jun-
10
Dec
-10
Jun-
11
Dec
-11
Jun-
12
Dec
-12
Jun-
13
Dec
-13
Jun-
14
Dec
-14
Jun-
15
Dec
-15
Jun-
16
Con
cent
ratio
n (µ
g/l)
Date
EX-05Vinyl Chloride
(VC)From 2003 to Present
Concentration Baseline 50% Reduction EnhancedBiodegredation
MCL = 2 µg/l
y = 3E-09e0.0005x
R² = 0.4126
0
20
40
60
80
100Ja
n-96
Jul-9
6Ja
n-97
Jul-9
7Ja
n-98
Jul-9
8Ja
n-99
Jul-9
9Ja
n-00
Jul-0
0Ja
n-01
Jul-0
1Ja
n-02
Jul-0
2Ja
n-03
Jul-0
3Ja
n-04
Jul-0
4Ja
n-05
Jul-0
5Ja
n-06
Jul-0
6Ja
n-07
Jul-0
7Ja
n-08
Jul-0
8Ja
n-09
Jul-0
9Ja
n-10
Jul-1
0Ja
n-11
Jul-1
1Ja
n-12
Jul-1
2Ja
n-13
Jul-1
3Ja
n-14
Jul-1
4Ja
n-15
Jul-1
5Ja
n-16
Jul-1
6Ja
n-17
Con
cent
ratio
n (µ
g/l)
Date
EX-05Vinyl Chloride
(VC)
Concentration Baseline 50% Reduction EnhancedBiodegredation
Best Fit Line
MCL = 2 µg/l

EXHIBIT B-5WASATCH CHEMICAL SITEHISTORICAL DATA TRENDSEXTRACTION WELL EX-07
Page 27 of 77
SampleDate
PCE(µg/l)
TCE(µg/l)
1,1-DCE(µg/l)
cis-1,2-DCE(µg/l)
trans-1,2-DCE(µg/l)
VC(µg/l)
2,4-D(µg/l)
PCP(µg/l)
20-Mar-95 23 210 86 -- -- -- 150 0.671 J6-Jul-95 53 160 21 -- -- -- < 20 < 40
27-Sep-95 47 150 71 -- -- -- < 2 < 20 27-Dec-95 33 140 28 -- -- -- < 2 < 0.2 28-Mar-96 43 170 21 -- -- -- 240 < 20 28-Aug-96 41 360 24 -- -- -- < 10 38 J20-Nov-96 51 420 23 -- -- 53 < 2.5 19 J26-Feb-97 67 490 19 -- -- -- < 2.5 4621-May-97 81 850 21 -- -- -- < 2.5 37 J26-Aug-97 74 460 16 -- -- -- 1.7 J 40 B6-Nov-97 72 490 16 -- -- -- < 2.5 --12-Feb-98 68 B 460 B 19 -- -- -- 3.6 --19-May-98 130 680 15 -- -- -- 4.5 --12-Aug-98 100 650 21 -- -- -- < 5.5 --17-Nov-98 17 58 1.4 J -- -- -- < 0.3 G 5.124-Feb-99 65 JB 190 J 4.2 J -- -- -- < 2.5 G 726-May-99 60 160 < 5 G -- -- -- < 4 UJ 1625-Aug-99 29 210 10 T -- -- -- 1.53 4.7817-Nov-99 52 210 9.4 T -- -- -- < 0.2 J 28.8 J22-Feb-00 51 110 2.9 J -- -- -- 0.13 J 16.724-May-00 18 71 2.6 T -- -- -- < 0.2 4.92 J23-Aug-00 39 D 96 5.5 D -- -- -- -- --7-Oct-00 -- -- -- -- -- -- < 0.5 0.77
23-May-01 38 D 141 D 7 D -- -- -- < 0.5 5.4 D19-Nov-01 7.8 59 3.9 -- -- -- < 0.5 2.415-May-02 26 96 D 4.1 -- -- -- < 0.5 8.4 D20-Nov-02 4.1 46 3.7 -- -- -- < 0.48 226-Feb-03 5.8 36 2.1 -- -- 17 0.1 TJ 3.2 J6-May-03 7.4 24 < 1 -- -- 1 < 0.5 1.412-Aug-03 10 65 D 4.8 -- -- 32 < 0.5 2.46-Nov-03 3.6 21 2 -- -- 10 < 2.4 1.3
14-May-04 14 42 < 1 -- -- 3.1 -- 0.4 TB3-Nov-04 7.4 19 < 1 -- -- 1 -- 0.6
10-May-05 5.1 11 < 1 -- -- 0.5 T -- < 0.5 1-Nov-05 5.5 30 2.4 -- -- 18 -- 0.9
16-May-06 11 22 0.47 T -- -- 2.1 -- 1.26-Sep-06 < 1 5.4 2.2 -- -- 16 J+ -- --6-Nov-06 < 1 7.9 2.2 -- -- 17 -- 0.27 T10-Apr-07 0.2036 T 7.1 0.71 T -- -- 6.9 -- 0.31 T30-Oct-07 < 1 2.1 0.43 T -- -- 4.2 -- 0.13 T30-Apr-08 < 1 5 0.82 T -- -- 8.9 -- 0.16 T13-Oct-08 < 1 5 1.6 -- -- 29 -- < 0.5 7-Apr-09 < 1 3 0.79 T 16 2.3 10 -- 0.13 T3-Nov-09 < 1 1.2 0.33 T 6 1.4 3.6 -- < 0.5 26-Apr-10 < 1 2 < 1 3.6 0.62 T 1.4 -- < 0.5 26-Oct-10 < 1 1.5 0.34 T 8.3 4 4.1 -- < 0.5 14-Apr-11 0.54 T 2.4 0.25 T 4 0.51 T 1.4 -- < 0.5 10-Nov-11 < 1 1.1 0.45 T 10 5 5.3 -- < 0.5 1-May-12 < 1 0.93 T 0.42 T 8.3 3.7 6.5 -- < 0.5 14-Nov-12 0.28 T 1.6 0.24 T 4.7 1.8 2.3 -- < 0.5 23-Apr-13 1.1 3.1 < 1 3.9 0.73 T 1.4 -- < 0.5 5-Nov-13 < 1 1.5 0.46 T 9.7 3 7.1 -- < 0.5 22-Apr-14 0.61 T 2.4 0.45 T 8.4 1.7 6.1 -- < 0.5 4-Nov-14 0.16 T 8 0.43 T 7.1 1.9 5.8 -- < 0.5 23-Apr-15 0.72 T 2.6 0.28 T 5.7 2.1 3.2 -- < 0.5 3-Nov-15 < 1 2.5 0.49 T 13 3.5 9.3 -- < 0.5
Data qualifiers are defined in laboratory reports. For data collected since 2001, a list of data qualifier definitions is includedat the front of this appendix.-- Not analyzed
LABORATORY PARAMETERS

EXHIBIT B-5WASATCH CHEMICAL SITEHISTORICAL DATA TRENDSEXTRACTION WELL EX-07
Page 28 of 77
EnhancedBiodegredation
July-06
y = 7E+13e-8E-04x
R² = 0.8332
0
40
80
120
160
200
Jan-
95Ju
l-95
Jan-
96Ju
l-96
Jan-
97Ju
l-97
Jan-
98Ju
l-98
Jan-
99Ju
l-99
Jan-
00Ju
l-00
Jan-
01Ju
l-01
Jan-
02Ju
l-02
Jan-
03Ju
l-03
Jan-
04Ju
l-04
Jan-
05Ju
l-05
Jan-
06Ju
l-06
Jan-
07Ju
l-07
Jan-
08Ju
l-08
Jan-
09Ju
l-09
Jan-
10Ju
l-10
Jan-
11Ju
l-11
Jan-
12Ju
l-12
Jan-
13Ju
l-13
Jan-
14Ju
l-14
Jan-
15Ju
l-15
Jan-
16Ju
l-16
Jan-
17
Con
cent
ratio
n (µ
g/l)
Date
EX-07Tetrachloroethene
(PCE)
Concentration Baseline 50% Reduction EnhancedBiodegredation
Best Fit Line
MCL = 5 µg/l
EnhancedBiodegredation
July-06
0
5
10
15
20
25
Jan-
03
Jul-0
3
Jan-
04
Jul-0
4
Jan-
05
Jul-0
5
Jan-
06
Jul-0
6
Jan-
07
Jul-0
7
Jan-
08
Jul-0
8
Jan-
09
Jul-0
9
Jan-
10
Jul-1
0
Jan-
11
Jul-1
1
Jan-
12
Jul-1
2
Jan-
13
Jul-1
3
Jan-
14
Jul-1
4
Jan-
15
Jul-1
5
Jan-
16
Jul-1
6
Con
cent
ratio
n (µ
g/l)
Date
EX-07Tetrachloroethene
(PCE)From 2003 to Present
Concentration Baseline 50% Reduction EnhancedBiodegredation
MCL = 5 µg/l

EXHIBIT B-5WASATCH CHEMICAL SITEHISTORICAL DATA TRENDSEXTRACTION WELL EX-07
Page 29 of 77
EnhancedBiodegredation
July-06
0
20
40
60
80
100
Jan-
03
Jul-0
3
Jan-
04
Jul-0
4
Jan-
05
Jul-0
5
Jan-
06
Jul-0
6
Jan-
07
Jul-0
7
Jan-
08
Jul-0
8
Jan-
09
Jul-0
9
Jan-
10
Jul-1
0
Jan-
11
Jul-1
1
Jan-
12
Jul-1
2
Jan-
13
Jul-1
3
Jan-
14
Jul-1
4
Jan-
15
Jul-1
5
Jan-
16
Jul-1
6
Con
cent
ratio
n (µ
g/l)
Date
EX-07Trichloroethene
(TCE)From 2003 to Present
Concentration Baseline 50% Reduction EnhancedBiodegredation
MCL = 5 µg/l
EnhancedBiodegredation
July-06
y = 6E+15e-9E-04x
R² = 0.8596
0
200
400
600
800
1000
Jan-
95Ju
l-95
Jan-
96Ju
l-96
Jan-
97Ju
l-97
Jan-
98Ju
l-98
Jan-
99Ju
l-99
Jan-
00Ju
l-00
Jan-
01Ju
l-01
Jan-
02Ju
l-02
Jan-
03Ju
l-03
Jan-
04Ju
l-04
Jan-
05Ju
l-05
Jan-
06Ju
l-06
Jan-
07Ju
l-07
Jan-
08Ju
l-08
Jan-
09Ju
l-09
Jan-
10Ju
l-10
Jan-
11Ju
l-11
Jan-
12Ju
l-12
Jan-
13Ju
l-13
Jan-
14Ju
l-14
Jan-
15Ju
l-15
Jan-
16Ju
l-16
Jan-
17
Con
cent
ratio
n (µ
g/l)
Date
EX-07Trichloroethene
(TCE)
Concentration Baseline 50% Reduction EnhancedBiodegredation
Best Fit Line
MCL = 5 µg/l

EXHIBIT B-5WASATCH CHEMICAL SITEHISTORICAL DATA TRENDSEXTRACTION WELL EX-07
Page 30 of 77
EnhancedBiodegredation
July-06
y = 1E+11e-6E-04x
R² = 0.8233
0
20
40
60
80
100Ja
n-95
Jul-9
5Ja
n-96
Jul-9
6Ja
n-97
Jul-9
7Ja
n-98
Jul-9
8Ja
n-99
Jul-9
9Ja
n-00
Jul-0
0Ja
n-01
Jul-0
1Ja
n-02
Jul-0
2Ja
n-03
Jul-0
3Ja
n-04
Jul-0
4Ja
n-05
Jul-0
5Ja
n-06
Jul-0
6Ja
n-07
Jul-0
7Ja
n-08
Jul-0
8Ja
n-09
Jul-0
9Ja
n-10
Jul-1
0Ja
n-11
Jul-1
1Ja
n-12
Jul-1
2Ja
n-13
Jul-1
3Ja
n-14
Jul-1
4Ja
n-15
Jul-1
5Ja
n-16
Jul-1
6Ja
n-17
Con
cent
ratio
n (µ
g/l)
Date
EX-071,1-Dichloroethene
(1,1-DCE)
Concentration Baseline 50% Reduction EnhancedBiodegredation
Best Fit Line
MCL = 7 µg/l
EnhancedBiodegredation
July-06
0
2
4
6
8
10
Jan-
03
Jul-0
3
Jan-
04
Jul-0
4
Jan-
05
Jul-0
5
Jan-
06
Jul-0
6
Jan-
07
Jul-0
7
Jan-
08
Jul-0
8
Jan-
09
Jul-0
9
Jan-
10
Jul-1
0
Jan-
11
Jul-1
1
Jan-
12
Jul-1
2
Jan-
13
Jul-1
3
Jan-
14
Jul-1
4
Jan-
15
Jul-1
5
Jan-
16
Jul-1
6
Con
cent
ratio
n (µ
g/l)
Date
EX-071,1-Dichloroethene
(1,1-DCE)From 2003 to Present
Concentration Baseline 50% Reduction EnhancedBiodegredation
MCL = 7 µg/l

EXHIBIT B-5WASATCH CHEMICAL SITEHISTORICAL DATA TRENDSEXTRACTION WELL EX-07
Page 31 of 77
0
5
10
15
20
25
Jan-
09
Jul-0
9
Jan-
10
Jul-1
0
Jan-
11
Jul-1
1
Jan-
12
Jul-1
2
Jan-
13
Jul-1
3
Jan-
14
Jul-1
4
Jan-
15
Jul-1
5
Jan-
16
Jul-1
6
Con
cent
ratio
n (µ
g/l)
Date
EX-07cis-1,2-Dichloroethene
(cis-1,2-DCE)
Concentration Baseline 50% Reduction EnhancedBiodegredation
MCL = 70 µg/l
0
2
4
6
8
10
Jan-
09
Jul-0
9
Jan-
10
Jul-1
0
Jan-
11
Jul-1
1
Jan-
12
Jul-1
2
Jan-
13
Jul-1
3
Jan-
14
Jul-1
4
Jan-
15
Jul-1
5
Jan-
16
Jul-1
6
Con
cent
ratio
n (µ
g/l)
Date
EX-07trans-1,2-Dichloroethene
(trans-1,2-DCE)
Concentration Baseline 50% Reduction EnhancedBiodegredation
MCL = 100 µg/l

EXHIBIT B-5WASATCH CHEMICAL SITEHISTORICAL DATA TRENDSEXTRACTION WELL EX-07
Page 32 of 77
EnhancedBiodegredation
July-06
y = 6048.6e-2E-04x
R² = 0.0656
0
20
40
60
80
100
Jan-
96Ju
l-96
Jan-
97Ju
l-97
Jan-
98Ju
l-98
Jan-
99Ju
l-99
Jan-
00Ju
l-00
Jan-
01Ju
l-01
Jan-
02Ju
l-02
Jan-
03Ju
l-03
Jan-
04Ju
l-04
Jan-
05Ju
l-05
Jan-
06Ju
l-06
Jan-
07Ju
l-07
Jan-
08Ju
l-08
Jan-
09Ju
l-09
Jan-
10Ju
l-10
Jan-
11Ju
l-11
Jan-
12Ju
l-12
Jan-
13Ju
l-13
Jan-
14Ju
l-14
Jan-
15Ju
l-15
Jan-
16Ju
l-16
Jan-
17
Con
cent
ratio
n (µ
g/l)
Date
EX-07Vinyl Chloride
(VC)
Concentration Baseline 50% Reduction EnhancedBiodegredation
Best Fit Line
MCL = 2 µg/l
EnhancedBiodegredation
July-06
0
10
20
30
40
50
Jan-
03
Jul-0
3
Jan-
04
Jul-0
4
Jan-
05
Jul-0
5
Jan-
06
Jul-0
6
Jan-
07
Jul-0
7
Jan-
08
Jul-0
8
Jan-
09
Jul-0
9
Jan-
10
Jul-1
0
Jan-
11
Jul-1
1
Jan-
12
Jul-1
2
Jan-
13
Jul-1
3
Jan-
14
Jul-1
4
Jan-
15
Jul-1
5
Jan-
16
Jul-1
6
Con
cent
ratio
n (µ
g/l)
Date
EX-07Vinyl Chloride
(VC)From 2003 to Present
Concentration Baseline 50% Reduction EnhancedBiodegredation
MCL = 2 µg/l
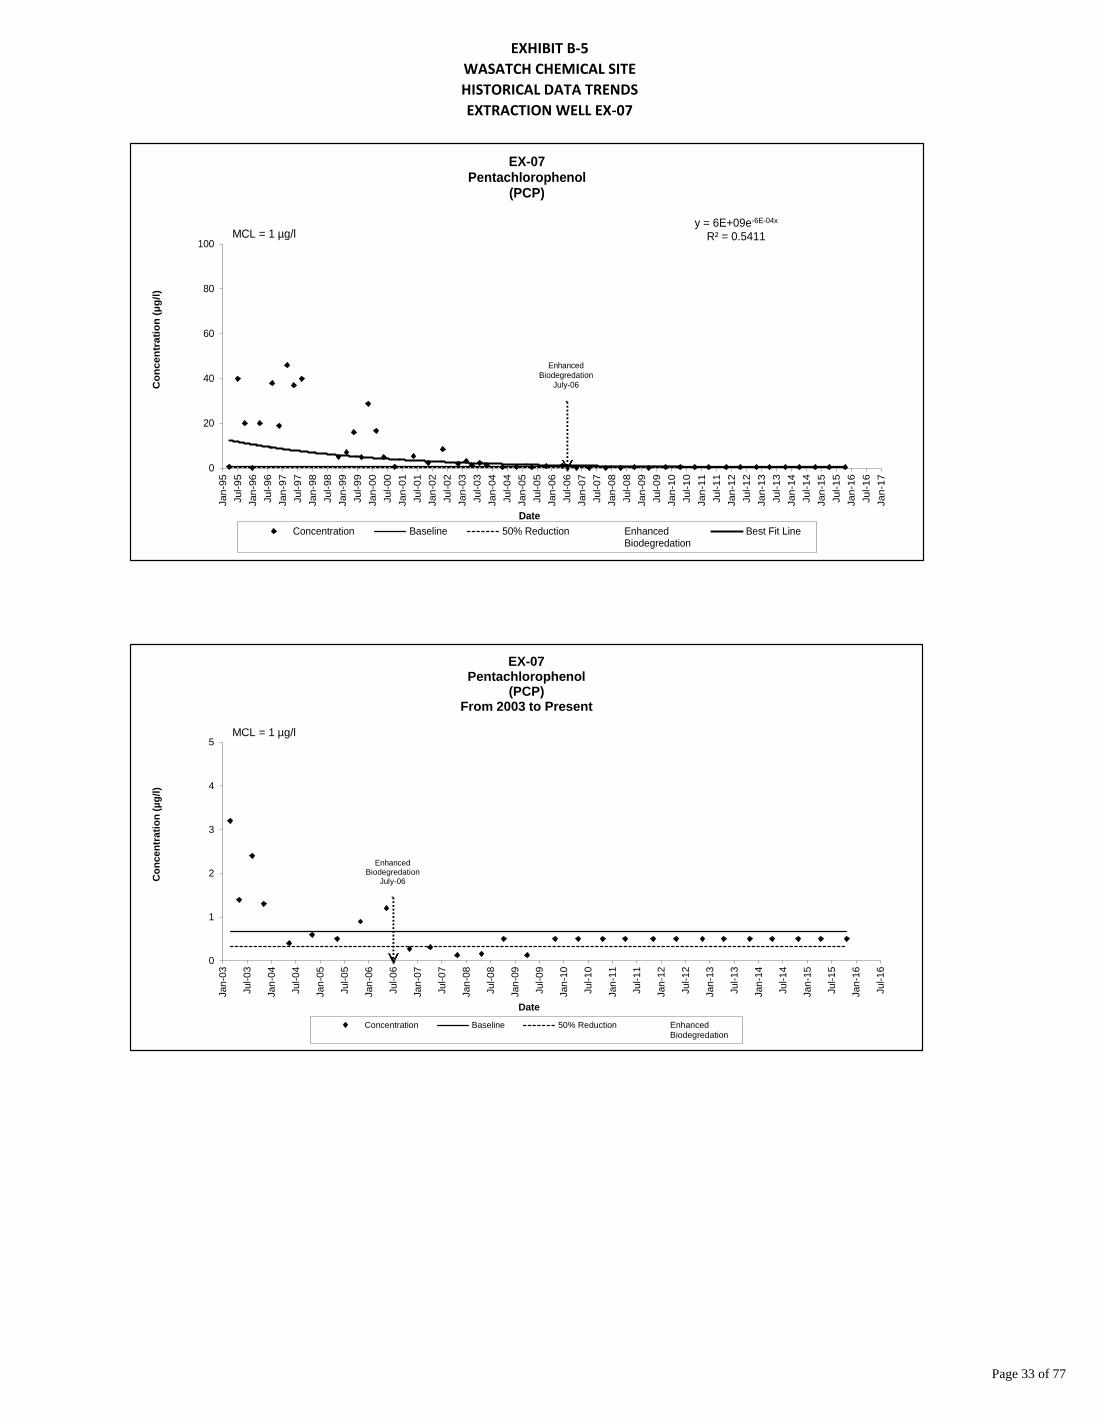
EXHIBIT B-5WASATCH CHEMICAL SITEHISTORICAL DATA TRENDSEXTRACTION WELL EX-07
Page 33 of 77
EnhancedBiodegredation
July-06
0
1
2
3
4
5
Jan-
03
Jul-0
3
Jan-
04
Jul-0
4
Jan-
05
Jul-0
5
Jan-
06
Jul-0
6
Jan-
07
Jul-0
7
Jan-
08
Jul-0
8
Jan-
09
Jul-0
9
Jan-
10
Jul-1
0
Jan-
11
Jul-1
1
Jan-
12
Jul-1
2
Jan-
13
Jul-1
3
Jan-
14
Jul-1
4
Jan-
15
Jul-1
5
Jan-
16
Jul-1
6
Con
cent
ratio
n (µ
g/l)
Date
EX-07Pentachlorophenol
(PCP)From 2003 to Present
Concentration Baseline 50% Reduction EnhancedBiodegredation
MCL = 1 µg/l
EnhancedBiodegredation
July-06
y = 6E+09e-6E-04x
R² = 0.5411
0
20
40
60
80
100
Jan-
95Ju
l-95
Jan-
96Ju
l-96
Jan-
97Ju
l-97
Jan-
98Ju
l-98
Jan-
99Ju
l-99
Jan-
00Ju
l-00
Jan-
01Ju
l-01
Jan-
02Ju
l-02
Jan-
03Ju
l-03
Jan-
04Ju
l-04
Jan-
05Ju
l-05
Jan-
06Ju
l-06
Jan-
07Ju
l-07
Jan-
08Ju
l-08
Jan-
09Ju
l-09
Jan-
10Ju
l-10
Jan-
11Ju
l-11
Jan-
12Ju
l-12
Jan-
13Ju
l-13
Jan-
14Ju
l-14
Jan-
15Ju
l-15
Jan-
16Ju
l-16
Jan-
17
Con
cent
ratio
n (µ
g/l)
Date
EX-07Pentachlorophenol
(PCP)
Concentration Baseline 50% Reduction EnhancedBiodegredation
Best Fit Line
MCL = 1 µg/l

EXHIBIT B-6WASATCH CHEMICAL SITEHISTORICAL DATA TRENDSEXTRACTION WELL EX-08
Page 34 of 77
SampleDate
PCE(µg/l)
TCE(µg/l)
1,1-DCE(µg/l)
cis-1,2-DCE(µg/l)
trans-1,2-DCE(µg/l)
VC(µg/l)
2,4-D(µg/l)
PCP(µg/l)
20-Mar-95 < 2 < 2 < 2 -- -- -- < 10 18.5 J6-Jul-95 < 2 < 2 < 2 -- -- -- < 20 < 40
27-Sep-95 < 2 < 2 < 2 -- -- -- < 2 3027-Dec-95 210 420 22 -- -- -- 980 2928-Mar-96 24 23 < 2 -- -- -- < 2 2228-Aug-96 < 2 < 2 < 2 -- -- -- < 10 20 J21-Nov-96 0.33 T 3.9 0.88 T -- -- 0.55 < 0.25 UJ 1426-Feb-97 < 1 0.94 T 0.15 T -- -- -- < 0.25 8.321-May-97 0.32 T 1.2 0.42 T -- -- -- < 0.25 10 J26-Aug-97 0.82 T 2 0.45 T -- -- -- < 0.25 11 B6-Nov-97 1.3 B 1.4 0.34 -- -- -- < 0.25 11 J12-Feb-98 < 1 0.39 JB < 1 -- -- -- < 0.25 319-May-98 0.21 J 0.34 J < 1 -- -- -- < 0.25 2.812-Aug-98 0.2 J 0.59 J < 1 -- -- -- < 0.25 3.517-Nov-98 < 1 0.48 J < 1 -- -- -- < 0.25 3.424-Feb-99 < 1 UJ < 1 UJ < 1 -- -- -- < 0.25 2.826-May-99 < 1 < 1 < 1 -- -- -- < 5 UJ 325-Aug-99 < 1 0.49 T < 1 -- -- -- < 0.2 2.7117-Nov-99 < 5 0.53 T < 5 -- -- -- < 0.2 3.0822-Feb-00 < 1 < 1 < 1 -- -- -- < 0.2 1.8524-May-00 < 1 0.31 T < 1 -- -- -- < 0.2 2.77 J23-Aug-00 < 0.166 0.45 < 0.116 -- -- -- -- --7-Oct-00 -- -- -- -- -- -- 2.28 J 0.28 J
23-May-01 < 1 0.5 T < 1 -- -- -- < 0.5 0.619-Nov-01 < 1 0.7 T < 1 -- -- -- < 0.5 0.2 T15-May-02 3.3 16 0.7 T -- -- -- < 0.5 0.4 T20-Nov-02 3.8 20 < 1 -- -- -- < 0.48 0.3 T26-Feb-03 1 2.8 < 1 -- -- < 1 0.2 T 0.3 T6-May-03 6.1 25 0.4 T -- -- 6.5 < 0.5 0.2 T12-Aug-03 3 9.5 < 1 -- -- 3.6 < 0.5 0.2 TJ6-Nov-03 2 4.2 < 1 -- -- 0.8 T < 2.4 0.5 T
14-May-04 0.7 T 2 < 1 -- -- < 1 -- 0.2 TUB4-Nov-04 < 1 1 < 1 -- -- < 1 -- 0.4 T
10-May-05 < 1 0.5 T < 1 -- -- < 1 -- < 0.5 1-Nov-05 0.4 T 1 < 1 -- -- < 1 -- < 0.5
16-May-06 0.25 T 0.49 T < 1 -- -- < 1 -- 0.747-Nov-06 0.39 T 1.5 < 1 -- -- 0.54 T -- 0.9210-Apr-07 0.43 T 1.3 < 1 -- -- 0.54 T -- 0.8230-Oct-07 0.36 T 1.6 < 1 -- -- 1.9 -- 1.113-May-08 < 1 0.22 T < 1 -- -- < 1 -- 1.215-Oct-08 < 1 0.22 T < 1 -- -- < 1 -- 1.48-Apr-09 0.83 T 4.7 0.92 T 16 1.5 11 -- 14-Nov-09 < 1 0.4 T < 1 0.94 T < 1 0.35 T -- 2.7 D27-Apr-10 < 1 0.27 T < 1 < 1 < 1 < 1 -- 1.825-Oct-10 < 1 0.44 T < 1 < 1 < 1 < 1 -- 3.4 D12-Apr-11 < 1 0.28 T < 1 < 1 < 1 < 1 -- 1.210-Nov-11 < 1 0.28 T < 1 0.83 T < 1 0.88 T -- 2.9 D2-May-12 < 1 < 1 < 1 0.23 T < 1 < 1 -- 215-Nov-12 < 1 0.29 T < 1 < 1 < 1 < 1 -- 2.4 D25-Apr-13 < 1 < 1 < 1 < 1 < 1 < 1 -- 0.876-Nov-13 < 1 < 1 < 1 < 1 < 1 < 1 -- 0.8921-Apr-14 < 1 < 1 < 1 < 1 < 1 < 1 -- 0.48 T5-Nov-14 < 1 0.11 T < 1 < 1 < 1 < 1 -- 0.8622-Apr-15 < 1 < 1 < 1 < 1 < 1 < 1 -- 0.45 T4-Nov-15 < 1 0.16 T < 1 0.11 T < 1 < 1 -- 0.9
Data qualifiers are defined in laboratory reports. For data collected since 2001, a list of data qualifier definitions is includedat the front of this appendix.-- Not analyzed
LABORATORY PARAMETERS

EXHIBIT B-6WASATCH CHEMICAL SITEHISTORICAL DATA TRENDSEXTRACTION WELL EX-08
Page 35 of 77
0
2
4
6
8
10
Jan-
03
Jul-0
3
Jan-
04
Jul-0
4
Dec
-04
Jul-0
5
Dec
-05
Jul-0
6
Dec
-06
Jul-0
7
Dec
-07
Jun-
08
Dec
-08
Jun-
09
Dec
-09
Jun-
10
Dec
-10
Jun-
11
Dec
-11
Jun-
12
Dec
-12
Jun-
13
Dec
-13
Jun-
14
Dec
-14
Jun-
15
Dec
-15
Jun-
16
Con
cent
ratio
n (µ
g/l)
Date
EX-08Tetrachloroethene
(PCE)From 2003 to Present
Concentration Baseline 50% Reduction EnhancedBiodegredation
MCL = 5 µg/l
y = 63.808e-1E-04x
R² = 0.046
0
60
120
180
240
300Ja
n-95
Jul-9
5Ja
n-96
Jul-9
6Ja
n-97
Jul-9
7Ja
n-98
Jul-9
8Ja
n-99
Jul-9
9Ja
n-00
Jul-0
0Ja
n-01
Jul-0
1Ja
n-02
Jul-0
2Ja
n-03
Jul-0
3Ja
n-04
Jul-0
4Ja
n-05
Jul-0
5Ja
n-06
Jul-0
6Ja
n-07
Jul-0
7Ja
n-08
Jul-0
8Ja
n-09
Jul-0
9Ja
n-10
Jul-1
0Ja
n-11
Jul-1
1Ja
n-12
Jul-1
2Ja
n-13
Jul-1
3Ja
n-14
Jul-1
4Ja
n-15
Jul-1
5Ja
n-16
Jul-1
6Ja
n-17
Con
cent
ratio
n (µ
g/l)
Date
EX-08Tetrachloroethene
(PCE)
Concentration Baseline 50% Reduction EnhancedBiodegredation
Best Fit Line
MCL = 5 µg/l

EXHIBIT B-6WASATCH CHEMICAL SITEHISTORICAL DATA TRENDSEXTRACTION WELL EX-08
Page 36 of 77
0
10
20
30
40
50
Jan-
03
Jul-0
3
Jan-
04
Jul-0
4
Dec
-04
Jul-0
5
Dec
-05
Jul-0
6
Dec
-06
Jul-0
7
Dec
-07
Jun-
08
Dec
-08
Jun-
09
Dec
-09
Jun-
10
Dec
-10
Jun-
11
Dec
-11
Jun-
12
Dec
-12
Jun-
13
Dec
-13
Jun-
14
Dec
-14
Jun-
15
Dec
-15
Jun-
16
Con
cent
ratio
n (µ
g/l)
Date
EX-08Trichloroethene
(TCE)From 2003 to Present
Concentration Baseline 50% Reduction EnhancedBiodegredation
MCL = 5 µg/l
y = 19394e-3E-04x
R² = 0.1536
0
100
200
300
400
500Ja
n-95
Jul-9
5Ja
n-96
Jul-9
6Ja
n-97
Jul-9
7Ja
n-98
Jul-9
8Ja
n-99
Jul-9
9Ja
n-00
Jul-0
0Ja
n-01
Jul-0
1Ja
n-02
Jul-0
2Ja
n-03
Jul-0
3Ja
n-04
Jul-0
4Ja
n-05
Jul-0
5Ja
n-06
Jul-0
6Ja
n-07
Jul-0
7Ja
n-08
Jul-0
8Ja
n-09
Jul-0
9Ja
n-10
Jul-1
0Ja
n-11
Jul-1
1Ja
n-12
Jul-1
2Ja
n-13
Jul-1
3Ja
n-14
Jul-1
4Ja
n-15
Jul-1
5Ja
n-16
Jul-1
6Ja
n-17
Con
cent
ratio
n (µ
g/l)
Date
EX-08Trichloroethene
(TCE)
Concentration Baseline 50% Reduction EnhancedBiodegredation
Best Fit Line
MCL = 5 µg/l

EXHIBIT B-6WASATCH CHEMICAL SITEHISTORICAL DATA TRENDSEXTRACTION WELL EX-08
Page 37 of 77
0
1
2
3
4
5
Jan-
03
Jul-0
3
Jan-
04
Jul-0
4
Dec
-04
Jul-0
5
Dec
-05
Jul-0
6
Dec
-06
Jul-0
7
Dec
-07
Jun-
08
Dec
-08
Jun-
09
Dec
-09
Jun-
10
Dec
-10
Jun-
11
Dec
-11
Jun-
12
Dec
-12
Jun-
13
Dec
-13
Jun-
14
Dec
-14
Jun-
15
Dec
-15
Jun-
16
Con
cent
ratio
n (µ
g/l)
Date
EX-081,1-Dichloroethene
(1,1-DCE)From 2003 to Present
Concentration Baseline 50% Reduction EnhancedBiodegredation
MCL = 7 µg/l
y = 2.7954e-3E-05x
R² = 0.0076
0
5
10
15
20
25
Jan-
95Ju
l-95
Jan-
96Ju
l-96
Jan-
97Ju
l-97
Jan-
98Ju
l-98
Jan-
99Ju
l-99
Jan-
00Ju
l-00
Jan-
01Ju
l-01
Jan-
02Ju
l-02
Jan-
03Ju
l-03
Jan-
04Ju
l-04
Jan-
05Ju
l-05
Jan-
06Ju
l-06
Jan-
07Ju
l-07
Jan-
08Ju
l-08
Jan-
09Ju
l-09
Jan-
10Ju
l-10
Jan-
11Ju
l-11
Jan-
12Ju
l-12
Jan-
13Ju
l-13
Jan-
14Ju
l-14
Jan-
15Ju
l-15
Jan-
16Ju
l-16
Jan-
17
Con
cent
ratio
n (µ
g/l)
Date
EX-081,1-Dichloroethene
(1,1-DCE)
Concentration Baseline 50% Reduction EnhancedBiodegredation
Best Fit Line
MCL = 7 µg/l

EXHIBIT B-6WASATCH CHEMICAL SITEHISTORICAL DATA TRENDSEXTRACTION WELL EX-08
Page 38 of 77
0
5
10
15
20
25Ja
n-09
Jul-0
9
Jan-
10
Jul-1
0
Jan-
11
Jul-1
1
Jan-
12
Jul-1
2
Jan-
13
Jul-1
3
Jan-
14
Jul-1
4
Jan-
15
Jul-1
5
Jan-
16
Jul-1
6
Con
cent
ratio
n (µ
g/l)
Date
EX-08cis-1,2-Dichloroethene
(cis-1,2-DCE)
Concentration Baseline 50% Reduction EnhancedBiodegredation
MCL = 70 µg/l
0
1
2
3
4
5
Jan-
09
Jul-0
9
Jan-
10
Jul-1
0
Jan-
11
Jul-1
1
Jan-
12
Jul-1
2
Jan-
13
Jul-1
3
Jan-
14
Jul-1
4
Jan-
15
Jul-1
5
Jan-
16
Jul-1
6
Con
cent
ratio
n (µ
g/l)
Date
EX-08trans-1,2-Dichloroethene
(trans-1,2-DCE)
Concentration Baseline 50% Reduction EnhancedBiodegredation
MCL = 100 µg/l

EXHIBIT B-6WASATCH CHEMICAL SITEHISTORICAL DATA TRENDSEXTRACTION WELL EX-08
Page 39 of 77
0
5
10
15
20
25
Jan-
03
Jul-0
3
Jan-
04
Jul-0
4
Dec
-04
Jul-0
5
Dec
-05
Jul-0
6
Dec
-06
Jul-0
7
Dec
-07
Jun-
08
Dec
-08
Jun-
09
Dec
-09
Jun-
10
Dec
-10
Jun-
11
Dec
-11
Jun-
12
Dec
-12
Jun-
13
Dec
-13
Jun-
14
Dec
-14
Jun-
15
Dec
-15
Jun-
16
Con
cent
ratio
n (µ
g/l)
Date
EX-08Vinyl Chloride
(VC)From 2003 to Present
Concentration Baseline 50% Reduction EnhancedBiodegredation
MCL = 2 µg/l
y = 4.2884e-3E-05x
R² = 0.0068
0
5
10
15
20
25
Jan-
96Ju
l-96
Jan-
97Ju
l-97
Jan-
98Ju
l-98
Jan-
99Ju
l-99
Jan-
00Ju
l-00
Jan-
01Ju
l-01
Jan-
02Ju
l-02
Jan-
03Ju
l-03
Jan-
04Ju
l-04
Jan-
05Ju
l-05
Jan-
06Ju
l-06
Jan-
07Ju
l-07
Jan-
08Ju
l-08
Jan-
09Ju
l-09
Jan-
10Ju
l-10
Jan-
11Ju
l-11
Jan-
12Ju
l-12
Jan-
13Ju
l-13
Jan-
14Ju
l-14
Jan-
15Ju
l-15
Jan-
16Ju
l-16
Jan-
17
Con
cent
ratio
n (µ
g/l)
Date
EX-08Vinyl Chloride
(VC)
Concentration Baseline 50% Reduction EnhancedBiodegredation
Best Fit Line
MCL = 2 µg/l

EXHIBIT B-6WASATCH CHEMICAL SITEHISTORICAL DATA TRENDSEXTRACTION WELL EX-08
Page 40 of 77
0
1
2
3
4
5
Jan-
03
Jul-0
3
Jan-
04
Jul-0
4
Dec
-04
Jul-0
5
Dec
-05
Jul-0
6
Dec
-06
Jul-0
7
Dec
-07
Jun-
08
Dec
-08
Jun-
09
Dec
-09
Jun-
10
Dec
-10
Jun-
11
Dec
-11
Jun-
12
Dec
-12
Jun-
13
Dec
-13
Jun-
14
Dec
-14
Jun-
15
Dec
-15
Jun-
16
Con
cent
ratio
n (µ
g/l)
Date
EX-08Pentachlorophenol
(PCP)From 2003 to Present
Concentration Baseline 50% Reduction EnhancedBiodegredation
MCL = 1 µg/l
y = 882598e-3E-04x
R² = 0.2942
0
10
20
30
40
50
Jan-
95Ju
l-95
Jan-
96Ju
l-96
Jan-
97Ju
l-97
Jan-
98Ju
l-98
Jan-
99Ju
l-99
Jan-
00Ju
l-00
Jan-
01Ju
l-01
Jan-
02Ju
l-02
Jan-
03Ju
l-03
Jan-
04Ju
l-04
Jan-
05Ju
l-05
Jan-
06Ju
l-06
Jan-
07Ju
l-07
Jan-
08Ju
l-08
Jan-
09Ju
l-09
Jan-
10Ju
l-10
Jan-
11Ju
l-11
Jan-
12Ju
l-12
Jan-
13Ju
l-13
Jan-
14Ju
l-14
Jan-
15Ju
l-15
Jan-
16Ju
l-16
Jan-
17
Con
cent
ratio
n (µ
g/l)
Date
EX-08Pentachlorophenol
(PCP)
Concentration Baseline 50% Reduction EnhancedBiodegredation
Best Fit Line
MCL = 1 µg/l

EXHIBIT B-7WASATCH CHEMICAL SITEHISTORICAL DATA TRENDSEXTRACTION WELL EX-09
Page 41 of 77
SampleDate
PCE(µg/l)
TCE(µg/l)
1,1-DCE(µg/l)
cis-1,2-DCE(µg/l)
trans-1,2-DCE(µg/l)
VC(µg/l)
2,4-D(µg/l)
PCP(µg/l)
20-Mar-95 < 2 190 25 -- -- -- < 2 < 0.2 J6-Jul-95 < 2 120 6.7 -- -- -- < 2 J < 0.2 J
27-Sep-95 < 2 200 35 -- -- -- < 2 < 0.2 27-Dec-95 < 2 190 17 -- -- -- < 2 < 0.2 28-Mar-96 < 2 170 9.1 -- -- -- < 2 < 0.2 28-Aug-96 < 2 90 6.7 -- -- -- < 10 < 0.2 20-Nov-96 < 1 84 6.5 -- -- 0.23 < 0.25 < 1 26-Feb-97 < 1 72 4.3 -- -- -- < 0.25 < 1 21-May-97 2 130 8 -- -- -- < 0.25 126-Aug-97 < 1 85 5.7 -- -- -- < 0.25 16-Nov-97 0.58 JB 60 4.1 -- -- -- < 0.25 < 1 12-Feb-98 < 1 19 B 1.9 -- -- -- < 0.25 < 1 19-May-98 < 1 38 3.5 -- -- -- < 0.25 < 1 12-Aug-98 < 1 73 5 -- -- -- < 0.25 < 1 17-Nov-98 < 1 29 2.8 J -- -- -- < 0.25 < 0.5 24-Feb-99 < 1 30 J 2.3 J -- -- -- < 0.25 < 0.5 26-May-99 < 1 12 1.1 -- -- -- < 4 UJ < 0.5 25-Aug-99 < 1 35 2.7 -- -- -- < 0.2 < 0.1 17-Nov-99 < 5 21 1.9 T -- -- -- < 0.2 < 0.1 22-Feb-00 < 1 9.2 1.4 -- -- -- < 0.2 < 0.1 24-May-00 < 1 17 1.7 -- -- -- < 0.2 < 0.1 23-Aug-00 25 D 310 D 19 D -- -- -- -- --7-Oct-00 -- -- -- -- -- -- 0.43 J < 0.5 UJ
23-May-01 < 1 5.9 0.8 T -- -- -- < 0.5 < 0.5 19-Nov-01 < 1 4.6 1 T -- -- -- < 0.5 < 0.5 15-May-02 < 1 2 < 1 -- -- -- < 0.5 < 0.5 20-Nov-02 < 1 2.9 1 -- -- -- < 0.48 < 0.48 26-Feb-03 < 1 2 0.8 T -- -- < 1 < 0.48 UJ < 0.48 UJ6-May-03 < 1 1 1 -- -- < 1 < 0.5 < 0.5 12-Aug-03 < 1 0.8 T 1 -- -- < 1 < 0.5 < 0.5 5-Nov-03 < 1 1 2.4 -- -- < 1 < 2.4 < 0.48
13-May-04 < 1 0.5 T < 1 -- -- < 1 -- 0.1 T4-Nov-04 < 1 0.7 T 0.7 T -- -- < 1 -- < 0.48
10-May-05 < 1 0.5 T < 1 -- -- < 1 -- < 0.5 1-Nov-05 < 1 0.4 T 0.6 T -- -- < 1 -- < 0.5
16-May-06 < 1 0.42 T 0.32 T -- -- < 1 -- < 0.5 7-Nov-06 < 1 0.7 T 1.3 -- -- < 1 -- < 0.5 10-Apr-07 < 1 0.27 T 1.7 -- -- 0.22 T -- < 0.5 30-Oct-07 < 1 0.6 T 1.8 -- -- 1.2 -- < 0.5 30-Apr-08 < 1 < 1 0.61 T -- -- < 1 -- < 0.5 13-Oct-08 < 1 0.36 T 1.8 -- -- < 1 -- < 0.5 7-Apr-09 < 1 0.29 T 2 24 6 < 1 -- < 0.5 3-Nov-09 < 1 0.33 T 1.6 19 5.8 < 1 -- < 0.5 27-Apr-10 < 1 0.28 T 2.8 35 10 < 1 -- < 0.5 27-Oct-10 < 1 0.25 T 1.7 26 8.2 < 1 -- < 0.5 14-Apr-11 < 1 0.21 T 1.2 17 5.6 < 1 -- < 0.5 10-Nov-11 < 1 0.24 T 1.2 15 5.3 < 1 -- < 0.5 21-Dec-11 -- -- -- -- -- -- -- < 0.5 1-May-12 < 1 0.21 T 2.1 25 7 0.22 T -- --13-Nov-12 < 1 0.29 T 2.5 35 9 0.22 T -- --23-Apr-13 < 1 0.23 T 2 25 7.5 < 1 -- --5-Nov-13 < 1 0.26 T 2.2 28 8.8 < 1 -- --22-Apr-14 < 1 < 1 2.7 31 10 0.24 T -- --4-Nov-14 < 1 0.22 T 2.3 30 11 0.21 T -- --23-Apr-15 < 1 0.17 T 2.1 30 9.1 < 1 -- --3-Nov-15 < 1 0.19 T 1.7 27 7.3 0.16 T -- --
Data qualifiers are defined in laboratory reports. For data collected since 2001, a list of data qualifier definitions is includedat the front of this appendix.-- Not analyzed
LABORATORY PARAMETERS

EXHIBIT B-7WASATCH CHEMICAL SITEHISTORICAL DATA TRENDSEXTRACTION WELL EX-09
Page 42 of 77
0
1
2
3
4
5
Jan-
03
Jul-0
3
Jan-
04
Jul-0
4
Dec
-04
Jul-0
5
Dec
-05
Jul-0
6
Dec
-06
Jul-0
7
Dec
-07
Jun-
08
Dec
-08
Jun-
09
Dec
-09
Jun-
10
Dec
-10
Jun-
11
Dec
-11
Jun-
12
Dec
-12
Jun-
13
Dec
-13
Jun-
14
Dec
-14
Jun-
15
Dec
-15
Jun-
16
Con
cent
ratio
n (µ
g/l)
Date
EX-09Tetrachloroethene
(PCE)From 2003 to Present
Concentration Baseline 50% Reduction EnhancedBiodegredation
MCL = 5 µg/l
y = 17.597e-7E-05x
R² = 0.0913
0
10
20
30
40
50
Jan-
95Ju
l-95
Jan-
96Ju
l-96
Jan-
97Ju
l-97
Jan-
98Ju
l-98
Jan-
99Ju
l-99
Jan-
00Ju
l-00
Jan-
01Ju
l-01
Jan-
02Ju
l-02
Jan-
03Ju
l-03
Jan-
04Ju
l-04
Jan-
05Ju
l-05
Jan-
06Ju
l-06
Jan-
07Ju
l-07
Jan-
08Ju
l-08
Jan-
09Ju
l-09
Jan-
10Ju
l-10
Jan-
11Ju
l-11
Jan-
12Ju
l-12
Jan-
13Ju
l-13
Jan-
14Ju
l-14
Jan-
15Ju
l-15
Jan-
16Ju
l-16
Jan-
17
Con
cent
ratio
n (µ
g/l)
Date
EX-09Tetrachloroethene
(PCE)
Concentration Baseline 50% Reduction EnhancedBiodegredation
Best Fit Line
MCL = 5 µg/l
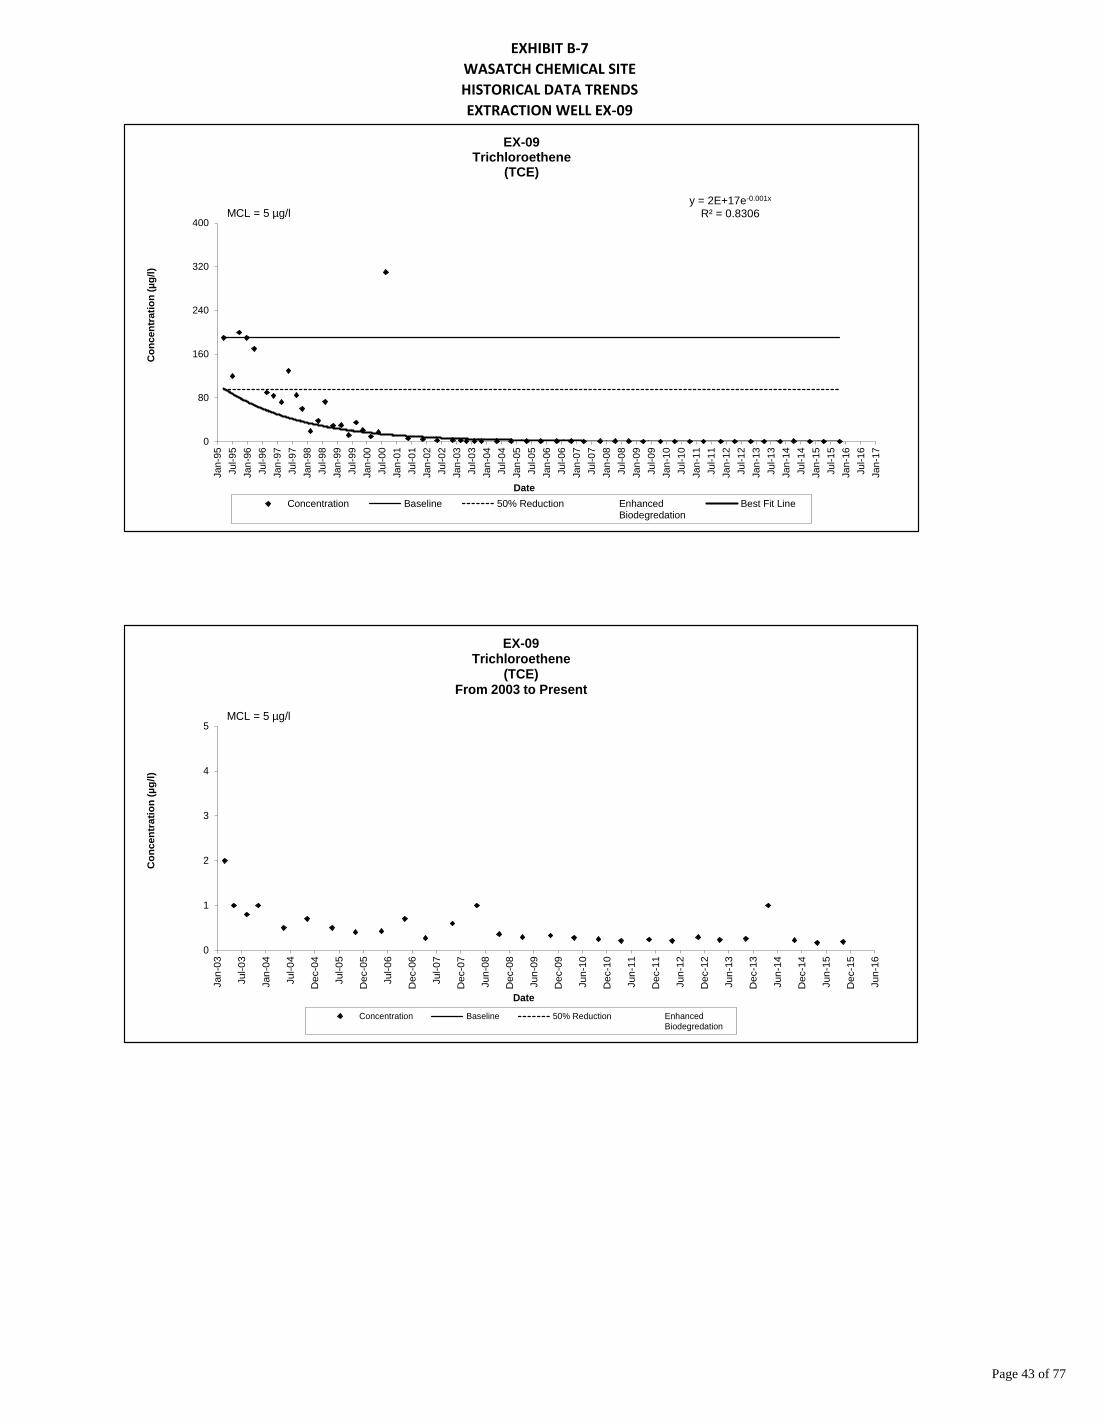
EXHIBIT B-7WASATCH CHEMICAL SITEHISTORICAL DATA TRENDSEXTRACTION WELL EX-09
Page 43 of 77
0
1
2
3
4
5
Jan-
03
Jul-0
3
Jan-
04
Jul-0
4
Dec
-04
Jul-0
5
Dec
-05
Jul-0
6
Dec
-06
Jul-0
7
Dec
-07
Jun-
08
Dec
-08
Jun-
09
Dec
-09
Jun-
10
Dec
-10
Jun-
11
Dec
-11
Jun-
12
Dec
-12
Jun-
13
Dec
-13
Jun-
14
Dec
-14
Jun-
15
Dec
-15
Jun-
16
Con
cent
ratio
n (µ
g/l)
Date
EX-09Trichloroethene
(TCE)From 2003 to Present
Concentration Baseline 50% Reduction EnhancedBiodegredation
MCL = 5 µg/l
y = 2E+17e-0.001x
R² = 0.8306
0
80
160
240
320
400Ja
n-95
Jul-9
5Ja
n-96
Jul-9
6Ja
n-97
Jul-9
7Ja
n-98
Jul-9
8Ja
n-99
Jul-9
9Ja
n-00
Jul-0
0Ja
n-01
Jul-0
1Ja
n-02
Jul-0
2Ja
n-03
Jul-0
3Ja
n-04
Jul-0
4Ja
n-05
Jul-0
5Ja
n-06
Jul-0
6Ja
n-07
Jul-0
7Ja
n-08
Jul-0
8Ja
n-09
Jul-0
9Ja
n-10
Jul-1
0Ja
n-11
Jul-1
1Ja
n-12
Jul-1
2Ja
n-13
Jul-1
3Ja
n-14
Jul-1
4Ja
n-15
Jul-1
5Ja
n-16
Jul-1
6Ja
n-17
Con
cent
ratio
n (µ
g/l)
Date
EX-09Trichloroethene
(TCE)
Concentration Baseline 50% Reduction EnhancedBiodegredation
Best Fit Line
MCL = 5 µg/l

EXHIBIT B-7WASATCH CHEMICAL SITEHISTORICAL DATA TRENDSEXTRACTION WELL EX-09
Page 44 of 77
0
1
2
3
4
5
Jan-
03
Jul-0
3
Jan-
04
Jul-0
4
Dec
-04
Jul-0
5
Dec
-05
Jul-0
6
Dec
-06
Jul-0
7
Dec
-07
Jun-
08
Dec
-08
Jun-
09
Dec
-09
Jun-
10
Dec
-10
Jun-
11
Dec
-11
Jun-
12
Dec
-12
Jun-
13
Dec
-13
Jun-
14
Dec
-14
Jun-
15
Dec
-15
Jun-
16
Con
cent
ratio
n (µ
g/l)
Date
EX-091,1-Dichloroethene
(1,1-DCE)From 2003 to Present
Concentration Baseline 50% Reduction EnhancedBiodegredation
MCL = 7 µg/l
y = 5456.3e-2E-04x
R² = 0.2312
0
10
20
30
40
50
Jan-
95Ju
l-95
Jan-
96Ju
l-96
Jan-
97Ju
l-97
Jan-
98Ju
l-98
Jan-
99Ju
l-99
Jan-
00Ju
l-00
Jan-
01Ju
l-01
Jan-
02Ju
l-02
Jan-
03Ju
l-03
Jan-
04Ju
l-04
Jan-
05Ju
l-05
Jan-
06Ju
l-06
Jan-
07Ju
l-07
Jan-
08Ju
l-08
Jan-
09Ju
l-09
Jan-
10Ju
l-10
Jan-
11Ju
l-11
Jan-
12Ju
l-12
Jan-
13Ju
l-13
Jan-
14Ju
l-14
Jan-
15Ju
l-15
Jan-
16Ju
l-16
Jan-
17
Con
cent
ratio
n (µ
g/l)
Date
EX-091,1-Dichloroethene
(1,1-DCE)
Concentration Baseline 50% Reduction EnhancedBiodegredation
Best Fit Line
MCL = 7 µg/l

EXHIBIT B-7WASATCH CHEMICAL SITEHISTORICAL DATA TRENDSEXTRACTION WELL EX-09
Page 45 of 77
0
10
20
30
40
50
Jan-
09
Jul-0
9
Jan-
10
Jul-1
0
Jan-
11
Jul-1
1
Jan-
12
Jul-1
2
Jan-
13
Jul-1
3
Jan-
14
Jul-1
4
Jan-
15
Jul-1
5
Jan-
16
Jul-1
6
Con
cent
ratio
n (µ
g/l)
Date
EX-09cis-1,2-Dichloroethene
(cis-1,2-DCE)
Concentration Baseline 50% Reduction EnhancedBiodegredation
MCL = 70 µg/l
0
5
10
15
20
25
Jan-
09
Jul-0
9
Jan-
10
Jul-1
0
Jan-
11
Jul-1
1
Jan-
12
Jul-1
2
Jan-
13
Jul-1
3
Jan-
14
Jul-1
4
Jan-
15
Jul-1
5
Jan-
16
Jul-1
6
Con
cent
ratio
n (µ
g/l)
Date
EX-09trans-1,2-Dichloroethene
(trans-1,2-DCE)
Concentration Baseline 50% Reduction EnhancedBiodegredation
MCL = 100 µg/l

EXHIBIT B-7WASATCH CHEMICAL SITEHISTORICAL DATA TRENDSEXTRACTION WELL EX-09
Page 46 of 77
0
1
2
3
4
5
Jan-
03
Jul-0
3
Jan-
04
Jul-0
4
Dec
-04
Jul-0
5
Dec
-05
Jul-0
6
Dec
-06
Jul-0
7
Dec
-07
Jun-
08
Dec
-08
Jun-
09
Dec
-09
Jun-
10
Dec
-10
Jun-
11
Dec
-11
Jun-
12
Dec
-12
Jun-
13
Dec
-13
Jun-
14
Dec
-14
Jun-
15
Dec
-15
Jun-
16
Con
cent
ratio
n (µ
g/l)
Date
EX-09Vinyl Chloride
(VC)From 2003 to Present
Concentration Baseline 50% Reduction EnhancedBiodegredation
MCL = 2 µg/l
y = 50.998e-1E-04x
R² = 0.0699
0
1
2
3
4
5Ja
n-96
Jul-9
6Ja
n-97
Jul-9
7Ja
n-98
Jul-9
8Ja
n-99
Jul-9
9Ja
n-00
Jul-0
0Ja
n-01
Jul-0
1Ja
n-02
Jul-0
2Ja
n-03
Jul-0
3Ja
n-04
Jul-0
4Ja
n-05
Jul-0
5Ja
n-06
Jul-0
6Ja
n-07
Jul-0
7Ja
n-08
Jul-0
8Ja
n-09
Jul-0
9Ja
n-10
Jul-1
0Ja
n-11
Jul-1
1Ja
n-12
Jul-1
2Ja
n-13
Jul-1
3Ja
n-14
Jul-1
4Ja
n-15
Jul-1
5Ja
n-16
Jul-1
6Ja
n-17
Con
cent
ratio
n (µ
g/l)
Date
EX-09Vinyl Chloride
(VC)
Concentration Baseline 50% Reduction EnhancedBiodegredation
Best Fit Line
MCL = 2 µg/l

EXHIBIT B-8WASATCH CHEMICAL SITEHISTORICAL DATA TRENDS
EXTRACTION TRENCH EX-11
Page 47 of 77
SampleDate
PCE(µg/l)
TCE(µg/l)
1,1-DCE(µg/l)
cis-1,2-DCE(µg/l)
trans-1,2-DCE(µg/l)
VC(µg/l)
2,4-D(µg/l)
PCP(µg/l)
20-Mar-95 2000 5900 380 -- -- -- 3.89 J < 2 J6-Jul-95 840 3200 < 200 -- -- -- < 20 J < 0.2 J
27-Sep-95 1000 1600 210 -- -- -- < 2 < 0.2 28-Mar-96 150 380 28 -- -- -- < 2 < 0.2 28-Aug-96 36 390 36 -- -- -- < 10 < 0.2 20-Nov-96 100 560 34 -- -- 130 < 0.6 UJ < 1 27-Dec-96 670 920 63 -- -- -- < 2 < 0.2 26-Feb-97 130 470 25 -- -- -- < 0.25 < 1 21-May-97 130 300 33 -- -- -- < 0.25 126-Aug-97 200 560 39 -- -- -- < 2.5 16-Nov-97 120 560 33 -- -- -- < 2.5 < 1 12-Feb-98 86 B 330 B 26 -- -- -- < 0.25 < 1 19-May-98 170 420 34 -- -- -- < 0.25 < 1 12-Aug-98 130 420 35 -- -- -- < 0.55 < 1 17-Nov-98 34 400 31 J -- -- -- < 2.5 G < 0.6 G24-Feb-99 72 J 530 J 30 J -- -- -- < 2.5 G < 0.5 26-May-99 65 250 J 15 -- -- -- < 4 UJ < 0.5 25-Aug-99 74 420 23 -- -- -- 5.68 0.63117-Nov-99 29 T 480 26 T -- -- -- < 0.2 < 0.1 22-Feb-00 37 400 24 -- -- -- < 0.2 < 0.1 24-May-00 91 480 J 22 -- -- -- < 0.2 < 0.1 23-Aug-00 47 D 420 D 21 D -- -- -- -- --7-Oct-00 -- -- -- -- -- -- 4.66 0.45
23-May-01 95 D 382 D 27 D -- -- -- < 0.5 0.1 T19-Nov-01 43 D 392 D 29 D -- -- -- < 0.5 < 0.5 15-May-02 110 D 402 D 27 D -- -- -- < 0.48 < 0.48 20-Nov-02 62 DJ 347 D 31 DJ -- -- -- < 0.48 < 0.48 UJ26-Feb-03 61 339 24 -- -- 170 < 0.48 UJ < 0.48 UJ6-May-03 72 D 420 D 24 -- -- 247 D < 0.5 < 0.5 UJ13-Aug-03 50 374 D 35 -- -- 271 D < 0.5 < 0.5 J5-Nov-03 64 D 362 D 35 D -- -- 394 D < 2.4 < 0.48 UJ
13-May-04 59 J 460 D 51 J -- -- 658 D -- 0.1 TJ4-Nov-04 2.7 120 D 12 -- -- 617 DJ -- < 0.48 UJ
10-May-05 < 25 D 120 D 19 TD -- -- 500 D -- < 0.5 UJ31-Oct-05 < 5 D 82 D 15 D -- -- 580 D -- < 0.5 UJ16-May-06 3.2 210 DJ 20 -- -- 380 DJ -- < 0.5 6-Sep-06 0.56 T 23 0.99 T -- -- 310 D -- --6-Nov-06 0.36 TJ+ 13 J+ 1.2 J+ -- -- 160 D -- < 0.5 10-Apr-07 0.29 T 15 3.6 -- -- 300 D -- < 0.5 30-Oct-07 < 1 4.3 0.74 T -- -- 480 DJ -- < 0.5 30-Apr-08 1.2 64 D 18 -- -- 920 D -- < 0.5 14-Oct-08 < 1 3.8 1.1 -- -- 520 D -- < 0.5 8-Apr-09 < 1 83 D 23 1200 D 120 D 560 D -- < 0.5 3-Nov-09 < 1 2.5 3.4 300 D 78 D 840 D -- < 0.5 26-Apr-10 < 1 35 20 1300 D 100 550 D -- < 0.5 27-Oct-10 < 1 2.3 4.1 420 D 87 790 DJ- -- < 0.5 11-Apr-11 1.7 26 15 740 D 81 230 D -- < 0.5 9-Nov-11 < 1 2 1.2 97 54 240 D -- < 0.5 1-May-12 < 1 14 6.1 360 D 73 590 D -- < 0.5 13-Nov-12 < 1 3 1.3 140 D 65 470 D -- < 0.5 24-Apr-13 < 1 69 15 670 D 84 460 D -- < 0.5 5-Nov-13 < 1 2.3 0.43 T 34 54 D 180 D -- < 0.5 22-Apr-14 < 1 3.8 8.8 430 D 88 530 D -- < 0.5 4-Nov-14 < 1 1.1 0.45 T 32 61 170 D -- < 0.5 23-Apr-15 < 1 0.79 T 0.23 T 15 49 72 -- < 0.5 3-Nov-15 < 1 0.84 T < 1 7 37 41 -- < 0.5
Data qualifiers are defined in laboratory reports. For data collected since 2001, a list of data qualifier definitions is includedat the front of this appendix.-- Not analyzed
LABORATORY PARAMETERS

EXHIBIT B-8WASATCH CHEMICAL SITEHISTORICAL DATA TRENDS
EXTRACTION TRENCH EX-11
Page 48 of 77
EnhancedBiodegredation
May-04
EnhancedBiodegredation
July-06
y = 2E+17e-1E-03x
R² = 0.8017
0
500
1000
1500
2000
2500
Jan-
95Ju
l-95
Jan-
96Ju
l-96
Jan-
97Ju
l-97
Jan-
98Ju
l-98
Jan-
99Ju
l-99
Jan-
00Ju
l-00
Jan-
01Ju
l-01
Jan-
02Ju
l-02
Jan-
03Ju
l-03
Jan-
04Ju
l-04
Jan-
05Ju
l-05
Jan-
06Ju
l-06
Jan-
07Ju
l-07
Jan-
08Ju
l-08
Jan-
09Ju
l-09
Jan-
10Ju
l-10
Jan-
11Ju
l-11
Jan-
12Ju
l-12
Jan-
13Ju
l-13
Jan-
14Ju
l-14
Jan-
15Ju
l-15
Jan-
16Ju
l-16
Jan-
17
Con
cent
ratio
n (µ
g/l)
Date
EX-11Tetrachloroethene
(PCE)
Concentration Baseline 50% Reduction EnhancedBiodegredation
Best Fit Line
MCL = 5 µg/l
EnhancedBiodegredation
May-04
EnhancedBiodegredation
July-06
0
20
40
60
80
100
Jan-
03
Jul-0
3
Jan-
04
Jul-0
4
Jan-
05
Jul-0
5
Jan-
06
Jul-0
6
Jan-
07
Jul-0
7
Jan-
08
Jul-0
8
Jan-
09
Jul-0
9
Jan-
10
Jul-1
0
Jan-
11
Jul-1
1
Jan-
12
Jul-1
2
Jan-
13
Jul-1
3
Jan-
14
Jul-1
4
Jan-
15
Jul-1
5
Jan-
16
Jul-1
6
Con
cent
ratio
n (µ
g/l)
Date
EX-11Tetrachloroethene
(PCE)From 2003 to Present
Concentration Baseline 50% Reduction EnhancedBiodegredation
MCL = 5 µg/l

EXHIBIT B-8WASATCH CHEMICAL SITEHISTORICAL DATA TRENDS
EXTRACTION TRENCH EX-11
Page 49 of 77
EnhancedBiodegredation
May-04
EnhancedBiodegredation
July-06
0
120
240
360
480
600
Jan-
03
Jul-0
3
Jan-
04
Jul-0
4
Jan-
05
Jul-0
5
Jan-
06
Jul-0
6
Jan-
07
Jul-0
7
Jan-
08
Jul-0
8
Jan-
09
Jul-0
9
Jan-
10
Jul-1
0
Jan-
11
Jul-1
1
Jan-
12
Jul-1
2
Jan-
13
Jul-1
3
Jan-
14
Jul-1
4
Jan-
15
Jul-1
5
Jan-
16
Jul-1
6
Con
cent
ratio
n (µ
g/l)
Date
EX-11Trichloroethene
(TCE)From 2003 to Present
Concentration Baseline 50% Reduction EnhancedBiodegredation
MCL = 5 µg/l
EnhancedBiodegredation
May-04
EnhancedBiodegredation
July-06
y = 1E+17e-9E-04x
R² = 0.8065
0
2000
4000
6000
8000
10000Ja
n-95
Jul-9
5Ja
n-96
Jul-9
6Ja
n-97
Jul-9
7Ja
n-98
Jul-9
8Ja
n-99
Jul-9
9Ja
n-00
Jul-0
0Ja
n-01
Jul-0
1Ja
n-02
Jul-0
2Ja
n-03
Jul-0
3Ja
n-04
Jul-0
4Ja
n-05
Jul-0
5Ja
n-06
Jul-0
6Ja
n-07
Jul-0
7Ja
n-08
Jul-0
8Ja
n-09
Jul-0
9Ja
n-10
Jul-1
0Ja
n-11
Jul-1
1Ja
n-12
Jul-1
2Ja
n-13
Jul-1
3Ja
n-14
Jul-1
4Ja
n-15
Jul-1
5Ja
n-16
Jul-1
6Ja
n-17
Con
cent
ratio
n (µ
g/l)
Date
EX-11Trichloroethene
(TCE)
Concentration Baseline 50% Reduction EnhancedBiodegredation
Best Fit Line
MCL = 5 µg/l

EXHIBIT B-8WASATCH CHEMICAL SITEHISTORICAL DATA TRENDS
EXTRACTION TRENCH EX-11
Page 50 of 77
EnhancedBiodegredation
May-04
EnhancedBiodegredation
July-06
y = 2E+10e-6E-04x
R² = 0.6096
0
100
200
300
400
500
Jan-
95Ju
l-95
Jan-
96Ju
l-96
Jan-
97Ju
l-97
Jan-
98Ju
l-98
Jan-
99Ju
l-99
Jan-
00Ju
l-00
Jan-
01Ju
l-01
Jan-
02Ju
l-02
Jan-
03Ju
l-03
Jan-
04Ju
l-04
Jan-
05Ju
l-05
Jan-
06Ju
l-06
Jan-
07Ju
l-07
Jan-
08Ju
l-08
Jan-
09Ju
l-09
Jan-
10Ju
l-10
Jan-
11Ju
l-11
Jan-
12Ju
l-12
Jan-
13Ju
l-13
Jan-
14Ju
l-14
Jan-
15Ju
l-15
Jan-
16Ju
l-16
Jan-
17
Con
cent
ratio
n (µ
g/l)
Date
EX-111,1-Dichloroethene
(1,1-DCE)
Concentration Baseline 50% Reduction EnhancedBiodegredation
Best Fit Line
MCL = 7 µg/l
EnhancedBiodegredation
May-04
EnhancedBiodegredation
July-06
0
20
40
60
80
100
Jan-
03
Jul-0
3
Jan-
04
Jul-0
4
Jan-
05
Jul-0
5
Jan-
06
Jul-0
6
Jan-
07
Jul-0
7
Jan-
08
Jul-0
8
Jan-
09
Jul-0
9
Jan-
10
Jul-1
0
Jan-
11
Jul-1
1
Jan-
12
Jul-1
2
Jan-
13
Jul-1
3
Jan-
14
Jul-1
4
Jan-
15
Jul-1
5
Jan-
16
Jul-1
6
Con
cent
ratio
n (µ
g/l)
Date
EX-111,1-Dichloroethene
(1,1-DCE)From 2003 to Present
Concentration Baseline 50% Reduction EnhancedBiodegredation
MCL = 7 µg/l
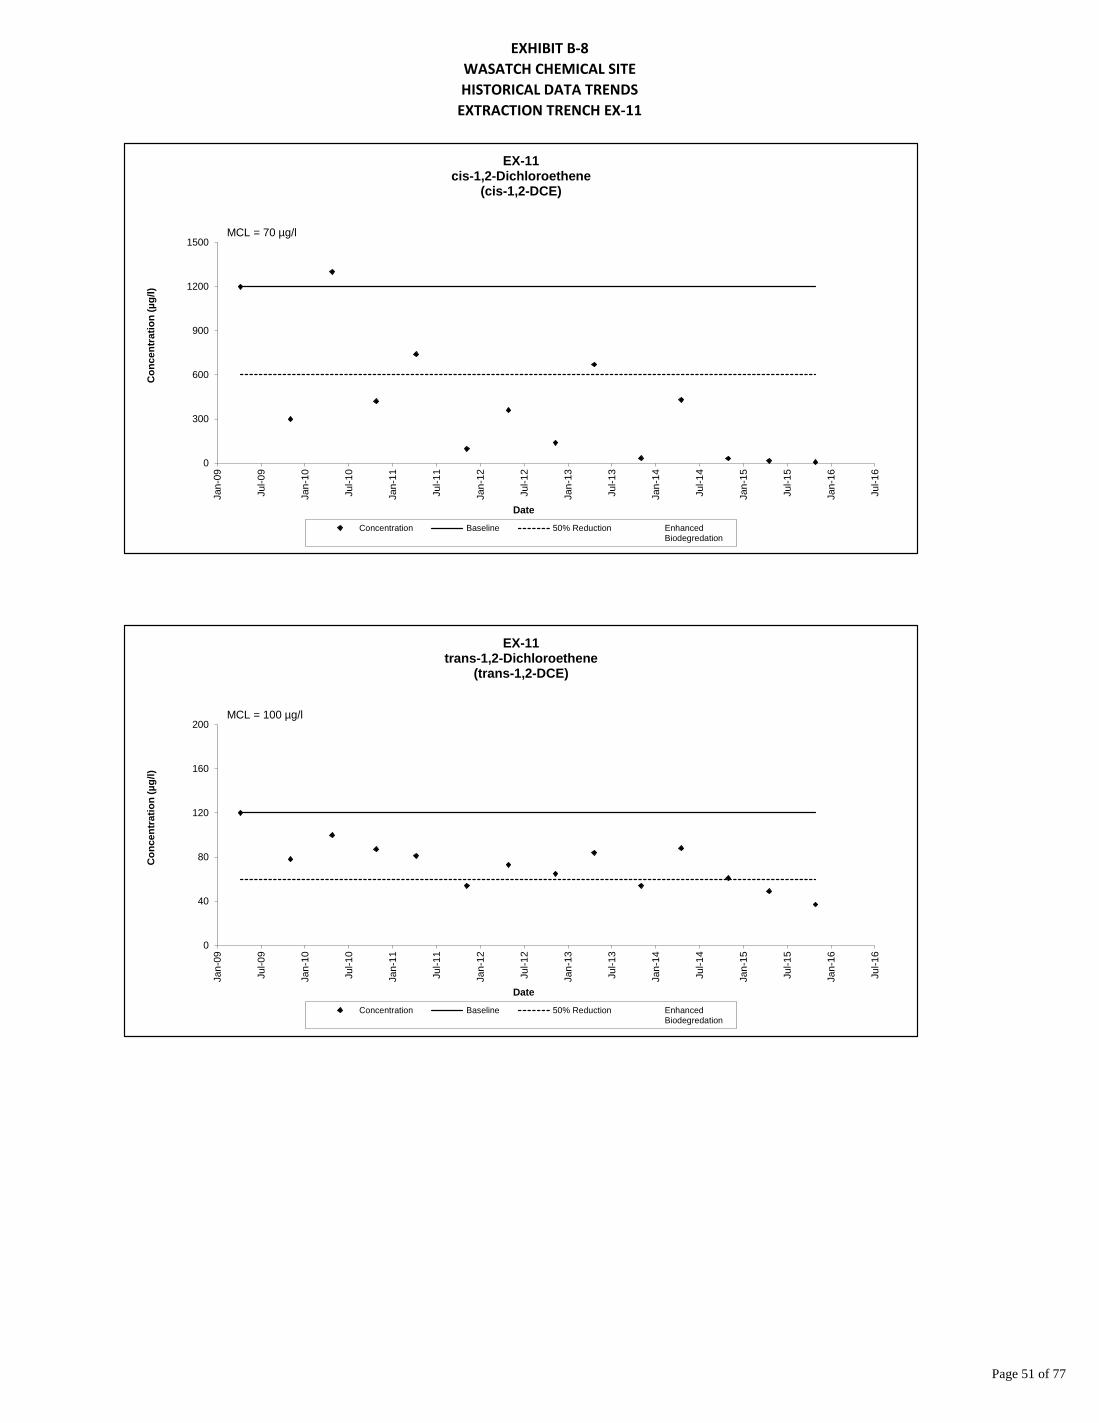
EXHIBIT B-8WASATCH CHEMICAL SITEHISTORICAL DATA TRENDS
EXTRACTION TRENCH EX-11
Page 51 of 77
0
300
600
900
1200
1500
Jan-
09
Jul-0
9
Jan-
10
Jul-1
0
Jan-
11
Jul-1
1
Jan-
12
Jul-1
2
Jan-
13
Jul-1
3
Jan-
14
Jul-1
4
Jan-
15
Jul-1
5
Jan-
16
Jul-1
6
Con
cent
ratio
n (µ
g/l)
Date
EX-11cis-1,2-Dichloroethene
(cis-1,2-DCE)
Concentration Baseline 50% Reduction EnhancedBiodegredation
MCL = 70 µg/l
0
40
80
120
160
200
Jan-
09
Jul-0
9
Jan-
10
Jul-1
0
Jan-
11
Jul-1
1
Jan-
12
Jul-1
2
Jan-
13
Jul-1
3
Jan-
14
Jul-1
4
Jan-
15
Jul-1
5
Jan-
16
Jul-1
6
Con
cent
ratio
n (µ
g/l)
Date
EX-11trans-1,2-Dichloroethene
(trans-1,2-DCE)
Concentration Baseline 50% Reduction EnhancedBiodegredation
MCL = 100 µg/l

EXHIBIT B-8WASATCH CHEMICAL SITEHISTORICAL DATA TRENDS
EXTRACTION TRENCH EX-11
Page 52 of 77
EnhancedBiodegredation
May-04
EnhancedBiodegredation
July-06
y = 4254.5e-6E-05x
R² = 0.0207
0
220
440
660
880
1100
Jan-
96Ju
l-96
Jan-
97Ju
l-97
Jan-
98Ju
l-98
Jan-
99Ju
l-99
Jan-
00Ju
l-00
Jan-
01Ju
l-01
Jan-
02Ju
l-02
Jan-
03Ju
l-03
Jan-
04Ju
l-04
Jan-
05Ju
l-05
Jan-
06Ju
l-06
Jan-
07Ju
l-07
Jan-
08Ju
l-08
Jan-
09Ju
l-09
Jan-
10Ju
l-10
Jan-
11Ju
l-11
Jan-
12Ju
l-12
Jan-
13Ju
l-13
Jan-
14Ju
l-14
Jan-
15Ju
l-15
Jan-
16Ju
l-16
Jan-
17
Con
cent
ratio
n (µ
g/l)
Date
EX-11Vinyl Chloride
(VC)
Concentration Baseline 50% Reduction EnhancedBiodegredation
Best Fit Line
MCL = 2 µg/l
EnhancedBiodegredation
May-04
EnhancedBiodegredation
July-06
0
220
440
660
880
1100
Jan-
03
Jul-0
3
Jan-
04
Jul-0
4
Jan-
05
Jul-0
5
Jan-
06
Jul-0
6
Jan-
07
Jul-0
7
Jan-
08
Jul-0
8
Jan-
09
Jul-0
9
Jan-
10
Jul-1
0
Jan-
11
Jul-1
1
Jan-
12
Jul-1
2
Jan-
13
Jul-1
3
Jan-
14
Jul-1
4
Jan-
15
Jul-1
5
Jan-
16
Jul-1
6
Con
cent
ratio
n (µ
g/l)
Date
EX-11Vinyl Chloride
(VC)From 2003 to Present
Concentration Baseline 50% Reduction EnhancedBiodegredation
MCL = 2 µg/l

EXHIBIT B-9WASATCH CHEMICAL SITEHISTORICAL DATA TRENDS
MONITORING WELL MW-06
Page 53 of 77
SampleDate
PCE(µg/l)
TCE(µg/l)
1,1-DCE(µg/l)
cis-1,2-DCE(µg/l)
trans-1,2-DCE(µg/l)
VC(µg/l)
2,4-D(µg/l)
PCP(µg/l)
15-May-06 < 1 < 1 < 1 -- -- < 1 -- --7-Nov-06 < 1 0.3 T < 1 -- -- < 1 -- --11-Apr-07 < 1 < 1 < 1 -- -- < 1 -- --31-Oct-07 < 1 0.21 T < 1 -- -- < 1 -- --29-Apr-08 < 1 < 1 < 1 -- -- < 1 -- --15-Oct-08 < 1 0.59 T < 1 -- -- < 1 -- --8-Apr-09 < 1 < 1 0.37 T 1.9 0.31 T 0.24 T -- --4-Nov-09 < 1 < 1 < 1 0.86 T < 1 < 1 -- --27-Apr-10 < 1 < 1 0.87 T 5.3 0.65 T < 1 -- --25-Oct-10 < 1 < 1 0.66 T 4.5 0.61 T 0.3 T -- --13-Apr-11 < 1 < 1 3.5 21 3.2 1.5 -- --10-Nov-11 < 1 < 1 3 18 2.8 0.98 T -- --3-May-12 < 1 < 1 3.4 19 3.1 1.5 -- --14-Nov-12 < 1 0.53 T 3.1 23 4.3 1.2 -- --25-Apr-13 < 1 0.25 T 5.7 28 5.1 1.9 -- --7-Nov-13 < 1 0.29 T 3.4 25 4.8 1.4 -- --21-Apr-14 < 1 0.21 T 4.3 24 5.3 1.4 -- --6-Nov-14 < 1 0.18 T 3.1 22 4.6 1.1 -- --23-Apr-15 < 1 0.2 T 4.1 34 6.9 1.2 -- --5-Nov-15 < 1 0.24 T 3.1 26 4.9 1 -- --
Data qualifiers are defined in laboratory reports. For data collected since 2001, a list of data qualifier definitions is includedat the front of this appendix.-- Not analyzed
LABORATORY PARAMETERS

EXHIBIT B-9WASATCH CHEMICAL SITEHISTORICAL DATA TRENDS
MONITORING WELL MW-06
Page 54 of 77
y = 2E-10e0.0006x
R² = 0.6097
0
2
4
6
8
10
Jan-
06
Jul-0
6
Jan-
07
Jul-0
7
Jan-
08
Jul-0
8
Jan-
09
Jul-0
9
Jan-
10
Jul-1
0
Jan-
11
Jul-1
1
Jan-
12
Jul-1
2
Jan-
13
Jul-1
3
Jan-
14
Jul-1
4
Jan-
15
Jul-1
5
Jan-
16
Jul-1
6
Con
cent
ratio
n (µ
g/l)
Date
MW-061,1-Dichloroethene
(1,1-DCE)
Concentration Baseline 50% Reduction EnhancedBiodegredation
Best Fit Line
MCL = 7 µg/l
0
10
20
30
40
50
Jan-
09
Jul-0
9
Jan-
10
Jul-1
0
Jan-
11
Jul-1
1
Jan-
12
Jul-1
2
Jan-
13
Jul-1
3
Jan-
14
Jul-1
4
Jan-
15
Jul-1
5
Jan-
16
Jul-1
6
Con
cent
ratio
n (µ
g/l)
Date
MW-06cis-1,2-Dichloroethene
(cis-1,2-DCE)
Concentration Baseline 50% Reduction EnhancedBiodegredation
MCL = 70 µg/l

EXHIBIT B-9WASATCH CHEMICAL SITEHISTORICAL DATA TRENDS
MONITORING WELL MW-06
Page 55 of 77
y = 0.0037e0.0001x
R² = 0.0932
0
1
2
3
4
5
Jan-
06
Jul-0
6
Jan-
07
Jul-0
7
Jan-
08
Jul-0
8
Jan-
09
Jul-0
9
Jan-
10
Jul-1
0
Jan-
11
Jul-1
1
Jan-
12
Jul-1
2
Jan-
13
Jul-1
3
Jan-
14
Jul-1
4
Jan-
15
Jul-1
5
Jan-
16
Jul-1
6
Con
cent
ratio
n (µ
g/l)
Date
MW-06Vinyl Chloride
(VC)
Concentration Baseline 50% Reduction EnhancedBiodegredation
Best Fit Line
MCL = 2 µg/l
0
2
4
6
8
10
Jan-
09
Jul-0
9
Jan-
10
Jul-1
0
Jan-
11
Jul-1
1
Jan-
12
Jul-1
2
Jan-
13
Jul-1
3
Jan-
14
Jul-1
4
Jan-
15
Jul-1
5
Jan-
16
Jul-1
6
Con
cent
ratio
n (µ
g/l)
Date
MW-06trans-1,2-Dichloroethene
(trans-1,2-DCE)
Concentration Baseline 50% Reduction EnhancedBiodegredation
MCL = 100 µg/l

EXHIBIT B-10WASATCH CHEMICAL SITEHISTORICAL DATA TRENDS
MONITORING WELL MW-20
Page 56 of 77
SampleDate
PCE(µg/l)
TCE(µg/l)
1,1-DCE(µg/l)
cis-1,2-DCE(µg/l)
trans-1,2-DCE(µg/l)
VC(µg/l)
2,4-D(µg/l)
PCP(µg/l)
20-Mar-95 75 J 3600 J 350 J -- -- -- < 2 < 0.2 J6-Jul-95 160 3600 150 -- -- -- < 2 < 0.2
27-Sep-95 290 5500 580 -- -- -- < 2 < 0.2 27-Dec-95 320 3400 87 -- -- -- < 2 < 0.2 28-Mar-96 95 1700 45 -- -- -- < 2 < 0.2 28-Aug-96 170 2600 97 -- -- -- 2.6 T < 0.2 21-Nov-96 < 50 2700 100 -- -- 50 < 1.5 < 1 26-Feb-97 31 1400 49 -- -- -- < 0.25 < 1 21-May-97 25 1000 40 -- -- -- < 0.25 < 1 26-Aug-97 15 T 1500 61 -- -- -- < 2.5 < 1 6-Nov-97 < 25 1400 50 -- -- -- < 0.25 < 1 12-Feb-98 < 12 630 B 35 -- -- -- < 0.25 < 1 19-May-98 7 J 830 35 -- -- -- < 0.25 < 1 12-Aug-98 7.1 J 810 36 -- -- -- < 0.25 < 1 17-Nov-98 6.4 J 510 25 J -- -- -- < 0.25 < 0.5 24-Feb-99 5.3 JB 460 J 25 J -- -- -- < 0.25 < 0.5 26-May-99 34 190 10 -- -- -- < 4 UJ < 0.5 25-Aug-99 < 25 G 220 15 T -- -- -- 1.41 < 0.1 17-Nov-99 5.8 T 340 20 T -- -- -- < 0.2 J < 0.1 J22-Feb-00 33 400 24 -- -- -- < 0.2 < 0.1 24-May-00 8.9 T 180 13 -- -- -- < 0.2 < 0.1 6-Oct-00 11 D 250 D 16 D -- -- -- -- --
23-May-01 48 D 316 D 20 D -- -- -- < 0.5 < 0.5 19-Nov-01 5 D 230 D 25 D -- -- -- < 0.5 0.2 T15-May-02 2.3 205 D 15 -- -- -- < 0.5 < 0.5 20-Nov-02 0.7 T 166 D 17 -- -- -- < 0.48 < 0.48 27-Feb-03 1 142 10 -- -- 0.4 T -- --6-May-03 2 119 D 12 -- -- -- -- --13-Aug-03 1 113 D 20 -- -- 0.7 T -- --5-Nov-03 2 149 D 24 -- -- < 5 D -- --
13-May-04 3.1 87 D 21 -- -- 0.9 T -- --4-Nov-04 0.9 T 22 5.8 -- -- 4.7 -- < 0.48
10-May-05 0.9 T 10 3.1 -- -- 7.4 -- < 0.5 31-Oct-05 < 1 2.4 0.8 T -- -- 7.6 -- < 0.5 16-May-06 0.47 T 6.5 1 -- -- 5.4 -- < 0.5 6-Nov-06 0.29 T 5.7 0.62 T -- -- 3.6 -- --10-Apr-07 < 1 2.9 0.76 T -- -- 1.1 -- --30-Oct-07 < 1 1.4 0.56 T -- -- 0.7 T -- < 0.5 30-Apr-08 0.29 T 4.9 3.4 -- -- 3.3 -- < 0.5 14-Oct-08 < 1 2.6 2 -- -- 3.1 -- --7-Apr-09 < 1 5.5 3.3 24 22 3 -- 0.11 T3-Nov-09 < 1 1.2 1.5 20 10 3.3 -- < 0.5 26-Apr-10 < 1 2.3 2.3 34 17 3.8 -- < 0.5 27-Oct-10 < 1 1 0.81 T 14 10 3.2 -- --14-Apr-11 < 1 3.4 2 26 21 8.1 -- --10-Nov-11 < 1 0.97 T 0.95 T 15 13 2.4 -- --2-May-12 < 1 1.4 1.8 28 12 3 -- --13-Nov-12 < 1 1.2 0.64 T 12 13 1.9 -- --23-Apr-13 < 1 1.4 1.3 20 18 2.7 -- --5-Nov-13 < 1 0.91 T 1.1 20 11 4 -- --22-Apr-14 < 1 1 1.6 25 15 2.1 -- --4-Nov-14 < 1 0.69 T 1.8 30 8.7 7.4 -- --23-Apr-15 < 1 0.86 T 1.3 25 10 2.2 -- --3-Nov-15 < 1 0.51 T 1.3 24 7.4 5.4 -- --
Data qualifiers are defined in laboratory reports. For data collected since 2001, a list of data qualifier definitions is includedat the front of this appendix.-- Not analyzed
LABORATORY PARAMETERS

EXHIBIT B-10WASATCH CHEMICAL SITEHISTORICAL DATA TRENDS
MONITORING WELL MW-20
Page 57 of 77
EnhancedBiodegredation
May-04
EnhancedBiodegredation
July-06
y = 7E+11e-7E-04x
R² = 0.6623
0
80
160
240
320
400
Jan-
95Ju
l-95
Jan-
96Ju
l-96
Jan-
97Ju
l-97
Jan-
98Ju
l-98
Jan-
99Ju
l-99
Jan-
00Ju
l-00
Jan-
01Ju
l-01
Jan-
02Ju
l-02
Jan-
03Ju
l-03
Jan-
04Ju
l-04
Jan-
05Ju
l-05
Jan-
06Ju
l-06
Jan-
07Ju
l-07
Jan-
08Ju
l-08
Jan-
09Ju
l-09
Jan-
10Ju
l-10
Jan-
11Ju
l-11
Jan-
12Ju
l-12
Jan-
13Ju
l-13
Jan-
14Ju
l-14
Jan-
15Ju
l-15
Jan-
16Ju
l-16
Jan-
17
Con
cent
ratio
n (µ
g/l)
Date
MW-20Tetrachloroethene
(PCE)
Concentration Baseline 50% Reduction EnhancedBiodegredation
Best Fit Line
MCL = 5 µg/l
EnhancedBiodegredation
May-04
EnhancedBiodegredation
July-06
0
1
2
3
4
5
Jan-
03
Jul-0
3
Jan-
04
Jul-0
4
Jan-
05
Jul-0
5
Jan-
06
Jul-0
6
Jan-
07
Jul-0
7
Jan-
08
Jul-0
8
Jan-
09
Jul-0
9
Jan-
10
Jul-1
0
Jan-
11
Jul-1
1
Jan-
12
Jul-1
2
Jan-
13
Jul-1
3
Jan-
14
Jul-1
4
Jan-
15
Jul-1
5
Jan-
16
Jul-1
6
Con
cent
ratio
n (µ
g/l)
Date
MW-20Tetrachloroethene
(PCE)From 2003 to Present
Concentration Baseline 50% Reduction EnhancedBiodegredation
MCL = 5 µg/l

EXHIBIT B-10WASATCH CHEMICAL SITEHISTORICAL DATA TRENDS
MONITORING WELL MW-20
Page 58 of 77
EnhancedBiodegredation
May-04
EnhancedBiodegredation
July-06
0
40
80
120
160
200
Jan-
03
Jul-0
3
Jan-
04
Jul-0
4
Jan-
05
Jul-0
5
Jan-
06
Jul-0
6
Jan-
07
Jul-0
7
Jan-
08
Jul-0
8
Jan-
09
Jul-0
9
Jan-
10
Jul-1
0
Jan-
11
Jul-1
1
Jan-
12
Jul-1
2
Jan-
13
Jul-1
3
Jan-
14
Jul-1
4
Jan-
15
Jul-1
5
Jan-
16
Jul-1
6
Con
cent
ratio
n (µ
g/l)
Date
MW-20Trichloroethene
(TCE)From 2003 to Present
Concentration Baseline 50% Reduction EnhancedBiodegredation
MCL = 5 µg/l
EnhancedBiodegredation
May-04
EnhancedBiodegredation
July-06
y = 7E+22e-0.001x
R² = 0.9414
0
2000
4000
6000
8000
10000
Jan-
95Ju
l-95
Jan-
96Ju
l-96
Jan-
97Ju
l-97
Jan-
98Ju
l-98
Jan-
99Ju
l-99
Jan-
00Ju
l-00
Jan-
01Ju
l-01
Jan-
02Ju
l-02
Jan-
03Ju
l-03
Jan-
04Ju
l-04
Jan-
05Ju
l-05
Jan-
06Ju
l-06
Jan-
07Ju
l-07
Jan-
08Ju
l-08
Jan-
09Ju
l-09
Jan-
10Ju
l-10
Jan-
11Ju
l-11
Jan-
12Ju
l-12
Jan-
13Ju
l-13
Jan-
14Ju
l-14
Jan-
15Ju
l-15
Jan-
16Ju
l-16
Jan-
17
Con
cent
ratio
n (µ
g/l)
Date
MW-20Trichloroethene
(TCE)
Concentration Baseline 50% Reduction EnhancedBiodegredation
Best Fit Line
MCL = 5 µg/l

EXHIBIT B-10WASATCH CHEMICAL SITEHISTORICAL DATA TRENDS
MONITORING WELL MW-20
Page 59 of 77
EnhancedBiodegredation
May-04
EnhancedBiodegredation
July-06
y = 4E+12e-7E-04x
R² = 0.7948
0
140
280
420
560
700
Jan-
95Ju
l-95
Jan-
96Ju
l-96
Jan-
97Ju
l-97
Jan-
98Ju
l-98
Jan-
99Ju
l-99
Jan-
00Ju
l-00
Jan-
01Ju
l-01
Jan-
02Ju
l-02
Jan-
03Ju
l-03
Jan-
04Ju
l-04
Jan-
05Ju
l-05
Jan-
06Ju
l-06
Jan-
07Ju
l-07
Jan-
08Ju
l-08
Jan-
09Ju
l-09
Jan-
10Ju
l-10
Jan-
11Ju
l-11
Jan-
12Ju
l-12
Jan-
13Ju
l-13
Jan-
14Ju
l-14
Jan-
15Ju
l-15
Jan-
16Ju
l-16
Jan-
17
Con
cent
ratio
n (µ
g/l)
Date
MW-201,1-Dichloroethene
(1,1-DCE)
Concentration Baseline 50% Reduction EnhancedBiodegredation
Best Fit Line
MCL = 7 µg/l
EnhancedBiodegredation
May-04
EnhancedBiodegredation
July-06
0
10
20
30
40
50
Jan-
03
Jul-0
3
Jan-
04
Jul-0
4
Jan-
05
Jul-0
5
Jan-
06
Jul-0
6
Jan-
07
Jul-0
7
Jan-
08
Jul-0
8
Jan-
09
Jul-0
9
Jan-
10
Jul-1
0
Jan-
11
Jul-1
1
Jan-
12
Jul-1
2
Jan-
13
Jul-1
3
Jan-
14
Jul-1
4
Jan-
15
Jul-1
5
Jan-
16
Jul-1
6
Con
cent
ratio
n (µ
g/l)
Date
MW-201,1-Dichloroethene
(1,1-DCE)From 2003 to Present
Concentration Baseline 50% Reduction EnhancedBiodegredation
MCL = 7 µg/l

EXHIBIT B-10WASATCH CHEMICAL SITEHISTORICAL DATA TRENDS
MONITORING WELL MW-20
Page 60 of 77
0
10
20
30
40
50
Jan-
09
Jul-0
9
Jan-
10
Jul-1
0
Jan-
11
Jul-1
1
Jan-
12
Jul-1
2
Jan-
13
Jul-1
3
Jan-
14
Jul-1
4
Jan-
15
Jul-1
5
Jan-
16
Jul-1
6
Con
cent
ratio
n (µ
g/l)
Date
MW-20cis-1,2-Dichloroethene
(cis-1,2-DCE)
Concentration Baseline 50% Reduction EnhancedBiodegredation
MCL = 70 µg/l
0
5
10
15
20
25
Jan-
09
Jul-0
9
Jan-
10
Jul-1
0
Jan-
11
Jul-1
1
Jan-
12
Jul-1
2
Jan-
13
Jul-1
3
Jan-
14
Jul-1
4
Jan-
15
Jul-1
5
Jan-
16
Jul-1
6
Con
cent
ratio
n (µ
g/l)
Date
MW-20trans-1,2-Dichloroethene
(trans-1,2-DCE)
Concentration Baseline 50% Reduction EnhancedBiodegredation
MCL = 100 µg/l

EXHIBIT B-10WASATCH CHEMICAL SITEHISTORICAL DATA TRENDS
MONITORING WELL MW-20
Page 61 of 77
EnhancedBiodegredation
May-04
EnhancedBiodegredation
July-06
y = 29.263e-6E-05x
R² = 0.0097
0
20
40
60
80
100
Jan-
96Ju
l-96
Jan-
97Ju
l-97
Jan-
98Ju
l-98
Jan-
99Ju
l-99
Jan-
00Ju
l-00
Jan-
01Ju
l-01
Jan-
02Ju
l-02
Jan-
03Ju
l-03
Jan-
04Ju
l-04
Jan-
05Ju
l-05
Jan-
06Ju
l-06
Jan-
07Ju
l-07
Jan-
08Ju
l-08
Jan-
09Ju
l-09
Jan-
10Ju
l-10
Jan-
11Ju
l-11
Jan-
12Ju
l-12
Jan-
13Ju
l-13
Jan-
14Ju
l-14
Jan-
15Ju
l-15
Jan-
16Ju
l-16
Jan-
17
Con
cent
ratio
n (µ
g/l)
Date
MW-20Vinyl Chloride
(VC)
Concentration Baseline 50% Reduction EnhancedBiodegredation
Best Fit Line
MCL = 2 µg/l
EnhancedBiodegredation
May-04
EnhancedBiodegredation
July-06
0
2
4
6
8
10
Jan-
03
Jul-0
3
Jan-
04
Jul-0
4
Jan-
05
Jul-0
5
Jan-
06
Jul-0
6
Jan-
07
Jul-0
7
Jan-
08
Jul-0
8
Jan-
09
Jul-0
9
Jan-
10
Jul-1
0
Jan-
11
Jul-1
1
Jan-
12
Jul-1
2
Jan-
13
Jul-1
3
Jan-
14
Jul-1
4
Jan-
15
Jul-1
5
Jan-
16
Jul-1
6
Con
cent
ratio
n (µ
g/l)
Date
MW-20Vinyl Chloride
(VC)From 2003 to Present
Concentration Baseline 50% Reduction EnhancedBiodegredation
MCL = 2 µg/l

EXHIBIT B-11WASATCH CHEMICAL SITEHISTORICAL DATA TRENDS
MONITORING WELL MW-23
Page 62 of 77
SampleDate
PCE(µg/l)
TCE(µg/l)
1,1-DCE(µg/l)
cis-1,2-DCE(µg/l)
trans-1,2-DCE(µg/l)
VC(µg/l)
2,4-D(µg/l)
PCP(µg/l)
9-Mar-95 < 2 < 2 < 2 -- -- -- < 10 J < 1 J6-Jul-95 < 2 < 2 < 2 -- -- -- < 2 < 0.2
29-Sep-95 < 2 < 2 < 2 -- -- -- < 2 < 0.2 27-Dec-95 < 2 < 2 < 2 -- -- -- < 2 < 0.2 28-Mar-96 < 2 < 2 < 2 -- -- -- < 2 < 0.2 27-Aug-96 < 2 < 2 < 2 -- -- -- < 10 < 0.2 21-Nov-96 < 1 < 1 < 1 -- -- 1.4 < 0.25 UJ < 1 25-Feb-97 < 1 < 1 < 1 -- -- -- < 0.25 < 1 20-May-97 < 1 < 1 < 1 -- -- -- < 0.25 < 1 25-Aug-97 < 1 0.14 T < 1 -- -- -- < 0.25 < 1 5-Nov-97 < 1 < 1 < 1 -- -- -- < 0.25 < 1 12-Feb-98 < 1 < 1 < 1 -- -- -- < 0.25 J < 1 18-May-98 < 1 < 1 < 1 -- -- -- < 0.25 < 1 11-Aug-98 < 1 < 1 < 1 -- -- -- < 0.25 < 1 16-Nov-98 < 1 < 1 < 1 -- -- -- 0.9 < 0.5 23-Feb-99 < 1 < 1 < 1 -- -- -- 0.57 J < 0.5 25-May-99 < 1 < 1 < 1 -- -- -- < 4 UJ < 0.5 26-Aug-99 < 1 < 1 < 1 -- -- -- 5 < 0.1 18-Nov-99 < 5 < 5 < 5 -- -- -- < 0.2 J < 0.1 J23-Feb-00 < 1 < 1 < 1 -- -- -- < 0.2 < 0.1 23-May-00 < 1 < 1 < 1 -- -- -- 0.741 < 0.1 23-Aug-00 < 0.166 < 0.0672 < 0.116 -- -- -- -- --7-Oct-00 -- -- -- -- -- -- 0.07 < 0.5
24-May-01 < 1 < 1 < 1 -- -- -- < 0.5 < 0.5 14-May-02 < 1 < 1 < 1 -- -- -- < 0.5 < 0.5 27-Feb-03 < 1 < 2 < 1 -- -- < 1 -- --5-May-03 < 1 < 1 < 1 -- -- < 1 -- --13-Aug-03 < 1 < 1 < 1 -- -- < 1 -- --6-Nov-03 < 1 < 1 < 1 -- -- < 1 -- --
13-May-04 < 1 < 1 < 1 -- -- < 1 -- --4-Nov-04 < 1 < 1 < 1 -- -- < 1 -- --9-May-05 < 1 < 1 < 1 -- -- < 1 -- --2-Nov-05 < 1 < 1 < 1 -- -- < 1 -- --
15-May-06 < 1 < 1 < 1 -- -- < 1 -- --7-Nov-06 < 1 < 1 < 1 -- -- < 1 -- --11-Apr-07 < 1 < 1 < 1 -- -- < 1 -- --31-Oct-07 < 1 < 1 < 1 -- -- < 1 -- --29-Apr-08 < 1 < 1 < 1 -- -- < 1 -- --15-Oct-08 < 1 < 1 < 1 -- -- < 1 -- --8-Apr-09 < 1 < 1 < 1 < 1 < 1 < 1 -- --4-Nov-09 < 1 < 1 < 1 < 1 < 1 < 1 -- --27-Apr-10 < 1 < 1 < 1 < 1 < 1 < 1 -- --26-Oct-10 < 1 < 1 < 1 < 1 < 1 < 1 -- --13-Apr-11 < 1 < 1 < 1 < 1 < 1 < 1 -- --10-Nov-11 < 1 < 1 < 1 < 1 < 1 < 1 -- --2-May-12 < 1 < 1 < 1 < 1 < 1 < 1 -- --15-Nov-12 < 1 < 1 < 1 < 1 < 1 < 1 -- --25-Apr-13 < 1 < 1 < 1 < 1 < 1 < 1 -- --7-Nov-13 < 1 < 1 < 1 < 1 < 1 < 1 -- --21-Apr-14 < 1 < 1 < 1 < 1 < 1 < 1 -- --6-Nov-14 < 1 < 1 < 1 < 1 < 1 < 1 -- --21-Apr-15 < 1 < 1 < 1 < 1 < 1 < 1 -- --4-Nov-15 < 1 < 1 < 1 < 1 < 1 < 1 -- --
Data qualifiers are defined in laboratory reports. For data collected since 2001, a list of data qualifier definitions is includedat the front of this appendix.-- Not analyzed
LABORATORY PARAMETERS

EXHIBIT B-12WASATCH CHEMICAL SITEHISTORICAL DATA TRENDS
MONITORING WELL MW-24A
Page 63 of 77
SampleDate
PCE(µg/l)
TCE(µg/l)
1,1-DCE(µg/l)
cis-1,2-DCE(µg/l)
trans-1,2-DCE(µg/l)
VC(µg/l)
2,4-D(µg/l)
PCP(µg/l)
9-Mar-95 < 2 < 2 < 2 -- -- -- < 10 J < 1 J6-Jul-95 < 2 < 2 < 2 -- -- -- < 2 < 0.2
27-Sep-95 < 2 < 2 < 2 -- -- -- < 2 < 0.2 28-Dec-95 < 2 < 2 < 2 -- -- -- < 2 0.229-Mar-96 < 2 < 2 < 2 -- -- -- < 2 < 0.2 27-Aug-96 < 2 < 2 < 2 -- -- -- < 10 < 0.2 21-Nov-96 < 1 < 1 < 1 -- -- 1 < 0.25 < 1 UJ25-Feb-97 < 1 < 1 < 1 -- -- -- < 0.25 < 1 20-May-97 < 1 < 1 < 1 -- -- -- < 0.25 < 1 25-Aug-97 < 1 < 1 < 1 -- -- -- < 0.25 < 1 5-Nov-97 0.32 J < 1 < 1 -- -- -- < 0.25 < 1 12-Feb-98 < 1 < 1 < 1 -- -- -- < 0.25 < 1 18-May-98 < 1 < 1 < 1 -- -- -- < 0.25 < 1 11-Aug-98 < 1 < 1 < 1 -- -- -- < 0.25 < 1 16-Nov-98 < 1 < 1 < 1 -- -- -- < 0.25 < 0.5 23-Feb-99 < 1 < 1 < 1 -- -- -- < 0.25 < 0.5 25-May-99 < 1 < 1 < 1 -- -- -- < 4 UJ < 0.5 26-Aug-99 < 1 < 1 < 1 -- -- -- < 0.2 < 0.1 18-Nov-99 < 5 < 5 < 5 -- -- -- < 0.2 J < 0.1 J23-Feb-00 < 1 < 1 < 1 -- -- -- < 0.2 < 0.1 23-May-00 < 1 < 1 < 1 -- -- -- < 0.2 < 0.1 23-Aug-00 < 0.166 < 0.0672 < 0.116 -- -- -- -- --7-Oct-00 -- -- -- -- -- -- < 0.5 < 0.5
24-May-01 < 1 0.3 T < 1 -- -- -- < 0.5 < 0.5 14-May-02 < 1 < 1 < 1 -- -- -- < 0.5 < 0.5 27-Feb-03 < 1 < 2 < 1 -- -- < 1 -- --5-May-03 < 1 < 1 < 1 -- -- < 1 -- --13-Aug-03 < 1 < 1 < 1 -- -- < 1 -- --6-Nov-03 < 1 < 1 < 1 -- -- < 1 -- --
13-May-04 < 1 < 1 < 1 -- -- < 1 -- --4-Nov-04 < 1 < 1 < 1 -- -- < 1 -- --9-May-05 < 1 < 1 < 1 -- -- < 1 -- --2-Nov-05 < 1 < 1 < 1 -- -- < 1 -- --
15-May-06 < 1 < 1 < 1 -- -- < 1 -- --7-Nov-06 < 1 < 1 < 1 -- -- < 1 -- --11-Apr-07 < 1 < 1 < 1 -- -- < 1 -- --31-Oct-07 < 1 < 1 < 1 -- -- < 1 -- --29-Apr-08 < 1 < 1 < 1 -- -- < 1 -- --15-Oct-08 < 1 < 1 < 1 -- -- < 1 -- --8-Apr-09 < 1 < 1 < 1 < 1 < 1 < 1 -- --4-Nov-09 < 1 < 1 < 1 < 1 < 1 < 1 -- --28-Apr-10 < 1 < 1 < 1 < 1 < 1 < 1 -- --25-Oct-10 < 1 < 1 < 1 < 1 < 1 < 1 -- --13-Apr-11 < 1 < 1 < 1 < 1 < 1 < 1 -- --11-Nov-11 < 1 < 1 < 1 < 1 < 1 < 1 -- --2-May-12 < 1 < 1 < 1 < 1 < 1 < 1 -- --14-Nov-12 < 1 < 1 < 1 < 1 < 1 < 1 -- --24-Apr-13 < 1 < 1 < 1 < 1 < 1 < 1 -- --6-Nov-13 < 1 < 1 < 1 < 1 < 1 < 1 -- --23-Apr-14 < 1 < 1 < 1 < 1 < 1 < 1 -- --5-Nov-14 < 1 < 1 < 1 < 1 < 1 < 1 -- --21-Apr-15 < 1 < 1 < 1 < 1 < 1 < 1 -- --4-Nov-15 < 1 < 1 < 1 < 1 < 1 < 1 -- --
Data qualifiers are defined in laboratory reports. For data collected since 2001, a list of data qualifier definitions is includedat the front of this appendix.-- Not analyzed
LABORATORY PARAMETERS
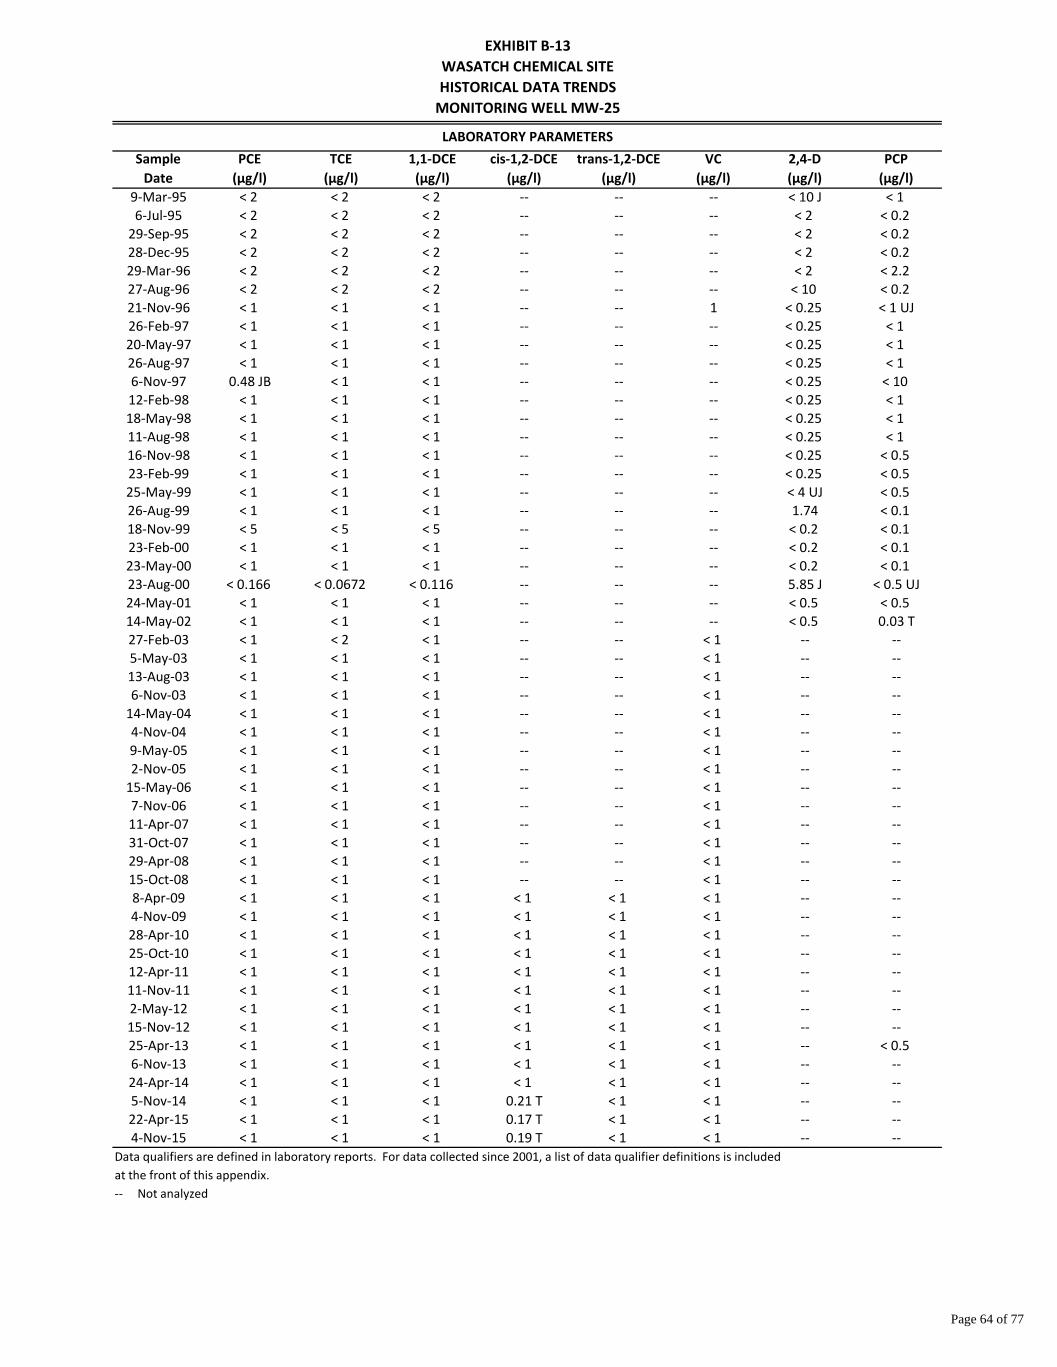
EXHIBIT B-13WASATCH CHEMICAL SITEHISTORICAL DATA TRENDS
MONITORING WELL MW-25
Page 64 of 77
SampleDate
PCE(µg/l)
TCE(µg/l)
1,1-DCE(µg/l)
cis-1,2-DCE(µg/l)
trans-1,2-DCE(µg/l)
VC(µg/l)
2,4-D(µg/l)
PCP(µg/l)
9-Mar-95 < 2 < 2 < 2 -- -- -- < 10 J < 1 6-Jul-95 < 2 < 2 < 2 -- -- -- < 2 < 0.2
29-Sep-95 < 2 < 2 < 2 -- -- -- < 2 < 0.2 28-Dec-95 < 2 < 2 < 2 -- -- -- < 2 < 0.2 29-Mar-96 < 2 < 2 < 2 -- -- -- < 2 < 2.2 27-Aug-96 < 2 < 2 < 2 -- -- -- < 10 < 0.2 21-Nov-96 < 1 < 1 < 1 -- -- 1 < 0.25 < 1 UJ26-Feb-97 < 1 < 1 < 1 -- -- -- < 0.25 < 1 20-May-97 < 1 < 1 < 1 -- -- -- < 0.25 < 1 26-Aug-97 < 1 < 1 < 1 -- -- -- < 0.25 < 1 6-Nov-97 0.48 JB < 1 < 1 -- -- -- < 0.25 < 10 12-Feb-98 < 1 < 1 < 1 -- -- -- < 0.25 < 1 18-May-98 < 1 < 1 < 1 -- -- -- < 0.25 < 1 11-Aug-98 < 1 < 1 < 1 -- -- -- < 0.25 < 1 16-Nov-98 < 1 < 1 < 1 -- -- -- < 0.25 < 0.5 23-Feb-99 < 1 < 1 < 1 -- -- -- < 0.25 < 0.5 25-May-99 < 1 < 1 < 1 -- -- -- < 4 UJ < 0.5 26-Aug-99 < 1 < 1 < 1 -- -- -- 1.74 < 0.1 18-Nov-99 < 5 < 5 < 5 -- -- -- < 0.2 < 0.1 23-Feb-00 < 1 < 1 < 1 -- -- -- < 0.2 < 0.1 23-May-00 < 1 < 1 < 1 -- -- -- < 0.2 < 0.1 23-Aug-00 < 0.166 < 0.0672 < 0.116 -- -- -- 5.85 J < 0.5 UJ24-May-01 < 1 < 1 < 1 -- -- -- < 0.5 < 0.5 14-May-02 < 1 < 1 < 1 -- -- -- < 0.5 0.03 T27-Feb-03 < 1 < 2 < 1 -- -- < 1 -- --5-May-03 < 1 < 1 < 1 -- -- < 1 -- --13-Aug-03 < 1 < 1 < 1 -- -- < 1 -- --6-Nov-03 < 1 < 1 < 1 -- -- < 1 -- --
14-May-04 < 1 < 1 < 1 -- -- < 1 -- --4-Nov-04 < 1 < 1 < 1 -- -- < 1 -- --9-May-05 < 1 < 1 < 1 -- -- < 1 -- --2-Nov-05 < 1 < 1 < 1 -- -- < 1 -- --
15-May-06 < 1 < 1 < 1 -- -- < 1 -- --7-Nov-06 < 1 < 1 < 1 -- -- < 1 -- --11-Apr-07 < 1 < 1 < 1 -- -- < 1 -- --31-Oct-07 < 1 < 1 < 1 -- -- < 1 -- --29-Apr-08 < 1 < 1 < 1 -- -- < 1 -- --15-Oct-08 < 1 < 1 < 1 -- -- < 1 -- --8-Apr-09 < 1 < 1 < 1 < 1 < 1 < 1 -- --4-Nov-09 < 1 < 1 < 1 < 1 < 1 < 1 -- --28-Apr-10 < 1 < 1 < 1 < 1 < 1 < 1 -- --25-Oct-10 < 1 < 1 < 1 < 1 < 1 < 1 -- --12-Apr-11 < 1 < 1 < 1 < 1 < 1 < 1 -- --11-Nov-11 < 1 < 1 < 1 < 1 < 1 < 1 -- --2-May-12 < 1 < 1 < 1 < 1 < 1 < 1 -- --15-Nov-12 < 1 < 1 < 1 < 1 < 1 < 1 -- --25-Apr-13 < 1 < 1 < 1 < 1 < 1 < 1 -- < 0.5 6-Nov-13 < 1 < 1 < 1 < 1 < 1 < 1 -- --24-Apr-14 < 1 < 1 < 1 < 1 < 1 < 1 -- --5-Nov-14 < 1 < 1 < 1 0.21 T < 1 < 1 -- --22-Apr-15 < 1 < 1 < 1 0.17 T < 1 < 1 -- --4-Nov-15 < 1 < 1 < 1 0.19 T < 1 < 1 -- --
Data qualifiers are defined in laboratory reports. For data collected since 2001, a list of data qualifier definitions is includedat the front of this appendix.-- Not analyzed
LABORATORY PARAMETERS

EXHIBIT B-14WASATCH CHEMICAL SITEHISTORICAL DATA TRENDS
MONITORING WELL MW-30
Page 65 of 77
SampleDate
PCE(µg/l)
TCE(µg/l)
1,1-DCE(µg/l)
cis-1,2-DCE(µg/l)
trans-1,2-DCE(µg/l)
VC(µg/l)
2,4-D(µg/l)
PCP(µg/l)
10-Nov-11 < 1 0.59 T 5.8 64 1.6 14 -- < 0.5 21-Dec-11 < 1 0.7 T 9 75 1.9 25 -- < 0.5 8-Feb-12 < 1 0.66 T 7.3 71 1.5 15 -- < 0.5
30-Apr-12 < 1 0.65 T 7.6 75 1.7 20 -- < 0.5 28-Aug-12 < 1 0.77 T 4.3 31 0.96 T 5.9 -- < 0.5 13-Nov-12 < 1 1.1 4.8 30 1 5.5 -- < 0.5 25-Apr-13 < 1 0.63 T 5.6 30 0.93 T 6.5 -- < 0.5 7-Nov-13 < 1 0.8 T 4.1 23 0.77 T 5.1 -- --24-Apr-14 < 1 0.89 T 6 37 0.81 T 10 -- --6-Nov-14 < 1 1.1 4.2 37 1 7.3 -- --21-Apr-15 < 1 0.88 T 5.7 40 0.93 T 5.4 -- --5-Nov-15 < 1 1.6 4.8 70 1.2 22 -- --
Data qualifiers are defined in laboratory reports. For data collected since 2001, a list of data qualifier definitions is includedat the front of this appendix.-- Not analyzed
LABORATORY PARAMETERS

EXHIBIT B-14WASATCH CHEMICAL SITEHISTORICAL DATA TRENDS
MONITORING WELL MW-30
Page 66 of 77
y = 6E-09e0.0005x
R² = 0.6027
0
1
2
3
4
5
Jan-
11
Jul-1
1
Jan-
12
Jul-1
2
Jan-
13
Jul-1
3
Jan-
14
Jul-1
4
Jan-
15
Jul-1
5
Jan-
16
Jul-1
6
Con
cent
ratio
n (µ
g/l)
Date
MW-30Trichloroethene
(TCE)
Concentration Baseline 50% Reduction EnhancedBiodegredation
Best Fit Line
MCL = 5 µg/l
y = 249312e-3E-04x
R² = 0.2675
0
2
4
6
8
10
Jan-
11
Jul-1
1
Jan-
12
Jul-1
2
Jan-
13
Jul-1
3
Jan-
14
Jul-1
4
Jan-
15
Jul-1
5
Jan-
16
Jul-1
6
Con
cent
ratio
n (µ
g/l)
Date
MW-301,1-Dichloroethene
(1,1-DCE)
Concentration Baseline 50% Reduction EnhancedBiodegredation
Best Fit Line
MCL = 7 µg/l

EXHIBIT B-14WASATCH CHEMICAL SITEHISTORICAL DATA TRENDS
MONITORING WELL MW-30
Page 67 of 77
0
20
40
60
80
100
Jan-
11
Jul-1
1
Jan-
12
Jul-1
2
Jan-
13
Jul-1
3
Jan-
14
Jul-1
4
Jan-
15
Jul-1
5
Jan-
16
Jul-1
6
Con
cent
ratio
n (µ
g/l)
Date
MW-30cis-1,2-Dichloroethene
(cis-1,2-DCE)
Concentration Baseline 50% Reduction EnhancedBiodegredation
MCL = 70 µg/l
0
1
2
3
4
5
Jan-
11
Jul-1
1
Jan-
12
Jul-1
2
Jan-
13
Jul-1
3
Jan-
14
Jul-1
4
Jan-
15
Jul-1
5
Jan-
16
Jul-1
6
Con
cent
ratio
n (µ
g/l)
Date
MW-30trans-1,2-Dichloroethene
(trans-1,2-DCE)
Concentration Baseline 50% Reduction EnhancedBiodegredation
MCL = 100 µg/l
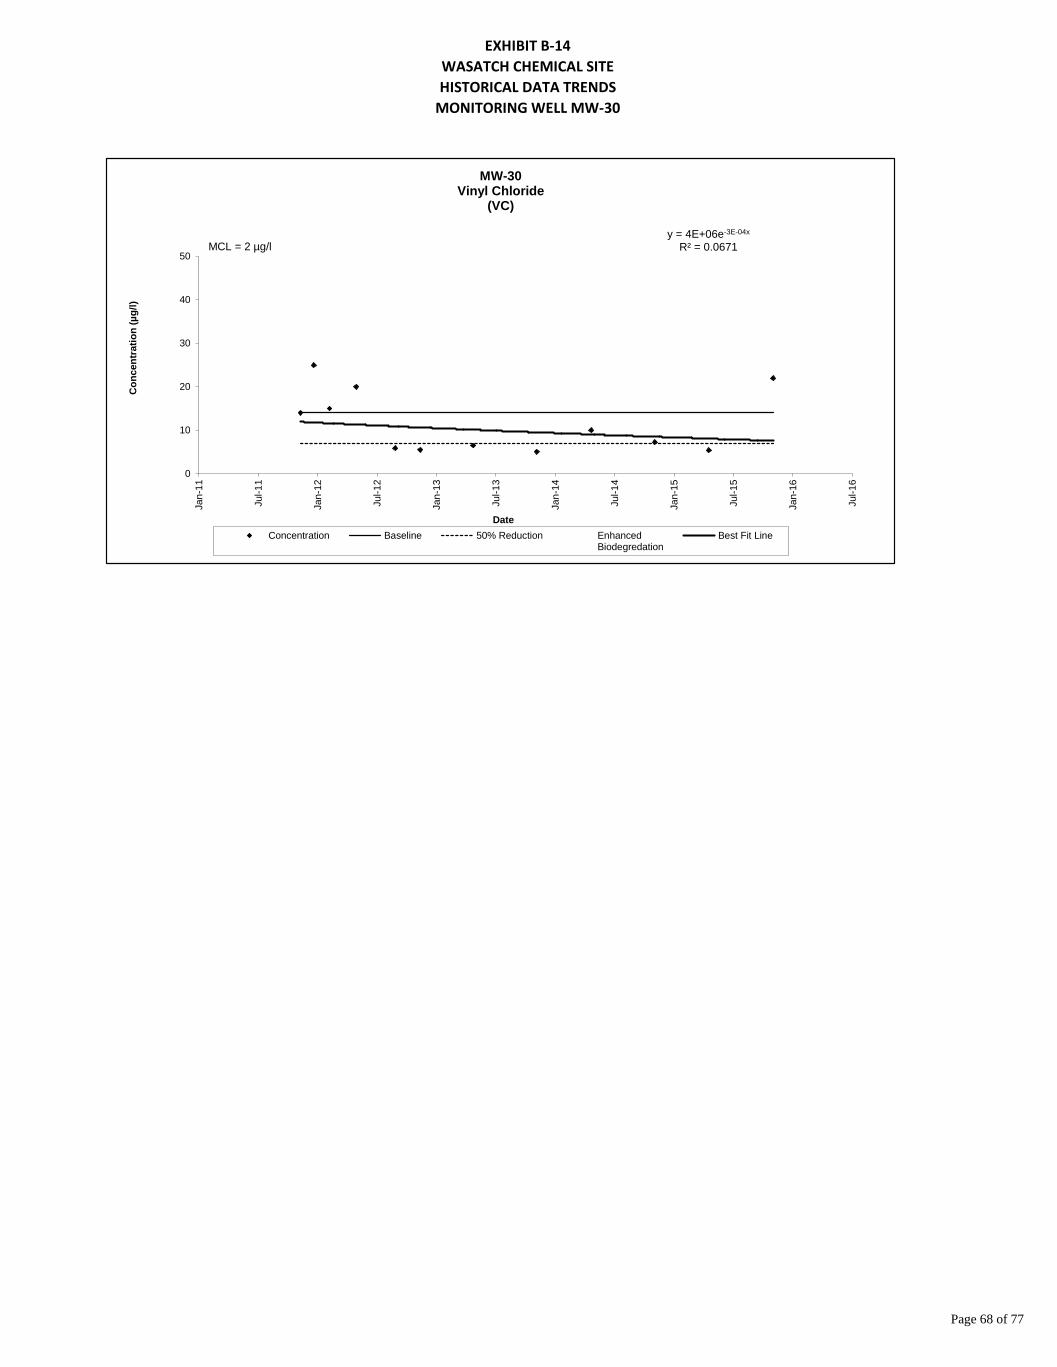
EXHIBIT B-14WASATCH CHEMICAL SITEHISTORICAL DATA TRENDS
MONITORING WELL MW-30
Page 68 of 77
y = 4E+06e-3E-04x
R² = 0.0671
0
10
20
30
40
50
Jan-
11
Jul-1
1
Jan-
12
Jul-1
2
Jan-
13
Jul-1
3
Jan-
14
Jul-1
4
Jan-
15
Jul-1
5
Jan-
16
Jul-1
6
Con
cent
ratio
n (µ
g/l)
Date
MW-30Vinyl Chloride
(VC)
Concentration Baseline 50% Reduction EnhancedBiodegredation
Best Fit Line
MCL = 2 µg/l

EXHIBIT B-15WASATCH CHEMICAL SITEHISTORICAL DATA TRENDS
MONITORING WELL MW-31D
Page 69 of 77
SampleDate
PCE(µg/l)
TCE(µg/l)
1,1-DCE(µg/l)
cis-1,2-DCE(µg/l)
trans-1,2-DCE(µg/l)
VC(µg/l)
2,4-D(µg/l)
PCP(µg/l)
20-Dec-11 < 1 < 1 < 1 < 1 < 1 < 1 -- < 0.5 7-Feb-12 < 1 < 1 < 1 < 1 < 1 < 1 -- < 0.5 3-May-12 < 1 < 1 < 1 < 1 < 1 < 1 -- < 0.5 29-Aug-12 < 1 < 1 < 1 < 1 < 1 < 1 -- < 0.5 14-Nov-12 < 1 < 1 < 1 < 1 < 1 < 1 -- < 0.5 25-Apr-13 < 1 < 1 < 1 < 1 < 1 < 1 -- < 0.5 7-Nov-13 < 1 < 1 < 1 < 1 < 1 < 1 -- --21-Apr-14 < 1 < 1 < 1 < 1 < 1 < 1 -- --6-Nov-14 < 1 < 1 < 1 < 1 < 1 < 1 -- --23-Apr-15 < 1 < 1 < 1 0.13 T < 1 < 1 -- --5-Nov-15 < 1 < 1 < 1 < 1 < 1 < 1 -- --
Data qualifiers are defined in laboratory reports. For data collected since 2001, a list of data qualifier definitions is includedat the front of this appendix.-- Not analyzed
LABORATORY PARAMETERS

EXHIBIT B-16WASATCH CHEMICAL SITEHISTORICAL DATA TRENDS
MONITORING WELL MW-32D
Page 70 of 77
SampleDate
PCE(µg/l)
TCE(µg/l)
1,1-DCE(µg/l)
cis-1,2-DCE(µg/l)
trans-1,2-DCE(µg/l)
VC(µg/l)
2,4-D(µg/l)
PCP(µg/l)
20-Dec-11 < 1 < 1 < 1 < 1 < 1 < 1 -- < 0.5 7-Feb-12 < 1 < 1 < 1 < 1 < 1 < 1 -- < 0.5 3-May-12 < 1 < 1 < 1 < 1 < 1 < 1 -- < 0.5 29-Aug-12 < 1 < 1 < 1 < 1 < 1 < 1 -- < 0.5 14-Nov-12 < 1 < 1 < 1 < 1 < 1 < 1 -- < 0.5 24-Apr-13 < 1 < 1 < 1 < 1 < 1 < 1 -- < 0.5 6-Nov-13 < 1 < 1 < 1 < 1 < 1 < 1 -- --23-Apr-14 < 1 < 1 < 1 < 1 < 1 < 1 -- --5-Nov-14 < 1 < 1 < 1 < 1 < 1 < 1 -- --21-Apr-15 < 1 UJ < 1 UJ < 1 UJ < 1 UJ < 1 UJ < 1 UJ -- --4-Nov-15 < 1 < 1 < 1 < 1 < 1 < 1 -- --
Data qualifiers are defined in laboratory reports. For data collected since 2001, a list of data qualifier definitions is includedat the front of this appendix.-- Not analyzed
LABORATORY PARAMETERS

EXHIBIT B-17WASATCH CHEMICAL SITEHISTORICAL DATA TRENDS
MONITORING WELL MW-33D
Page 71 of 77
SampleDate
PCE(µg/l)
TCE(µg/l)
1,1-DCE(µg/l)
cis-1,2-DCE(µg/l)
trans-1,2-DCE(µg/l)
VC(µg/l)
2,4-D(µg/l)
PCP(µg/l)
BZ(µg/l)
EBZ(µg/l)
m,p-Xylene(µg/l)
o-Xylene(µg/l)
BZME(µg/l)
12/28/2011 46 31 < 1 4.7 < 1 < 1 -- < 0.5 < 1 27 83 D 46 102/7/2012 19 48 0.3 T 140 D < 1 < 1 -- < 0.5 < 0.5 52 150 D 33 5.25/3/2012 4.4 2.9 0.26 T 110 D < 1 < 1 -- < 0.5 < 0.50 3.6 36 9.6 2.8
8/28/2012 5.2 1.5 < 1 17 < 1 8.9 -- < 0.5 < 0.5 < 1 7.5 12 0.7111/15/2012 6.2 1.8 < 1 15 < 1 2.1 -- < 0.5 < 0.5 10 33 13 2.84/24/2013 8.8 1.6 < 1 17 < 1 7.4 -- < 0.5 < 0.5 5.1 39 18 1.611/6/2013 0.7 T 0.29 T < 1 3.4 < 1 1.3 -- -- < 0.5 7 14 5.6 1.123-Apr-14 0.98 T 0.42 T < 1 3.1 < 1 1.2 -- -- < 0.5 12 15 7.7 0.47 T5-Nov-14 0.38 T 0.27 T < 1 3.3 < 1 0.67 T -- -- < 0.5 8.7 13 5.4 1.221-Apr-15 0.27 TJ 0.3 TJ < 1 UJ 1.5 J < 1 UJ 0.47 TJ -- -- < 0.5 UJ 6.3 J 7.7 J 5 J < 0.5 UJ4-Nov-15 < 1 0.16 T < 1 1.4 < 1 0.6 T -- -- < 0.5 5.1 7.2 3.1 0.64
Data qualifiers are defined in laboratory reports. For data collected since 2001, a list of data qualifier definitions is includedat the front of this appendix.-- Not analyzed
LABORATORY PARAMETERS

EXHIBIT B-17WASATCH CHEMICAL SITEHISTORICAL DATA TRENDS
MONITORING WELL MW-33D
Page 72 of 77
y = 3E+53e-0.003x
R² = 0.7522
0
20
40
60
80
100
Jan-
11
Jul-1
1
Jan-
12
Jul-1
2
Jan-
13
Jul-1
3
Jan-
14
Jul-1
4
Jan-
15
Jul-1
5
Jan-
16
Jul-1
6
Con
cent
ratio
n (µ
g/l)
Date
MW-33DTetrachloroethene
(PCE)
Concentration Baseline 50% Reduction EnhancedBiodegredation
Best Fit Line
MCL = 5 µg/l
y = 2E+61e-0.003x
R² = 0.7584
0
20
40
60
80
100
Jan-
11
Jul-1
1
Jan-
12
Jul-1
2
Jan-
13
Jul-1
3
Jan-
14
Jul-1
4
Jan-
15
Jul-1
5
Jan-
16
Jul-1
6
Con
cent
ratio
n (µ
g/l)
Date
MW-33DTrichloroethene
(TCE)
Concentration Baseline 50% Reduction EnhancedBiodegredation
Best Fit Line
MCL = 5 µg/l
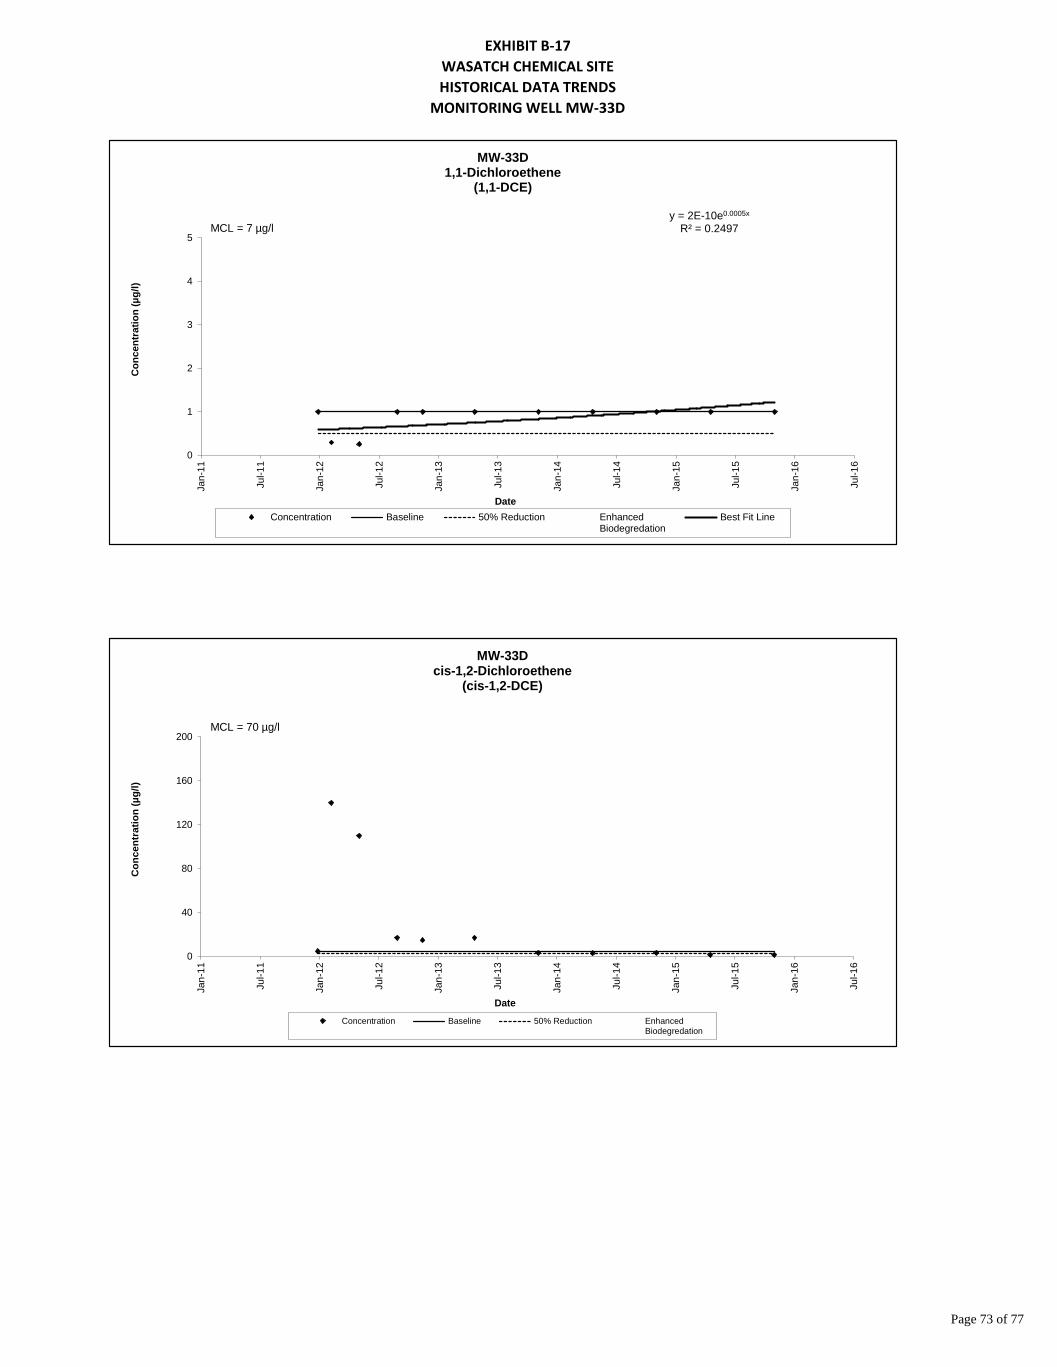
EXHIBIT B-17WASATCH CHEMICAL SITEHISTORICAL DATA TRENDS
MONITORING WELL MW-33D
Page 73 of 77
y = 2E-10e0.0005x
R² = 0.2497
0
1
2
3
4
5
Jan-
11
Jul-1
1
Jan-
12
Jul-1
2
Jan-
13
Jul-1
3
Jan-
14
Jul-1
4
Jan-
15
Jul-1
5
Jan-
16
Jul-1
6
Con
cent
ratio
n (µ
g/l)
Date
MW-33D1,1-Dichloroethene
(1,1-DCE)
Concentration Baseline 50% Reduction EnhancedBiodegredation
Best Fit Line
MCL = 7 µg/l
0
40
80
120
160
200
Jan-
11
Jul-1
1
Jan-
12
Jul-1
2
Jan-
13
Jul-1
3
Jan-
14
Jul-1
4
Jan-
15
Jul-1
5
Jan-
16
Jul-1
6
Con
cent
ratio
n (µ
g/l)
Date
MW-33Dcis-1,2-Dichloroethene
(cis-1,2-DCE)
Concentration Baseline 50% Reduction EnhancedBiodegredation
MCL = 70 µg/l

EXHIBIT B-17WASATCH CHEMICAL SITEHISTORICAL DATA TRENDS
MONITORING WELL MW-33D
Page 74 of 77
y = 2E+16e-9E-04x
R² = 0.2075
0
2
4
6
8
10
Jan-
11
Jul-1
1
Jan-
12
Jul-1
2
Jan-
13
Jul-1
3
Jan-
14
Jul-1
4
Jan-
15
Jul-1
5
Jan-
16
Jul-1
6
Con
cent
ratio
n (µ
g/l)
Date
MW-33DVinyl Chloride
(VC)
Concentration Baseline 50% Reduction EnhancedBiodegredation
Best Fit Line
MCL = 2 µg/l

EXHIBIT B-18WASATCH CHEMICAL SITEHISTORICAL DATA TRENDS
MONITORING WELL MW-34
Page 75 of 77
SampleDate
PCE(µg/l)
TCE(µg/l)
1,1-DCE(µg/l)
cis-1,2-DCE(µg/l)
trans-1,2-DCE(µg/l)
VC(µg/l)
2,4-D(µg/l)
PCP(µg/l)
13-Jun-13 < 1 0.24 T < 1 1.7 0.48 T < 1 -- < 0.5 28-Aug-13 < 1 0.31 T < 1 1.6 0.5 T < 1 UJ -- < 0.5 7-Nov-13 < 1 0.33 T < 1 2.2 0.58 T < 1 -- < 0.5 20-Feb-14 < 1 0.32 T < 1 3 0.69 T < 1 -- < 0.5 24-Apr-14 < 1 0.24 T < 1 1.6 0.46 T < 1 -- --6-Nov-14 < 1 0.3 T < 1 2 0.6 T < 1 -- --22-Apr-15 < 1 0.32 T < 1 2.8 0.61 T < 1 -- --5-Nov-15 < 1 0.31 T < 1 1.9 0.49 T < 1 -- --
Data qualifiers are defined in laboratory reports. For data collected since 2001, a list of data qualifier definitions is includedat the front of this appendix.-- Not analyzed
LABORATORY PARAMETERS

EXHIBIT B-19WASATCH CHEMICAL SITEHISTORICAL DATA TRENDS
PIEZOMETER PZ-1
Page 76 of 77
SampleDate
PCE(µg/l)
TCE(µg/l)
1,1-DCE(µg/l)
cis-1,2-DCE(µg/l)
trans-1,2-DCE(µg/l)
VC(µg/l)
2,4-D(µg/l)
PCP(µg/l)
13-Aug-03 < 1 < 1 < 1 -- -- < 1 -- --6-Nov-03 < 1 < 1 < 1 -- -- < 1 -- --
14-May-04 < 1 < 1 < 1 -- -- < 1 -- --4-Nov-04 < 1 < 1 < 1 -- -- < 1 -- --9-May-05 < 1 < 1 < 1 -- -- < 1 -- --2-Nov-05 < 1 < 1 < 1 -- -- < 1 -- --
15-May-06 < 1 < 1 < 1 -- -- < 1 -- --7-Nov-06 < 1 < 1 < 1 -- -- < 1 -- --11-Apr-07 < 1 < 1 < 1 -- -- < 1 -- --31-Oct-07 < 1 < 1 < 1 -- -- < 1 -- --29-Apr-08 < 1 < 1 < 1 -- -- < 1 -- --15-Oct-08 < 1 < 1 < 1 -- -- < 1 -- --8-Apr-09 < 1 < 1 < 1 < 1 < 1 < 1 -- --4-Nov-09 < 1 < 1 < 1 < 1 < 1 < 1 -- --28-Apr-10 < 1 < 1 < 1 < 1 < 1 < 1 -- --25-Oct-10 < 1 < 1 < 1 < 1 < 1 < 1 -- --13-Apr-11 < 1 < 1 < 1 < 1 < 1 < 1 -- --10-Nov-11 < 1 < 1 < 1 < 1 < 1 < 1 -- --2-May-12 < 1 < 1 < 1 < 1 < 1 < 1 -- --15-Nov-12 < 1 < 1 < 1 < 1 < 1 < 1 -- --24-Apr-13 < 1 < 1 < 1 < 1 < 1 < 1 -- --6-Nov-13 < 1 < 1 < 1 < 1 < 1 < 1 -- --23-Apr-14 < 1 < 1 < 1 < 1 < 1 < 1 -- --5-Nov-14 < 1 < 1 < 1 0.11 T < 1 < 1 -- --21-Apr-15 < 1 < 1 < 1 < 1 < 1 < 1 -- --4-Nov-15 < 1 < 1 < 1 < 1 < 1 < 1 -- --
Data qualifiers are defined in laboratory reports. For data collected since 2001, a list of data qualifier definitions is includedat the front of this appendix.-- Not analyzed
LABORATORY PARAMETERS
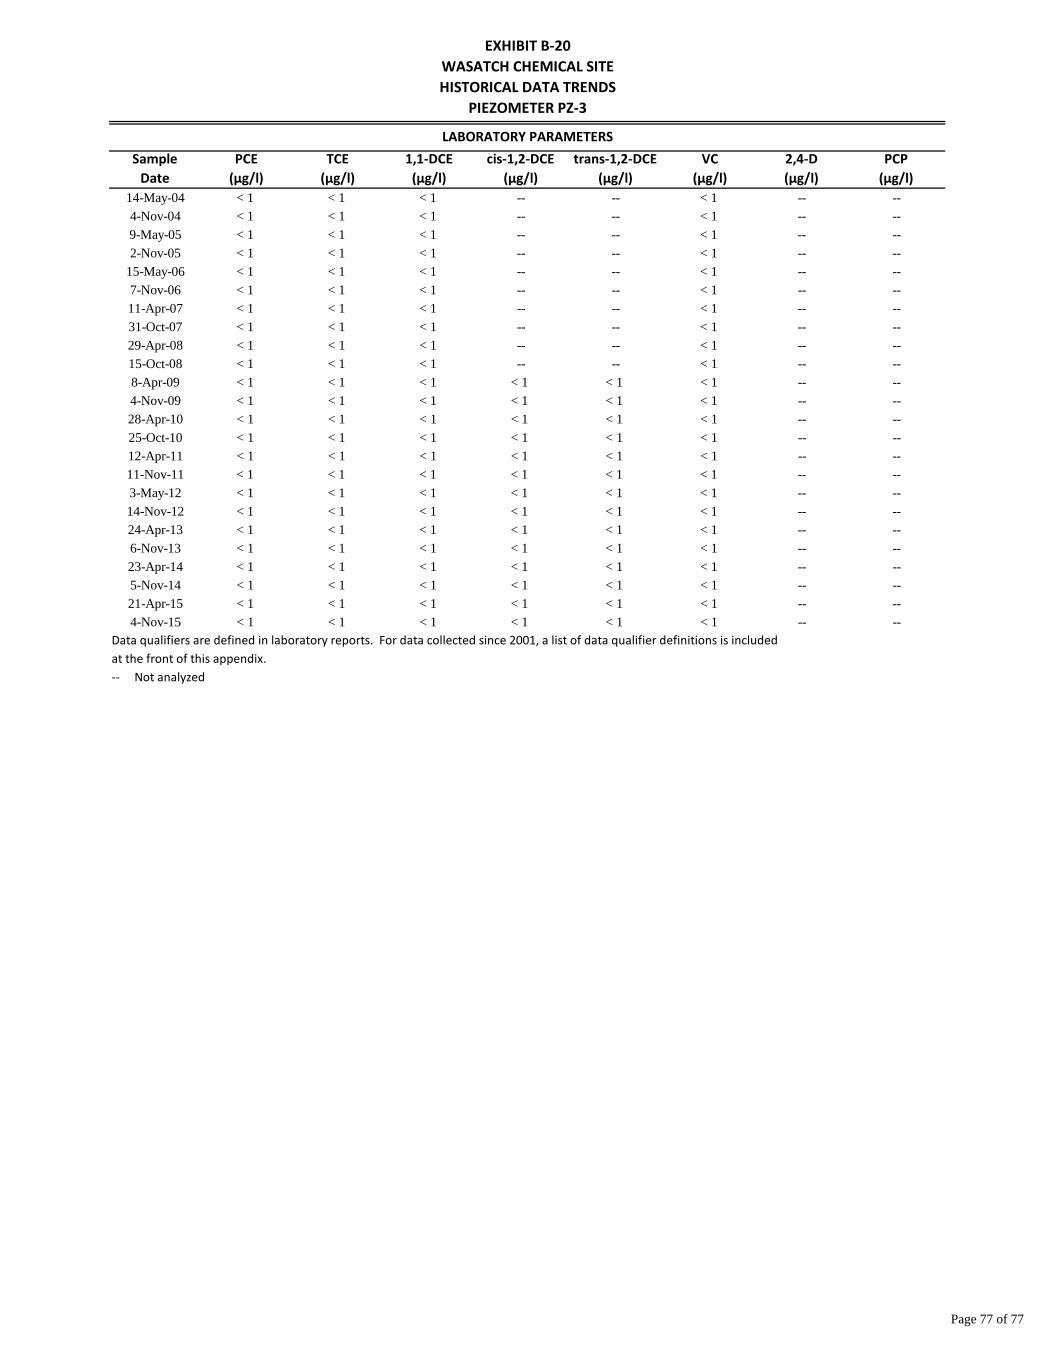
EXHIBIT B-20WASATCH CHEMICAL SITEHISTORICAL DATA TRENDS
PIEZOMETER PZ-3
Page 77 of 77
SampleDate
PCE(µg/l)
TCE(µg/l)
1,1-DCE(µg/l)
cis-1,2-DCE(µg/l)
trans-1,2-DCE(µg/l)
VC(µg/l)
2,4-D(µg/l)
PCP(µg/l)
14-May-04 < 1 < 1 < 1 -- -- < 1 -- --4-Nov-04 < 1 < 1 < 1 -- -- < 1 -- --9-May-05 < 1 < 1 < 1 -- -- < 1 -- --2-Nov-05 < 1 < 1 < 1 -- -- < 1 -- --
15-May-06 < 1 < 1 < 1 -- -- < 1 -- --7-Nov-06 < 1 < 1 < 1 -- -- < 1 -- --11-Apr-07 < 1 < 1 < 1 -- -- < 1 -- --31-Oct-07 < 1 < 1 < 1 -- -- < 1 -- --29-Apr-08 < 1 < 1 < 1 -- -- < 1 -- --15-Oct-08 < 1 < 1 < 1 -- -- < 1 -- --8-Apr-09 < 1 < 1 < 1 < 1 < 1 < 1 -- --4-Nov-09 < 1 < 1 < 1 < 1 < 1 < 1 -- --28-Apr-10 < 1 < 1 < 1 < 1 < 1 < 1 -- --25-Oct-10 < 1 < 1 < 1 < 1 < 1 < 1 -- --12-Apr-11 < 1 < 1 < 1 < 1 < 1 < 1 -- --11-Nov-11 < 1 < 1 < 1 < 1 < 1 < 1 -- --3-May-12 < 1 < 1 < 1 < 1 < 1 < 1 -- --14-Nov-12 < 1 < 1 < 1 < 1 < 1 < 1 -- --24-Apr-13 < 1 < 1 < 1 < 1 < 1 < 1 -- --6-Nov-13 < 1 < 1 < 1 < 1 < 1 < 1 -- --23-Apr-14 < 1 < 1 < 1 < 1 < 1 < 1 -- --5-Nov-14 < 1 < 1 < 1 < 1 < 1 < 1 -- --21-Apr-15 < 1 < 1 < 1 < 1 < 1 < 1 -- --4-Nov-15 < 1 < 1 < 1 < 1 < 1 < 1 -- --
Data qualifiers are defined in laboratory reports. For data collected since 2001, a list of data qualifier definitions is includedat the front of this appendix.-- Not analyzed
LABORATORY PARAMETERS