reluctant donors and their reactions to social information
TRANSCRIPT
Reluctant donors and their reactions to socialinformation
David Klinowski∗
University of [email protected]
July 24, 2015
Abstract
Recent work on charitable giving finds that some individuals donate when asked, but preferto avoid the request. I investigate how these reluctant donors respond to a solicitationthat informs them of how much others contribute. Participants of a laboratory experimentare invited to donate to a charity, and receive information about a previous donationeither before or after they indicate that they will give. Results show that the timing of theinformation affects behavior. For example, participants decline the invitation if they learnthat others give high amounts, but donate relatively large amounts if they receive the sameinformation only after opting in. Subjects identified as image-concerned from a separateelicitation display this behavior most markedly. I characterize the findings with a modelin which donors do not want to appear selfish and create excuses for declining to donate.Informing them of others’ donations affects their ability to create excuses for opting out.
JEL codes: C91, D64, D03, D82, J16.Keywords: reluctant giving, charitable giving, social information, signaling, motivated
reasoning.
∗I am indebted to Lise Vesterlund for her valuable supervision of this work. I also gratefully acknowledgefunding and support from the Science of Philanthropy Initiative. For helpful discussions I thank Maria Cubel,Jason Dana, Christine Exley, Sera Linardi, Evan Piermont, Luca Rigotti, Roee Teper, Stephanie Wang, MarkWilhelm, Alistair Wilson, and participants of the University of Pittsburgh Experimental Economics Workshop,the SABE 2014 Conference at Lake Tahoe, the SPI 2014 Conference at the University of Chicago, and the 11th.Annual Whitebox Graduate Student Conference at Yale University.
1

1. Introduction
People donate to charity for various and often subtle reasons. The standard economicsliterature identifies as motivations altruism (Becker, 1974) and pleasure from helping others(Andreoni 1989, 1990).1 But work in the past decade recognizes that a considerable fraction ofdonors give rather reluctantly, in an apparent effort to not seem selfish or not disappoint thesolicitor. These individuals donate when asked, but prefer not to have been asked, and thusavoid the solicitation if they can anticipate it (DellaVigna et al., 2012; Andreoni et al., 2012),retract their gifts if they can do so discreetly (Dana et al., 2006; Broberg et at., 2007; Lazearet al., 2012), or stop sharing when the request is framed in a way such that giving $0 is not themost selfish action (Bardsley, 2008; List, 2007).
In this study I investigate how reluctant donors respond to a solicitation for a donationthat informs them of how much others contribute. Since reluctant giving is frequent,2 andcharities often announce others’ contributions during fundraisers (for example by mentioningseed money or posting past donations in crowdfunding websites), it is important to understandhow reluctant donors react to this fundraising technique. Such understanding can also helpexplain what drives reluctant giving—a question economists are only beginning to answer.
I conduct a laboratory experiment in which participants can make a donation from theirearnings (approximately $15) to a charity. Participants first indicate whether they intend todonate, and only if they do, then indicate how much money to donate ($0 is explicitly allowed).Depending on the treatment, they are informed either that a subject in a previous sessiondonated 50¢ or $5 (relatively low and high amounts), and this information is provided eitherbefore or after participants indicate that they will give. In this way, I explore the effect of notonly the content of the information, but also its timing. That is, whether it matters that thesolicitee receives the information before deciding to participate or after expressing an intent togive. The distinction may seem unimportant until one recognizes that reluctant givers donateunless they can avoid the solicitation, and thus may react differently to the information if theycan easily opt out vs. if they feel obligated to give.
Timing affected behavior in the experiment. Mentioning a $5 donation before participantssaid they would give caused them to opt out, but providing the same information after theysaid they would give did not cause them to give $0, and actually raised the donation size.Mentioning a 50¢ donation caused participants to opt in, and not decrease the donation size.Thus, informing participants of a 50¢ donation sooner rather than later raised more funds thanany other treatment, or 111% more than never providing social information.
The treatment responses are consistent with individuals not wanting to appear selfish.They feel compelled to donate if others donate 50¢. They opt out if others give $5, butfind it unacceptable to give $0 if they learn this after opting in. To explore whether theseresponses are correlated with motivations to give reluctantly, I elicit a reluctance measure fromeach participant using a novel game inspired by Dana et al.’s (2006). After the solicitation,participants play a $10 dictator game with an anonymous subject in the room. Then, withoutprevious notice, they are given a chance to choose the probability with which they would rather
1Vesterlund (forthcoming) reviews motivations for charitable giving.2Approximately 50% of sharing observed in the settings so far explored (mostly the dictator game) can be
attributed to reluctant giving (Cain et al., 2014).
2

implement a different outcome: $9 for themselves and $0 for the other subject. The othersubject never learns the probability chosen. This game therefore identifies dictators who share$10 reluctantly, and quantifies the extent to which they are willing to switch discretely to $9-$0.
Results show that the dictators identified as reluctant drove the treatment responses.Choosing a higher probability of $9-$0 was associated with a higher likelihood of opting into thesolicitation when informed of a 50¢ donation, and of opting out when informed of a $5 donation.More than other participants, reluctant dictators became unwilling to give only 50¢ wheninformed of others’ donations. This supports the idea that participants reacted to the socialinformation for the same reason they shared reluctantly in the dictator game—presumably anattempt to not appear selfish.
An additional finding is that women responded more than men to the social information.Both genders agreed to donate at equal rates when shown no social information. Men did notvary their intent to donate when informed of a 50¢ or a $5 donation, but women opted insignificantly more when informed of a 50¢ donation, and significantly less when informed of a$5 donation. DellaVigna et al. (2013) find the related phenomenon of women being more likelythan men to avoid the solicitation (by checking a do-not-disturb box on a flyer). As I find,mentioning a $5 donation early induces women to opt out more than men, but mentioning a50¢ donation early reverses the gender gap. This makes social information a powerful tool. Asthe effect is almost entirely due to women changing their intent to give, this finding supportsDellaVigna et al.’s (2013) conclusion that women are more likely to be on the margin of giving.
Women also appeared more (self-)image concerned than men in the reluctance-measuregame. When dividing the $10, women were more likely to share evenly and less likely to share$0. This is in line with previous findings that men are more likely to be perfectly selfish andwomen more likely to prefer equality of payoffs (Andreoni and Vesterlund, 2001; Croson andGneezy, 2009; Niederle, forthcoming). However, women were also more likely to then move theodds in favor of getting $9-$0, to the extent that sharing became equal across genders once thisdiscrete exit is accounted for. This suggests that the gender difference in the amount sharedin the original dictator game is due to a higher (self-)image concern of women, rather thandue to differences in payoff-related preferences. Though more work is needed on this question,experiments on volunteerism (Linardi and Jones, 2014; Exley, 2014) find that women are moreaffected by social image concerns, thus it is possible that the difference in image concernsextends to private, anonymous contribution decisions such as those made in this study.
The last part of the paper offers a theory for why individuals give reluctantly and respondto social information. Agents in the model wish to keep their money as well as a good image ofthemselves. They create excuses for avoiding the solicitation, something in line with evidencefrom psychology and economics of humans interpreting their own actions self-servingly whendoing so can justify selfish behavior (Kunda, 1990; Snyder et al., 1979; Haisley and Weber, 2010;Linardi and McConnell, 2011; Exley, 2015). Providing agents with social information affectstheir ability to come up with valid excuses for not participating. For example, mentioning thatothers contribute “even a penny” invalidates excuses such as “I can’t afford to give” or “Smallamounts probably don’t help” (Cialdini and Schroeder, 1976).3
3Related theoretical models of self- or social-image concerns in giving contexts include Bodner and Prelec(2003), Ellingsen and Johannesson (2008), Andreoni and Bernheim (2009), DellaVigna et al. (2012), andGrossman (2015). The current model aims to contribute to the literature by deriving the phenomenon of
3

This paper draws on the literature on how social information impacts donors in general.Broadly, experimental work finds a positive relationship between others’ donations and one’sown (Frey and Meier, 2004; Martin and Randal, 2008; Shang and Croson, 2009). However, nostudy that I am aware of considers that the timing of the information can affect this relationship.By varying both content and timing, I show that this is true, and that the reason is likely tobe that individuals react to the information reluctantly out of image concerns.
Section 2 details the experiment design. Section 3 presents the results, and Section 4 thetheoretical model. Section 5 concludes by discussing practical implications and open questions.
2. Experiment design
The experiment was conducted at the Pittsburgh Experimental Economics Laboratory(PEEL) from April to September 2014. In total 308 undergraduate students recruited fromthe PEEL subject pool participated in 14 sessions, with no one participating in more than onesession. Each session had 16 to 30 participants and lasted approximately one hour. An equalnumber of men and women were recruited for each session.4 The experiment was programmedin z-Tree (Fischbacher, 2007).
The experiment consisted of four parts: (1) Participants earned money by solving efforttasks individually. (2) Everyone was solicited to donate part of their earnings to a charity. Thesolicitation was not mentioned until this point. (3) After the solicitation, participants played apreviously-unannounced game to elicit their reluctant measure. (4) A set of demographic andpersonality questionnaires was administered and earnings net of any donation were paid. Eachpart is detailed below.
2.1 Effort tasks
Participants solved two computerized effort tasks for money (Appendix A includes theinstructions and screenshots). The first task was a modification of Gill and Prowse’s (2012)slider task, in which participants had 90 seconds to slide seven scroll bars to their centerpositions. For doing this correctly they received $1.50, and $0 otherwise. In the second taskparticipants had to click on a button located at the center of the screen precisely when a timershown next to the button displayed the number ‘15.’ The timer counted the seconds elapsedsince the start of the second task; thus, participants had a one-second window, exactly fifteenseconds after the start of the task, to click on the button. For doing this correctly they received$1.50, and $0 for clicking at the incorrect time.
The two tasks appeared in succession five times, and thus participants could earn at most$15 from these tasks. Unbeknown to the participants, the tasks served no purpose in the studyother than to endow them with money that they worked for and hence felt entitled to keep.The tasks were not challenging, but required full attention to be completed successfully. As
reluctant giving, by examining the role of social information, and by providing psychological microfoundationsfor both based on the theory of motivated reasoning and excuse-driven behavior. Models of other channelsthrough which social information affects giving, such as altruism, prestige, and drawing inference about thecharity’s quality are given, respectively, by Varian (1994), Romano and Yildirim (2001), and Vesterlund (2003).
4Some individuals registered for a session but did not attend, thus sessions were not perfectly gender-balanced.Nevertheless, as Section 3 details, the gender composition did not vary statistically across treatments.
4

planned, the vast majority (83%) of participants earned the $15 (more details in Section 3).No additional show-up fee was paid.
2.2 Solicitation
The initial instructions did not mention any part to follow the effort tasks. However, afterfinishing the effort tasks but before receiving their earnings, participants were informed that theexperimenter had allowed the nonprofit organization Pittsburgh Cares5 to request donationsfrom all experiment participants, and that they could make a donation from their earnings.The solicitation occurred via the computer. Participants received information about PittsburghCares, a notification that donations would be matched 1:1 by the sponsor of the study,6 and adescription of how donations would be kept confidential.7
The solicitation consisted of two stages, shown in Figure 1. The stages appeared one ata time. In this paper they are called Invitation Stage and Payment Stage. If the participantindicated ‘No’ in the Invitation Stage, the solicitation ended immediately. If they indicated‘Yes,’ they moved to the Payment Stage. Depending on the treatment assigned to them,participants received information in one of the stages about how much another subject donatedin a previous session. The information consisted of the sentence at the bottom of Figure 1, andwas shown to the participants on the corresponding shaded area in Figure 1.
X was either 50¢ or $5, and the sentence was shown either at the Invitation Stage or thePayment Stage, in a 2-by-2 between-subjects design. If shown at the Payment Stage, theinformation was shown only if the participant advanced to that stage. The values 50¢ and$5 were determined by first conducting two sessions in which social information was neverprovided. The minimum non-zero donation made in these sessions was 50¢ and the maximumwas $5; thus the two values represented a relatively small and a relatively large donation.
Table 1 summarizes the design. The size of the donation participants were informed ofvaries across rows, and the timing of the provision of information varies across columns. Eachparticipant received only one treatment, and all participants in a given session received thesame treatment.
5Pittsburgh Cares is a Pittsburgh-local nonprofit organization that promotes volunteerism in the region byconnecting organizations that seek to enlist the help of volunteers with individuals who seek to volunteer theirtime. At the time of the study the Organization had been active for over 20 years, and held a database of morethan 20,000 potential volunteers and more than 500 opportunities for them to volunteer at. The Organizationdoes not focus on any particular population or issue, which makes it ideal for this study, as it lessens concernsthat donations are driven by unobserved characteristics of the participants.
6Donations were matched to encourage participants to contribute. Karlan and List (2007) find that matchingencourages donations, and that match ratios of 2:1 and 3:1 do not have additional impact relative to a 1:1 ratio.
7All participants received an envelope and a receipt form. Anyone who wished to get in the mail a donationreceipt from Pittsburgh Cares had to fill out the form with their name, their donation amount, and their mailingaddress, and had to place the receipt form in the envelope, seal the envelope, and leave it on their desk uponleaving the laboratory. The envelope was sent to Pittsburgh Cares. To prevent participants from identifyingwho donated and who did not based on their filling the envelope, all participants were instructed to place thereceipt form (even if left blank) in the envelope, seal the envelope, and leave it on their desks.
5

[Invitation Stage]
Would you like to make a donation from your experiment payment to Pittsburgh Cares?
No Yes
If yes, you will see a screen next where you can enter the amount you wish to donate(anywhere between $0.00 and [earnings]).
[Payment Stage]
You may donate anywhere between $0.00 and [earnings].
Please enter the amount you wish to donate, in dollars (enter cents as decimal places):
Treatment: For you information, a participant in a previous session donated [X] dollars.
Figure 1: Two-stage solicitation
2.3 Reluctance measure
To investigate an association between reluctant giving and the response to the socialinformation, participants played a game designed to elicit a reluctance measure after thesolicitation. They learned about the game only after the solicitation ended.
The game consisted of two parts. Participants were randomly and anonymously matched inpairs, and remained with the same partner throughout the game. In each part, each memberof the pair decided on an allocation of money between himself and his partner. One allocationfrom one member of the pair was randomly selected for payment at the end of the game.Participants received the instructions for the second part after finishing the first part (AppendixA includes the instructions).
For the first part, each participant privately selected how to split $10 among the pair. Thatis, participants played a dictator game in the role of dictator and recipient ex ante. They thenmoved to the second part without being informed of how the partner split the $10. At the endof the game, if the first part was selected for payment, the split dictated by the randomly-chosenmember of the pair was revealed to the partner and paid accordingly.
For the second part, each participant was randomly assigned one of two possible allocationsof money between himself and the partner: the $10 split he dictated in the first part, or $9for himself and $0 for the partner. Prior to the assignment, the participant had to indicatethe probability with which he wanted to be assigned the $9-$0 option. Only a probabilitybetween 10% and 90% was allowed, and the remaining probability to make 100% went to
6

Invitation Stage Payment Stage
X=50¢ 3 sessions 3 sessionsN = 64 N = 60
X=$5 3 sessions 3 sessionsN = 74 N = 66
No info 2 sessionsN = 44
Table 1: Treatments and sample sizes
the other option (the $10 dictator split). After the participant indicated the probability, theallocation was randomly assigned based on these weights, and revealed to the participant. Atthe end of the game, if the second part was selected for payment, the allocation assigned to therandomly-chosen member of the pair was revealed to the partner and paid accordingly. Theprobability indicated by the participant was never disclosed to the partner.
With each part’s allocation decided, an allocation from a member of the pair was randomlychosen for payment. Participants learned this outcome and the payment each member of thepair received. The money was added to previous earnings net of any donation made.
This game gives a measure from $0 to $10 of the participants’ willingness to share moneywith an anonymous person when prompted to, and a measure from 0.10 to 0.90 of the extentto which they would rather get $9 and leave the other with $0 discreetly. By constraining theprobability of the $9-$0 allocation to between 0.10 and 0.90, the partner is prevented frominferring what probability the participant indicated, even if $9-$0 is revealed for payment.There is always a chance that $9-$0 gets assigned to a participant regardless of the probabilityhe indicates. Participants who want to maximize their own payoff but share in the dictatorgame because of image concerns may have an incentive to move the odds in favor of $9-$0, sincethe outcome does not reveal their choice. In contrast, participants who share in the dictatorgame because they care about the recipient’s payoff should indicate a probability equal to 0.10.8
2.4 Questionnaires
To investigate a connection between personality characteristics and behavior in the exper-iment, after completing the reluctance measure elicitation participants filled out a Big Fivepersonality questionnaire (John et al., 1991; John et al., 2008), a Principle of Care question-naire (Wilhelm and Bekkers, 2010), and a demographics questionnaire. The last six sessionsconducted also asked participants whether they had ever heard of Pittsburgh Cares and hadever interacted with the Organization. Appendix B discusses the questionnaires in detail.
8This game was inspired by Dana et al’s (2006) experiment, in which participants play a $10 dictator gamewith dictators and recipients in separate rooms, and dictators choose whether to take $9 and leave the recipientwith $0 and unaware that a dictator game was to be played.
7

3. Experiment results
One hundred fifty-five women and 153 men participated in the experiment. The gendercomposition was similar across treatments (a χ2(4) fails to reject equality of gender compositionacross treatments with p = 0.656). The average age of the participants was 20.8 years, but themean age varied statistically across treatments (an ANOVA F-test rejects equality of mean ageacross treatments with p = 0.031).9 The analysis to come controls for age and gender.
Eighty-two percent of participants made no mistake in the effort tasks (i.e, earned $15) and98% of participants made one or no mistake (i.e., earned $13.5 or $15). Pre-solicitation earningswere therefore homogeneous across subjects, and had no significant impact on responses to thesolicitation. A quarter of the participants asked reported having heard of Pittsburgh Caresprior to the study, and 6% reported having interacted with the Organization before.
The data analysis is divided in three parts. The response to the social information duringthe solicitation is explored first, in terms of the extensive and intensive margins of giving. Thispart reveals that both the content and the timing of the information matter, and that thebehavior observed is consistent with reluctant giving. The second part supports the view ofreluctant giving by finding a within-subject correlation between the reluctance measure andthe response to the social information during the solicitation. The third part looks in detail atgender differences in behavior.
3.1 Response to the social information
3.1.1 Extensive margin
The overall fraction of participants who agreed to donate at the Invitation Stage was 0.37.The fraction varied significantly depending on the information received. Figure 2 shows thefraction of participants who indicated that they would donate at the Invitation Stage, giventhe information received in this stage. Relative to when no information was given, informingof a previous donation of 50¢ raised intent to donate by 61%, and informing of a $5 donationdepressed intent to donate by 40%.
Intent to donate does not necessarily imply a positive donation, because participants couldhave indicated that they would give at the Invitation Stage and then donate $0 at the PaymentStage. But this happened very rarely—once in the No-info treatment and twice in the $5-at-Invitation. Therefore, intent to donate reflects almost perfectly the donation rate, and one mayspeak practically interchangeably of intent and actual donation in these data. This can be seenfrom Panel A of Table 2, which shows similar treatment effects on the intent to donate and onthe share of participants who donated a positive amount.10
9The differences are driven by a few older outliers in the No-info and $5-at-Invitation treatments. Neverthelessthe age of the vast majority of participants was similar across treatments, as between 88% to 96% of theparticipants in any treatment were 18 to 22 years old.
10As expected given the lack of $0 donations, donation rates are statistically similar across the treatmentsthat provided no information at the Invitation Stage. A χ2(2) test fails to reject equality of donation ratesacross the treatments No-info, 50¢-at-Payment, and $5-at-Payment with p = 0.404. When the $5-at-Invitationtreatment is also included, a χ2(3) test rejects equality of donation rates across treatments with p = 0.037,and when all treatments are considered, a χ2(4) rejects the equality of donation rates across treatments withp < 0.001.
8

0
0.22
0.36
0.58
0.75
Share
accepte
d to d
onate
at In
vitation S
tage
50¢ No info $5
Figure 2: Intent to donate by information received at Invitation StageNotes: This figure shows the fraction of participants who accepted to donate at the Invitation Stage, given theinformation received at this stage. Estimates based on a probit regression of the binary decision to accept todonate at the Invitation Stage, regressed on the information received at the Invitation Stage (results do notvary significantly when controlling for age and gender). Observations from treatments 50¢-at-Payment, $5-at-Payment, and No-info are combined and labeled ‘No info’, since these treatments did not provide informationabout a previous donation at the Invitation Stage. Error bars indicate 90% confidence intervals.
No participant decided to donate $0 upon learning in the Payment Stage that someonedonated $5. On the other hand, participants declined to donate when they learned thesame information in the Invitation Stage. Possible explanations will be discussed once theinformation’s effect on the intensive margin of giving is presented. For now, it must be notedthat the evidence for this finding in isolation is not overwhelming, as the donation rate in the$5-at-Payment treatment (0.303) and the intent to donate in the $5-at-Invitation treatment(0.216) are not statistically different from each other at standard levels (p = 0.164 for a one-sidedFisher’s exact test of equality of these proportions).
3.1.2 Intensive margin
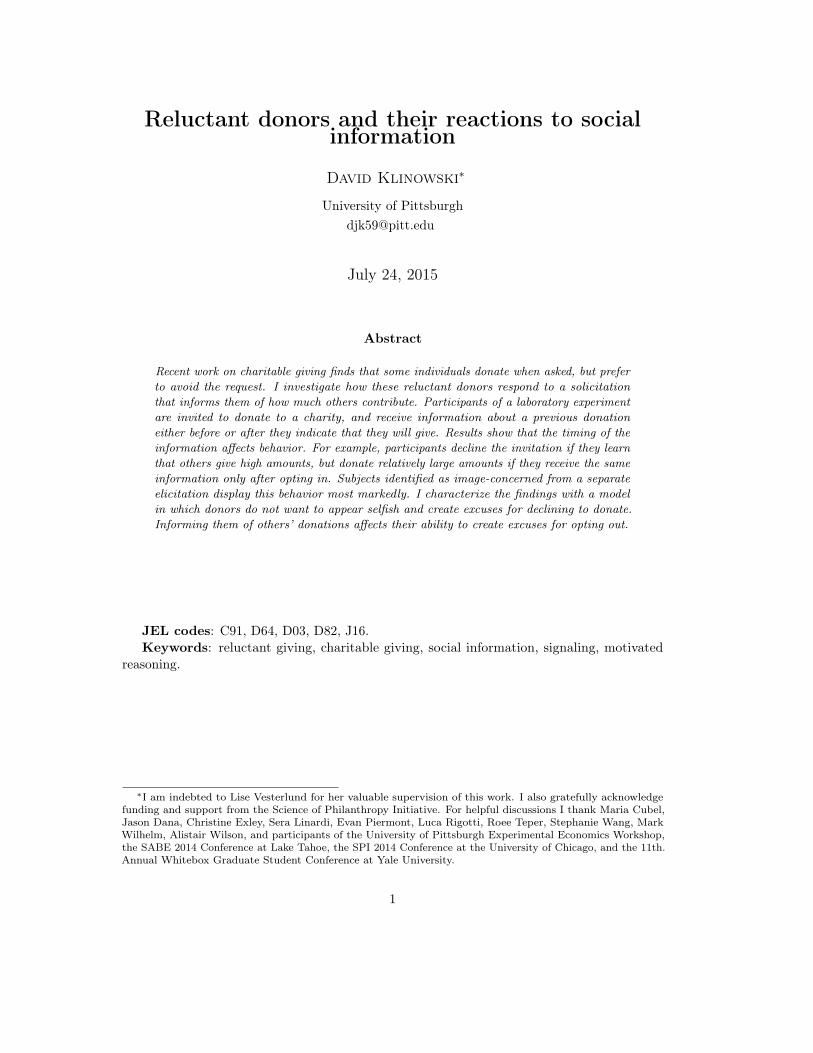
All donations observed were multiples of 50¢. Figure 3 shows for each treatment thedistribution of donations among subjects who made a contribution, with amounts larger than $1collapsed together for clearer exposition (see the Appendix B for uncollapsed distributions).11
The social information affected the intensive margin of giving. In the No-info treatment,73% of the mass of donations concentrated on amounts of 50¢ and $1, and 27% of the masson amounts greater than that. This distribution shifted up for all information treatments,especially for treatments informing of a $5 donation, as seen in Figure 3. For instance, in the$5-at-Invitation treatment, no one donated 50¢, and 79% of those who donated gave more than$1. And in the $5-at-Payment treatment, 50¢ donations were less frequent and the mediandonation went up significantly relative to the No-info treatment. Panel B of Table 2 shows
11The 50¢/$1/+$1 division was selected so that each bin contains roughly a third of the observations in theNo-info treatment.
9
0
0.25
0.50
0.75
1
Fra
ctio
n o
f p
art
icip
an
ts
50¢ $1 >$1 Donation size
No−info
0
0.25
0.50
0.75
1
Fra
ctio
n o
f p
art
icip
an
ts
50¢ $1 >$1 Donation size
50¢−at−Invitation
0
0.25
0.50
0.75
1
Fra
ctio
n o
f p
art
icip
an
ts
50¢ $1 >$1 Donation size
50¢−at−Payment
0
0.25
0.50
0.75
1
Fra
ctio
n o
f p
art
icip
an
ts
50¢ $1 >$1 Donation size
$5−at−Invitation
0
0.25
0.50
0.75
1
Fra
ctio
n o
f p
art
icip
an
ts
50¢ $1 >$1 Donation size
$5−at−Payment
Figure 3: Distribution of donation sizes conditional on donating, by treatmentNotes: This figure shows the fraction of participants who donated 50¢, $1, and more than $1 among all theparticipants who donated a positive amount in the treatment. Dashed lines mark the fraction of participantswho donated a positive amount in the treatment.
that the mean and median donation size conditional on donating increased for all informationtreatments relative to the No-info treatment, though significantly so only for the $5 treatments.
Panel B of Table 2 also shows treatment effects on the mean and median funds raisedincluding all treatment participants (unconditional amount columns). Informing participants atthe Invitation Stage of a 50¢ donation raised more funds than any other treatment. It raised onaverage $0.98 per participant, or 111% more than when no information was provided. This isbecause participants in the 50¢-at-Invitation treatment increased their intent to donate and didnot decrease their contribution size. On the other hand, the same information, when providedat the Payment Stage, did not yield as large an impact, because it did not reap the benefits ofincreasing intent to donate. Hence the timing of the information mattered.
When providing information at the Invitation Stage, informing of a 50¢ donation raisedmore funds than informing of a $5 donation. Yet the opposite conclusion might have beenreached if the experiment design was such that participants received information only afterindicating an intent to donate,12 since the conditional donation size is greater for $5-at-Paymentthan 50¢-at-Invitation. Therefore, again, the timing of the information mattered.
12As in Shang and Croson (2009), who find that informing solicitees of a higher donation leads to higherdonations. Their sample comprises individuals who call to a radio station in response to a fundraising campaign,and thus all participants express an intent to donate before being treated. It is telling that in their sample noparticipant declined to donate.
10

Table 2: Treatment effects on the extensive and intensive margin of giving
Panel A: Extensive marginIntent to donate Donation rate
(1) (2) (1) (2)
50¢-at-Invitation 0.214** 0.204** 0.237** 0.229**(0.095) (0.097) (0.094) (0.096)
50¢-at-Payment 0.053 0.047 0.076 0.071(0.096) (0.097) (0.097) (0.096)
$5-at-Invitation -0.147* -0.151* -0.152* -0.154*(0.087) (0.088) (0.085) (0.085)
$5-at-Payment -0.061 -0.067 -0.038 -0.043(0.092) (0.093) (0.091) (0.092)
constant (No-info mean) 0.363*** 0.369*** 0.341*** 0.345***(0.075) (0.073) (0.071) (0.072)
Age-gender controls No Yes No YesSample size 308 308 308 308
Panel B: Intensive marginConditional amount Unconditional amount
(1) (2) MWU (1) (2) MWU
50¢-at-Invitation 0.336 0.327 1.024 0.518** 0.508** 2.592***(0.436) (0.440) (0.306) (0.238) (0.242) (0.009)
50¢-at-Payment 0.193 0.225 1.273 0.184 0.177 1.082(0.465) (0.472) (0.203) (0.241) (0.243) (0.279)
$5-at-Invitation 1.312** 1.398** 2.835*** 0.041 0.036 -1.352(0.529) (0.555) (0.005) (0.231) (0.232) (0.176)
$5-at-Payment 0.533 0.538 1.901* 0.110 0.102 -0.004(0.486) (0.490) (0.057) (0.236) (0.239) (0.997)
constant (No-info mean) 1.367*** 1.351*** - 0.466** 0.472** -(0.367) (0.372) (0.183) (0.185)
Age-gender controls No Yes No No Yes NoSample size 111 111 - 308 308 -
Notes: Panel A shows marginal treatment effects from probit regressions where the dependent variables are abinary indicator for acceptance to donate at the Invitation Stage (Intent to donate) and a binary indicator fora positive donation (Donation rate). Panel B shows marginal treatment effects from OLS regressions wherethe dependent variables are the size of the donation conditional on making a donation (Conditional amount)and the size of the donation among all participants in the treatment (Unconditional amount). For both panels,model (1) includes treatments as the only regressors, and model (2) adds age and gender controls. Panel B alsoshows the Mann-Whitney U test statistic (MWU) that the median donation in the corresponding treatmentis equal to the median donation in the No-info treatment. Standard errors in parentheses except for MWUcolumns, which show two-sided p values. *p < 0.1; **p < 0.05; ***p < 0.01.
11

3.1.3 Possible explanations
Participants seem to have responded to the social information in an effort to not appearselfish, and seem to have found it more acceptable to decline to donate at the InvitationStage than at the Payment Stage. An estimated 40% of participants declined to donate wheninformed of a $5 donation at the Invitation Stage, but would have donated relatively highamounts had the same information been provided at the Payment Stage. This is consistentwith reluctant giving: if the social information arrives after agreeing to donate, the participantdonates enough to not appear selfish, yet he would have preferred to receive the informationearlier to have declined the invitation.
The reactions to the 50¢ treatments are also consistent with giving reluctantly. Participantsmay have felt compelled to donate as others were willing to give 50¢, therefore informingparticipants of such a donation at the Invitation Stage raised intent to donate. At the sametime, participants may have felt that donating only 50¢ would still reflect badly on theirgenerosity, and thus donated 50¢ less often than in the No-info treatment (see Figure 3).13
It is difficult to reconcile these findings with other motivations for giving. Altruism assumesthat participants care about the aggregate donation to the charity, and thus predicts thatparticipants give more when informed of a 50¢ donation than when informed of a $5 donation.This matches the observed treatment effects on the extensive margin, but not those on theintensive margin. It is hard to see why altruistic participants declined to donate when informedof a $5 donation at the Invitation Stage, but donated significantly more than any other treatmentwhen given the same information at the Payment Stage. It is equally difficult to reconcile thefindings with the idea that participants inferred the worthiness of Pittsburgh Cares from thesocial information received. If participants deduced that the charity was meritorious whenothers gave higher amounts, then it makes sense that they gave higher amounts when informedof a $5 donation at the Payment Stage, but not that they declined to donate when the sameinformation was provided at the Invitation Stage. Neither do participants seem to have beenseeking to conform to social norms. If they donated more to follow what others did wheninformed of a $5 donation at the Payment Stage, then why did they decline to donate uponreceiving the same information at the Invitation Stage?
It seems that participants reacted to the social information reluctantly, motivated to notappear selfish. To explore this possibility further, the next part of the analysis investigateswhether the reluctance measure elicited from participants helps to explain their behavior in thesolicitation.
3.2 Correlation with the reluctance measure
The reluctance measure was elicited by having participants first decide how to split $10 ina dictator game, and then quietly indicate their preferred probability (between 0.10 and 0.90)of getting $9 and leaving the partner with $0 instead of implementing their dictator-game split.Figure 4 shows how many participants shared a given amount in the dictator game and howmany selected a given probability of obtaining the $9-$0 outcome.
13This is consistent with Cialdini and Schroeder (1976), who find that by mentioning that “even a pennyhelps,” the solicitor makes it difficult for the solicitee to decline to help and at the same time makes it unlikelythat he contributes a small amount.
12

22 (7%)
66 (21%)
164 (53%)
Num
ber
of part
icip
ants
0 1 2 3 4 5 6 10
Dollars shared in the $10 dictator game
Pr = 0.1 0.1 < Pr < 0.9 Pr = 0.9
Figure 4: Histogram of dictator transfer and probability of getting $9-$0
In the dictator game, 47% of the participants shared more than $0. The mean transfer was$1.80. The distribution of transfers matches standard behavior in the dictator game (Camerer2003) although the few overly generous transfers (three of $6 and one of $10) are atypical. Thedistribution did not vary significantly by treatment (when regressing the amount shared on thetreatments alone, an F-test fails to reject the hypothesis that all the regression coefficients areequal to zero with p = 0.357).
When offered then the chance to discreetly get $9-$0, most apparently generous dictatorswere moved the odds in favor of $9-$0: 79% of participants who shared $2 or more selecteda probability greater than 0.10 (21% selected a probability equal to 0.50 and 26% selected aprobability equal to 0.90). In contrast, the most selfish dictators tended to adhere to their split:87% of participants who shared $0 or $1 selected a probability equal to 0.10.
In total 41% of participants selected a probability larger than 0.10. Their behavior isconsistent with the idea that giving in the dictator game does not necessarily reflect generosity,but rather that participants shared reluctantly because they did not wish to appear ungenerouswhen asked to split $10, though they preferred not to have been asked to share the money tobegin with. The degree to which they preferred to keep the money discreetly was presumablycaptured by their indicated probability of obtaining $9-$0.
To investigate whether this behavior correlates with the response to the social informationobserved earlier, I classify participants into three types based on the reluctance measure, andlook for systematically different treatment effects across types. Types are constructed as follows:
• Selfish: participants who shared $0 or $1 in the dictator game and subsequently indicateda probability equal to 0.10.
• Reluctant (i.e., image concerned): participants who, independently of the amount sharedin the dictator game, indicated a probability greater than 0.10.14
14Individuals who shared $0 in the dictator game and then selected a probability greater than 0.10 are
13

• Generous: participants who shared $2 or more in the dictator game and subsequentlyindicated a probability equal to 0.10.
The proportion of types in the sample is 50% Selfish, 41% Reluctant, and 9% Generous. Theproportion did not vary significantly across treatments (a Fisher’s exact test fails to rejectequality of proportions across treatments with p = 0.15, and with p = 0.13 when the Generoustype is excluded from the sample). In particular, the results to come find no evidence of moralcompensation in either direction between the solicitation and the reluctance measure.15 Itis important to note that the low frequency of the Generous type in the sample presents alimitation to the analysis to come, and some tests are underpowered or infeasible for this group.
Panel A of Table 3 shows the marginal effects of the information on the intent to donateconditional on the participant’s type. When no information was provided at the InvitationStage, Generous participants were most likely to accept to donate, followed by the Reluctant,and lastly the Selfish (a χ2(2) joint test of model (1)’s estimates for the no-information conditionrejects equality of intent to donate across types with p = 0.0012). This natural progression is afirst indication that types responded differently to the solicitation.
Panel A of Table 3 also shows that, relative to receiving no information at the InvitationStage, all types raised their intent to donate when informed of a 50¢ donation, and decreased itwhen informed of a $5 donation (though only significantly so for the Reluctant type on the50¢ condition). However, within the Reluctant category, the magnitude of the effect variedaccording to the participant’s indicated probability of getting $9-$0, something not capturedby Table 3’s estimates. Figure 5 shows this variation by plotting the effect of the informationon the intent to donate for Reluctant participants conditional on their selected probability ofgetting $9-$0.
On average participants who selected a higher probability changed their intent to donatemore in response to the social information, in the direction consistent with reluctant giving.They were increasingly less likely to accept to donate when informed of a $5 donation, andincreasingly more likely to accept to donate when informed of a 50¢ donation. This within-person correlation between intent to donate and the reluctance measure presents additional,correlational evidence that a tendency to reluctant giving was responsible for the participants’reactions to the social information during the solicitation.
Panel B of Table 3 shows marginal treatment effects on the intensive margin of givingconditional on the participant’s type. OLS columns show estimates of the change in the meandonation size conditional on giving, and quantile regression columns show similar estimates forthe three quartiles rather than the mean (quartile estimates could not be computed for theGenerous type due to lack of observations). Since donations were not normally distributed,looking at treatment effects on different points of the distribution provides a fuller picture than
included in this category. They were willing to pay $1 to make it unclear that they selected the most selfish splitin the dictator game, and thus appear to be image concerned. Twenty-two participants indicated a probabilitygreater than 0.10 after sharing $0, and 1 individual indicated a probability greater than 0.10 after sharing $1.Results are largely insensitive to excluding these individuals from the sample; the sensitivity of the results isreported when appropriate.
15That is, no evidence of ‘moral licensing’ (Zhong et al., 2006; Merrit et al., 2010) whereby participantsfelt entitled to act selfishly in the reluctance measure elicitation because they donated to the Organization,or ‘moral cleansing’ (Sachdeva et al., 2009) whereby participants acted generously in the elicitation to redeemthemselves after not donating to the Organization.
14

0
0.50
1
Share
accepte
d to d
onate
at In
vitation S
tage
0.11 0.20 0.30 0.40 0.50 0.60 0.70 0.80 0.90Chosen probability of $9−$0
50¢ No info $5
Figure 5: Intent to donate for Reluctant participants conditional on their selected probability for $9-$0Notes: This figure shows the estimated fraction of participants who accepted to donate at the Invitation Stage,given the information received at this stage, and conditional on their selected probability of getting $9-$0.Sample limited to Reluctant participants. The x-axis starts at 0.11 since by definition Reluctant participantsindicated a probability of $9-$0 greater than 0.10. Estimates based on a probit regression of a binary indicator foracceptance to donate at the Invitation Stage regressed on the information received at this stage, the probabilityof getting $9-$0, and their interaction (estimates do not vary significantly when controlling for age and gender orwhen excluding from the sample Reluctant participants who shared $0 or $1 in the dictator game). Observationsfrom treatments 50¢-at-Payment, $5-at-Payment, and No-info are combined and labeled ‘No info’, since thesetreatments did not provide information about a previous donation at the Invitation Stage. Error bars indicate90% confidence intervals, omitted for the ‘No info’ condition for improved visibility.
OLS estimates alone.Reluctant participants changed their donation size most significantly in response to the
information, especially at the lower tail of the distribution. Without receiving information,75% of the Reluctant participants who made a donation donated at least 50¢. Upon receivinginformation, these participants became unwilling to donate such a small amount, as 75% ofReluctant donors donated at least $1 or $1.50 in any given information treatment. The mediandonation also went up significantly relative to No-info for two treatments (50¢-at-Payment and$5-at-Invitation). Selfish participants, in contrast, were largely insensitive to the information,and gave significantly more relative to No-info only for the $5-at-Invitation treatment.
The within-person correlation between the reluctance measure and behavior on the so-licitation supports the idea that participants reacted reluctantly to the social information.Participants classified as Reluctant were most responsive to the social information, and theirextensive- and intensive-margin-of-giving reactions corresponded to reluctant giving. Theydeclined to donate at the Invitation Stage if others donated $5, but could not easily decline ifothers donated 50¢. Informing them of any amount also pushed their donation size above 50¢.
If participants were motivated to not appear selfish, it remains unclear whom they weretrying to impress—themselves or an imagined audience. It is also unclear why they found itacceptable to decline to donate at the Invitation Stage when informed of a $5 donation orto retract their dictator transfer when offered the chance to get $9-$0, given that these were
15
0
0.25
0.50
0.75
1S
hare
accepte
d to d
onate
at In
vitation S
tage
50¢ No info $5Men
0
0.25
0.50
0.75
1
Share
accepte
d to d
onate
at In
vitation S
tage
50¢ No info $5Women
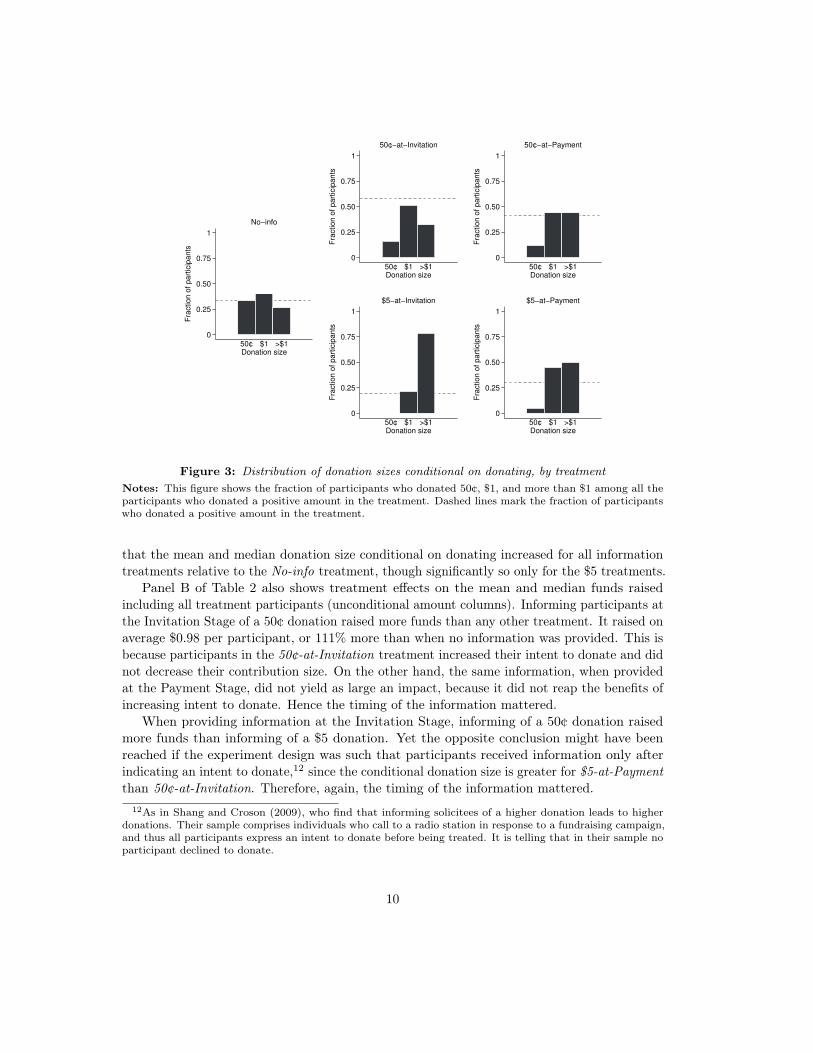
Figure 6: Intent to donate by information received at Invitation Stage conditional on genderNotes: This figure shows the fraction of participants who accepted to donate at the Invitation Stage, giventhe information received at this stage and the participant’s gender. Estimates based on a probit regression ofthe binary decision to accept to donate at the Invitation Stage, regressed on the information received at theInvitation Stage, the participant’s gender, and their interaction (results are insensitive to controlling for age).Observations from treatments 50¢-at-Payment, $5-at-Payment, and No-info are combined and labeled ‘No info’,since these treatments did not provide information about a previous donation at the Invitation Stage. Errorbars indicate 90% confidence intervals.
deliberate selfish actions. These are questions the current experiment is unable to investigate.Section 4 proposes a mechanism based on self-serving rationalization. Before that, the nextpart of the analysis explores in detail gender differences in behavior in the experiment.
3.3 Gender differences
3.3.1 In the response to the social information
Men and women differed significantly in both their responses to the social informationduring the solicitation and the reluctance measure. On the former, Figure 6 and Panel A ofTable 4 show the intent to donate for each gender separately. Men and women accepted todonate at equal rates (0.35 for men and 0.37 for women) when no information was provided atthe Invitation Stage. Men were largely insensitive to the information at this stage; their intentto donate did not change significantly when informed of a donation of 50¢ or $5. Women’sreactions, on the other hand, were large and significant; their intent to donate went up to0.66 when informed of a 50¢ donation and down to 0.09 when informed of a $5 donation.The findings remain after controlling for age. While this gender difference is in line witheconomics experiments that find women to be more sensitive than men to the social context ofthe experiment,16 social susceptibility by itself does not explain the specific directions in whichwomen responded to being informed of a 50¢ or a $5 donation.
In terms of the intensive margin, women were also more responsive than men to theinformation. Panel B of Table 4 shows marginal treatment effects on the intensive margin ofgiving conditional on the participant’s gender. Men donors did not give significantly different
16See the review by Croson and Gneezy (2009).
16

Tab
le3:
Treatmenteff
ects
ontheextensivean
dintensivemarginof
giving
cond
itiona
lon
type
Pan
elA
:Ext
ensi
vem
argi
n(i
nten
tto
dona
te)
Selfish
Reluctant
Generou
s
(1)
(2)
(3)
(1)
(2)
(3)
(1)
(2)
(3)
50¢
0.140
0.133
0.140
0.208**
0.203*
0.173
0.185
0.179
0.185
(0.109)
(0.109)
(0.109)
(0.104)
(0.104)
(0.119)
(0.185)
(0.189)
(0.185)
$5-0.080
-0.081
-0.080
-0.138
-0.133
-0.161
-0.365
-0.356
-0.365
(0.071)
(0.070)
(0.071)
(0.110)
(0.112)
(0.119)
(0.255)
(0.259)
(0.255)
constant
0.235***
0.234***
0.235***
0.458***
0.463***
0.508***
0.615***
0.611***
0.615***
(0.046)
(0.046)
(0.046)
(0.059)
(0.059)
(0.065)
(0.135)
(0.136)
(0.135)
Age-gendercontrols
No
Yes
No
No
Yes
No
No
Yes
No
Samplesize
308
308
285
308
308
285
308
308
285
Pan
elB:In
tens
ive
mar
gin
(don
atio
nsi
zeco
nditio
nalon
mak
ing
ado
nation
)Selfish
Reluctant
Generou
s
Qua
ntile
regression
Qua
ntile
regression
Qua
ntile
regression
OLS
25th
50th
75th
OLS
25th
50th
75th
OLS
25th
50th
75th
50¢-at-Inv
itation
1.22
00
3.00*
0.19
0.50*
00
-0.44
--
-(0.812)
(0.388)
(0.606)
(1.529)
(0.565)
(0.270)
(0.422)
(1.065)
(0.914)
50¢-at-Pay
ment
0.33
00
00.83
0.50*
1.00**
1.00
-1.67
--
-(0.812)
(0.388)
(0.606)
(1.529)
(0.607)
(0.290)
(0.453)
(1.143)
(1.103)
$5-at-Invitation
2.80***
2.00***
2.00***
2.00
1.25*
1.00
***
1.00**
1.00
-2.00
--
-(0.906)
(0.433)
(0.676)
(1.707)
(0.675)
(0.323)
(0.504)
(1.272)
(1.560
)$5-at-Pay
ment
0.75
01.00
1.50
1.19*
0.50*
0.50
2.00*
-2.00
--
-(0.872)
(0.417)
(0.651)
(1.643)
(0.616)
(0.295)
(0.460)
(1.161)
(1.233
)constant
1.00
1.00***
1.00**
1.00
0.94*
0.50**
1.00***
1.00
3.00**
--
-(0.675)
(0.323)
(0.504)
(1.272)
(0.478)
(0.228)
(0.356)
(0.900)
(0.780
)Sa
mplesize
111
9494
94111
9494
94111
--
-N
otes
:Pan
elA
show
smargina
leff
ects
oftheinform
ationreceived
attheInvitation
Stag
eon
theintent
todo
nate,from
prob
itregression
swhe
rethe
depe
ndentvariab
leis
abina
ryindicatorforacceptan
ceto
dona
teat
theInvitation
Stag
e.Regressorsformod
el(1)aretheinform
ationreceived
atthe
Invitation
Stag
e,thepa
rticipan
t’stype
,an
dtheirinteraction.
Mod
el(2)ad
dsagean
dgend
ercontrols.Mod
el(3)includ
esthesameregressors
asmod
el(1)bu
texclud
esfrom
thesampleindividu
alsin
theReluctant
type
who
shared
$0or
$1in
thedictator
game.
Pan
elB
show
smargina
ltreatm
enteff
ects
from
anOLSregression
andqu
antile
regression
s,whe
retheregressors
arethetreatm
entreceived
,thepa
rticipan
t’stype
,an
dtheinteractionof
thetw
o.OLScompu
tesestimates
ofeff
ects
onthemeansize
ofthedo
nation
cond
itiona
lon
mak
ingado
nation
.Qua
ntile
regression
scompu
teestimates
ofeff
ects
onthefirst
quartile,median,
andthirdqu
artile
dona
tion
size
cond
itiona
lon
mak
ingado
nation
.Qua
ntile
regression
estimates
couldno
tbe
compu
ted
forGenerou
spa
rticipan
tsdu
eto
theirlow
frequency.
Stan
dard
errors
inpa
rentheses.
*p<
0.1;**p<
0.0
5;***p<
0.0
1.
17

amounts when informed of a previous donation than when not informed, except for the $5-at-Invitation treatment, which induced larger donations. On the other hand, all informationtreatments caused women donors to give significantly more than when not informed. Thiswas particularly the case for the lower end of the distribution, meaning that receiving anyinformation caused women donors to become unwilling to donate just 50¢.
Hence it was mostly women that responded to the social information, and their reactionscorresponded to reluctant giving (Appendix B provides evidence that the reluctance measureretains explanatory power within gender, especially for women). The responsiveness of womento the information led to the average revenue being much more different across treatmentsfor women than for men. Panel B of Table 4 shows the marginal treatment effects on theunconditional donation size; namely, on the average revenue raised per participant. For men,the revenue did not vary significantly across treatments. For women, the difference in revenuebetween the least profitable treatment ($5-at-Invitation; $0.10 raised per participant) and themost profitable treatment (50¢-at-Invitation; $1.24 raised per participant) was more twelvefold,and highly significant.
3.3.2 In the reluctance measure
Figure 7 shows results of the reluctance measure by gender. Focusing only on how partici-pants split the $10 in the dictator game (i.e., ignoring the colors of the bars) women appearedmore generous than men. The mean transfer was $2.00 for women vs. $1.59 for men, and themass of the distribution of transfers fell toward larger amounts for women than for men (aMann-Whitney U test rejects equality of median transfers across genders with p = 0.065). Menwere significantly more likely than women to share $0 rather than any other amount (59% vs.48%; χ2(1) test of equality rejected with p = 0.051) and marginally significantly less likelyto share $5 rather than any other amount (18% vs. 25%; χ2(1) test of equality marginallyrejected with p = 0.108). This is in line with the literature on gender differences in the dictatorgame, which finds that men are more likely to be perfectly selfish, while women are more likelyto prefer equality of payoffs.17
However, women no longer appeared more generous than men after accounting for theirdecisions to obtain $9-$0. Women were more likely than men to indicate a probability greaterthan 0.10; 50% of women did so, compared to 33% of men (a χ2(1) test rejects equality ofproportions with p = 0.002).18 Among those who selected a probability greater than 0.10,the expected value of the transfer to the recipient (adjusting for the probability of $9-$0) didnot vary by gender. The mean was $1.26 for women and $1.15 for men, and their medianswere statistically equal (a Mann-Whitney U test fails to reject equality of the median expectedtransfer across genders for this group with p = 0.521). Gender equality of transfers was alsoobserved among the participants who selected a probability equal to 0.10. The mean transferwas $0.69 for women and $0.81 for men, and the median was indistinguishable across genders(a Mann-Whitney U test fails to reject equality of median transfers across genders for thisgroup with p = 0.742).
Thus men and women revealed as preferred equal amounts to share with the recipient, once17Andreoni and Vesterlund (2001), and Niederle (forthcoming).18The exact value of the probability above 0.10 did not vary by gender (see Appendix B).
18

Tab
le4:
Treatmenteff
ects
ontheextensivean
dintensivemarginof
giving
cond
itiona
lon
gend
er
Pan
elA
:Ext
ensi
vem
argi
n(i
nten
tto
dona
te)
Men
Wom
en
(1)
(2)
(1)
(2)
50¢
0.138
0.130
0.285***
0.280*
**(0.106)
(0.107)
(0.096)
(0.096)
$5-0.020
-0.018
-0.284***
-0.283***
(0.090)
(0.091)
(0.071)
(0.071)
constant
0.345*
**0.347***
0.372***
0.371***
(0.052)
(0.052)
(0.052)
(0.052)
Age
control
No
Yes
No
Yes
Samplesize
308
308
308
308
Pan
elB:In
tens
ive
mar
gin
Con
dition
alam
ount
Uncon
dition
alam
ount
Men
Wom
enMen
Wom
en
Qua
ntile
regression
Qua
ntile
regression
OLS
OLS
OLS
25th
50th
OLS
25th
50th
(1)
(2)
(1)
(2)
50¢-at-Inv
itation
-0.36
00
0.78
0.50**
0.50
0.23
0.21
0.74**
0.74**
(0.700)
(0.272)
(0.481)
(0.565)
(0.219)
(0.388)
(0.331)
(0.338)
(0.337)
(0.337
)50
¢-at-Pay
ment
-0.36
00
0.66
0.50**
1.00**
0.19
0.17
0.17
0.17
(0.700)
(0.272)
(0.481)
(0.645)
(0.250)
(0.443)
(0.327)
(0.331)
(0.349)
(0.350
)$5-at-Invitation
1.08
1.00***
2.00***
0.64
1.00**
1.50*
0.41
0.40
-0.40
-0.39
(0.717)
(0.279)
(0.493)
(1.122)
(0.436)
(0.771)
(0.310)
(0.312)
(0.338)
(0.339
)$5-at-Pay
ment
00
0.50
0.89
0.50**
1.00
0.05
0.03
0.15
0.15
(0.775)
(0.301)
(0.532)
(0.633)
(0.246)
(0.435)
(0.331)
(0.336)
(0.333)
(0.334
)constant
1.75***
1.00***
1.00**
1.11**
0.50
***
0.50
0.44*
0.45*
0.50*
0.50*
(0.586)
(0.227)
(0.403)
(0.478)
(0.186)
(0.329)
(0.245)
(0.250)
(0.269)
(0.269
)Sa
mplesize
111
111
111
111
111
111
308
308
308
308
Not
es:Pan
elA
show
smargina
leff
ects
oftheinform
ationreceived
attheInvitation
Stag
eon
theintent
todo
nate
cond
itiona
lon
thepa
rticipan
t’s
gend
er,from
prob
itregression
swhe
rethede
pen
dent
variab
leis
abina
ryindicatorforacceptan
ceto
dona
teat
theInvitation
Stag
e.Regressorsfor
mod
el(1)aretheinform
ationreceived
attheInvitation
Stag
e,thepa
rticipan
t’sgend
er,an
dtheirinteraction.
Mod
el(2)ad
dsag
eas
control.
Pan
elB
show
smargina
ltreatm
enteff
ects
onthesize
ofthedo
nation
cond
itiona
lon
mak
ingado
nation
(Con
dition
alam
ount)an
dthesize
ofthedo
nation
amon
gallpa
rticipan
tsin
thetreatm
ent(U
ncon
dition
alam
ount).
OLScompu
tesestimates
ofeff
ects
onthemeansize,an
dqu
antile
regression
scompu
teestimates
ofeff
ects
onthefirst
quartile
andthemediansize.Fo
rthecond
itiona
lam
ount,regressors
arethetreatm
entreceived,thepa
rticipan
t’sgend
er,
andtheirinteraction.
Fortheun
cond
itiona
lam
ount,regressors
formod
els(1)an
d(2)areas
inPan
elA.Stan
dard
errors
inpa
renthe
ses.
*p<
0.1;
**p<
0.0
5;***p<
0.0
1.
19

0
25
50
75
100
Num
ber
of part
icip
ants
Men Women
0 1 2 3 4 5 6 10 0 1 2 3 4 5 6 10
Amount shared in $10 dictator game
Pr = 0.1 0.1 < Pr < 0.9 Pr = 0.9
Figure 7: Histogram of dictator transfer and probability of getting $9-$0 by gender
the quiet exit is considered. This suggests that the gender difference in the original dictatorgame, interpreted in the literature as arising from different preferences for selfishness andequality of payoffs, may be the result of a higher (self-)image concern of women, rather thanof differences in payoff-related preferences. More work is needed to evaluate this possibility,though experimental research in the context of volunteering (Linardi and Jones, 2014; Exley,2014) finds women to be more affected than men by social image concerns, hence it is possiblethat this gender difference extends to private, anonymous contribution decisions such as thosemade in this study.
4. Theory: a model of reluctant giving
This section offers a model for why individuals give reluctantly and how they respond toreceiving information about others’ donations. Donors in the model care about their image andcreate excuses for not participating in the solicitation. In equilibrium, a subset of donors—thereluctant donors—decline to donate if the solicitation has an Invitation Stage prior to thePayment Stage, but give positive amounts if there is no Invitation Stage. I propose thatproviding social information affects these individuals’ ability to come up with valid excuses fornot participating. The model is an extension of Benabou and Tirole (2006), and belongs to theclass of dynamic psychological games (Battigalli and Dufwenberg, 2009).
4.1 Two-stage solicitation model
4.1.1 The game
Consider a game between a “donor” and an “observer.” For now, the observer is simplysomeone who can see the donor’s actions (such as the solicitor or a bystander). To avoid
20

confusion I often refer to the donor as she and the observer as he.The donor comes from a population of donors with heterogeneous levels of generosity. Let
the donor’s generosity, v, be a random draw from a uniform distribution on [0, 2v], v > 0. v isprivate information to the donor, and unknown to the observer.
The donor decides to make a donation to a charity in two stages: the Invitation Stage andthe Payment Stage. In the Invitation Stage the donor chooses whether to participate in thePayment Stage. Denote this binary choice by d ∈ {0, 1}, where d = 1 means the donor chose toparticipate. If the donor participates in the Payment Stage, she then selects the amount g ≥ 0
of money to donate. If she does not participate, the Payment Stage does not take place andshe does not donate. This setup corresponds to the experimental design as well as to situationsoutside of the laboratory where solicitees can anticipate an opportunity to give (for example byreceiving an invitation to attend a fundraising event, or by noticing a solicitor in the distance)and can decide whether to pursue the opportunity.
Independently of the value of v, there is a commonly-known probability p ∈ (0, 1) that thedonor is unable to participate in the Payment Stage due to circumstances outside of her choice.This captures the fact that anyone, despite their intentions, may face a situation that preventsthem from helping. Importantly, the failure to participate is due to a situation outside of thedonor’s control that anybody may experience, and not the result of the donor’s deliberateaction; therefore, the probability of its occurrence is constant and independent of the donor’slevel of generosity. Getting ahead of the results, one may imagine that the fact that anyonemay face such situation can be used strategically to cover up one’s lack of generosity, and this iswhat will occur in equilibrium in the model. But this equilibrium will arise endogenously—themodel does not assume that ungenerous individuals are more likely to experience obstacles totheir participation in prosocial activities.
Since the donor may fail to participate despite choosing to participate, it is useful to denoteactual participation separately from the choice d. Let a ∈ {0, 1} denote whether the donoractually participates in the Payment Stage, where a = 1 means that the donor participated.The observer observes a, but not d. Namely, the observer sees if the donor fails to participate inthe Payment Stage, but not if she did so deliberately or involuntarily. Naturally, a = 1 revealsthat d = 1, while a = 0 does not necessarily imply d = 0.
Finally, the observer has no action in the game. He simply observes a, and g if a = 1. Fromthe observables he forms a belief about the donor’s level of generosity, as described below.
4.1.2 Preferences
The donor derives intrinsic utility gv from donating an amount g. Following Benabou andTirole (2006), this utility can arise from pure altruism, warm glow, or both. In addition, thedonor incurs in cost kg2/2 when she donates g, where k > 0 is fixed and commonly known.
The donor derives image utility from what the observer thinks of her. This utility dependson the observer’s expectation of v conditional on the actions a and g observed. When shedonates g, her image utility is equal to γE(v|g), where γ > 0 is fixed and commonly known andreflects the donor’s intensity of her image concern, and E(v|g) is the observer’s expectation ofthe donor’s level generosity given the observed donation g.19 When she does not participate in
19Strictly speaking, the donor’s image utility is not a function of E(v|g) but of the donor’s expected value of
21
the Payment Stage, the donor derives image utility equal to γE(v|a = 0).Note that if the donor donates nothing—whether by not participating in the Payment Stage,
or by participating and choosing g = 0—she derives no intrinsic utility and incurs in no cost,but still derives image utility as given by the observer’s beliefs conditional on what he observes.That is, she derives γE(v|a = 0) or γE(v|g = 0), whose values are to be derived in equilibrium.
For completeness, the observer’s utility is c, some constant across all outcomes of the game.
4.1.3 Solution
I solve for a Bayesian equilibrium whose outcome corresponds to reluctant giving, and thatis reasonable in the sense that it survives Cho and Kreps’ (1987) equilibrium domination test(a standard equilibrium refinement concept).
Given preferences, the donor’s problem can be written as
maxd∈{0,1}, g≥0
d
{pγE(v|a = 0) + (1− p)
[vg − kg2
2+ γE(v|g)
]}+ (1− d) {γE(v|a = 0)} (1)
Letting R(g) ≡ E(v|g) and assuming that R(g) is differentiable, then conditional on agreeingto participate in the Payment Stage, the donor chooses to donate the amount g∗(v) given bythe first-order condition
v − kg∗(v) + γdR (g∗(v))
dg= 0 (2)
The function R(g) will result endogenously in equilibrium, but is taken as given by thedonor when solving her problem. If R(g) is weakly increasing in g, then equation (2) impliesthat the donor’s level of generosity is perfectly revealed from the amount she donates, as thereis a unique optimum g different for each v. It follows that, under rational expectations, beliefsin equilibrium pin v perfectly when g∗(v) is observed; namely
R (g∗(v)) = g∗−1 (g∗(v)) = v (3)
Substituting (3) into (2) obtains the differential equation
R (g∗(v))− kg∗(v) + γdR (g∗(v))
dg= 0 (4)
The solution to this equation is the belief rule that maps the observed donation g to theposterior expected level of generosity the observer infers in equilibrium. This function is
R(g) = k[g − γ
(1− e−g/γ
)](5)
where the initial condition has been set to R(0) = 0. This initial condition states that theobserver identifies the minimum possible donation amount (g = 0) as coming from a donor
E(v|g), since the observer’s beliefs are not known to the donor. But in equilibrium beliefs are assumed to beaccurate, and so formulating the donor’s preferences in terms of the observer’s beliefs is without problem andavoids the more cumbersome notation of second-order beliefs.
22

Figure 8: Functions g∗(v) and U∗(v) for arbitrary values of k and γ
with the lowest possible level of generosity (v = 0). This condition also guarantees that R(g) isincreasing in g for any k > 0 and γ > 0.
The donor’s optimal donation as a function of her generosity, conditional on participating inthe Payment Stage and given the beliefs R(g), is given by g∗(v), found by taking the derivativeof the belief rule and substituting it into equation (2), obtaining
g∗(v) =v
k+ γ
[1 +W0
(−e−1− v
kγ
)](6)
where W0 is the principal branch of the Lambert W function.20 Note that g∗(v) is increasingin v, and g∗(0) = 0, as Figure 8 shows.
Given R(g) and g∗(v), the payoff that the donor expects to get on agreeing to participatein the Payment Stage is the value function
U∗(v) ≡ pγE(v|a = 0) + (1− p)H(v) (7)
where H(v) ≡ γv + 12k
(v2 − k2γ2Ψ2(v)
)and Ψ(v) ≡ 1 +W0
(−e−1− v
kγ
). Note that H(v) is
increasing in v for any k > 0 and γ > 0, is continuous, and H(0) = 0. Figure 8 shows thegeneral shape of H.
The value of E(v|a = 0) remains to be solved for. It also must be proved that the obtainedsolution is an equilibrium, by checking that the donor has no incentives to deviate. I start bydescribing a situation that is not an equilibrium, but that is instructive and serves to introducethe subsequent discussion.
An equilibrium that fails: full participation
Consider a candidate equilibrium in which no donor deliberately avoids participating, andthe donor of generosity level v chooses g∗(v). Then, any donation g ∈ [0, g∗(2v)] is observedin equilibrium with probability (1− p)/2v, and the observer’s beliefs are such that, when g is
20The Lambert W function is defined as the solution to x = W(x)eW(x). Its principal branch, W0(x),is real-valued and increasing for x ≥ − 1
e, with W0(− 1
e) = −1, which implies that in our problem g∗(v) is
real-valued and increasing in v for any v ≥ 0, given that k > 0 and γ > 0. For a discussion on the Lambert Wfunction, see Corless et al. (1996).
23

observed, they place full weight on the donor having generosity level R(g). Failure to participatein the Payment Stage is observed only when it happens unintentionally, which occurs withequal probability p to a donor of any level of generosity. Beliefs about the generosity of a donorwho fails to participate are therefore uniform over [0, 2v], so that E(v|a = 0) = v.
But this cannot be an equilibrium, since a donor with low enough level of generosity has anincentive to deviate to deliberately opting out of the Payment Stage. Take for instance theleast generous donor (v = 0). In this candidate equilibrium she gives g∗(0) = 0, and derivesexpected utility pγv + (1− p)0 = pγv. If instead she decided not to participate in the PaymentStage, she would obtain utility γv, which is clearly greater than pγv for any valid p. Thereforeshe prefers the deviation, breaking the equilibrium. This incentive to avoid participating holdsnot only for the least generous donor, but also for any donor with generosity level low enoughsuch that H(v) < γv.
Full participation fails because the observer interprets non-participation as an entirelyunintended occurrence. The observer’s ingenuousness can be exploited by a donor who prefersto avoid participating and be mistaken for the average type over donating g∗(v) and revealingher low generosity. This raises the possibility of another candidate equilibrium—our actualequilibrium—where donors of certain level of generosity deliberately opt out of the PaymentStage, and the observer correctly incorporates such behavior into his beliefs.
Equilibrium: partial pooling at non-participation
Consider a candidate equilibrium in which there exists a generosity level 0 < vc < 2v
such that a donor with v < vc deliberately chooses to opt out of the Payment Stage, anda donor with v > vc opts in and donates g∗(v). Hence, any donation g ∈ (g∗(vc), g
∗(2v)] isobserved in equilibrium with probability (1− p)/(2v− vc). The observer’s beliefs are such that,when g is observed, they place full weight on the donor having generosity level R(g) and zeroweight elsewhere. Failure to participate occurs either unintentionally (for donor of any v) orintentionally (for a donor of v < vc). Therefore, when non-participation is observed, beliefsabout the donor’s generosity are uniform over [0, 2v] with probability p, and uniform over [0, vc]
with probability 1 − p. The expected value of this mixture is E(v|a = 0) = pv + (1 − p)vc/2.Donations of g ∈ [0, g∗(vc)) are never observed in equilibrium, and as such beliefs upon observingthem must be specified outside Bayes rule. I assume that if g is observed, beliefs place fullweight on R(g). (Below I check that the equilibrium with these beliefs survives Cho and Kreps’(1987) equilibrium domination test.)
For this equilibrium to exist, any donor who deliberately opts out must not prefer to deviateto opting in and giving g∗(v), and any donor who donates g∗(v) must not prefer to deviateto opting out. Since H(v) is increasing in v, these conditions hold if the donor with cutoffgenerosity vc is indifferent between deliberately avoiding the Payment Stage and participatingwith a donation of g∗(vc); that is, if
pγ[pv + (1− p)vc
2
]+ (1− p)H(vc) = γ
[pv + (1− p)vc
2
](8)
Equation (8) is always satisfied by a unique and positive vc. Moreover, as the followingproposition states, vc is strictly in (0, 2v) for appropriately chosen values of k, γ, and v.
24
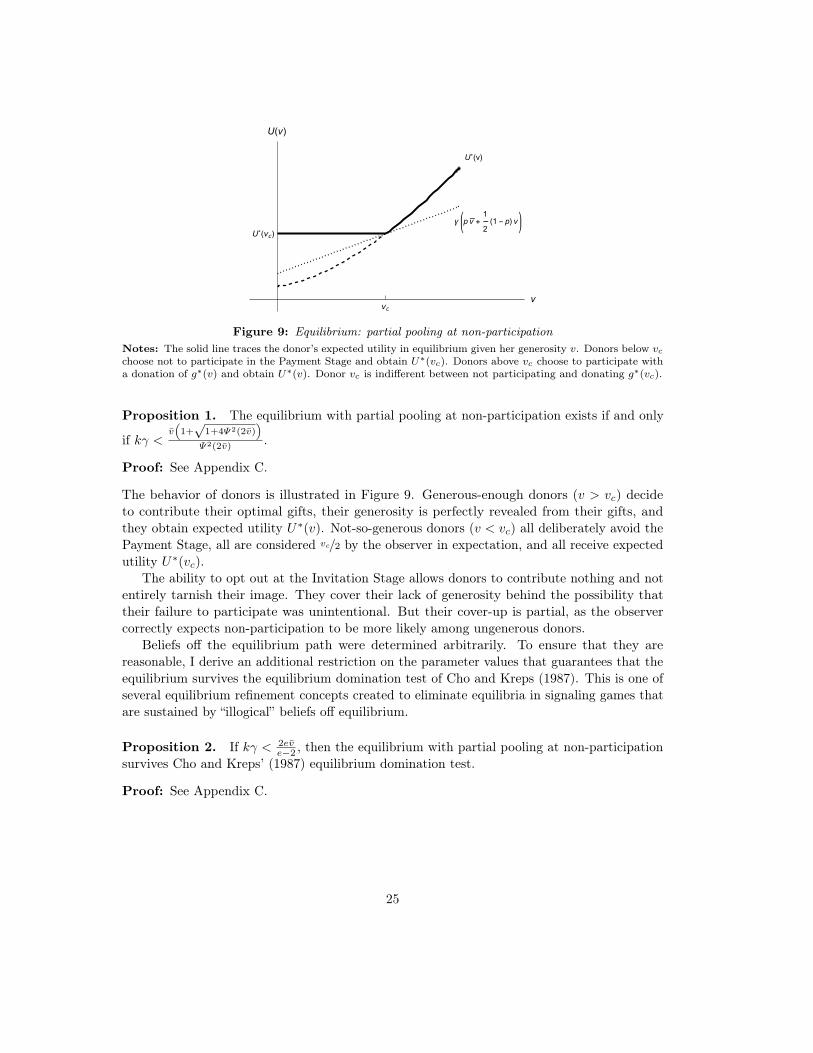
Figure 9: Equilibrium: partial pooling at non-participationNotes: The solid line traces the donor’s expected utility in equilibrium given her generosity v. Donors below vcchoose not to participate in the Payment Stage and obtain U∗(vc). Donors above vc choose to participate witha donation of g∗(v) and obtain U∗(v). Donor vc is indifferent between not participating and donating g∗(vc).
Proposition 1. The equilibrium with partial pooling at non-participation exists if and only
if kγ <v(
1+√
1+4Ψ2(2v))
Ψ2(2v) .
Proof: See Appendix C.
The behavior of donors is illustrated in Figure 9. Generous-enough donors (v > vc) decideto contribute their optimal gifts, their generosity is perfectly revealed from their gifts, andthey obtain expected utility U∗(v). Not-so-generous donors (v < vc) all deliberately avoid thePayment Stage, all are considered vc/2 by the observer in expectation, and all receive expectedutility U∗(vc).
The ability to opt out at the Invitation Stage allows donors to contribute nothing and notentirely tarnish their image. They cover their lack of generosity behind the possibility thattheir failure to participate was unintentional. But their cover-up is partial, as the observercorrectly expects non-participation to be more likely among ungenerous donors.
Beliefs off the equilibrium path were determined arbitrarily. To ensure that they arereasonable, I derive an additional restriction on the parameter values that guarantees that theequilibrium survives the equilibrium domination test of Cho and Kreps (1987). This is one ofseveral equilibrium refinement concepts created to eliminate equilibria in signaling games thatare sustained by “illogical” beliefs off equilibrium.
Proposition 2. If kγ < 2eve−2 , then the equilibrium with partial pooling at non-participation
survives Cho and Kreps’ (1987) equilibrium domination test.
Proof: See Appendix C.
25

4.2 Who are the reluctant donors? Those whose behavior changeswith the invitation
In the game above, the donor foresees the Payment Stage and can decide not to participatein it, just as donors in practice sometimes anticipate that someone will ask them for money andcan decide whether to seek or steer away from the solicitor. Other times the request cannotbe anticipated, and donors must reply directly. Reluctant donors are individuals whose imageconcern compels them to donate in the latter case, but avoid the Payment Stage in the formercase.
To describe this behavior, consider now a version of the game in which the solicitationconsists only of the Payment Stage. In this new game, donors cannot fail to participate inthe Payment Stage (involuntarily or by choice), and must make a donation of g ≥ 0. Thougha and p are no longer part of the problem, monetarily this game is no more restrictive thanthe original, as donors can choose g = 0. If the donor has the same preferences as before, herproblem is now
maxg≥0
{vg − kg2
2+ γE(v|g)
}By following the previous derivation steps, one finds that there now exists a full-participation
equilibrium in which donor of type v donates g∗(v) as defined above. More importantly, there isalso a partial-pooling equilibrium, with pooling at g = 0. Donors below the cutoff v′c give g = 0
and donors above v′c give g = g∗(v), where v′c is such that H(v′c) = γv′c2 . For off-equilibrium
donations g′, beliefs place full weight on R(g′). As before, the fact that a whole subset ofdonors pools at g = 0 makes it impossible for the observer to perfectly identify the level ofgenerosity of a donor who gives nothing. This yields enough image utility for the least generousindividuals to prefer giving zero over perfectly revealing their type by giving g∗(v).
Partial pooling at g = 0 is not an equilibrium of the original, two-stage game.21 The reasonis that in that game, the observer interprets failure to participate more favorably than a $0donation, due to the chance p that anyone fails to participate despite their intentions. Aslong as p > 0, some donors prefer to opt out over explicitly donating $0, and therefore thepartial-pooling equilibrium at non-participation in the original game comprises all individualswho pool at g = 0 in the equilibrium of the new game plus an additional group of individuals.This additional group are the reluctant givers: individuals who donate a positive amount whenthey are unable to avoid the Payment Stage, but who opt out when there is an Invitation Stage.This result is guaranteed by the following condition.
Proposition 3. In the two-stage game, vc(p) increases in p ∈ (0, 1) in the equilibrium withpartial pooling at non-participation if and only if kγ < 2vc(0)
2√e−1
. This condition can always be
satisfied while satisfying conditions for Proposition 1 and Proposition 2.
Proof: See Appendix C.21To see this, suppose it was an equilibrium. Failure to participate in the Payment Stage would only be
observed when it occurred involuntarily, making E(v|a = 0) = v. Then anyone pooling at g = 0 in this candidateequilibrium would prefer to deviate to deliberately opting out of the Payment Stage, since γv is necessarilylarger than γ v′c
2, and this breaks the equilibrium.
26

Figure 10: The value of the Invitation StageNotes: Solid lines trace the donor’s expected utility in equilibrium given her generosity v. Avoidance is notpossible in the game with only a Payment Stage, and avoidance is possible in the two-stage game. With only aPayment Stage, donors below v′c donate $0 and obtain γE(v|g = 0), and donors above v′c donate g∗(v) andobtain the corresponding U∗(v). With an Invitation Stage, donors below vc choose not to participate in thePayment Stage and obtain γE(v|a = 0), and donors above vc donate g∗(v) and obtain the corresponding U∗(v).Donors between v′c and vc are the reluctant donors, who donate a positive amount if they cannot avoid thePayment Stage, but do not participate if there is an Invitation Stage.
Figure 10 illustrates this result. In the game where the Payment Stage is the only stage, alldonors below v′c pool at g = 0 and obtain utility γE(v|g = 0), whereas in the game with theInvitation Stage, a larger set of donors (all donors below vc) opt out, all of whom obtain a largerlevel of utility equal to γE(v|a = 0). Individuals between v′c and vc are the reluctant donors.They donate if they cannot avoid the Payment Stage, but opt out if there is an InvitationStage. The least generous individuals in the population (donors below v′c) give in neither game,and the most generous (higher than vc) give in both games. The reluctant donors are thosewho change their behavior with the Invitation Stage.
4.3 What drives reluctant donors? Self-serving rationalization
Individuals give reluctantly even when donations are private and anonymous, as thisand other experiments show. The behavior may therefore be driven in part by a self-imageconcern—an attempt to satisfy one’s own judgement. Self-image is often characterized witha dual-self model, whereby an agent with limited self-insight infers her moral identity fromher actions. A dual-self reinterpretation of our model considers the donor and the observer asdifferent sides of the same agent, who decides whether and how much to donate but also lacksawareness of what motivates her actions and thus forms an impression of her generosity fromthe observables a and g.22
To sustain reluctant giving in equilibrium, two elements are essential in the model: (1) a22For more on the self-image interpretation of signaling models see Benabou and Tirole (2006).
27

probability p that any donor fails to participate in the Payment Stage independently of hergenerosity, and (2) that the observer not see the donor’s participation choice d. With them, theobserver can legitimately excuse the donor for not participating. The excuse is objective in themodel, and given by p. Reinterpreted in a dual-self light, these elements describe a donor who,when she does not participate, is unaware of what motivated her (i.e., cannot access d) and hasa tendency (of magnitude p) to find excuses or justifications for not participating. Now p is atrait of the agent rather than a feature of the environment. As long as p is common knowledge,the model is otherwise unchanged and the equilibrium remains.23
Work in psychology and economics provides ample reason to adopt this dual-self interpreta-tion. There is considerable evidence that individuals interpret events and actions—includingtheir own actions—in self-serving ways.24 In the words of Kunda (1990), “people may bias theirself-characterizations when motivated to do so.” A donor motivated to keep both her moneyand a good impression of herself is more likely to decline to donate at the Invitation Stage thanto more explicitly donate $0 at the Payment Stage insofar as she finds it easier to rationalize toherself the former. In situations outside the lab, individuals may avoid the solicitor and offerto themselves reasons such as “I may be asked to provide contact information that I am notwilling to share,” or “the solicitation may take too much time.” These excuses are plausible, buttheir objectivity is illusory, as Kunda (1990) puts it. p captures this self-serving rationalization.
4.4 How does social information affect reluctant donors? Less roomto rationalize
The economics literature considers a number of ways in which information about pastdonations affects solicitees. Altruist donors care about the sum of money the charity receives,and donate to offset the amount others donate (Varian, 1994). Individuals who derive prestigefrom giving seek to exceed others’ donations (Romano and Yildirim, 2001). Solicitees whoare unsure about the merits of the charity infer merit from others’ donations, and donateproportionally to others (Vesterlund, 2003).
As discussed in Section 3, these theories have trouble explaining reluctant giving. If reluctantdonors avail themselves of opportunities to decline to donate to the extent that they can comeup with self-serving rationales for doing so, it is reasonable to conjecture that social informationaffects their ability to find excuses for not participating. Donors may find it harder to rationalizetheir unwillingness to help if others are willing to contribute small amounts. Excuses such as“I decline to donate because I really need the money,” or “I decline to donate because small
23The donor has limited self-insight of her decision to participate, but is fully aware of what motivates her todonate a specific amount g. One may imagine another model where she is also unaware of what motivates g,and has a tendency to excuse herself, especially for donating g close or equal to zero. For simplicity I do notpursue this. In this more general model p would be the donor’s tendency to rationalize the action a = 0 inexcess of her tendency to rationalize g.
24Kunda (1990) reviews evidence that motivation biases strategies for accessing, constructing, and evaluatingbeliefs. In another, relevant experiment in psychology Snyder et al. (1979) show that people are more likelyto avoid interacting with a handicapped person if they can appear to be doing so on some other basis. Inexperimental economics, Haisley and Weber (2010) demonstrate that people interpret ambiguity self-servinglywhen doing so provides a justification for unfair behavior, and Exley (2015) finds similar bias in the domain ofrisk. For a decision-theory model of agents who are constrained to make choices that they can rationalize orjustify, see Cherepanov et al. (2013).
28

amounts probably don’t help,” seem valid if others donate large amounts, but are not convincingif others donate as low as 50¢.25
This can be captured in the model by letting p be positively related to the donation sizethe donor is informed of. That is, the set of justifications for not participating available to thedonor shrinks as she learns that other individuals contribute smaller amounts. If p is relatedto the information in this way, it is easy to see that in the equilibrium of the model donorsrespond to the information as follows.
RESULT 1. Donors are more likely to choose to participate in the Payment Stage as theamount they are informed of in the Invitation Stage decreases.
RESULT 2. When information is provided only in the Payment Stage, no donor whoparticipates in this stage donates $0.
As donors are informed of a smaller amount in the Invitation Stage, more excuses aredefeated, and more reluctant givers are induced to participate. Information in this stage thusacts as a screening mechanism. On the other hand, the same information that causes reluctantdonors to opt out in the Invitation Stage does not cause them to donate $0 if received onlyin the Payment Stage, because donating $0 would bring an unacceptably high cost on theself-image. Note that the information causes no change in the donation size (other than in thesize conditional on participating through the screening mechanism) because, as pointed before,a tendency to rationalize g is not captured in the model to maintain tractability.
5. Discussion and conclusion
To encourage donations, fundraisers often inform solicitees of how much others contribute.The effectiveness of this technique depends on the solicitees’ motivations for giving. This paperfocuses on the reaction to social information of a particular class of donors: individuals whodonate to not appear selfish, but avoid the solicitation when possible.
Such individuals were fairly prevalent in the study—they constituted 41% of the experimentparticipants according to a novel reluctance measure employed. They were also highly responsiveto social information. Their intent to donate went as high as 0.79 when informed that anotherparticipant donated 50¢, to as low as 0.17 when informed of a $5 donation (see Figure 5). Ifshown the same information only after saying they would give, they all gave, and donated onaverage 88% and 127% more (when informed of a 50¢ and $5 donation, respectively) than theydid without any information (see Panel B of Table 3).
25The idea that the solicitor invalidates excuses for noncompliance by referring to small donations is proposedby Cialdini and Schroeder (1976), who write: “When the most minimal of monetary donations is said to beacceptable, excuses for failing to help that might ordinarily be offered (e.g., ‘I can’t afford to give to all thevarious charities’; ‘We’re too low on money this week,’ etc.) become inapplicable. Further, the refusal to provide‘even a penny’ of aid might cause one to feel guilty or ashamed or might jeopardize one’s image as a helpful,socially responsible person.” Notice that the latter mechanism for increasing compliance—the jeopardizing ofone’s image—results endogenously in the equilibrium of our model, because as p drops—that is, as excusesbecome inapplicable—fewer donors pool at d = 0 in equilibrium, and therefore the inferred generosity of thosewho fail to participate goes down.
29

Therefore, how profitable it is to announce others’ donations depends not only on whatamount is announced, but also on when the amount is announced. Solicitors may gain frommentioning a relatively modest previous donation early, when they seek to notify and attractdonors to the fundraiser. This can increase participation and not decrease the size of thedonations, as the experiment shows. This virtually costless intervention may also prove moreeffective than offering solicitees gifts or subsidies, which has been found to increase participationbut also to decrease the average amount shared among entrants (Lazear et al., 2012). Of course,the assumption is that the solicitees are individuals who would donate, if at all, out of imageconcerns. Individuals with other motivations for giving may react differently to the socialinformation, as work reviewed in this paper suggests.
Future research may help determine whether reluctant giving is a stable type that can bepredicted.26 Appendix B includes evidence that reluctant donors are no more or less empatheticthan outright selfish participants. They do report a higher sense of responsibility toward helpingothers, and score higher on the personality trait of neuroticism. A much premature take onthese findings is that reluctant donors give not because they empathize with the cause, butrather because they feel they must give, and possibly experience negative emotions from thesolicitation. More work may inform this question.
Given the interest of charitable organizations in maintaining a pool of donors from whichto draw funds repeatedly, another open question is whether reluctant donors become lessresponsive to social information after multiple requests, or whether they are likely to be part ofa donor pool at all. When designing their fundraising campaigns, organizations may benefitfrom experimenting with providing different social information depending on whether the goalis to build a donor pool or raise the most funds immediately, on whether solicitees are fresh orpast donors, and on the likely motivations of the solicitees.
26Lotz et al. (2013) find that individuals who score low on justice sensitivity—the importance placed onjustice in everyday life—tend to be the ones who avoid giving and become selfish when circumstances give theman excuse to do so. But as the authors note, the underlying psychological process remains unclear.
30

References
Andreoni, J. (1989). Giving with impure altruism: applications to charity and ricardianequivalence. Journal of Political Economy, 97:1447–1458.
Andreoni, J. (1990). Impure altruism and donations to public goods: a theory of warm-glowgiving. The Economic Journal, 100:464–477.
Andreoni, J. and Bernheim, D. B. (2009). Social image and the 50-50 norm: a theoretical andexperimental analysis of audience effects. Econometrica, 77(5):1607–1636.
Andreoni, J., Rao, J. M., and Trachtman, H. (2012). Avoiding the ask: a field experiment onaltruism, empathy, and charitable giving. Working paper.
Andreoni, J. and Vesterlund, L. (2001). Which is the fair sex? Gender differences in altruism.Quarterly Journal of Economics, 116(1):293–312.
Bardsley, N. (2008). Dictator game giving: altruism or artefact? Experimental Economics,11(2):122–133.
Battigalli, P. and Dufwenberg, M. (2009). Dynamic psychological games. Journal of EconomicTheory, 144(1):1–35.
Baumeister, R. F. and Vohs, K. D. (2007). Encyclopedia of social psychology. Sage Publications.Becker, G. S. (1974). A theory of social interactions. Journal of Political Economy, 82(61):1063–
1093.Benabou, R. and Tirole, J. (2006). Incentives and prosocial behavior. American Economic
Review, 96(5):1652–1678.Bodner, R. and Prelec, D. (2003). Self-signaling and diagnostic utility in everyday decision
making. In Brocas, I. and Carrillo, J. D., editors, The psychology of economic decisions,volume 1. Oxford University Press, Oxford, UK.
Broberg, T., Ellingsen, T., and Johannesson, M. (2007). Is generosity involuntary? EconomicsLetters, 94(1):32–37.
Cain, D. M., Dana, J., and Newman, G. E. (2014). Giving versus giving in. The Academy ofManagement Annals, 8(1):505–533.
Camerer, C. (2003). Behavioral game theory: Experiments in strategic interaction. PrincetonUniversity Press.
Cherepanov, V., Feddersen, T., and Sandroni, A. (2013). Rationalization. Theoretical Economics,8:775–800.
Cho, I.-K. and Kreps, D. M. (1987). Signaling games and stable equilibria. Quarterly Journalof Economics, 102(2):179–222.
Cialdini, R. B. and Schroeder, D. A. (1976). Increasing compliance by legitimizing paltrycontributions: when even a penny helps. Journal of Personality and Social Psychology,34(4):599–604.
Corless, R. M., Gonnet, G. H., Hare, D. E., Jeffrey, D. J., and Knuth, D. E. (1996). On thelambert W function. Advances in Computational Mathematics, 5(1):329–359.
Croson, R. and Gneezy, U. (2009). Gender differences in preferences. Journal of EconomicLiterature, 47:448–474.
Dana, J., Cain, D. M., and Dawes, R. M. (2006). What you don’t know wont hurt me:costly (but quiet) exit in dictator games. Organizational Behavior and Human DecisionProcesses, 100(2):193–201.
31
DellaVigna, S., List, J. A., and Malmendier, U. (2012). Testing for altruism and social pressurein charitable giving. Quarterly Journal of Economics, 127(1):1–56.
DellaVigna, S., List, J. A., Malmendier, U., and Rao, G. (2013). The importance of beingmarginal: gender differences in generosity. American Economic Review, 103(3):586–590.
Ellingsen, T. and Johannesson, M. (2008). Pride and prejudice: the human side of incentivetheory. American Economic Review, 98(3):990–1008.
Exley, C. L. (2014). Incentives for prosocial behavior: the role of reputations. Working paper.Exley, C. L. (2015). Excusing selfishness in charitable giving: the role of risk. Working paper.Fischbacher, U. (2007). z-Tree: Zurich toolbox for ready-made economic experiments. Experi-
mental Economics, 10(2):171–178.Frey, B. S. and Meier, S. (2004). Social comparisons and pro-social behavior: testing "conditional
cooperation" in a field experiment. American Economic Review, 94(5):1717–1722.Gill, D. and Prowse, V. (2012). A structural analysis of disappointment aversion in a real effort
competition. American Economic Review, 102(1):469–503.Grossman, Z. (2015). Self-signaling versus social-signaling in giving. Journal of Economic
Behavior and Organization, forthcoming.Haisley, E. C. and Weber, R. A. (2010). Self-serving interpretations of ambiguity in other-
regarding behavior. Games and economic behavior, 68:614–625.John, O. P., Donahue, E. M., and Kentle, R. L. (1991). The big five inventory–versions 4a
and 54. Berkeley: University of California, Berkeley, Institute of Personality and SocialResearch.
John, O. P., Naumann, L. P., and Soto, C. J. (2008). Paradigm shift to the integrative big fivetrait taxonomy: history, measurement, and conceptual issues. Handbook of personality:Theory and research, 3:114–158.
Jones, D. and Linardi, S. (2014). Wallflowers: experimental evidence of an aversion to standingout. Management Science, 60(7):1757–1771.
Karlan, D. and List, J. A. (2007). Does price matter in charitable giving? Evidence from alarge-scale natural field experiment. American Economic Review, 97(5):1774–1793.
Kunda, Z. (1990). The case for motivated reasoning. Psychological Bulletin, 108(3):480–498.Lazear, E. P., Malmendier, U., and Weber, R. A. (2012). Sorting in experiments with application
to social preferences. American Economic Journal: Applied Economics, 4(1):136–163.Linardi, S. and McConnell, M. A. (2011). No excuses for good behavior: volunteering and the
social environment. Journal of Public Economics, 95:445–454.List, J. A. (2007). On the interpretation of giving in dictator games. Journal of Political
Economy, 115(3):482–493.Lotz, S., Schlosser, T., Cain, D. M., and Fetchenhauer, D. (2013). The (in)stability of social
preferences: using justice sensitivity to predict when altruism collapses. Journal ofEconomic Behavior and Organization, 93:141–148.
Martin, R. and Randal, J. (2008). How is donation behaviour affected by the donations ofothers? Journal of Economic Behavior and Organization, 67(1):228–238.
Merritt, A. C., Effron, D. A., and Monin, B. (2010). Moral self-licensing: when being goodfrees us to be bad. Social and Personality Psychology Compass, 4(5):344–357.
Niederle, M. Gender. To appear in The Handbook of Experimental Economics, vol 2, John HKagel and Alvin Roth, eds.
32
Romano, R. and Yildirim, H. (2001). Why charities announce donations: a positive perspective.Journal of Public Economics, 81:423–447.
Sachdeva, S., Iliev, R., and Medin, D. L. (2009). Sinning saints and saintly sinners. The paradoxof moral self-regulation. Psychological Science, 20(4):523–528.
Shang, J. and Croson, R. (2009). A field experiment in charitable contribution: the impact ofsocial information on the voluntary provision of public goods. The Economic Journal,119(540):1422–1439.
Snyder, M. L., Kleck, R. E., Strenta, A., and Mentzer, S. J. (1979). Avoidance of thehandicapped: an attributional ambiguity analysis. Journal of Personality and SocialPsychology, 37(12):2297–2306.
Varian, H. R. (1994). Sequential contributions to public goods. Journal of Public Economics,53(2):165–186.
Vesterlund, L. Voluntary giving to public goods: moving beyond the linear VCM. To appearin The Handbook of Experimental Economics, vol 2, John H Kagel and Alvin Roth, eds.
Vesterlund, L. (2003). The informational value of sequential fundraising. Journal of PublicEconomics, 87(3):627–657.
Wilhelm, M. O. and Bekkers, R. (2010). Helping behavior, dispositional empathic concern, andthe principle of care. Social Psychology Quarterly, 73(1):11–32.
Zhong, C.-B. and Liljenquist, K. (2006). Washing away your sins: threatened morality andphysical cleansing. Science, 313(5792):1451–1452.
33
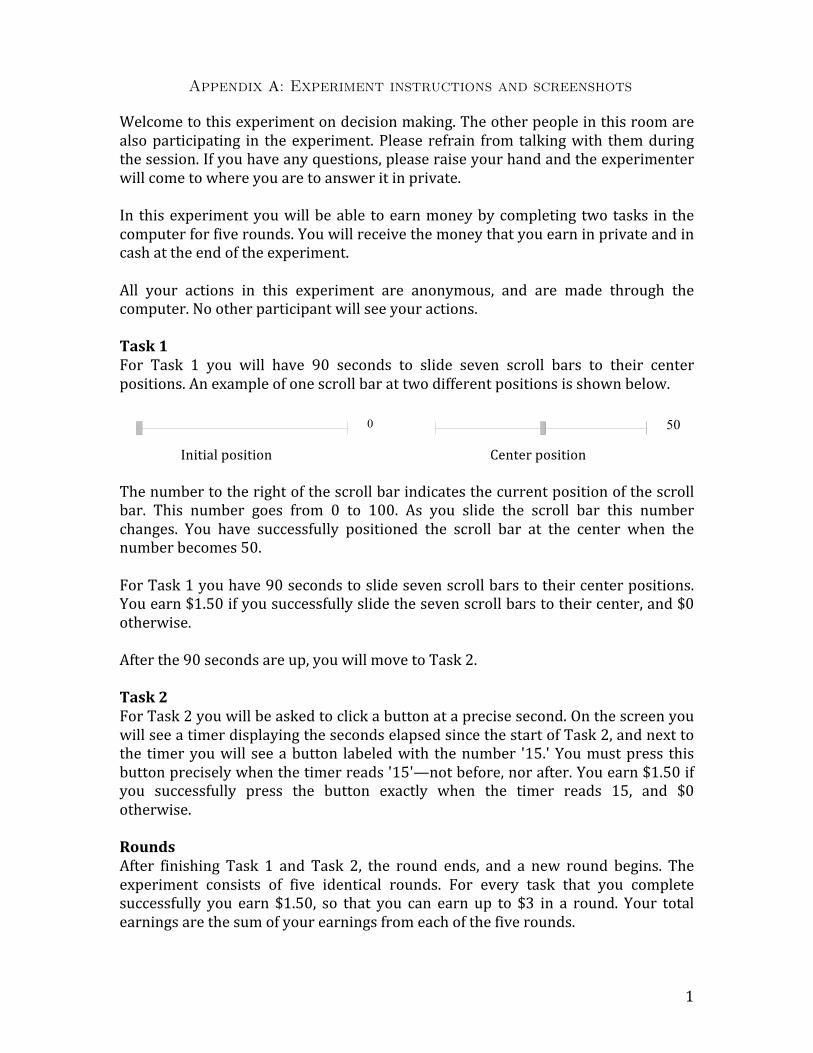
1
Welcome to this experiment on decision making. The other people in this room are also participating in the experiment. Please refrain from talking with them during the session. If you have any questions, please raise your hand and the experimenter will come to where you are to answer it in private.
In this experiment you will be able to earn money by completing two tasks in the computer for five rounds. You will receive the money that you earn in private and in cash at the end of the experiment.
All your actions in this experiment are anonymous, and are made through the computer. No other participant will see your actions.
Task 1 For Task 1 you will have 90 seconds to slide seven scroll bars to their center positions. An example of one scroll bar at two different positions is shown below.
Initial position Center position
The number to the right of the scroll bar indicates the current position of the scroll bar. This number goes from 0 to 100. As you slide the scroll bar this number changes. You have successfully positioned the scroll bar at the center when the number becomes 50.
For Task 1 you have 90 seconds to slide seven scroll bars to their center positions. You earn $1.50 if you successfully slide the seven scroll bars to their center, and $0 otherwise.
After the 90 seconds are up, you will move to Task 2.
Task 2 For Task 2 you will be asked to click a button at a precise second. On the screen you will see a timer displaying the seconds elapsed since the start of Task 2, and next to the timer you will see a button labeled with the number '15.' You must press this button precisely when the timer reads '15'—not before, nor after. You earn $1.50 if you successfully press the button exactly when the timer reads 15, and $0 otherwise.
Rounds After finishing Task 1 and Task 2, the round ends, and a new round begins. The experiment consists of five identical rounds. For every task that you complete successfully you earn $1.50, so that you can earn up to $3 in a round. Your total earnings are the sum of your earnings from each of the five rounds.
Appendix A: Experiment instructions and screenshots

1
Instructions -‐ Extra round
At the beginning of this round, the computer will randomly assign you either the color BLUE or the color GREEN, and will randomly pair you with a participant in this room of the other color to form a BLUE-‐GREEN pair.
For this round both you and the participant paired with you will make 2 decisions: Decision 1 and Decision 2. Your payment in this round will depend on the decisions made by you or by the participant paired with you.
Only one decision from only one member of the pair will count for payment. After everyone makes the two decisions, the experimenter will randomly select a color (BLUE or GREEN) and a decision (1 or 2) to be the decision that counts.
Your payment from this round will be added to the money you have already earned from the previous rounds.
Instructions for Decision 1 appear on the next screen. Instructions for Decision 2 will be given once everybody completes Decision 1.
Press OK to move to the instructions for Decision 1.

2
Decision 1 For this decision you must choose how to allocate $10 between you and the participant paired with you. You may choose any allocation that sums to $10 and that consists of whole numbers. In other words, you may choose any of the following allocations:
You: $10 $9 $8 $7 $6 $5 $4 $3 $2 $1 $0 Other participant: $0 $1 $2 $3 $4 $5 $6 $7 $8 $9 $10
As you privately make this decision, the participant paired with you will also privately make a decision by choosing from the same set of allocations.
Payment If Decision 1 is randomly chosen as the decision that counts for payment, and your color is randomly chosen, then the allocation that you select in Decision 1 will be implemented. The money that you allocate to yourself will be paid to you, and the money that you allocate to the participant paired with you will be paid to that participant.
On the other hand, if Decision 1 is randomly chosen as the decision that counts for payment, and your color is not the one randomly chosen, then the allocation that the participant paired with you selects in Decision 1 will be implemented. The money that that participant allocates to you will be paid to you, and the money that that participant allocates to him or herself will be paid to that participant.
Remember that all decisions are private, and will never be linked to your identity.
Press OK to see what color you've been assigned, and then move to Decision 1.

3
Decision 2 Decision 2 involves two possible allocations of money between you and the participant paired with you. Allocation A is the allocation that you selected in Decision 1. Allocation B is $9 for you and $0 for the participant paired with you. Below you see these two allocations.
You Participant paired with you A $9 $0 B $$ $$ çYour Decision 1
The computer will choose one of these two allocations as your allocation for Decision 2. It will make the choice based partly on chance, and partly on a number that you must indicate. The rule that the computer will use when choosing between A and B can be illustrated as follows.
The computer will place 100 balls in a bag, and will randomly draw one ball from the bag. Balls are labeled either A or B. The letter on the ball drawn by the computer determines whether allocation A or allocation B is chosen.
Your task in Decision 2 is to indicate to the computer how many of the 100 balls in the bag you want to be "B" balls. You can indicate any number between 10 and 90.
Once you indicate the number of B balls you want in the bag, the computer will place the desired number of B balls in the bag, and the remaining as A balls to complete 100 balls. It will then draw one ball, and the letter on the ball drawn will be your allocation for Decision 2.
Of course the computer will not literally use balls and a bag, but the algorithm is the same. The number that you indicate is therefore the probability with which the computer chooses allocation B. 100 minus the number that you indicate is the probability with which the computer chooses allocation A.
Notice that because the number that you indicate must be between 10 and 90, there are always at least 10 balls of each letter in the bag, and therefore there is always some chance that the computer chooses either allocation regardless of what number you indicate.
Payment After the computer chooses between allocation A and allocation B for Decision 2, you will learn which allocation the computer chose.
If Decision 2 is randomly chosen as the decision that counts for payment, and your color is randomly chosen, then your allocation for Decision 2 will be implemented. The money allocated to yourself will be paid to you, and the money allocated to the participant paired with you will be paid to that person.

4
On the other hand, if Decision 2 is randomly chosen as the decision that counts, and your color is not the one randomly chosen, then the allocation for Decision 2 of the participant paired with you will be implemented. The money allocated to you will be paid to you, and the money allocated that participant will be paid to that participant.
Remember that all decisions are private, and will never be linked to your identity.


Appendix B: Supplementary analysis
Response to the social information
Intensive margin
Figure 11 shows the distribution of donations among subjects who made a donation.
0
0.25
0.50
0.75
1
Fra
ction o
f part
icip
ants
0 1 2 3 4 5 6 7 88.5Donation size ($)
No−info
0
0.25
0.50
0.75
1
Fra
ction o
f part
icip
ants
0 1 2 3 4 5 6 7 88.5Donation size ($)
50¢−at−Invitation
0
0.25
0.50
0.75
1
Fra
ction o
f part
icip
ants
0 1 2 3 4 5 6 7 88.5Donation size ($)
50¢−at−Payment
0
0.25
0.50
0.75
1
Fra
ction o
f part
icip
ants
0 1 2 3 4 5 6 7 88.5Donation size ($)
$5−at−Invitation
0
0.25
0.50
0.75
1
Fra
ction o
f part
icip
ants
0 1 2 3 4 5 6 7 88.5Donation size ($)
$5−at−Payment
Figure 11: Uncollapsed distribution of donation sizes conditional on donating, by treatmentNotes: This figure shows the fraction of participants who donated a given amount among all theparticipants who donated a positive amount in the treatment. Dashed lines mark the fraction ofparticipants who donated a positive amount in the treatment.
Reluctance measure
Table 5 shows the number of participants classified as Selfish, Reluctant, and Generous foreach treatment.
Table 5: Frequency of types by treatment
No-info 50¢-at-Invitation 50¢-at-Payment $5-at-Invitation $5-at-Payment Total
Selfish 18 45 24 33 34 154Reluctant 22 25 30 28 22 127Generous 4 4 10 5 4 27Total 44 74 64 66 60 308
1

Gender differences
Table 6 and Figure 12 provide evidence that the reluctance measure retains some ability toexplain behavior in the solicitation within gender, especially for women. Table 6 shows thatthe progressive increase in intent to donate from Selfish to Reluctant to Generous holds forboth men and women. Figure 12 shows that for women identified as Reluctant, the probabilitychosen for $9-$0 continues to have a positive relation with the gap in intent to donate betweeninformation seen in the Invitation Stage. For Reluctant men, the differences across informationconditions are statistically nil; yet, an upward trend for the 50¢ condition and a downwardtrend for the $5 condition are discernible.
Table 6: Intent to donate conditional on information at Invitation Stage, type, and gender
Men Women
Selfish Reluctant Generous Selfish Reluctant Generous
50¢ -0.143 0.097 - 0.379** 0.272** -(0.106) (0.176) (0.152) (0.126)
$5 -0.027 0.151 - -0.174* -0.332*** -(0.097) (0.180) (0.092) (0.116)
constant 0.234*** 0.448*** 0.625*** 0.237*** 0.465*** 0.600***(0.062) (0.092) (0.171) (0.069) (0.076) (0.219)
Sample size 308 308 308 308 308 308
Notes: The table reports the fraction of participants who accepted to donate at the Invitation stage, ascoefficients from a gender-specific logistic regressions with amount announced in the Invitation stage, type, andthe interaction of the two as regressors, and the ‘No info’ condition as the reference condition. The treatments50¢-at-Payment and $5-at-Payment are merged together with the No info treatment and labeled ‘No info’in this table, since in none of these treatments was a previous donation announced at the Invitation stage.Standard errors in parentheses. *p < 0.1; **p < 0.05; ***p < 0.01.
2

0
0.50
1
Share
accepte
d to d
onate
at In
vitation S
tage
0.11−0.49 0.5 0.51−0.89 0.9Chosen probability of $9−$0
50¢ No info $ 5
Men
0
0.50
1
Share
accepte
d to d
onate
at In
vitation S
tage
0.11−0.49 0.5 0.51−0.89 0.9Chosen probability of $9−$0
50¢ No info $ 5
Women
Figure 12: Intent to donate for Reluctant participants conditional on the probability for $9-$0, bygender
Notes: This figure shows the estimated fraction of participants who accepted to donate at the InvitationStage, given the information received at this stage, and conditional on their selected probability of getting$9-$0. Sample limited to Reluctant participants. The x-axis starts at 0.11 since by definition Reluctantparticipants indicated a probability of $9-$0 greater than 0.10. Estimates based on gender-specific probitregressions of a binary indicator for acceptance to donate at the Invitation Stage regressed on the informationreceived at this stage, the probability of getting $9-$0, and their interaction. Observations from treatments50¢-at-Payment, $5-at-Payment, and No-info are combined and labeled ‘No info’, since these treatments didnot provide information about a previous donation at the Invitation Stage. Error bars indicate 90% confidenceintervals, omitted for the ‘No info’ condition for improved visibility.
Figure 13 shows that Reluctant participants chose probabilities for $9-$0 across the entirerange of [0.11, 0.90], with large mass points at 0.50 and 0.90. Moreover, the choices ofprobabilities are very similar between men and women.
3

0
.25
.5
.75
1
Cum
ula
tive p
roport
ion
11 20 30 40 50 60 70 80 90Chosen probability of $9−$0
Men Women
Figure 13: Cumulative proportion of choices for $9-$0 for Reluctant participants, by gender
Personality traits and the principle of care
After completing the reluctance-measure game, participants filled out a Big Five personalityquestionnaire, a Principle of Care questionnaire, and a demographics questionnaire.
The Big Five questionnaire is a set of forty-four statements. The participant indicates hislevel of agreement (from 1 to 5) with each statement, and answers from specific questionsare added to produce a score for each of the five fundamental traits that are commonlyused to characterize personality (extraversion, agreeableness, openness, neuroticism, andconscientiousness).
The Principle of Care questionnaire is a set of three questions intended to capture whethera person who engages in helping behavior does so because he has internalized a value thatone should help others, rather than because he empathizes with the recipient of his help.Participants indicate their agreement (from 1 to 5) with each of the following statements:“people should be willing to help others who are less fortunate” (principle of care 1), “these dayspeople need to look after themselves and not overly worry about others” (principle of care 2), and“personally assisting people in trouble is very important to me” (principle of care 3). Note thata higher agreement score with the second statement implies weaker endorsement of a principlethat one should help. Wilhelm and Bekkers (2010) show that responses to these questionscorrelate with various kinds of helping behavior, and are better predictors of generosity towardimpersonal, abstract recipients such as charities and anonymous observers than measures ofempathy. The authors argue that the principle of care mediates the relationship betweenempathy and generosity in these cases. It was therefore hypothesized that an internalization ofa principle that one should help when help is needed correlates with behavior in the experiment.
4

Finally, the demographics questionnaire asks for the participant’s gender, age, race, andcollege major.
To investigate a correlation between personality and a tendency to give reluctantly, Table 7shows estimates from a multinomial logistic regression of the likelihood that the participant isclassified as a given type rather than another type on gender and the Big Five personality traitscores for model (1). Model (2) adds principle of care scores as regressors. Note, as before,that comparisons involving the Generous type are underpowered due to few participants fallinginto this category.
For model (1), agreeableness and neuroticism are associated with higher odds of beingclassified as Reluctant relative to the odds of being classified as Selfish.27 This could beinterpreted as Reluctant donors sharing initially in the dictator game due to empathy towardthe recipient and a concern about negative consequences of not sharing. But when the principlesof care scores are added to the regression, agreeableness becomes an insignificant explanatoryvariable. Moreover, principles of care 1 and 2 significantly predict the likelihood of beingclassified as Reluctant relative to being classified as Selfish. This suggests that it is not empathytoward the recipient that led reluctant donors to share in the dictator game, but rather a senseof responsibility that they should give. Also, the association with neuroticism may indicatethat reluctant donors experience negative emotions from the solicitation.28
The right-most column of Table 7 shows estimates from a regression of the value of theprobability of getting $9-$0 chosen by Reluctant participants. No regressor helps to explainthe extent to which reluctant donors favored the $9-$0 option, except for openness, whichappears positively correlated with the probability (openness is linked to curiosity and embraceof unconventional ideas). I cannot offer an account for this relationship.
27Agreeableness “is most concerned with how individuals differ in their orientation toward interpersonalrelationships[...] Agreeableness is related to dispositional empathy[...] One might expect persons high inagreeableness to offer more help and aid to others, even to strangers, than do their peers.” (Baumeister and Vohs,2007.) Neuroticism “[represents] the degree to which a person experiences the world as distressing, threatening,and unsafe[...] Neurotic individuals[...] tend to feel dissatisfied with themselves and their lives[... and] are moreprone to negative emotions (e.g., anxiety, depression, anger, guilt).” (Ibid.)
28The fact that agreeableness became insignificant when the principle of care is added to the model isconsistent with Wilhelm and Bekkers (2010), who find that different kinds of helping behavior, particularlyabstract and impersonal assistance such as giving money to charity, are more strongly associated with an“internalization of a value that one should help” rather than an empathetic reaction toward the recipient, andthat empathy is mediated by the principle of care and thus loses its explanatory power when the principle ofcare is accounted for.
5

Table 7: Personality and principle of care as predictors of type and $9-$0 choice
Reluctant vs. Reluctant vs. Generous vs.Selfish Generous Selfish OLS on
(1) (2) (1) (2) (1) (2) $9-$0 choice
Woman 1.704** 1.649* 2.078 2.049 0.820 0.805 2.234(0.453) (0.455) (0.958) (0.950) (0.376) (0.374) (4.933)
Extraversion 0.967 0.966 1.032 1.026 0.937* 0.942 0.166(0.020) (0.021) (0.038) (0.037) (0.034) (0.035) (0.357)
Agreeableness 1.067** 1.026 0.953 0.946 1.120** 1.084 -0.110(0.029) (0.030) (0.046) (0.048) (0.054) (0.056) (0.529)
Conscientiousness 0.989 0.981 1.012 1.012 0.978 0.970 0.477(0.025) (0.026) (0.043) (0.043) (0.041) (0.041) (0.460)
Neuroticism 1.063** 1.054* 1.021 1.018 1.042 1.035 -0.098(0.028) (0.029) (0.044) (0.043) (0.045) (0.045) (0.441)
Openness 1.035 1.016 1.014 1.004 1.020 1.012 0.692*(0.023) (0.024) (0.038) (0.039) (0.037) (0.039) (0.406)
Principle of care 1 1.472** 1.411 1.043 -1.645(0.284) (0.456) (0.328) (3.383)
Principle of care 2 0.766** 1.452 0.528*** 2.361(0.097) (0.360) (0.130) (2.169)
Principle of care 3 1.182 1.248 0.947 4.043(0.206) (0.337) (0.254) (3.056)
Constant 0.018** 0.049 1.924 0.185 0.010* 0.265 6.755(0.031) (0.093) (5.474) (0.598) (0.027) (0.851) (32.044)
Sample size 308 308 308 308 308 308 127R2 0.045 0.092 0.045 0.092 0.045 0.092 0.074
Notes: Estimates on all except the right-most column from a multinomial logistic regression on the likelihoodthat the participant is classified as a given type vs. another type, reported as relative risk ratios with the secondtype listed in the comparison as the reference category. Model (1) includes as regressors gender and the BigFive personality scores. Model (2) adds principle of care scores. A coefficient greater (lower) than 1 implies thatthe regressor is associated with an increase (decrease) in the risk ratio. The right-most column shows estimatesfrom an OLS regression on the probability of $9-$0 selected by the participants, with observations only fromReluctant participants. R2 refers to pseudo R2 for the multinomial regression. Standard errors in parentheses.*p < 0.1; **p < 0.05; ***p < 0.01.
6

Appendix C: Proofs of theoretical propositions
Proposition 1. The equilibrium with partial pooling at non-participation exists if and only
if kγ <v(
1+√
1+4Ψ2(2v))
Ψ2(2v) .
Proof:
Let L(v) ≡ γ [pv + (1− p)v/2]. Notice that L(v) increases in v at a constant rate of γ(1−p)2 ,
while H(v) increases in v at an increasing rate of vk +γΨ(v). Then, since L(0) > H(0), vc existsin (0, 2v) if and only if L(2v) < H(2v); namely, if and only if L(v) and H(v) cross each otherover the pertinent domain. Working algebraically the last inequality obtains the necessary and
sufficient condition on the parameter values for the equilibrium to exist: kγ <v(
1+√
1+4Ψ2(2v))
Ψ2(2v) .�
Proposition 2. If kγ < 2eve−2 , then the equilibrium with partial pooling at non-participation
survives Cho and Kreps’ (1987) equilibrium domination test.
Proof:
An equilibrium survives the equilibrium domination test if, for all off-equilibrium actions, beliefsassign no positive weight to the action having been made by a type of player who could neverobtain from that action a payoff larger than her equilibrium payoff. For the purposes of thismodel, this means that the equilibrium with partial pooling at non-participation survives thetest if, for all g ∈ [0, g∗(vc)), the maximum expected utility that donor v ≡ R(g) could aspireto get by choosing g is larger than her equilibrium payoff, which is equal to U∗(vc).
The maximum expected utility donor v could obtain by making donation g occurs if g isbelieved to have been made by the most generous donor—that with, by a donor with v = 2v.Hence the equilibrium passes the test if
pγ[pv + (1− p)vc
2
]+ (1− p)
[vg∗(v)− kg∗2(v)
2+ γ2v
]> U∗(vc)
for all v ∈ [0, vc). The previous expression is equivalent to[vg∗(v)− kg∗2(v)
2+ γ2v
]> H(vc) (9)
for all v ∈ [0, vc). Notice that the left-hand side of this expression is U-shaped in v withminimum at v = kγ
e . In general—that is, regardless of whether vc is above or below kγe —the
inequality is guaranteed to hold if it holds at v = kγe and v = vc.
It is easy to see by simple substitution that equation (9) is satisfied for v = vc, sinceH(vc) + γ(2v − vc) > H(vc). Similarly, letting v = kγ
e and noting that g∗(kγe ) = γ, equation(9) becomes
kγ2(2− e)2e
+ γ2v > γ[pv + (1− p)vc
2
]which is satisfied if vc <
kγ(2−e)+(2−p)e2v(1−p)e .
1

Unfortunately, since there is no explicit solution for vc, one cannot express this restrictionpurely in terms of the parameter values. However, since existence of the equilibrium requiresthat vc < 2v, it follows that a sufficient condition for the previous inequality to hold is thatkγ(2−e)+(2−p)e2v
(1−p)e > 2v, or more simply kγ < 2eve−2 , which is expressed in terms of parameter
values only. �
Proposition 3. vc(p) increases in p ∈ (0, 1) in the equilibrium with partial pooling at non-participation if and only if kγ < 2vc(0)
2√e−1
. This condition can always be satisfied while satisfying
conditions for Proposition 1 and Proposition 2.
Proof:
Restate the indifference condition that determines vc in equilibrium as
F (vc, p) ≡ H(vc(p))− γ[pv + (1− p)vc(p)
2
]= 0
By the Implicit Function Theorem
dvcdp
= −∂F∂p
∂F∂vc
= − kγ(vc(p)− 2v)
2vc(p) + kγ(1 + p) + 2kγW0
(−e−1− vc(p)kγ
)This expression is positive if the denominator is positive; therefore, vc(p) increases in
p ∈ (0, 1) if and only if vc(p) > 12kγ
(−1− p+ 2e
−1+p2
)for all p ∈ (0, 1). The right-hand side
of the inequality is decreasing in p ∈ [0, 1], therefore the inequality holds for all p ∈ (0, 1) if andonly if it holds for p = 0; namely, if and only if kγ < 2Vc(0)
2√e−1
.
To see that this condition can always be satisfied while satisfying conditions for Proposition1 and Proposition 2, notice that the indifference equation that defines vc (Equation (8)) can berewritten as
V c(p) =1
2
[−kγ(1 + p) +
√kγ [8pv + kγ ((1 + p)2 + 4Ψ2(vc(p)))]
]which for p = 0 becomes
vc(0) =1
2kγ[−1 +
√1 + 4Ψ2(vc(0))
]vc(0) does not depend on v. Therefore, one can choose k, γ appropriately to satisfy
kγ < 2Vc(0)2√e−1
, and then, sincev(
1+√
1+4Ψ2(2v))
Ψ2(2v) and 2eve−2 both increase in v, choose a large
enough v to guarantee that Proposition 1 and Proposition 2 hold. �
2