religious teachings as an agent of development: …...religious teachings affect women’s marital...
TRANSCRIPT

Interim Report for Institutional Roles of Marriage in the Developing World: Empirical Studies from thePerspectives of Gender Empowerment, IDE-JETRO, 2014
Religious Teachings as an Agent of Development: Evidencefrom Early Marriage and Polygamy in Malawi†
Yuya Kudo*
March 2014
Abstract
Using individual-level data provided by the Demographic and Health Survey (2000, 2004,
2010) merged by GPS-based coordinates with community-level data sourced from the Inte-
grated Household Survey (2010-2011) in Malawi, this paper asks the question of whether
religious teachings affect women’s marital practices. To address endogeneity associated with
an individual’s religious affiliation, the analysis takes an instrumental variable (IV) approach
by exploiting a unique setting of the Christian mission, which dates back to the late 19th cen-
tury. Being exposed to the mission, measured by geographical distance (km) to the influential
station, Livingstonia, enabled the indigenous population to gradually convert to Christianity
when they were not the Yao, an ethnic group that was proselytized into Islam because of their
ivory and slave trades with the Arabs that had existed prior to the arrival of the mission. The
IV approach shows that the religious affiliation cannot always be taken as exogenous in an em-
pirical analysis. Using the distance-ethnicity (non-Yao) interaction as an IV for the religious
distribution of the current generation with a control of ethnicity-level historical covariates (e.g.,
slave exports, access to railway networks) and abundance of community-level local conditions
(e.g., geography, climate) or community-fixed effects, this study finds that compared to those
practicing the other religions (Islam and other) or no religion, Christian females are more
likely to postpone their marriage by 1-3 years with less likelihood of engaging in polygynous
relationship by approximately 30 percentage points. Formal educational attainment, fear of
HIV infection, and religion-based segmentation in both the marriage and labor markets are
less likely to explain the religious effects. While it is difficult to completely rule out alternative
mechanisms, these findings are consistent with the view that religious education plays a role.
Keywords: Culture, Education, Gender, Marriage, Mission, Religion
JEL classification: I25, J12, N37, Z12, Z13†I thank Marc Bellemare, James Fenske, Yoshihiro Hashiguchi, Dorothy Nampota, Tsutomu Takane, Shinichi
Takeuchi, and participants at the NEUDC Conference (Harvard, 2013) for insightful comments and suggestions.Financial support from the IDE-JETRO for my field trip to Machinga, Mulanje, and Zomba is gratefully acknowl-edged. My great thanks in the field trip go to McDonald Chitekwe, James Mkandawire (Invest in KnowledgeInitiative), and respondents in the survey. The findings, interpretations, and conclusions expressed in this paper areentirely those of the author and do not represent the views of the IDE-JETRO. This version is an interim report ofthe IDE-JETRO funded research project. Please do not quote this version without permission of the author.
*Institute of Developing Economies (IDE-JETRO), 3-2-2 Wakaba, Mihama-ku, Chiba-shi, Chiba 261-8545, Japan,Yuya [email protected], +81-43-299-9697.
1

Interim Report for Institutional Roles of Marriage in the Developing World: Empirical Studies from thePerspectives of Gender Empowerment, IDE-JETRO, 2014
1 Introduction
During the recent decade, many political efforts have been expended to put religious forces and
institutions on development agenda (Haar and Ellis (2006)). For instance, UNDP (2004) lists
religion (in parallel to ethnicity) as sources of cultural diversity and sees the cultural liberty as a
vital part of human development.1 In addition, Commission for Africa (2005) (p.31; pp.127-129)
highlights the potential of religion, which provides both the material and spiritual services, to play
a positive role in the development process on this continent, referring to the fact that non-state
organizations having an explicit religious basis often take much responsibility for offering welfare
services (e.g., education, health). The UK Department for International Development (DFID) also
financed a series of multi-million-pound comparative research that the Religions and Development
Research Programme Consortium undertook between 2005 and 2010.2 This trend seemingly builds
on the political society’s firm belief that by understanding socio-economic roles played by religion,
one may remove political aspects from the dimension as well as design effective policy tools that
exploit and/or change its economic impacts on the economy. In fact, religious denomination
typically carries attitudes, values, skills, and knowledge of its own, such as asceticism (or austerity,
thrift), diligence, fidelity, honesty, work ethic, and absenteeism from sinful activities (e.g., drug,
alcohol). The followers can acquire those intellectual resources from relevant actors (e.g., parent,
priest, sheikh) in various circumstances (e.g., church, mosque, madrasa). Provided that the lifelong
learning process alters people’s assessment about the material world, it is certainly possible that
religious instruction has economic consequences.
In contrast to the recent resilience, however, an international society traditionally excluded
consideration of religion in formulating policies towards developing countries. One reason for the
lack of the prior discussions may be that religion was regarded as irrelevant to the development
process.3 Related to this point, Lewis (1955) provided deliberate discussions about the relationship
between religion and economic development. According to him, while some religious codes are more
compatible with economic growth than others, the causal relationship is not always explicit. In
particular, he notes not only that people are prone to ignoring religious precepts that conflict with
their economic interest but also that religious doctrines often change as social conditions change
(pp.103-104). In addition to his thoughtful observations, people also tend to show veneration
for their ancestors as well as for religious authority in the developing world. In Africa whereby
1Ethnicity is another important social fabric in the developing world and evidence has increasingly emergedshowing the relationship between ethnic diversity and economic development at both the macro- (e.g., Alesina et al.(2003); Alesina and Ferrara (2005); Easterly and Levine (1997)) and micro-levels (e.g., Barr and Oduro (2002);Michalopoulos and Papaioannou (2013); Miguel and Gugerty (2005)).
2See http://r4d.dfid.gov.uk/Project/3896/ and http://www.religionsanddevelopment.org/index.php?
section=10#mod 58 for the details.3Another reason may be that religion is politically sensitive.
2

Interim Report for Institutional Roles of Marriage in the Developing World: Empirical Studies from thePerspectives of Gender Empowerment, IDE-JETRO, 2014
syncretism often abounds, it is not uncommon that few people devote themselves to all of one
religion. All these considerations yield skepticism against the idea that religion has an independent
effect in shaping socio-economic behavior.
While several empirical attempts have been made to test if religion causally affects economic
development (e.g., Barro and McCleary (2005); McCleary and Barro (2006); Noland (2005)), it
seems that general agreement about the relationship has not yet been obtained. As indicated in
the previous literature (Aldashev and Platteau (2014); de Jong (2011)), the ambiguity is in part
attributed to difficulty in establishing a solid empirical strategy to identify the causal effects as
well as the lack of theoretical understandings behind the identified impacts. By paying careful
attention to these two issues, the current study attempts not only to fill the knowledge gap but
also to inform the public of the potential of religion as development forces.
Broadly speaking, two considerations may be given to the theoretical channels through which
religion causes economic or social changes; firstly, religion can function as an institutional constraint
that affects an individual’s decision-making. Secondly, it alters people’s perceptions about values
and beliefs attached to the material world (i.e., preferences), which in turn changes their choices.
Focusing on the second mechanism, specifically, this study asks the question of whether religious
teachings affect women’s marital practices in Malawi, namely age at marriage and an entry into
polygynous relationship. This decision stems from several reasons. Firstly, as religious doctrine
often includes marriage-related contents, it is quite likely that religious education produces the
stock of knowledge or beliefs relevant to marriage conducts among the adherents, which actually
characterizes women’s marital behavior. Secondly, based on a short questionnaire-based survey
that the author conducted in rural Malawi, some of the respondents indeed had own understand-
ings about those practices from the religious standpoint.4 For example, whether the respondents
were Christian or Muslim, they usually perceived that Christianity prohibited polygyny but Islam
did not. In addition, part of both Christian and Muslim respondents also remarked that religion
provided them with some sort of moral guidance about sexual behavior and appropriate age at
4In order to examine people’s perception about marital practices, inheritance practices, and the relationshipbetween those practices and religious beliefs, the author conducted a short questionnaire-based survey in threedistricts (Machinga, Mulanje, and Zomba) in southern Malawi in 2013. After obtaining the village list from therespective district council, in this survey, the author randomly selected at least one village from each district,resulting in five villages surveyed in all those three districts. In each village, two to five residents were interviewedand each of those interviews required approximately one hour to one hour and a half for the completion. In orderto ensure confidentiality as well as to increase data reliability, the interviews were conducted in an environmentwhere the respondent was alone with the author and the research assistant (for translation to Chewa). While theinterviewed respondents were not randomly selected because of the author’s limited resources (i.e., conveniencesampling) and so it is difficult for the current study to generalize the findings from the field interviews, the surveyeventually reached eight male and 12 female adult respondents. Among the respondents covering four ethnic groups(Lomwe, Ngoni, Nyanja, and Yao), 11 respondents were Muslim and nine were Christian. The author plans toimplement a similar survey in northern districts in 2014.
3

Interim Report for Institutional Roles of Marriage in the Developing World: Empirical Studies from thePerspectives of Gender Empowerment, IDE-JETRO, 2014
marriage, probably due to the spread of HIV/AIDS (Trinitapoli and Weinreb (2012)), complication
of delivery associated with physical immaturity, or social understandings about economic roles of
females. These pieces of background information demonstrate understandable reasons to expect
that by generating intellectual or spiritual capability pertaining to those marital conducts, reli-
gious teachings may indeed affect women’s marital behavior. Thirdly, while some marriage-related
practices against women’s human rights (e.g., child marriage, female circumcision, polygamy) are
often discussed in association with religious beliefs, it is not clear whether they are indeed the
consequence of religious teachings or some other mechanisms drive them in the name of religion.5
From the perspective of female human rights, the question should also deserve investigating.
In order to estimate impacts of religious education on women’s marital practices, this paper uses
repeated cross-sectional data drawn from the Malawi Demographic and Health Surveys (MDHS)
2000, 2004 and 2010. The data contains a variety of information pertaining to marriage, fertility,
family planning, reproductive health, child health, and HIV/AIDS at the individual level. This
makes the MDHS data highly valuable resource for an empirical study. The selection of the country
also fits the purpose of the current study for two reasons. Firstly, the MDHS data set contains
a good variation of females that practiced Christianity, Islam, other or no religions that is useful
in an empirical analysis. As reported in Table 1, in the data set, approximately 85.9% of the
sample females believed some Christianity, in contrast to about 13.0% and 1.0% of Islam and
other/no religions, respectively.6 In addition, this country’s experience of the Christian mission
(Livingstonia Mission) produces a quasi-experimental setting that helps identify the causal impacts
of interest.
This study will take two steps to meet the research objectives. Firstly, it is attempted to
show that an individual’s religious affiliation has causal influence on marital practices, because
the MDHS data set does not provide a direct measure of religious education acquired by the
respondents. Consequently, in the second step, it will be needed to make every effort to exclude
alternative mechanisms that prevent this study from interpreting the identified religious effects as
impacts of religious teachings.
Regarding the first-step exercise, the descriptive analysis presented in this paper will reveal a
statistically significant association between Christianity and women’s marital practices. However,
this relationship cannot simply be taken as evidence supporting causality from religion to the
5In some societies, female circumcision is seen as a rite of passage into womanhood (e.g., Oloo et al. (2011)). Insome of such societies, females are not allowed to get married unless they go for the circumcision.
6In Table 1, the proportion is unweighted. In order to calculate the true proportion of the entire populationfrom the sample data, appropriate sample weights need to be used. However the weighting may not significantlyaffect the overall picture. For example, based on the recent estimate in 2010 provided by Pew Forum on Religion &Public Life (http://features.pewforum.org/global-christianity/total-population-percentage.php), approxi-mately 82.7% of the total population was Christian in Malawi, which is very close to the unweighted proportionobserved in the MDHS data.
4

Interim Report for Institutional Roles of Marriage in the Developing World: Empirical Studies from thePerspectives of Gender Empowerment, IDE-JETRO, 2014
marital outcomes. This is because the current Christianity’s supremacy in this country has its origin
in the Christian mission in the late 19th and early 20th centuries that preceded the colonization
periods and consequently, the religious distribution of the current generation may be correlated
with the mission’s decision to establish the work stations. If the determinants of the locational
choices have long-term independent influence on women’s marital practices, this will bias the
estimates of interest.
To address this potential endogeneity, two strategies will be taken in this paper. The first
approach attempts to control for as many determinants as possible. Several key factors such as
access to clean water as well as disease-preventing low temperature and high altitude are often indi-
cated as the missionaries’ consideration in Johnson (1967) and elsewhere (e.g., Nunn (2010); Nunn
(forthcoming)). As it appears that those items are primarily characterized by local geographic and
climate conditions, an attempt will be made to control for them. In the attempt, as no such data
is available in the MDHS, ample community-level information on the geography and climate will
be taken from another survey of the third Integrated Household Survey (IHS) 2010-2011. Using
the GPS-based coordinates provided by both the surveys, this exercise will be made by identifying
an IHS community located in the closest proximity to a community surveyed in the MDHS.
The second approach will address the endogeneity problem by taking an instrumental variable
(IV) strategy. This study notes that Christianity was less appealing to the Yao, an ethnic group
that were proselytized into Islam due to their ivory and slave trades with the Arabs that had existed
before the arrival of the mission. Then, a MDHS community’s distance to the mission’s influential
station, Livingstonia, interacted with an indicator variable for non-Yao ethnic groups will be used
as an instrument for an individual’s religious affiliation. One advantage of this instrument enables
this study to use it to identify the religious effects even with a control of community-level fixed
effects. Compared to the OLS estimations, the IV approach will considerably alter the estimates of
interest, although the fundamental implications remain unchanged. A discussion about the possible
factors that might have confounded the OLS estimates will be made, followed by three separate
falsification tests to check the exclusion restriction of the instrument. Using population data in
the early 20th century, one of those tests attempts to see if within the non-Yao ethnic groups,
the distance to Livingstonia was associated with the outcomes of interest, proxied by population
density, in the periods before the missionary contacts.
After showing the religious effects on women’s marital practices, then, the analysis will turn to
the question of whether receiving religious teachings is indeed a source of the identified religious
effects. This study aims at achieving this goal by excluding major alternative mechanisms that
might explain the impacts. Given evidently significant educational facilitation provided by the
mission, it will be checked whether an individual’s educational attainment can fully account for
5

Interim Report for Institutional Roles of Marriage in the Developing World: Empirical Studies from thePerspectives of Gender Empowerment, IDE-JETRO, 2014
the religious effects. This paper will also explore whether an individual’s fear of HIV infection as
well as religion-based segmentation in both the marriage and labor markets drives the religious
effects.
This study contributes to many strands of the extant literature. First of all, within the field
of economics, not many empirical studies have explored the relationship between religion and
economic outcomes (e.g., Barro and McCleary (2005); McCleary and Barro (2006); Noland (2005)),
and the causal relationship is not always explicit. In addition, most of those studies were typically
based on the cross-country comparison or the analysis at the sub-national level and consequently,
micro evidence from within countries is highly scarce. Even in case of studies using micro-level data,
most of them investigate the role of religion in high-income countries (e.g., Dehejia et al. (2007)).
In contrast to those studies, by using large-scale micro-level data collected within a low-income
country, this study will attempt to identify causal effects of an individual’s religious affiliation in a
rigorous manner. Using an individual as a unit of observations allows this study to directly evaluate
impacts of religious values that are internal to individuals and facilitated by religious education.
The in-depth within-country nature of the analysis also helps disentangle the complexity between
religion and socio-economic environment, which is usually difficult in macro-level studies.
As already noted above, secondly, two sets of explanations may broadly be given to theoretical
mechanisms that link religious forces to people’s decision making; one emphasizes institutional
aspects of religion and the other focuses on direct influence of religious beliefs or teachings on an
individual’s preferences. Regarding the institutional role, for example, it has been studied that
religious organizations provide public goods such as social insurance (Chen (2010); Dehejia et al.
(2007); Hungerman (2005); Scheve and Stasavage (2006)) and educational services (Botticini and
Eckstein (2005, 2007)) as well as club goods that induce social cooperation among group members
(Berman (2000); Levy and Razin (2012, forthcoming)). From the preference perspective, several at-
tempts have been made to explore the relationship between religion and people’s attitudes towards
political participation (Gerber et al. (2010)); religiously prohibited activities (Carvalho (2013);
Gruber and Hungerman (2008)); work ethic (Arrunada (2010)); women’s social role (Clinging-
smith et al. (2009); Guiso et al. (2003)); government, legal rules, and the market economy (Guiso
et al. (2003)); and equality and harmony among ethnic groups (Clingingsmith et al. (2009)). By
adding a new piece of empirical evidence from attitudes towards marital conducts, the current
research will contribute to this second line of research.7
7More generally, there has been a recent effort made by economists to better understand the role played by culture,norms, and beliefs in an individual’s decision making (e.g., Greif (1994); Benabou and Tirole (2006); Fernandez(2011); Luttmer and Singhal (2011); Fernandez (2013); Henrich et al. (forthcoming)) as well as intergenerationaltransmission of such cultural values (Bisin and Verdier (2001); Dohmen et al. (2011); Alesina et al. (2013); Ciprianiet al. (2013); Farre and Vella (2013); Zumbuehl et al. (2013)). By adding a new piece of empirical evidence fromthe religious perspective, the current study will also make contribution to this rapidly growing body of research.
6

Interim Report for Institutional Roles of Marriage in the Developing World: Empirical Studies from thePerspectives of Gender Empowerment, IDE-JETRO, 2014
Moreover, this study can also be seen as one of few empirical studies exploring determinants of
early marriage and polygamy in the developing world. In addition to roles played by a mother’s
intra-household bargaining power (e.g., Luke and Munshi (2011)) and external labor market op-
portunities available to females (e.g., Jensen (2012)) in explaining the age at marriage as well as
roles of women’s agricultural productivity (e.g., Jacoby (1995)) and historical events (e.g., Fenske
(2012); Dalton and Leung (forthcoming)) in accounting for the prevalence of polygamy, this study
underscores the contribution of religious teachings to those practices.
Finally, the research showing that historic events and the associated social institutions have
long-term impacts on development has recently been growing (e.g., Acemoglu et al. (2001); Ace-
moglu et al. (2002); Nunn (2008); Cantoni and Yuchtman (2012)). In the context of the current
study, for example, with careful attention given to the endogeneity, Gallego and Woodberry (2010)
and Nunn (forthcoming), by using region- and individual-level data sets, respectively, estimated
lasting impacts of the Protestant and Catholic missions on educational promotion in colonial Africa.
In addition to the reduced-form effects of the Christian mission on formation of women’s marital
relationship, the IV approach used in the current study will also reveal the influence of religious
conversion itself that was prompted by the mission. However, due to the lack of an adequate
number of good instruments, this study will not be able to disentangle the Christianity effects,
although the previous studies often emphasized differing influence of the Protestant and Catholic
missions on the level of economic development today (e.g., Weber (1958)).8
This paper is organized in seven sections. To find a clue to make a polished identification
strategy, Section 2 provides a historical overview of the Livingstonia Mission, highlighting the
manner in which the mission established the central station in Malawi as well as that of the mass
conversion of the Yao to Islam. The identification strategy is discussed in Section 3, followed by
data overview given in Section 4. The main findings of this paper are presented in Section 5.
Section 6 discusses several mechanisms that may prevent this study from interpreting a source
of the identified religious effects as religious teachings, with concluding remarks summarized in
Section 7.
8For example, using province-level data that covered 17 sub-Saharan African countries, Gallego and Woodberry(2010) found that the Protestant missionary activities had larger long-term impacts on educational attainment, incontrast to the Catholic mission contributing less to increasing the level of schooling today. They also extended theanalysis to argue that the Protestant missionary effects were mainly observed in Catholic areas, whereby Catholicmissionaries occupied a sort of ‘monopolistic position’ in a religious market due to protection provided formercolonial governments, and therefore in order to gain converts, the Protestant missionaries had to be efficient enoughto overcome their institutional disadvantage. In addition, using 2005 Afrobarometer data covering 17 sub-SaharanAfrican countries, Nunn (forthcoming) also found long-run positive influence of both the Catholic and Protestantmissions on the present education level as well as that the Protestant effects reduced the gender gap, whereas theCatholic mission increased it.
7

Interim Report for Institutional Roles of Marriage in the Developing World: Empirical Studies from thePerspectives of Gender Empowerment, IDE-JETRO, 2014
2 Historical background
The Livingstonia Mission of the Free Church of Scotland was founded in 1875 and has long been
recognized as one of the most important missions that introduced Christianity into Malawi (more
generally, Central Africa) in the late 19th century.
As explained in subsection 3.1.2, this study uses a community’s distance from the influential
station, Livingstonia (also known as Khondowe), as an instrumental variable for an individual’s
affiliation with Christianity in present days. This strategy will be taken by assuming that those who
live long distance away from Livingstonia are less likely to be Christian because their ancestors that
passed the religious beliefs over to the offspring must have been less exposed to Christian tenets.
In practice, the distance will be interacted by an indicator variable for non-Yao ethnic groups, as
the Yao are predominantly Muslim due to strong alliance of their ancestors with the Arabs that
existed prior to the arrival of the mission. Largely sourced from Pike (1968), McCracken (1977),
and Msiska (1995), this section attempts to outline the history of the mission with a particular
emphasis placed on their settlement pattern as well as the Yao’s conversion to Islam. Further
historic accounts can be found in more detail in those literature sources and elsewhere (e.g., Pike
(1965), Kalinga (1985), Thompson (1995)).
2.1 Livingstonia Mission
David Livingstone (1813-1873), one of the most outstanding explorers that made a transconti-
nental journey across Africa during the middle years of the 19th century, laid the groundwork
for the mission that was named ‘Livingstonia’ in honor of Livingstone. Sponsored by the British
government, the Scottish missionary headed ‘Zambezi expedition’ between the years of 1858 and
1863 that aimed to catalogue natural resources of the Zambezi River area as well as to identify
trade routes needed for transporting raw materials from the African interior to coastal trading
points that could eventually be sold on a British market. The opening of the African continent to
a world economy and the promotion of local commercial activities were believed to contribute to
uprooting the African slave trade by creating ‘legitimate’ trade of products (e.g., cotton, ivory),
whereby Africans did not have to sell their own people to obtain guns, gun-powder and cloth that
they desired. The expedition was also greatly motivated by Livingstone’s zeal for cutting off the
slave trade and bringing Christianity and civilization into the heathens. He also urged the culti-
vation of cotton (and other crops) in the unexplored territory to make the missionary activities
self-supporting as well as to bypass the slave-owning American states from which most of Britain’s
raw cotton came.
In this expedition, he reached conclusions that the only practicable means of linking the interior
8

Interim Report for Institutional Roles of Marriage in the Developing World: Empirical Studies from thePerspectives of Gender Empowerment, IDE-JETRO, 2014
with the coast was to take a deep-water route from the Shire River to Lake Malawi by steamer and
that the Shire Highlands, a plateau in southern Malawi, was a suitable area for white settlement
as well as for the creation of a cash-crop economy.910 However, his statements were shortly
censured by James Stewart (1831-1905), a devout adherent of Livingstone’s model of an ‘industrial
mission’, that in order to realize an agricultural and Christian settlement, traveled to the Shire
Highlands in 1861. Stewart made the harsh criticism, because as opposed to indication provided by
Livingstone, in the journey, he saw no expected commercial benefits obtained from the settlement
in the region and discovered that the Zambezi-Shire route was shallow and difficult to navigate by
steamship.11 Concurrently, the Universities’ Mission to Central Africa (UMCA), which had been
founded inspired by Livingstone’s speeches made at Cambridge and Oxford in 1857 and set up the
station at Magomero between modern Zomba and Blantyre in 1861, made a decision to evacuate
the work center to Zanzibar in 1862.12 A few months later, the British government determined to
withdraw the Zambedzi expedition that had lasted six years, and many at the time commented
that it was a failure with none of its purposes fulfilled.13
After ten-year ignorance shown by the Free Church and other societies about the Livingstone’s
proposals, Stewart, now the head of Lovedale Institution in South Africa, drew up a memorandum
on ‘Livingstonia, Central Africa’ after his return to Scotland in 1874.14 To some extent ironically, he
presented the essence to the General Assembly of the Free Church that as suggested by Livingstone,
the southern end of Lake Malawi could be reached from the coast by waterway via the mouth of
the Zambezi to the Shire and that Lovedale could be an operational base of a new mission.15 In
9Livingstone rejected the overland route from the south because of the presence of tsetse fly in the Zambezivalley and his expectation that the enormous amount of capital required to build railways would not be raisedoutside the boundaries of a European colony. Initially, he had an opinion that the best route to reach the interiorlay along the Rovuma (Ruvuma) River. On the investigation, however, it became clear that this route did not meethis anticipation, and in May 1861, the Livingstone’s party returned to Zambezi to follow the Shire route.
10To Livingstone, it seemed that the region had laid the foundations of the successful cash-crop economy, ascotton of good quality was already cultivated in many villages in the region.
11In contrast to Livingstone’s view described in footnote 10, when Stewart arrived at the highlands, he foundthat no cotton was produced in the region and that such slow and primitive methods of spinning were exploited.Nevertheless, even after the recall of the expedition ordered by the British government, Livingstone still insisted onthe importance and practicability of introducing small colonies into the region, deploring that the cotton productionwas not in full swing at the moment of Stewart’s visit.
12UMCA (1857-1965) was a missionary society established by members of the Anglican Church within the uni-versities of Cambridge, Dublin, Durham and Oxford.
13Up to the 1860’s, Livingstone’s concept of the industrial mission was closely allied with one important schoolof the government opinion. For example, Livingstone’s scheme received a considerable amount of financial supportfrom the government under the patronage of Henry John Temple, 3rd Viscount Palmerston (1784-1865) that severedas the Prime Minister. However, Stewart’s criticism, together with the other failures of ‘East Africa expedition’ andthe ‘Niger expedition’ as well as Palmerston’s death, rapidly changed official views of the government about theLivingstone’s theory.
14Lovedale was a mission station and educational institute established in Cape Province, South Africa.15At that time, Stewart was eager to develop a new inland mission station that might work as a satellite for
Lovedale.
9

Interim Report for Institutional Roles of Marriage in the Developing World: Empirical Studies from thePerspectives of Gender Empowerment, IDE-JETRO, 2014
response to his presentation, the Free Church authorities decided to found the Livingstonia Mission
that (at the start-up) was largely financed and administered by a small group of philanthropic
industrialists, most of them had the operational base in Glasgow (e.g., James Stevenson).1617
At this moment, Livingstone’s ‘Commerce and Christianity’ theory was to be put into action by
well-qualified people for the first time in its history.18
In 1875, the Livingstonia Mission established the central station at Cape Maclear (see Figure
1), a hilly promontory at the south end of Lake Malawi, that severed as a good port for the
mission steamer. Based on a ‘residential’ mission policy, by which it was desired that Africans
be raised in mission sites isolated from ‘temptations’ of their own society, the mission attracted
a couple of groups to the site (e.g., freed slaves returning to their homeland, a local chief’s son
sent to acquire a Western education, refugees defiant of the authority of local rulers). However,
the settlement expansion revealed several issues such as shortage of sanitation facilities and the
mission’s insufficient ability to feed the settlers as well as to regulate their behaviors in many spheres
of social life (e.g., violence, theft, Sunday meetings, beer drinking, polygamy).19 Moreover, it was
soon evident that the mission station was nearly useless, because with a great distance away from
the nearest villages, it was situated on the edge of barren and tsetse-infested plains unfriendly
to animal life, whereby fertile land needed for cotton production was also almost absent. These
unfavorable environments made the pioneer party decide to move the central station to Bandawe,
halfway up the west coast of Lake Malawi, in 1881.20 Consequently, the years spent by the
missionaries at Cape Maclear were seen as a period of adjustment that accustomed themselves to
the realities of the African situation.
The relocation to Bandawe was a milestone in the history of the Livingstonia Mission for several
reasons. Firstly, it showed the mission’s intention to shift the whole axis of the activities to the
Northern Province. Such a switch of attention partly stemmed from a proposal made by James
Stevenson, one of directors of the African Lakes Company (ALC) at that time, a trading body
formed by the aforementioned Glasgow industrialists, to build a road between Lake Malawi and
16Until the early 20th century, the mission had to rely for much financial support on the Glasgow businessmenthat discerned the economic potential of the Lake Malawi, rather than on the Free Church official funds.
17James Stevenson, a chemical manufacturer, viewed the mission as one among several instruments of change tointegrate East Central Africa into a world economy. He believed that the mission would not succeed in making theagricultural settlement unless legitimate trade was, by reducing transportation costs of the products, introduced intothe region as well as adequate commercial enterprises that exploited the arbitrage opportunities were established.Accordingly, he contributed to founding a trading company, ‘The Livingstonia Central Africa Company’, in 1878that was a predecessor of the ‘African Lakes Company (ALC).’
18At the outset, the leadership of the mission was vested in the hands of E. D. Young, a navy officer that hadbeen seconded to Livingstone’s Zambezi expedition, as Stewart could not join the Livingstonia Mission due to hiscommitments at Lovedale. After Young’s immediate leave from the Malawi region in 1877, Robert Law (1851-1934),a Scottish missionary, headed the mission for more than 50 years.
19The early settlers were given food supplies until they could grow their own crops.20The missionaries’ departure immediately weakened their influence on the promontory.
10

Interim Report for Institutional Roles of Marriage in the Developing World: Empirical Studies from thePerspectives of Gender Empowerment, IDE-JETRO, 2014
Lake Tanganyika that enabled the ALC to distribute commercial products to a wide inland area
as well as to work in close co-operation with the missionaries.21 Secondly, the mission abandoned
the previously employed residential policy and alternatively decided to act on the village level with
only a small residential element. The exploratory and evangelistic visits to neighboring villages
made under the new strategy helped the missionaries considerably extend their Christian and
educational influence outside the settlement place. Thirdly, in the early stage of the Livingstonia
Mission, in the absence of any local authority, the missionaries often exercised civil powers to
impose discipline on the settlers as well as to counter a rash of crimes (e.g., thefts) occurring in the
vicinity of the settlement. Similarly, the mission was frequently required by indigenous headmen
to involve in the native disputes as an authoritative third party. At Bandawe, however, it was
strongly recommended that the missionaries should reject their involvement in local politics.2223
Despite the landmark nature of the move to Bandawe, however, both the missionaries and the
Foreign Missions Committee of the Free Church at home regarded the location as a provisional
outstation until another better site was found.24 Several issues accounted for this negative enthu-
siasm shared among them. First of all, the low-lying site on the lake shore seemed malarial due
to the near proximity to swamps and marshes. In addition, its susceptibility to a blow and no
protection from the waves made the site inadequate as a harbor of the mission’s steamship. While
the missionary activities at Bandawe made an unparalleled achievement in East or Central Africa
in this period, in 1894, the mission eventually decided to re-move the central station to further
north, Khondowe, that later developed into a small town now known as Livingstonia. The new site
lay on the highlands between Lake Malawi and Nyika Plateau and was not prone to mosquitoes
carrying malaria.
Under the directorship vested in the hands of a Scottish missionary, Robert Laws (1851-1934),
at Livingstonia (Khondowe), the mission contributed much to providing educational facilities and
services at both the primary and post-primary levels. In particular, the Overtoun Institution
21Stevenson also demanded that both the Livingstonia and the London Missionary Society should establish thestations near the south and north end of the road, respectively.
22This policy change may partly be attributed to the Blantyre Mission that the Church of Scotland set up in1876. At the central station, Blantyre, the missionaries often imposed harsh punishments (e.g., flogging, lashing)on the settlers in the name of civil jurisdiction, which received wide publicity in the British press. To avoid theintervention of the British government and risk of being exposed to the torch of publicity, the Livingstonia Missiondecided to abstain from its involvement in civil administration and discard much of their colonial apparatus. Onthe other hand, the Blantyre Mission still retained powers of jurisdiction.
23In 1911, the Livingstonia and Blantyre Synods agreed to join together to form the Church of Central Africa,Presbyterian (CCAP).
24The representatives of the Foreign Missions Committee and the Glasgow Livingstonia Committee formed a jointsub-committee of the Livingstonia Mission. While this sub-committee was nominally subordinate to the ForeignMissions Committee, in reality, it dealt with everything related to the Livingstonia’s affairs. The activities wereprimarily managed by the aforementioned Glasgow businessmen, and James Stevenson was one of the committeemembers that had the power of vetoing issues.
11

Interim Report for Institutional Roles of Marriage in the Developing World: Empirical Studies from thePerspectives of Gender Empowerment, IDE-JETRO, 2014
founded at the new site, a training center of post-primary education, supplied a great amount
of skilled labor (e.g., clerks, typists, telegraphists, mechanics) not only to European-controlled
economy of the Northern Province but also to other parts of South and Central Africa (e.g.,
Tanganyika, Northern Rhodesia).2526 The educational expansion was followed by the widespread
adoption of evangelical Christianity, and a significant improvement in the evangelist techniques
(e.g., use mission-educated natives as evangelists) enabled Christianity to spread as a genuinely
popular movement from the mid-1890s. On the long-term venture set about 20 years earlier at
Cape Maclear, the mission finally established the solid base of its activities at Livingstonia, and a
great movement towards Christianity began in northern Malawi.27
2.2 The spread of Islam among the Yao
The Yao people are a major ethnic group primarily settling at the southern end of Lake Malawi.
They originally inhabited in northern Mozambique, and after the attack launched by the Makua
people, in about 1830, they migrated from their traditional home to present-day Malawi and
Tanzania, which shaped the current distribution of the populations (See Figure A.2 for the recent
spatial distribution of linguistic groups). The Yao are predominantly Muslim and indeed, Table 1
using the pooled data set of 2000, 2004 and 2010 MDHS reports that 76% of the interviewed Yao
females had Islamic faith.
Historically, the Yao were under considerable Islamic Influence because of their allies with the
Arabs in the caravan trade through which the east coast was linked to markets in the African
interior. For example, it was observed that by the middle years of the 18th century, the Yao
caravan came to Kilwa, a great Arab port, to trade with the Arabs (Pike (1968), pp.58-59). The
Yao-Arab relationship was that of a senior and a junior business partner, whereby the Arabs learnt
of the interior of Africa from the Yao that in turn traded beads, cloth, guns and gun-powder for
ivory, tobacco, and slaves.
25In the absence of significant commercial opportunities in the Northern Province, the Livingstonia elites oftenmigrated to seek for wage jobs provided in other areas. This played a crucial role in creating the migrant laborsystem that was a central feature of Malawi’s colonial economy.
26In the field of education, the institution occupied the preeminent position until the counterpart institutes werefounded elsewhere, e.g., the Henry Henderson Institute at Blantyre in 1909 and the Kafue Training Institute inNorthern Rhodesia in 1918.
27Thus, this paper conceptually regarded the ‘north’ as an important Christian center and attempted to use acommunity’s distance from the area as an instrumental variable. In practically measuring the distance from the‘north’, Livingstonia (Khondowe) was selected as the epicenter. However, the author does not intend to meanthat the site was the only place of importance. Rather, the location was selected as it is a symbolic place ofthe Livingstonia Mission. Similarly, the author does not necessarily mean to disregard other missions and theassociated places of importance in the central and southern regions (e.g., Nkhoma Synod of the CCAP, BlantyreMission, Zambezi Industrial Mission). Nevertheless, as shown in the subsequent analysis, it seemed that the distancefrom Livingstonia worked quite well as the instrument.
12

Interim Report for Institutional Roles of Marriage in the Developing World: Empirical Studies from thePerspectives of Gender Empowerment, IDE-JETRO, 2014
While the Yao had maintained the relationship with the Arab traders, at latest, since the early
18th century, it was not until 1870s-90s that the rapid expansion of Islam among the Yao became
apparent (Pike (1968), p.69; Msiska (1995), p.52). It was believed that several factors contributed
to the mass conversion of the Yao. Firstly, powerful Yao chiefs (e.g., Makanjira, Mponda) adopted
Islam to strengthen their economic ties with the Arab trading partners and using the commercial
prowess, to command the subjects’ loyalty. The chiefs’ conversion was typically followed by that
of their subjects. Secondly, after the arrival of the Christian mission, Islam provided a more
acceptable solution to the Yao’s cultural requirements for several reasons than Christianity did.
For example, the Islamic faith did not interfere with the Yao’s traditional customs and social
institutions such as polygamy and partial circumcision. In addition, in the Yao society, slave labor
was a fundamental feature and the chiefs needed slaves not only for selling them on an export
market but also using them for domestic physical labor (e.g., farming, building, making baskets,
sewing garments). Thus, it was not surprising that Christianity attempting to stop the slave trades
lost the battle to entice the Yao into its religious domain. Another reason for the conversion may
be attributed to the Yao’s ongoing clashes with the Ngoni people, another powerful group that
migrated from the Natal region of present-day South Africa. For fear of raids made by the Ngoni
on their territories, by adopting Islam, the Yao chiefs attempted to make tactical alliance with the
Arab traders that supplied flintlocks and Enfield rifles.28
3 Empirical strategy
As explained in Section 4, the primary data used in this study comes from the Malawi Demographic
and Health Survey (MDHS) that aimed to collect representative data on population, health, and
nutrition of females of reproductive age (15-49). The current study reports the estimation results
of two marital outcomes, namely age at marriage (years) and a dummy variable equal to one if the
marriage-type is polygyny and zero otherwise.
For a female i living in a community j that were currently in the first marital union, this study
28In fact, in the literature, much more reasons are indicated for the spread of Islamic faith in Malawi. Forinstance, Islam was simply considered fashionable among the Yao in the late 19th century (Pike (1968), p.69). Inaddition, people were sometimes eager to be Muslims because they perceived becoming so as a means of earningincome (Msiska (1995), p. 61). This is because once they became Muslim teachers, they could typically collectfairly substantial fees from their disciples. Those disciples also had to administer to the teachers until they left asfledged Muslims. Moreover, the colonial administration also indirectly contributed to the spread of Islam becausegovernment officials sometimes preferred and helped Muslims to build mosques, and for the period from 1888 to1889, the Nyasaland Government banned Christian missionaries from working in Muslim areas, for example (Msiska(1995), pp. 63-64).
13

Interim Report for Institutional Roles of Marriage in the Developing World: Empirical Studies from thePerspectives of Gender Empowerment, IDE-JETRO, 2014
models the outcomes yij
yij = α1 + α2cij + α3eij + α4xij + ϵij , (1)
whereby cij takes the value of one if she was Christian and zero otherwise; a dummy variable
for non-Yao ethnic groups are measured by eij ; the vector xij contains other determinants of the
outcomes specific to her, her original household, and her natal community; and ϵij represents a
stochastic error.29 As noted from the specification, due to the limitations imposed by the data
analyzed in the current research, this study refers to an individual’s religious affiliation as receiving
religious teachings. This way of treating data allows the identified religious effects to have many
interpretations. This issue will carefully be discussed in Section 6.
Ideally, the xij is expected to be evaluated at the point when she entered into a marriage
market. In addition to her birth order and other standard controls such as age, hence, to capture
the levels of wealth at a household’s disposal at that point, the xij included the number of both
the young and elderly siblings that had passed away as well as the number of siblings that were
alive when she was 15 years old, based on recall information indicated by the survey responses.
The number of late siblings is included in the xij, given the presumption that the mortality
information may positively correlate with her original household’s poverty status. This study also
expects the information to capture a household’s affordability of children’s schooling and thus her
educational qualification that had been obtained by her marriageable age, as the pre-marital level
of her education could not be discerned from the available data. However, this study admits that
the mortality information does not control for an individual’s intellectual capability (unobservable
to researchers) that may affect her marital decision.30 The number of existing siblings as well
as the birth order is likely to express social understandings of, among siblings, who takes main
responsibility for taking care of family members at natal home.
The dummy variable for females being currently in a polygynous union does not make a dis-
tinction between those that got married with a partner who had already had a wife (or wives)
29As including ethnicity-level historical controls explained below prevents this study from controlling for ethnicity-level fixed effects, the main analysis presented in this paper treats the non-Yao people as one group. However, itwas also confirmed that eliminating the ethnicity-level historical controls from regressors and instead including theethnicity-level fixed effects yielded similar implications obtained from the main analysis. The estimation resultswith a control of the ethnicity-fixed effects corresponding to those in Tables 3 and 4 are reported in Tables A.4 andA.5.
30However, this may not be a serious concern in identifying the religious effects, provided that the personalcapability is an innate endowment that does not change over time. This view is taken because it is less likelythat the distribution of the initial endowment has significant correlation with religious beliefs. Nevertheless, thisstudy’s limited ability to control for the pre-marital level of education may bias the religious effects in case thatthe intellectual capability is affected by religious teachings or upbringing provided by parents and so time-varying.This study expects the IV approach explained below to solve this problem as well.
14

Interim Report for Institutional Roles of Marriage in the Developing World: Empirical Studies from thePerspectives of Gender Empowerment, IDE-JETRO, 2014
and those who entered into monogamous marriage that resulted in a polygynous union. As the
data contained information on the rank of the respondent among the partner’s wives, alternatively,
the analysis also used the rank as a dependent variable, whereby the rank took the value of one
for all females in monogamous marriage.31 This dependent variable allowed the current study to
make a distinction between the first wife, whose marriage was likely to start with monogamous
relationship, and wives of the other ranks, who entered into polygynous marriage from the be-
ginning of the marital relationship, within a polygynous union. As the alternative estimations
yielded similar implications obtained from the analysis using the dummy variable for polygyny,
this study mainly reports the estimation results based on the polygyny dummy, except for a couple
of exercises conducted to address the selectivity concern discussed in subsections 3.3 and 5.3.2.32
The estimated α2 does not necessarily imply the causal relationship with the marital practices
of the interest. Below, this study discusses several major factors that make the causal identification
challenging as well as a number of strategies taken in this paper to address those issues.
3.1 Omitted variables bias
In the estimations, the possible correlation between Christianity and the outcomes could be ex-
plained by omitted variables that correlate with an individual’s religious affiliation as well as with
the outcomes. The mass conversion of Africans to Christianity can be attributed to the missionary
penetration followed by British colonial administration. In addition, the missionary contacts must
have lasting impacts on the subsequent religious distribution of the country, by parents passing the
religious beliefs and values on to their children (Nunn (2010)). This suggests that controlling for
pre-determined local conditions that characterized the entry and explosion of the missionary ven-
ture (as well as colonial rule) is crucial to identify the causal impacts of an individual’s religious
faith. This study addresses this issue by pursuing two strategies, namely indeed attempting to
control for the initial conditions that are observable and taking an instrumental variable approach.
31However, since only the current rank of the respondent was identified from the data, it may not necessarilybe identical with the rank when she got married with the current husband. For example, it is certainly possiblethat she got married as a second wife, followed by the death of her husband’s first wife. In this case, in the dataset, she would be recorded as the first wife at the point of the survey. However, as this is measurement noise ofthe dependent variable, as long as the error is classical, it primarily affects the precision of the estimates, not theconsistency.
32The results using the rank as a dependent variable are available from the author upon request.
15

Interim Report for Institutional Roles of Marriage in the Developing World: Empirical Studies from thePerspectives of Gender Empowerment, IDE-JETRO, 2014
3.1.1 Controlling for initial conditions
Geographic and climate controls
The settlement pattern of the missionaries was influenced by a number of factors. As indicated in
Johnson (1967) and elsewhere (e.g., Nunn (2010); Nunn (forthcoming)), the key elements generally
included health-related items such as availability of clean water and malaria-preventing geographic
and climate conditions (e.g., low temperature, high altitude); economic considerations such as
access to trade routes from/to Europe (that might have been affected by railway networks in
colonial periods) and affluence of fertile land needed for the creation of a cash-crop economy; and
the mission’s benevolent nature to eradicate slave trades. Indeed, all these points are indicated in
the Livingstonia Mission as described in Section 2.
To attenuate the possibility that these factors confound the causal inference of the religious
effects, this paper firstly attempted to control for a great number of geographic and climate con-
ditions that must have been encountered by the missionaries. However, it appears that no such
pre-missionary data tenable to an empirical analysis exists. Thus, given the assumption that those
conditions have not noticeably changed over the last century, the current study alternatively de-
cided to use such information collected in the relatively recent past. In the subsequent analysis,
this information was provided by another survey of the third Integrated Household Survey (IHS)
2010-2011, as no such information was included in the MDHS data.
With technical assistance offered by the World Bank LSMS-ISA (Living Standards Measure-
ment Study-Integrated Surveys on Agriculture) team, the National Statistical Office (NSO) in
Malawi implemented the IHS in the period of March 2010-March 2011. With stratification based
on geography, respondents belonging to 12271 households located in 768 enumeration areas (com-
munities)33 were randomly contacted in the IHS that provided information on various aspects of
welfare and socio-economic status of the population.34 The IHS data also contained ample in-
formation on geography and climate conditions surrounding the surveyed communities, such as
climatology, landscape typology, soil and terrain, and crop season parameters (see Appendix A for
the details).
Both the MDHS and IHS projects publicized GPS-based coordinates of the surveyed communi-
ties after - to maintain the confidentiality of the surveyed respondents but still to partially satisfy
the demand for the positional information from the public - displacing the coordinates by apply-
ing a random offset within a specified range to the positions (see Appendix B.1 for the details).
33This study interchangeably uses the word “enumeration areas” and “communities.”34For the details of sampling design, see ‘Third Integrated Household Survey (IHS3) 2010-2011
Basic Information Document, March 2012’ at http://siteresources.worldbank.org/INTLSMS/Resources/
3358986-1233781970982/5800988-1271185595871/IHS3.BID.FINAL.pdf.
16

Interim Report for Institutional Roles of Marriage in the Developing World: Empirical Studies from thePerspectives of Gender Empowerment, IDE-JETRO, 2014
The GPS latitude and longitude position allowed this study to calculate the great-circle distance
(GCD) between the MDHS and IHS communities, i.e., the shortest distance between any two
points on the surface of a sphere measured along a path on the surface of the sphere (as opposed
to going through the sphere’s interior). As both the MDHS and IHS communities spatially spread
all over the country (see Appendix Figure A.3, whereby the sample communities in both the sur-
veys are dotted, although for easeness of visual identification, only the 2010 MDHS communities
were compared to the IHS ones in the figure), it was not difficult to identify an IHS community
located in the closest proximity to a community surveyed in the MDHS (see Appendix B.2 for the
details of the identification process). As a matter of fact, approximately 95% (99%) of the MDHS
communities were matched with the nearest IHS community situated less than 10 (15) kilometers
away from them. Consequently, the analysis used, as the geographic and climate information of
the MDHS communities, that of the corresponding nearest IHS communities. In Appendix B.3,
goodness of the fit of the IHS community-characteristics to the MDHS data was informally checked
by performing a couple of exercises. Those exercises gave some ease to the subsequent analysis
using community-level information sourced from the IHS.
In addition to the geographic and climate conditions, for each sample community, the IHS also
provided information that might have had historical persistence to some extent: (i) decent rules
(i.e., matrilineal, patrilineal or dual descent); (ii) the most common language spoken at home in
a community (i.e., Chewa, Lambya, Lomwe, Ngoni, Nkhonde, Nyakyusa, Nyanja, Sena, Senga,
Sukwa, Tonga, Tumbuka, Yao, and other. See Figure A.2 for the distribution); (iii) the most
common religion practiced in a community (i.e., Christianity, Islam, or African tradition. See
Figure A.1 for the distribution); (iv) a community’s population; and (v) a community’s distance
(km) to the nearest town having over 20000 population; and (vi) whether a community is situated
in a major urban center. In several exercises, as a robustness check, all these characteristics of the
IHS communities in the immediate vicinity to the MDHS ones were also included in the xij.
While the informal analysis conducted in Appendix B.3 provides some support for the quality
of the match between the two data sets, the current study cannot exclude the existence of mea-
surement noise in evaluating local conditions of the MDHS communities. Two factors may account
for the potential noise, one of which stems from the adjustment of the GPS-based coordinates
made in both the surveys for the public use before the dissemination. However, the random offset
applied to the coordinate values to displace the community-level positions may make the causal
effects of religious faith unaffected by this measurement noise, because due to the random nature,
the noise that may be contained in the error terms of equation (1) are unlikely to be correlated
with the religious beliefs. The other concern is solely based on the likelihood that irrespective
of the displacement of the GPS-based coordinates, the IHS communities positioned in the closest
17

Interim Report for Institutional Roles of Marriage in the Developing World: Empirical Studies from thePerspectives of Gender Empowerment, IDE-JETRO, 2014
proximity to the MDHS ones may not have similar local characteristics. To mitigate this prob-
lem, the subsequent empirical analysis used females residing in the MDHS communities located
less than 10 kilometers away from the nearest IHS communities, although this sample restriction
almost unaffected the estimation results using all the sample females that were in the first marital
union. Finally, the second concern may partly be checked by replacing all those community-level
variables with community-fixed effects in estimating (1) to see the extent to which the estimates
are sensitive to this replacement.
Historical controls
The detailed information on geography and climate in a community is primarily supposed to control
for the missionaries’ considerations of health-related factors and land productivity in selecting the
settlement. While the information (e.g., elevation, slope, terrain roughness) may be even associated
with administration of trade routes from/to the coast and intensity of slave trades, it may still
be strong to assume this issue. Thus, to reinforce the primary instruments of the geography and
climate, an empirical analysis exploited additional covariates that measured European influence
during colonial periods as well as severity of slavery during the 19th century.
All these pieces of information were directly taken from data used in Nunn and Wantchekon
(2011) that contained (i) a dummy variable, equal to one if any part of railway lines in the first
decade of the 20th century drawn from Century Company (1911) passed through land historically
inhabited by an ethnic group and (ii) the total number of slaves taken from an ethnic group that
was normalized by the area of land inhabited by the ethnic group during the 19th century (log of
one plus the normalized slave export measure). Unlike the aforementioned geographic and climate
controls that were measured at the community-level, these items were evaluated at the ethnicity-
level. Thus, the information was appended to the MDHS data using the name of ethnic groups
provided by the two independent data sets. Consequently, a few ethnic groups in the MDHS that
were not identified in the Nunn and Wantchekon (2011) data were excluded from the subsequent
regression analysis.35 These omitted groups corresponded to approximately 8% of all the sample
females.
Two limitations should be recognized in using both the aforementioned community-characteristics
and the ethnicity-level historical controls. Regarding the first case, the information on the current
residential place may not sufficiently be able to control for issues that women took into account
when they got married with a spouse living long distance away from their natal home. This case
may typically apply to females coming from an ethnic group that traces their descent through fa-
35The following ethnic groups were identified in both the MDHS and Nunn and Wantchekon (2011) data sets:Chewa, Lomwe, Ngoni, Lambya, Nkhonde, Sena, Tonga, Tumbuka, and Yao.
18

Interim Report for Institutional Roles of Marriage in the Developing World: Empirical Studies from thePerspectives of Gender Empowerment, IDE-JETRO, 2014
thers, i.e., a patrilineal ethnic group.36 This is because in such an ethnic group, when she marries,
a rural woman usually leaves her kin to reside with her husband living outside her original village
(i.e., patrilocal marriage). The other issue is that the historical information is specific to location
historically inhabited by each ethnic group. In the current context, it may also be desirable to
control for the pre-colonial and/or colonial controls associated with an individual’s present residen-
tial area, in addition to those associated with historical settlement of ethnic groups. This concern
becomes more evident for ethnic groups that migrated into the present residential space long away
from the original settlement place. It is expected that the instrumental variable (IV) approach
explained below to address this study’s limited ability to control for socio-economic conditions
prior to the arrival of the mission.
3.1.2 Instrumental variable approach
The second strategy taken by this study is to exploit instrumental variables that are correlated
with an individual’s affiliation with Christianity, but are uncorrelated with other omitted factors
that determine the outcomes of interest.
To identify a reasonable instrument, this study notes that broadly speaking, the present pop-
ularity of Christianity is determined by two factors: (i) the date on which Christian ideas arrived
at a community and (ii) the speed at which the doctrine spread through the society that is in turn
governed by the frequency of social contacts among the members and the rate of transmission of
the religious values.37 As the frequency involving the transmission of the religious faith would not
be discerned from available data, to find an adequate instrument, this study focuses on the arrival
date of Christianity, namely, the date on which the missionaries had a contact with members in a
community; the earlier they preached the Gospel in a community, the earlier the society members
converted to Christianity, and consequently, the descendants are more likely to be Christian.
Regarding the date of the first missionary contact, the information is not contained in the
data used in this study and probably elsewhere.38 However, it appears that the arrival date has
close relationship with a community’s distance to the mission’s central station, as people living in
the proximity to the station might have earlier chances to encounter the missionaries. Given the
indication provided in Section 2 that in Malawi, Christianity exploded from the northern area,
36While a patrilineal descent system is quite popular in many sub-Saharan African countries, matrilineality isalso commonly observed in Malawi. For example, the Chewa, Lomwe and Yao typically refer to matrilineal ethnicgroups.
37Discussions made in this paragraph refer to Oster (2012) that exploited a community’s distance to the originof the virus in the Democratic Republic of the Congo as an instrumental variable for the rate of HIV prevalence inthe community in estimating the causal effects of the prevalence on an individual’s sexual behavior.
38A parish register might have been used to identify the arrival date if this study had surveyed churches establishedaround the MDHS communities.
19

Interim Report for Institutional Roles of Marriage in the Developing World: Empirical Studies from thePerspectives of Gender Empowerment, IDE-JETRO, 2014
this study uses the distance between each community and the influential station in the region,
i.e., Livingstonia, as an appropriate instrument. As for the distance, based on the GPS-based
coordinates provided by the MDHS, the analysis calculated the great circle distance dj between
the MDHS communities and Livingstonia. As discussed in subsection 2.2, since Christianity was
less appealing to the Yao people, the distance was interacted with a dummy variable for non-
Yao ethnic groups, when used as an instrumental variable for an individual’s religious faith in an
empirical analysis.
To sum up, the assumption eventually made here to exploit the instrument is that since the
non-Yao Africans residing a great distance away from Livingstonia in the late 19th or early 20th
century are expected to have been less exposed to the missionary contacts as well as parents have
passed the religious beliefs over to children (Nunn (2010)), the distance measure multiplied by
the dummy is likely to explain the probability of the current generation being Christian. This
statement can be checked by estimating the following first-stage equation as well as testing that
β2 = 0 and β3 < 0:
cij = β1 + β2dj + β3djeij + β4eij + β5xij + uij . (2)
It seems that the instrument relevance argument is made by implicitly assuming that the spatial
mobility of the population has been completely limited at the ethnicity-level over time. However,
it might have been possible that the mission’s involvement in political disputes between indigenous
headmen that was sometimes observed in the early periods of the missionary penetration altered
the spatial distribution of ethnic groups to a certain degree.39 Thus, the assumption made here
actually allows for the spatial mobility of the ethnic groups that might have existed but might not
have been strong enough to invalidate the instrument relevance. Another issue to be recognized is
that once the propagation of Christianity reaches the steady state, the date of the first missionary
contact and so the distance from Livingstonia may no longer explain the distribution of Christianity
of the present generation. Thus, the distance could be used as a valid instrument only when the
study uses data drawn from periods during which the mission’s arrival date still plays a role.
Indeed, the first-stage estimation results reported below provide strong support for the instrument
relevance arguments, which makes these concerns less serious.
Using the interaction term between the community-level distance and an individual’s ethnicity
(a dummy for the non-Yao people) as an instrumental variable has two merits for the analysis.
Firstly, it allows the analysis to test whether the pre-determined community-level variables that
39For example, see the relationship of the mission with the lakeside Tonga and the northern Ngoni in the earlyperiods of the Livingstonia Mission (McCracken (1977), pp. 73-99).
20

Interim Report for Institutional Roles of Marriage in the Developing World: Empirical Studies from thePerspectives of Gender Empowerment, IDE-JETRO, 2014
were explained in the previous subsection 3.1.1 sufficiently control for all time-invariant community-
level characteristics that affected the outcomes, because one can instead estimate equations (1) and
(2) by replacing those community characteristics with community-level fixed effects.40 Secondly,
it will be possible to conduct a falsification test of the type used in Nunn and Wantchekon (2011),
which will be explained below.
Falsification tests
While it is multiplied by a dummy variable for non-Yao ethnic groups, to instrument an individual’s
religious affiliation, the aforementioned approach fundamentally uses the distance between each
community and Livingstonia that may also be correlated with distances to other locations, which
were important for the missionaries as well as for the British Government that maintained the
colonial state.41 If such distances had independent influence on an individual’s marital decision,
the excludability of the instrument would not be supported. In addition, one may also doubt
that (even if it is interacted with the distance to Livingstonia as well as the level effect is already
controlled for) the ethnicity eij characterizes the marital practices only through its influence on an
individual’s religion beliefs.
To check the exclusion restriction of the instrument, thus, this study will conduct three falsi-
fication tests. The first test follows a technique employed in Nunn and Wantchekon (2011). To
identify causal relationship between the exposure of ancestors belonging to the same ethnic group
to slave trades and the current differences in trust levels within Africa, they exploited the historical
distance of ethnic groups from the coast at the time of the slave trade as an instrumental variable
for the number of slaves taken. After showing the reduced-form relationship between the distance
and the trust levels, to remove a concern that the distance directly affected the trust levels not
only through the slave trades, they showed that there was no relationship between the distance
and trust outside of Africa, where there was no slave trade. In the current context, due to the less
sensitivity of the Yao people to the Livingstonia Mission, the following reduced-form equation can
be estimated
yij = γ1 + γ2dj + γ3djeij + γ4eij + γ5xij + νij , (3)
to show that there is no systematic relationship between the distance to Livingstonia and the
outcomes for the Yao people, i.e., γ2 = 0. Also, note that given the likely negative correlation
40In this case, dj will also be removed from regressors in estimating the first-stage equation (2) to avoid perfectmulticollinearity.
41Such locations may include other major mission stations such as Bandawe and Cape Maclear and/or slave-marketcenters such as Nkhotakota and Mangochi (previously called Fort Johnson), for example.
21

Interim Report for Institutional Roles of Marriage in the Developing World: Empirical Studies from thePerspectives of Gender Empowerment, IDE-JETRO, 2014
between Christianity and the distance within the non-Yao people (β3 < 0), it is expected that the
γ3 has an opposite sign value of α2.
However, the fact that the distance has no impacts on the outcomes of Yao Africans does not
necessarily mean that the non-Yao-distance interaction term is uncorrelated with other omitted
factors that affected the outcomes. While it is unlikely that the distance actually drives marital
behavior, it is still important to consider more carefully whether the instrumental variable satisfies
the exclusion restriction. This check may be performed by exploring the relationship between the
distance and the outcomes in the periods before the missionary contacts. If the distance has no
impacts on the outcomes in the pre-missionary periods, the subsequently emerged differences in
the outcomes between Christian and non-Christian people may indeed be attributed to the impacts
of religious affiliation that originates from the Christian mission. Unfortunately, the information
on the outcomes of interest (age at marriage, polygyny) in the late 19th century was not available.
However, as it is likely that all these outcomes are correlated with economic prosperity that may in
turn be measured by population density (Acemoglu et al. (2002)), this study will more elaborately
discuss and report the relationship between the population density and the distance in subsection
5.2.2.
Regarding the endogeneity concern of the non-Yao dummy, after replacing the distance to
Livingstonia with a community’s distance to three communities randomly selected from all the
MDHS ones, the equation (3) will be estimated. As the three communities are randomly selected,
there is no reason to assume that the distance to those communities has an impact on the outcomes.
However, if the non-Yao indicator (interacted with the distance to Livingstonia) has a direct effect
on the outcomes not through its influence on religious beliefs, the interaction with the distance
to those randomly selected communities is also likely to affect the outcomes. Then, to informally
check the excludability of the non-Yao indicator (interacted with the distance to Livingstonia), it
may deserve observing that the interaction terms between the non-Yao dummy and the distance to
those three communities do not significantly affect the marital practices. While the concern of the
exclusion restriction is clearly the limitation to be admitted, the excludability of the instrument
may find some consolation in these falsification tests.
3.2 Measurement concerns
While the inter-faith marriage may typically be less preferred in some African countries (Pew
Forum on Religion & Public Life (2010), p.40), this may not necessarily be true in Malawi. In the
short questionnaire-based survey that in order to complement the analysis based on the MDHS
data, the author conducted in southern region in Malawi in 2013 (see footnote 4 for the details),
22

Interim Report for Institutional Roles of Marriage in the Developing World: Empirical Studies from thePerspectives of Gender Empowerment, IDE-JETRO, 2014
for example, more than 75% of the respondents answered that the inter-religious marriage was
common and all mentioned that after the marriage, women typically follow a husband’s religion in
such a case.42 Related to this point, in the MDHS data, approximately 80% of the surveyed (7287)
couples had the same religious faith.43 This high degree of homo-religiosity among couples observed
in the MDHS indeed suggests the conversion of married females to their husband’s religion.
Because the MDHS data contains information only on an individual’s current religious affilia-
tion, it would be true that for the purpose of the research, the religion measure used in this study
has noise to some extent.44 Two remarks may be expressed regarding this issue. Firstly, while the
inter-faith marriage is often observed, it may still be a difficult decision for Christian (Muslim) fe-
males to get married with Islam (Christian) males, compared to the case of inter-religious marriage
within Christian denominations. This view was indicated by the respondents in the aforementioned
survey that the author implemented. Secondly, as long as the measurement errors are classical,
the instrumental variable approach described above would correct the potential attenuation bias
of the OLS estimates, which is indeed the case in the estimation results reported below.
Somewhat related to the measurement issue, given the Islamic law that allows for polygyny,
Christian females may allow their Christian husband to convert to Islam to have multiple wives.
As females usually follow their husband’s religion, in this case, married females may also convert
to Islam as well (reverse causality).45 This study addresses this concern again by relying on the
IV strategy.
3.3 Selectivity bias
The preceding strategies may primarily solve the bias arising from community-level omitted vari-
ables that correlate with the religious distribution of the population as well as from measurement
noise associated with observed Christianity. However, another empirical challenge may also arise,
as this study uses the selected females that were only in the first marital union. For example, if
Christian females show little propensity to marry as well as, conditional on getting married, tend
to do so late (early) or to make a union with males having a larger (smaller) number of wives due
42In addition to the religious dimension, in the short-questionnaire based survey, the author also asked the respon-dents if the inter-ethnic marriage was common. Approximately 90% of the respondents agreed to the commonalityand as a matter of fact, approximately 33% of marriage cases observed in the couple-level data of the MDHS wereinter-ethnic.
43A partner’s religion and ethnicity were not indicated by questionnaire responses from the surveyed females.However, in the MDHS, although it placed the emphasis on the collection of data of females, males between the agesof 15 and 54 were also surveyed in one-third (one-fourth in 2000) of the selected households. This feature allowsthis study to analyze the data from a perspective of couples.
44In addition to the inter-religious marriage, the author’s field survey also identified those who converted toanother religion because of their inability to afford the amount of donation.
45In this case, the relationship between Christianity and polygamy identified in the OLS estimations may bebiased downwards.
23

Interim Report for Institutional Roles of Marriage in the Developing World: Empirical Studies from thePerspectives of Gender Empowerment, IDE-JETRO, 2014
to their unobserved personality traits, this would make the estimated α2 biased upwards (down-
wards).46 In addition, if Christian females that got married late (early) with males having a larger
(smaller) number of wives are less likely to get divorced or be widowed in some unobserved way,
this would also overestimate (underestimate) the impacts of Christianity on the marital formation.
While it is difficult to identify such personality traits precisely as well as the use of the distance
to Livingstonia as a statistical instrument may even solve this problem, it may still be important
to assess the potential bias associated with using the selective females in the analysis.
One possible way to solve the selection problem is to use a selection correction methodology
by explicitly modeling the selection process. However, this strategy often yields evidence that is
sensitive to a parametric assumption made in the process and needs good instruments that explain
the selection but not the outcomes. As a matter of fact, in the current context, this approach
would be much harder to be taken, because once a distinction between females that had never
been married, females that were in the first marital union, females that were separated from their
husband due to divorce or the husband’s death, and females that formed the second (or further)
union is required, the approach needs to take into account not just selection into the first marriage,
but also selection into divorce/widowhood and/or the second marriage. Due to the complexity in
modeling these selection mechanisms and the lack of good instruments that may be exploited to
control for each selection process, this is not the strategy taken in the current study.
Alternatively, this study attempts to check if the obtained results are entirely attributed to the
selection problem by performing two informal checks. The first test, although it can be conducted
only for checking the selection concern associated with the religious effects on age at marriage,
explores differences in the probability of getting married between Christian and non-Christian
females by exploiting observations of both the single and married females less than the ages of 25
years. To address the concern associated with the religious effects on the entry into polygynous
marriage, again by exploiting observations of both the single and married females aged less than
25 years, the second exercise will estimate the rank of the respondent among the partner’s wives,
whereby the rank was assumed to be zero for females that were not married as well as one for
females in monogamous marriage. These exercises will be explained more clearly in subsection
5.3 after presenting the main estimation results. While these checks undoubtedly fall short of
providing evidence that rules out the selectivity concern, this study may still obtain some comfort
from these exercises regarding this issue.
46Note that this is a standard selection problem. A similar issue arises when estimating the impact of educationalattainment on earnings, for example. If the educated show high propensity to get employed as well as, conditionalon obtaining a job, tend to be paid nicely due to their (unobserved) ability, the educational effect on earnings wouldbe biased upwards, unless the employment selection is appropriately addressed.
24

Interim Report for Institutional Roles of Marriage in the Developing World: Empirical Studies from thePerspectives of Gender Empowerment, IDE-JETRO, 2014
4 Data
This study primarily uses repeated cross-sectional data drawn from the Malawi Demographic and
Health Surveys (MDHS) 2000, 2004 and 2010 that were implemented by the National Statistical
Office from July to November 2000, October 2004 to January 2005, and from June to Novem-
ber 2010, respectively. The MDHS is a nationally-representative household survey that provided
information in the areas of population, health, and nutrition such as marriage, fertility, family
planning, reproductive health, child health, and HIV/AIDS. Due to the areas of interest, women
of reproductive age are the main target of this survey. In the 2010 MDHS, 23020 females aged 15
to 49 years old that resided in 24825 households located in 849 enumeration areas (communities)
were interviewed in total, with 11698 and 13220 resident females of 13664 and 14213 households
situated in 521 and 559 communities in the 2000 and 2004 MDHS, respectively.47 The MDHS
sample households are a stratified random sample based on a study domain and urban/rural con-
siderations.48 Although the MDHS has been run multiple times, there is no panel element in
terms of both the clusters and households. As explained in subsection 3.1.1, this study also uses
community-level information sourced from the third Integrated Household Survey (IHS) 2010-2011
as a complement to the MDHS that had no such information.
By religious affiliation, Table 2 provides summary statistics of selected variables of females that
were in the first marital relationship, with a check of the equality of the mean between these two
groups. First of all, notice from the panel B (see “the most common religion”) that Christian
females resided in communities that were primarily settled by Christian people more evidently
than the non-Christian counterpart did. As a matter of fact, this observation establishes one of
several checks performed in Appendix B.3 in order to verify goodness of the fit of community-level
characteristics sourced from the IHS to individual characteristics of the MDHS females.
Secondly, Christian and non-Christian females were found to be significantly different in an
observed way in terms of all the individual- (panel A), community- (panels B and C), and ethnicity-
level characteristics (panel D). For example, compared to non-Christian ones, Christian females
obtained more education and had fewer siblings that had passed away when they were 15 years old.
As often indicated by the relevant historical research, both the greater educational achievement
47In the survey, all females between the ages of 15 and 49 in the selected households and all males between 15and 54 in one-third (one -fourth in 2000) of the selected households were eligible to be interviewed.
48Similar sampling exercises were implemented in all the surveys. For example, the 2010 MDHS sample householdswere selected in two stages. By separating the 27 study domains (districts) into urban and rural areas, first of all, thenation was stratified into 54 sampling strata that consisted of 9144 enumeration areas established in the 2008 MalawiPopulation and Housing Census (PHC). The selection of 849 clusters from those enumeration areas was made inthe first stage, with 158 urban and 691 rural ones. In the second stage, it was designed to select 20 households inan urban cluster and 35 households in a rural cluster, which generated the target sample size of 27345 householdsat the national level. See ‘Malawi DHS Final Report’ (2000, 2004, 2010) for details of the sampling framework.
25

Interim Report for Institutional Roles of Marriage in the Developing World: Empirical Studies from thePerspectives of Gender Empowerment, IDE-JETRO, 2014
and lower level of siblings-mortality of Christian females may suggest that the Christian mission
has made a significant contribution to economic development over the last century by creating the
legal, institutional, and economic basis of a modern market economy as well as offering both the
educational and health-related facilities.
In contrast to the economic advantage that might have been enjoyed by Christian females at
the individual level, it appears from the panels B and C that Christian females dwelled in relatively
less modernized areas than non-Christian females did, as the communities largely occupied by the
former group were less populated as well as located a greater distance away from the nearest pop-
ulation center (although this view may be challenged due to the weakly significant but still higher
likelihood of Christian females living in a major urban center). This country-like nature of com-
munities mostly settled by Christian females may be elucidated by the fact that the Livingstonia
Mission established the central station in relatively uncivilized areas.49
These significant differences in observed traits between Christian and non-Christian females
indeed underscore the importance of, to make causal inferences, controlling for unobserved factors
(as well as observed ones) associated with an individual’s religious faith in the subsequent empirical
analysis. In addition, given the likelihood of correlation between prospects for economic success
and women’s marital practices, the apparent discrepancy in the association of Christianity with
the success-related attributes between the individual- (i.e., education, mortality) and community-
levels (i.e., modernization, urbanization) suggests that the estimated religious effects may involve
any direction of bias, unless the relevant personal characteristics that are correlated with religious
beliefs but unobservable to researchers are appropriately controlled for. Moreover, the potential
noise contained in the measured Christianity (see subsection 3.2) may also make the direction of
bias more complicated.
While it is not a sufficient condition, successful implementation of the instrumental variable
procedure requires strongly negative association between the distance to Livingstonia and the
prevalence of Christianity within non-Yao ethnic groups. Although the summary statistics do
not provide a formal assessment about the negative relationship, the observations that Christian
females largely lived in communities in closer proximity to Livingstonia than the non-Christian
counterpart as well as that the former group was primarily non-Yao Africans residing in com-
munities predominantly occupied by non-Yao ethnolinguistic groups may give some credit to the
validity of the instrument relevance. In addition, the nearly absence of the Yao among Christian
females is also consistent with the historic account that they were less amenable to Christianity
49For example, while the Overtoun Institution at Livingstonia was intended to create commercial expansion inthe Northern Province, the expansion took place elsewhere, leaving the site quite set apart from the materialopportunities. (McCracken (1977), p.138). In addition, in the mid-1890s, one missionary also commented about thenorthern areas as ‘the population in this locality was thin and very unevenly distributed’ (ibid, p. 115).
26

Interim Report for Institutional Roles of Marriage in the Developing World: Empirical Studies from thePerspectives of Gender Empowerment, IDE-JETRO, 2014
than the other ethnic groups due to their strong socio-economic ties with Arab Muslims that had
existed before the advent of the Christian mission and, as explained below, probably a matrilineal
descent rule employed by them. Related to this Yao-Christianity relationship, it seems that as the
Yao have historically inhabited in southeast areas of a thin strip of land of this country, Christian
females were more likely to be located in the western part of this country than the non-Christian
equivalent.
Following these observations, the descriptive statistics also provide several other findings that
may be compatible with historic records on the advancement of the mission. For example, the
smaller number of matrilineal communities among Christian females relative to that of the non-
Christian counterpart may be explained by Christianity’s mythical view of the origin of gender
relationship. As this view might have been against the beliefs carried by matrilineal ethnic groups
such as the Chewa and the Yao that an original human being was a female, with the blood line
flowing from a mother to a daughter and/or a son (Davison (1997), p.101), this belief system might
have somewhat discouraged local inhabitants in those communities to come under the mission’s
full influence. In addition, as explained in Section 2, in the pioneer years, the Livingstonia Mission
moved to the Northern Province to find the settlement partly to evade unhealthy climate conditions
in the south (e.g., Cape Maclear, Bandawe) that sometimes proved malarial. This resulted in the
establishment of the mission’s main work centers in northern highlands in the later periods. In
consistent with this view, it is shown that that in contrast to the non-Christian equivalent, Christian
females were largely found in northern areas characterized by low temperature and a high altitude
as well as a steep ascent.
In panel D, it is also shown that Christian females belonged to ethnic groups that had histor-
ically inhabited land on which fewer railway networks were built and slavery was less intense. It
may be difficult to obtain a coherent picture from these observations, partly, due to the fact that
these pieces of information were evaluated at the historical settlement of ethnic groups, not at an
individual’s present residential space. Nevertheless, at least, the latter aspect may indicate that
the slave trade was more apparent among the Yao that mostly became Muslim.
Finally, the panel A suggests that Christian females got married later with less likelihood of
engaging in polygynous relationship than non-Christian counterparts did. The purposes of this
paper are to show that these are consequence of an individual’s religious beliefs and then to discuss
that religious teachings play a role in explaining the religious effects.
27

Interim Report for Institutional Roles of Marriage in the Developing World: Empirical Studies from thePerspectives of Gender Empowerment, IDE-JETRO, 2014
5 Estimation results
5.1 OLS estimates
The OLS estimation results of equation (1) are reported in columns (a) to (c) in Tables 3 and 4
for the respective outcomes of age at marriage and a dummy variable for polygynous marriage,
whereby all the reported standard errors are robust to heteroskedasticity as well as clustered
residuals within a community. In addition to own age, birth order, both the number of alive and
late siblings at the ages of 15 years, the ethnicity-level historical controls, geographic and climate
conditions of each surveyed community, i.e., climatology, landscape typology, soil and terrain, crop
season parameters, and GPS-based coordinates (see Appendix A for the details), were included in
the xij in the column (a) together with district- and year-fixed effects. The estimation in column
(b) controlled for further community-level characteristics (e.g., descent rule, population) explained
in subsection 3.1.1 that might have had historical persistence, in addition to the geographic and
climate conditions. In the column (c), all those community-level characteristics were replaced by
community-fixed effects.
With strong significance, the estimated religious effects revealed quite a stable pattern across
the columns for both the outcomes. Compared to those practicing the other religions and no
religion, Christianity was associated with delay of marriage by approximately 0.3 years and less
likelihood of entering into a polygynous union by 8-9 percentage points. Also, note that replacing
the community-level variables with the community-fixed effects almost unaffected the estimated
religious impacts. This observation may provide the indication that all those community-level
variables sourced from the IHS adequately controlled for all time-invariant determinants of the
outcomes working at the community-level, as the community-fixed effects were supposed to do so.
In addition to the religious effects, the number of late siblings at the ages of 15 years had
significantly negative relationship with age at marriage. Assuming that an impoverished household
may experience a great number of child deaths, the finding may suggest that a deprived girl is
likely to marry early. Related to this observation, the results also show that females that had a
large number of living siblings at the ages of 15 years married late, compared to the counterpart.
As this relationship was observed conditional on the mortality information, it may reflect that a
girl belonging to a wealthy family tends to enter into marriage quite late, provided that the number
of alive siblings evaluates a household’s affordability to raise children.50
50As reported in Section 6, the analysis in Table A.8 estimated own educational achievement by exploiting equation(1). These interpretations related to the number of late and alive siblings at the ages of 15 years may also apply tothe estimation results.
28

Interim Report for Institutional Roles of Marriage in the Developing World: Empirical Studies from thePerspectives of Gender Empowerment, IDE-JETRO, 2014
5.2 IV estimates
5.2.1 Second-stage estimation results
Columns (d) to (j) in Tables 3 and 4 present the 2SLS estimation results of equation (1). In the
columns (d) and (e), an individual’s religious affiliation was instrumented with both the distance
to Livingstonia and that interacted by a dummy variable for non-Yao ethnic groups. On the other
hand, only the interaction term was exploited as the excluded instrument in all the remaining
columns, whereby the columns (i) and (j) kept the distance in the included instruments, in con-
trast to the columns (f) to (h) that did not. As so in the OLS estimation results, a different
set of controls included in each estimation is explained at the bottom of the tables. Unlike the
OLS estimation results, due to computational difficulty primarily attributed to a great number of
categorical variables used to control for the community-level characteristics, the standard errors
were not corrected to allow for intra-community correlation in all the 2SLS estimations, although
the columns excluding (h) that involved further difficulty because of a considerably large number
of community-fixed effects still assumed the heteroskedasticity.
As before, for each outcome measure, all those 2SLS estimations provided a remarkably steady
pattern on the estimated religious effects across the columns, keeping the implications obtained
from the OLS estimates unchanged. However, the magnitude of the impacts was markedly altered
by the instrumentation. Now, the results suggest that Christian females are more likely to post-
pone their marriage by 1-3 years with less likelihood of engaging in polygynous relationship by
approximately 30 percentage points, compared to the non-Christian equivalent.
Given the presumption that the 2SLS estimations yielded more reliable point estimates, a com-
parison between the OLS and 2SLS estimation results suggest that the OLS estimations generated
a considerably large downward bias on the positive Christianity effect on age at marriage as well
as upward bias on the negative impact on polygyny. In Section 4, based on the two observations
of the positive association of Christianity with educational attainment and siblings-survival in
the childhood and the negative association with modernization and urbanization of the surveyed
communities predominantly occupied by Christian females, it was argued that the religious effects
estimated by OLS might involve (if any) any direction of omitted variables bias.
Nevertheless, the pattern of bias demonstrated in the current estimations provides the indication
that the possible omitted regressors might have been related to the pre-missionary level of economic
prosperity of the surveyed communities. This consideration refers to the second item of the two
observations, recalling that the pioneer missionaries were willing to preach the great words of Jesus-
Christ in primitive parts of the country. Intuitively, in developed areas, it is likely that women
marry late (and attain more education) with less likelihood of entering into polygynous relationship.
29

Interim Report for Institutional Roles of Marriage in the Developing World: Empirical Studies from thePerspectives of Gender Empowerment, IDE-JETRO, 2014
If the pre-missionary level of economic development is negatively correlated with Christianity, the
correlation is likely to generate exactly the bias observed in the current estimations of all those
outcomes. Alternatively or together with this account, the difference between the OLS and 2SLS
estimates may also be explained by the observed Christianity measured with classical errors.
Interestingly, the instrumentation considerably changed the ethnicity effects. The 2SLS es-
timation results suggest that with strong significance, the Yao females tend to marry late and
avoid polygyny. Before the arrival of the mission, the Yao enjoyed the prosperity due to a for-
tune that they amassed through trading ivory and slaves to the Arabs. As the findings were
obtained conditional on the religious effects, they may indicate long-lasting impacts of the wealth
accumulated by the Yao in the 18th and 19th centuries.
Finally, while all the previous estimations exploited pooled cross-sectional data of the 2000,
2004, and 2010 MDHS females, using data coming from any single year of those three years
yielded similar implications to those obtained so far. In addition, as explained in subsection 3.1.1,
females living in the MDHS communities that were situated more than 10 kilometers away from
the nearest IHS communities were excluded from the preceding analysis. Including those females
in the estimations also unaffected the implications obtained up to the present. All these results
are available from the author upon request.
5.2.2 Falsification tests
Reduced-form and first-stage estimation results
Three falsification tests were conducted to check if the instrumental variables could be excluded
from the second-stage estimations. Following an idea drawn from Nunn and Wantchekon (2011),
the first test attempted to show there was no significant association between the distance to
Livingstonia and the outcomes within the Yao ethnic group by estimating reduced-form equation
(3). If the distance is correlated with some unobserved determinants of the outcomes, it should
have direct effects on marital practices of the Yao as well as those of non-Yao Africans. On the other
hand, the distance indeed matters in accounting for the outcomes as a proxy for the missionary
penetration, due to strong dedication of the Yao to Islam, only the interaction term between the
distance and an indicator variable for the non-Yao ethnic groups should directly influence the
outcomes.
The results are reported in columns (d) to (i) in Table 5, whereby standard errors were robust
to heteroskedasticity as well as adjusted for clustering on a community. As before, a different set
of regressors is explained at the bottom of the table. As expected, the distance itself indeed had
no significant impacts on the outcomes, whereas the distance interacted with the non-Yao dummy
30

Interim Report for Institutional Roles of Marriage in the Developing World: Empirical Studies from thePerspectives of Gender Empowerment, IDE-JETRO, 2014
did.
In addition, it was anticipated that the impacts of the non-Yao-distance interaction on the
outcomes (i.e., γ3) would take an opposite sign value of α2 in equation (1), provided non-Yao
Africans residing longer distance away from Livingstonia were indeed less likely to be Christian
due to their less exposure to Christian doctrine. Regarding the negative association of the distance
with Christianity within non-Yao ethnic groups, the analysis in columns (a) to (c) in Table 5
estimated the first-stage equation (2) of the 2SLS. The results showed that the distance indeed
had significantly negative correlation with the probability of being Christian only for non-Yao
ethnic groups. Figure 2 also provides the graphical representation of the negative relationship.
The semiparametric regression curve (Lowess) of a partial linear model based on Yatchew (1997,
1998)’s differenced-based method clearly shows that the negative relationship is observed only for
non-Yao groups. The IV approach using too strong instrumental variables often yields estimates
almost identical to OLS estimates, both of which are biased. The instrumental variables used
in the current research appear to be quite strong but the IV estimates are significantly different
from the OLS estimates. This observation may also give some credit to the reliability of the IV
estimates. Moreover, the estimations in columns (d) to (i) in Table 5 also confirmed the expected
relationship between the sign of the estimated α2 and that of γ3, suggesting that probably due to
less familiarity with Christian tenet, non-Yao females living further away from Livingstonia were
more likely to marry early as well as to choose polygynous marriage, than the non-Yao counterpart
residing in closer proximity to Livingstonia.
Pre-missionary economic prosperity
The second falsification test checked whether there was a significant relationship between the
distance to Livingstonia and the outcomes in the periods prior to the arrival of the mission within
non-Yao ethnic groups. If the distance interacted with a dummy variable for non-Yao Africans was
significantly correlated with the outcomes before the missionary penetration, it indicates violation
against the excludability of the instrument. On the other hand, the absence of such a significant
relationship provides additional confidence that the instrument satisfies the exclusion restriction.
The pre-missionary level of the outcomes was proxied by population density, because the density
is likely to be correlated with economic prosperity that in turn seems to affect the outcomes
(Acemoglu et al. (2002)). While it is somewhat difficult to obtain population data before the arrival
of the mission, this study exploited two independent data sets. The first historical population data
was sourced from the History Database of the Global Environment (HYDE) 3.1. Within the field
of economics, Fenske (2013) has recently used this database to explain pre-colonial land tenure
and slavery in Africa. The HYDE provides estimates of historical population from 10000 BC to
31

Interim Report for Institutional Roles of Marriage in the Developing World: Empirical Studies from thePerspectives of Gender Empowerment, IDE-JETRO, 2014
2005 AD with a spatial resolution of 5-minute longitude/latitude in raster format (Goldewijk et al.
(2010)). The current research exploited the data on population density in 1900 that was plotted
in Figure 3. In the regression analysis, the 5-by-5-minute cell was used as a unit of observations
and accordingly, the distance to Livingstonia was calculated as that to the centroid of each cell.
Because the historical population estimates are unavoidably imprecise, this study also used
census data as an alternative to the HYDE. However, it appeared that the earliest census data
that was tenable to an empirical analysis could be sourced only from the post-colonial periods,
more precisely, “Malawi Population Census 1966.”51 In order to compensate for the shortcoming
that the analysis had to use data on the post-colonial population density, this study explored the
association of the distance to Livingstonia particularly with the density of the elderly population
aged more than 60 years. This exercise was made, given the assumption that the density of the
elderly cohort could still be used as a proxy for the true density of the total population in the late
19th or early 20th century.52 The assumption may be strong, because the elderly who lived long
until the middle 20th century might have been selected from the initial population born in those
periods, due to some selection mechanisms that might have been related to the level of economic
development in their residential areas. Acknowledging this limitation, nevertheless, the second
analysis was conducted based on the population density of the elderly cohort identified in the 1966
census. In this analysis, a district was used as a unit of observations and accordingly, the distance
to Livingstonia was measured by that to a district’s capital city or a major town.
After replacing the outcome with the pre-missionary population density, a version of equation
(3) was estimated in Table 6. Column (a) and the other columns exploited population data sourced
from the HYDE and the 1966 census, respectively. Instead of the non-Yao dummy used in equation
(3), all the estimations in the table attempted to exploit the proportion of the non-Yao population
(relative to an observational unit’s overall population). However, this information could only be
discerned from the 1966 census. Consequently, as an alternative to the non-Yao dummy, the
analysis exploited the 1966 non-Yao proportion of a district that each cell in Figure 3 was situated
51Several documents also provide some information on the population in the early 20th century, such as “Cen-sus of the Nyasaland Protectorate 1911” and annual reports of “Colonial Reports-Annual, British Central AfricaProtectorate” for the period from 1904 to 1936. The digital version of the latter documents can be obtained fromhttp://libsysdigi.library.illinois.edu/ilharvest/Africana/Books2011-05/469188/ thanks to a contributionmade by University of Illinois at Urbana-Champaign. The population information in those periods can also beobtained from Dixey (1928). However, these documents did not provide detailed figures that could be exploited inan empirical analysis.
52A similar idea can be found in Oster (2012)’s study noted in footnote 37. In the study, to check the exclusionrestriction of an instrumental variable, she attempted to examine whether there was a relationship between acommunity’s distance to the origin of the HIV virus and an individual’s sexual behavior in the period before theepidemic. For this purpose, she investigated pre-marital sexual behavior of elderly individuals aged 45 years andabove that were interviewed in the DHS, assuming that those people would have been engaged in such behaviorbefore the epidemic.
32

Interim Report for Institutional Roles of Marriage in the Developing World: Empirical Studies from thePerspectives of Gender Empowerment, IDE-JETRO, 2014
in in column (a) and a district’s 1966 non-Yao proportion in all the other columns.
Having a similar set of controls but using different sources for the population density revealed
similar sign values of all coefficients in columns (a) and (b). The exclusion restriction of the non-
Yao-distance instrument requires no significant relationship between the distance to Livingstonia
and the population density of regions primarily settled by non-Yao ethnic groups. Indeed, the
estimation results provided support for this view, because the interaction term between the distance
and the non-Yao proportion had no significant impacts on the pre-missionary population density.
In column (c), a district’s gender composition and average age were additionally included. The
analysis in columns (d) to (f) estimated the density of the overall population in 1966 and 1945
(again sourced from the 1966 census report). In Table A.3, the density of both the elderly and the
general population in 1966 was also estimated by using a district-age-gender cohort as a unit of
observations, rather than only a few district-level observations exploited in columns (b) to (f) in
Table 6. All these estimation results also provided no support for that the instrumental variable
approach may not make an extremely strong causal case.
Distance to randomly selected communities
Finally, it was tested if interaction terms between an indicator for non-Yao ethnic groups and a
MDHS community’s distance to three communities (A, B, C) randomly drawn from all the MDHS
ones had statistically significant association with the outcomes. If the non-Yao indicator (interacted
with a community’s distance to Livingstonia) directly influences the outcomes not through its
impacts on religion, the interaction with the distance to those randomly selected communities is
also likely to reveal the significant relationship. On the other hand, the absence of such significant
association may alleviate the concern that the instrumental variable used in this study does not
satisfy the exclusion restriction.
The OLS estimation results of equation (3) that replaces the distance to Livingstonia with a
community’s distance to those three communities are reported in columns (d) to (i) in Table 7.
Since the three communities are randomly selected, as anticipated, the distance to those communi-
ties reveals no significant association with the outcomes, except for the distance to the community
A in column (g) that shows the marginal significance. More importantly, all the interaction terms
between the distance and the non-Yao indicator do not correlate with the outcomes. This suggests
that the previously identified reduced-from impacts of the interaction between the non-Yao dummy
and the distance to Livingstonia (see in Table 5) do not reflect spurious correlation attributed to
the endogeneity of the non-Yao dummy.
In columns (a) to (c), the outcomes are replaced by a dummy for Christianity. While it
was unanticipated (but still possible), the distance to the communities B and C was correlated
33

Interim Report for Institutional Roles of Marriage in the Developing World: Empirical Studies from thePerspectives of Gender Empowerment, IDE-JETRO, 2014
with Christianity with strong significance. However, interestingly, the interaction of the non-Yao
indicator with the distance to those three communities has significant relationship with Christianity
only in case that the distance itself does so. For example, the interaction with the distance to the
community A is not significantly associated with Christianity, probably because the distance itself
has no correlation with the religious beliefs. This observation displays a sharp contrast to the
distance to the communities B and C, i.e., the interaction terms between the distance to these
communities and the non-Yao dummy as well as the level effects are both significant. This contrast
is not inconsistent with the instrument relevance argument that the distance to Livingstonia plays
a role in characterizing the marital practices only for non-Yao ethnic groups.
5.3 Checking on selectivity concern
As discussed in subsection 3.3, one remaining concern is that all the previously identified religious
effects may entirely be attributed to the use of the selective females that were in the first marital
union. This subsection conducts two informal tests to check if the selection bias indeed accounts
for all those impacts. Both checks attempt to exploit females that were not in wedded relationship
as well as those who were, to avoid the concern associated with the sample selection.
5.3.1 Checking on early marriage
To check if the estimated effects of Christianity on age at marriage is not solely the selection bias,
the first test alternatively estimated for both the single and married females aged less than 25 years
old
mij = ρ1 + ρ2cij + ρ3eij + ρ4xij + µij , (4)
where mij takes the value of one if they were married and zero otherwise. In the absence of the
causal impact of Christianity on age at marriage, it is likely that the estimated ρ2 is insignificantly
different from zero, suggesting that the previously identified positive effects of Christianity on age
at marriage was entirely the selection bias. On the other hand, if the estimated ρ2 takes a negative
value, this may provide support for the causal interpretation that compared to those practicing
other religions or no religion, Christian females are indeed more likely to postpone their marriage.
The OLS estimation results corresponding to those reported in columns (d) to (f) in Table 5
(i.e., the results of the reduced-form equation) are reported in columns (a) to (c) in Table A.6. As
before, the results indicate that non-Yao Africans residing in areas less exposed to the Christian
mission (i.e., areas a great distance away from Livingstonia) are more likely to form a marital
union by the ages of 25 years, suggesting the existence of early marriage practices. Columns (d)
34

Interim Report for Institutional Roles of Marriage in the Developing World: Empirical Studies from thePerspectives of Gender Empowerment, IDE-JETRO, 2014
to (m) in Table A.6 correspond to columns (a) to (j) in Table 3 in terms of both the estimation
methodologies (OLS or 2SLS) and the set of instruments exploited. All those estimation results
show that Christian females are less likely to get married by the ages of 25 years, confirming the view
that Christian females are indeed more likely to postpone their marriage than the non-Christian
counterpart.
5.3.2 Checking on the rank of wives
The second test was exercised to address the selectivity concern associated with the religious effects
on the entry into polygyny. Instead of estimating the probability of being in a polygynous union,
this exercise estimated the rank of the respondent among a partner’s wives by using both the single
and married females. Since the information is absent for the single females, the rank was assumed
to take the value of zero for them as well as one for females keeping a monogamous union. Again,
the test limited the sample into single and married females less than the ages of 25 years. As these
females are young, it appears that a distinction between those who were in wedded relationship
and those who were not simply reduces into a distinction between females that had never been
married and females that got married. Consequently, this sample restriction was made to enable
the analysis primarily to consider the concern associated with selection into the first marriage
(i.e., to focus on the formation of the first marital union), destressing the concerns associated with
selection into separation and/or selection into the second (or further) marriage.
Both the reduced-form and structural estimation results of the rank among wives are reported
in Table A.7, whereby columns (a) to (c) and (d) to (m) correspond to columns (g) to (i) in Table
5 and columns (a) to (j) in Table 4, respectively. Estimating the rank by using both the single and
married females unaffected the implications obtained from the previous analysis, providing support
for the view that Christian females are less likely to enter into the polygynous relationship.
While they are obviously not perfect, these two exercises provided some evidence indicating
that the selectivity bias alone does not fully account for the previously identified religious effects.
Last but not least, even if the selection problem biases the OLS estimation results, it may not be
the case in the 2SLS estimations, provided that the non-Yao-distance interaction is uncorrelated
with some unidentified attributes that not only drive the selection but also correlate with an
individual’s religious faith as well as the outcomes. This paper has difficulty in enumerating such
personal traits.
35
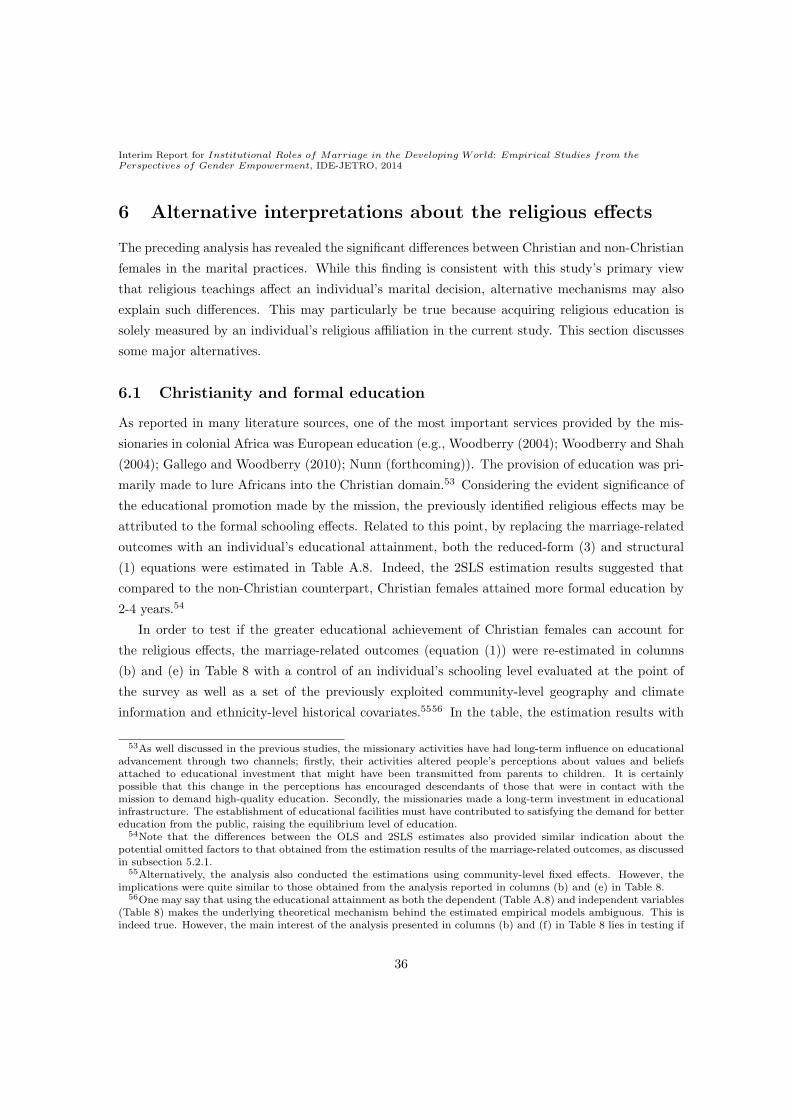
Interim Report for Institutional Roles of Marriage in the Developing World: Empirical Studies from thePerspectives of Gender Empowerment, IDE-JETRO, 2014
6 Alternative interpretations about the religious effects
The preceding analysis has revealed the significant differences between Christian and non-Christian
females in the marital practices. While this finding is consistent with this study’s primary view
that religious teachings affect an individual’s marital decision, alternative mechanisms may also
explain such differences. This may particularly be true because acquiring religious education is
solely measured by an individual’s religious affiliation in the current study. This section discusses
some major alternatives.
6.1 Christianity and formal education
As reported in many literature sources, one of the most important services provided by the mis-
sionaries in colonial Africa was European education (e.g., Woodberry (2004); Woodberry and Shah
(2004); Gallego and Woodberry (2010); Nunn (forthcoming)). The provision of education was pri-
marily made to lure Africans into the Christian domain.53 Considering the evident significance of
the educational promotion made by the mission, the previously identified religious effects may be
attributed to the formal schooling effects. Related to this point, by replacing the marriage-related
outcomes with an individual’s educational attainment, both the reduced-form (3) and structural
(1) equations were estimated in Table A.8. Indeed, the 2SLS estimation results suggested that
compared to the non-Christian counterpart, Christian females attained more formal education by
2-4 years.54
In order to test if the greater educational achievement of Christian females can account for
the religious effects, the marriage-related outcomes (equation (1)) were re-estimated in columns
(b) and (e) in Table 8 with a control of an individual’s schooling level evaluated at the point of
the survey as well as a set of the previously exploited community-level geography and climate
information and ethnicity-level historical covariates.5556 In the table, the estimation results with
53As well discussed in the previous studies, the missionary activities have had long-term influence on educationaladvancement through two channels; firstly, their activities altered people’s perceptions about values and beliefsattached to educational investment that might have been transmitted from parents to children. It is certainlypossible that this change in the perceptions has encouraged descendants of those that were in contact with themission to demand high-quality education. Secondly, the missionaries made a long-term investment in educationalinfrastructure. The establishment of educational facilities must have contributed to satisfying the demand for bettereducation from the public, raising the equilibrium level of education.
54Note that the differences between the OLS and 2SLS estimates also provided similar indication about thepotential omitted factors to that obtained from the estimation results of the marriage-related outcomes, as discussedin subsection 5.2.1.
55Alternatively, the analysis also conducted the estimations using community-level fixed effects. However, theimplications were quite similar to those obtained from the analysis reported in columns (b) and (e) in Table 8.
56One may say that using the educational attainment as both the dependent (Table A.8) and independent variables(Table 8) makes the underlying theoretical mechanism behind the estimated empirical models ambiguous. This isindeed true. However, the main interest of the analysis presented in columns (b) and (f) in Table 8 lies in testing if
36

Interim Report for Institutional Roles of Marriage in the Developing World: Empirical Studies from thePerspectives of Gender Empowerment, IDE-JETRO, 2014
no control of the educational attainment in columns (a) and (d) were taken from Tables 3 and 4
to be compared to the results that controlled for the level of schooling.
The educational attainment has significantly positive correlation with age at marriage and
negative association with polygynous marriage. However, including own educational achievement
unaffected the religious effects previously identified in the 2SLS estimations. Considering the
common belief that the Christian mission provided great education that might in turn have helped
women avoid early marriage and polygyny, the finding that formal educational achievement did
not change the religious effects is truly striking.
While the results are not reported here to save space, another exercise was also implemented
that additionally controlled for a community’s characteristics relevant to educational facilities again
sourced from the IHS, namely (i) the number of teachers and pupils at the nearest government
primary and secondary schools, (ii) the number of primary and secondary schools run by religious
organizations, and (iii) the number of private primary and secondary schools.57 The obtained
implications remained unchanged. To sum up, it appears that formal education does not play a
role in explaining the religious effects on women’s early marriage practice and polygyny.
6.2 Fear of HIV infection
Malawi has one of the highest HIV prevalence rates in the world. If women take the prevalence
into account when they get married, the previously identified religious effects may be attributed
to HIV/AIDS-related adult mortality that might have differed by religion. For example, Ueyama
and Yamauchi (2009) showed that in Malawi, an increase in mortality among prime-age adult
population lowered women’s age at marriage and they interpreted this finding as women’s attempt
to avoid HIV infection associated with pre-marital sexual intercourse. Given this mechanism, if
the rate of HIV prevalence is higher among the non-Christian than among the Christian for some
reasons and marriage candidates refer only to the same congregation as a source of the prevalence
information, then, non-Christian females may enter into marriage at earlier age than the Christian
counterpart.
In order to test this possibility, firstly, this study checked if the rate of HIV prevalence varied
by religion by estimating the versions of equations (1) and (3) in Table A.9, whereby the marriage-
related outcomes were replaced with an individual’s HIV serostatus. The 2004 and 2010 MDHS
collected blood for HIV testing from the sample respondents who voluntarily tested for HIV.
The analysis in Table A.9 exploited data pertaining to all (i.e., both single and married) available
the religious effects disappear once an individual’s educational achievement is controlled for, rather than in strictlymodeling and identifying the structural relationship between educational attainment and marital practices.
57All these measures are evaluated at the point of the IHS.
37

Interim Report for Institutional Roles of Marriage in the Developing World: Empirical Studies from thePerspectives of Gender Empowerment, IDE-JETRO, 2014
females, because there is no reason to limit the attention to females in the first marital union in this
exercise. The estimation results showed that the non-Yao Africans living in closer to Livingstonia
- who were thus more likely to be Christian - and Christian females were less likely to be HIV
positive, although the statistical significance was not always strong. The voluntary nature of the
testing protocol requires more careful examination about the causal relationship between religion
and HIV serostatus which is open for future research. In addition, simply exploring impacts
of religious denomination may not be a worthwhile exercise for explaining the HIV prevalence,
compared to considering influence of what religion means to people in a setting in which they
live (Trinitapoli and Weinreb (2012), p.204). Nevertheless, the current data analysis still provided
indication that the rate of HIV prevalence was lower among Christian females than among the
non-Christian counterpart.
Give the significant association between religion and HIV serostatus, then, equation (1) was
estimated by 2SLS in columns (a) and (c) in Table 9 to check if the previously identified religious
effects could be attributed to the rate of HIV prevalence that differed by religion. The exercises
attempted to additionally control for the rate of HIV prevalence at the community-level that
females faced at the time of marriage. If the fear of HIV infection accounts for the religious effects,
including the prevalence may absorb the effects.
To construct the prevalence measure, as Oster (2012) did, the analysis could have collapsed
the HIV data to the cluster level. However, this exercise results in excluding the entire obser-
vations in 2000 MDHS from the analysis. It might also have been possible to estimate the past
prevalence by using the current information (e.g., Oster (2010)). However, the implementation
requires additional pieces of information that may not necessarily be available. With respect to
these issues, using the DHS data drawn from 14 African countries including Malawi, Oster (2012)
showed that a community’s distance from the origin of the HIV virus in the Democratic Republic
of the Congo (latitude, -6.31; longitude, 23.59) had significantly negative association with the rate
of HIV prevalence in a community. Relying on this finding, the current study decided to use the
distance between the origin point and each community’s location as a proxy for the prevalence of
HIV. In practice, the distance was interacted with an individual’s age, considering its time-varying
influence that may result from individually differing timing of marriage. Using the distance rather
than the actual prevalence also helps this study avoid controlling for the endogeneity associated
with the latter as well as simplify the analysis.
Before turning to a description of the estimation results, to confirm the negative association, it
was attempted in columns (e) in Table 9 to relate HIV prevalence at the community-level, measured
by the proportion of HIV positive (both male and female) respondents among those who tested for
HIV in each community, to a community’s distance from the origin of the HIV virus. The result
38

Interim Report for Institutional Roles of Marriage in the Developing World: Empirical Studies from thePerspectives of Gender Empowerment, IDE-JETRO, 2014
using the community-level data ensured the finding reported in Oster (2012).
Two major findings are obtained from the estimation results in columns (a) and (c) in Table
9. Firstly, the distance from the virus origin (interacted with an individual’s age) were positively
correlated with age at marriage and negatively with polygamy, suggesting that women living in a
community severely affected by HIV were more likely to marry early as well as enter into polygamy.
While giving theoretical interpretations to these observations is beyond the scope of this paper,
the first finding may be consistent with that reported in Ueyama and Yamauchi (2009). Secondly
and more importantly, while some relationship between religion and HIV serostatus might have
existed, additionally controlling for the HIV prevalence unaffected the religious effects.
The analysis in columns (b) and (d) limits the attention to data pertaining to females living
in a matrilineal community, where females usually stay in their natal village even after marriage.
This exercise was made because the distance of the current community from the origin of HIV
virus might be more relevant to those females than females that usually marry out their natal
community due to social custom. While the reduced number of observations made the religious
effects insignificant in case of age at marriage, the results still yielded similar implications to those
obtained from the analysis using the full sample. The analysis in Table 9 might have fallen short
of adequately testing the story of interest, because it did not make a distinction between the
rate of HIV prevalence among Christian females and that among the non-Christian counterpart.
However, the fact that additionally including (the proxy for) the overall HIV prevalence at the
community-level made the religious effects intact is less likely to provide support for the story.
6.3 Search theoretic mechanisms
Based on field interviews that the author made (see footnote 4), a groom typically initiates a
process of marriage by proposing to a bride. While this observation cannot be generalized due
to the non-random nature of convenience sampling as well as the small sample size, the religious
effects may be explained by socio-economic factors that affect a bride’s decision about whether to
shop for grooms by refusing to accept unattractive terms of marriage contracts.
6.3.1 Marriage market segmentation
If people simply prefer to get married with those that follow the same religion, male-to-female
ratio among the congregation in each religious denomination may affect the marital practices.
For example, the lower sex-ratio among non-Christian people than that among the Christian may
encourage females in the former group to accept an unwanted proposal, which may or may not
include polygamy, at earlier age by reducing chances of receiving another offer.
39

Interim Report for Institutional Roles of Marriage in the Developing World: Empirical Studies from thePerspectives of Gender Empowerment, IDE-JETRO, 2014
One possible way to test this story is to see if additionally including the sex-ratio in a local
marriage market associated with each religious sect absorbs the religious effects. However, this
strategy cannot be taken because of the lack of such information. Alternatively, two exercises were
implemented to test whether such segmentation existed; firstly, it was explored whether marital
behavior of Christian females living in a community strongly governed by non-Christian culture
varied by that of Christian females living in a Christian community. In the second exercise, it was
also checked whether the marital outcomes of Christian females differed between those who got
married with non-Christian males and those having Christian husbands.
With respect to the first exercise, the IHS collected information on the most common religion
practiced in a community, i.e., Christianity (reference group), Islam, or African tradition. In
columns (a), (b), (d) and (e) in Table 10, equation (1) was estimated by 2SLS after including the
information in regressors as well as that interacted with an individual’s religious beliefs. If such
market segmentation indeed existed, the interaction term is likely to be statistically significant.
The estimation result in column (a) indeed suggests that Christian females in a Muslim com-
munity (i.e., religious minority) are likely to marry earlier than those in a Christian community
(i.e., religious majority), although the significance is marginal. However, such significant effect is
absent in case of polygamy in column (d). Similar to the exercises conducted in subsection 6.2, the
analysis in columns (b) and (e) restricted the sample to females living in a matrilineal community,
given the presumption that the community-level religious information that was evaluated at the
point of the IHS would be more relevant to those females. While the reduced number of observa-
tions might have made the estimation results less precise, the results provide no strong support for
the presence of marriage market segmentation in religious line.
Regarding the second exercise, in the MDHS, a partner’s religion was available only for males
between the ages of 15 and 54 in one-third (one-fourth in 2000) of the selected households. Including
this information and its interaction terms with a respondent’s religion in regressors, the analysis in
columns (c) and (f) in Table 10 estimated equation (1) by 2SLS. While measurement errors may
exist, the difference/similarity between a respondent’s and her husband’s religion may capture the
degree of her tolerance towards different religious doctrines at the time of marriage. If females who
got married within the same religion indeed had preference to search for partners following the same
religion at the time of marriage, the limited set of marriage candidates might have prompted them
to marry earlier, compared to females that experienced inter-religious marriage. This suggests the
presence of segmentation in the marriage market.
Due to the small number of observations, the estimation results in columns (c) and (f) in Table
10 appear to be somewhat imprecise. However, the results provide no strong evidence suggesting
that Christian females who formed a marital union with Christian males did so at earlier age than
40

Interim Report for Institutional Roles of Marriage in the Developing World: Empirical Studies from thePerspectives of Gender Empowerment, IDE-JETRO, 2014
Christian females who entered into the inter-faith marriage, although the former females were less
likely to create polygynous relationship, compared to Christian females having Muslim husbands.
In all the estimations in Table 10, both the variables of a community’s major religion and a
husband’s religion were regarded as exogenous. Accordingly, the information interacted with both
the dj and djeij were used to instrument the interaction terms between those variables and an
individual’s religious beliefs. In addition, in the first exercise, it was also assumed that while the
major religion was evaluated at the point of the IHS, the situation was not significantly different
from the circumstance that the sample females in the MDHS faced at the time of marriage.58 These
assumptions should be recognized as analytic limitations. Nevertheless, as noted in subsection 3.2,
from the author’s view based on the field interviews, the inter-religious marriage is not strictly
prohibited in Malawi (although Christianity-Islam marriage may sometimes be a difficult decision).
Combining this qualitative information with evidence presented in Table 10, the marriage market
segmentation along the religious line is less likely to explain the religious effects.
Furthermore, the community-level religious information exploited in the first exercise may be
associated with religion-based infrastructure and governance structure in a community. The anal-
ysis in Table 10 indicates that the religious effects remain even after considering these issues.
6.3.2 Labor market segmentation
The present discounted value of future utility obtained from both the spinsterhood and marriage
life and the associated uncertainty about access to such utility are likely to affect marriage decisions.
For example, it is certainly possible that the labor market is segmented in line by religion for some
reasons (e.g., either taste-based or statistical discrimination) and that accordingly future earnings
opportunities vary by religious affiliation. If females take these issues into account when they
decide whether to accept a proposal, the labor market fragmentation may also account for the
religious effects.
The analysis in columns (c) and (f) in Table 8 tested this possibility by estimating equation
(1) that included women’s current occupational status in regressors, i.e., not working, profes-
sional/technician/management, clerical workers, salesperson, self-employed agricultural workers,
employed agricultural workers, household/domestic service providers, service workers, skilled man-
ual workers, and unskilled manual workers. This exercise was made given the presumption that
the current activities were more or less similar to those that at the time of marriage, the sample
females expected themselves to engage in in the future. If such segmentation explains the religious
effects, including these occupational variables is likely to absorb the impacts.
58In other words, this study assumed that a community’s major religion has not significantly changed over thelast several decades.
41

Interim Report for Institutional Roles of Marriage in the Developing World: Empirical Studies from thePerspectives of Gender Empowerment, IDE-JETRO, 2014
However, including the occupation-fixed effects unaffected the previously identified religious
effects. This finding does not provide support for that the religious effects are attributed to
religion-based labor market segmentation that might have existed.
7 Conclusion
Churches, mosques and other places of worship are commonly found in the developing world. In
some policy spheres, by virtue of the close proximity to the population, the religious organizations
may play a more effective role in the process of development than political infrastructure such as
administrative agencies and governments does. One potential of religion guiding the growth of
economy is religious education. However, within the field of economics, not many rigorous efforts
have been made to better understand how such education (more generally, religious beliefs) causally
affects socio-economic outcomes as well as whether and how the social fabric can be embedded in
policy discourses. To fill this knowledge gap, using individual-level data provided by the MDHS
(2000, 2004, 2010), this paper has attempted to present empirical evidence showing how religious
teachings affect women’s decision to enter into marriage.
Two steps were taken to meet the objective; firstly, due to the limitations imposed by the data,
this study regarded an individual’s religious affiliation as acquiring religious education and then
tested if the affiliation had causal influence on marriage conducts. Secondly, the analysis explored
whether receiving religious teachings was indeed the underlying mechanism of the causal effects.
In the first-step analysis, in order to address potential endogeneity associated with an individ-
ual’s religious affiliation, two strategies were taken. Firstly, an attempt was made to control for
a great number of local geographic and climate conditions that might have affected the mission’s
decision to establish the work stations. Such information was sourced from the IHS (2010-2011)
that provided abundance of the details surrounding the surveyed communities. The GPS-based
positional information of the surveyed communities made this implementation possible, as it al-
lowed the current study to identify the IHS communities in the immediate proximity to those
surveyed in the MDHS. While the information was provided at the ethnicity-level, not at the
present community-level, the analysis also attempted to control for European influence during
colonial periods as well as intensity of slave trade during the 19th century.
The second strategy exploited an instrumental variable, assuming that those who lived close
to the mission’s influential station, Livingstonia in the late 19th and early 20th centuries as well
as the descendants were more clearly familiarized with Christian ideas than the counterpart living
away from Livingstonia, when they were not the Yao. The Yao converted to Islam because of
their allies with the Arabs based on ivory and slave trades that had existed prior to the arrival
42

Interim Report for Institutional Roles of Marriage in the Developing World: Empirical Studies from thePerspectives of Gender Empowerment, IDE-JETRO, 2014
of the mission. Using a community’s distance to Livingstonia interacted by an indicator variable
for non-Yao ethnic groups as an IV for the religious distribution of the current generation with a
control of the ethnicity-level historical covariates and abundance of community-level information
or community-fixed effects, this study found that compared to those practicing the other religions
(Islam and other) or no religion, Christian females were more likely to postpone their marriage by 1-
3 years with less likelihood of engaging in polygynous relationship by approximately 30 percentage.
Considering the mean age at first marriage, 17.39 years and the proportion of polygynous marriage
among all (current) marriages, 16 percentage points that were discerned from the MDHS, the
impacts are truly remarkable.
Referring to an individual’s religious affiliation as receiving religious teachings makes it possible
for the identified religious effects to have alternative interpretations. Then, in the second step, this
study examined other major channels that might have underlain the causal impacts. Given the
evident significance of educational facilitation made by the missionaries, of the presence of the
HIV epidemic as well as of possible segmentation in both the marriage and labor markets, it was
investigated whether those factors could account for the religious effects. This study did not find
strong evidence supporting those alternative stories.
A few qualifications may be expressed with respect to this study’s ability to make the findings
relevant in a much broader context of the developing world. Firstly, influence of religious teachings
may not be universal both spatially and temporally. Religious doctrines may be continuously ad-
justed to new situations (Lewis (1955), p.106). For instance, given potential adherents’ strategic
choice of religion, it is possible that each denomination may modify the codes to entice them in
a competitive religious market. Priests may also differently (re-)interpret religious doctrines from
their conviction, frustration, or ambition. Believers in the same religion may also have different
understandings about the materials of the teachings. Even if they similarly understand the in-
struction, some may ignore teachings that prevent them from seizing own economic opportunities.
All these suggest that it would be useful for future research to explore what teaching materials
would be at play under what conditions. Secondly, in addition to the consideration of the external
validity, even internally, it is also true that the current research has only established the causal re-
lationship between religious education and one particular type of welfare outcomes. Consequently,
neither which religion provides the superiority over others in term of prospects for economic growth
nor whether religious teachings uniformly influence economic development across spaces and over
time is not the argument of the current research. The main point presented in this paper is that
whatever form they take, religious teachings would indeed have potential to constitute a social and
economic reality as development forces.
43

Interim Report for Institutional Roles of Marriage in the Developing World: Empirical Studies from thePerspectives of Gender Empowerment, IDE-JETRO, 2014
A Appendix: Geographic and climate controls
This section describes community-level geographic and climate controls (as well as the original
sources) that are all publicly available in the IHS data set. The variables description refers to
‘Geovariables.Description.pdf’ (http://microdata.worldbank.org/index.php/catalog/1003).
A.1 Climatology
The original data on climatology is sourced from ‘WorldClim - Global Climate Data,’ University
of California, Berkeley.59
Mean temperature (Bio1): average temperature (multiplied by 10 ◦C) based on monthly cli-
matology between 1960 and 1990.
Mean diurnal range (Bio2): average diurnal range - mean of monthly maximum minus minimum
temperature (multiplied by 10 ◦C) - based on monthly climatology between 1960 and 1990.
Isothermality (Bio3): isothermality defined as(
Bio2Bio5−Bio6
× 100).
Temperature seasonality (Bio4): standard deviation of temperature (multiplied by 100) based
on monthly climatology between 1960 and 1990.
Maximum temperature of the warmest month (Bio5): maximum temperature (multiplied
by 10 ◦C) of the warmest month based on monthly climatology between 1960 and 1990.
Minimum temperature of the coldest month (Bio6): minimum temperature (multiplied by
10 ◦C) of the coldest month based on monthly climatology between 1960 and 1990.
Mean temperature of the wettest quarter (Bio8): average temperature of the wettest quarter
(multiplied by 10 ◦C) based on monthly climatology between 1960 and 1990.
Mean temperature of the driest quarter (Bio9): average temperature of the driest quarter
(multiplied by 10 ◦C) based on monthly climatology between 1960 and 1990.
Mean temperature of the warmest quarter (Bio10): average temperature of the warmest
quarter (multiplied by 10 ◦C) based on monthly climatology between 1960 and 1990.
Mean temperature of the coldest quarter (Bio11): average temperature of the coldest quarter
(multiplied by 10 ◦C) based on monthly climatology between 1960 and 1990.
Mean precipitation (Bio12): average annual precipitation (mm) based on monthly climatology
between 1960 and 1990.
Mean precipitation of the wettest month (Bio13): average precipitation (mm) of the wettest
month based on monthly climatology between 1960 and 1990.
59Temperature range (Bio7) defined as Bio5−Bio6 was not used in the estimations to avoid perfect multicollinear-ity among regressors.
44

Interim Report for Institutional Roles of Marriage in the Developing World: Empirical Studies from thePerspectives of Gender Empowerment, IDE-JETRO, 2014
Mean precipitation of the driest month (Bio14): average precipitation (mm) of the driest
month based on monthly climatology between 1960 and 1990.
Precipitation seasonality (Bio15): coefficient of variation of annual precipitation (mm) based
on monthly climatology between 1960 and 1990.
Mean precipitation of the wettest quarter (Bio16): average precipitation (mm) of the wettest
quarter based on monthly climatology between 1960 and 1990.
A.2 Landscape typology
Land cover classes: categorical variables for types of land cover within approximately 1km
buffer in 2009 based on ‘GlobCover Version 2.3’ sourced from the European Space Agency (ESA)
and Universite Catholique de Louvain, i.e., (a) rainfed cropland (reference group); (b) mosaic
cropland (50-70%)/vegetation(20-50%); (c) mosaic vegetation (50-70%)/cropland (20-50%); (d)
closed (> 40%) broadleaved deciduous forest (> 5m); (e) open (15-40%) broadleaved deciduous
forest/woodland (< 5m); (f) open (15-40%) needleleaved deciduous or evergreen forest, (g) mosaic
forest or shrubland (50-70%)/grassland (20-50%); (h) closed to open (> 15%) - broadleaved or
needleleaved, evergreen or deciduous - shrubland (< 5m); (i) closed to open (> 15%) herbaceous
vegetation (grassland, savanna or lichen/moss); and (j) artificial surfaces and associated areas
(urban areas > 50%).
Agricultural land: percentage under agriculture within approximately 1km buffer in 2009 based
on ‘GlobCover Version 2.3’ sourced from the European Space Agency (ESA) and Universite
Catholique de Louvain.
Agro-ecological zones: categorical variables for agro-ecological zones in 2009 sourced from Har-
vestChoice and International Food Policy Research Institute (IFPRI), i.e., (a) tropic-warm/semiarid
(reference group); (b) tropic-warm/subhumid; (c) tropic-cool/semiarid; and (d) tropic-cool/subhumid.
A.3 Soil and terrain
Elevation: elevation (m) based on the Shuttle Radar Topography Mission (SRTM) 90m data
sourced from the National Aeronautics and Space Administration (NASA).
Slope: slope (percent) based on the SRTM 90m data sourced from the U.S Geological Survey
(USGS)
Topographic wetness index: potential wetness index based on the modified SRTM 90m data
sourced from the Africa Soil Information Service (AfSIS). This index is calculated as ln(
Atan b
),
where A is flow accumulation or effective drainage areas and b is slope gradient.
45

Interim Report for Institutional Roles of Marriage in the Developing World: Empirical Studies from thePerspectives of Gender Empowerment, IDE-JETRO, 2014
Terrain roughness: categorical variables for terrain roughness based on the SRTM 90m data
sourced from the Living Standards Measurement Study-Integrated Surveys on Agriculture (LSMS-
ISA), i.e., (a) plains (reference group); (b) mid-altitude plains; (c) high-altitude plains; (d) low-
lands; (e) rugged lowlands; (f) platform (very low plateaus); (g) low plateaus; (h) mid-altitude
plateaus; (i) hills; (j) low mountains; and (k) mid-altitude mountains.
Nutrient availability: categorical variables for nutrient availability based on ‘Harmonized World
Soil Database’ sourced from the Food and Agriculture Organization of the United Nations (FAO),
i.e., (a) no or slight constraint (reference group); (b) moderate constraint; (c) severe constraint;
(d) very severe constraint; (e) mainly non-soil; and (f) water.
Nutrient retention capacity: categorical variables for nutrient retention capacity based on
‘Harmonized World Soil Database’ sourced from the Food and Agriculture Organization of the
United Nations (FAO), i.e., (a) no or slight constraint (reference group); (b) moderate constraint;
(c) severe constraint; (d) very severe constraint; and (e) water.
Rooting conditions: categorical variables for rooting conditions y based on ‘Harmonized World
Soil Database’ sourced from the Food and Agriculture Organization of the United Nations (FAO),
i.e., (a) no or slight constraint (reference group); (b) moderate constraint; (c) severe constraint;
(d) very severe constraint; (e) mainly non-soil; and (f) water.
Oxygen availability to roots: categorical variables for oxygen availability to roots based on
‘Harmonized World Soil Database’ sourced from the Food and Agriculture Organization of the
United Nations (FAO), i.e., (a) no or slight constraint (reference group); (b) moderate constraint;
(c) severe constraint; (d) very severe constraint; and (e) water.
Excess salts: categorical variables for excess salts based on ‘Harmonized World Soil Database’
sourced from the Food and Agriculture Organization of the United Nations (FAO), i.e., (a) no or
slight constraint (reference group); (b) moderate constraint; (c) severe constraint; (d) very severe
constraint; and (e) water.
Toxicity: categorical variables for toxicity based on ‘Harmonized World Soil Database’ sourced
from the Food and Agriculture Organization of the United Nations (FAO), i.e., (a) no or slight con-
straint (reference group); (b) moderate constraint; (c) severe constraint; (d) very severe constraint;
and (e) water.
Field-management constraint: categorical variables for Field-management constraint based on
‘Harmonized World Soil Database’ sourced from the Food and Agriculture Organization of the
United Nations (FAO), i.e., (a) no or slight constraint (reference group); (b) moderate constraint;
(c) severe constraint; (d) very severe constraint; (e) mainly non-soil; and (f) water.
46

Interim Report for Institutional Roles of Marriage in the Developing World: Empirical Studies from thePerspectives of Gender Empowerment, IDE-JETRO, 2014
A.4 Crop season parameters
Mean rainfall: average 12-month total rainfall (mm) from July to June between 2001 and 2011
sourced from ‘Rainfall Estimates (EFE),’ the Climate Prediction Center (NOAA CPC).
Mean rainfall in the wettest quarter: average total rainfall (mm) in the wettest quarter within
12 months from July to June between 2001 and 2011 sourced from ‘Rainfall Estimates (EFE),’ the
Climate Prediction Center (NOAA CPC).
Mean onset date of the wettest quarter: average onset date of the wettest quarter within 12
months from July to June between 2001 and 2011 sourced from ‘Rainfall Estimates (EFE),’ the
Climate Prediction Center (NOAA CPC). The date is measured by dekads ranging from 1 to 36,
where the first dekad of July is normalized to one.
Total rainfall, 2008-2009: 12-month total rainfall (mm) from July in 2008 to June in 2009
sourced from ‘Rainfall Estimates (EFE),’ the Climate Prediction Center (NOAA CPC).
Total rainfall in the wettest quarter, 2008-2009: total rainfall (mm) in the wettest quarter
within 12 months from July in 2008 to June in 2009 sourced from ‘Rainfall Estimates (EFE),’ the
Climate Prediction Center (NOAA CPC).
Onset date of the wettest quarter, 2008-2009: onset date of the wettest quarter within 12
months from July in 2008 to June in 2009 sourced from ‘Rainfall Estimates (EFE),’ the Climate
Prediction Center (NOAA CPC). The date is measured by dekads ranging from 1 to 36, where the
first dekad of July in 2008 is normalized to one.
Total rainfall, 2009-2010: 12-month total rainfall (mm) from July in 2009 to June in 2010
sourced from ‘Rainfall Estimates (EFE),’ the Climate Prediction Center (NOAA CPC).
Total rainfall in the wettest quarter, 2009-2010: total rainfall (mm) in the wettest quarter
within 12 months from July in 2009 to June in 2010 sourced from ‘Rainfall Estimates (EFE),’ the
Climate Prediction Center (NOAA CPC).
Onset date of the wettest quarter, 2009-2010: onset date of the wettest quarter within
12 months from July in June 2009 to June in 2010 sourced from ‘Rainfall Estimates (EFE),’ the
Climate Prediction Center (NOAA CPC). The date is measured by dekads ranging from 1 to 36,
where the first dekad of July in 2009 is normalized to one.
Greenness changes: mean total chanege in greenness (averaged by district), integral of daily
Enhanced Vegetation Index (EVI) values, within a primary growing season between 2001 and 2010
sourced from ‘Land Cover Dynamics - MODIS,’ Boston University.
Mean onset timing of greeness increase: mean onset timing of greenness increase (averaged
by district) within 12 months from July to June between 2001 and 2010 sourced from ‘Land Cover
Dynamics - MODIS,’ Boston University. The timing is measured by days ranging from 1 to 356,
47

Interim Report for Institutional Roles of Marriage in the Developing World: Empirical Studies from thePerspectives of Gender Empowerment, IDE-JETRO, 2014
where the 1st July is normalized to one.
Mean onset timing of greenness decrease: mean onset timing of greenness decrease (averaged
by district) within 12 months from July to June between 2001 and 2010 sourced from ‘Land Cover
Dynamics - MODIS,’ Boston University. The timing is measured by days ranging from 1 to 356,
where the 1st July is normalized to one.
Greenness changes, 2008-2009: total change in greenness (averaged by district), integral of
daily Enhanced Vegetation Index (EVI) values, within a primary growing season from July in 2008
to June in 2009 sourced from ‘Land Cover Dynamics - MODIS,’ Boston University.
Onset timing of greenness increase, 2008-2009: onset timing of greenness increase (averaged
by district) within 12 months from July in 2008 to June in 2009 sourced from ‘Land Cover Dynamics
- MODIS,’ Boston University. The timing is measured by days ranging from 1 to 356, where the
1st July in 2008 is normalized to one.
Onset timing of greenness decrease, 2008-2009: onset timing of greenness decrease (averaged
by district) within 12 months from July in 2008 to June in 2009 sourced from ‘Land Cover Dynamics
- MODIS,’ Boston University. The timing is measured by days ranging from 1 to 356, where the
1st July in 2008 is normalized to one.
Greenness changes, 2009-2010: total change in greenness (averaged by district), integral of
daily Enhanced Vegetation Index (EVI) values, within a primary growing season from July in 2009
to June in 2010 sourced from ‘Land Cover Dynamics - MODIS,’ Boston University.
Onset timing of greenness increase, 2009-2010: onset timing of greenness increase (averaged
by district) within 12 months from July in 2009 to June in 2010 sourced from ‘Land Cover Dynamics
- MODIS,’ Boston University. The timing is measured by days ranging from 1 to 356, where the
1st July in 2009 is normalized to one.
Onset timing of greenness decrease, 2009-2010: onset timing of greenness decrease (averaged
by district) within 12 months from July in 2009 to June in 2010 sourced from ‘Land Cover Dynamics
- MODIS,’ Boston University. The timing is measured by days ranging from 1 to 356, where the
1st July in 2009 is normalized to one.
B Appendix: Merging the IHS community-level informa-
tion with the MDHS data
B.1 Community-level positions
The MDHS collected coordinates of the groupings of households known as clusters (communities).
In order to maintain the confidentiality of the surveyed respondents, the GPS latitude/longitude
48

Interim Report for Institutional Roles of Marriage in the Developing World: Empirical Studies from thePerspectives of Gender Empowerment, IDE-JETRO, 2014
position was publicized after displacing the coordinates by applying a random offset within a
specified range to the position. After this adjustment made, urban clusters contained 0-2 kilometers
of positional error. On the other hand, rural clusters contained 0-5 kilometers of error with a further
1% of them displaced 0-10 kilometers. Nevertheless, this displacement still made the surveyed
clusters fall within an original surveyed area of the country’s second administrative level (district).
For the details, see http://www.measuredhs.com/What-We-Do/GPS-Data-Collection.cfm.
In the IHS, GPS-based household location was collected. Similar to the case in the MDHS,
to enforce respondent confidentiality, this information was disseminated as a community-level
value after manipulating those household-level GPS coordinates. This manipulation included
computing the average of household-level coordiates in a community (enumeration area) at first
and then following the MDHS methodology, applying a random offset to the average coordinate
value. For urban areas, a range of 0-2 kilometers was applied as the random offset, in con-
trast to a range of 0-5 kilometers offset used in rural areas. An additional 0-10 kilometers offset
was also exploited for 1% of the rural clusters effectively to raise the publicly known range of
positional displacement (for all rural points) to the level of 10 kilometers with minimal noise.
Again, this displacement was made, keeping a community’s representative location remain in
the original district. For the details, see ‘Third Integrated Household Survey (IHS3) 2010-
2011 Basic Information Document, March 2012’ (http://siteresources.worldbank.org/
INTLSMS/Resources/3358986-1233781970982/5800988-1271185595871/IHS3.BID.FINAL.pdf).
B.2 Finding the nearest IHS community
By using the community-level GPS coordinates provided by both the MDHS and IHS, this study
selected, from 768 communities surveyed in the IHS, the geographically nearest one to each com-
munity surveyed in the MDHS that contained more than 1900 communities over all three rounds
of 2000, 2004, and 2010.
When calculating the distance between the MDHS and IHS communities, this study used the
great-circle distance (GCD), i.e., the shortest distance between any two points on the surface of a
sphere measured along a path on the surface of the sphere (as opposed to going through the sphere’s
interior). More specifically, in this paper, the GCD between two points i and j was computed as:
Radius (6378.7 km) ×
arccos
[sin
(latitudei
57.2958
)× sin
(latitudej
57.2958
)+ cos
(latitudei
57.2958
)× cos
(latitudej
57.2958
)× cos
(longitudej
57.2958−
longitudei
57.2958
)]. (B.1)
Because both the MDHS and IHS communities spatially spread all over the country ( see Appendix
49
Interim Report for Institutional Roles of Marriage in the Developing World: Empirical Studies from thePerspectives of Gender Empowerment, IDE-JETRO, 2014
Figure A.3, whereby the sample communities in both the surveys are dotted, although for easeness
of visual identification, only the 2010 MDHS communities were compared to the IHS ones in the
figure), it was not difficult to identify an IHS community in the closest proximity with relatively
short distance to all the MDHS communities. As a matter of fact, approximately 95% (99%) of the
MDHS communities was matched with the nearest IHS community less than 10 (15) kilometers
away from them, with a MDHS community having the maximum distance of approximately 67
kilometers to the nearest IHS one.
B.3 Goodness of fit of the IHS data to the MDHS data
In order to see the goodness of fit of the characteristics of the nearest IHS communities to the
MDHS data, three informal checks that used the merged MDHS data were invented. Firstly, this
study regressed a dummy variable, equal to one if the MDHS sample females were Christian and
zero otherwise, with a dummy variable, which takes one if Christianity was the most common
religion practiced in the nearest IHS communities, in column (a) in Appendix Table A.1. If
the community-level characteristics of the IHS data fit well to the MDHS data, the significantly
positive relationship is likely to be found. The result indeed supports this view. Similar exercises
associated with Islam and other or no religion were also conducted in columns (b) and (c) in the
table, providing further support for the fitness.
The second exercise imported the idea used from the first test but now with an emphasis placed
on ethnicity, rather than religions. For example, in column (d) in Appendix Table A.1, a dummy
variable that takes the value of one if the MDHS sample females were identified as Chewa (ethnic
group) was estimated by a dummy variable, equal to one if the most common language spoken at
home in the nearest IHS communities was Chewa and zero otherwise. Again, given the good fit
of the IHS community-characteristics to the MHDS data, these two variables are likely to reveal
significantly positive association that was indeed confirmed in the column. The remaining columns
in the table report the estimation results implemented for the other ethnic groups. As a whole, it
appears that the results provided some comfort for the goodness of fit between the two data sets.
Finally, in columns (f) to (j) in Appendix Table A.2, a dummy variable, which takes one if the
MDHS sample females that were in wedded relationship were not born in the current residential
place and zero otherwise, was regressed by a dummy variable, equal to one if the nearest IHS
communities traced their descent through their mothers and zero otherwise. This exercise was
made to confirm that married females were less likely to be migrants in the present residential
place if the nearest IHS communities had traditionally adopted a matrilineal descent system. This
is because the default norm of the marriage-related relocation associated with the matrilineality is
50

Interim Report for Institutional Roles of Marriage in the Developing World: Empirical Studies from thePerspectives of Gender Empowerment, IDE-JETRO, 2014
matrilocal, i.e., females stay in their natal villages that their husband marries into, as opposed to
patrilocality (i.e., females leave their natal home and marry into their husband’s villages) associated
with a patrilineal descent system. Since the norm may not be strictly enforced in urban areas, the
analysis allowed for heterogeneiy in the relationship between the matrilineal descent rule and the
migrant probability according to this dimension, namely by interacting the dummy for the nearest
IHS communities characterized by the matrilineality with the distance (km) to the nearest town
having population over 20000. In the analysis, the distance took a categorical form, whereby the
communities were split into 6 groups in the column (f), 5 in (g), 4 in (h), 3 in (i) and 2 in (j) as
well as the reference group was always a group in the farthest distance.
As expected, the results show that compared to the counterpart in patrilineal communities,
on average, married females residing in matrilineal communities were less likely to be migrants
in the current residential place as well as that within matrilineal communities, married females
were more likely to stay in their natal home as the current residential place was situated a greater
distance away from the nearest population center. The analysis in columns (k) to (o) that limited
the sample into females residing in the MDHS communities located less than 10 kilometers away
from the nearest IHS communities revealed the similar pattern.
The relationship between the migrant probability and matrilineality provides another support
for the goodness of fit of the community-level characteristics of the nearest IHS communities to the
individual characteristics of the MDHS females. Moreover, in columns (a) to (d) in Appendix Table
A.2, the migrant probablility was again estimated now by using only the IHS data (i.e., female
observations of the IHS), with a similar set of controls and specification used in columns (f) to (o)
in the table. The estimation results revealed a remarkably similar pattern to the association of the
migrant probability with the matrilineal descent rule identified in the estimations that exploited
the merged MDHS data. This finding may give this study further encouragement to use the MDHS
data joined with the characteristics of the nearest IHS communities in an entire empirical analysis.
51

Interim Report for Institutional Roles of Marriage in the Developing World: Empirical Studies from thePerspectives of Gender Empowerment, IDE-JETRO, 2014
References
Acemoglu, D., Johnson, S., Robinson, J. A., December 2001. The colonial origins of comparatives
development: An empirical investigation. American Economic Review 91 (5), 1369–1401.
Acemoglu, D., Johnson, S., Robinson, J. A., 2002. Reversal of fortune: Geography and institutions
in the making of the modern world income distribution. Quarterly Journal of Economics 117 (4),
1231–1294.
Aldashev, G., Platteau, J.-P., 2014. Religion, Culture, and Development. Elsevier, pp.587-631,
Chapter 21 in Handbook of the Economics of Art and Culture, vol. 2 edited by Victor A.
Ginsburgh and David Throsby.
Alesina, A., Devleeschauwer, A., Easterly, W., Kurlat, S., Wacziarg, R., 2003. Fractionalization.
Journal of Economic Growth 8, 155–194.
Alesina, A., Ferrara, E. L., September 2005. Ethnic diversity and economic performance. Journal
of Economic Literature 43 (3), 762–800.
Alesina, A., Giuliano, P., Nunn, N., 2013. On the origins of gender roles: Women and the plough.
Quarterly Journal of Economics 128 (2), 469–530.
Arrunada, B., September 2010. Protestants and catholics: Similar work ethic, different social ethic.
Economic Journal 120 (547), 890–918.
Barr, A., Oduro, A., August 2002. Ethnic fractionalization in an african labour market. Journal of
Development Economics 68 (2), 355–379.
Barro, R. J., McCleary, R. M., November 2005. Which countries have state religions? Quarterly
Journal of Economics 120 (4), 1331–1370.
Benabou, R., Tirole, J., May 2006. Beliefs in a just world and redistributive politics. Quarterly
Journal of Economics 121 (2), 699–746.
Berman, E., 2000. Sect, subsidy, and sacrifice: An economist’s view of ultra-orthodox jews. Quar-
terly Journal of Economics 115 (3), 905–953.
Bisin, A., Verdier, T., April 2001. The economics of cultural transmission and the dynamics of
preferences. Journal of Economic Theory 97 (2), 298–319.
Botticini, M., Eckstein, Z., December 2005. Jewish occupational selection: Education, restrictions,
or minorities? Journal of Economic History 65 (4), 922–948.
52

Interim Report for Institutional Roles of Marriage in the Developing World: Empirical Studies from thePerspectives of Gender Empowerment, IDE-JETRO, 2014
Botticini, M., Eckstein, Z., September 2007. From farmers to merchants, conversions and diaspora:
Human capital and jewish history. Journal of the European Economic Association 5 (5), 885–926.
Cantoni, D., Yuchtman, N., April 2012. Medieval universities, legal institutions, and the commercial
revolution. National Bureau of Economic Research (NBER) Working Paper (17979).
Carvalho, J.-P., 2013. Veiling. Quarterly Journal of Economics 128 (1), 337–370.
Century Company, 1911. The Century Atlas: Africa [map].
Chen, D. L., 2010. Club goods and group identity: Evidence from islamic resurgence during the
indonesian financial crisis. Journal of Political Economy 118 (2), 300–354.
Cipriani, M., Giuliano, P., Jeanne, O., June 2013. Like mother like son? experimental evidence on
the transmission of values from parents to children. Journal of Economic Behavior & Organiza-
tion 90, 100–111.
Clingingsmith, D., Khwaja, A. I., Kremer, M., 2009. Estimating the impact of the hajj: Religion
and tolerance in islam’s global gathering. Quarterly Journal of Economics 124 (3), 1133–1170.
Commission for Africa, March 2005. Our common interest: Report of the commision for africa.
Dalton, J. T., Leung, T. C., forthcoming. Why is polygyny more prevalent in western africa? an
african slave trade perspective. Economic Development and Cultural Change.
Davison, J., 1997. Gender, Lineage, and Ethnicity in Southern Africa. Westview Press.
de Jong, E., 2011. Religious Values and Economic Growth: A Review and Assessment of Recent
Studies. C Hurst & Co Publishers Ltd, pp.111-140, Chapter 5 in Religion and Development:
Ways of Transforming the World, edited by Gerrie Ter Haar.
Dehejia, R., DeLeire, T., Luttmer, E. F. P., February 2007. Insuring consumption and happiness
through religious organizations. Journal of Public Economics 91 (1-2), 259–279.
Dixey, F., 1928. The distribution of population in nyasaland. Geographical Review 18 (2), 274–290,
American Geographic Society.
Dohmen, T., Falk, A., Huffman, D., 2011. The intergenerational transmission of risk and trust
attitudes. Review of Economic Studies 79 (2), 645–677.
Easterly, W., Levine, R., 1997. Africa’s growth tragedy: Policies and ethnic divisions. Quarterly
Journal of Economics 112 (4), 1203–1250.
53

Interim Report for Institutional Roles of Marriage in the Developing World: Empirical Studies from thePerspectives of Gender Empowerment, IDE-JETRO, 2014
Farre, L., Vella, F., April 2013. The intergenerational transmission of gender role attitudes and its
implications for female labor force participation. Economica 80 (318), 219–247.
Fenske, J., November 2012. African polygamy: Past and presentmimeo.
Fenske, J., December 2013. Does land abundance explain african institutions? Economic Journal
123 (573), 1363–1390.
Fernandez, R., 2011. Does Culture Matter? North Holland, pp.481-510, Chapter 11 in Handbook
of Social Economics, vol. 1A edited by Jess Benhabib, Matthew O. Jackson, and Alberto Bisin.
Fernandez, R., 2013. Cultural change as learning: The evolution of female labor force participation
over a century. American Economic Review 103 (1), 472–500.
Gallego, F. A., Woodberry, R., 2010. Christian missionaries and education in former african
colonies: How competition mattered. Journal of African Economies 19 (3), 294–329.
Gerber, A., Gruber, J., Hungerman, D. M., May 2010. Does church attendance cause people to
vote? using blue laws repeal to estimate the effect of religiosity on voter turnoutmimeo.
Goldewijk, K. K., Beusen, A., Janssen, P., June 2010. Long-term dynamic modeling of global
population and build-up area in a spatially explicit way: Hyde 3.1. The Holocene 20 (4), 565–
573.
Greif, A., October 1994. Cultural beliefs and the organizations of society: A historical and theo-
retical reflection on collectivist and individualist societies. Journal of Political Economy 102 (5),
912–950.
Gruber, J., Hungerman, D. M., May 2008. The church versus the mall: What happens when
religion faces increased secular competition? Quarterly Journal of Economics 123 (2), 831–862.
Guiso, L., Sapienza, P., Zingales, L., January 2003. People’s opium? religion and economic atti-
tudes. Journal of Monetary Economics 50 (1), 225–282.
Haar, G. T., Ellis, S., 2006. The role of religion in development: Towards a new relationship
between the european union and africa. European Journal of Development Research 18 (3),
351–367.
Henrich, J., Ensminger, J., Barr, A., McElreath, R., forthcoming. Major Empirical Results: Mar-
kets, Religion, Community Size, and the Evolution of Fairness and Punishment. The Russell
Sage Foundation Press, New York, Chapter in Experimenting with Social Norms: Fairness and
Punishment in Cross-Cultural Perspective, edited by Jean Ensminger and Joseph Henrich.
54

Interim Report for Institutional Roles of Marriage in the Developing World: Empirical Studies from thePerspectives of Gender Empowerment, IDE-JETRO, 2014
Hungerman, D. M., December 2005. Are church and state substitutes? evidence from the 1996
welfare reform. Journal of Public Economics 89 (11-12), 2245–2267.
Jacoby, H. G., October 1995. The economics of polygyny in sub-saharan africa: Female productivity
and the demand for wives in cote d’voire. Journal of Political Economy 103 (5), 938–971.
Jensen, R., 2012. Do labor market opportunities affect young women’s work and family decisions?
experimental evidence from india. Quarterly Journal of Economics 127 (2), 753–792.
Johnson, H. B., April 1967. The location of christian missions in africa. Geographical Review 57 (2),
168–202.
Kalinga, O. J., March 1985. Colonial rule, missionaries and ethnicity in the north nyasa district,
1891-1938. African Studies Review 28 (1), 57–72.
Levy, G., Razin, R., 2012. Religious beliefs, religious participation, and cooperation. American
Economic Journal: Microeconomics 4 (3), 121–151.
Levy, G., Razin, R., forthcoming. Rituals or good works: Social signaling in religious organizations.
Journal of the European Economic Association.
Lewis, W. A., 1955. The Theory of Economic Growth. George Allen & Unwin Ltd.
Luke, N., Munshi, K., 2011. Women as agents of change: Female income and mobility in india.
Journal of Development Economics 94 (1), 1–17.
Luttmer, E. F. P., Singhal, M., 2011. Culture, context, and the taste for redistribution. American
Economic Journal: Economic Policy 3 (1), 157–179.
McCleary, R. M., Barro, R. J., Spring 2006. Religion and economy. Journal of Economic Perspec-
tives 20 (2), 49–72.
McCracken, J., 1977. Politics and Christianity in Malawi 1875-1940. Cambridge University Press.
Michalopoulos, S., Papaioannou, E., January 2013. Pre-colonial ethnic institutions and contempo-
rary african development. Econometrica 81 (1), 113–152.
Miguel, E., Gugerty, M. K., December 2005. Ethnic diversity, social sanctions, and public goods
in kenya. Journal of Public Economics 89 (11-12), 2325–2368.
Msiska, A. W., 1995. The spread of islam in malawi and its impact on yao rites of passage, 1870-
1960. The Society of Malawi Journal 48 (1), 49–86.
55

Interim Report for Institutional Roles of Marriage in the Developing World: Empirical Studies from thePerspectives of Gender Empowerment, IDE-JETRO, 2014
Noland, M., 2005. Religion and economic performance. World Development 33 (8), 1215–1232.
Nunn, N., 2008. The long-term effects of africa’s slave trades. Quarterly Journal of Economics
123 (1), 139–176.
Nunn, N., May 2010. Religious conversion in colonial africa. American Economic Review: Papers
& Proceedings 100 (2), 147–152.
Nunn, N., forthcoming. Gender and Missionary Influence in Colonial Africa. Cambridge University
Press, Africa’s Development in Historical Perspective, edited by Emmanuel Akyeampong, Robert
Bates, Nathan Nunn, and James A. Robinson.
Nunn, N., Wantchekon, L., 2011. The slave trade and the origins of mistrust in africa. American
Economic Review 101 (7), 3221–3252.
Oloo, H., Wanjiru, M., Newell-Jones, K., March 2011. Female genital mutilation practices in kenya:
The role of alternative rites of passage (a case study of kisii and kuria districts).
Oster, E., September 2010. Estimating hiv prevalence and incidence in africa from mortality data.
BE Journal of Economic Analysis & Policy 10 (1).
Oster, E., January 2012. Hiv and sexual behavior change: Why not africa? Journal of Health
Economics 31 (1), 35–49.
Pew Forum on Religion & Public Life, April 2010. Tolerance and tension: Islam and chistianity in
sub-saharan africa.
Pike, J. G., January 1965. A pre-colonial history of malawi. Nyasaland Journal 18 (1), 22–54.
Pike, J. G., 1968. A Political and Economic History. Pall Mall Press Ltd.
Scheve, K., Stasavage, D., 2006. Religion and preferences for social insurance. Quarterly Journal
of Political Science 1 (3), 225–286.
Thompson, T. J., 1995. Christianity in Northern Malawi: Donald Fraser’s Missionary Methods
and Ngoni Culture. E.J. Brill, Leiden, New York, Koln.
Trinitapoli, J., Weinreb, A., 2012. Religion and AIDS in Africa. Oxford University Press.
Ueyama, M., Yamauchi, F., February 2009. Marriage behavior response to prime-age adult mor-
tality: Evidence from malawi. Demography 46 (1), 43–63.
UNDP, 2004. Human development report 2004: Cultural liberty in today’s diverse world.
56

Interim Report for Institutional Roles of Marriage in the Developing World: Empirical Studies from thePerspectives of Gender Empowerment, IDE-JETRO, 2014
Weber, M., 1958. The Protestant Ethic and the Spirit of Capitalism. New York.
Woodberry, R. D., 2004. The shadow of empire: Christian missions, colonial policy, and democracy
in post colonial societiesPhD Thesis, Department of Sociology, University of North Carolina.
Woodberry, R. D., Shah, T. S., 2004. Christian and democracy: The pioneering protestants.
Journal of Democracy 15 (2), 47–61.
Yatchew, A., 1997. An elementary estimator of the partial linear model. Economics Letters 57,
135–143.
Yatchew, A., June 1998. Nonparametric regression techniques in economics. Journal of Economic
Literature 36 (2), 669–721.
Zumbuehl, M., Dohmen, T., Pfann, G., 2013. Parental investment and the intergenerational trans-
mission of economic preferences and attitudesROA-RA-2013/11, Research Centre for Education
and the Labour Market, Maastricht University.
57

Interim Report for Institutional Roles of Marriage in the Developing World: Empirical Studies from thePerspectives of Gender Empowerment, IDE-JETRO, 2014
Livingstonia
Bandawe
Cape Maclear
Figure 1: Major mission stations
Note: The background map is sourced from UN-SALB (Second Administrative Level Boundaries, period 22.08.2002-21.06.2010).
58

Interim Report for Institutional Roles of Marriage in the Developing World: Empirical Studies from thePerspectives of Gender Empowerment, IDE-JETRO, 2014
−1
01
23
chris
tiani
ty r
esid
uals
0 2 4 6 8
distance to Livingstonia (100km)bandwidth = .8
Yao
−1
01
23
chris
tiani
ty r
esid
uals
0 2 4 6 8
distance to Livingstonia (100km)bandwidth = .8
Non−Yao
Figure 2: Semiparametric regression curve (Lowess): Christianity and distance to Livingstonia
Notes :(1) This figure is based on Yatchew (1997, 1998)’s differenced-based semiparametric estimations of a partiallineal model. (2) Christianity residuals are cij minus the estimated parametric part. (3) Regressors in the parametricpart contain age, age squared, birth order, no. of alive siblings at age 15, no. of older late siblings at age 15, no.of younger late siblings at age 15, geographic and climate controls, and ethnicity-level historical controls. (4) Thegeographic and climate controls contain community-level information on climatology, landscape typology, soil &terrain, crop season parameters, and GPS-based coordinates. See Appendix A for the details. (5) The ethnicity-level historical controls include (i) a dummy variable, equal to one if any part of railway lines in the first decadeof the 20th century drawn from Century Company (1911) passed through land historically inhabited by an ethnicgroup and (ii) the total number of slaves taken from an ethnic group that was normalized by the area of landinhabited by the ethnic group during the 19th century (log of one plus the normalized slave export measure).
59

Interim Report for Institutional Roles of Marriage in the Developing World: Empirical Studies from thePerspectives of Gender Empowerment, IDE-JETRO, 2014
< 3.4
3.4 - 8.1
8.1 - 16.5
16.5 - 30.4
30.4 - 53.4
Figure 3: Historical population density in 1900 (inhabitants/km2)
Notes: (1) The data on population density is sourced from History Database of the Global Environment (HYDE)version 3.1. (2) The map of Malawi is sourced from UN-SALB (Second Administrative Level Boundaries, period22.08.2002-21.06.2010).
60

Interim Report for Institutional Roles of Marriage in the Developing World: Empirical Studies from thePerspectives of Gender Empowerment, IDE-JETRO, 2014
Christianity (623)Islam (101)Traditional (44)
Figure A.1: Spatial distribution of the most common religion practiced in a community (IHS)
Notes: (1) Figure in ( ) is the number of communities. (2) The background map is sourced from UN-SALB (SecondAdministrative Level Boundaries, period 22.08.2002-21.06.2010).
61
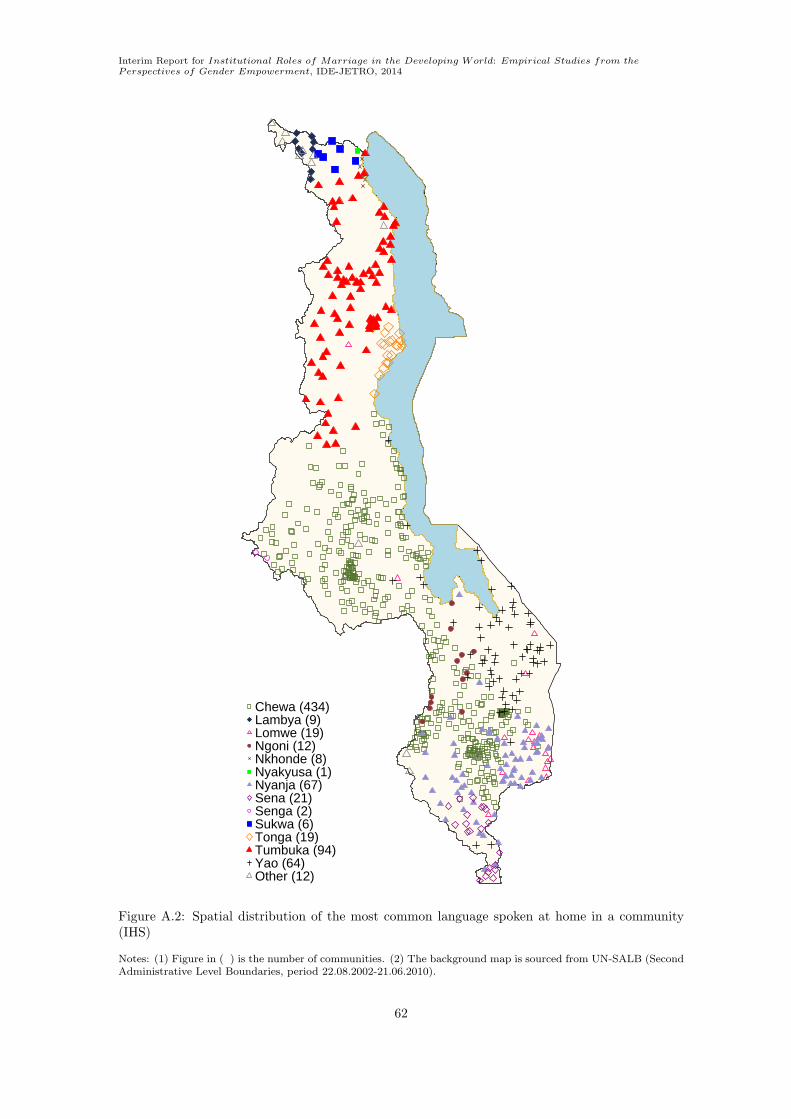
Interim Report for Institutional Roles of Marriage in the Developing World: Empirical Studies from thePerspectives of Gender Empowerment, IDE-JETRO, 2014
Chewa (434)Lambya (9)Lomwe (19)Ngoni (12)Nkhonde (8)Nyakyusa (1)Nyanja (67)Sena (21)Senga (2)Sukwa (6)Tonga (19)Tumbuka (94)Yao (64)Other (12)
Figure A.2: Spatial distribution of the most common language spoken at home in a community(IHS)
Notes: (1) Figure in ( ) is the number of communities. (2) The background map is sourced from UN-SALB (SecondAdministrative Level Boundaries, period 22.08.2002-21.06.2010).
62

Interim Report for Institutional Roles of Marriage in the Developing World: Empirical Studies from thePerspectives of Gender Empowerment, IDE-JETRO, 2014
Integrated Household Survey (IHS)Demographic Health Survey (DHS)
Figure A.3: Spatial distribution of sampled communities: MDHS 2010 and IHS 2010-2011
Note: The background map is sourced from UN-SALB (Second Administrative Level Boundaries, period 22.08.2002-21.06.2010).
63

Interim Report for Institutional Roles of Marriage in the Developing World: Empirical Studies from thePerspectives of Gender Empowerment, IDE-JETRO, 2014
Table 1: Religious affiliationTotal Yao Non-Yao
(1) ChristianityAnglican 0.02 0.01 0.02Catholic 0.21 0.05 0.23Seventh Day Advent/Baptist 0.06 0.01 0.07The Church of Central Africa, Presbyterian (CCAP) 0.17 0.04 0.18Other Christian 0.37 0.09 0.42
(2) Islam 0.13 0.76 0.03(3) Other or no religion 0.01 0.00 0.01No. of respondents 47920 6171 41749
Note: The number is the proportion relative to the total number of respondents in each category. This is theunweighted proportion. In order to calculate the true proportion of the entire population from the sample data,appropriate sample weights need to be used.
Table 2: Descriptive statistics
Christian Non-ChristianMean Std. No. of Mean Std. No. of
obs obs(A) Individual controlsAge at marriage (years) 17.53*** [2.95] 22110 17.18 [3.18] 3342Polygyny (dummy) 0.11*** [0.32] 22110 0.17 [0.38] 3342Age (years) 28.73*** [8.27] 22110 28.13 [8.30] 3342Education (years) 4.96*** [3.62] 22109 3.36 [3.41] 3342Yao (dummy) 0.03*** [0.17] 22103 0.67 [0.46] 3341Birth order 3.64** [2.37] 22044 3.55 [2.37] 3333No. of alive siblings at age 15 4.51*** [2.16] 22044 4.25 [2.15] 3333No. of older late siblings at age 15 0.58* [1.22] 22044 0.62 [1.33] 3333No. of younger late siblings at age 15 0.38 [0.81] 22044 0.37 [0.82] 3333(B) Selected community controlsDistance to Livingstonia (100 km) 4.20*** [1.98] 21848 4.77 [1.06] 3313Descent rule
Patrilineal descent (dummy) 0.36*** [0.48] 21848 0.16 [0.37] 3313Matrilineal descent (dummy) 0.54*** [0.49] 21848 0.76 [0.42] 3313Dual descent (dummy) 0.08* [0.27] 21848 0.07 [0.26] 3313
Community’s population 4387.88*** [7315.00] 21819 5803.41 [9180.98] 3313Distance to the nearest town of pop. > 20000 (km) 0.35*** [0.22] 21848 0.26 [0.18] 3313Major urban center (dummy) 0.09* [0.29] 21848 0.08 [0.27] 3313The most common religion is Christianity. (dummy) 0.86*** [0.33] 21848 0.45 [0.49] 3313The most common language is Yao. (dummy) 0.04*** [0.21] 21848 0.46 [0.49] 3313(C) Selected geographic and climate controlsLatitude -13.99*** [1.91] 21848 -14.51 [0.95] 3313Longitude 34.39*** [0.75] 21848 34.97 [0.60] 3313Annual mean temperature (Bio1) (× 10 ◦C), 1960-1990 217.28*** [20.12] 21848 226.52 [16.54] 3313Std. of temperature (Bio4) (×100), 1960-1990 2344.54*** [259.36] 21848 2290.53 [179.76] 3313Mean precipitation (Bio12) (mm), 1960-1990 1094.27*** [265.82] 21848 1062.65 [168.96] 3313Coef. of Var. of precipitation (Bio15), 1960-1990 103.30*** [13.15] 21848 109.12 [9.50] 3313Elevation (m) 874.63*** [358.47] 21848 721.03 [258.06] 3313Slope (percent) 5.09*** [4.43] 21848 3.95 [3.93] 3313(D) Ethnicity-level historical controlsRailway networks (dummy) 0.80*** [0.39] 19988 0.93 [0.24] 3258Slave exports normalized by land area 0.42*** [0.90] 19988 1.39 [0.86] 3258
Note: The equality of means between Christian and non-Christian females are examined by T-tests. *** denotessignificance at 1%, ** at 5%, and * at 10%.
64

Interim Report for Institutional Roles of Marriage in the Developing World: Empirical Studies from thePerspectives of Gender Empowerment, IDE-JETRO, 2014
Tab
le3:
Impacts
ofreligiou
saffi
liation:ag
eat
marriag
eDep
enden
tvariable:
Ageatmarriage
OLS
2SLS(i)
2SLS(ii)
(a)
(b)
(c)
(d)
(e)
(f)
(g)
(h)
(i)
(j)
OneifChristian
0.348***
0.353***
0.315***
2.429***
2.425***
2.459***
2.431***
3.024***
2.556***
2.435***
[0.087]
[0.087]
[0.100]
[0.728]
[0.742]
[0.734]
[0.745]
[0.878]
[0.768]
[0.766]
Distance
toLivingstonia
(100km)
--
--
--
--
0.220
0.012
[0.309]
[0.373]
Non-Y
ao(d
ummy)
0.106
0.091
0.146
-0.988**
-0.986**
-1.004**
-0.990**
-1.085***
-1.053**
-0.993**
[0.131]
[0.131]
[0.149]
[0.396]
[0.399]
[0.399]
[0.400]
[0.417]
[0.415]
[0.411]
Age
0.308***
0.308***
0.297***
0.308***
0.308***
0.308***
0.308***
0.300***
0.308***
0.308***
[0.018]
[0.018]
[0.019]
[0.018]
[0.018]
[0.018]
[0.018]
[0.178]
[0.018]
[0.018]
Agesquared
-0.004***
-0.004***
-0.004***
-0.004***
-0.004***
-0.004***
-0.004***
-0.004***
-0.004***
-0.004***
[0.000]
[0.000]
[0.000]
[0.000]
[0.000]
[0.000]
[0.000]
[0.000]
[0.000]
[0.000]
Birth
ord
er0.010
0.008
-0.001
0.011
0.009
0.011
0.009
0.008
0.011
0.009
[0.013]
[0.013]
[0.014]
[0.013]
[0.013]
[0.013]
[0.013]
[0.013]
[0.013]
[0.013]
No.ofalivesiblingsatage15
0.036***
0.036***
0.035***
0.030**
0.030**
0.029**
0.030**
0.029**
0.029**
0.030**
[0.012]
[0.012]
[0.013]
[0.012]
[0.012]
[0.012]
[0.012]
[0.012]
[0.012]
[0.012]
No.ofolder
late
siblingsatage15
-0.100***
-0.098***
-0.085***
-0.101***
-0.099***
-0.101***
-0.099***
-0.085***
-0.101***
-0.099***
[0.021]
[0.022]
[0.023]
[0.022]
[0.022]
[0.022]
[0.022]
[0.023]
[0.022]
[0.022]
No.ofyounger
late
siblingsatage15
-0.070***
-0.069***
-0.054**
-0.070***
-0.069***
-0.070***
-0.069***
-0.049**
-0.070***
-0.069***
[0.025]
[0.025]
[0.027]
[0.024]
[0.024]
[0.024]
[0.024]
[0.025]
[0.024]
[0.024]
Eth
nicity-lev
elhistorica
lco
ntrols
Yes
Yes
Yes
Yes
Yes
Yes
Yes
Yes
Yes
Yes
Community-lev
elco
ntrols
Geo
graphyandclim
ate
Yes
Yes
No
Yes
Yes
Yes
Yes
No
Yes
Yes
Oth
erNo
Yes
No
No
Yes
No
Yes
No
No
Yes
CommunityFE
No
No
Yes
No
No
No
No
Yes
No
No
DistrictFE
Yes
Yes
No
Yes
Yes
Yes
Yes
No
Yes
Yes
Yea
rFE
Yes
Yes
Yes
Yes
Yes
Yes
Yes
Yes
Yes
Yes
1st
stageF-statistic
--
-55.17
49.62
80.05
77.79
209.40
72.40
72.50
Overiden
tifica
tion(p
-values)
--
-0.474
0.947
--
--
-R-squared
0.056
0.057
0.147
--
--
--
-No.ofobs.
21587
21559
21587
21587
21559
21587
21559
21587
21587
21559
Notes:
(1)Figures[
]are
standard
errors.***den
otessignifica
nce
at1%,**at5%,and*at10%.(2)Standard
errors
are
robust
toheterosked
asticityandclustered
residuals
within
each
communityin
OLS,wherea
sth
ose
in2SLSare
robust
toheterosked
asticityin
columnsex
clusiveof(h
).(3)Overiden
tifica
tionis
p-valueofHansentest
inallco
lumns
(d)to
(j)butco
lumn(h
),whereth
atofSargantest
isreported
.(4)Thegeo
graphic
andclim
ate
controls
contain
community-lev
elinform
ationonclim
atology,
landscapetypology,
soil&
terrain,cropseasonparameters,
andGPS-basedco
ord
inates.
See
Appen
dix
Aforth
edetails.
(5)Theoth
erco
mmunityco
ntrols
are
sourced
from
theIH
Sandco
ntain
characteristics
iden
tified
atth
epointofth
esu
rvey,including(i)dummiesfordescentru
les,
i.e.,matrilinea
l,patrilinea
l(referen
cegroup)ordualdescent;
(ii)
aco
mmunity’s
population;(iii)aco
mmunity’s
distance
(km)to
thenea
rest
townhavingover
20000population;(iv)adummyforamajorurb
ancenter;
(v)dummiesforth
emost
common
religionpracticed
inaco
mmunity,
i.e.,Christian,Muslim
,orTraditional(referen
cegroup);
and(vi)
dummiesforth
emost
commonlanguagesp
oken
athomein
aco
mmunity,
i.e.,Chew
a,Lambya,Lomwe,
Ngoni,
Nkhonde,
Nyakyusa,Nyanja,Sen
a,Sen
ga,Sukwa,Tonga,Tumbuka,Yao,andoth
er(referen
cegroup).
(6)Theethnicity-lev
elhistorica
lco
ntrols
include(i)adummyvariable,eq
ualto
oneifanypart
ofrailwaylines
inth
efirstdecadeofth
e20th
centu
rydrawnfrom
Cen
tury
Company(1911)passed
throughland
historica
llyinhabited
byanethnic
groupand(ii)
thetotalnumber
ofslaves
taken
from
anethnic
groupth
atwasnorm
alizedbyth
eareaoflandinhabited
byth
eethnic
group
duringth
e19th
centu
ry(logofoneplusth
enorm
alizedslaveex
port
mea
sure).
65

Interim Report for Institutional Roles of Marriage in the Developing World: Empirical Studies from thePerspectives of Gender Empowerment, IDE-JETRO, 2014
Tab
le4:
Impacts
ofreligiou
saffi
liation:polyga
my
Dep
enden
tvariable:
Oneifpolygamy
OLS
2SLS(i)
2SLS(ii)
(a)
(b)
(c)
(d)
(e)
(f)
(g)
(h)
(i)
(j)
OneifChristian
-0.088***
-0.086***
-0.076***
-0.285***
-0.296***
-0.290***
-0.298***
-0.355***
-0.306***
-0.304***
[0.009]
[0.009]
[0.100]
[0.077]
[0.077]
[0.077]
[0.078]
[0.094]
[0.080]
[0.080]
Distance
toLivingstonia
(100km)
--
--
--
--
-0.037
-0.019
[0.040]
[0.046]
Non-Y
ao(d
ummy)
0.010
0.010
-0.002
0.113***
0.120***
0.116***
0.121***
0.124***
0.124***
0.124***
[0.012]
[0.012]
[0.013]
[0.039]
[0.039]
[0.039]
[0.039]
[0.044]
[0.041]
[0.040]
Age
0.021***
0.021***
0.021***
0.021***
0.021***
0.021***
0.021***
0.021***
0.021***
0.021***
[0.002]
[0.002]
[0.002]
[0.002]
[0.002]
[0.002]
[0.002]
[0.002]
[0.002]
[0.002]
Agesquared
-0.000***
-0.000***
-0.000***
-0.000***
-0.000***
-0.000***
-0.000***
-0.000***
-0.000***
-0.000***
[0.000]
[0.000]
[0.000]
[0.000]
[0.000]
[0.000]
[0.000]
[0.000]
[0.000]
[0.000]
Birth
ord
er0.000
0.000
0.001
0.000
0.000
0.000
0.000
0.001
0.000
0.000
[0.001]
[0.001]
[0.001]
[0.001]
[0.001]
[0.001]
[0.001]
[0.001]
[0.001]
[0.001]
No.ofalivesiblingsatage15
-0.002
-0.002
-0.001
-0.001
-0.001
-0.001
-0.001
-0.001
-0.001
-0.001
[0.001]
[0.001]
[0.001]
[0.001]
[0.001]
[0.001]
[0.001]
[0.001]
[0.001]
[0.001]
No.ofolder
late
siblingsatage15
-0.000
-0.000
-0.002
-0.000
-0.000
-0.000
-0.000
-0.002
-0.000
-0.000
[0.002]
[0.002]
[0.003]
[0.002]
[0.002]
[0.002]
[0.002]
[0.002]
[0.002]
[0.002]
No.ofyounger
late
siblingsatage15
-0.003
-0.003
-0.004
-0.003
-0.003
-0.003
-0.003
-0.005*
-0.003
-0.003
[0.003]
[0.003]
[0.003]
[0.003]
[0.003]
[0.003]
[0.003]
[0.003]
[0.003]
[0.003]
Eth
nicity-lev
elhistorica
lco
ntrols
Yes
Yes
Yes
Yes
Yes
Yes
Yes
Yes
Yes
Yes
Community-lev
elco
ntrols
Geo
graphyandclim
ate
Yes
Yes
No
Yes
Yes
Yes
Yes
No
Yes
Yes
Oth
erNo
Yes
No
No
Yes
No
Yes
No
No
Yes
CommunityFE
No
No
Yes
No
No
No
No
Yes
No
No
DistrictFE
Yes
Yes
No
Yes
Yes
Yes
Yes
No
Yes
Yes
Yea
rFE
Yes
Yes
Yes
Yes
Yes
Yes
Yes
Yes
Yes
Yes
1st
stageF-statistic
--
-55.17
49.62
80.05
77.79
209.40
72.40
72.50
Overiden
tifica
tion(p
-values)
--
-0.354
0.669
--
--
-R-squared
0.062
0.065
0.157
--
--
--
-No.ofobs.
21587
21559
21587
21587
21559
21587
21559
21587
21587
21559
Notes:
(1)Figures[
]are
standard
errors.***den
otessignifica
nce
at1%,**at5%,and*at10%.(2)Standard
errors
are
robust
toheterosked
asticityandclustered
residuals
within
each
communityin
OLS,wherea
sth
ose
in2SLSare
robust
toheterosked
asticityin
columnsex
clusiveof(h
).(3)Overiden
tifica
tionis
p-valueofHansentest
inallco
lumns
(d)to
(j)butco
lumn(h
),whereth
atofSargantest
isreported
.(4)Thegeo
graphic
andclim
ate
controls
contain
community-lev
elinform
ationonclim
atology,
landscapetypology,
soil&
terrain,cropseasonparameters,
andGPS-basedco
ord
inates.
See
Appen
dix
Aforth
edetails.
(5)Theoth
erco
mmunityco
ntrols
are
sourced
from
theIH
Sandco
ntain
characteristics
iden
tified
atth
epointofth
esu
rvey,including(i)dummiesfordescentru
les,
i.e.,matrilinea
l,patrilinea
l(referen
cegroup)ordualdescent;
(ii)
aco
mmunity’s
population;(iii)aco
mmunity’s
distance
(km)to
thenea
rest
townhavingover
20000population;(iv)adummyforamajorurb
ancenter;
(v)dummiesforth
emost
common
religionpracticed
inaco
mmunity,
i.e.,Christian,Muslim
,orTraditional(referen
cegroup);
and(vi)
dummiesforth
emost
commonlanguagesp
oken
athomein
aco
mmunity,
i.e.,Chew
a,Lambya,Lomwe,
Ngoni,
Nkhonde,
Nyakyusa,Nyanja,Sen
a,Sen
ga,Sukwa,Tonga,Tumbuka,Yao,andoth
er(referen
cegroup).
(6)Theethnicity-lev
elhistorica
lco
ntrols
include(i)adummyvariable,eq
ualto
oneifanypart
ofrailwaylines
inth
efirstdecadeofth
e20th
centu
rydrawnfrom
Cen
tury
Company(1911)passed
throughland
historica
llyinhabited
byanethnic
groupand(ii)
thetotalnumber
ofslaves
taken
from
anethnic
groupth
atwasnorm
alizedbyth
eareaoflandinhabited
byth
eethnic
group
duringth
e19th
centu
ry(logofoneplusth
enorm
alizedslaveex
port
mea
sure).
66

Interim Report for Institutional Roles of Marriage in the Developing World: Empirical Studies from thePerspectives of Gender Empowerment, IDE-JETRO, 2014
Tab
le5:
Red
uced-form
andfirst-stag
eregression
s(O
LS)
Dep
enden
tva
riables:
OneifChristian
Ageatmarriage
Oneifpolygamy
(a)
(b)
(c)
(d)
(e)
(f)
(g)
(h)
(i)
Distance
toLivingstonia
(100km)
-0.099***
-0.099***
-0.082***
-0.252***
-0.240***
-0.249***
0.030***
0.030***
0.029***
×Non-Y
ao
[0.013]
[0.013]
[0.014]
[0.076]
[0.077]
[0.086]
[0.008]
[0.008]
[0.009]
Distance
toLivingstonia
(100km)
-0.032
-0.030
-0.143
-0.055
--0.028
-0.010
-[0.036]
[0.039]
[0.319]
[0.373]
[0.045]
[0.053]
Non-Y
ao(dummy)
1.023***
1.021***
0.870***
1.559***
1.490***
1.545***
-0.189***
-0.187***
-0.184***
[0.068]
[0.068]
[0.073]
[0.409]
[0.412]
[0.463]
[0.046]
[0.045]
[0.050]
Age
0.000
0.000
-0.001
0.309***
0.309***
0.298***
0.020***
0.021***
0.021***
[0.001]
[0.001]
[0.001]
[0.018]
[0.018]
[0.019]
[0.002]
[0.002]
[0.002]
Agesquared
-0.000
-0.000
0.000
-0.004***
-0.004***
-0.004***
-0.000***
-0.000***
-0.000***
[0.000]
[0.000]
[0.000]
[0.000]
[0.000]
[0.000]
[0.000]
[0.000]
[0.000]
Birth
order
-0.000
-0.000
-0.000
0.010
0.009
-0.000
0.000
0.000
0.000
[0.001]
[0.001]
[0.001]
[0.013]
[0.013]
[0.014]
[0.001]
[0.001]
[0.001]
No.ofalivesiblingsatage15
0.003***
0.003***
0.002**
0.037***
0.037***
0.035***
-0.002
-0.002
-0.002
[0.001]
[0.001]
[0.001]
[0.012]
[0.012]
[0.013]
[0.001]
[0.001]
[0.001]
No.ofolder
late
siblingsatage15
0.000
0.000
-0.000
-0.100***
-0.098***
-0.085***
-0.000
-0.000
-0.002
[0.002]
[0.002]
[0.002]
[0.021]
[0.022]
[0.023]
[0.002]
[0.002]
[0.003]
No.ofyounger
late
siblingsatage15
-0.000
-0.000
-0.001
-0.070***
-0.069***
-0.054**
-0.003
-0.003
-0.004
[0.002]
[0.002]
[0.002]
[0.025]
[0.025]
[0.027]
[0.003]
[0.003]
[0.003]
Ethnicity-level
historicalcontrols
Yes
Yes
Yes
Yes
Yes
Yes
Yes
Yes
Yes
Community-level
controls
Geographyandclim
ate
Yes
Yes
No
Yes
Yes
No
Yes
Yes
No
Other
No
Yes
No
No
Yes
No
No
Yes
No
CommunityFE
No
No
Yes
No
No
Yes
No
No
Yes
DistrictFE
Yes
Yes
No
Yes
Yes
No
Yes
Yes
No
YearFE
Yes
Yes
Yes
Yes
Yes
Yes
Yes
Yes
Yes
R-squared
0.536
0.539
0.622
0.056
0.057
0.147
0.059
0.062
0.155
No.ofobs.
21587
21559
21587
21595
21567
21595
21595
21567
21595
Notes:
(1)Figures[
]are
standard
errors.***den
otessignifica
nce
at1%,**at5%,and*at10%.(2)Standard
errors
are
robust
toheterosked
asticityandclustered
residuals
within
each
community.
(3)Thegeo
graphic
andclim
ate
controls
contain
community-lev
elinform
ationonclim
atology,
landscapetypology,
soil&
terrain,cropseasonparameters,
andGPS-basedco
ord
inates.
See
Appen
dix
Aforth
edetails.
(4)Theoth
erco
mmunityco
ntrols
are
sourced
from
theIH
Sandco
ntain
characteristics
iden
tified
atth
epointofth
esu
rvey,including(i)dummiesfordescentru
les,
i.e.,matrilinea
l,patrilinea
l(referen
cegroup)ordualdescent;
(ii)
aco
mmunity’s
population;(iii)aco
mmunity’s
distance
(km)
toth
enea
rest
townhavingover
20000population;(iv)adummyforamajorurb
ancenter;
(v)dummiesforth
emost
commonreligionpracticed
inaco
mmunity,
i.e.,Christian,
Muslim
,orTraditional(referen
cegroup);
and
(vi)
dummiesforth
emost
common
languagesp
oken
athomein
aco
mmunity,
i.e.,Chew
a,Lambya,Lomwe,
Ngoni,
Nkhonde,
Nyakyusa,Nyanja,Sen
a,Sen
ga,Sukwa,Tonga,Tumbuka,Yao,andoth
er(referen
cegroup).
(5)Theethnicity-lev
elhistorica
lco
ntrols
include(i)adummyvariable,eq
ualto
oneifanypart
ofrailwaylines
inth
efirstdecadeofth
e20th
centu
rydrawnfrom
Cen
tury
Company(1911)passed
throughlandhistorica
llyinhabited
byanethnic
groupand
(ii)
thetotalnumber
ofslaves
taken
from
anethnic
groupth
atwasnorm
alizedbyth
eareaoflandinhabited
byth
eethnic
groupduringth
e19th
centu
ry(logofoneplusth
enorm
alizedslaveex
port
mea
sure).
67

Interim Report for Institutional Roles of Marriage in the Developing World: Empirical Studies from thePerspectives of Gender Empowerment, IDE-JETRO, 2014
Table 6: Falsification test: population density in the early and mid-20th century (OLS)
Dependent variable: Log of population densityData sources of population: HYDE Malawi Population Census 1966, Final report
population population in 1966 populationin 1900 60 years or above All in 1945(a) (b) (c) (d) (e) (f)
Distance to Livingstonia (100km) -0.369 -0.821 0.194 -1.094 0.509 -1.023× Non-Yao (proportion) [0.436] [0.930] [1.249] [0.919] [1.130] [1.085]Distance to Livingstonia (100km) 0.577 1.256 0.269 1.603 -0.060 1.600
[0.475] [0.972] [1.245] [0.952] [1.111] [1.142]Non-Yao (proportion) 1.824 3.198 -2.071 4.843 -3.426 4.713
[1.961] [4.058] [6.078] [3.995] [5.628] [4.693]Male proportion - - 12.138 - 16.715 -
[16.103] [15.616]Average age - - 4.051 - 4.330 -
[3.113] [3.345]Average age squared - - -0.101 - -0.112 -
[0.075] [0.080]Latitude -0.179 -0.110 -0.129 0.067 -0.058 0.129
[0.157] [0.195] [0.204] [0.182] [0.227] [0.180]Longitude 0.021 0.406 0.635* 0.398 0.805*** 0.571**
[0.275] [0.252] [0.333] [0.247] [0.233] [0.261]Constant -3.340 -17.551* -66.409** -14.306 -70.490** -19.913*
[9.014] [9.601] [30.306] [9.101] [33.819] [10.269]Regional FE Yes Yes Yes Yes Yes YesR-squared 0.382 0.661 0.712 0.643 0.764 0.584No. of obs. 1115 23 23 23 23 23
Notes: (1) The unit of observations is a 5-by-5-minute cell demonstrated in Figure 3 in column (a) and a district incolumns (b) to (f). (2) Figures [ ] are standard errors. *** denotes significance at 1%, ** at 5%, and * at 10%. (3)Standard errors are robust to heteroskedasticity and clustered residuals within each district. (4) In all the columns,the non-Yao proportion is the proportion of the non-Yao population relative to a district’s overall population in1966. (5) The analysis uses the level of districts in 1966. Therefore, regarding districts divided between 1945 and1966 (i.e., Karonga to Chitipa & Karonga, Nkhotakota to Ntchisi & Nkhotakota, Dowa to Dowa & Salima), incolumn (f), the population in 1945 was split in proportion to the proportion in 1966. (6) The latitude and longitudeare the coordinates of (a centroid of) each cell in column (a) and those of a district’s capital city (major town) incolumns (b) to (f). (7) The distance is measured from Livingstonia to a centroid of each cell in column (a) andto a district’s capital city (major town) in columns (b) to (f). (8) In columns (b) to (f), the population densityis a district’s total population (African, European, Asian, and other) divided by land area (square mile). (9) Incolumns (c) and (e), a district’s average age is calculated by weighting based on the population in each age categoryof below 5 years, assumed to be 1 year-old in the calculation; 5 to 9 years, assumed to be 5 year-old; 10 to 14 years,assumed to be 10 year-old; 15 to 19 years, assumed to be 15 year-old; 20 to 24 years, assumed to be 20 year-old; 25to 29 years, assumed to be 25 year-old; 30 to 34 years, assumed to be 30 year-old; 35 to 39 years, assumed to be35 year-old: 40 to 44 years, assumed to be 40 year-old; 45 to 49 years, assumed to be 45 year-old; 50 to 54 years,assumed to be 50 year-old; 55 to 59 years, assumed to be 55 year-old; 60 to 64 years, assumed to be 60 year-old;and 65 years or above, assumed to be 65 year-old. (10) The analysis uses three regional fixed effects (i.e., north,central, south).
68

Interim Report for Institutional Roles of Marriage in the Developing World: Empirical Studies from thePerspectives of Gender Empowerment, IDE-JETRO, 2014
Tab
le7:
Falsification
test:im
pacts
ofdistance
torandom
lyselected
communities(O
LS)
Dep
enden
tvariables:
OneifChristian
Ageatmarriage
Oneifpolygamy
(a)
(b)
(c)
(d)
(e)
(f)
(g)
(h)
(i)
Distance
(100km)to
arandomly
selected
communityA
×Non-Y
ao
-0.000
-0.000
0.000
-0.002
-0.002
-0.002
0.001
0.001
0.000
[0.001]
[0.001]
[0.001]
[0.004]
[0.004]
[0.005]
[0.000]
[0.000]
[0.001]
communityB
×Non-Y
ao
-0.002***
-0.002***
-0.002**
-0.002
-0.002
-0.003
0.000
0.000
0.000
[0.001]
[0.001]
[0.001]
[0.004]
[0.004]
[0.006]
[0.001]
[0.001]
[0.001]
communityC
×Non-Y
ao
0.001***
0.001***
0.001***
0.002
0.002
0.002
-0.000
-0.000
-0.000
[0.000]
[0.000]
[0.000]
[0.002]
[0.002]
[0.002]
[0.000]
[0.000]
[0.000]
Distance
(100km)to
arandomly
selected
communityA
-0.001
-0.001
-0.002
-0.001
--0.001*
-0.001
-[0.001]
[0.001]
[0.005]
[0.005]
[0.001]
[0.001]
communityB
0.004***
0.003***
-0.002
0.005
-0.000
0.000
-[0.001]
[0.001]
[0.006]
[0.006]
[0.001]
[0.001]
communityC
-0.001**
-0.001**
--0.003
-0.005
-0.000
0.001
-[0.001]
[0.001]
[0.004]
[0.004]
[0.001]
[0.001]
Non-Y
ao(d
ummy)
0.698***
0.692***
0.578***
0.590
0.568
0.600
-0.141***
-0.135***
-0.106**
[0.060]
[0.060]
[0.069]
[0.427]
[0.431]
[0.480]
[0.045]
[0.044]
[0.049]
Age
0.000
0.000
-0.001
0.308***
0.308***
0.298***
0.021***
0.021***
0.021***
[0.001]
[0.001]
[0.000]
[0.018]
[0.018]
[0.019]
[0.002]
[0.002]
[0.002]
Agesquared
-0.000
-0.000
0.000
-0.004***
-0.004***
-0.004***
-0.000***
-0.000***
-0.000***
[0.000]
[0.000]
[0.000]
[0.000]
[0.000]
[0.000]
[0.000]
[0.000]
[0.000]
Birth
ord
er-0.000
-0.000
-0.000
0.010
0.008
-0.001
0.000
0.000
0.001
[0.001]
[0.001]
[0.001]
[0.013]
[0.013]
[0.014]
[0.001]
[0.001]
[0.001]
No.ofalivesiblingsatage15
0.003***
0.003***
0.002*
0.037***
0.037***
0.035***
-0.002
-0.002
-0.002
[0.001]
[0.001]
[0.001]
[0.012]
[0.012]
[0.013]
[0.001]
[0.001]
[0.001]
No.ofolder
late
siblingsatage15
0.000
0.000
-0.000
-0.100***
-0.097***
-0.085***
-0.000
-0.000
-0.002
[0.002]
[0.002]
[0.002]
[0.021]
[0.022]
[0.023]
[0.002]
[0.002]
[0.003]
No.ofyounger
late
siblingsatage15
-0.000
-0.000
-0.002
-0.070***
-0.068***
-0.054**
-0.003
-0.003
-0.004
[0.002]
[0.002]
[0.002]
[0.025]
[0.025]
[0.027]
[0.003]
[0.003]
[0.003]
Eth
nicity-lev
elhistorica
lco
ntrols
Yes
Yes
Yes
Yes
Yes
Yes
Yes
Yes
Yes
Community-lev
elco
ntrols
Geo
graphyandclim
ate
Yes
Yes
No
Yes
Yes
No
Yes
Yes
No
Oth
erNo
Yes
No
No
Yes
No
No
Yes
No
CommunityFE
No
No
Yes
No
No
Yes
No
No
Yes
DistrictFE
Yes
Yes
No
Yes
Yes
No
Yes
Yes
No
Yea
rFE
Yes
Yes
Yes
Yes
Yes
Yes
Yes
Yes
Yes
R-squared
0.543
0.545
0.625
0.056
0.057
0.147
0.060
0.063
0.155
No.ofobs.
21572
21544
21572
21580
21552
21580
21580
21552
21580
Notes:
(1)Figures[
]are
standard
errors.
***
denotessignificanceat1%,**
at5%,and
*at10%.
(2)Sta
ndard
errors
are
robust
tohetero
skedasticity
and
clustered
residuals
within
each
community.(3
)Thegeogra
phic
and
climate
controls
conta
incommunity-levelinform
ation
on
climato
logy,landscapety
pology,so
il&
terrain,cro
pseaso
npara
meters,and
GPS-b
ased
coord
inates.
SeeAppendix
Aforth
edeta
ils.
(4)Theoth
ercommunity
controls
are
sourced
from
theIH
Sand
conta
inch
ara
cteristicsidentified
atth
epointofth
esu
rvey,including
(i)
dummiesfordescentru
les,
i.e.,
matrilineal,
patrilineal(referencegro
up)ordualdescent;
(ii)
acommunity’s
population;(iii)acommunity’s
dista
nce(k
m)to
thenearest
town
havingover
20000population;(iv)adummy
foramajorurb
an
center;
(v)dummiesforth
emost
common
religion
pra
cticed
inacommunity,i.e.,
Christian,M
uslim
,orTra
ditional(referencegro
up);
and(v
i)dummiesforth
emost
commonlanguagesp
okenathomein
acommunity,i.e.,Chewa,Lambya,Lomwe,Ngoni,Nkhonde,Nyakyusa
,Nyanja,Sena,Senga,Sukwa,Tonga,Tumbuka,
Yao,and
oth
er(referencegro
up).
(5)Theeth
nicity-levelhisto
ricalcontrols
include(i)adummy
variable,equalto
oneif
any
part
ofra
ilway
linesin
thefirstdecadeofth
e20th
centu
rydrawn
from
Centu
ryCompany(1
911)passed
thro
ugh
land
histo
ricallyinhabited
byan
eth
nic
gro
up
and
(ii)
theto
talnumberofslavesta
ken
from
an
eth
nic
gro
up
thatwasnorm
alized
by
theareaofland
inhabited
byth
eeth
nic
gro
up
duringth
e19th
centu
ry(logofoneplusth
enorm
alized
slaveexport
measu
re).
69
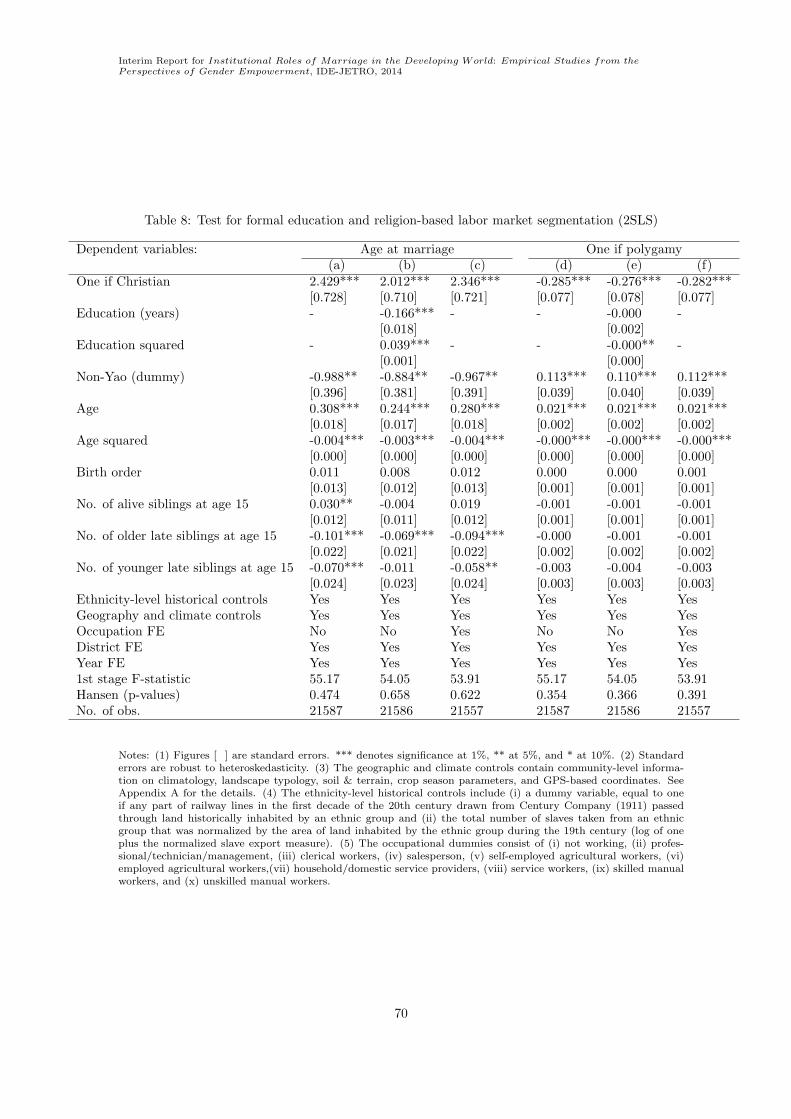
Interim Report for Institutional Roles of Marriage in the Developing World: Empirical Studies from thePerspectives of Gender Empowerment, IDE-JETRO, 2014
Table 8: Test for formal education and religion-based labor market segmentation (2SLS)
Dependent variables: Age at marriage One if polygamy(a) (b) (c) (d) (e) (f)
One if Christian 2.429*** 2.012*** 2.346*** -0.285*** -0.276*** -0.282***[0.728] [0.710] [0.721] [0.077] [0.078] [0.077]
Education (years) - -0.166*** - - -0.000 -[0.018] [0.002]
Education squared - 0.039*** - - -0.000** -[0.001] [0.000]
Non-Yao (dummy) -0.988** -0.884** -0.967** 0.113*** 0.110*** 0.112***[0.396] [0.381] [0.391] [0.039] [0.040] [0.039]
Age 0.308*** 0.244*** 0.280*** 0.021*** 0.021*** 0.021***[0.018] [0.017] [0.018] [0.002] [0.002] [0.002]
Age squared -0.004*** -0.003*** -0.004*** -0.000*** -0.000*** -0.000***[0.000] [0.000] [0.000] [0.000] [0.000] [0.000]
Birth order 0.011 0.008 0.012 0.000 0.000 0.001[0.013] [0.012] [0.013] [0.001] [0.001] [0.001]
No. of alive siblings at age 15 0.030** -0.004 0.019 -0.001 -0.001 -0.001[0.012] [0.011] [0.012] [0.001] [0.001] [0.001]
No. of older late siblings at age 15 -0.101*** -0.069*** -0.094*** -0.000 -0.001 -0.001[0.022] [0.021] [0.022] [0.002] [0.002] [0.002]
No. of younger late siblings at age 15 -0.070*** -0.011 -0.058** -0.003 -0.004 -0.003[0.024] [0.023] [0.024] [0.003] [0.003] [0.003]
Ethnicity-level historical controls Yes Yes Yes Yes Yes YesGeography and climate controls Yes Yes Yes Yes Yes YesOccupation FE No No Yes No No YesDistrict FE Yes Yes Yes Yes Yes YesYear FE Yes Yes Yes Yes Yes Yes1st stage F-statistic 55.17 54.05 53.91 55.17 54.05 53.91Hansen (p-values) 0.474 0.658 0.622 0.354 0.366 0.391No. of obs. 21587 21586 21557 21587 21586 21557
Notes: (1) Figures [ ] are standard errors. *** denotes significance at 1%, ** at 5%, and * at 10%. (2) Standarderrors are robust to heteroskedasticity. (3) The geographic and climate controls contain community-level informa-tion on climatology, landscape typology, soil & terrain, crop season parameters, and GPS-based coordinates. SeeAppendix A for the details. (4) The ethnicity-level historical controls include (i) a dummy variable, equal to oneif any part of railway lines in the first decade of the 20th century drawn from Century Company (1911) passedthrough land historically inhabited by an ethnic group and (ii) the total number of slaves taken from an ethnicgroup that was normalized by the area of land inhabited by the ethnic group during the 19th century (log of oneplus the normalized slave export measure). (5) The occupational dummies consist of (i) not working, (ii) profes-sional/technician/management, (iii) clerical workers, (iv) salesperson, (v) self-employed agricultural workers, (vi)employed agricultural workers,(vii) household/domestic service providers, (viii) service workers, (ix) skilled manualworkers, and (x) unskilled manual workers.
70

Interim Report for Institutional Roles of Marriage in the Developing World: Empirical Studies from thePerspectives of Gender Empowerment, IDE-JETRO, 2014
Table 9: Test for fear of HIV infection
Dependent variables: Age at marriage One if polygamy HIVSample: Total Matrilineal Total Matrilineal prevalence
2SLS 2SLS 2SLS 2SLS OLS(a) (b) (c) (d) (e)
One if Christian 2.453*** 1.289 -0.284*** -0.389*** -[0.726] [0.853] [0.077] [0.106]
Distance to the origin of the 1.476 -3.246 0.084 1.385 -0.780***HIV virus (100km) [1.872] [7.825] [0.221] [0.856] [0.256]Distance to the origin of the 0.003** 0.003 -0.001*** -0.001*** -HIV virus origin (100km) × Age [0.002] [0.003] [0.000] [0.000]Non-Yao (dummy) -1.012** -0.358 0.113*** 0.149*** -
[0.396] [0.430] [0.039] [0.049]Age 0.257*** 0.262*** 0.038*** 0.035*** -
[0.031] [0.048] [0.003] [0.005]Age squared -0.004*** -0.004*** -0.000*** -0.000*** -
[0.000] [0.000] [0.000] [0.000]Birth order 0.011 0.018 0.000 0.000 -
[0.013] [0.017] [0.001] [0.002]No. of alive siblings at age 15 0.030** 0.028* -0.001 -0.001 -
[0.012] [0.016] [0.001] [0.002]No. of older late siblings at age 15 -0.100*** -0.105*** -0.001 -0.003 -
[0.022] [0.028] [0.002] [0.003]No. of younger late siblings at age 15 -0.070*** -0.063** -0.003 -0.006* -
[0.024] [0.031] [0.003] [0.003]Ethnicity-level historical controls Yes Yes Yes Yes NoGeography and climate controls Yes Yes Yes Yes YesDistrict FE Yes Yes Yes Yes YesYear FE Yes Yes Yes Yes Yes1st stage F-statistic 57.45 37.06 57.45 37.06 -Hansen (p-values) 0.648 0.424 0.346 0.819 -R-squared - - - - 0.232No. of obs. 21587 12824 21587 12824 1337
Notes: (1) Unit of observations is an individual in columns (a) to (d) and a community in column (e). (2) Figures[ ] are standard errors. *** denotes significance at 1%, ** at 5%, and * at 10%. (3) Standard errors are robustto heteroskedasticity in columns (a) to (d), whereas those are robust to heteroskedasticity and clustered residualswithin each district in column (e). (4) The geographic and climate controls contain community-level information onclimatology, landscape typology, soil & terrain, crop season parameters, and GPS-based coordinates. See AppendixA for the details. (5) The ethnicity-level historical controls include (i) a dummy variable, equal to one if any partof railway lines in the first decade of the 20th century drawn from Century Company (1911) passed through landhistorically inhabited by an ethnic group and (ii) the total number of slaves taken from an ethnic group that wasnormalized by the area of land inhabited by the ethnic group during the 19th century (log of one plus the normalizedslave export measure).
71

Interim Report for Institutional Roles of Marriage in the Developing World: Empirical Studies from thePerspectives of Gender Empowerment, IDE-JETRO, 2014
Table 10: Test for religion-based marriage market segmentation (2SLS)
Dependent variables: Age at marriage One if polygamySample: Total Matrilineal Total Total Matrilineal Total
(a) (b) (c) (d) (e) (f)
One if Christian 2.708*** 1.785* 1.970 -0.300*** -0.428*** -0.101[0.767] [0.947] [1.449] [0.081] [0.121] [0.154]
One if Christian × A community’s most common religionIslam -0.504* -0.352 - -0.000 0.024 -
[0.281] [0.333] [0.029] [0.037]Traditional -0.482 0.061 - 0.055 0.115 -
[0.709] [0.815] [0.070] [0.082]A community’s most common religion
Islam 0.330 0.257 - 0.001 -0.035 -[0.248] [0.296] [0.026] [0.034]
Traditional 0.295 -0.110 - 0.014 -0.039 -[0.635] [0.737] [0.062] [0.073]
One if Christian × A husband’s religionIslam - - -5.878 - - 1.306*
[4.274] [0.684]Traditional or no religion - - 2.749 - - -0.230
[6.321] [0.627]A husband’s religion
Islam - - 4.789 - - -1.101*[3.879] [0.614]
Traditional or no religion - - -2.733 - - 0.192[6.257] [0.623]
Non-Yao (dummy) -1.042*** -0.528 -1.176 0.120*** 0.161*** 0.056[0.397] [0.450] [0.804] [0.039] [0.053] [0.086]
Age 0.308*** 0.303*** 0.276*** 0.021*** 0.018*** 0.013***[0.018] [0.024] [0.042] [0.002] [0.002] [0.004]
Age squared -0.004*** -0.004*** -0.004*** -0.000*** -0.000*** -0.000**[0.000] [0.000] [0.001] [0.000] [0.000] [0.000]
Birth order 0.011 0.018 -0.021 0.000 0.000 0.004[0.013] [0.017] [0.028] [0.001] [0.002] [0.003]
No. of alive siblings at age 15 0.029** 0.027* 0.060** -0.001 -0.001 -0.004[0.012] [0.016] [0.025] [0.001] [0.002] [0.002]
No. of older late siblings at age 15 -0.101*** -0.106*** -0.068 -0.000 -0.003 -0.003[0.022] [0.028] [0.047] [0.002] [0.003] [0.005]
No. of younger late siblings at age 15 -0.071*** -0.065** 0.002 -0.003 -0.006** -0.004[0.024] [0.031] [0.054] [0.003] [0.003] [0.005]
Ethnicity-level historical controls Yes Yes Yes Yes Yes YesGeography and climate controls Yes Yes Yes Yes Yes YesDistrict FE Yes Yes Yes Yes Yes YesYear FE Yes Yes Yes Yes Yes Yes1st stage F-statistic (for religion) 21.81 16.40 19.69 21.81 16.40 19.69Hansen (p-values) 0.758 0.431 0.251 0.746 0.469 0.760R-squared - - - - - -No. of obs. 21587 12824 4883 21587 12824 4883
Notes:. (1) Figures [ ] are standard errors. *** denotes significance at 1%, ** at 5%, and * at 10%. (2) Standarderrors are robust to heteroskedasticity. (3) The geographic and climate controls contain community-level informa-tion on climatology, landscape typology, soil & terrain, crop season parameters, and GPS-based coordinates. SeeAppendix A for the details. (4) The ethnicity-level historical controls include (i) a dummy variable, equal to oneif any part of railway lines in the first decade of the 20th century drawn from Century Company (1911) passedthrough land historically inhabited by an ethnic group and (ii) the total number of slaves taken from an ethnicgroup that was normalized by the area of land inhabited by the ethnic group during the 19th century (log of oneplus the normalized slave export measure). (5) A community’s most common religion is a set of indicators, i.e.,Christian (reference group), Muslim, or Traditional.
72

Interim Report for Institutional Roles of Marriage in the Developing World: Empirical Studies from thePerspectives of Gender Empowerment, IDE-JETRO, 2014
Tab
leA.1:Inform
alcheckof
goodnessof
thefitof
theIH
Scommunitycharacteristicsto
theMDHSdata:
religion
andethnicity(O
LS)
Dependentvariables
Oneif
based
on
theM
DHS:
pra
ctice
pra
ctice
pra
ctice
Chewa
Lambya
Lomwe
Ngoni
Nkhonde
Nyanja
Sena
Tonga
Tumbuka
Yao
Oth
er
Christianity
Islam
oth
eror
eth
nicity
noreligion
(a)
(b)
(c)
(d)
(e)
(f)
(g)
(h)
(i)
(j)
(k)
(l)
(m)
(n)
Independentvariablesbased
on
theIH
S:
Themost
common
religion
pra
cticed
inacommunity
Christianity
0.121***
--
--
--
--
--
--
-[0.019]
Islam
-0.137***
--
--
--
--
--
--
[0.023]
Tra
ditional
--
0.009*
--
--
--
--
--
-[0.005]
Themost
common
languagesp
oken
athomein
acommunity
Chewa
--
-0.074***
--
--
--
--
--
[0.020]
Lambya
--
--
0.108*
--
--
--
--
-[0.063]
Lomwe
--
--
-0.059
--
--
--
--
[0.041]
Ngoni
--
--
--
0.041
--
--
--
-[0.049]
Nkhonde
--
--
--
-0.301***
--
--
--
[0.064]
Nyanja
--
--
--
--
0.005
--
--
-[0.004]
Sena
--
--
--
--
-0.205***
--
--
[0.050]
Tonga
--
--
--
--
--
0.343***
--
-[0.097]
Tumbuka
--
--
--
--
--
-0.442***
--
[0.042]
Yao
--
--
--
--
--
--
0.180***
-[0.034]
Oth
er
--
--
--
--
--
--
-0.228***
[0.055]
Constant
0.865***
0.007
0.008***
-0.012
0.063**
0.004
0.009
0.015***
-0.010***
-0.001
0.005**
0.140***
0.007
0.567***
[0.021]
[0.007]
[0.002]
[0.008]
[0.026]
[0.007]
[0.007]
[0.005]
[0.002]
[0.003]
[0.002]
[0.030]
[0.007]
[0.058]
DistrictFE
Yes
Yes
Yes
Yes
Yes
Yes
Yes
Yes
Yes
Yes
Yes
Yes
Yes
Yes
YearFE
Yes
Yes
Yes
Yes
Yes
Yes
Yes
Yes
Yes
Yes
Yes
Yes
Yes
Yes
R-squared
0.323
0.349
0.014
0.505
0.113
0.404
0.340
0.351
0.035
0.508
0.477
0.518
0.328
0.196
No.ofobs.
47371
47371
47371
47369
47369
47369
47369
47369
47369
47369
47369
47369
47369
47369
Notes:
(1)Figures[
]are
standard
errors.***den
otessignifica
nce
at1%,**at5%,and*at10%.(2)Standard
errors
are
robust
toheterosked
asticityandclustered
residuals
within
each
community.
73

Interim Report for Institutional Roles of Marriage in the Developing World: Empirical Studies from thePerspectives of Gender Empowerment, IDE-JETRO, 2014
Table
A.2:Inform
alcheckof
goodnessof
thefitof
theIH
Scommunitycharacteristicsto
theMDHSdata:
descentrulesan
dmigrantprobab
ilityof
marriedfemales
(OLS)
Dependentvariable:
Oneif
migra
nt
Data
sourc
es:
IHS
MDHS
matched
with
theIH
SSample:
Fem
alesth
atre
sided
inall
theM
DHS
com
munities
Fem
alesth
atre
sided
inth
eM
DHS
com
munities
with
dista
nceto
theneare
stIH
Scom
munities<
10
km
(a)
(b)
(c)
(d)
(e)
(f)
(g)
(h)
(i)
(j)
(k)
(l)
(m)
(n)
(o)
Matrilin
ealdesc
entcommunity
×A
com
munity’s
dista
nce(k
m)to
theneare
stto
wn
havin
gpopulation
>20000
1st
quantile
0.158
0.133*
0.092
0.051
0.067
0.098**
0.101**
0.077**
0.034
0.060**
0.120***
0.108***
0.091**
0.043*
0.069***
[0.099]
[0.081]
[0.066]
[0.047]
[0.045]
[0.044]
[0.041]
[0.039]
[0.025]
[0.025]
[0.042]
[0.039]
[0.037]
[0.025]
[0.023]
2nd
quantile
0.155*
0.128*
0.057
0.062*
-0.113***
0.130***
0.075**
0.044**
-0.133***
0.139***
0.079**
0.048**
-[0.079]
[0.071]
[0.059]
[0.036]
[0.043]
[0.038]
[0.035]
[0.020]
[0.041]
[0.037]
[0.034]
[0.019]
3rd
quantile
0.249***
0.190***
0.002
--
0.105**
0.086**
0.021
--
0.117***
0.087**
0.020
--
[0.075]
[0.071]
[0.054]
[0.041]
[0.038]
[0.031]
[0.040]
[0.036]
[0.030]
4th
quantile
0.180**
0.084
--
-0.057
0.043
--
-0.066*
0.038
--
-[0.079]
[0.054]
[0.037]
[0.033]
[0.036]
[0.032]
5th
quantile
0.168***
--
--
0.046
--
--
0.057
--
--
[0.061]
[0.036]
[0.035]
Acommunity’s
dista
nce(k
m)to
theneare
stto
wn
havin
gpopulation
>20000
1st
quantile
-0.177*
-0.138
-0.159**
-0.024
-0.084*
-0.147**
-0.111*
0.001
0.042
-0.057**
-0.164**
-0.091
-0.018
0.023
-0.072***
[0.102]
[0.085]
[0.073]
[0.051]
[0.045]
[0.072]
[0.063]
[0.054]
[0.031]
[0.026]
[0.069]
[0.061]
[0.052]
[0.030]
[0.025]
2nd
quantile
-0.123
-0.132*
-0.156***
-0.053
--0
.156**
-0.127**
-0.040
-0.007
--0
.176***
-0.116**
-0.047
-0.018
-[0.080]
[0.072]
[0.060]
[0.034]
[0.063]
[0.051]
[0.042]
[0.020]
[0.061]
[0.049]
[0.040]
[0.019]
3rd
quantile
-0.214***
-0.181***
-0.081*
--
-0.120**
-0.072*
0.003
--
-0.131***
-0.053
0.009
--
[0.069]
[0.062]
[0.047]
[0.051]
[0.043]
[0.031]
[0.050]
[0.041]
[0.030]
4th
quantile
-0.109*
-0.145***
--
--0
.066*
-0.030
--
--0
.067*
-0.013
--
-[0.063]
[0.045]
[0.039]
[0.032]
[0.038]
[0.031]
5th
quantile
-0.137***
--
--
-0.049
--
--
-0.055*
--
--
[0.049]
[0.033]
[0.031]
Matrilin
ealdesc
ent
-0.126**
-0.086*
-0.011
-0.016
-0.010
-0.085***
-0.088***
-0.055**
-0.038*
-0.043**
-0.095***
-0.087***
-0.057**
-0.040**
-0.045**
[0.057]
[0.050]
[0.047]
[0.039]
[0.040]
[0.031]
[0.030]
[0.027]
[0.021]
[0.019]
[0.030]
[0.029]
[0.027]
[0.020]
[0.019]
Dualdesc
ent
0.020
0.009
0.014
0.011
0.011
0.071***
0.070***
0.074***
0.075***
0.072***
0.061***
0.061***
0.065***
0.066***
0.063***
[0.047]
[0.044]
[0.044]
[0.045]
[0.044]
[0.023]
[0.023]
[0.023]
[0.023]
[0.023]
[0.022]
[0.022]
[0.022]
[0.022]
[0.022]
Age
Yes
Yes
Yes
Yes
Yes
Yes
Yes
Yes
Yes
Yes
Yes
Yes
Yes
Yes
Yes
Education
Yes
Yes
Yes
Yes
Yes
Yes
Yes
Yes
Yes
Yes
Yes
Yes
Yes
Yes
Yes
Religion
Yes
Yes
Yes
Yes
Yes
Yes
Yes
Yes
Yes
Yes
Yes
Yes
Yes
Yes
Yes
Eth
nicity
Yes
Yes
Yes
Yes
Yes
Yes
Yes
Yes
Yes
Yes
Yes
Yes
Yes
Yes
Yes
House
hold
size
Yes
Yes
Yes
Yes
Yes
Yes
Yes
Yes
Yes
Yes
Yes
Yes
Yes
Yes
Yes
Community
controls
Yes
Yes
Yes
Yes
Yes
Yes
Yes
Yes
Yes
Yes
Yes
Yes
Yes
Yes
Yes
Geogra
phic
and
Yes
Yes
Yes
Yes
Yes
Yes
Yes
Yes
Yes
Yes
Yes
Yes
Yes
Yes
Yes
climate
controls
DistrictFE
Yes
Yes
Yes
Yes
Yes
Yes
Yes
Yes
Yes
Yes
Yes
Yes
Yes
Yes
Yes
YearFE
--
--
-Yes
Yes
Yes
Yes
Yes
Yes
Yes
Yes
Yes
Yes
R-square
d0.320
0.320
0.312
0.318
0.312
0.191
0.191
0.191
0.191
0.191
0.190
0.190
0.190
0.189
0.189
No.ofobs.
6701
6701
6701
6701
6701
30911
30911
30911
30911
30911
32761
32761
32761
32761
32761
Notes:
(1)Figures[
]are
standard
errors.***denotessignificanceat1%,**at5%,and*at10%.(2
)Sta
ndard
errors
are
robust
tohetero
skedasticityandclusteredresiduals
within
each
community.
(3)Thegeogra
phic
and
climate
controls
conta
ina
community-levelinform
ation
on
climato
logy,landscapety
pology,so
il&
terrain,cro
pseaso
npara
meters,and
GPS-b
ased
coord
inates.
SeeAppendix
Aforth
edeta
ils.
(4)Theoth
ercommunitycontrols
are
sourcedfrom
theIH
Sandconta
inch
ara
cteristicsidentifiedatth
epointofth
esu
rvey.In
additionto
the
descentru
lesanddista
nce(k
m)to
thenearest
townhavingover20000population,th
eyinclude(i)acommunity’s
population;(ii)
adummyforamajorurb
ancenter;
(iii)dummiesforth
emost
commonreligionpra
cticedin
acommunity,i.e.,Christian,M
uslim
,orTra
ditional(referencegro
up);
and(iv)dummiesforth
emost
commonlanguagesp
okenathomein
acommunity,
i.e.,
Chewa,Lambya,Lomwe,Ngoni,
Nkhonde,Nyakyusa
,Nyanja,Sena,Senga,Sukwa,Tonga,Tumbuka,Yao,and
oth
er(referencegro
up).
(5)In
columns(a
)to
(e),
thecompleted
level
ofeducation
ismeasu
red
bycategoricalvariablesofNone(referencegro
up),
Primary
Sch
oolLeavingCertificate
(PSLC),
JuniorCertificate
Examination
(JCE),
MalawiSch
oolCertificate
ofEducation
(MSCE),
non-u
niversitydiploma,universitydiploma/degree,and
post-gra
duate
degree.On
theoth
erhand,th
eestim
ationsin
columns(f)to
(o)use
acontinuousmeasu
reof
thecompletedlevelofeducation(y
ears).
(6)In
theIH
S,anindividual’seth
nicitywasnotdirectlyindicatedbyth
esu
rveyresp
onses.
Thus,
altern
atively,th
eestim
ationsin
columns(a
)to
(e),
theeth
nicityis
proxied
bylanguagesth
atahousehold
head
spokeathome.
74

Interim Report for Institutional Roles of Marriage in the Developing World: Empirical Studies from thePerspectives of Gender Empowerment, IDE-JETRO, 2014
Table A.3: Falsification test: population density in the early and mid-20th century, district-age-gender cohorts, (OLS)
Dependent variable: Log of population density per square mileSample: Cohorts aged 60 All age-cohorts
years or above(a) (b) (c) (d)
Distance to Livingstonia (100km) -0.797 -0.797 -1.038 -1.038× Non-Yao (proportion) [0.764] [0.773] [0.750] [0.759]Distance to Livingstonia (100km) 1.194 1.194 1.517* 1.517*
[0.797] [0.806] [0.778] [0.787]Non-Yao (proportion) 3.319 3.319 4.627 4.627
[3.346] [3.387] [3.266] [3.302]Male proportion - -0.014 - -0.146***
[0.034] [0.022]Age-cohort5-9 years - - - -0.219***
[0.012]10-14 years - - - -0.540***
[0.024]15-19 years - - - -0.630***
[0.018]20-24 years - - - -0.901***
[0.024]25-29 years - - - -0.969***
[0.029]30-34 years - - - -1.186***
[0.022]35-39 years - - - -1.192***
[0.034]40-44 years - - - -1.602***
[0.027]45-49 years - - - -1.446***
[0.032]50-54 years - - - -1.874***
[0.041]55-59 years - - - -2.019***
[0.044]60-64 years - - - -2.392***
[0.050]65 years or above - 0.880*** - -1.512***
[0.064] [0.049]Latitude -0.082 -0.082 0.055 0.055
[0.159] [0.161] [0.158] [0.160]Longitude 0.528** 0.528** 0.453** 0.453**
[0.192] [0.194] [0.201] [0.204]Constant -22.830*** -23.264*** -19.563** -18.313**
[7.387] [7.471] [7.397] [7.484]Regional FE Yes Yes Yes YesR-squared 0.483 0.732 0.372 0.781No. of obs. 92 92 644 644
Source: Author’s calculation based on Malawi Population Census 1966, Final Report.Notes: (1) The unit of observations is a district-age-gender cohort. (2) Figures [ ] are standard errors. *** denotessignificance at 1%, ** at 5%, and * at 10%. (3) Standard errors are robust to heteroskedasticity and clusteredresiduals within each district. (4) The latitude and longitude are the coordinates of a district’s capital city (majortown). (5) The distance is measured as that between a district’s capital city (major town) and Livingstonia. (6)The population density is a cohort’s total population (African, European, Asian, and other) divided by land area(square mile). (7) The analysis uses three regional fixed effects (i.e., north, central, south).
75

Interim Report for Institutional Roles of Marriage in the Developing World: Empirical Studies from thePerspectives of Gender Empowerment, IDE-JETRO, 2014
Tab
leA.4:Im
pacts
ofreligiou
saffi
liationwithacontrol
ofethnicity-fixed
effects:ag
eat
marriag
eDep
enden
tvariable:
Ageatmarriage
OLS
2SLS(i)
2SLS(ii)
(a)
(b)
(c)
(d)
(e)
(f)
(g)
(h)
(i)
(j)
OneifChristian
0.272***
0.280***
0.274***
1.876***
1.906***
1.875***
1.909***
2.263***
1.976***
1.888**
[0.085]
[0.084]
[0.097]
[0.719]
[0.731]
[0.719]
[0.731]
[0.855]
[0.742]
[0.744]
Distance
toLivingstonia
(100km)
--
--
--
--
0.199
-0.049
[0.270]
[0.291]
Age
0.304***
0.303***
0.293***
0.303***
0.303***
0.303***
0.303***
0.294***
0.303***
0.303***
[0.017]
[0.017]
[0.018]
[0.017]
[0.017]
[0.017]
[0.017]
[0.017]
[0.017]
[0.017]
Agesquared
-0.004***
-0.004***
-0.004***
-0.004***
-0.004***
-0.004***
-0.004***
-0.004***
-0.004***
-0.004***
[0.000]
[0.000]
[0.000]
[0.000]
[0.000]
[0.000]
[0.000]
[0.017]
[0.000]
[0.000]
Birth
ord
er0.017
0.015
0.006
0.017
0.016
0.017
0.016
0.008
0.017
0.016
[0.012]
[0.012]
[0.013]
[0.012]
[0.012]
[0.012]
[0.012]
[0.012]
[0.012]
[0.012]
No.ofalivesiblingsatage15
0.032***
0.032***
0.031**
0.027**
0.027**
0.027**
0.027**
0.026**
0.027**
0.027**
[0.011]
[0.011]
[0.012]
[0.012]
[0.012]
[0.012]
[0.012]
[0.011]
[0.012]
[0.012]
No.ofolder
late
siblingsatage15
-0.108***
-0.105***
-0.090***
-0.109***
-0.106***
-0.109***
-0.106***
-0.090***
-0.109***
-0.105***
[0.021]
[0.021]
[0.022]
[0.021]
[0.021]
[0.021]
[0.021]
[0.022]
[0.021]
[0.021]
No.ofyounger
late
siblingsatage15
-0.077***
-0.075***
-0.059**
-0.076***
-0.074***
-0.076***
-0.074***
-0.055**
-0.076***
-0.074***
[0.024]
[0.024]
[0.025]
[0.023]
[0.023]
[0.023]
[0.023]
[0.024]
[0.023]
[0.023]
Eth
nicityFE
Yes
Yes
Yes
Yes
Yes
Yes
Yes
Yes
Yes
Yes
Eth
nicity-lev
elhistorica
lco
ntrols
No
No
No
No
No
No
No
No
No
No
Community-lev
elco
ntrols
Geo
graphyandclim
ate
Yes
Yes
No
Yes
Yes
Yes
Yes
No
Yes
Yes
Oth
erNo
Yes
No
No
Yes
No
Yes
No
No
Yes
CommunityFE
No
No
Yes
No
No
No
No
Yes
No
No
DistrictFE
Yes
Yes
No
Yes
Yes
Yes
Yes
No
Yes
Yes
Yea
rFE
Yes
Yes
Yes
Yes
Yes
Yes
Yes
Yes
Yes
Yes
1st
stageF-statistic
--
-49.96
45.25
80.24
78.23
224.05
73.24
73.32
Overiden
tifica
tion(p
-values)
--
-0.460
0.865
--
--
-R-squared
0.058
0.060
0.144
--
--
--
-No.ofobs.
23628
23559
23628
23628
23599
23628
23599
23628
23628
23599
Notes:
(1)Figures[
]are
standard
errors.***den
otessignifica
nce
at1%,**at5%,and*at10%.(2)Standard
errors
are
robust
toheterosked
asticityandclustered
residuals
within
each
communityin
OLS,wherea
sth
ose
in2SLSare
robust
toheterosked
asticityin
columnsex
clusiveof(h
).(3)Overiden
tifica
tionis
p-valueofHansentest
inallco
lumns
(d)to
(j)butco
lumn(h
),whereth
atofSargantest
isreported
.(4)Thegeo
graphic
andclim
ate
controls
contain
community-lev
elinform
ationonclim
atology,
landscapetypology,
soil&
terrain,cropseasonparameters,
andGPS-basedco
ord
inates.
See
Appen
dix
Aforth
edetails.
(5)Theoth
erco
mmunityco
ntrols
are
sourced
from
theIH
Sandco
ntain
characteristics
iden
tified
atth
epointofth
esu
rvey,including(i)dummiesfordescentru
les,
i.e.,matrilinea
l,patrilinea
l(referen
cegroup)ordualdescent;
(ii)
aco
mmunity’s
population;(iii)aco
mmunity’s
distance
(km)to
thenea
rest
townhavingover
20000population;(iv)adummyforamajorurb
ancenter;
(v)dummiesforth
emost
common
religionpracticed
inaco
mmunity,
i.e.,Christian,Muslim
,orTraditional(referen
cegroup);
and(vi)
dummiesforth
emost
commonlanguagesp
oken
athomein
aco
mmunity,
i.e.,Chew
a,Lambya,Lomwe,
Ngoni,Nkhonde,
Nyakyusa,Nyanja,Sen
a,Sen
ga,Sukwa,Tonga,Tumbuka,Yao,andoth
er(referen
cegroup).
(6)Eth
nic
groupsare
categorized
into
13groups,
i.e.,Chew
a,Lambya,Lomwe,
mang’anja,Ndali,Ngoni,Nkhonde,
Nyanja,Sen
a,Tonga,Tumbuka,Yao(referen
cegroup),
andoth
er.
76

Interim Report for Institutional Roles of Marriage in the Developing World: Empirical Studies from thePerspectives of Gender Empowerment, IDE-JETRO, 2014
Tab
leA.5:Im
pacts
ofreligiou
saffi
liationwithacontrol
ofethnicity-fixed
effects:polyga
my
Dep
enden
tvariable:
Oneifpolygamy
OLS
2SLS(i)
2SLS(ii)
(a)
(b)
(c)
(d)
(e)
(f)
(g)
(h)
(i)
(j)
OneifChristian
-0.085***
-0.082***
-0.071***
-0.335***
-0.329***
-0.335***
-0.330***
-0.382***
-0.331***
-0.327***
[0.009]
[0.009]
[0.009]
[0.077]
[0.077]
[0.077]
[0.077]
[0.093]
[0.079]
[0.078]
Distance
toLivingstonia
(100km)
--
--
--
--
0.009
0.007
[0.036]
[0.039]
Age
0.020***
0.020***
0.020***
0.020***
0.020***
0.020***
0.020***
0.020***
0.020***
0.020***
[0.002]
[0.002]
[0.002]
[0.002]
[0.002]
[0.002]
[0.002]
[0.002]
[0.002]
[0.002]
Agesquared
-0.000***
-0.000***
-0.000***
-0.000***
-0.000***
-0.000***
-0.000***
-0.000***
-0.000***
-0.000***
[0.000]
[0.000]
[0.000]
[0.000]
[0.000]
[0.000]
[0.000]
[0.000]
[0.000]
[0.000]
Birth
ord
er0.001
0.001
0.001
0.001
0.001
0.001
0.001
0.001
0.001
0.001
[0.001]
[0.001]
[0.001]
[0.001]
[0.001]
[0.001]
[0.001]
[0.001]
[0.001]
[0.001]
No.ofalivesiblingsatage15
-0.002*
-0.002*
-0.002
-0.001
-0.001
-0.001
-0.001
-0.001
-0.001
-0.001
[0.001]
[0.001]
[0.003]
[0.001]
[0.001]
[0.001]
[0.001]
[0.001]
[0.001]
[0.001]
No.ofolder
late
siblingsatage15
0.001
0.001
-0.002
0.001
0.001
0.001
0.001
-0.002
0.001
0.001
[0.002]
[0.002]
[0.003]
[0.002]
[0.002]
[0.002]
[0.002]
[0.000]
[0.002]
[0.002]
No.ofyounger
late
siblingsatage15
-0.001
-0.001
-0.002
-0.001
-0.002
-0.001
-0.002
-0.003
-0.001
-0.002
[0.003]
[0.003]
[0.003]
[0.003]
[0.003]
[0.003]
[0.003]
[0.000]
[0.003]
[0.003]
Eth
nicityFE
Yes
Yes
Yes
Yes
Yes
Yes
Yes
Yes
Yes
Yes
Eth
nicity-lev
elhistorica
lco
ntrols
No
No
No
No
No
No
No
No
No
No
Community-lev
elco
ntrols
Geo
graphyandclim
ate
Yes
Yes
No
Yes
Yes
Yes
Yes
No
Yes
Yes
Oth
erNo
Yes
No
No
Yes
No
Yes
No
No
Yes
CommunityFE
No
No
Yes
No
No
No
No
Yes
No
No
DistrictFE
Yes
Yes
No
Yes
Yes
Yes
Yes
No
Yes
Yes
Yea
rFE
Yes
Yes
Yes
Yes
Yes
Yes
Yes
Yes
Yes
Yes
1st
stageF-statistic
--
-49.96
45.25
80.24
78.23
224.05
73.24
73.32
Overiden
tifica
tion(p
-values)
--
-0.810
0.846
--
--
-R-squared
0.065
0.067
0.150
--
--
--
-No.ofobs.
23628
23559
23628
23628
23599
23628
23599
23628
23628
23599
Notes:
(1)Figures[
]are
standard
errors.***den
otessignifica
nce
at1%,**at5%,and*at10%.(2)Standard
errors
are
robust
toheterosked
asticityandclustered
residuals
within
each
communityin
OLS,wherea
sth
ose
in2SLSare
robust
toheterosked
asticityin
columnsex
clusiveof(h
).(3)Overiden
tifica
tionis
p-valueofHansentest
inallco
lumns
(d)to
(j)butco
lumn(h
),whereth
atofSargantest
isreported
.(4)Thegeo
graphic
andclim
ate
controls
contain
community-lev
elinform
ationonclim
atology,
landscapetypology,
soil&
terrain,cropseasonparameters,
andGPS-basedco
ord
inates.
See
Appen
dix
Aforth
edetails.
(5)Theoth
erco
mmunityco
ntrols
are
sourced
from
theIH
Sandco
ntain
characteristics
iden
tified
atth
epointofth
esu
rvey,including(i)dummiesfordescentru
les,
i.e.,matrilinea
l,patrilinea
l(referen
cegroup)ordualdescent;
(ii)
aco
mmunity’s
population;(iii)aco
mmunity’s
distance
(km)to
thenea
rest
townhavingover
20000population;(iv)adummyforamajorurb
ancenter;
(v)dummiesforth
emost
common
religionpracticed
inaco
mmunity,
i.e.,Christian,Muslim
,orTraditional(referen
cegroup);
and(vi)
dummiesforth
emost
commonlanguagesp
oken
athomein
aco
mmunity,
i.e.,Chew
a,Lambya,Lomwe,
Ngoni,Nkhonde,
Nyakyusa,Nyanja,Sen
a,Sen
ga,Sukwa,Tonga,Tumbuka,Yao,andoth
er(referen
cegroup).
(6)Eth
nic
groupsare
categorized
into
13groups,
i.e.,Chew
a,Lambya,Lomwe,
mang’anja,Ndali,Ngoni,Nkhonde,
Nyanja,Sen
a,Tonga,Tumbuka,Yao(referen
cegroup),
andoth
er.
77

Interim Report for Institutional Roles of Marriage in the Developing World: Empirical Studies from thePerspectives of Gender Empowerment, IDE-JETRO, 2014
Tab
leA.6:Checkingon
earlymarriag
e(allfemales
aged
less
than
25years)
Dependent
varia
ble
:O
ne
ifm
arrie
d
OLS
OLS
2SLS
(i)
2SLS
(ii)
(a)
(b)
(c)
(d)
(e)
(f)
(g)
(h)
(i)
(j)
(k)
(l)
(m
)
One
ifChristia
n-
--
-0.0
69***
-0.0
68***
-0.0
62***
-0.3
08***
-0.2
73**
-0.2
90***
-0.2
58**
-0.1
21
-0.2
55**
-0.2
29**
[0.0
13]
[0.0
13]
[0.0
16]
[0.1
10]
[0.1
11]
[0.1
09]
[0.1
11]
[0.1
59]
[0.1
13]
[0.1
13]
Distance
to
Liv
ingstonia
(100km
)0.0
23**
0.0
21**
0.0
08
--
--
--
--
--
×Non-Y
ao
[0.0
10]
[0.0
10]
[0.0
12]
Distance
to
Liv
ingstonia
(100km
)0.0
89
0.0
99
--
--
--
--
-0.0
74
0.0
88
[0.0
55]
[0.0
63]
[0.0
50]
[0.0
59]
Non-Y
ao
(dum
my)
-0.1
45***
-0.1
25**
-0.0
55
0.0
07
0.0
14
0.0
14
0.1
30**
0.1
18**
0.1
21**
0.1
11*
0.0
39
0.1
03*
0.0
96
[0.0
55]
[0.0
55]
[0.0
64]
[0.0
19]
[0.0
19]
[0.0
22]
[0.0
60]
[0.0
60]
[0.0
60]
[0.0
60]
[0.0
71]
[0.0
62]
[0.0
61]
Age
0.4
73***
0.4
72***
0.4
60***
0.4
71***
0.4
71***
0.4
59***
0.4
68***
0.4
68***
0.4
68***
0.4
69***
0.4
58***
0.4
69***
0.4
69***
[0.0
16]
[0.0
16]
[0.0
18]
[0.0
16]
[0.0
16]
[0.0
18]
[0.0
15]
[0.0
15]
[0.0
15]
[0.0
15]
[0.0
16]
[0.0
15]
[0.0
15]
Age
squared
-0.0
10***
-0.0
10***
-0.0
09***
-0.0
10***
-0.0
10***
-0.0
09***
-0.0
10***
-0.0
10***
-0.0
10***
-0.0
10***
-0.0
09***
-0.0
10***
-0.0
10***
[0.0
00]
[0.0
00]
[0.0
00]
[0.0
00]
[0.0
00]
[0.0
00]
[0.0
00]
[0.0
00]
[0.0
00]
[0.0
00]
[0.0
00]
[0.0
00]
[0.0
00]
Birth
order
-0.0
01
-0.0
01
-0.0
00
-0.0
01
-0.0
01
-0.0
00
-0.0
01
-0.0
01
-0.0
01
-0.0
01
-0.0
01
-0.0
01
-0.0
01
[0.0
02]
[0.0
02]
[0.0
02]
[0.0
02]
[0.0
02]
[0.0
02]
[0.0
02]
[0.0
02]
[0.0
02]
[0.0
02]
[0.0
02]
[0.0
02]
[0.0
02]
No.
ofalive
sib
lings
at
age
15
-0.0
03
-0.0
02
-0.0
03
-0.0
02
-0.0
02
-0.0
03
-0.0
02
-0.0
02
-0.0
02
-0.0
02
-0.0
03
-0.0
02
-0.0
02
[0.0
02]
[0.0
02]
[0.0
02]
[0.0
02]
[0.0
02]
[0.0
02]
[0.0
02]
[0.0
02]
[0.0
02]
[0.0
02]
[0.0
02]
[0.0
02]
[0.0
02]
No.
ofold
er
late
sib
lings
at
age
15
0.0
06
0.0
05
0.0
04
0.0
06
0.0
05
0.0
04
0.0
05
0.0
05
0.0
05
0.0
05
0.0
04
0.0
05
0.0
05
[0.0
04]
[0.0
04]
[0.0
04]
[0.0
04]
[0.0
04]
[0.0
04]
[0.0
04]
[0.0
04]
[0.0
04]
[0.0
04]
[0.0
04]
[0.0
04]
[0.0
04]
No.
ofyounger
late
sib
lings
at
age
15
0.0
02
0.0
01
-0.0
03
0.0
02
0.0
01
-0.0
03
0.0
02
0.0
01
0.0
02
0.0
01
-0.0
03
0.0
02
0.0
01
[0.0
04]
[0.0
04]
[0.0
05]
[0.0
04]
[0.0
04]
[0.0
04]
[0.0
04]
[0.0
04]
[0.0
04]
[0.0
04]
[0.0
04]
[0.0
04]
[0.0
04]
Ethnic
ity-levelhistoric
alcontrols
Yes
Yes
Yes
Yes
Yes
Yes
Yes
Yes
Yes
Yes
Yes
Yes
Yes
Com
munity-levelcontrols
Geography
and
clim
ate
Yes
Yes
No
Yes
Yes
No
Yes
Yes
Yes
Yes
No
Yes
Yes
Other
No
Yes
No
No
Yes
No
No
Yes
No
Yes
No
No
Yes
Com
munity
FE
No
No
Yes
No
No
Yes
No
No
No
No
Yes
No
No
Distric
tFE
Yes
Yes
No
Yes
Yes
No
Yes
Yes
Yes
Yes
No
Yes
Yes
Year
FE
Yes
Yes
Yes
Yes
Yes
Yes
Yes
Yes
Yes
Yes
Yes
Yes
Yes
1st
stage
F-s
tatistic
--
--
--
44.3
237.2
455.5
252.6
8121.0
949.1
348.5
5
Overid
entific
atio
n(p-v
alu
es)
--
--
--
0.1
32
0.1
38
--
--
-
R-s
quared
0.3
50
0.3
51
0.4
37
0.3
51
0.3
52
0.4
38
--
--
--
-
No.
ofobs.
17717
17688
17717
17715
17686
17715
17715
17686
17715
17686
17715
17715
17686
Notes:
(1)Figures[
]are
standard
errors.***den
otessignifica
nce
at1%,**at5%,and*at10%.(2)Standard
errors
are
robust
toheterosked
asticityandclustered
residuals
within
each
communityin
OLS,wherea
sth
ose
in2SLSare
robust
toheterosked
asticityin
columnsex
clusiveof(k).
(3)Overiden
tifica
tionis
p-valueofHansentest
inallco
lumns
(g)to
(m)butco
lumn(k),
whereth
atofSargantest
isreported
.(4)Thegeo
graphic
andclim
ate
controlsco
ntain
community-lev
elinform
ationonclim
atology,
landscapetypology,
soil&
terrain,cropseasonparameters,
andGPS-basedco
ord
inates.
See
Appen
dix
Aforth
edetails.
(5)Theoth
erco
mmunityco
ntrols
are
sourced
from
theIH
Sandco
ntain
characteristics
iden
tified
atth
epointofth
esu
rvey,including(i)dummiesfordescentru
les,
i.e.,matrilinea
l,patrilinea
l(referen
cegroup)ordualdescent;
(ii)
aco
mmunity’s
population;(iii)aco
mmunity’s
distance
(km)to
thenea
rest
townhavingover
20000population;(iv)adummyforamajorurb
ancenter;
(v)dummiesforth
emost
common
religionpracticed
inaco
mmunity,
i.e.,Christian,Muslim
,orTraditional(referen
cegroup);
and(vi)
dummiesforth
emost
commonlanguagesp
oken
athomein
aco
mmunity,
i.e.,Chew
a,Lambya,Lomwe,
Ngoni,
Nkhonde,
Nyakyusa,Nyanja,Sen
a,Sen
ga,Sukwa,Tonga,Tumbuka,Yao,andoth
er(referen
cegroup).
(6)Theethnicity-lev
elhistorica
lco
ntrols
include(i)adummyvariable,eq
ualto
oneifanypart
ofrailwaylines
inth
efirstdecadeofth
e20th
centu
rydrawnfrom
Cen
tury
Company(1911)passed
throughland
historica
llyinhabited
byanethnic
groupand(ii)
thetotalnumber
ofslaves
taken
from
anethnic
groupth
atwasnorm
alizedbyth
eareaoflandinhabited
byth
eethnic
group
duringth
e19th
centu
ry(logofoneplusth
enorm
alizedslaveex
port
mea
sure).
78

Interim Report for Institutional Roles of Marriage in the Developing World: Empirical Studies from thePerspectives of Gender Empowerment, IDE-JETRO, 2014
Tab
leA.7:Checkingon
therankof
wives
(allfemales
aged
less
than
25years)
Dependent
varia
ble
:The
rank
ofthe
respondent
am
ong
the
partner’s
wiv
es
(zero
ifnot
marrie
d)
OLS
OLS
2SLS
(i)
2SLS
(ii)
(a)
(b)
(c)
(d)
(e)
(f)
(g)
(h)
(i)
(j)
(k)
(l)
(m
)
One
ifChristia
n-
--
-0.0
81***
-0.0
79***
-0.0
69***
-0.3
89***
-0.3
50***
-0.3
75***
-0.3
41***
-0.1
99
-0.3
45***
-0.3
20**
[0.0
14]
[0.0
14]
[0.0
17]
[0.1
25]
[0.1
25]
[0.1
24]
[0.1
25]
[0.1
74]
[0.1
28]
[0.1
28]
Distance
to
Liv
ingstonia
(100km
)0.0
31***
0.0
29**
0.0
14
--
--
--
--
--
×Non-Y
ao
[0.0
12]
[0.0
12]
[0.0
14]
0.0
63
0.0
64
Distance
to
Liv
ingstonia
0.0
79
0.0
77
--
--
--
--
-[0
.060]
[0.0
68]
(100km
)[0
.067]
[0.0
72]
Non-Y
ao
(dum
my)
-0.1
91***
-0.1
71***
-0.0
89
0.0
10
0.0
16
0.0
11
0.1
68**
0.1
54**
0.1
61**
0.1
49**
0.0
68
0.1
47**
0.1
39**
[0.0
64]
[0.0
63]
[0.0
75]
[0.0
21]
[0.0
21]
[0.0
24]
[0.0
67]
[0.0
67]
[0.0
67]
[0.0
67]
[0.0
79]
[0.0
69]
[0.0
68]
Age
0.4
70***
0.4
71***
0.4
55***
0.4
68***
0.4
70***
0.4
54***
0.4
64***
0.4
66***
0.4
64***
0.4
66***
0.4
51***
0.4
65***
0.4
66***
[0.0
18]
[0.0
18]
[0.0
20]
[0.0
18]
[0.0
18]
[0.0
20]
[0.0
17]
[0.0
17]
[0.0
17]
[0.0
17]
[0.0
18]
[0.0
17]
[0.0
17]
Age
squared
-0.0
10***
-0.0
10***
-0.0
09***
-0.0
09***
-0.0
10***
-0.0
09***
-0.0
09***
-0.0
09***
-0.0
09***
-0.0
09***
-0.0
09***
-0.0
09***
-0.0
09***
[0.0
00]
[0.0
00]
[0.0
00]
[0.0
00]
[0.0
00]
[0.0
00]
[0.0
00]
[0.0
00]
[0.0
00]
[0.0
00]
[0.0
00]
[0.0
00]
[0.0
00]
Birth
order
-0.0
01
-0.0
01
-0.0
00
-0.0
01
-0.0
01
-0.0
00
-0.0
01
-0.0
01
-0.0
01
-0.0
01
-0.0
00
-0.0
01
-0.0
01
[0.0
02]
[0.0
02]
[0.0
02]
[0.0
02]
[0.0
02]
[0.0
02]
[0.0
02]
[0.0
02]
[0.0
02]
[0.0
02]
[0.0
02]
[0.0
02]
[0.0
02]
No.
ofalive
sib
lings
at
age
15
-0.0
03
-0.0
03
-0.0
04
-0.0
03
-0.0
03
-0.0
03
-0.0
02
-0.0
02
-0.0
02
-0.0
02
-0.0
03
-0.0
02
-0.0
02
[0.0
02]
[0.0
02]
[0.0
02]
[0.0
02]
[0.0
02]
[0.0
02]
[0.0
02]
[0.0
02]
[0.0
02]
[0.0
02]
[0.0
02]
[0.0
02]
[0.0
02]
No.
ofold
er
late
sib
lings
at
age
15
0.0
07*
0.0
07
0.0
04
0.0
07
0.0
07
0.0
04
0.0
06
0.0
06
0.0
06
0.0
06
0.0
04
0.0
06
0.0
06
[0.0
04]
[0.0
04]
[0.0
05]
[0.0
04]
[0.0
04]
[0.0
05]
[0.0
04]
[0.0
04]
[0.0
04]
[0.0
04]
[0.0
04]
[0.0
04]
[0.0
04]
No.
ofyounger
late
sib
lings
at
age
15
0.0
02
0.0
01
-0.0
03
0.0
02
0.0
01
-0.0
03
0.0
02
0.0
02
0.0
02
0.0
02
-0.0
03
0.0
02
0.0
02
[0.0
05]
[0.0
05]
[0.0
05]
[0.0
05]
[0.0
05]
[0.0
05]
[0.0
05]
[0.0
05]
[0.0
05]
[0.0
05]
[0.0
04]
[0.0
05]
[0.0
05]
Ethnic
ity-levelhistoric
alcontrols
Yes
Yes
Yes
Yes
Yes
Yes
Yes
Yes
Yes
Yes
Yes
Yes
Yes
Com
munity-levelcontrols
Geography
and
clim
ate
Yes
Yes
No
Yes
Yes
No
Yes
Yes
Yes
Yes
No
Yes
Yes
Other
No
Yes
No
No
Yes
No
No
Yes
No
Yes
No
No
Yes
Com
munity
FE
No
No
Yes
No
No
Yes
No
No
No
No
Yes
No
No
Distric
tFE
Yes
Yes
No
Yes
Yes
No
Yes
Yes
Yes
Yes
No
Yes
Yes
Year
FE
Yes
Yes
Yes
Yes
Yes
Yes
Yes
Yes
Yes
Yes
Yes
Yes
Yes
1st
stage
F-s
tatistic
--
--
--
43.2
935.7
154.9
052.0
8122.3
648.7
248.3
0
Overid
entific
atio
n(p-v
alu
es)
--
--
--
0.2
92
0.3
45
--
--
-
R-s
quared
0.3
27
0.3
28
0.4
18
0.3
28
0.3
29
0.4
19
--
--
--
-
No.
ofobs.
17456
17427
17456
17454
17425
17454
17454
17425
17454
17425
17454
17454
17425
Notes:
(1)Figures[
]are
standard
errors.***den
otessignifica
nce
at1%,**at5%,and*at10%.(2)Standard
errors
are
robust
toheterosked
asticityandclustered
residuals
within
each
communityin
OLS,wherea
sth
ose
in2SLSare
robust
toheterosked
asticityin
columnsex
clusiveof(k).
(3)Overiden
tifica
tionis
p-valueofHansentest
inallco
lumns
(g)to
(m)butco
lumn
(k),
whereth
atofSargan
test
isreported
.(4)Thegeo
graphic
and
clim
ate
controls
contain
community-lev
elinform
ation
on
clim
atology,
landscape
typology,
soil
&terrain,crop
season
parameters,
and
GPS-based
coord
inates.
See
Appen
dix
Aforth
edetails.
(5)Theoth
erco
mmunityco
ntrols
are
sourced
from
theIH
Sand
contain
characteristics
iden
tified
atth
epointofth
esu
rvey,including(i)dummiesfordescentru
les,
i.e.,matrilinea
l,patrilinea
l(referen
cegroup)ordualdescent;
(ii)
aco
mmunity’s
population;(iii)aco
mmunity’s
distance
(km)to
thenea
rest
town
havingover
20000population;(iv)adummyforamajorurb
an
center;
(v)dummiesforth
emost
commonreligionpracticed
inaco
mmunity,
i.e.,Christian,Muslim
,orTraditional(referen
cegroup);
and(vi)
dummiesforth
emost
commonlanguagesp
oken
athomein
aco
mmunity,
i.e.,Chew
a,Lambya,Lomwe,
Ngoni,Nkhonde,
Nyakyusa,Nyanja,Sen
a,Sen
ga,Sukwa,Tonga,Tumbuka,Yao,andoth
er(referen
cegroup).
(6)Theethnicity-lev
elhistorica
lco
ntrols
include(i)adummyvariable,eq
ualto
oneif
anypart
ofrailwaylines
inth
efirstdecadeofth
e20th
centu
rydrawnfrom
Cen
tury
Company(1911)passed
throughlandhistorica
llyinhabited
byanethnic
groupand(ii)
thetotalnumber
ofslaves
taken
from
anethnic
groupth
atwasnorm
alizedbyth
eareaoflandinhabited
byth
eethnic
groupduringth
e19th
centu
ry(logofoneplusth
enorm
alizedslaveex
port
mea
sure).
79

Interim Report for Institutional Roles of Marriage in the Developing World: Empirical Studies from thePerspectives of Gender Empowerment, IDE-JETRO, 2014
Tab
leA.8:Im
pacts
ofreligiou
saffi
liation:ed
ucation
Dependent
varia
ble
:Educatio
n(years)
OLS
OLS
2SLS
(i)
2SLS
(ii)
(a)
(b)
(c)
(d)
(e)
(f)
(g)
(h)
(i)
(j)
(k)
(l)
(m
)
One
ifChristia
n-
--
1.1
94***
1.1
63***
1.0
20***
3.1
53***
2.9
95***
3.1
73***
2.9
87***
4.0
38***
3.2
37***
2.9
62***
[0.1
05]
[0.1
05]
[0.1
05]
[0.7
60]
[0.7
64]
[0.7
64]
[0.7
67]
[0.9
10]
[0.7
96]
[0.7
88]
Distance
to
Liv
ingstonia
-0.3
20***
-0.2
94***
-0.3
32***
--
--
--
--
--
(100km
)×
Non-Y
ao
[0.0
88]
[0.0
88]
[0.0
93]
Distance
to
Liv
ingstonia
0.0
55
-0.1
58
--
--
--
--
-0.1
45
-0.0
78
(100km
)[0
.513]
[0.5
80]
[0.3
25]
[0.3
83]
Non-Y
ao
(dum
my)
1.8
94***
1.6
85***
1.7
16***
-0.3
49**
-0.4
06**
-0.4
24***
-1.3
78***
-1.3
59***
-1.3
89***
-1.3
55***
-1.7
96***
-1.4
22***
-1.3
42***
[0.4
63]
[0.4
63]
[0.4
92]
[0.1
61]
[0.1
59]
[0.1
61]
[0.4
25]
[0.4
23]
[0.4
27]
[0.4
24]
[0.4
31]
[0.4
42]
[0.4
35]
Age
0.0
40**
0.0
35*
0.0
01
0.0
40**
0.0
35*
0.0
02
0.0
40**
0.0
36**
0.0
40**
0.0
36**
0.0
05
0.0
40**
0.0
36**
[0.0
19]
[0.0
19]
[0.0
20]
[0.0
19]
[0.0
19]
[0.0
19]
[0.0
18]
[0.0
18]
[0.0
18]
[0.0
18]
[0.0
18]
[0.0
18]
[0.0
18]
Age
squared
-0.0
02***
-0.0
02***
-0.0
02***
-0.0
02***
-0.0
02***
-0.0
02***
-0.0
02***
-0.0
02***
-0.0
02***
-0.0
02***
-0.0
02***
-0.0
02***
-0.0
02***
[0.0
00]
[0.0
00]
[0.0
00]
[0.0
00]
[0.0
00]
[0.0
00]
[0.0
00]
[0.0
00]
[0.0
00]
[0.0
00]
[0.0
00]
[0.0
00]
[0.0
00]
Birth
order
-0.0
27*
-0.0
30**
-0.0
38**
-0.0
27*
-0.0
30**
-0.0
38**
-0.0
26*
-0.0
30**
-0.0
26*
-0.0
30**
-0.0
36***
-0.0
26*
-0.0
30**
[0.0
15]
[0.0
15]
[0.0
15]
[0.0
15]
[0.0
15]
[0.0
15]
[0.0
15]
[0.0
15]
[0.0
15]
[0.0
15]
[0.0
14]
[0.0
15]
[0.0
15]
No.
ofalive
sib
lings
at
age
15
0.1
39***
0.1
39***
0.1
12***
0.1
36***
0.1
37***
0.1
11***
0.1
30***
0.1
31***
0.1
30***
0.1
31***
0.1
05***
0.1
30***
0.1
32***
[0.0
14]
[0.0
14]
[0.0
13]
[0.0
14]
[0.0
14]
[0.0
13]
[0.0
13]
[0.0
13]
[0.0
13]
[0.0
13]
[0.0
12]
[0.0
13]
[0.0
13]
No.
ofold
er
late
sib
lings
at
age
15
-0.0
47*
-0.0
41*
-0.0
13
-0.0
47*
-0.0
41*
-0.0
12
-0.0
47*
-0.0
41*
-0.0
47*
-0.0
41*
-0.0
12
-0.0
47*
-0.0
41*
[0.0
24]
[0.0
24]
[0.0
25]
[0.0
24]
[0.0
24]
[0.0
25]
[0.0
25]
[0.0
25]
[0.0
25]
[0.0
25]
[0.0
23]
[0.0
25]
[0.0
25]
No.
ofyounger
late
sib
lings
at
age
15
-0.1
48***
-0.1
41***
-0.0
95***
-0.1
47***
-0.1
41***
-0.0
94***
-0.1
47***
-0.1
41***
-0.1
47***
-0.1
41***
-0.0
89***
-0.1
47***
-0.1
41***
[0.0
25]
[0.0
25]
[0.0
26]
[0.0
25]
[0.0
25]
[0.0
26]
[0.0
25]
[0.0
25]
[0.0
25]
[0.0
25]
[0.0
26]
[0.0
25]
[0.0
25]
Ethnic
ity-levelhistoric
alcontrols
Yes
Yes
Yes
Yes
Yes
Yes
Yes
Yes
Yes
Yes
Yes
Yes
Yes
Com
munity-levelcontrols
Geography
and
clim
ate
Yes
Yes
No
Yes
Yes
No
Yes
Yes
Yes
Yes
No
Yes
Yes
Other
No
Yes
No
No
Yes
No
No
Yes
No
Yes
No
No
Yes
Com
munity
FE
No
No
Yes
No
No
Yes
No
No
No
No
Yes
No
No
Distric
tFE
Yes
Yes
No
Yes
Yes
No
Yes
Yes
Yes
Yes
No
Yes
Yes
Year
FE
Yes
Yes
Yes
Yes
Yes
Yes
Yes
Yes
Yes
Yes
Yes
Yes
Yes
1st
stage
F-s
tatistic
--
--
--
55.1
749.3
280.0
577.7
8209.3
872.3
972.5
0
Overid
entific
atio
n(p-v
alu
es)
--
--
--
0.6
55
0.8
38
--
--
-
R-s
quared
0.2
27
0.2
37
0.3
90
0.2
32
0.2
42
0.3
93
--
--
--
-
No.
ofobs.
21594
21566
21594
21586
21558
21586
21586
21558
21586
21558
21586
21586
21558
Notes:
(1)Figures[
]are
standard
errors.***den
otessignifica
nce
at1%,**at5%,and*at10%.(2)Standard
errors
are
robust
toheterosked
asticityandclustered
residuals
within
each
communityin
OLS,wherea
sth
ose
in2SLSare
robust
toheterosked
asticityin
columnsex
clusiveof(k).
(3)Overiden
tifica
tionis
p-valueofHansentest
inallco
lumns
(g)to
(m)butco
lumn
(k),
whereth
atofSargan
test
isreported
.(4)Thegeo
graphic
and
clim
ate
controls
contain
aco
mmunity-lev
elinform
ation
on
clim
atology,
landscape
typology,
soil
&terrain,crop
season
parameters,
and
GPS-based
coord
inates.
See
Appen
dix
Aforth
edetails.
(5)Theoth
erco
mmunityco
ntrols
are
sourced
from
theIH
Sand
contain
characteristics
iden
tified
atth
epointofth
esu
rvey,including(i)dummiesfordescentru
les,
i.e.,matrilinea
l,patrilinea
l(referen
cegroup)ordualdescent;
(ii)
aco
mmunity’s
population;(iii)aco
mmunity’s
distance
(km)to
thenea
rest
town
havingover
20000population;(iv)adummyforamajorurb
an
center;
(v)dummiesforth
emost
commonreligionpracticed
inaco
mmunity,
i.e.,Christian,Muslim
,orTraditional(referen
cegroup);
and(vi)
dummiesforth
emost
commonlanguagesp
oken
athomein
aco
mmunity,
i.e.,Chew
a,Lambya,Lomwe,
Ngoni,Nkhonde,
Nyakyusa,Nyanja,Sen
a,Sen
ga,Sukwa,Tonga,Tumbuka,Yao,andoth
er(referen
cegroup).
(6)Theethnicity-lev
elhistorica
lco
ntrols
include(i)adummyvariable,eq
ualto
oneif
anypart
ofrailwaylines
inth
efirstdecadeofth
e20th
centu
rydrawnfrom
Cen
tury
Company(1911)passed
throughlandhistorica
llyinhabited
byanethnic
groupand(ii)
thetotalnumber
ofslaves
taken
from
anethnic
groupth
atwasnorm
alizedbyth
eareaoflandinhabited
byth
eethnic
groupduringth
e19th
centu
ry(logofoneplusth
enorm
alizedslaveex
port
mea
sure).
80

Interim Report for Institutional Roles of Marriage in the Developing World: Empirical Studies from thePerspectives of Gender Empowerment, IDE-JETRO, 2014
Tab
leA.9:Im
pacts
ofreligiou
saffi
liation:HIV
serostatus
Dependent
varia
ble
:O
ne
ifHIV
positiv
e
OLS
OLS
2SLS
(i)
2SLS
(ii)
(a)
(b)
(c)
(d)
(e)
(f)
(g)
(h)
(i)
(j)
(k)
(l)
(m
)
One
ifChristia
n-
--
0.0
02
0.0
04
0.0
02
-0.3
24
-0.3
51*
-0.3
23
-0.3
68**
-0.7
58**
-0.3
23
-0.3
81*
[0.0
15]
[0.0
15]
[0.0
20]
[0.2
08]
[0.1
82]
[0.2
31]
[0.1
87]
[0.3
61]
[0.2
56]
[0.1
98]
Distance
to
Liv
ingstonia
(100km
)0.0
19
0.0
23*
0.0
28*
--
--
--
--
--
×Non-Y
ao
[0.0
14]
[0.0
14]
[0.0
17]
Distance
to
Liv
ingstonia
(100km
)0.0
33
0.0
03
--
--
--
--
-0.0
01
-0.0
32
[0.0
52]
[0.0
64]
[0.0
63]
[0.0
80]
Non-Y
ao
(dum
my)
-0.1
47**
-0.1
67**
-0.1
96**
-0.0
50**
-0.0
53**
-0.0
54**
0.1
28
0.1
37
0.1
27
0.1
47
0.3
10*
0.1
27
0.1
54
[0.0
73]
[0.0
73]
[0.0
88]
[0.0
22]
[0.0
22]
[0.0
26]
[0.1
14]
[0.1
00]
[0.1
27]
[0.1
02]
[0.1
74]
[0.1
39]
[0.1
08]
Age
0.0
27***
0.0
27***
0.0
26***
0.0
27***
0.0
27***
0.0
26***
0.0
26***
0.0
26***
0.0
26***
0.0
26***
0.0
25***
0.0
26***
0.0
26***
[0.0
02]
[0.0
02]
[0.0
03]
[0.0
02]
[0.0
02]
[0.0
03]
[0.0
02]
[0.0
03]
[0.0
02]
[0.0
03]
[0.0
03]
[0.0
02]
[0.0
03]
Age
squared
-0.0
00***
-0.0
00***
-0.0
00***
-0.0
00***
-0.0
00***
-0.0
00***
-0.0
00***
-0.0
00***
-0.0
00***
-0.0
00***
-0.0
00***
-0.0
00***
-0.0
00***
[0.0
00]
[0.0
00]
[0.0
00]
[0.0
00]
[0.0
00]
[0.0
00]
[0.0
00]
[0.0
00]
[0.0
00]
[0.0
00]
[0.0
00]
[0.0
00]
[0.0
00]
Birth
order
-0.0
00
-0.0
00
-0.0
00
-0.0
00
-0.0
00
-0.0
00
0.0
00
0.0
00
0.0
00
0.0
00
0.0
00
0.0
00
0.0
00
[0.0
02]
[0.0
02]
[0.0
03]
[0.0
02]
[0.0
02]
[0.0
03]
[0.0
02]
[0.0
02]
[0.0
02]
[0.0
02]
[0.0
03]
[0.0
02]
[0.0
02]
No.
ofalive
sib
lings
at
age
15
0.0
01
0.0
01
-0.0
01
0.0
01
0.0
01
-0.0
01
0.0
01
0.0
02
0.0
01
0.0
02
0.0
00
0.0
01
0.0
02
[0.0
02]
[0.0
02]
[0.0
03]
[0.0
02]
[0.0
02]
[0.0
03]
[0.0
02]
[0.0
02]
[0.0
02]
[0.0
02]
[0.0
02]
[0.0
02]
[0.0
02]
No.
ofold
er
late
sib
lings
at
age
15
-0.0
02
-0.0
01
-0.0
01
-0.0
01
-0.0
01
-0.0
01
-0.0
02
-0.0
02
-0.0
02
-0.0
02
-0.0
02
-0.0
02
-0.0
02
[0.0
04]
[0.0
04]
[0.0
04]
[0.0
04]
[0.0
04]
[0.0
04]
[0.0
04]
[0.0
04]
[0.0
04]
[0.0
04]
[0.0
04]
[0.0
04]
[0.0
04]
No.
ofyounger
late
sib
lings
at
age
15
-0.0
03
-0.0
02
-0.0
04
-0.0
03
-0.0
02
-0.0
04
-0.0
03
-0.0
02
-0.0
03
-0.0
02
-0.0
04
-0.0
03
-0.0
02
[0.0
04]
[0.0
04]
[0.0
05]
[0.0
04]
[0.0
04]
[0.0
05]
[0.0
05]
[0.0
05]
[0.0
05]
[0.0
05]
[0.0
05]
[0.0
05]
[0.0
05]
Ethnic
ity-levelhistoric
alcontrols
Yes
Yes
Yes
Yes
Yes
Yes
Yes
Yes
Yes
Yes
Yes
Yes
Yes
Com
munity-levelcontrols
Geography
and
clim
ate
Yes
Yes
No
Yes
Yes
No
Yes
Yes
Yes
Yes
No
Yes
Yes
Other
No
Yes
No
No
Yes
No
No
Yes
No
Yes
No
No
Yes
Com
munity
FE
No
No
Yes
No
No
Yes
No
No
No
No
Yes
No
No
Distric
tFE
Yes
Yes
No
Yes
Yes
No
Yes
Yes
Yes
Yes
No
Yes
Yes
Year
FE
Yes
Yes
Yes
Yes
Yes
Yes
Yes
Yes
Yes
Yes
Yes
Yes
Yes
1st
stage
F-s
tatistic
--
--
--
17.8
831.2
712.9
759.2
918.5
510.7
253.2
6
Overid
entific
atio
n(p-v
alu
es)
--
--
--
0.9
85
0.6
86
--
--
-
R-s
quared
0.0
79
0.0
83
0.2
31
0.0
78
0.0
83
0.2
31
--
--
--
-
No.
ofobs.
8785
8767
8785
8782
8764
8782
8782
8764
8782
8764
8782
8782
8764
Notes:
(1)Figures[
]are
standard
errors.***den
otessignifica
nce
at1%,**at5%,and*at10%.(2)Standard
errors
are
robust
toheterosked
asticityandclustered
residuals
within
each
communityin
OLS,wherea
sth
ose
in2SLSare
robust
toheterosked
asticityin
columnsex
clusiveof(h
),(j),
(k)and(m
).(3)Overiden
tifica
tionis
p-valueofHansen
test
inall
columns(g)to
(m)butco
lumns(h
),(j),
(k)and
(m),
whereth
atofSargan
test
isreported
.(4)Thegeo
graphic
and
clim
ate
controls
contain
aco
mmunity-lev
elinform
ationonclim
atology,
landscapetypology,
soil&
terrain,cropseasonparameters,
andGPS-basedco
ord
inates.
See
Appen
dix
Aforth
edetails.
(5)Theoth
erco
mmunity
controls
are
sourced
from
theIH
Sandco
ntain
characteristics
iden
tified
atth
epointofth
esu
rvey,including(i)dummiesfordescentru
les,
i.e.,matrilinea
l,patrilinea
l(referen
cegroup)ordualdescent;
(ii)
aco
mmunity’s
population;(iii)aco
mmunity’s
distance
(km)to
thenea
rest
townhavingover
20000population;(iv)adummyforamajorurb
an
center;
(v)dummiesforth
emost
commonreligionpracticed
inaco
mmunity,
i.e.,Christian,Muslim
,orTraditional(referen
cegroup);
and(vi)
dummiesforth
emost
common
languagesp
oken
athomein
aco
mmunity,
i.e.,Chew
a,Lambya,Lomwe,
Ngoni,Nkhonde,
Nyakyusa,Nyanja,Sen
a,Sen
ga,Sukwa,Tonga,Tumbuka,Yao,andoth
er(referen
cegroup).
(6)Theethnicity-lev
elhistorica
lco
ntrols
include(i)adummyvariable,eq
ualto
oneif
anypart
ofrailwaylines
inth
efirstdecadeofth
e20th
centu
rydrawn
from
Cen
tury
Company(1911)passed
throughlandhistorica
llyinhabited
byanethnic
groupand(ii)
thetotalnumber
ofslaves
taken
from
anethnic
groupth
atwasnorm
alizedby
theareaoflandinhabited
byth
eethnic
groupduringth
e19th
centu
ry(logofoneplusth
enorm
alizedslaveex
port
mea
sure).
81