relief and social services department
TRANSCRIPT
RELIEF AND SOCIAL SERVICES DEPARTMENT
A SOCIO-ECONOMIC ANALYSIS OF
SPECIAL HARDSHIP CASE FAMILIES IN THE FIVE FIELDS OF UNRWA
OPERATIONS
Ibrahim M. Hejoj, Ph.D. and Adnan Badran
October, 2006
2
Table of Contents
List of Tables 5 List of Figures 7 List of Acronyms 9 Executive Summary 10
CHAPTER ONE: INTRODUCTION
Historical background 16 Population trends of registered Palestine refugees since
1952 17
Structure of the report 18 Methods of research 19 The questionnaire 19 The sample 19 Fieldwork 20 Data cleaning, processing and response rate 20
CHAPTER TWO: THE SPECIAL HARDSHIP CASE PROGRAMME
Background 22 Population trends of SHC families since 1983 22 Composition of the food basket 24 Special Hardship Case population 25
CHAPTER THREE: POPULATION
Family size 28 Age-sex structure 30 Migration 31
CHAPTER FOUR: EDUCATION
Educational attainment 34 Enrolment and drop out rates 38 Type of school attended 40 Education accomplishment associated with household
heads and by gender 40
Reasons for not enrolling or dropping out 42

3
CHAPTER FIVE: HEALTH AND HEALTH CONDITIONS
Disabilities and chronic illnesses 44 Disabilities 44 Chronic illnesses 47 Physical impairment 50 Health insurance coverage and treatment 50
CHAPTER SIX: LABOUR FORCE
General Background 52 Economic activity status 52 Occupation and industry 54 The unemployed 57
CHAPTER SEVEN: HOUSEHOLD ECONOMICS
SHC families’ expenditures 59 The distribution of expenditures 60 Overall expenditures by expenditure groups 63 SHC families’ income 63 The distribution of income 64 SHC family reliance on transfer incomes 65 Distribution of income by category 70 The relation of age, gender and education to income 71 Possession of durable goods 73
CHAPTER EIGHT: HOUSING AND INFRASTRUCTURE
The dwellings 76 Dwellings ownership 78 Number of rooms in the dwellings and overcrowding 79 Amenities and sanitation 80 The indoor environment 82 Availability of services 82 CHAPTER NINE: FOOD ASSESSMENT SURVEY
Consumption of food items 86 Sufficiency of food quantities 88 Substitution of food items 89
4
Unitization of cash proceeds and cash subsidy 91 Preferences of SHC families in terms of distribution
mechanism
91
CHAPTER TEN: CONCLUSIONS AND POLICY IMPLICATIONS Conclusions 95 Policy Implications 103 APPENDICES Appendix One: Methodological note on the sample
106
Appendix Two: The questionnaire 109 BIBLIOGRAPHY 129

5
LIST OF TABLES
Number
Page
Table 1.1: Sample size by field 20
Table 1.2: Net sample size by field and as a total 21
Table 2.1: Food commodities and quantities distributed to SHC families 24
Table 2.2: Number of Registered Refugees, SHC persons and rations as end of Dec. 2005
25
Table 2.3: Place of residence of SHC families, inside and outside camps 26
Table 2.4:Distibution of SHC families by category and by field 26
Table 3.1: Average SHC family size compared with RR and host country populations
28
Table 3.2: Family size by category 29
Table 3.3: Median age by category and field 30
Table 3.4: Main reason for moving 33
Table 4.1: Highest level of education completed among persons aged 25 years or older
36
Table 4.2: Educational accomplishment by field 38
Table 4.3: Net enrolment and drop out rates by field and as a total 39
Table 6.1: Per cent distribution of SHC individuals (10+ year of age) by employment category and by SHC category
53
Table 6.2: Per cent distribution of employed SHC individuals by gender and occupation
55
Table 7.1: Distribution of individuals by field and by overall expenditure deciles
60
Table 7.2: Gini index by field and as a total, based on per capita expenditures
61
Table 7.3: Distribution of families by field and overall expenditure deciles 61
Table 7.4: Per cent distribution of average monthly expenditures by expenditure groups and by field
63
Table 7.5: Gini index by field and as a total, based on per capita income 65
Table 7.6: Average annual per capita total income by source of income (USD)
67
Table 7.7: Per cent distribution of annual per capita transfer income by source of income
68
Table 7.8: Distribution of individuals by field and overall income deciles 68
Table 7.9: Per cent distribution of families by overall income deciles and by field
70

6
Table 7.10: Per cent distribution of families by income type and by categories
71
Table 8.1: Percentage of SHC families in different types of dwellings, location and by field
77
Table 9.1: Consumption of food items by field, per cent distribution of SHC families
88
Table 9.2: Per cent of families wanting to replace food items and kind of replacement
90
Table 10.1: Basic social and economic indicators
96

7
LIST OF FIGURES
Number
Page
Figure 1.1: Growth rates of registered refugee population since 1953 18
Figure 2.1: Per cent growth of SHC individuals (1983-2005) 23
Figure 2.2: Growth rates of SHC individuals (1983-2005) 23
Figure 3.1: Distribution of population by family size 29
Figure 3.2: Distribution of SHC population by age and sex 31
Figure 3.3: Number of years lived at current place of residence 32
Figure 3.4: Number of lifetime moves by gender 32
Figure 4.1: Highest level of education completed 35
Figure 4.2: Percentage of persons 25 years and older with post-secondary education; by age and gender
36
Figure 4.3: Illiteracy rates for men and women (15+ years) by age groups 37 Figure 4.4: School drop out ratio for students from 7 to 15 years of age for all fields
39
Figure 4.5: Educational accomplishment by gender 40
Figure 4.6: Percentage of highest level of education completed among heads of families (15+ year old) by gender
41
Figure 4.7: Reasons for not enrolling or dropping out of school, children 6-18 years of age and by gender
42
Figure 5.1: Percentage distribution of disabilities by field 45
Figure 5.2: Percentage of persons with disabilities by age groups and kinds of disabilities
45
Figure 5.3: Distribution of disabilities by age and gender 46
Figure 5.4: Average number of years suffering from disabilities 47
Figure 5.5: Percentage of total population with chronic illnesses 48
Figure 5.6: Distribution of chronic illnesses by age and gender 49
Figure 5.7: Average number of years suffering from chronic illnesses 49
Figure 5.8: Coverage of health insurance among SHC families by field 50
Figure 6.1: Per cent of employed SHC individuals (10+ years) by employment categorization and by gender
53
Figure 6.2: Per cent of working individuals by age groups (10+ years) 54
Figure 6.3: Occupational structure for men by educational accomplishment 56

8
Figure 6.4: Occupational structure for women by educational accomplishment
57
Figure 6.5: Number of person that do not work by age groups and gender 58
Figure 7.1: Distribution of SHCs annual expenditures 59
Figure 7.2: Average monthly family expenditures by field 62
Figure 7.3: Distribution of per capita annual income 64
Figure 7.4: Total income (deciles) by main income type and per cent of SHC families in each income decile
66
Figure 7.5: SHC individuals by total per capita income and income per unit deciles
69
Figure 7.6: Per cent distribution of SHC families by head of family gender and income deciles
71
Figure 7.7: Per cent distribution of SHC families by head of family marital status and income deciles
72
Figure 7.8: Per cent distribution of SHC families by head of family age and income deciles
73
Figure 7.9: SHC families by ownership of durable goods 74
Figure 8.1: Per cent distribution of dwellings by type of building material and by field
78
Figure 8.2: Owning, renting and other arrangements: Percentage distribution of SHC families by income groups
79
Figure 8.3: Per cent distribution of SHC dwelling by connection to a sewage network for inside and outside camps dwellings
81
Figure 8.4: Percentages of households affected by negative housing characteristics
82
Figure 8.5: Per cent of SHC families with various community services within radius of 3 km or less
83
Figure 8.6: Per cent distribution of SHC families in the five fields by type of services available within radius of 3 km or less
84
Figure 9.1: Consumption of flour by field 87
Figure 9.2: Per cent of SHC families wanting to replace the food items 90
Figure 9.3: Per cent distribution of SHC families by the preferred type of intervention and by field
92
Figure 9.4: Per cent distribution of SHC families by categories (all food) 92
Figure 9.5: Per cent distribution of SHC families by categories (all cash) 93
Figure 9.6: Per cent distribution of SHC families by categories (part-food and part-cash)
93

9
LIST OF ACRONYMS
DoS : Jordan’s Department of Statistics
DPA : Department of Palestinian Affairs (Jordan)
EC : European Community
FIS : Family Income Supplement
HEIS : Household Expenditure and Income Survey
HoF : Head of Family
ICRC : The International Committee of the Red Cross
JD : Jordanian Dinar
MIS : Management Information System
MoSA : Ministry of Social Affairs
MoSD : Ministry of Social Development
MWN : Married Wife Non-refugee
NAF : The National Aid Fund (Jordan)
NGOs : Non-Governmental Organizations
oPt : Occupied Palestinian Territories
PA : Palestinian Authority
PPP : Purchasing Power Parity
PVOs Private Voluntary Organizations
RCAP : Recurrent Cash Assistance Programme
RR : Registered Refugees
SHC Special Hardship Case
SMEs : Small and Micro Enterprises
SPSS : Statistical Package for Social Sciences
UN : United Nations
UNRWA : United Nations Relief and Works Agency for Palestine Refugees in the Near East
USD United States Dollar
10
Executive Summary
Nearly three-quarters of a million Palestinians lost their homes and livelihoods in the aftermath of the 1948 Arab-Israeli War. The responsibility for addressing the many pressing needs of these refugees, initially adopted by international and local voluntary organizations, was handed over to the United Nations Relief and Works Agency for Palestine Refugees in the Near East (UNRWA) following its establishment by the United Nations General Assembly on December 8, 1949. UNRWA initiated its operations in May 1950, primarily as a relief agency and remains, half a century later, the largest and oldest organization providing continuous basic services to Palestine refugees. At present, the agency provides education, health, relief and social services, as well as income generation assistance through micro-credit and micro-enterprise programmes and vocational training, to more than 4.3 million registered Palestine refugees in the Gaza Strip, West Bank, Syrian Arab Republic, Lebanon, and Jordan. The Agency’s Special Hardship Case (SHC) programme, the focus of the current survey, was introduced in 1978 to provide a cushion of support to the neediest families among the refugee population in the five fields of UNRWA operations. Upon implementation, the SHC Programme increased the amount of assistance to needy families, compared to that received by other refugees. In 1982, the mass distribution of food rations to the majority of refugees was abolished, and thus the SHC programme remained the main programme that provides food rations to the neediest refugees. This report examines the socio-economic conditions of SHC families in the five fields of UNRWA operations along all major socio-economic dimensions. It builds on the results of the SHC survey, which offers an overview of the living conditions of the SHC population, as derived through interviews with a representative sample of 3603 SHC families (14,598 individuals) in the five fields. One of the main objectives of the survey was to provide data relevant to a range of policy concerns associated with reforming the SHC programme from the current status-based approach to a needs-based approach. A second objective was to undertake an in-depth policy-relevant analysis of the socio-economic conditions of SHC families, which will serve as a baseline for studying subsequent changes in the patterns of living conditions, particularly after reforming the Programme. To date, the SHC survey represents the first comprehensive attempt by the Agency to describe the socio-economic conditions of SHC families in the five fields of UNRWA operations. The SHC population discussed here depend to a large extent on assistance from UNRWA’s SHC programme to support their families. The majority of them are in economic distress and live in precarious living conditions, as revealed by the results of the survey. For easy reference and summary on the main findings of the survey, the conclusion (chapter ten) includes a tabular overview of most basic social and economic indicators.

11
The main findings of the SHC survey report can be summarized as follows: Population Structure
1. The results of the survey show that SHC families in the five fields are heterogeneous populations with varied socio-economic conditions. However, the status-based approach adopted by the SHC programme does not take these conditions into consideration when allocating assistance to these families. In some fields, such as in Lebanon and Gaza, SHC families’ living conditions are poor and worse than other fields and maybe worse than the host populations.
2. SHC families have a young population and they have smaller families compared with
the registered refugee populations in general. The median age, the age at which 50 per cent of the population is older and 50 per cent younger than that age, is 22 years for the five fields, which is indicative of a young SHC population. However, in the West Bank field, the median age of 34 years is indicative of an older population among SHC families.
3. The average family size is 4.01 persons, compared with 4.73 persons for registered
refugees, i.e., the Palestine refugees, and 5.76 persons for host populations in the five fields. While the median family size is a three-person family, the highest proportion of SHC families lived in one-person families, accounting for 26.4 per cent of all families with only 4.8 per cent of families composed of ten or more persons. Therefore, SHC families are small by national and international standards. The small family size is directly related to the fact that 40 per cent of SHC beneficiaries fall under the aged category.
4. Overall, females account for about 59 per cent of the total SHC population. When
the data is aggregated for heads of SHC families, the ratio of female-headed families (43.6 per cent) is lower than the ratio for male-headed families (56.4 per cent). However, the percentage of female-headed families among SHC families is almost four times higher than the percentage of female-headed families among the overall registered refugee population (13.72 per cent). Again, the high percentage of female-headed families is directly related to the targeting criteria of the SHC programme. Although, no conclusion can be drawn regarding the feminization of hardship, or for that matter poverty, the high ratio of female heads of families among SHC population and the close relation between income and gender and labour market outcomes may lead to the conclusion that SHC families who are headed by females are more vulnerable than male-headed families.
Housing and Infrastructure
5. SHC families occupy a limited space, with an average dwelling size of 75 square meters (sqm) and an average per person built area of 18.5 sqm. The size of the dwelling differs by place of residence, i.e., camp and non-camp, whereby the size of the dwelling inside camps is smaller than outside camps (67 sqm compared with 82 sqm for non-camp dwellings), which indicates that SHC families living in the camps suffer more from overcrowded conditions. The majority of the dwellings have three rooms or less, with an average of 1.5 persons per room and 2.2 persons per sleeping
12
room (2.4 persons per sleeping room in Lebanon). In general, these statistics do not indicate serious overcrowding conditions in any of the fields, however, we have to bear in mind that some SHC families live in shared dwellings, and all household members, including extended family members are not included in the current SHC survey. This is mainly due to the specificity of the SHC survey, which enquired about SHC families only and did not include any other members of the household. The other reason for this finding lies in the structure of the SHC population, whereby more than 40 per cent of SHC families fall under the “A” (aged) category and those in general have smaller families (2.27 persons) compared with the “Z” category (7.14 persons). In fact, the number of persons per room and per sleeping room for the “A” category is around one person per room and 1.52 persons, respectively. On the other hand, the number of persons per room and per sleeping room for the “Z” category is 2.5 person per room and 3.33 persons per sleeping room, respectively. Also, the average per person built area and yard area of for the “A” category is 30.7 sqm and 12.9 sqm, respectively compared with only 10.6 sqm and 3.9 sqm, respectively for the “Z” category.
6. The majority of SHC dwelling roofs are made of concrete (76.7 per cent), asbestos
(12.63 per cent), iron and/or zinc (8.63 per cent) or other materials (2.05 per cent). Almost 4 in 10 dwellings in Gaza have asbestos roofs and the percentage increases to 50.7 per cent for dwelling located in camps.
7. The limited space and family size may contribute to both overcrowding and lower
economic status. The limited space and the family size are not the only factors that affect the overall living conditions of SHC families. In addition to these factors, the majority of dwellings suffer from an unhealthy indoor environment (such as humidity, poor ventilation, leakage during winter), which further contributes to lower living conditions. Furthermore, 24 per cent of SHC families in all fields have no heating, and 57.6 per cent of all SHC families in Gaza have no heating. These conditions combined indicate clearly that almost one-half of SHC dwellings are sub-standard and inadequate to live in, and that most are certainly in need of restructuring to make them properly serviceable. This picture is worsened by lack of physical infrastructure in some fields, whereby some SHC dwellings, mainly outside camps, are not connected to the sewage network, especially in the West Bank.
8. Most households benefit from access to drinking water that is piped directly into
their dwellings, regardless of place of residence. Yet, camp residences have a better overall access to amenities, which is partly explained by the services provided to the camps by UNRWA and host authorities. Also, almost all SHC families in the five fields have access to electricity, and nearly all households have independent kitchens and toilet facilities within the residence.
9. The majority of SHC families have good access to public community services and
can fulfil most of their daily needs quite close to home, except for public and private hospitals. More than 60 per cent of SHC families have to commute more than five kilometres (km) to reach the nearest hospitals, and some 11.6 per cent do not have the services at all within their communities.

13
Education Outcomes
10. The analyses of educational levels and attainment show that higher levels in educational attainment have an important impact on reducing the probability that a household is in hardship. Indeed SHC individuals with higher education have generally achieved the highest income on average and are not part of the lower income groups. On the other hand, those with less than preparatory education represent the majority (88.3 per cent) of the lower income groups in the five fields. Thus as educational achievement increases, the probability of being in the lower income groups decreases. It is evident from the results that SHC individuals have given priority to completing education up to the level where it is free of charge and provided either by UNRWA at the elementary and preparatory level (secondary level in Lebanon only), or by host authorities at the secondary level. Beyond these levels, the percentage of SHC individuals who go on to complete their education drops dramatically (11.5 per cent), namely for post-secondary education.
11. The results indicate that more than 14.3 per cent of persons aged 6 to 15 years old
drop out of school in all fields; this increases to 37.3 per cent for age groups 16 to 18 years old, i.e., the secondary cycle. In fact, at the age of 17 years, only around two-thirds of students are still enrolled and at the age of 18 years (the last year in the secondary education cycle) the ratio drops down to almost one-half. The highest percentage of drop outs for persons between 6 and 15 years old is recorded for SHC families in Jordan (29.7 per cent) and the lowest is in Gaza (7 per cent). The highest drop out ratio for persons 18 years of age is in Syria, in which more than 80 per cent of SHC individuals leave school before completing their secondary education. The high drop out rates among SHC individuals are mostly related to poverty of the family (20.6 per cent), school failure (15 per cent), marriage (12.7 per cent) social restriction (9.8 per cent) and other factors as well.
12. The illiteracy rates among SHC individuals (15+ years and older) stands at 16.6 per
cent, with the highest ratio recorded for the West Bank (24.7 per cent), and the lowest ratio is in Gaza, which stands at 12.4 per cent. The illiteracy rate among female heads of families (58.4 per cent) is more than twice the illiteracy rates among male heads of families. Moreover, illiteracy is more widespread among the people suffering from disabilities and chronic illnesses. In fact, 35.7 per cent of them are illiterate compared with 7.2 per cent for those not suffering from any kind of disabilities of chronic illnesses.
Health Outcomes
13. As evident from the data, health differences are closely associated with age. It comes as no surprise that bad health is associated with age. As indicated in chapter five, 21.8 per cent of individuals suffer from a chronic health problem and another 11.5 per cent suffer from some kind of disability. The percentages differ quite considerably for those above 50 years old, whereby more than 62 per cent of individuals suffer from a chronic health problem and another 20.3 per cent suffer from various disabilities. Overall, males suffer more than females from disabilities and chronic health problems across all age groups.
14
14. While the health indicator adopted here is a simple assessment based on current suffering or illness, the situation is quite complex. For example, four kinds of chronic illnesses account for more than 72 per cent of all illnesses among SHC individuals, with the highest percentages related to bones and muscles, diabetes, elevated blood pressure and heart and blood vessels.
15. More than 58.3 per cent of SHC families do not have any type of health insurance.
In fact, almost all SHC families (99.2 per cent) in Lebanon do not have health insurance compared with only 15 per cent of SHC families in Gaza who do not have health insurance. The majority of those who are insured have public health insurance (95.7 per cent), while the rest have other types of health insurance. The absence of health insurance in Lebanon is a clear indicator that SHC families suffer the most in this regard compared to SHC families in other fields and endure higher costs for the provision of health services, which necessarily drains the overall meagre resources of families.
Economic Resources
16. The majority of SHC families are in hardship by definition and, in general, have low incomes concentrated in the lower income deciles (when the total SHC population is divided into ten deciles). The results indicate that more than 68 per cent of SHC individuals have annual incomes of less than USD 600 and only 10 per cent have annual incomes of more than USD 1,000, with an average annual per capita income of USD 435. Although, these figures are higher than the World Bank subsistence poverty line of USD 1 per person per day, the averages conceals disparities among fields. For example, in Syria the median per capita daily income is less than USD 1 and the average median income for all fields is slightly higher than USD 1 per person per day.
17. A simple poverty analysis of expenditure levels among SHC individuals according to
the World Bank standards of one and two US dollars a day, reveals that 46.7 per cent of SHC individual have expenditure levels of less than UDS 1 a day and 85.8 per cent have expenditure levels of less than USD 2 a day. The results differ quite considerably among fields, whereby almost all (96.5 per cent) of SHC individuals in Gaza are below the USD 2 a day and around 70 per cent have expenditure levels of less than USD 1 a day. The lowest percentages of poverty levels are recorded for SHC individuals in Lebanon, whereby 15.2 per cent of individuals have expenditure levels of less than USD 1 a day and 72 per cent of individuals have expenditures of less than USD 2 a day. These results point directly to the different standards of living and purchasing power parity prevalent in host societies. Nonetheless, the results point directly to the low income/expenditure levels of SHC families in the five fields.
18. Transfer incomes are the most important source of income for more than 83.8 per
cent of SHC families and almost all families in the bottom income decile (97.8 per cent) depend entirely on transfer incomes. The reliance on transfers diminishes slightly as we move up the income ladder and reaches its lowest point for the ninth decile, but increases again for the top decile. Dependency on transfer incomes
15
among lowest income groups is not a transitory phenomenon, since hardship among them is largely chronic.
Food Assessment
19. The overall consumption of the SHC food items in the five fields is very high, with the exception of flour. Overall, slightly over two-thirds of SHC families consume all quantities of flour, and the rest either consume part and sell part (17.7 per cent) or sell all the quantities they receive (14.9 per cent). The highest ratios for selling all quantities of flour are reported for Jordan (34 per cent) and Syria (31 per cent) and the least is reported for Gaza (0.3 per cent). Therefore, the decision of the Agency to discontinue the distribution of flour in Jordan and Syria is in line with the findings of the SHC survey. However, in the Lebanon field, around two-thirds of families consume all the flour quantities they receive and only about 15 per cent sell all the quantities, which does not concur with or support the decision of the Agency to discontinue the distribution of flour in Lebanon.
20. In terms of other items, the overall consumption levels do not necessitate
replacement of any of the items, since more than 93 per cent of SHC families consume all the quantities they receive and only a small percentage of them sell the quantities.
21. The current distribution mechanism of food rations of part-food and part-cash is the
preferred distribution mechanism by 78 per cent of SHC families and only 18.2 per cent prefer to receive the assistance in the form of all cash, with the rest preferring to receive the assistance in the form of all food. The rationale underpinning the preference for the part-food and part-cash lies mainly in the security that the food part provides the family, the flexibility that the cash component provides the family with to purchase other needed items, and the realization that prices for food items, if they were not procured by the Agency, would be higher in local markets.

16
Chapter 1 Introduction
In this report, the main results of the SHC survey are analysed and presented, including the food assessment survey, along all major socio-economic dimensions. It offers an overview of the living conditions of the SHC population, through interviews with a representative sample of 3603 SHC families from the five fields. These interviews were conducted during the second and third quarters of 2005. To-date, this survey is the first comprehensive attempt made to describe the socio-economic conditions of SHC families in the five fields of UNRWA operations. Accordingly, this study is intended as a baseline study that summaries the situation of SHC families in 2005 and will be used for reforming the SHC programme from the current status-based approach to a needs-based approach. The SHC population discussed here depends to a large extent on assistance from UNRWA’s SHC programme to support their families and they are from amongst the most vulnerable refugee populations. The majority of them are in economic distress and live in precarious living conditions, as revealed by the results of the survey.
Historical Background
In the aftermath of the 1948 Arab-Israeli war, nearly three-quarters of a million Palestinians lost their homes and livelihoods (Schiff, B. 1995, p.3). Most of the refugees took refuge in neighbouring countries and surrounding towns and villages. The immediate humanitarian needs for the refugees were met first by private voluntary organization (PVOs), such as the International Committee of the Red Cross (ICRC), until late 1949 when the PVOs ended their relief operations. In 1949, the United Nations (UN) created the United Nations Relief and Works Agency for Palestine Refugees in the Near East (UNRWA) to take over relief operations of the PVOs.
A basic principle underlying the establishment of UNRWA on December 8, 1949 was to provide humanitarian assistance to Palestine refugees (UNRWA, 2000a). The Agency began its operations in May 1950 in the five fields of operations, namely the West Bank, Gaza, Lebanon, Syria and Jordan. In its early days of operations, the Agency was concerned with “reintegrating” the refugees into regional economies through four types of schemes: first, small-scale training and employment-creating projects, called “work relief”; second, medium-sized, government-controlled undertakings, such as road building and tree planting, called “work projects”; third, subsidization of a small number of refugees willing to “resettle” in Libya and Iraq to set up small businesses or farms; and fourth, large-scale development projects in cooperation with host authorities (Schiff, B. 1995, p.21). In addition, the Agency was also concerned with meeting the refugees more immediate desperate needs of food, shelter, sanitation, health care and education, which then became later the prototype for the UNRWA programmes that succeeded them (Ibid.).
The Agency’s immediate concern of providing welfare services, mostly in the form of rations, absorbed most of the Agency’s resources and included initial plans to provide more “work-oriented” projects and large-scale development projects, with the overall objective of
17
making the refugees self-supporting and removing them from the basic ration rolls in the long-run. However, this latter objective was not realized and the “work projects” and development projects were soon down-sized and some totally abandoned due to many factors, including the political uncertainty in the region and unwillingness of the refugees to reintegrate into local economies, which meant for them resettlement (UNRWA, 1951). The resettlement issue, which has been constantly reiterated ever since, has been at the forefront of all efforts to provide better living conditions for the refugees comparable to that of host populations.
Initially, the Agency provided universal assistance to Registered Refugees (RR), in the form of rations to approximately 876,000 refugees. In 1951, the monthly rations included flour (10 kg), sugar (600 g), rice (500 g), pulses (600 g), margarine (150 g), and vegetable oil (25 g), which provided on average 1600 calories per person per day (Ibid. p. 5) It has been recognised by the Agency that the “quantities of the basic food supplied is inadequate in calorie content if it is to be considered as a complete ration; further, as it consists mainly of flour, it is dietically unbalanced” (UNRWA, 1956). Throughout the following three decades the food basket (rations) remained more or less the same and the number of RR on the rations rolls varied slightly, with 832,000 refugees on the ration rolls in 1980 (UNRWA, 1986, p. 22).
The late 1970s marked the beginning of attempts by UNRWA’s Relief Programme to target relief spending to needy refugees through the introduction of the Special Hardship Case (SHC) programme. In early 1978, the Agency lacked enough flour for full distribution of rations to all recipients and therefore had to reduce the quantities of flour from 10 kg per month per recipients to about 6.7 kg (Schiff, B. 1995, p. 21). The reduction in the quantities had serious implications on the nutritional status of needy families, and therefore, UNRWA took steps towards identifying those families and providing them with additional assistance. Thus the introduction of the SHC programme in 1978. The number of needy families that were eligible under the SHC programme to receive additional assistance in 1978 was 27,196 (133,330 rations) (Ibid.). However, in 1982 the universal distribution of rations to all RR was suspended in all fields, except in Lebanon whereby the distribution of rations was suspended in 1984 (Ibid.). Therefore, the SHC programme remained the only programme providing assistance to needy refugees in the five fields.
Population Trends since 1952
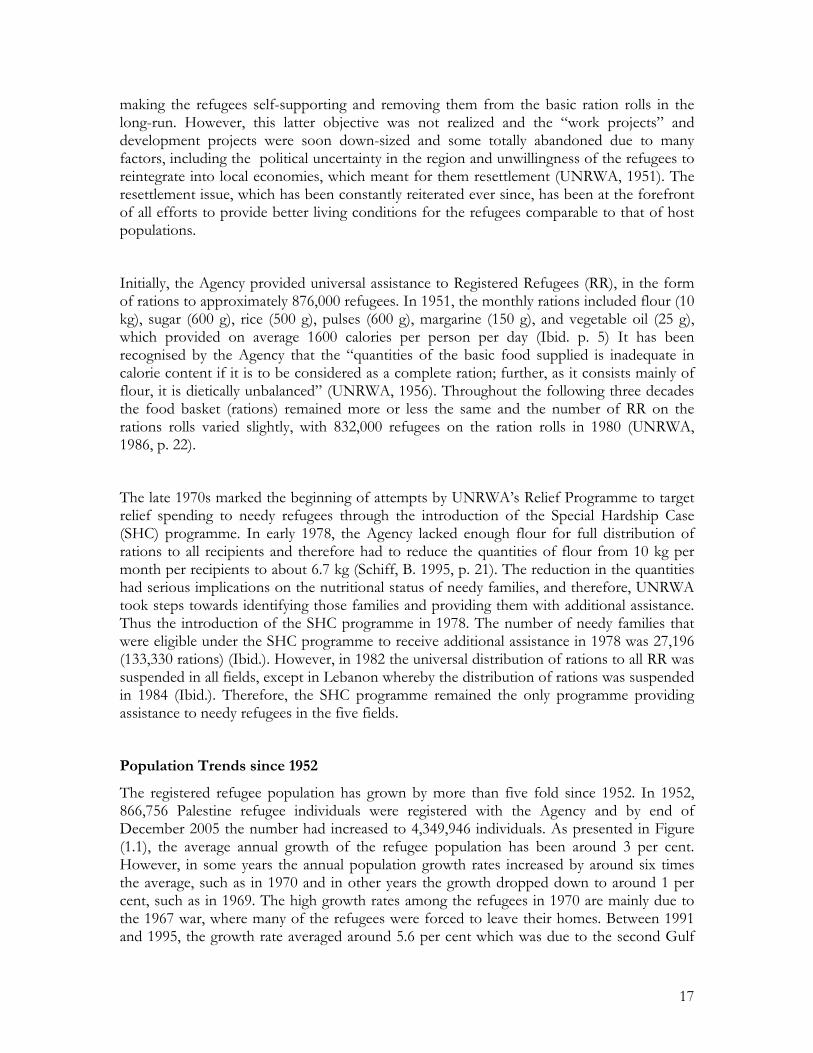
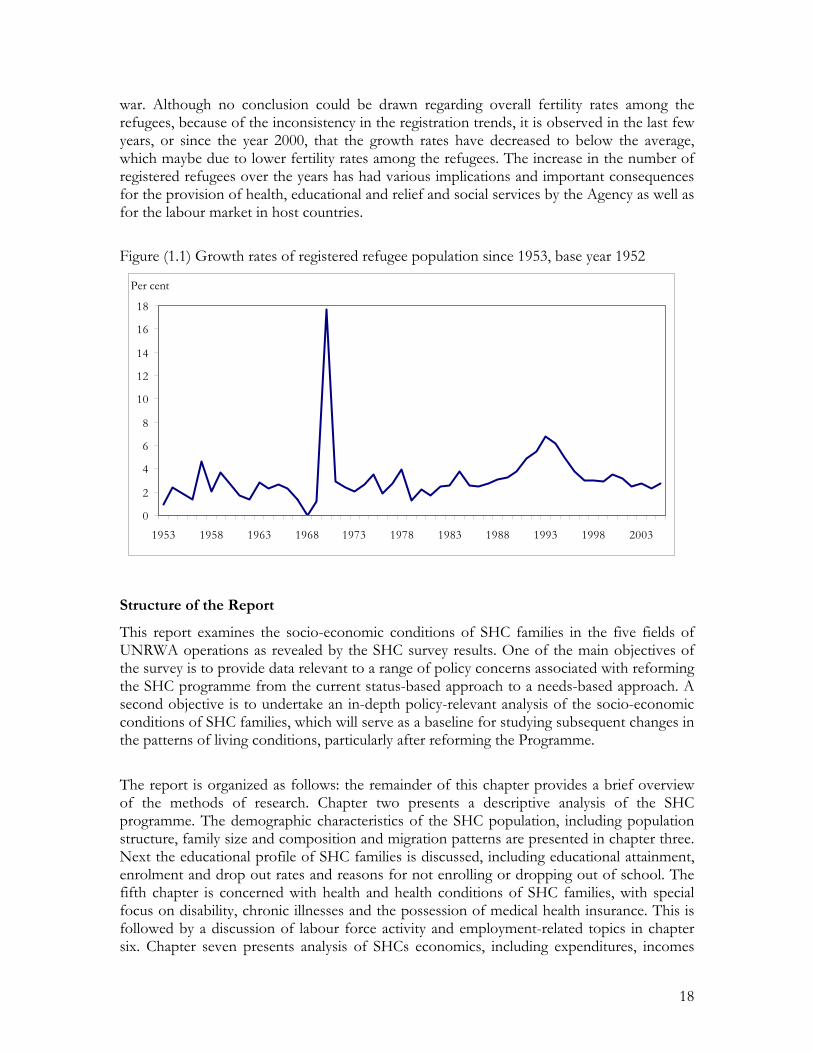
The registered refugee population has grown by more than five fold since 1952. In 1952, 866,756 Palestine refugee individuals were registered with the Agency and by end of December 2005 the number had increased to 4,349,946 individuals. As presented in Figure (1.1), the average annual growth of the refugee population has been around 3 per cent. However, in some years the annual population growth rates increased by around six times the average, such as in 1970 and in other years the growth dropped down to around 1 per cent, such as in 1969. The high growth rates among the refugees in 1970 are mainly due to the 1967 war, where many of the refugees were forced to leave their homes. Between 1991 and 1995, the growth rate averaged around 5.6 per cent which was due to the second Gulf
18
war. Although no conclusion could be drawn regarding overall fertility rates among the refugees, because of the inconsistency in the registration trends, it is observed in the last few years, or since the year 2000, that the growth rates have decreased to below the average, which maybe due to lower fertility rates among the refugees. The increase in the number of registered refugees over the years has had various implications and important consequences for the provision of health, educational and relief and social services by the Agency as well as for the labour market in host countries. Figure (1.1) Growth rates of registered refugee population since 1953, base year 1952
0
2
4
6
8
10
12
14
16
18
1953 1958 1963 1968 1973 1978 1983 1988 1993 1998 2003
Per cent
Structure of the Report
This report examines the socio-economic conditions of SHC families in the five fields of UNRWA operations as revealed by the SHC survey results. One of the main objectives of the survey is to provide data relevant to a range of policy concerns associated with reforming the SHC programme from the current status-based approach to a needs-based approach. A second objective is to undertake an in-depth policy-relevant analysis of the socio-economic conditions of SHC families, which will serve as a baseline for studying subsequent changes in the patterns of living conditions, particularly after reforming the Programme.
The report is organized as follows: the remainder of this chapter provides a brief overview of the methods of research. Chapter two presents a descriptive analysis of the SHC programme. The demographic characteristics of the SHC population, including population structure, family size and composition and migration patterns are presented in chapter three. Next the educational profile of SHC families is discussed, including educational attainment, enrolment and drop out rates and reasons for not enrolling or dropping out of school. The fifth chapter is concerned with health and health conditions of SHC families, with special focus on disability, chronic illnesses and the possession of medical health insurance. This is followed by a discussion of labour force activity and employment-related topics in chapter six. Chapter seven presents analysis of SHCs economics, including expenditures, incomes
19
and the possession of family durables. In chapter eight, a lengthy discussion of housing and housing characteristics is undertaken, including those related to dwellings, amenities, sanitation, overcrowding and space. The next chapter presents the main finding of the food assessment survey and the utilization of the food items distributed to SHC families. In this chapter SHC opinions are probed on a number of issues, including their opinions on the current mechanism of distribution, the content of the food basket and their preferences for changing some or all the food items. Finally, an attempt is made in chapter ten to provide a synthesis of the material presented in this report and to present some key policy implications as well. The objective is not to be exhaustive but rather to point to critical issues that are considered detrimental to SHC families.
Methods of Research
This section provides a brief descriptive account of the methods of research, including the questionnaire, sampling, data cleaning, processing and response rates. In order to arrive at a comprehensive picture of the varied socio-economic conditions of the SHC families in the five fields, the methods consisted primarily of a quantitative component, through a pre-designed questionnaire. The data collected through the SHC survey served two proposes: First, to replace the “old” social study form currently used by social workers with the “new” social study form for the collection of specific information on SHC families, including information on income, expenditure, demographics and socio-economic variables that are essential to determine the standards of living of SHC families and to test for eligibility criteria. The second purpose of the SHC survey was to collect data on the utilization of the food basket distributed to SHC families (rations).
The questionnaire
The questionnaire (social study form) comprises ten sections on housing and environment, household demographics, education, health, economic activities, vocational training, migration, household expenditure, a detailed account of income from all sources and a section designed to assess the utilization and appropriateness of the food baskets. The design attempts to fulfil two basic conditions, namely: (1) that information on individual and family characteristics should be comprehensive and detailed, including these related to resources of the family; and (2) that information on living conditions, including infrastructure should be comprehensive. The Form was designed to allow answers from individual income recipients as well as responses on behalf of the household as a whole (see Annex two).
The sample
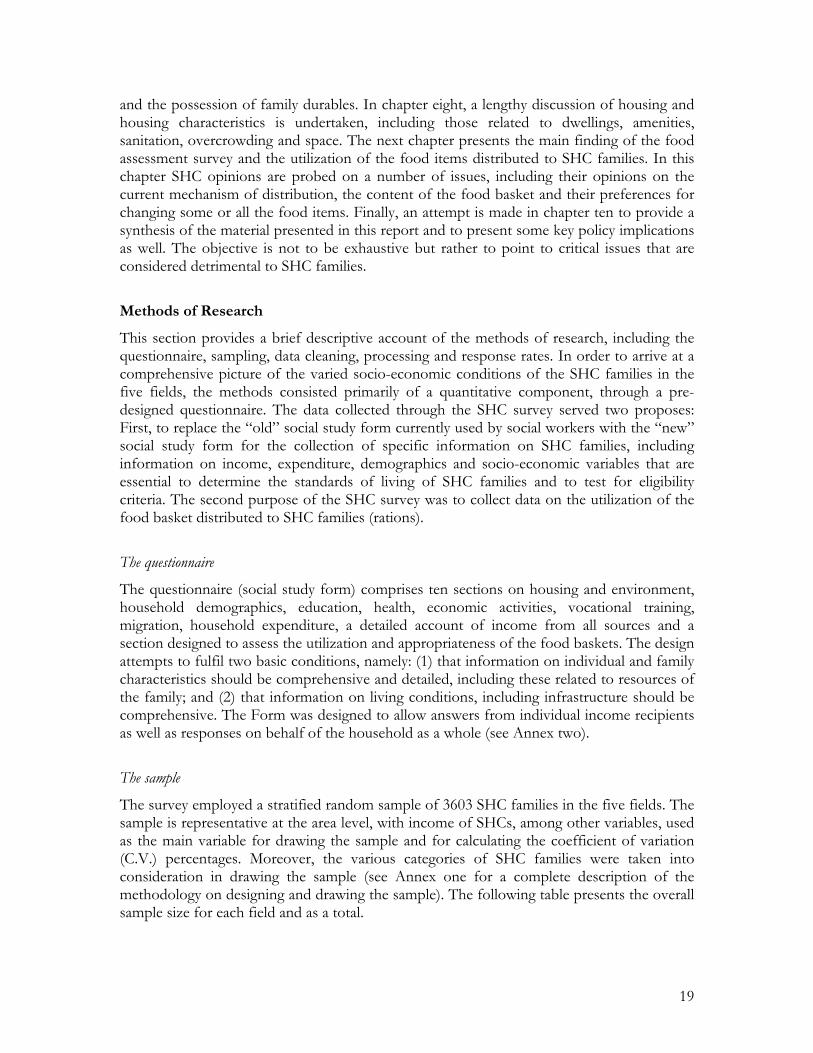
The survey employed a stratified random sample of 3603 SHC families in the five fields. The sample is representative at the area level, with income of SHCs, among other variables, used as the main variable for drawing the sample and for calculating the coefficient of variation (C.V.) percentages. Moreover, the various categories of SHC families were taken into consideration in drawing the sample (see Annex one for a complete description of the methodology on designing and drawing the sample). The following table presents the overall sample size for each field and as a total.
20
Table (1.1) Sample size by field
Sample size Individuals
Sample size FamiliesField
2,565 691 West Bank
5,156 1,125 Gaza
2,552 591 Lebanon
1,555 475 Syria
2,770 720 Jordan
14,598 3,603 Total
Fieldwork
Two phases of fieldwork were planned to carry out the survey. First, a pilot phase was carried out in March 2005. The purpose of the pilot phase was to test the reliability of the questionnaire, in terms of its appropriateness and procedures, and to make preliminary observations regarding the time required to fill-out each questionnaire. A sample of ten SHC families was surveyed during this phase using the original questionnaire. Based on the results of the pilot phase, the main questionnaire was modified accordingly. The second phase comprised the actual fieldwork on the main survey, which was carried out between 25 May and 4 August 2005. In addition to the two phases mentioned above, entering, cleaning, testing, and analysis of the data followed, between 15 July and 20 October 2005.
Data cleaning, processing and response rates
After cleaning the data, 234 individuals were removed from the overall analysis. The reason for the removal of these individuals was associated with the individual status of persons, in which 153 individuals were imprisoned1 and 81 individuals died, and thus were excluded from the analysis. The final data set for all fields included 14,362 individuals. The small number of individuals removed from the original data set does not significantly alter the overall analysis. The following table provides a breakdown of those removed from the analysis by field and as a total. Moreover, the response rate for the survey was 100 per cent and this rate reflects the great effort made by all social workers to produce a high quality data set. 1 The reason for the removal of imprisoned persons from the analysis rests on the fact that imprisoned persons are not living with the family and do not receive assistance from the SHC programme, only their families do. The inclusion of them in the analysis will distort the overall living standards and socio-economic conditions of families, particularly for the assessment and calculation of poverty lines and poverty indicators.

21
Table (1.2) Net sample size by field and as a total
Field Original sample
Imprisoned Died Final sample
West Bank 2,565 36 23 2,506 Gaza 5,156 30 11 5,115 Lebanon 2,552 37 6 2,509 Syria 1,555 26 25 1,504 Jordan 2,770 24 16 2,730 Total 14,598 153 81 14,364
22
Chapter 2 The Special Hardship Case Programme
Background
The SHC programme was introduced in 1978 to provide a cushion of support to the neediest families among the refugee population in the five fields of UNRWA operations. To qualify for aid, refugee families have to meet a number of established criteria, as stipulated in the Relief Services Instructions (RSI). They must be in economic distress with no healthy male adult between the ages of nineteen and sixty, and the total family income can not exceed two-thirds of a grade one step one of local UNRWA salary, i.e., lowest paid UNRWA area staff member with the same number of dependents, they also need to fit within one of the eight categories of eligibility criteria. The majority of SHC families assisted fall within three categories: the elderly (A category), female-headed households (W category) and those unable to work due to chronic illness or disability (M category). The Agency also extends SHC assistance to low-income families headed by, or including, a male adult who is following a full-time course of post-secondary study (E), orphans (O), families of those who are imprisoned (I) and families of those serving compulsory military service (C). Those who do not fall under any of the previously mentioned categories, but are still in need are eligible under the “Z” category, as stipulated in the RSI.
In its overall structure, the SHC programme resembles an entitlement programme that provides one-size-fits-all benefits to SHC families within pre-defined eligibility categories. However, because budget allocations in practice do not cover all eligible individuals, the programme functions like a budget-capped, discretionary assistance programme in which social workers assess eligibility, through home visitation and verification, about applicant’s eligibility. However, it should be noted that eligibility criteria largely excludes the working poor.
The SHC Programme provides assistance to SHC families through a combination of food commodities and cash subsidies on a quarterly basis. In kind food support (rations) and cash subsidies (for local food purchases) are issued to all persons registered as Special Hardship Cases, with the exception of those family members who are living away from the family home and infants within the home who are less than one year old, according to criteria and procedures outlined in the RSI. The combined value of food rations and cash subsidies distributed in each field, per person/ per annum has been on average USD 110.
Population Trends of SHC Families since 1983
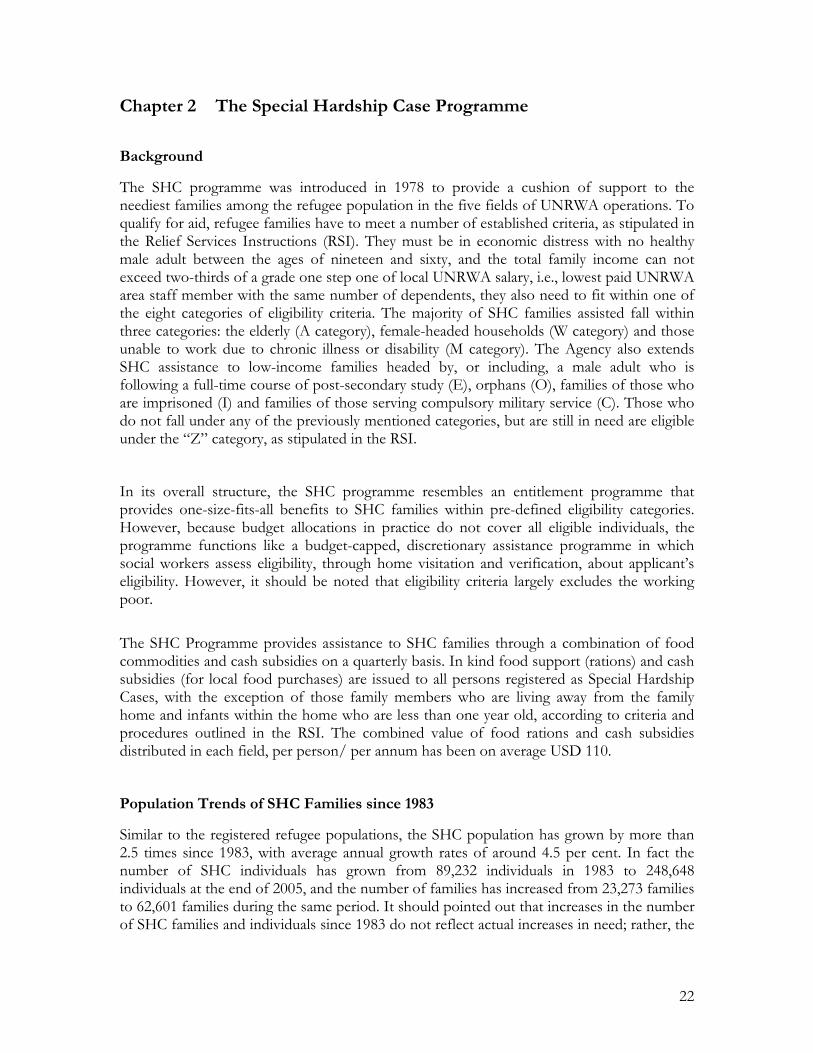
Similar to the registered refugee populations, the SHC population has grown by more than 2.5 times since 1983, with average annual growth rates of around 4.5 per cent. In fact the number of SHC individuals has grown from 89,232 individuals in 1983 to 248,648 individuals at the end of 2005, and the number of families has increased from 23,273 families to 62,601 families during the same period. It should pointed out that increases in the number of SHC families and individuals since 1983 do not reflect actual increases in need; rather, the
23
needs far outpace available resources and that the rate of increase reflect the resources being made available to the SHC programme. Figure (2.1) SHC population since 1983 (number of individuals)
0
50,000
100,000
150,000
200,000
250,00019
83
1985
1987
1989
1991
1993
1995
1997
1999
2001
2003
2005
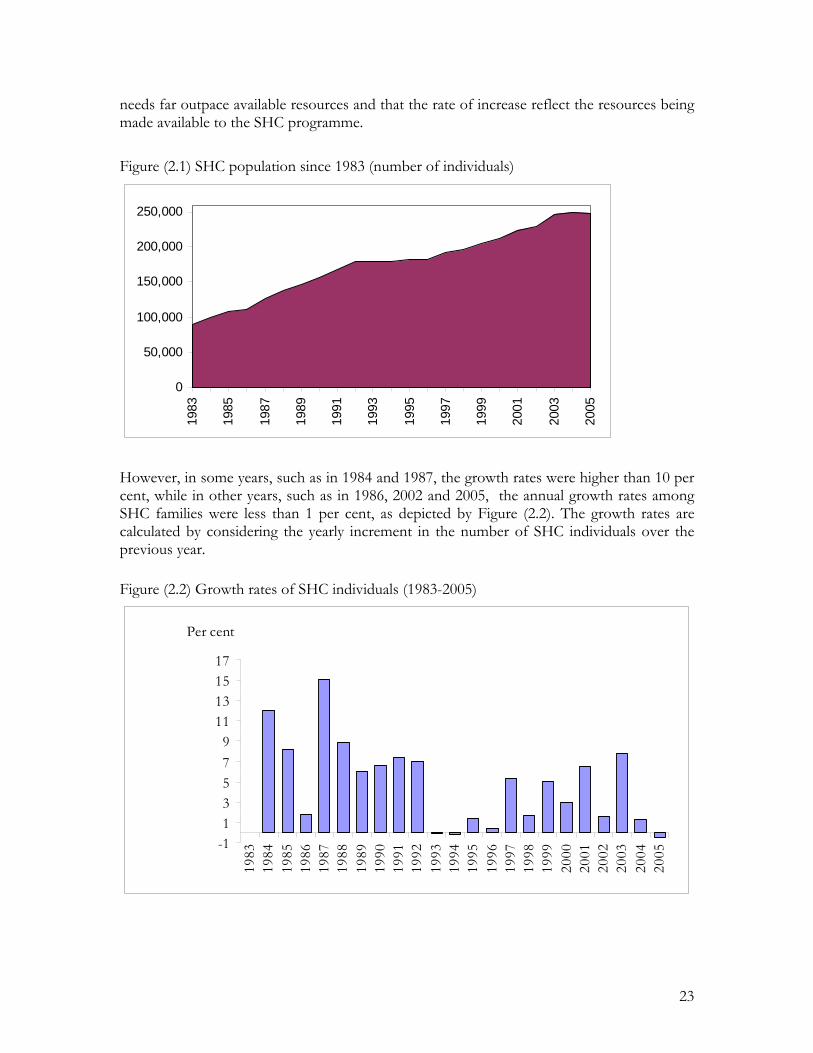
However, in some years, such as in 1984 and 1987, the growth rates were higher than 10 per cent, while in other years, such as in 1986, 2002 and 2005, the annual growth rates among SHC families were less than 1 per cent, as depicted by Figure (2.2). The growth rates are calculated by considering the yearly increment in the number of SHC individuals over the previous year. Figure (2.2) Growth rates of SHC individuals (1983-2005)
-113579
11131517
1983
1984
1985
1986
1987
1988
1989
1990
1991
1992
1993
1994
1995
1996
1997
1998
1999
2000
2001
2002
2003
2004
2005
Per cent
24
A simple rank correlation between the total number of registered refugee population and that of SHC individuals, between 1983 and 2005, reveal that the rank correlation coefficient is positive, high, and statistically significant (R=0.998), which means that, on average, the growth in the number of SHC individuals has kept pace with the overall population growth among the registered refugee. Composition of the Food Basket
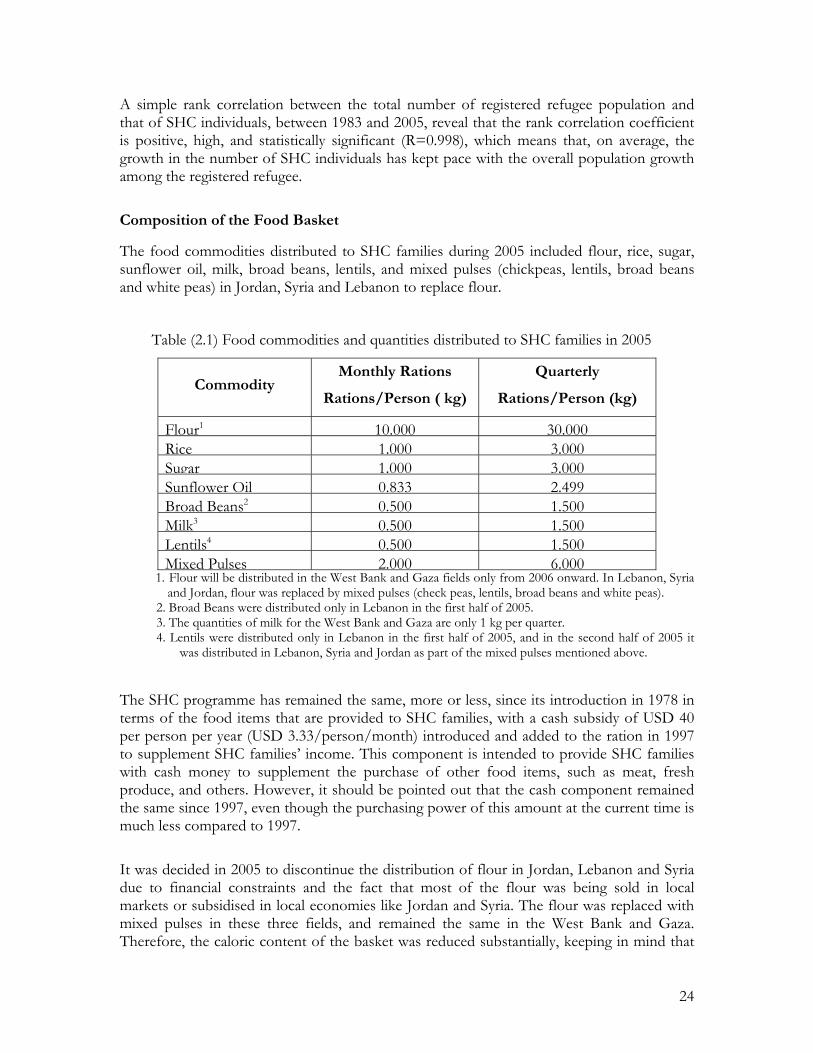
The food commodities distributed to SHC families during 2005 included flour, rice, sugar, sunflower oil, milk, broad beans, lentils, and mixed pulses (chickpeas, lentils, broad beans and white peas) in Jordan, Syria and Lebanon to replace flour.
Table (2.1) Food commodities and quantities distributed to SHC families in 2005
Commodity Monthly Rations
Rations/Person ( kg)
Quarterly
Rations/Person (kg)
Flour1 10.000 30.000 Rice 1.000 3.000 Sugar 1.000 3.000 Sunflower Oil 0.833 2.499 Broad Beans2 0.500 1.500 Milk3 0.500 1.500 Lentils4 0.500 1.500 Mixed Pulses 2.000 6.000
1. Flour will be distributed in the West Bank and Gaza fields only from 2006 onward. In Lebanon, Syria and Jordan, flour was replaced by mixed pulses (check peas, lentils, broad beans and white peas).
2. Broad Beans were distributed only in Lebanon in the first half of 2005. 3. The quantities of milk for the West Bank and Gaza are only 1 kg per quarter. 4. Lentils were distributed only in Lebanon in the first half of 2005, and in the second half of 2005 it
was distributed in Lebanon, Syria and Jordan as part of the mixed pulses mentioned above.
The SHC programme has remained the same, more or less, since its introduction in 1978 in terms of the food items that are provided to SHC families, with a cash subsidy of USD 40 per person per year (USD 3.33/person/month) introduced and added to the ration in 1997 to supplement SHC families’ income. This component is intended to provide SHC families with cash money to supplement the purchase of other food items, such as meat, fresh produce, and others. However, it should be pointed out that the cash component remained the same since 1997, even though the purchasing power of this amount at the current time is much less compared to 1997. It was decided in 2005 to discontinue the distribution of flour in Jordan, Lebanon and Syria due to financial constraints and the fact that most of the flour was being sold in local markets or subsidised in local economies like Jordan and Syria. The flour was replaced with mixed pulses in these three fields, and remained the same in the West Bank and Gaza. Therefore, the caloric content of the basket was reduced substantially, keeping in mind that

25
the flour contained most of the caloric content of the food basket. In fact, an initial calculation of calories of the food basket distributed in three fields, Jordan, Lebanon and Syria, estimated the calories at approximately 900 calories per person daily. The SHC programme provides assistance to approximately 62,601 families or 248,648 individuals as of the end of December 2005. It should be noted that the number of individuals receiving rations (230,314) differs from the total number of individuals mentioned above, because not all family members receive rations, such as infants below one year of age, prisoners, those not living with the family, and others. The SHC population represents approximately 5.7 per cent of the total refugee population (individuals) in the five fields, with the smallest representation in Jordan, where only 2.6 per cent of RR is receiving SHC assistance; the largest is in Lebanon (11.4 per cent). Table (2.2) provides a breakdown of RR and SHC persons and rations per field as of end of December 2005. Table (2.2) Number of Registered Refugees, SHC persons and rations as end of Dec. 2005
Field No. of RR (Persons)
SHC Persons
% of SHC Person to
RR Rations
% of SHC Rations to
RR
West Bank 699,817 40,270 5.75% 34,566 4.94% Gaza 986,034 84,379 8.56% 83,001 8.42% Lebanon 404,170 45,965 11.37% 42,339 10.48% Syria 432,048 30,796 7.13% 26,727 6.19% Jordan 1,827,877 47,238 2.58% 43,681 2.39% Total 4,349,946 248,648 5.72% 230,314 5.29%
It can be deduced from the above table that the Gaza field has the largest share of SHC families among the five fields, although it is not the largest in terms of the total number of registered refugees. On the other hand, the Jordan field, which hosts the majority of the registered refugees (42 per cent), has only 19 per cent of SHC families. The fact that refugees in Gaza endure harsh living conditions, are subject to sever restrictions and closures, and staggering poverty and unemployment rates makes Gaza refugees more vulnerable and in need of assistance. The same scenario also exits in Lebanon where Palestine refugees have been banned from working in more than 70 occupations until recently and face harsh living conditions. However, refugees in Jordan and Syria enjoy relatively better living conditions; enjoy basic civic rights as the host population, with the majority of Palestine refugees granted citizenships in Jordan.
Special Hardship Case Population
The results of the SHC survey indicate that most SHC families live outside camps; more specifically, 53.4 per cent of all SHC families live outside camps. This implies that the camps, as a concentration for Palestine refugees, are not the major focus of the SHC programme.

26
Rather, the eligibility criteria of the SHC programme, which focus on special categories or groups among the refugee population is the determining factor, regardless of place of residence. However, in Lebanon 62.2 per cent of SHC families live inside camps and only 36 per cent in Syria. Table (2.3) presents the distribution of SHC families by place of residence, inside and outside camps.
Table (2.3) Place of residence of SHC families, inside and outside camps
Field SHC Inside
Camp RR Inside
camps SHC Outside
Camp RR Outside
Camp
West Bank 42.2 26.35 57.8 73.65
Gaza 51.5 48.62 48.5 51.38
Lebanon 62.2 52.79 37.8 47.21
Syria 36.0 26.73 64.0 73.27
Jordan 37.1 15.65 62.9 84.35
Total 46.6 29.40 53.4 70.60
In terms of distribution of SHC population by category, as indicated in Table (2.4), the majority of SHC families fall under the aged (A) category, which represent 40.3 per cent of all SHC beneficiaries in the five fields, with the highest is in the West Bank (50.1 per cent) and the lowest is in Gaza (33.6 per cent). The “A” category is followed by the medical category “M” (22.3 per cent), with the highest percentage is in Gaza (31.4 per cent) and the lowest is in Lebanon (13 per cent). The widowed category “W” comes third in order and represents 19.3 per cent of all SHC families in the five fields, with the highest is in Jordan (26.7 per cent). However, it should be pointed out the “Z” category is highest in Lebanon (30.7 per cent) and lowest in Jordan (5.8 per cent).
Table (2.4) Distribution of SHC families by categories and by field Field A C E I M O W Z Total
West Bank 50.1 - 2.0 3.0 18.2 1.6 19.0 6.1 100 Gaza 33.6 - 7.1 1.0 31.4 1.6 16.9 8.4 100
Lebanon 41.0 - 1.7 0.5 13.0 0.9 12.2 30.7 100
Syria 43.0 4.4 0.9 1.1 18.2 1.6 22.7 8.2 100
Jordan 38.8 - 2.0 1.0 23.7 2.0 26.7 5.8 100
Total 40.3 0.7 3.3 1.3 22.3 1.5 19.3 11.4 100
Regarding the number of persons (i.e., family members), the “M” category accounts for the largest share (34.4 per cent) of SHC individuals followed by the “A” category (23.4 per cent) and “Z” category (20.2 per cent) and the least are from the “O” category (0.9 per cent). The

27
difference in the number of individuals between the “M” and the “A” categories lies in the fact that the latter has less family members (usually comprised of one or two persons) while the former has more than two members. Another revealing comparison between the “Z” category as a per cent of total SHC families and the number of individuals is another point in case, where the SHC families have more individuals than other categories.
28
Chapter 3 Population
This chapter examines basic aspects of the demographic situation of the SHC population in the five fields, as revealed by the SHC survey. Population patterns, such as family composition, age and sex structure and migration, are important indicators which, when combined with other social and economic indicators, contribute to a more nuanced picture of the relative standard of living of SHC families. For instance, the increase in the population has important consequences for the provision of social and economic services, such as education and health, and for the labour market.
Family Size
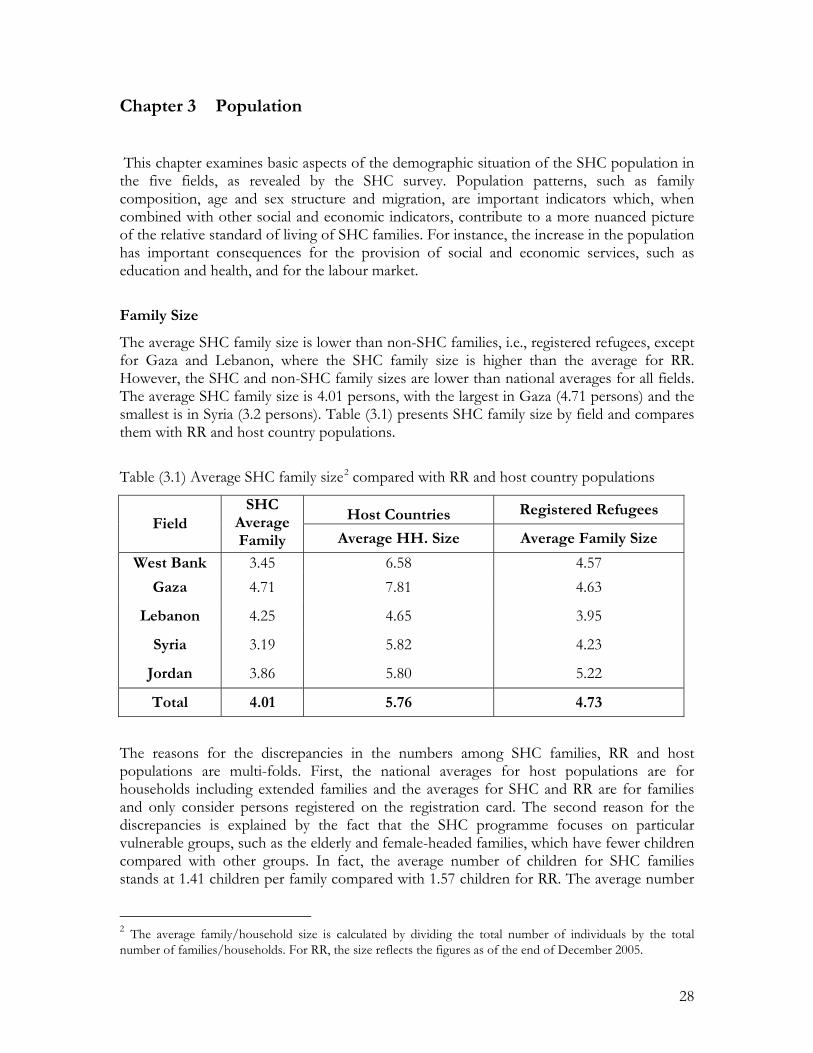
The average SHC family size is lower than non-SHC families, i.e., registered refugees, except for Gaza and Lebanon, where the SHC family size is higher than the average for RR. However, the SHC and non-SHC family sizes are lower than national averages for all fields. The average SHC family size is 4.01 persons, with the largest in Gaza (4.71 persons) and the smallest is in Syria (3.2 persons). Table (3.1) presents SHC family size by field and compares them with RR and host country populations.
Table (3.1) Average SHC family size2 compared with RR and host country populations
Host Countries Registered Refugees Field
SHC Average Family Average HH. Size Average Family Size
West Bank 3.45 6.58 4.57 Gaza 4.71 7.81 4.63
Lebanon 4.25 4.65 3.95
Syria 3.19 5.82 4.23
Jordan 3.86 5.80 5.22
Total 4.01 5.76 4.73
The reasons for the discrepancies in the numbers among SHC families, RR and host populations are multi-folds. First, the national averages for host populations are for households including extended families and the averages for SHC and RR are for families and only consider persons registered on the registration card. The second reason for the discrepancies is explained by the fact that the SHC programme focuses on particular vulnerable groups, such as the elderly and female-headed families, which have fewer children compared with other groups. In fact, the average number of children for SHC families stands at 1.41 children per family compared with 1.57 children for RR. The average number
2 The average family/household size is calculated by dividing the total number of individuals by the total number of families/households. For RR, the size reflects the figures as of the end of December 2005.

29
of children is well below the national average. For example, in Jordan the average number of children for females between 15 and 49 years is only 2.2 children per women.
Figure (3.1) presents family distribution in terms of family size. While the median family size is a three-person family, the highest proportion of SHC families lives in one-person families, accounting for 26.4 percent of all families. On the other hand, only 4.78 per cent of families have 10 persons or more. Thus, SHC families are relatively small by national and international standards.
Figure (3.1) Distribution of population by family size
0
5
10
15
20
25
30
1 3 5 7 9 11 13 15 17 19
Family Size
Per cent
When the family size is broken down by category, the “Z” category accounts for the largest family size (7.14 persons) followed by the education or “E” category (7 persons); the smallest is among the Orphans and Aged categories, 2.25 persons, as presented in Table (3.2).
Table (3.2) Family size by category Category Family Size
Aged A 2.25 Dependents of those who are serving compulsory military service C
5.50
Education E 7.00 Dependents of those who are imprisoned I
4.49
Medical M 6.25 Orphans O 2.25 Widowed W 2.73 Special Category Z 7.14 Total 4.01
30
Age-Sex Structure
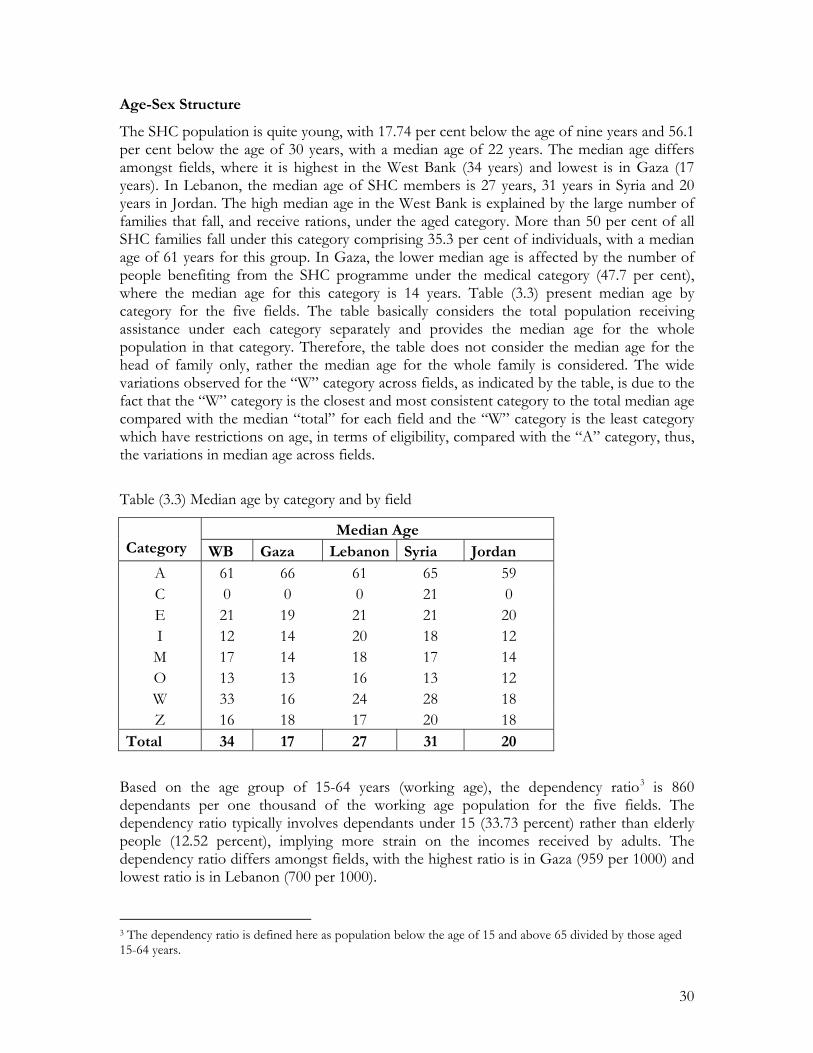
The SHC population is quite young, with 17.74 per cent below the age of nine years and 56.1 per cent below the age of 30 years, with a median age of 22 years. The median age differs amongst fields, where it is highest in the West Bank (34 years) and lowest is in Gaza (17 years). In Lebanon, the median age of SHC members is 27 years, 31 years in Syria and 20 years in Jordan. The high median age in the West Bank is explained by the large number of families that fall, and receive rations, under the aged category. More than 50 per cent of all SHC families fall under this category comprising 35.3 per cent of individuals, with a median age of 61 years for this group. In Gaza, the lower median age is affected by the number of people benefiting from the SHC programme under the medical category (47.7 per cent), where the median age for this category is 14 years. Table (3.3) present median age by category for the five fields. The table basically considers the total population receiving assistance under each category separately and provides the median age for the whole population in that category. Therefore, the table does not consider the median age for the head of family only, rather the median age for the whole family is considered. The wide variations observed for the “W” category across fields, as indicated by the table, is due to the fact that the “W” category is the closest and most consistent category to the total median age compared with the median “total” for each field and the “W” category is the least category which have restrictions on age, in terms of eligibility, compared with the “A” category, thus, the variations in median age across fields.
Table (3.3) Median age by category and by field
Median Age Category WB Gaza Lebanon Syria Jordan
A 61 66 61 65 59 C 0 0 0 21 0 E 21 19 21 21 20 I 12 14 20 18 12 M 17 14 18 17 14 O 13 13 16 13 12 W 33 16 24 28 18 Z 16 18 17 20 18
Total 34 17 27 31 20
Based on the age group of 15-64 years (working age), the dependency ratio3 is 860 dependants per one thousand of the working age population for the five fields. The dependency ratio typically involves dependants under 15 (33.73 percent) rather than elderly people (12.52 percent), implying more strain on the incomes received by adults. The dependency ratio differs amongst fields, with the highest ratio is in Gaza (959 per 1000) and lowest ratio is in Lebanon (700 per 1000). 3 The dependency ratio is defined here as population below the age of 15 and above 65 divided by those aged 15-64 years.

31
For all SHC age groups, the male population (41.4 per cent) is less than the female population (58.6 per cent), with variations across age groups. The sex ratio is 71 males per 100 females, with the highest ratio is in Gaza (87 males per 100 females) and lowest is in the West Bank (54 males per 100 females). The ratio drops significantly for the age group 25-34 years in the five fields. Although no significant international migration patterns could be inferred from the data, the decline in the ratio maybe attributed to male migration away in that age group. The gender composition of SHC individuals differ from that for registered refugees, whereby the male population among registered refugees (51 per cent) is slightly higher than the female population (49 per cent).
Another revealing indicator on SHC families is their marital status. 44.1 per cent of SHC individuals in the ‘marriage-age’ (15+ years old) are married compared with 39.4 per cent who are single; 12.5 per cent are widowed, 3.5 per cent are divorced, and the rest are equally divided between separated and abandoned. What is important to note is that 37 per cent of females and 13 per cent of males in the age group 25-29 years are not married and the percentage decreases to 22 per cent for females and 4.6 per cent for males for the next age group 30-34 years. It would have been useful if time-series data were available for age-sex groups to examine how the marriage pattern has changed over the years. Marital status is generally affected by various factors including educational achievement, participation in the labour force, and household financial status.
Figure (3.2) Distribution of SHC population by age and sex
0%
20%
40%
60%
80%
100%
0 - 4 5 - 9 10 -14
15 -19
20 -24
25 -29
30 -34
35 -39
40 -44
45 -49
50 -54
55 -59
60 -64
65 -69
70 -74
75 -79
80 +
Age (years)
Male Female
Migration
The section on migration in the questionnaire provides a detailed data on the migration history of SHC families in the five fields. Of particular importance here is the number of moves that SHC families have to endure in their lifetime and the reasons for the relocation. Indeed over one-third of all SHC individuals have moved at one point in their life-time as revealed by the data while the rest were born in their current places of residence. In fact,
32
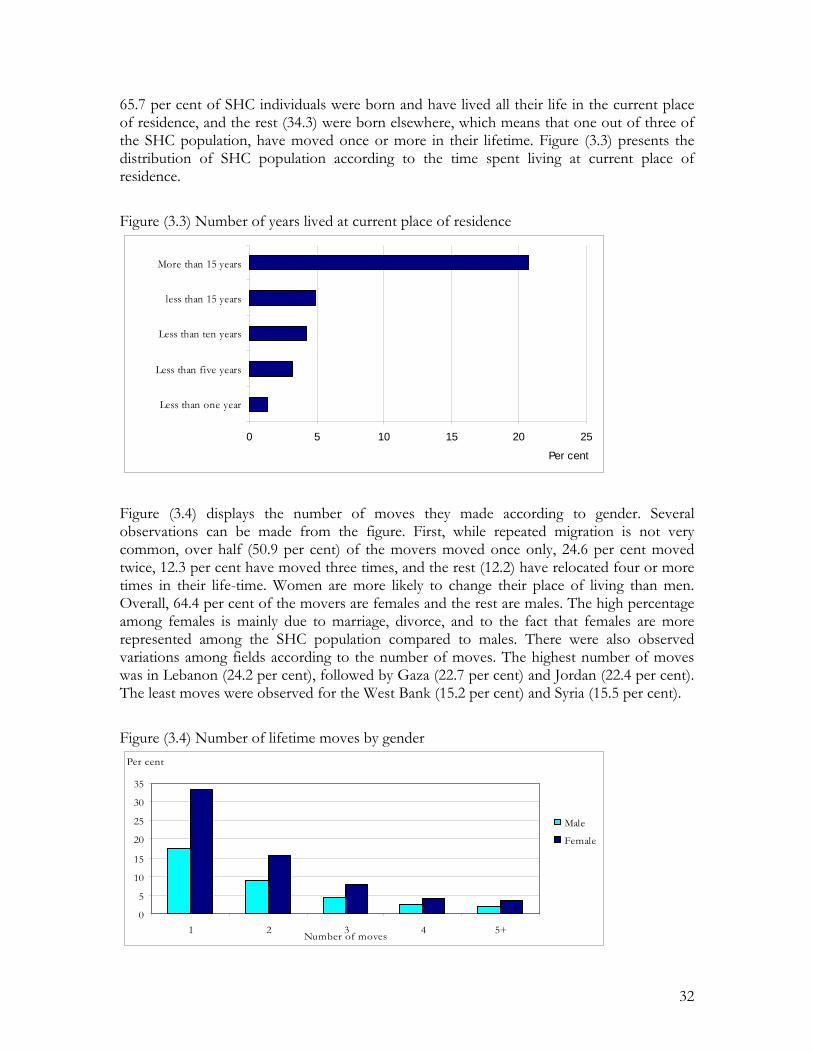
65.7 per cent of SHC individuals were born and have lived all their life in the current place of residence, and the rest (34.3) were born elsewhere, which means that one out of three of the SHC population, have moved once or more in their lifetime. Figure (3.3) presents the distribution of SHC population according to the time spent living at current place of residence.
Figure (3.3) Number of years lived at current place of residence
0 5 10 15 20 25
Less than one year
Less than five years
Less than ten years
less than 15 years
More than 15 years
Per cent
Figure (3.4) displays the number of moves they made according to gender. Several observations can be made from the figure. First, while repeated migration is not very common, over half (50.9 per cent) of the movers moved once only, 24.6 per cent moved twice, 12.3 per cent have moved three times, and the rest (12.2) have relocated four or more times in their life-time. Women are more likely to change their place of living than men. Overall, 64.4 per cent of the movers are females and the rest are males. The high percentage among females is mainly due to marriage, divorce, and to the fact that females are more represented among the SHC population compared to males. There were also observed variations among fields according to the number of moves. The highest number of moves was in Lebanon (24.2 per cent), followed by Gaza (22.7 per cent) and Jordan (22.4 per cent). The least moves were observed for the West Bank (15.2 per cent) and Syria (15.5 per cent).
Figure (3.4) Number of lifetime moves by gender
0
5
10
15
20
25
30
35
1 2 3 4 5+Number of moves
Per cent
Male
Female

33
Table (3.4) displays the main reasons from moving among SHC population. The majority of moves were related to the occupation (26.8 per cent), marriage (22.8 per cent) and war/safety (22.6 per cent). Of particular importance to note in the table is the high percentage of movers in Gaza and Syria that is related to the occupation (46.1 per cent and 36.2 per cent, respectively). Also, in Lebanon, the West Bank and Jordan, the majority of moves were related to “war/safety” (38.3 per cent, 34.9 per cent, and 31.4 per cent, respectively) as indicated by respondents. When the age of movers are aggregated for all individuals above sixty years of age or more, over 83 per cent of the moves were related to the occupation and war/safety.
Table (3.4) Main reasons for moving by field Reasons for moving West Bank Gaza Lebanon Syria Jordan Total Work or work related 8.5 4.4 12.5 7.0 9.0 8.4 Overcrowding 1.9 9.3 0.5 2.7 4.8 4.0 Housing facilities 5.6 9.7 5.4 11.8 9.8 8.4 Marriage 32.7 19.5 14.2 26.4 26.1 22.8 War/safety 34.9 6.6 38.3 10.1 31.4 24.7 The neighbourhood 0.9 0.7 1.0 0.9 0.2 0.7 Schools 0.1 0.8 0.7 0.3 0.3 0.5 Occupation 13.1 46.1 22.9 36.2 14.5 26.8 Other 2.4 2.9 4.5 4.6 4.0 3.7 Total 100 100 100 100 100 100
34
Chapter 4 Education
Since its establishment, UNRWA has under-taken a series of reforms of its educational system, and the educational services have expanded rapidly ever since due to high population growth. A high educational level among the refugees population is viewed by the Agency and the refugee communities as a major investment that promotes economic and social development. At present, the Agency, through the Department of Education, serves 488,795 pupils in 652 schools in the five fields, which makes it the single largest education service in the UN system. The refugees are served through four sub-programmes: General Education, providing elementary and primary education (secondary in Lebanon where Palestinian children are prohibited from attending state schools); Vocational and Technical Training, offering 5,223 training places in eight training centres in the five fields of operation; Educational Science Faculty, a four-year (university-equivalent) pre-service course for 1050 (in the Training Centres of Amman and West Bank only) and 100 places for a similar two-year course offered in the Siblin Training Centre in Lebanon. In addition to the educational services provides by the Agency, the refugees benefit from the educational services provided by host authorities.
The purpose of this section is to delineate the educational achievement of the SHC population in the five fields. The section focuses mainly on various educational variables such as educational attainment, enrolment and drop out rates, illiteracy rates, and the primary reasons given for leaving or dropping out of school.
Educational Attainment
The majority of SHC population (six years of age and older) in the five fields are either currently enrolled (32.1 per cent) or previously enrolled (42.1 per cent) at an educational institution, and 14.2 per cent of individuals have never attended school at all. Almost one-half (47.5 per cent) of the currently enrolled are found in Gaza, 13.5 per cent in the West Bank, 15.2 per cent are in Lebanon, 15.9 per cent are in Jordan and 7.9 are in Syria. On the other hand, the percentage for persons who never attended school in Gaza is 25.9 per cent, followed by the West Bank (23.3 per cent), and the smallest percentage is found in Syria (16.2 per cent).
The overall educational achievement of SHC population in the five fields is mainly determined by the educational stage that an individual has completed. While 88.3 per cent of SHC individuals have preparatory education or less, only 9.2 per cent have completed their secondary education and a mere 2.3 per cent have completed their education beyond the secondary stage. Figure (4.1) provides data on the level of education completed among the SHC population, in terms of the highest level attained. What is noteworthy in the figure is that 16.6 per cent of the SHC population are illiterate, 31.5 per cent can read and write, 22.3 per cent have completed their elementary education, 17.9 per cent have completed their preparatory education, 0.2 per cent have completed their vocational education, 9.2 per cent

35
have completed their secondary education, and the rest either have completed post-secondary education. The percentage for those illiterate varies among fields where it is lowest in Gaza (12.4 per cent) and highest in the West Bank (24.7 per cent).
Figure (4.1) Highest level of education completed
0
5
10
15
20
25
30
35
Illiter
ate
Read an
d write
Elemen
tary
Prepara
tory
Vocation
al Edu
cation
Secondar
y
Inter
mediate
Diploma
B.A.,B
.Sc.
Higher
diploma
M.A.
Per cent
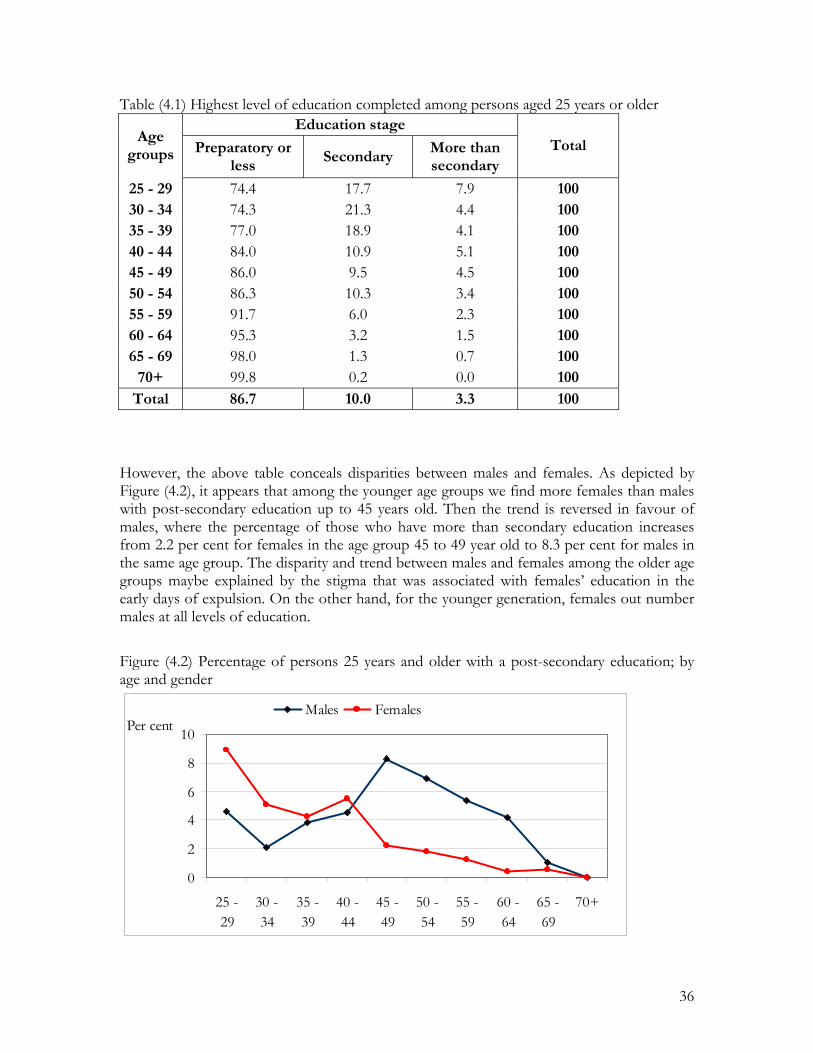
It can be deduced from the above analysis that many SHC individuals have given priority to completing education up to the level where it is free-of-charge and provided either by UNRWA at the elementary and preparatory levels, or by host authorities at the secondary level. Beyond these levels, the percentage of SHC individuals that go on to complete their education drops dramatically, especially for post-secondary education. The trend in educational attainment is evident from Table (4.1), which compares the education level of SHC population aged 25 years or older. While around 1 in 10 people have completed their preparatory education or less among persons aged 55 to 59 years, roughly 1 in 7 have completed the same educational level among persons aged 25 to 29 and 30 to 34 years. The table indicates a steady trend of progress in which roughly 17 per cent and 8 per cent of the young (15-29 years old) have completed their secondary and post-secondary education, respectively.
On the other hand, it is clear from the table that the emphasis among the older age groups was on obtaining preparatory education or less, whereby the percentage of those who obtained preparatory education or less is about 100 per cent among persons aged 60 years or older. What is interesting to note is that the survey data did not record a single SHC person in the oldest age group (60+ years) who has completed any education beyond secondary level and a mere 0.2 per cent in the same age group who have completed their secondary education.
36
Table (4.1) Highest level of education completed among persons aged 25 years or older Education stage
Age groups Preparatory or
less Secondary
More than secondary
Total
25 - 29 74.4 17.7 7.9 100 30 - 34 74.3 21.3 4.4 100 35 - 39 77.0 18.9 4.1 100 40 - 44 84.0 10.9 5.1 100 45 - 49 86.0 9.5 4.5 100 50 - 54 86.3 10.3 3.4 100 55 - 59 91.7 6.0 2.3 100 60 - 64 95.3 3.2 1.5 100 65 - 69 98.0 1.3 0.7 100
70+ 99.8 0.2 0.0 100 Total 86.7 10.0 3.3 100
However, the above table conceals disparities between males and females. As depicted by Figure (4.2), it appears that among the younger age groups we find more females than males with post-secondary education up to 45 years old. Then the trend is reversed in favour of males, where the percentage of those who have more than secondary education increases from 2.2 per cent for females in the age group 45 to 49 year old to 8.3 per cent for males in the same age group. The disparity and trend between males and females among the older age groups maybe explained by the stigma that was associated with females’ education in the early days of expulsion. On the other hand, for the younger generation, females out number males at all levels of education.
Figure (4.2) Percentage of persons 25 years and older with a post-secondary education; by age and gender
0
2
4
6
8
10
25 -29
30 -34
35 -39
40 -44
45 -49
50 -54
55 -59
60 -64
65 -69
70+
Per centMales Females
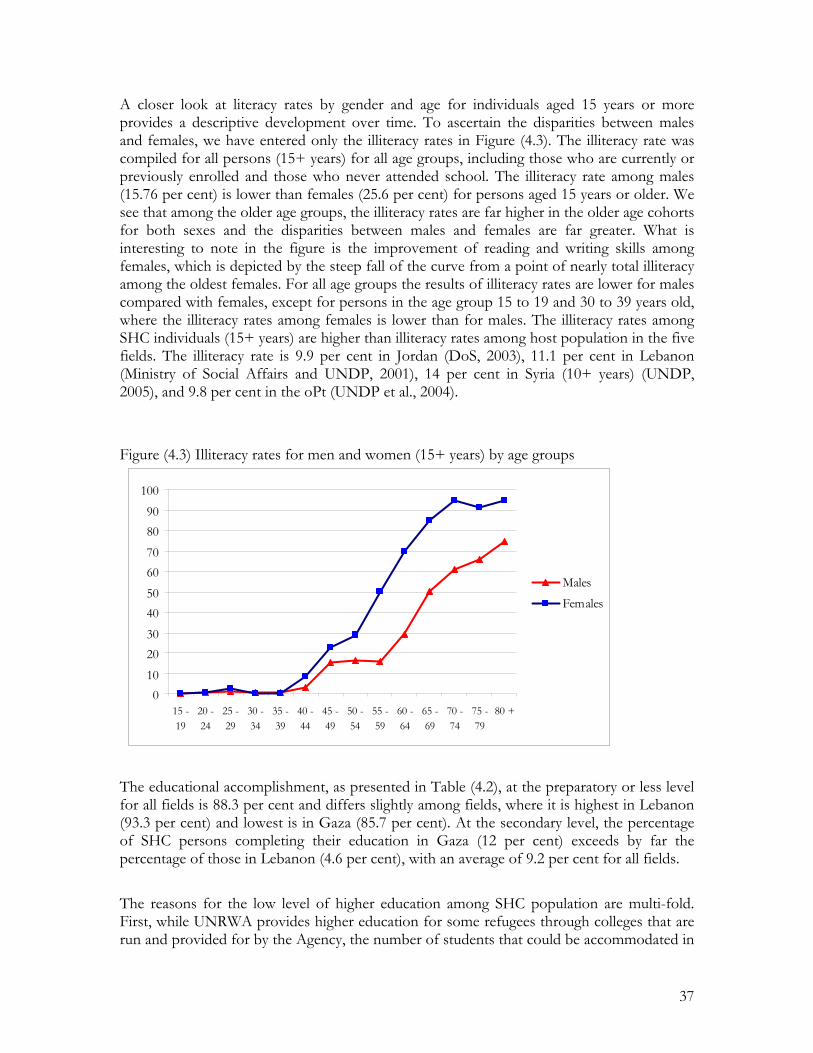
37
A closer look at literacy rates by gender and age for individuals aged 15 years or more provides a descriptive development over time. To ascertain the disparities between males and females, we have entered only the illiteracy rates in Figure (4.3). The illiteracy rate was compiled for all persons (15+ years) for all age groups, including those who are currently or previously enrolled and those who never attended school. The illiteracy rate among males (15.76 per cent) is lower than females (25.6 per cent) for persons aged 15 years or older. We see that among the older age groups, the illiteracy rates are far higher in the older age cohorts for both sexes and the disparities between males and females are far greater. What is interesting to note in the figure is the improvement of reading and writing skills among females, which is depicted by the steep fall of the curve from a point of nearly total illiteracy among the oldest females. For all age groups the results of illiteracy rates are lower for males compared with females, except for persons in the age group 15 to 19 and 30 to 39 years old, where the illiteracy rates among females is lower than for males. The illiteracy rates among SHC individuals (15+ years) are higher than illiteracy rates among host population in the five fields. The illiteracy rate is 9.9 per cent in Jordan (DoS, 2003), 11.1 per cent in Lebanon (Ministry of Social Affairs and UNDP, 2001), 14 per cent in Syria (10+ years) (UNDP, 2005), and 9.8 per cent in the oPt (UNDP et al., 2004).
Figure (4.3) Illiteracy rates for men and women (15+ years) by age groups
010
203040506070
8090
100
15 -19
20 -24
25 -29
30 -34
35 -39
40 -44
45 -49
50 -54
55 -59
60 -64
65 -69
70 -74
75 -79
80 +
MalesFemales
The educational accomplishment, as presented in Table (4.2), at the preparatory or less level for all fields is 88.3 per cent and differs slightly among fields, where it is highest in Lebanon (93.3 per cent) and lowest is in Gaza (85.7 per cent). At the secondary level, the percentage of SHC persons completing their education in Gaza (12 per cent) exceeds by far the percentage of those in Lebanon (4.6 per cent), with an average of 9.2 per cent for all fields.
The reasons for the low level of higher education among SHC population are multi-fold. First, while UNRWA provides higher education for some refugees through colleges that are run and provided for by the Agency, the number of students that could be accommodated in

38
these colleges is minimal, compared to the needs and they are highly competitive. Thus, many of the refugees who do not have the financial means to provide for such education miss the opportunity to continue their studies.
Table (4.2) Educational accomplishments by field for all SHC population
Educational Level West Bank Gaza Lebanon Syria Jordan Total
Illiterate 24.7 12.4 14.9 21.5 15.9 16.6 Read and write 29.3 29.6 38.1 30.0 31.4 31.5 Elementary 18.3 22.1 26.5 26.3 19.2 22.3 Preparatory 16.0 21.7 13.9 13.1 19.8 17.9 Vocational Education 0.2 0.2 0.5 0.3 0.2 Secondary 8.8 12.0 4.6 7.6 9.8 9.2 Intermediate Diploma 1.9 1.1 0.6 0.7 2.8 1.4 B.A.,B.Sc. 0.9 0.9 0.9 0.5 0.7 0.8 Higher diploma 0.0 0.1 0.1 0.02 M.A. 0.0 0.0 0.01 Total 100 100.0 100.0 100.0 100.0 100.0
Second, the cost of higher education has been generally on the rise in all fields, whether for refugees or non-refugees. This fact has proven to be crucial for lower-income groups that are unable to secure the cost of education, and as a result many students from lower-income groups do not continue their education beyond secondary level. Hence, many of the refugee students abandon the idea of continuing their education beyond the preparatory school level and move on to look for jobs in a highly competitive market without any practical experience or higher education.
Enrolment and Drop out Rates
Table (4.3) presents net enrolment and drop out rates by fields and as a total. The most striking feature of the table is that more than 14 per cent of persons aged 6 to 15 years old drop out of school in all fields, with the highest percentage in Jordan (29.7 per cent) and the lowest in Gaza (7 per cent).
At the age of twelve, the elementary education cycle, almost 90 per cent of SHC children are enrolled. Three years later, the end of the preparatory cycle, the net enrolment rate drops down to 75.4 per cent, indicating a high drop out ratio. At the age of seventeen, only around two-thirds are still enrolled and at the age of eighteen, the ratio drops down to almost one-half.

39
Table (4.3) Net enrolment and drop out rates by field and as a total for SHC population
Field Total population
(6-15)
Net number of currently
enrolled (6-15)
Net enrolment
rate
Drop out rate
West Bank 9213 8081 87.7 12.3
Gaza 29174 27126 93.0 7.0
Lebanon 11234 9584 85.3 14.7
Syria 6060 5062 83.5 16.5
Jordan 14025 9859 70.3 29.7
Total 69706 59712 85.7 14.3
In fact, the drop out rate increases from 14.3 per cent for the ages from 6 to 15 years to 37.3 per cent for age groups 16 to 18 years old, i.e., the secondary cycle. As illustrated in Figure (4.4), the drop out rate increases gradually from one age to the next until the age of 10 and 12 years old. Then the drop out rate seems stable until the age of 14 years before it increases substantially for the age 15 years onward. By the end of the secondary cycle, i.e., 18 years of age, the drop out rate increases to more than 50 per cent. The highest drop out ratio for persons 18 years of age is in Syria, in which more than 80 per cent of SHC individuals leave school before completing their secondary education and the lowest is in Gaza (35.3 per cent).
Figure (4.4) School drop out ratio for students from 7 to 15 years of age for all fields
0
10
20
30
40
50
60
7 8 9 10 11 12 13 14 15 16 17 18 Age
per cent dropout rate
As is evident from the data, there exists no significant difference in the educational levels between male and females except on illiteracy rates. As depicted by Figure (4.5) while 9.9 per cent of males are illiterate, 19.9 per cent of women are illiterate. This conclusion is supported by the question on the reasons for not completing education. About 13 per cent of respondents indicated that girls do not attend school because of social restrictions, and 16.9
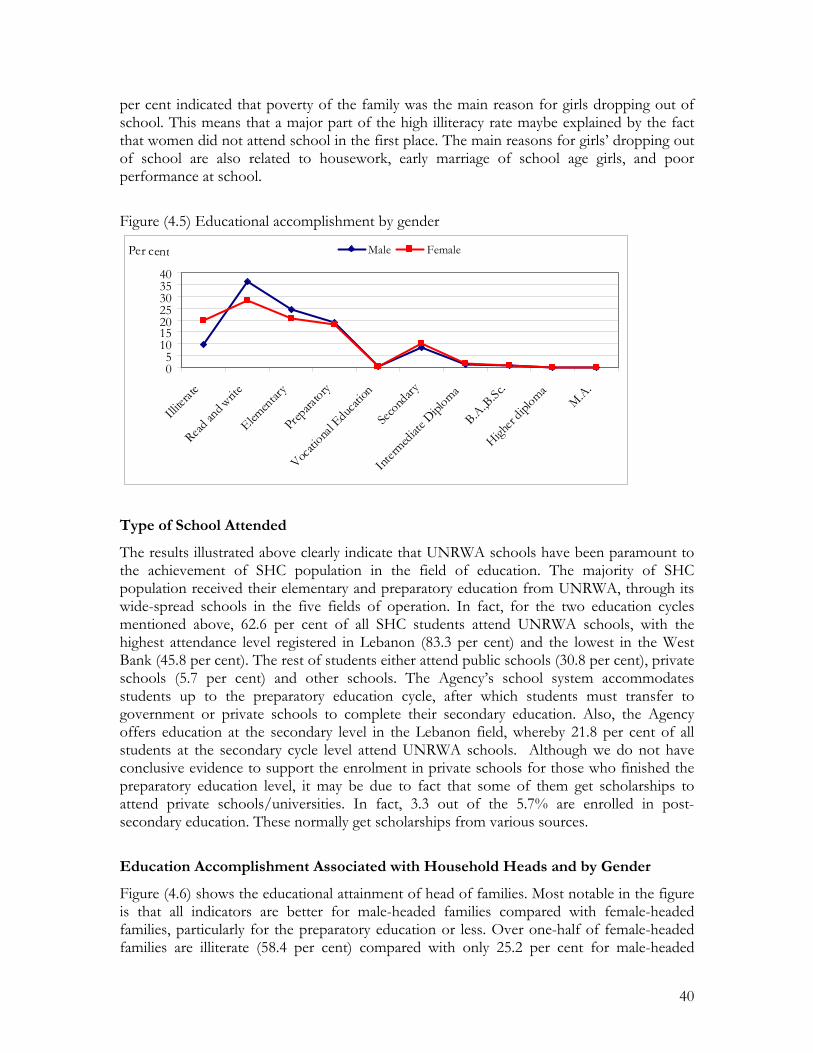
40
per cent indicated that poverty of the family was the main reason for girls dropping out of school. This means that a major part of the high illiteracy rate maybe explained by the fact that women did not attend school in the first place. The main reasons for girls’ dropping out of school are also related to housework, early marriage of school age girls, and poor performance at school.
Figure (4.5) Educational accomplishment by gender
05
10152025303540
Illiter
ate
Read an
d write
Elemen
tary
Prepara
tory
Vocati
onal E
ducati
on
Seco
ndary
Interm
ediat
e Dipl
oma
B.A.,B
.Sc.
Higher
diploma
M.A.
Per cent Male Female
Type of School Attended
The results illustrated above clearly indicate that UNRWA schools have been paramount to the achievement of SHC population in the field of education. The majority of SHC population received their elementary and preparatory education from UNRWA, through its wide-spread schools in the five fields of operation. In fact, for the two education cycles mentioned above, 62.6 per cent of all SHC students attend UNRWA schools, with the highest attendance level registered in Lebanon (83.3 per cent) and the lowest in the West Bank (45.8 per cent). The rest of students either attend public schools (30.8 per cent), private schools (5.7 per cent) and other schools. The Agency’s school system accommodates students up to the preparatory education cycle, after which students must transfer to government or private schools to complete their secondary education. Also, the Agency offers education at the secondary level in the Lebanon field, whereby 21.8 per cent of all students at the secondary cycle level attend UNRWA schools. Although we do not have conclusive evidence to support the enrolment in private schools for those who finished the preparatory education level, it may be due to fact that some of them get scholarships to attend private schools/universities. In fact, 3.3 out of the 5.7% are enrolled in post-secondary education. These normally get scholarships from various sources.
Education Accomplishment Associated with Household Heads and by Gender
Figure (4.6) shows the educational attainment of head of families. Most notable in the figure is that all indicators are better for male-headed families compared with female-headed families, particularly for the preparatory education or less. Over one-half of female-headed families are illiterate (58.4 per cent) compared with only 25.2 per cent for male-headed
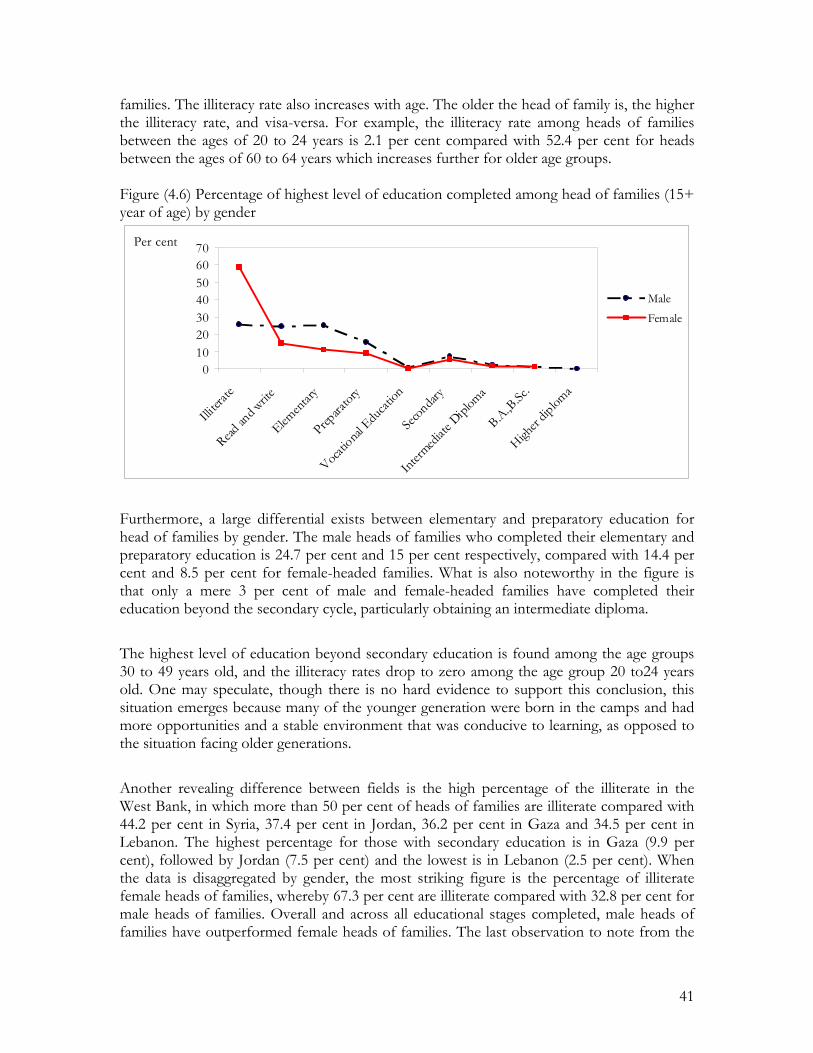
41
families. The illiteracy rate also increases with age. The older the head of family is, the higher the illiteracy rate, and visa-versa. For example, the illiteracy rate among heads of families between the ages of 20 to 24 years is 2.1 per cent compared with 52.4 per cent for heads between the ages of 60 to 64 years which increases further for older age groups. Figure (4.6) Percentage of highest level of education completed among head of families (15+ year of age) by gender
010203040506070
Illiter
ate
Read an
d write
Elemen
tary
Prepara
tory
Vocatio
nal Edu
cation
Secon
dary
Interm
ediat
e Dipl
oma
B.A.,B.Sc
.
Higher
diplom
a
Per cent
MaleFemale
Furthermore, a large differential exists between elementary and preparatory education for head of families by gender. The male heads of families who completed their elementary and preparatory education is 24.7 per cent and 15 per cent respectively, compared with 14.4 per cent and 8.5 per cent for female-headed families. What is also noteworthy in the figure is that only a mere 3 per cent of male and female-headed families have completed their education beyond the secondary cycle, particularly obtaining an intermediate diploma.
The highest level of education beyond secondary education is found among the age groups 30 to 49 years old, and the illiteracy rates drop to zero among the age group 20 to24 years old. One may speculate, though there is no hard evidence to support this conclusion, this situation emerges because many of the younger generation were born in the camps and had more opportunities and a stable environment that was conducive to learning, as opposed to the situation facing older generations.
Another revealing difference between fields is the high percentage of the illiterate in the West Bank, in which more than 50 per cent of heads of families are illiterate compared with 44.2 per cent in Syria, 37.4 per cent in Jordan, 36.2 per cent in Gaza and 34.5 per cent in Lebanon. The highest percentage for those with secondary education is in Gaza (9.9 per cent), followed by Jordan (7.5 per cent) and the lowest is in Lebanon (2.5 per cent). When the data is disaggregated by gender, the most striking figure is the percentage of illiterate female heads of families, whereby 67.3 per cent are illiterate compared with 32.8 per cent for male heads of families. Overall and across all educational stages completed, male heads of families have outperformed female heads of families. The last observation to note from the
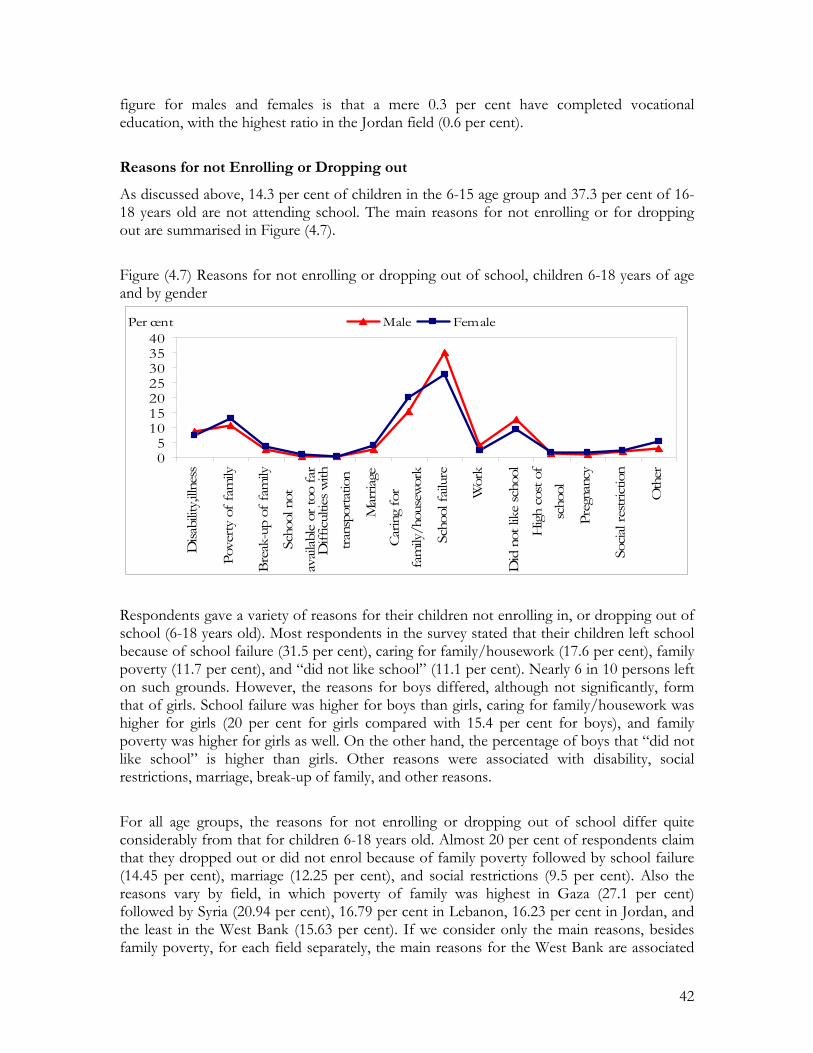
42
figure for males and females is that a mere 0.3 per cent have completed vocational education, with the highest ratio in the Jordan field (0.6 per cent).
Reasons for not Enrolling or Dropping out
As discussed above, 14.3 per cent of children in the 6-15 age group and 37.3 per cent of 16-18 years old are not attending school. The main reasons for not enrolling or for dropping out are summarised in Figure (4.7).
Figure (4.7) Reasons for not enrolling or dropping out of school, children 6-18 years of age and by gender
05
10152025303540
Disa
bilit
y,illn
ess
Pove
rty o
f fam
ily
Brea
k-up
of
fam
ily
Scho
ol n
otav
ailab
le or
too
far
Diff
iculti
es w
ithtra
nspo
rtatio
n
Mar
riage
Carin
g fo
rfa
mily
/hou
sewo
rk
Scho
ol fa
ilure
Wor
k
Did
not
like
scho
ol
High
cos
t of
scho
ol
Preg
nanc
y
Socia
l res
trict
ion
Oth
er
Per cent Male Female
Respondents gave a variety of reasons for their children not enrolling in, or dropping out of school (6-18 years old). Most respondents in the survey stated that their children left school because of school failure (31.5 per cent), caring for family/housework (17.6 per cent), family poverty (11.7 per cent), and “did not like school” (11.1 per cent). Nearly 6 in 10 persons left on such grounds. However, the reasons for boys differed, although not significantly, form that of girls. School failure was higher for boys than girls, caring for family/housework was higher for girls (20 per cent for girls compared with 15.4 per cent for boys), and family poverty was higher for girls as well. On the other hand, the percentage of boys that “did not like school” is higher than girls. Other reasons were associated with disability, social restrictions, marriage, break-up of family, and other reasons.
For all age groups, the reasons for not enrolling or dropping out of school differ quite considerably from that for children 6-18 years old. Almost 20 per cent of respondents claim that they dropped out or did not enrol because of family poverty followed by school failure (14.45 per cent), marriage (12.25 per cent), and social restrictions (9.5 per cent). Also the reasons vary by field, in which poverty of family was highest in Gaza (27.1 per cent) followed by Syria (20.94 per cent), 16.79 per cent in Lebanon, 16.23 per cent in Jordan, and the least in the West Bank (15.63 per cent). If we consider only the main reasons, besides family poverty, for each field separately, the main reasons for the West Bank are associated
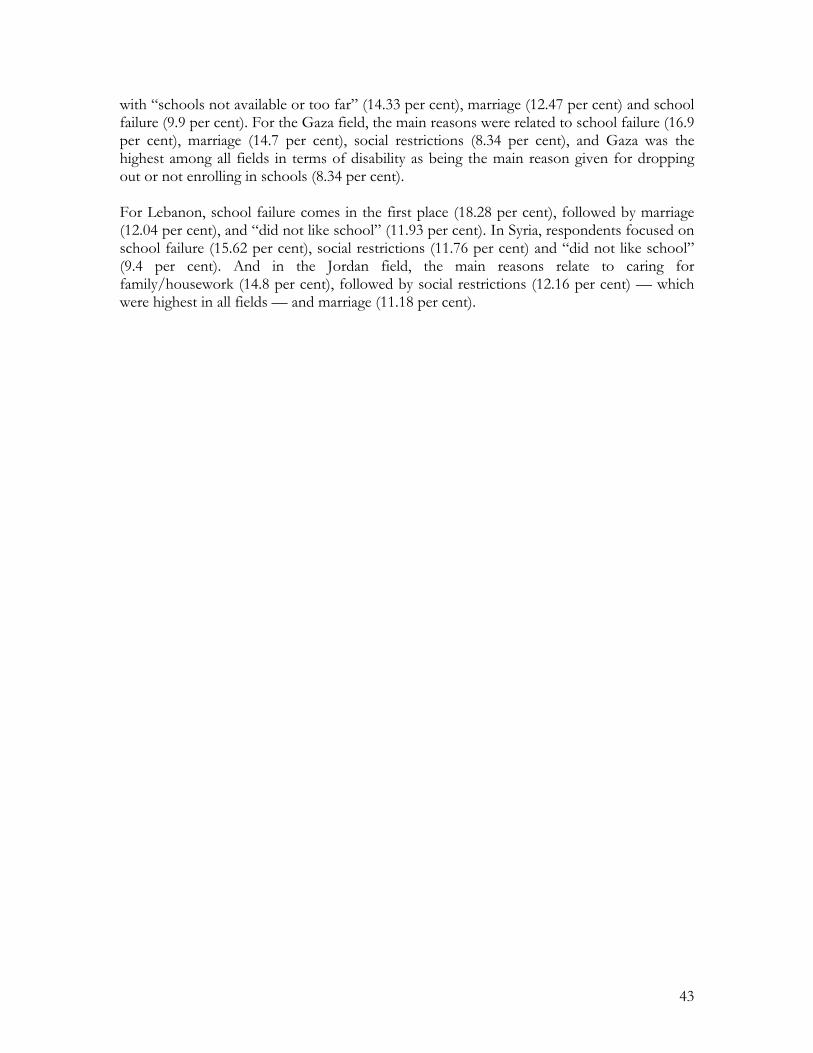
43
with “schools not available or too far” (14.33 per cent), marriage (12.47 per cent) and school failure (9.9 per cent). For the Gaza field, the main reasons were related to school failure (16.9 per cent), marriage (14.7 per cent), social restrictions (8.34 per cent), and Gaza was the highest among all fields in terms of disability as being the main reason given for dropping out or not enrolling in schools (8.34 per cent). For Lebanon, school failure comes in the first place (18.28 per cent), followed by marriage (12.04 per cent), and “did not like school” (11.93 per cent). In Syria, respondents focused on school failure (15.62 per cent), social restrictions (11.76 per cent) and “did not like school” (9.4 per cent). And in the Jordan field, the main reasons relate to caring for family/housework (14.8 per cent), followed by social restrictions (12.16 per cent) — which were highest in all fields — and marriage (11.18 per cent).
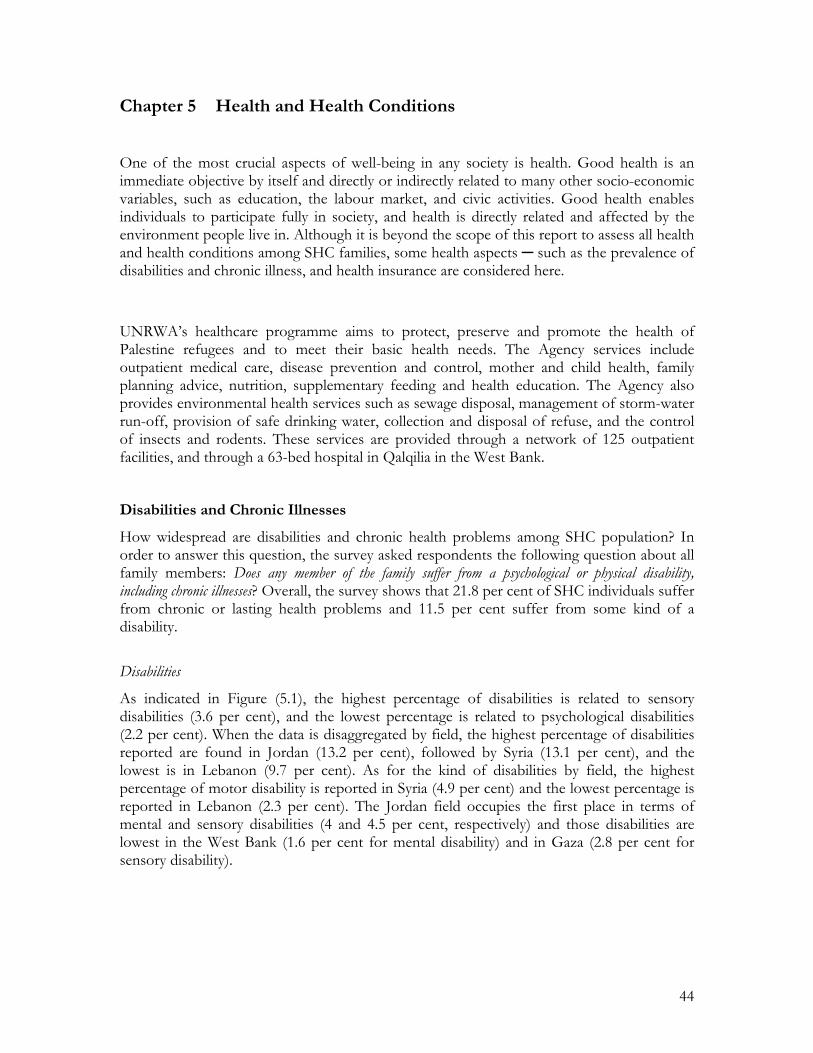
44
Chapter 5 Health and Health Conditions
One of the most crucial aspects of well-being in any society is health. Good health is an immediate objective by itself and directly or indirectly related to many other socio-economic variables, such as education, the labour market, and civic activities. Good health enables individuals to participate fully in society, and health is directly related and affected by the environment people live in. Although it is beyond the scope of this report to assess all health and health conditions among SHC families, some health aspects ─ such as the prevalence of disabilities and chronic illness, and health insurance are considered here.
UNRWA’s healthcare programme aims to protect, preserve and promote the health of Palestine refugees and to meet their basic health needs. The Agency services include outpatient medical care, disease prevention and control, mother and child health, family planning advice, nutrition, supplementary feeding and health education. The Agency also provides environmental health services such as sewage disposal, management of storm-water run-off, provision of safe drinking water, collection and disposal of refuse, and the control of insects and rodents. These services are provided through a network of 125 outpatient facilities, and through a 63-bed hospital in Qalqilia in the West Bank.
Disabilities and Chronic Illnesses
How widespread are disabilities and chronic health problems among SHC population? In order to answer this question, the survey asked respondents the following question about all family members: Does any member of the family suffer from a psychological or physical disability, including chronic illnesses? Overall, the survey shows that 21.8 per cent of SHC individuals suffer from chronic or lasting health problems and 11.5 per cent suffer from some kind of a disability.
Disabilities
As indicated in Figure (5.1), the highest percentage of disabilities is related to sensory disabilities (3.6 per cent), and the lowest percentage is related to psychological disabilities (2.2 per cent). When the data is disaggregated by field, the highest percentage of disabilities reported are found in Jordan (13.2 per cent), followed by Syria (13.1 per cent), and the lowest is in Lebanon (9.7 per cent). As for the kind of disabilities by field, the highest percentage of motor disability is reported in Syria (4.9 per cent) and the lowest percentage is reported in Lebanon (2.3 per cent). The Jordan field occupies the first place in terms of mental and sensory disabilities (4 and 4.5 per cent, respectively) and those disabilities are lowest in the West Bank (1.6 per cent for mental disability) and in Gaza (2.8 per cent for sensory disability).
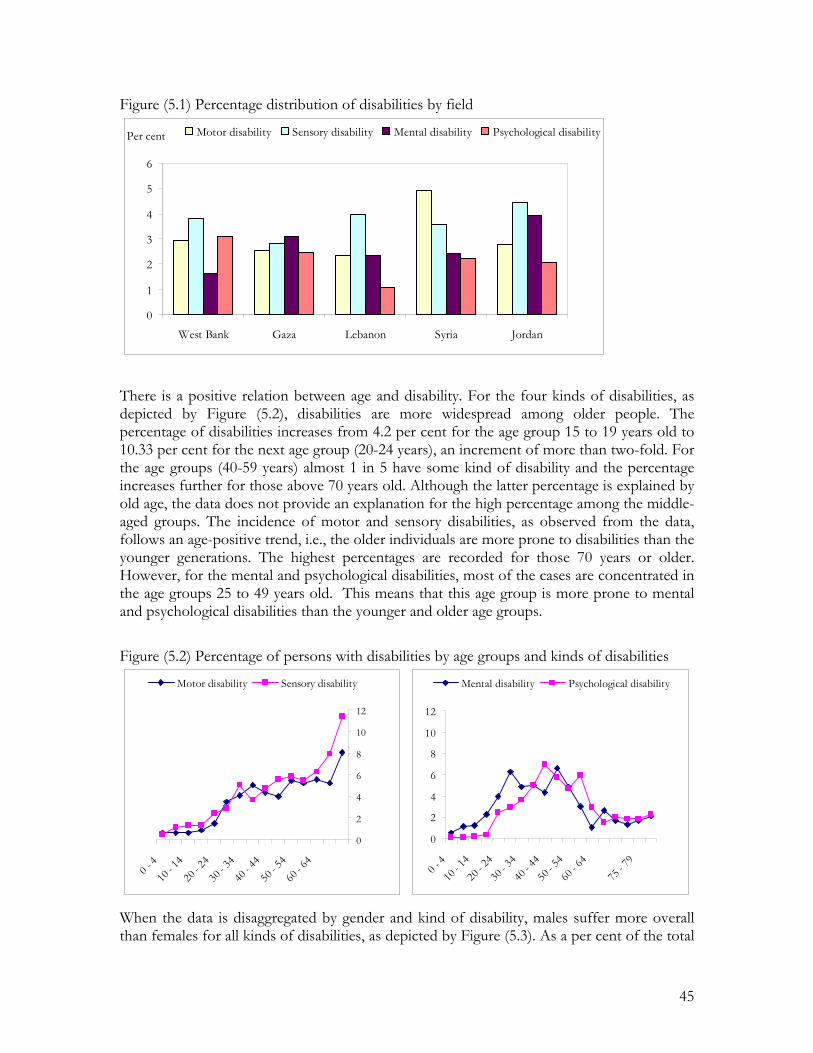
45
Figure (5.1) Percentage distribution of disabilities by field
0
1
2
3
4
5
6
West Bank Gaza Lebanon Syria Jordan
Per cent Motor disability Sensory disability Mental disability Psychological disability
There is a positive relation between age and disability. For the four kinds of disabilities, as depicted by Figure (5.2), disabilities are more widespread among older people. The percentage of disabilities increases from 4.2 per cent for the age group 15 to 19 years old to 10.33 per cent for the next age group (20-24 years), an increment of more than two-fold. For the age groups (40-59 years) almost 1 in 5 have some kind of disability and the percentage increases further for those above 70 years old. Although the latter percentage is explained by old age, the data does not provide an explanation for the high percentage among the middle-aged groups. The incidence of motor and sensory disabilities, as observed from the data, follows an age-positive trend, i.e., the older individuals are more prone to disabilities than the younger generations. The highest percentages are recorded for those 70 years or older. However, for the mental and psychological disabilities, most of the cases are concentrated in the age groups 25 to 49 years old. This means that this age group is more prone to mental and psychological disabilities than the younger and older age groups.
Figure (5.2) Percentage of persons with disabilities by age groups and kinds of disabilities
When the data is disaggregated by gender and kind of disability, males suffer more overall than females for all kinds of disabilities, as depicted by Figure (5.3). As a per cent of the total
0
2
4
6
8
10
12
0 - 4
10 - 1
420
- 24
30 - 3
440
- 44
50 - 5
460
- 64
Motor disability Sensory disability
0
2
4
6
8
10
12
0 - 4
10 - 1
420
- 2430
- 3440
- 4450
- 5460
- 64
75 - 7
9
Mental disability Psychological disability
46
SHC population, males account for 7 per cent of all disabilities compared with 4.5 per cent for females. However, if the comparison is taken as a per cent of the total male and female population, the percentage increases by more than twice for that of females (16.84 per cent for males compared with 7.7 per cent for females), which simply means that 60.7 per cent of all disabilities are found among males and the rest, 39.3 per cent, are found among females. The distribution of disabilities by age and gender also differs according to the kind of disability. For example, the highest number of cases for motor disability among females is for females 70 years of age or older and for the age group 35 to 39 years. For the sensory disability, the highest number of cases is recorded for those 65 years of age or older, and the psychological disability is highest among the age groups of 35 to 49 years old, similar to that of men. Although the data does not provide conclusive evidence to the prevalence of disabilities among the males and females for specific age groups, the observed statistics may be related to work or occupation, life-cycle for the aged, and may be to war or conflict in some fields, such as in West Bank, Gaza and Lebanon.
Figure (5.3) Distribution of disabilities by age and gender
0
10
20
30
40
50
60
0 - 4
5 - 9
10 -
14
15 -
19
20 -
24
25 -
29
30 -
34
35 -
39
40 -
44
45 -
49
50 -
54
55 -
59
60 -
64
65 -
69 70+
Per cent Males Females
The overall trend in the prevalence of disabilities among various age groups discussed above is supported by the question on the length of time the person has suffered from the disability. Overall, the average mean number of years is around 17 years, but it varies by age groups. As illustrated in the Figure (5.4), overall there is a logical positive time pattern trend for the length of time a person suffering from any of the four kinds of disabilities. However, the highest number of years (mean) is recorded for those who suffer from mental disability (19.9 years) followed by a motor disability (18 years) and the lowest is among the psychological disabilities averaging around 15.6 years. The highest number of years per age group was recorded for the mental disability for persons aged from 70 to 75 years old, with a mean length of disability of 39 years, the number drops sharply for those 80 years or more (14.4 years). For those who suffer from psychological disabilities only, the number of years is highest among the age group from 60 to 64 years (32.2 years) and, again, drops by more than one-half for the next age group from 65 to 69 years (15.2 years). One variation is also observed for the age group 50 to 54 years old, in which the number of years increases to 22 years, as compared with the previous age group of 45-49 years (16 years).
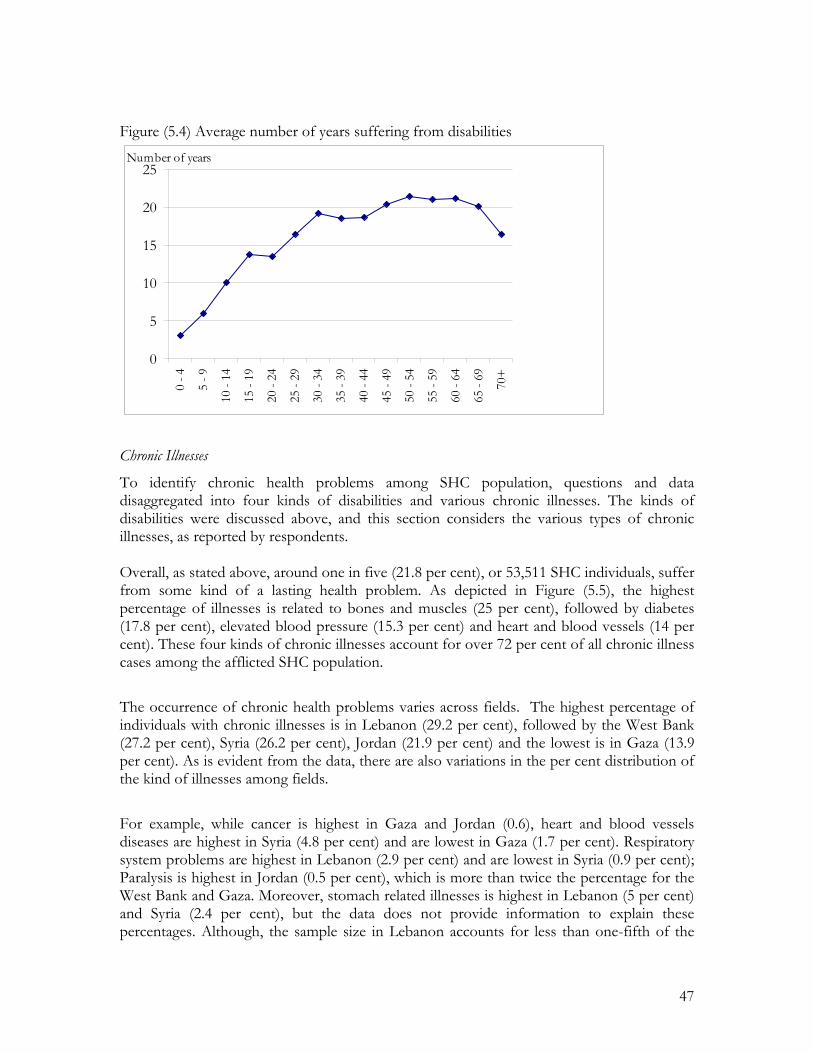
47
Figure (5.4) Average number of years suffering from disabilities
0
5
10
15
20
250
- 4
5 - 9
10 -
14
15 -
19
20 -
24
25 -
29
30 -
34
35 -
39
40 -
44
45 -
49
50 -
54
55 -
59
60 -
64
65 -
69
70+
Number of years
Chronic Illnesses
To identify chronic health problems among SHC population, questions and data disaggregated into four kinds of disabilities and various chronic illnesses. The kinds of disabilities were discussed above, and this section considers the various types of chronic illnesses, as reported by respondents. Overall, as stated above, around one in five (21.8 per cent), or 53,511 SHC individuals, suffer from some kind of a lasting health problem. As depicted in Figure (5.5), the highest percentage of illnesses is related to bones and muscles (25 per cent), followed by diabetes (17.8 per cent), elevated blood pressure (15.3 per cent) and heart and blood vessels (14 per cent). These four kinds of chronic illnesses account for over 72 per cent of all chronic illness cases among the afflicted SHC population.
The occurrence of chronic health problems varies across fields. The highest percentage of individuals with chronic illnesses is in Lebanon (29.2 per cent), followed by the West Bank (27.2 per cent), Syria (26.2 per cent), Jordan (21.9 per cent) and the lowest is in Gaza (13.9 per cent). As is evident from the data, there are also variations in the per cent distribution of the kind of illnesses among fields.
For example, while cancer is highest in Gaza and Jordan (0.6), heart and blood vessels diseases are highest in Syria (4.8 per cent) and are lowest in Gaza (1.7 per cent). Respiratory system problems are highest in Lebanon (2.9 per cent) and are lowest in Syria (0.9 per cent); Paralysis is highest in Jordan (0.5 per cent), which is more than twice the percentage for the West Bank and Gaza. Moreover, stomach related illnesses is highest in Lebanon (5 per cent) and Syria (2.4 per cent), but the data does not provide information to explain these percentages. Although, the sample size in Lebanon accounts for less than one-fifth of the
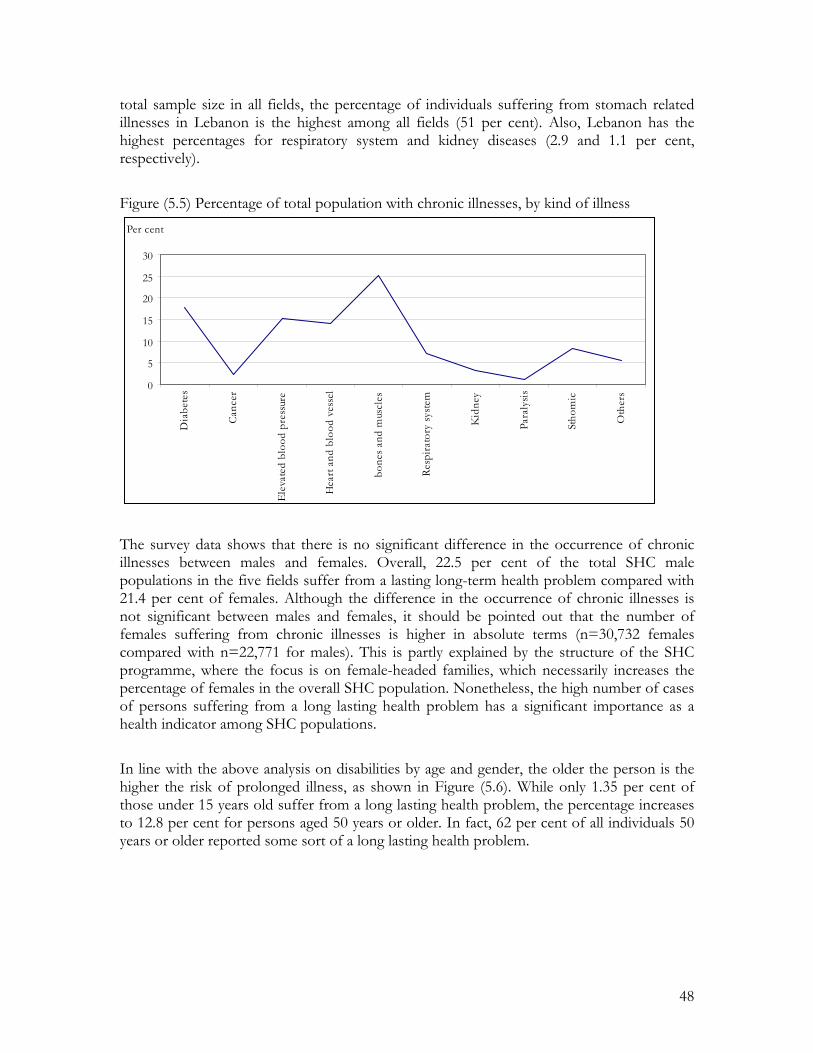
48
total sample size in all fields, the percentage of individuals suffering from stomach related illnesses in Lebanon is the highest among all fields (51 per cent). Also, Lebanon has the highest percentages for respiratory system and kidney diseases (2.9 and 1.1 per cent, respectively).
Figure (5.5) Percentage of total population with chronic illnesses, by kind of illness
0
5
10
15
20
25
30
Dia
bete
s
Canc
er
Elev
ated
blo
od p
ress
ure
Hea
rt an
d bl
ood
vess
el
bone
s and
mus
cles
Resp
irato
ry sy
stem
Kid
ney
Para
lysis
Stho
mic
Oth
ers
Per cent
The survey data shows that there is no significant difference in the occurrence of chronic illnesses between males and females. Overall, 22.5 per cent of the total SHC male populations in the five fields suffer from a lasting long-term health problem compared with 21.4 per cent of females. Although the difference in the occurrence of chronic illnesses is not significant between males and females, it should be pointed out that the number of females suffering from chronic illnesses is higher in absolute terms (n=30,732 females compared with n=22,771 for males). This is partly explained by the structure of the SHC programme, where the focus is on female-headed families, which necessarily increases the percentage of females in the overall SHC population. Nonetheless, the high number of cases of persons suffering from a long lasting health problem has a significant importance as a health indicator among SHC populations.
In line with the above analysis on disabilities by age and gender, the older the person is the higher the risk of prolonged illness, as shown in Figure (5.6). While only 1.35 per cent of those under 15 years old suffer from a long lasting health problem, the percentage increases to 12.8 per cent for persons aged 50 years or older. In fact, 62 per cent of all individuals 50 years or older reported some sort of a long lasting health problem.
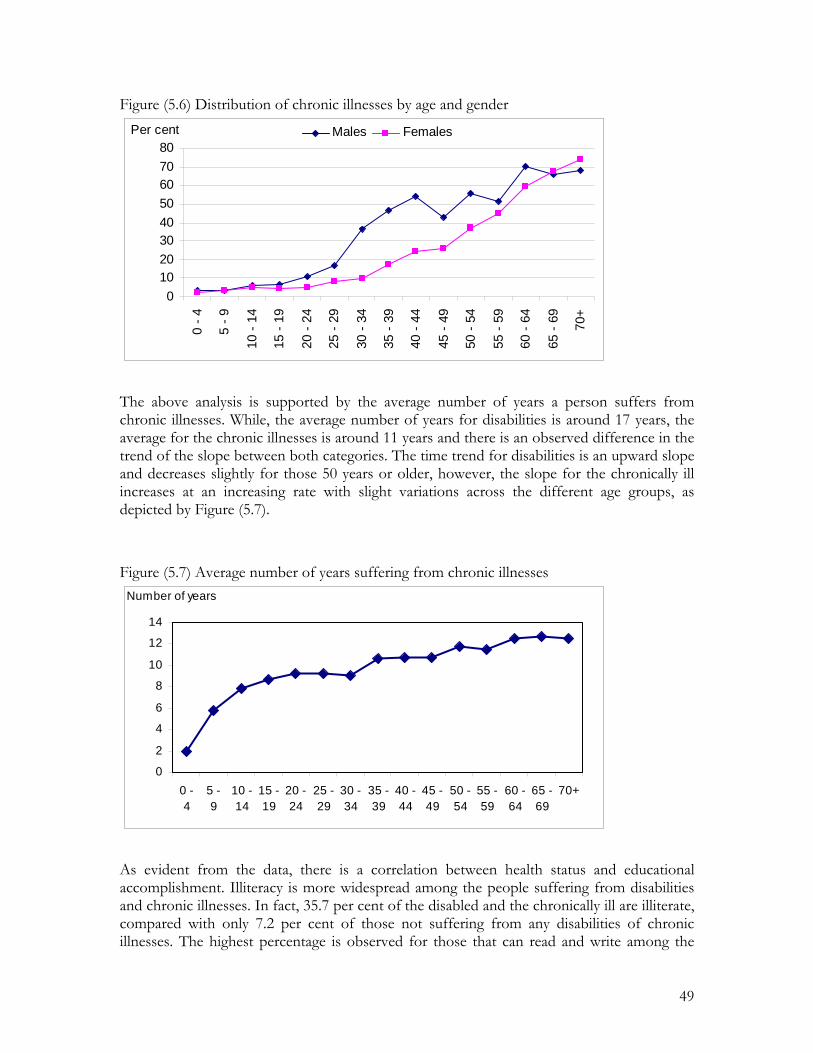
49
Figure (5.6) Distribution of chronic illnesses by age and gender
01020304050607080
0 - 4
5 - 9
10 -
14
15 -
19
20 -
24
25 -
29
30 -
34
35 -
39
40 -
44
45 -
49
50 -
54
55 -
59
60 -
64
65 -
69 70+
Per cent Males Females
The above analysis is supported by the average number of years a person suffers from chronic illnesses. While, the average number of years for disabilities is around 17 years, the average for the chronic illnesses is around 11 years and there is an observed difference in the trend of the slope between both categories. The time trend for disabilities is an upward slope and decreases slightly for those 50 years or older, however, the slope for the chronically ill increases at an increasing rate with slight variations across the different age groups, as depicted by Figure (5.7).
Figure (5.7) Average number of years suffering from chronic illnesses
0
2
4
6
8
10
12
14
0 -4
5 -9
10 -14
15 -19
20 -24
25 -29
30 -34
35 -39
40 -44
45 -49
50 -54
55 -59
60 -64
65 -69
70+
Number of years
As evident from the data, there is a correlation between health status and educational accomplishment. Illiteracy is more widespread among the people suffering from disabilities and chronic illnesses. In fact, 35.7 per cent of the disabled and the chronically ill are illiterate, compared with only 7.2 per cent of those not suffering from any disabilities of chronic illnesses. The highest percentage is observed for those that can read and write among the
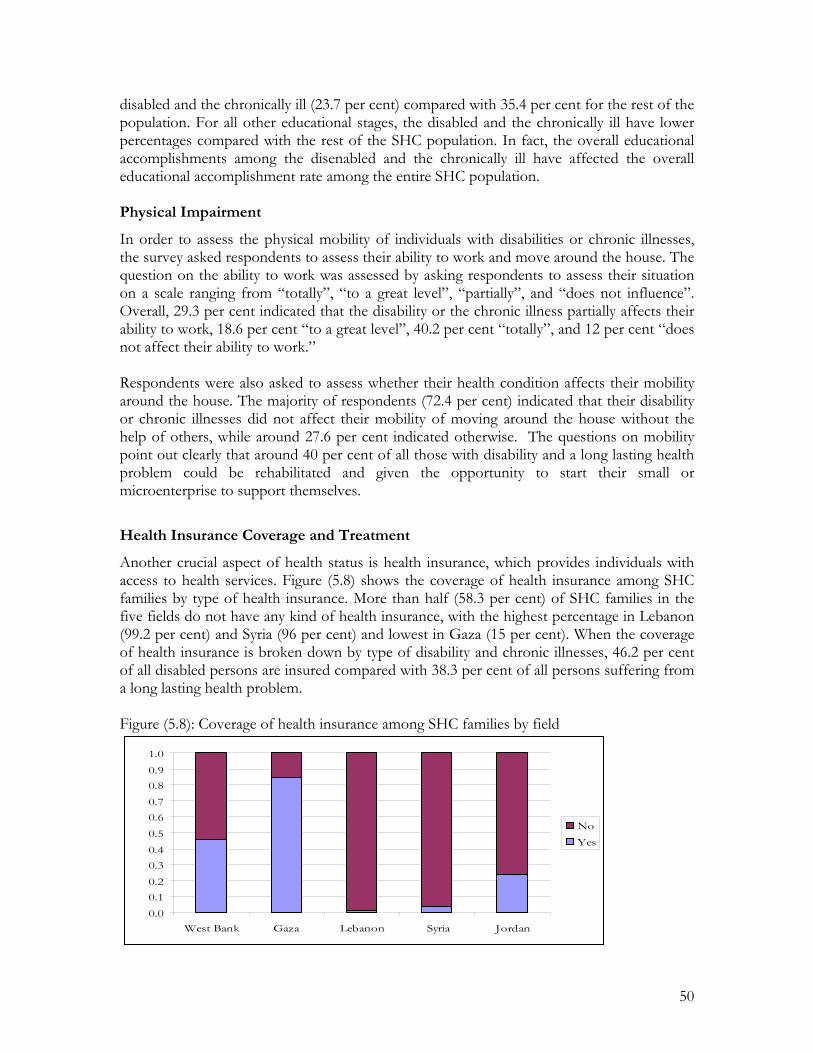
50
disabled and the chronically ill (23.7 per cent) compared with 35.4 per cent for the rest of the population. For all other educational stages, the disabled and the chronically ill have lower percentages compared with the rest of the SHC population. In fact, the overall educational accomplishments among the disenabled and the chronically ill have affected the overall educational accomplishment rate among the entire SHC population. Physical Impairment
In order to assess the physical mobility of individuals with disabilities or chronic illnesses, the survey asked respondents to assess their ability to work and move around the house. The question on the ability to work was assessed by asking respondents to assess their situation on a scale ranging from “totally”, “to a great level”, “partially”, and “does not influence”. Overall, 29.3 per cent indicated that the disability or the chronic illness partially affects their ability to work, 18.6 per cent “to a great level”, 40.2 per cent “totally”, and 12 per cent “does not affect their ability to work.” Respondents were also asked to assess whether their health condition affects their mobility around the house. The majority of respondents (72.4 per cent) indicated that their disability or chronic illnesses did not affect their mobility of moving around the house without the help of others, while around 27.6 per cent indicated otherwise. The questions on mobility point out clearly that around 40 per cent of all those with disability and a long lasting health problem could be rehabilitated and given the opportunity to start their small or microenterprise to support themselves.
Health Insurance Coverage and Treatment
Another crucial aspect of health status is health insurance, which provides individuals with access to health services. Figure (5.8) shows the coverage of health insurance among SHC families by type of health insurance. More than half (58.3 per cent) of SHC families in the five fields do not have any kind of health insurance, with the highest percentage in Lebanon (99.2 per cent) and Syria (96 per cent) and lowest in Gaza (15 per cent). When the coverage of health insurance is broken down by type of disability and chronic illnesses, 46.2 per cent of all disabled persons are insured compared with 38.3 per cent of all persons suffering from a long lasting health problem. Figure (5.8): Coverage of health insurance among SHC families by field
0.00.10.20.30.40.50.60.70.80.91.0
West Bank Gaza Lebanon Syria Jordan
No
Yes
51
The highest coverage among the disabled is among the psychologically disabled (54.6 per cent) and the lowest is among those suffering from sensory disability (38.7 per cent). Among the chronically ill, the highest coverage is among cancer patients (53.2 per cent) and the lowest (26 per cent) is among patients suffering from stomach related illnesses.
As reported by respondents in the five fields, there are, roughly speaking, three different types of insurance schemes, public insurance, private insurance, and military insurance. In addition, UNRWA offers highly subsidised health services to all registered refugees, but is not considered here as a health insurance. Overall, 95.7 per cent of all insured SHC families have public health insurance, with the highest ratio is in Gaza (97.1 per cent) and the West Bank (95.7 per cent) and the lowest is in Lebanon (62.6 per cent). The rest either have private insurance (1.9 per cent), military health insurance (1.6 per cent), or other types of health insurance (0.8 per cent).
52
Chapter 6 Labour Force Activities
General Background
This chapter analyses the participation of SHCs in the labour market in the five fields, with special focus on the activities of the employed, their main occupations, sectors of employment, and the establishments they work at. In order to analyse the labour force according to international standards, the ILO classification and categorization of occupations and sectors framework were only adopted for this analysis. However, since the SHC survey did not adopt the ILO framework in totality for the classification of the employed and the unemployed, the survey could not calculate the percentage of unemployment among SHC families.4
In general, the ILO framework classifies the population (15 years and above) on the basis of each person’s activity during a particular ‘reference period’, usually one week. All the people surveyed are then classified into employed, unemployed, or outside the labour force. The employed are defined as individuals who worked at least one hour during the ‘reference period’, and the unemployed those who did not work one hour during the referenced week but were actively seeking work. Both of these categories combined make up the labour force. Thus, a person must be seeking work in the ‘reference week’, or he/she will not be considered as part of the economically active labour force. Defined as such, the labour force does not include persons who are not working or did not actively look for a job during the ‘referenced week’ (DoS, 1999). Those individuals are considered economically inactive. This does not mean that the so called ‘economically inactive’ do not contribute to the economy of a nation, as many of them may work at home taking care of children or doing domestic work. Some of them may want to work but do not actively seek employment because they have lost all hope of finding a job.
Therefore, in the SHC survey, SHC individuals were asked about their economic activities at the time of the interview only and hence classified as paid employee, employer, self-employed, unpaid family worker, unpaid worker, and “do not work”.
Economic Activity Status
The majority of SHC individuals “do not work” (91.3 per cent) and the rest (8.7 per cent, n=17,440) work; the majority of those who “do not work” are females (63.3 per cent). What these figures simply mean that the majority of SHC individuals are not in the labour force at all. As shown in Figure (6.1), 62.7 per cent of those who have some kind of a job are paid employees, 22.3 per cent are self-employed, and the lowest percentage are for unpaid family 4 In the design of economic activities section of the SHC questionnaire, the Relief and Social Services Staff objected to the ILO classification and instead insisted on asking respondents simply whether they are working or not, regardless of the reference period. Hence, the ILO classification is only considered here for the classification of occupations and sectors of employment only, but not to calculate the participation rate, employment and unemployment rates. Moreover, and in order to measure child labour, the SHC survey enquired about employment among individuals aged 10 years and older.
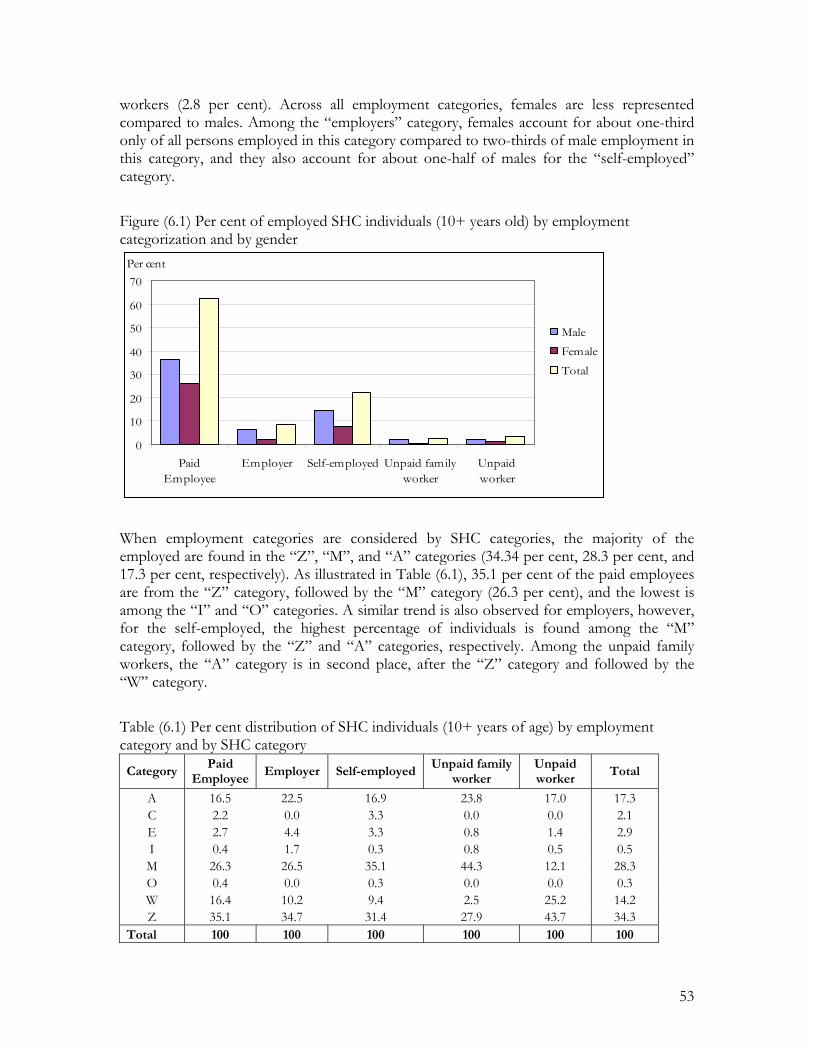
53
workers (2.8 per cent). Across all employment categories, females are less represented compared to males. Among the “employers” category, females account for about one-third only of all persons employed in this category compared to two-thirds of male employment in this category, and they also account for about one-half of males for the “self-employed” category.
Figure (6.1) Per cent of employed SHC individuals (10+ years old) by employment categorization and by gender
0
10
20
30
40
50
60
70
PaidEmployee
Employer Self-employed Unpaid familyworker
Unpaidworker
Per cent
Male
Female
Total
When employment categories are considered by SHC categories, the majority of the employed are found in the “Z”, “M”, and “A” categories (34.34 per cent, 28.3 per cent, and 17.3 per cent, respectively). As illustrated in Table (6.1), 35.1 per cent of the paid employees are from the “Z” category, followed by the “M” category (26.3 per cent), and the lowest is among the “I” and “O” categories. A similar trend is also observed for employers, however, for the self-employed, the highest percentage of individuals is found among the “M” category, followed by the “Z” and “A” categories, respectively. Among the unpaid family workers, the “A” category is in second place, after the “Z” category and followed by the “W” category.
Table (6.1) Per cent distribution of SHC individuals (10+ years of age) by employment category and by SHC category
Category Paid
Employee Employer Self-employed
Unpaid family worker
Unpaid worker
Total
A 16.5 22.5 16.9 23.8 17.0 17.3 C 2.2 0.0 3.3 0.0 0.0 2.1 E 2.7 4.4 3.3 0.8 1.4 2.9 I 0.4 1.7 0.3 0.8 0.5 0.5 M 26.3 26.5 35.1 44.3 12.1 28.3 O 0.4 0.0 0.3 0.0 0.0 0.3 W 16.4 10.2 9.4 2.5 25.2 14.2 Z 35.1 34.7 31.4 27.9 43.7 34.3
Total 100 100 100 100 100 100
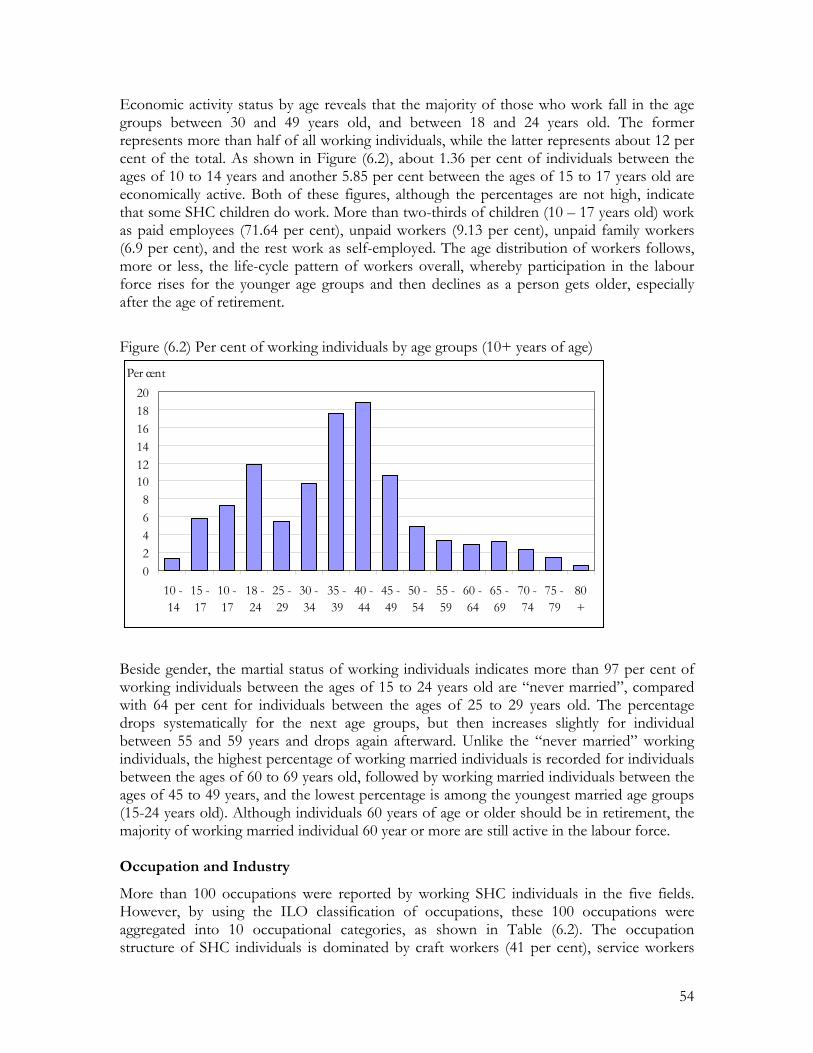
54
Economic activity status by age reveals that the majority of those who work fall in the age groups between 30 and 49 years old, and between 18 and 24 years old. The former represents more than half of all working individuals, while the latter represents about 12 per cent of the total. As shown in Figure (6.2), about 1.36 per cent of individuals between the ages of 10 to 14 years and another 5.85 per cent between the ages of 15 to 17 years old are economically active. Both of these figures, although the percentages are not high, indicate that some SHC children do work. More than two-thirds of children (10 – 17 years old) work as paid employees (71.64 per cent), unpaid workers (9.13 per cent), unpaid family workers (6.9 per cent), and the rest work as self-employed. The age distribution of workers follows, more or less, the life-cycle pattern of workers overall, whereby participation in the labour force rises for the younger age groups and then declines as a person gets older, especially after the age of retirement.
Figure (6.2) Per cent of working individuals by age groups (10+ years of age)
02468
101214161820
10 -14
15 -17
10 -17
18 -24
25 -29
30 -34
35 -39
40 -44
45 -49
50 -54
55 -59
60 -64
65 -69
70 -74
75 -79
80+
Per cent
Beside gender, the martial status of working individuals indicates more than 97 per cent of working individuals between the ages of 15 to 24 years old are “never married”, compared with 64 per cent for individuals between the ages of 25 to 29 years old. The percentage drops systematically for the next age groups, but then increases slightly for individual between 55 and 59 years and drops again afterward. Unlike the “never married” working individuals, the highest percentage of working married individuals is recorded for individuals between the ages of 60 to 69 years old, followed by working married individuals between the ages of 45 to 49 years, and the lowest percentage is among the youngest married age groups (15-24 years old). Although individuals 60 years of age or older should be in retirement, the majority of working married individual 60 year or more are still active in the labour force. Occupation and Industry
More than 100 occupations were reported by working SHC individuals in the five fields. However, by using the ILO classification of occupations, these 100 occupations were aggregated into 10 occupational categories, as shown in Table (6.2). The occupation structure of SHC individuals is dominated by craft workers (41 per cent), service workers
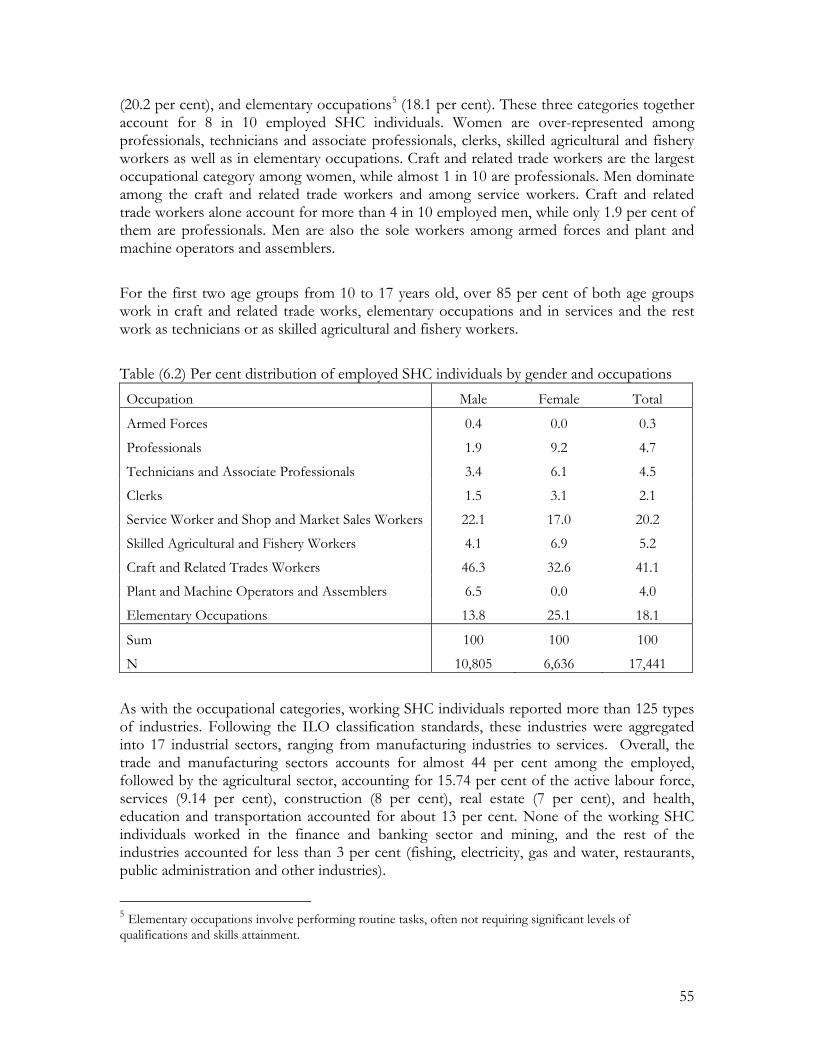
55
(20.2 per cent), and elementary occupations5 (18.1 per cent). These three categories together account for 8 in 10 employed SHC individuals. Women are over-represented among professionals, technicians and associate professionals, clerks, skilled agricultural and fishery workers as well as in elementary occupations. Craft and related trade workers are the largest occupational category among women, while almost 1 in 10 are professionals. Men dominate among the craft and related trade workers and among service workers. Craft and related trade workers alone account for more than 4 in 10 employed men, while only 1.9 per cent of them are professionals. Men are also the sole workers among armed forces and plant and machine operators and assemblers.
For the first two age groups from 10 to 17 years old, over 85 per cent of both age groups work in craft and related trade works, elementary occupations and in services and the rest work as technicians or as skilled agricultural and fishery workers.
Table (6.2) Per cent distribution of employed SHC individuals by gender and occupations Occupation Male Female Total
Armed Forces 0.4 0.0 0.3
Professionals 1.9 9.2 4.7
Technicians and Associate Professionals 3.4 6.1 4.5
Clerks 1.5 3.1 2.1
Service Worker and Shop and Market Sales Workers 22.1 17.0 20.2
Skilled Agricultural and Fishery Workers 4.1 6.9 5.2
Craft and Related Trades Workers 46.3 32.6 41.1
Plant and Machine Operators and Assemblers 6.5 0.0 4.0
Elementary Occupations 13.8 25.1 18.1
Sum 100 100 100
N 10,805 6,636 17,441
As with the occupational categories, working SHC individuals reported more than 125 types of industries. Following the ILO classification standards, these industries were aggregated into 17 industrial sectors, ranging from manufacturing industries to services. Overall, the trade and manufacturing sectors accounts for almost 44 per cent among the employed, followed by the agricultural sector, accounting for 15.74 per cent of the active labour force, services (9.14 per cent), construction (8 per cent), real estate (7 per cent), and health, education and transportation accounted for about 13 per cent. None of the working SHC individuals worked in the finance and banking sector and mining, and the rest of the industries accounted for less than 3 per cent (fishing, electricity, gas and water, restaurants, public administration and other industries).
5 Elementary occupations involve performing routine tasks, often not requiring significant levels of qualifications and skills attainment.
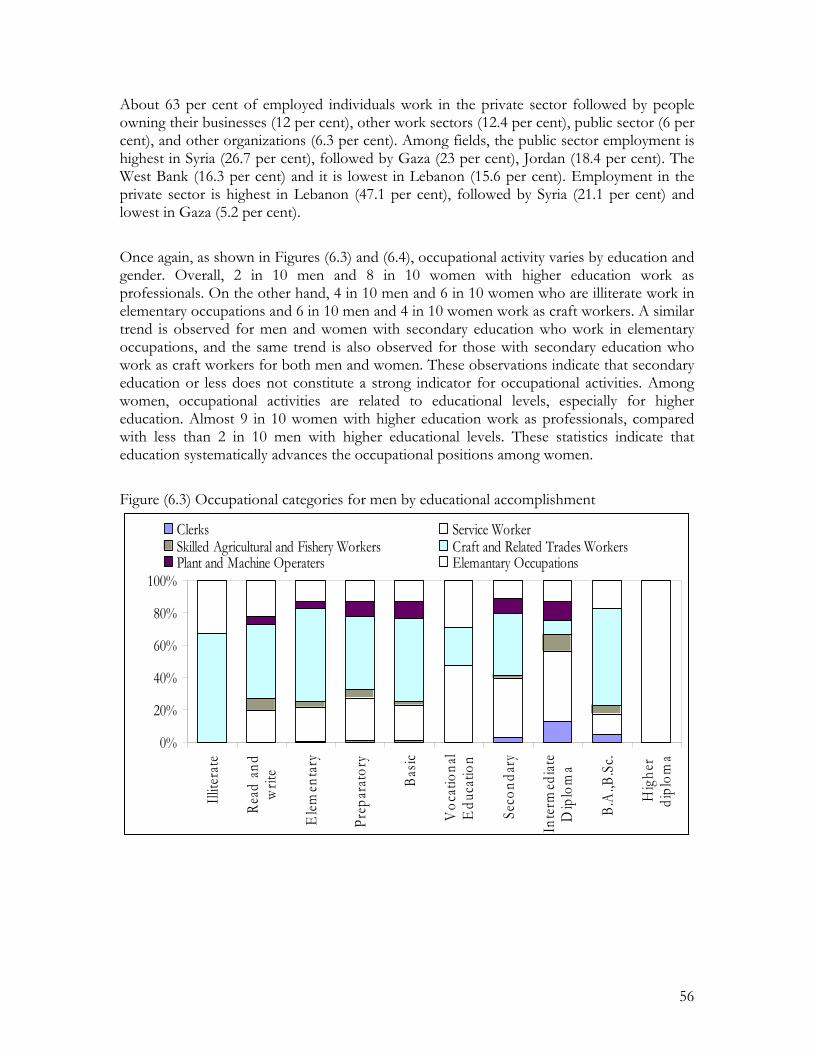
56
About 63 per cent of employed individuals work in the private sector followed by people owning their businesses (12 per cent), other work sectors (12.4 per cent), public sector (6 per cent), and other organizations (6.3 per cent). Among fields, the public sector employment is highest in Syria (26.7 per cent), followed by Gaza (23 per cent), Jordan (18.4 per cent). The West Bank (16.3 per cent) and it is lowest in Lebanon (15.6 per cent). Employment in the private sector is highest in Lebanon (47.1 per cent), followed by Syria (21.1 per cent) and lowest in Gaza (5.2 per cent).
Once again, as shown in Figures (6.3) and (6.4), occupational activity varies by education and gender. Overall, 2 in 10 men and 8 in 10 women with higher education work as professionals. On the other hand, 4 in 10 men and 6 in 10 women who are illiterate work in elementary occupations and 6 in 10 men and 4 in 10 women work as craft workers. A similar trend is observed for men and women with secondary education who work in elementary occupations, and the same trend is also observed for those with secondary education who work as craft workers for both men and women. These observations indicate that secondary education or less does not constitute a strong indicator for occupational activities. Among women, occupational activities are related to educational levels, especially for higher education. Almost 9 in 10 women with higher education work as professionals, compared with less than 2 in 10 men with higher educational levels. These statistics indicate that education systematically advances the occupational positions among women.
Figure (6.3) Occupational categories for men by educational accomplishment
0%
20%
40%
60%
80%
100%
Illite
rate
Read
and
writ
e
Elem
enta
ry
Prep
arat
ory
Basic
Voc
atio
nal
Edu
catio
n
Seco
ndar
y
Inte
rmed
iate
Dip
lom
a
B.A
.,B.S
c.
Hig
her
dipl
oma
Clerks Service WorkerSkilled Agricultural and Fishery Workers Craft and Related Trades WorkersPlant and Machine Operaters Elemantary Occupations
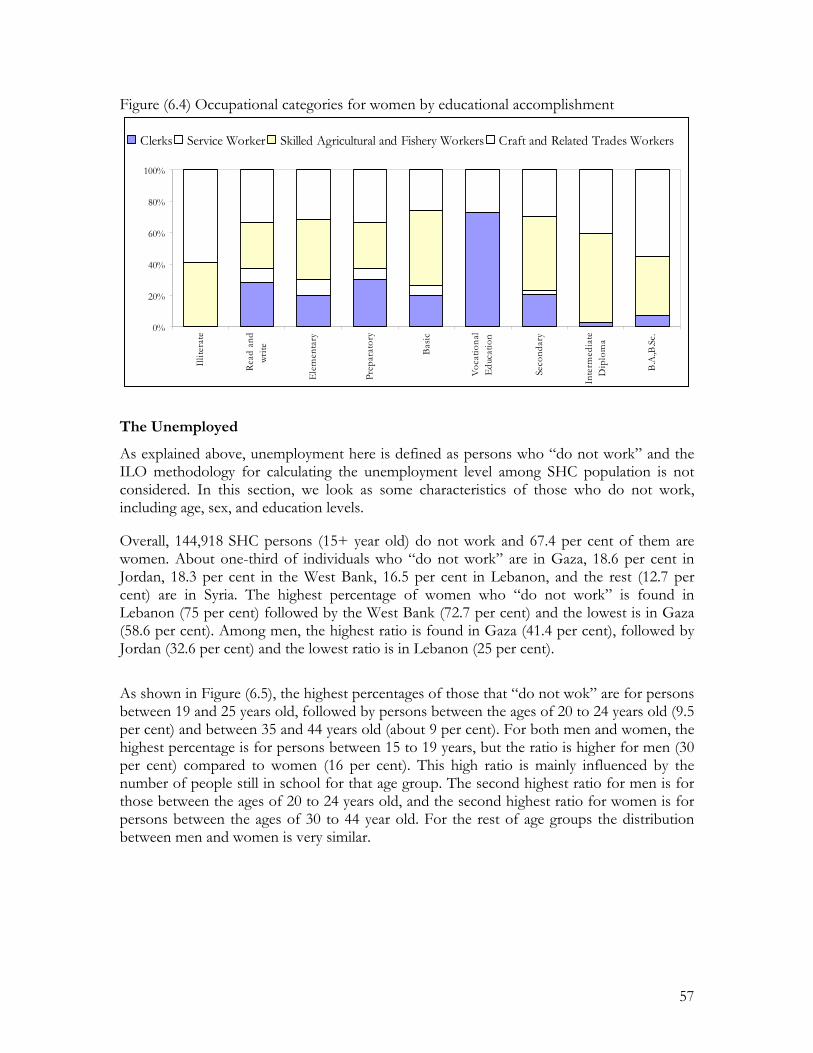
57
Figure (6.4) Occupational categories for women by educational accomplishment
0%
20%
40%
60%
80%
100%
Illite
rate
Read
and
write
Elem
enta
ry
Prep
arat
ory
Basic
Voca
tiona
lEd
ucat
ion
Seco
ndar
y
Inte
rmed
iate
Dip
lom
a
B.A.
,B.Sc
.
Clerks Service Worker Skilled Agricultural and Fishery Workers Craft and Related Trades Workers
The Unemployed
As explained above, unemployment here is defined as persons who “do not work” and the ILO methodology for calculating the unemployment level among SHC population is not considered. In this section, we look as some characteristics of those who do not work, including age, sex, and education levels. Overall, 144,918 SHC persons (15+ year old) do not work and 67.4 per cent of them are women. About one-third of individuals who “do not work” are in Gaza, 18.6 per cent in Jordan, 18.3 per cent in the West Bank, 16.5 per cent in Lebanon, and the rest (12.7 per cent) are in Syria. The highest percentage of women who “do not work” is found in Lebanon (75 per cent) followed by the West Bank (72.7 per cent) and the lowest is in Gaza (58.6 per cent). Among men, the highest ratio is found in Gaza (41.4 per cent), followed by Jordan (32.6 per cent) and the lowest ratio is in Lebanon (25 per cent).
As shown in Figure (6.5), the highest percentages of those that “do not wok” are for persons between 19 and 25 years old, followed by persons between the ages of 20 to 24 years old (9.5 per cent) and between 35 and 44 years old (about 9 per cent). For both men and women, the highest percentage is for persons between 15 to 19 years, but the ratio is higher for men (30 per cent) compared to women (16 per cent). This high ratio is mainly influenced by the number of people still in school for that age group. The second highest ratio for men is for those between the ages of 20 to 24 years old, and the second highest ratio for women is for persons between the ages of 30 to 44 year old. For the rest of age groups the distribution between men and women is very similar.

58
Figure (6.5) Number of persons who do not work by age groups and gender
02000400060008000
1000012000140001600018000
15 -19
20 -24
25 -29
30 -34
35 -39
40 -44
45 -49
50 -54
55 -59
60 -64
65 -69
70 -74
75 -79
80+
Number of persons
Male Female
The majority of those who “do not work” have never worked before (83.2 per cent). Almost 67.8 per cent of all persons that have worked before started working the first time when they were less than 20 years old, and out of those 29 per cent started working below the age of 15 years old. Moreover, out of the 16.8 per cent of persons who did not work before, 13.5 per cent have no skills, and only 3.3 per cent have some kind of a skill. The majority (65 per cent) have skills in occupations related to craft and related trades, 10 per cent in occupations related to technicians and associate professionals, 8 per cent in services and shop market sales, 6.6 per cent in elementary occupations, 4.3 per cent in plant and machine operators and assemblers, and the rest are either skilled agricultural and fishery workers or clerks.
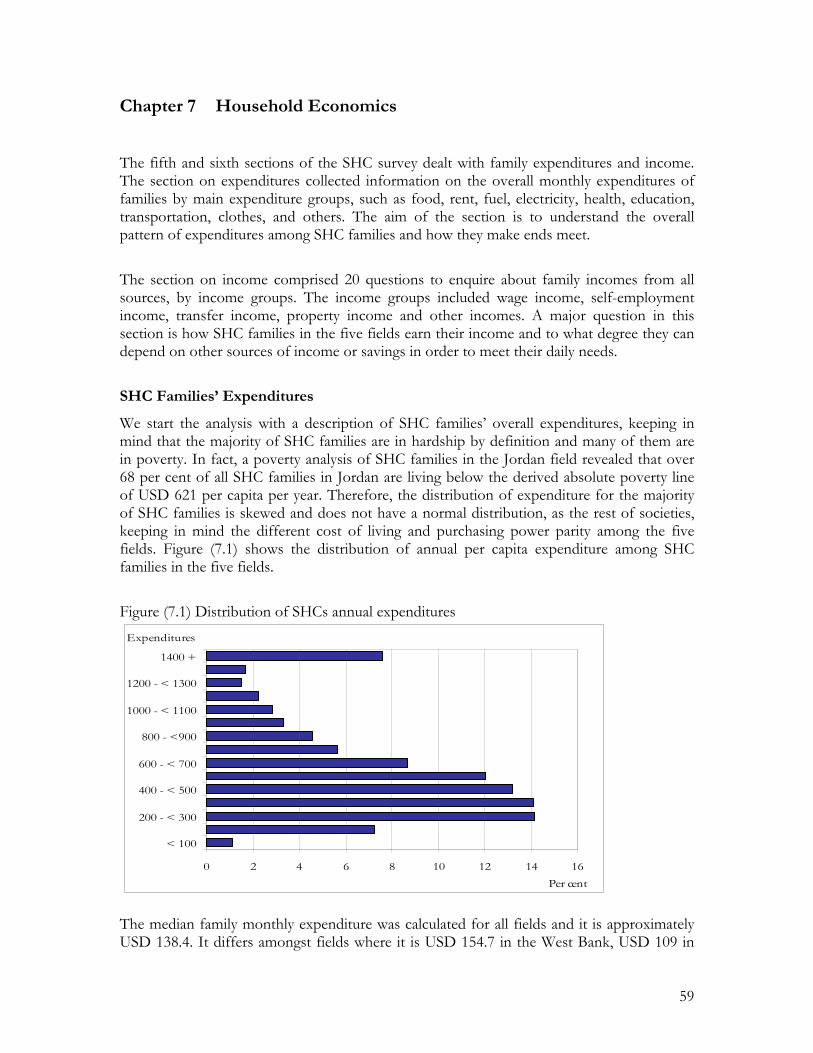
59
Chapter 7 Household Economics
The fifth and sixth sections of the SHC survey dealt with family expenditures and income. The section on expenditures collected information on the overall monthly expenditures of families by main expenditure groups, such as food, rent, fuel, electricity, health, education, transportation, clothes, and others. The aim of the section is to understand the overall pattern of expenditures among SHC families and how they make ends meet.
The section on income comprised 20 questions to enquire about family incomes from all sources, by income groups. The income groups included wage income, self-employment income, transfer income, property income and other incomes. A major question in this section is how SHC families in the five fields earn their income and to what degree they can depend on other sources of income or savings in order to meet their daily needs.
SHC Families’ Expenditures
We start the analysis with a description of SHC families’ overall expenditures, keeping in mind that the majority of SHC families are in hardship by definition and many of them are in poverty. In fact, a poverty analysis of SHC families in the Jordan field revealed that over 68 per cent of all SHC families in Jordan are living below the derived absolute poverty line of USD 621 per capita per year. Therefore, the distribution of expenditure for the majority of SHC families is skewed and does not have a normal distribution, as the rest of societies, keeping in mind the different cost of living and purchasing power parity among the five fields. Figure (7.1) shows the distribution of annual per capita expenditure among SHC families in the five fields.
Figure (7.1) Distribution of SHCs annual expenditures
0 2 4 6 8 10 12 14 16
< 100
200 - < 300
400 - < 500
600 - < 700
800 - <900
1000 - < 1100
1200 - < 1300
1400 +
Expenditures
Per cent The median family monthly expenditure was calculated for all fields and it is approximately USD 138.4. It differs amongst fields where it is USD 154.7 in the West Bank, USD 109 in
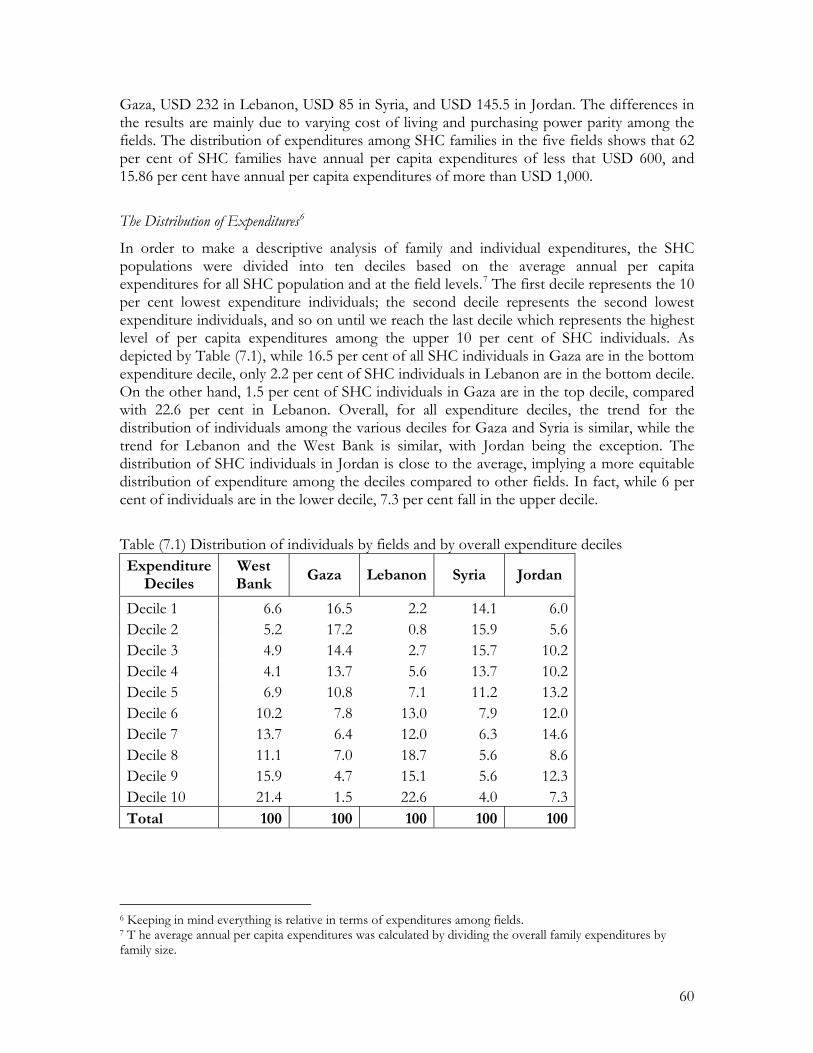
60
Gaza, USD 232 in Lebanon, USD 85 in Syria, and USD 145.5 in Jordan. The differences in the results are mainly due to varying cost of living and purchasing power parity among the fields. The distribution of expenditures among SHC families in the five fields shows that 62 per cent of SHC families have annual per capita expenditures of less that USD 600, and 15.86 per cent have annual per capita expenditures of more than USD 1,000.
The Distribution of Expenditures6
In order to make a descriptive analysis of family and individual expenditures, the SHC populations were divided into ten deciles based on the average annual per capita expenditures for all SHC population and at the field levels.7 The first decile represents the 10 per cent lowest expenditure individuals; the second decile represents the second lowest expenditure individuals, and so on until we reach the last decile which represents the highest level of per capita expenditures among the upper 10 per cent of SHC individuals. As depicted by Table (7.1), while 16.5 per cent of all SHC individuals in Gaza are in the bottom expenditure decile, only 2.2 per cent of SHC individuals in Lebanon are in the bottom decile. On the other hand, 1.5 per cent of SHC individuals in Gaza are in the top decile, compared with 22.6 per cent in Lebanon. Overall, for all expenditure deciles, the trend for the distribution of individuals among the various deciles for Gaza and Syria is similar, while the trend for Lebanon and the West Bank is similar, with Jordan being the exception. The distribution of SHC individuals in Jordan is close to the average, implying a more equitable distribution of expenditure among the deciles compared to other fields. In fact, while 6 per cent of individuals are in the lower decile, 7.3 per cent fall in the upper decile.
Table (7.1) Distribution of individuals by fields and by overall expenditure deciles Expenditure
Deciles West Bank
Gaza Lebanon Syria Jordan
Decile 1 6.6 16.5 2.2 14.1 6.0Decile 2 5.2 17.2 0.8 15.9 5.6Decile 3 4.9 14.4 2.7 15.7 10.2Decile 4 4.1 13.7 5.6 13.7 10.2Decile 5 6.9 10.8 7.1 11.2 13.2Decile 6 10.2 7.8 13.0 7.9 12.0Decile 7 13.7 6.4 12.0 6.3 14.6Decile 8 11.1 7.0 18.7 5.6 8.6Decile 9 15.9 4.7 15.1 5.6 12.3Decile 10 21.4 1.5 22.6 4.0 7.3Total 100 100 100 100 100
6 Keeping in mind everything is relative in terms of expenditures among fields. 7 T he average annual per capita expenditures was calculated by dividing the overall family expenditures by family size.
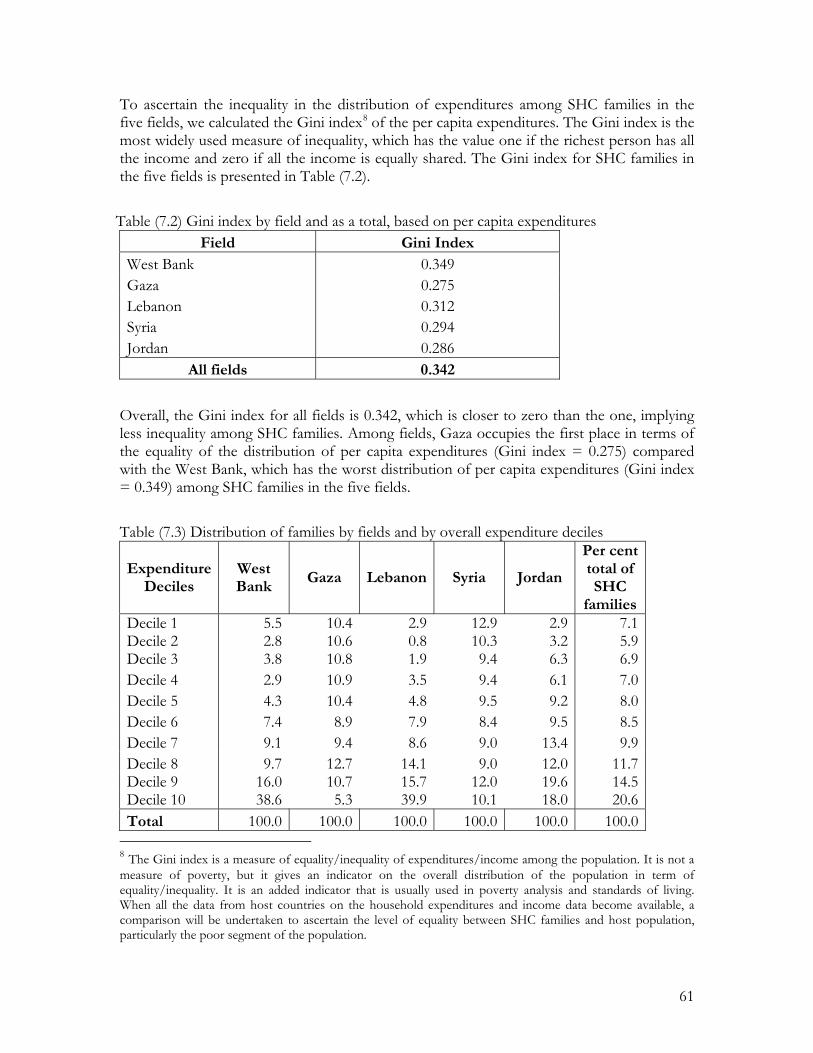
61
To ascertain the inequality in the distribution of expenditures among SHC families in the five fields, we calculated the Gini index8 of the per capita expenditures. The Gini index is the most widely used measure of inequality, which has the value one if the richest person has all the income and zero if all the income is equally shared. The Gini index for SHC families in the five fields is presented in Table (7.2).
Table (7.2) Gini index by field and as a total, based on per capita expenditures Field Gini Index
West Bank 0.349 Gaza 0.275 Lebanon 0.312 Syria 0.294 Jordan 0.286
All fields 0.342
Overall, the Gini index for all fields is 0.342, which is closer to zero than the one, implying less inequality among SHC families. Among fields, Gaza occupies the first place in terms of the equality of the distribution of per capita expenditures (Gini index = 0.275) compared with the West Bank, which has the worst distribution of per capita expenditures (Gini index = 0.349) among SHC families in the five fields.
Table (7.3) Distribution of families by fields and by overall expenditure deciles
Expenditure Deciles
West Bank
Gaza Lebanon Syria Jordan
Per cent total of SHC
families Decile 1 5.5 10.4 2.9 12.9 2.9 7.1 Decile 2 2.8 10.6 0.8 10.3 3.2 5.9 Decile 3 3.8 10.8 1.9 9.4 6.3 6.9 Decile 4 2.9 10.9 3.5 9.4 6.1 7.0 Decile 5 4.3 10.4 4.8 9.5 9.2 8.0 Decile 6 7.4 8.9 7.9 8.4 9.5 8.5 Decile 7 9.1 9.4 8.6 9.0 13.4 9.9 Decile 8 9.7 12.7 14.1 9.0 12.0 11.7 Decile 9 16.0 10.7 15.7 12.0 19.6 14.5 Decile 10 38.6 5.3 39.9 10.1 18.0 20.6 Total 100.0 100.0 100.0 100.0 100.0 100.0
8 The Gini index is a measure of equality/inequality of expenditures/income among the population. It is not a measure of poverty, but it gives an indicator on the overall distribution of the population in term of equality/inequality. It is an added indicator that is usually used in poverty analysis and standards of living. When all the data from host countries on the household expenditures and income data become available, a comparison will be undertaken to ascertain the level of equality between SHC families and host population, particularly the poor segment of the population.

62
The distribution of families by deciles differs from that of individuals (Table 7.3). While, 7.1 per cent of all SHC families in the five fields fall in the first decile, 20.6 per cent of families fall in the upper decile. In fact, 13 per cent of all SHC families fall in the first quintile (first two deciles), compared with 35.1 per cent falling in the top quintile. Overall, these results point to the large family size among the lower expenditure SHC families. However, there seems to be discrepancies among fields. While, 12.9 per cent of SHC families in Syria fall in the first expenditure decile, only 2.9 per cent of SHC families are in the first decile in Lebanon and Jordan. On the other hand, the highest percentage for families falling in the top decile is recorded for Lebanon (39.9 per cent) and the West Bank (38.6 per cent). As depicted by Figure (7.2), the highest total monthly family expenditures, as reported by SHC families, are in Lebanon, where the average is around USD 250, and the lowest is in Syria USD 96.4. Overall, the average total monthly family expenditures for all fields combined is around USD 162. When these averages are calculated on a per capita basis, the results change significantly, where the highest average is still in Lebanon (USD 58.8) and the lowest per capita average expenditures is in Gaza (USD 27.9). To get a better idea of the overall expenditure levels and its distribution among fields, the share of each decile from the overall expenditures level is calculated for all SHC population and at the field level. The poorest decile accounts only for 3 per cent of all expenditures, compared with the top decile, which accounts for 27.9 per cent of expenditures. In fact, the top two expenditure deciles account for around 42.8 per cent of all expenditures, compared with 7.3 per cent for the lower two expenditure deciles, keeping in mind that the overall SHC population in the five fields combined are divided into deciles. Among fields, the results change slightly, where the lowest ratio for the first decile is recorded for the West Bank (2.4 per cent) and the highest is in Syria (4 per cent). In comparison, the highest ratio for the top decile is recorded for the West Bank (27.3 per cent) and the lowest is in Gaza (21.9 per cent).
Figure (7.2) Average monthly family expenditures by field
188.2
131.3
249.9
96.4
153.6
0 50 100 150 200 250 300
West Bank
Gaza
Lebanon
Syria
Jordan
USD (Monthly)

63
Overall Expenditures by Expenditure Groups
The distribution of total expenditures by expenditure groups reveals that 47.9 per cent of total expenditures is spent on food and water (3 per cent of total expenditures are only spent on water), with the highest recorded in Syria (55.7 per cent) and the lowest is in the West Bank (45 per cent). The expenditures on food and water are followed by expenditures on health (9.4 per cent), clothes (7.8 per cent), fuel (7.4 per cent), transportation (6.2 per cent) and the lowest is spent on telecommunications (1.7 per cent). Table (7.3) presents the per cent distribution of expenditure groups by field and as a total. What is interesting to note in the table is that the highest percentage on health is in Lebanon (14.5 per cent) compared with 6.4 per cent in Gaza. The high percentage of expenditures on health in Lebanon, as well be explained later, is mainly due to the absence of health insurance among SHC families. The expenditures on health are supported by the possession of health insurance, in which, as stated in chapter five, the majority of SHC families in Gaza have access to public health insurance, compared with a small fraction of SHC families in Lebanon, as pointed out in Table (5.8).
The results also point to field-specific characteristics in terms of expenditures on rent, which is highest in Jordan (7.9 per cent); electricity, clothes, education, and other expenditures. In fact, the expenditures on electricity in the West Bank are more than twice the expenditures on the same item in Gaza, Syria and Lebanon.
Table (7.4) Per cent distribution of average monthly expenditures by expenditure group and by field Expenditure Group West Bank Gaza Lebanon Syria Jordan Total Rent 2.6 1.5 3.5 3.5 7.9 3.7 Electricity 10.4 3.7 4.5 4.3 5.5 5.7 Fuel 6.7 8.3 6.6 7.7 8.1 7.4 Food 45.0 48.9 47.1 55.7 47.1 47.9 Clothes 9.3 10.5 5.1 6.3 7.5 7.8 Education 6.1 8.6 4.4 2.9 5.9 5.9 Health 8.5 6.3 14.5 10.5 6.5 9.4 Transportation 6.6 7.9 4.6 4.5 6.6 6.2 Telecommunication 1.9 1.5 1.7 1.4 1.9 1.7 Other 2.8 2.8 8.0 3.2 2.9 4.3 Total 100 100 100 100 100 100
SHC Families’ Income
All SHC families interviewed in the SHC survey were asked about the total monthly income from all sources. Respondents were asked to report the exact figures of income by income source. Figure (7.3) shows the distribution of per capita annual income and indicates that the median monthly income of SHC families is around USD 121. The median monthly family income differs widely amongst fields, where it is highest in Lebanon (USD 219), followed by Jordan (USD 157), Gaza (USD 112), Syria (USD 80.3) and it is lowest in the West Bank

64
(USD 74.4). We have to state here once again, that the income among SHC families in different fields is manly due to the different cost of living and purchasing power parity. The results on median monthly incomes are similar to the median monthly expenditures for all fields, except for the West Bank, where the reported income is approximately less than one-half of reported expenditures. It is to be noted that, in general, income is always under reported and expenditures are always over reported, not just among SHC families, but also on national levels.
The Distribution of Incomes
The analysis on the distribution of annual per capita income indicates that more than 68 per cent of SHC individuals have annual income of less than USD 600, and only 10 per cent have annual income of more than USD 1000. The median per capita monthly income ranges form USD 28 in Syria to USD 54.5 in Lebanon, with a median of USD 37.6 for all fields combined. However, the average monthly per capita income is higher then the median by almost USD 8.6 and the ranking of fields in terms of the average income differs from that for the median.
Figure (7.3) Distribution of per capita annual income (USD)
0 5 10 15 20
< 100
200 - < 300
400 - < 500
600 - < 700
800 - <900
1000 +
Income (USD)
Per cent
Again, as in the distribution of expenditures, the Gini index was calculated for SHC families in the five fields based on per capita income, to examine the inequality or otherwise among SHC families. The Gini index for SHC families, based on per capita income in the five fields is presented in Table (7.5).
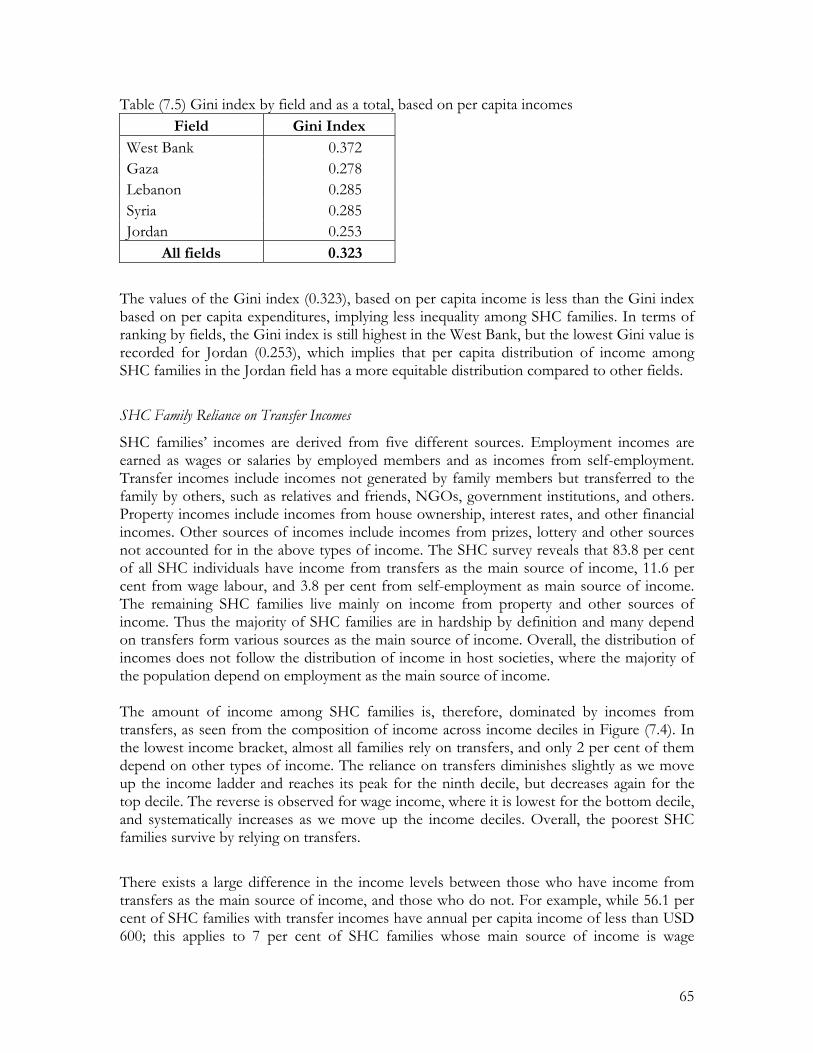
65
Table (7.5) Gini index by field and as a total, based on per capita incomes Field Gini Index
West Bank 0.372 Gaza 0.278 Lebanon 0.285 Syria 0.285 Jordan 0.253
All fields 0.323
The values of the Gini index (0.323), based on per capita income is less than the Gini index based on per capita expenditures, implying less inequality among SHC families. In terms of ranking by fields, the Gini index is still highest in the West Bank, but the lowest Gini value is recorded for Jordan (0.253), which implies that per capita distribution of income among SHC families in the Jordan field has a more equitable distribution compared to other fields.
SHC Family Reliance on Transfer Incomes
SHC families’ incomes are derived from five different sources. Employment incomes are earned as wages or salaries by employed members and as incomes from self-employment. Transfer incomes include incomes not generated by family members but transferred to the family by others, such as relatives and friends, NGOs, government institutions, and others. Property incomes include incomes from house ownership, interest rates, and other financial incomes. Other sources of incomes include incomes from prizes, lottery and other sources not accounted for in the above types of income. The SHC survey reveals that 83.8 per cent of all SHC individuals have income from transfers as the main source of income, 11.6 per cent from wage labour, and 3.8 per cent from self-employment as main source of income. The remaining SHC families live mainly on income from property and other sources of income. Thus the majority of SHC families are in hardship by definition and many depend on transfers form various sources as the main source of income. Overall, the distribution of incomes does not follow the distribution of income in host societies, where the majority of the population depend on employment as the main source of income. The amount of income among SHC families is, therefore, dominated by incomes from transfers, as seen from the composition of income across income deciles in Figure (7.4). In the lowest income bracket, almost all families rely on transfers, and only 2 per cent of them depend on other types of income. The reliance on transfers diminishes slightly as we move up the income ladder and reaches its peak for the ninth decile, but decreases again for the top decile. The reverse is observed for wage income, where it is lowest for the bottom decile, and systematically increases as we move up the income deciles. Overall, the poorest SHC families survive by relying on transfers.
There exists a large difference in the income levels between those who have income from transfers as the main source of income, and those who do not. For example, while 56.1 per cent of SHC families with transfer incomes have annual per capita income of less than USD 600; this applies to 7 per cent of SHC families whose main source of income is wage
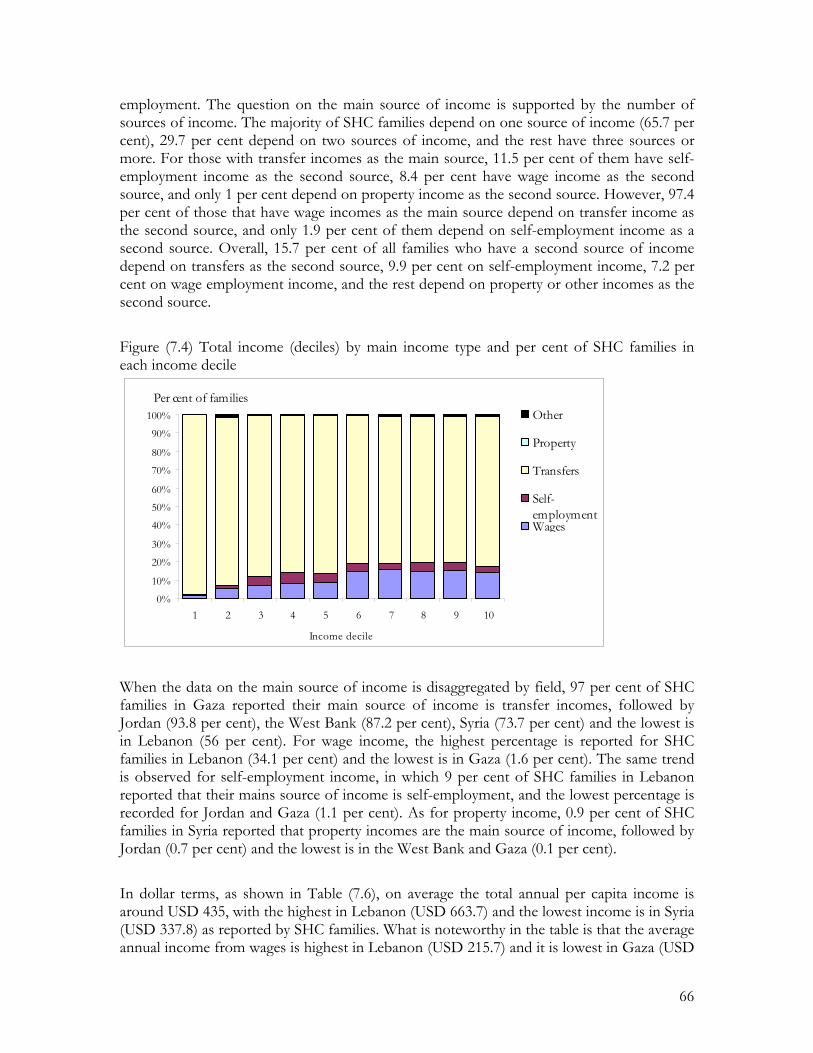
66
employment. The question on the main source of income is supported by the number of sources of income. The majority of SHC families depend on one source of income (65.7 per cent), 29.7 per cent depend on two sources of income, and the rest have three sources or more. For those with transfer incomes as the main source, 11.5 per cent of them have self-employment income as the second source, 8.4 per cent have wage income as the second source, and only 1 per cent depend on property income as the second source. However, 97.4 per cent of those that have wage incomes as the main source depend on transfer income as the second source, and only 1.9 per cent of them depend on self-employment income as a second source. Overall, 15.7 per cent of all families who have a second source of income depend on transfers as the second source, 9.9 per cent on self-employment income, 7.2 per cent on wage employment income, and the rest depend on property or other incomes as the second source.
Figure (7.4) Total income (deciles) by main income type and per cent of SHC families in each income decile
Per cent of families
0%
10%
20%
30%
40%
50%
60%
70%
80%
90%
100%
1 2 3 4 5 6 7 8 9 10
Income decile
Other
Property
Transfers
Self-employmentWages
When the data on the main source of income is disaggregated by field, 97 per cent of SHC families in Gaza reported their main source of income is transfer incomes, followed by Jordan (93.8 per cent), the West Bank (87.2 per cent), Syria (73.7 per cent) and the lowest is in Lebanon (56 per cent). For wage income, the highest percentage is reported for SHC families in Lebanon (34.1 per cent) and the lowest is in Gaza (1.6 per cent). The same trend is observed for self-employment income, in which 9 per cent of SHC families in Lebanon reported that their mains source of income is self-employment, and the lowest percentage is recorded for Jordan and Gaza (1.1 per cent). As for property income, 0.9 per cent of SHC families in Syria reported that property incomes are the main source of income, followed by Jordan (0.7 per cent) and the lowest is in the West Bank and Gaza (0.1 per cent).
In dollar terms, as shown in Table (7.6), on average the total annual per capita income is around USD 435, with the highest in Lebanon (USD 663.7) and the lowest income is in Syria (USD 337.8) as reported by SHC families. What is noteworthy in the table is that the average annual income from wages is highest in Lebanon (USD 215.7) and it is lowest in Gaza (USD

67
12.1). The same trend is also observed for self-employment. The figures on incomes from wages and self-employment clearly indicate that SHC families work on an irregular basis and in occupations that do not pay high wages. In fact, even in Lebanon where the incomes from wages are the highest, the average per capita monthly income derived from wages is around USD 18.
Table (7.6) Average annual per capita total income by source of income (USD)
Source of Income West Bank
Gaza Lebanon Syria Jordan Total
Wage income 64.6 12.1 215.7 66.6 36.8 69.6 Self-employment 24.3 12.0 65.4 32.2 16.7 27.2 Transfer income 344.2 316.9 374.6 229.0 449.6 347.0
Property income 0.5 0.5 5.1 4.2 6.9 3.0
Other income 1.4 2.1 2.9 5.7 1.4 2.4
Total income 435.1 343.5 663.7 337.8 511.4 449.3 As for transfer incomes, the highest amount of annual income is reported for SHC families in Jordan (USD 449.6), and the lowest is reported for Syria. Part of the explanation for high transfer incomes in Jordan maybe the transfers provided by the National Aid Fund (NAF), which on average allocates USD 37 per capita per month, up to USD 220 for a family of six persons. These transfers are provided to families living in hardship based on predetermined criteria. Just like other Jordanians, the refugees benefit from the assistance provided by the NAF.
Since transfer incomes are the major source of income for SHC families in the five fields, the distribution of transfer incomes by source of income is considered next. The main sources of transfer incomes for SHC families in the five fields are transfers from UNRWA (23.6 per cent), support from family or relatives (21.6 per cent), transfers from governments (16.4 per cent), with the rest of transfers derived from NGOs, private organizations, social security entitlements, retirement pensions, gifts in kind, and other sources. The highest percentage for transfer from family or relatives is recorded in the West Bank (29.3 per cent) followed by Lebanon (24.8 per cent) with the lowest in Jordan (15.1 per cent). As for UNRWA assistance, the highest is reported for Gaza (31.9 per cent) and the lowest is in Lebanon (17.1 per cent). The highest transfer incomes from governments are reported in Jordan (33.4 per cent) followed by Gaza (25.8 per cent) with the lowest in Lebanon (0.2 per cent). Again the former results are due to the assistance provided by the NAF in Jordan and Ministry of Social Affairs in Gaza, as shown in Table 7.7.
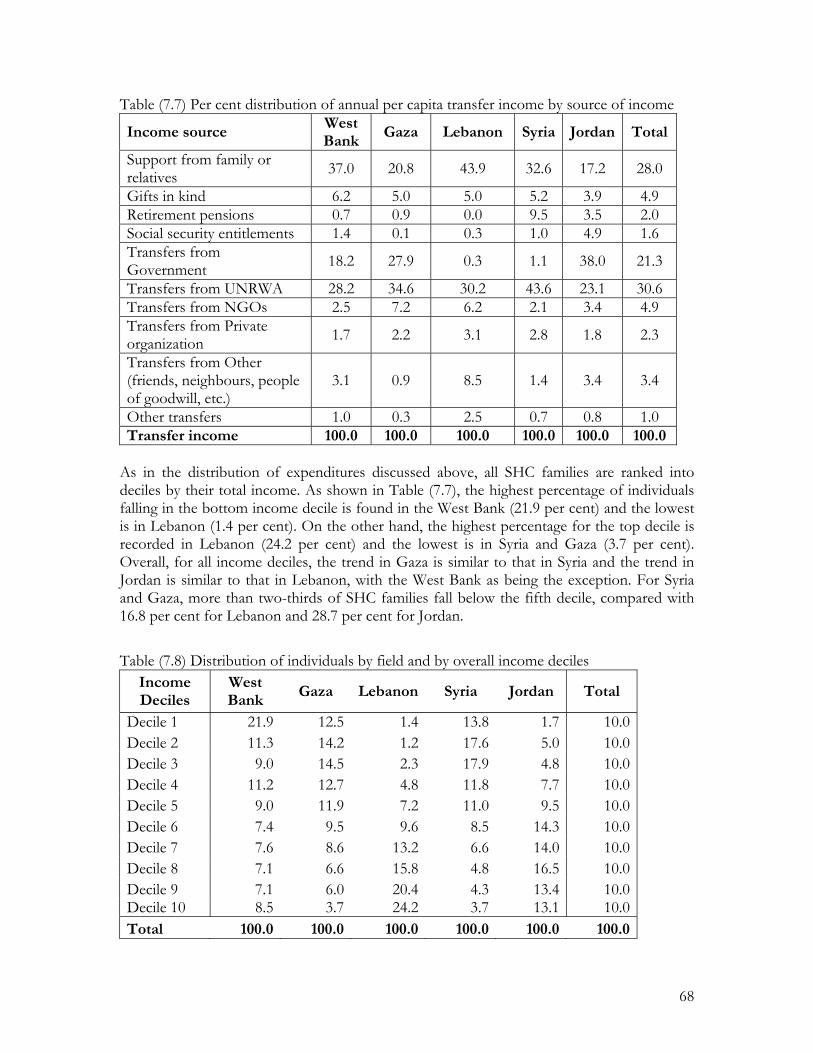
68
Table (7.7) Per cent distribution of annual per capita transfer income by source of income
Income source West Bank
Gaza Lebanon Syria Jordan Total
Support from family or relatives 37.0 20.8 43.9 32.6 17.2 28.0
Gifts in kind 6.2 5.0 5.0 5.2 3.9 4.9 Retirement pensions 0.7 0.9 0.0 9.5 3.5 2.0 Social security entitlements 1.4 0.1 0.3 1.0 4.9 1.6 Transfers from Government 18.2 27.9 0.3 1.1 38.0 21.3
Transfers from UNRWA 28.2 34.6 30.2 43.6 23.1 30.6 Transfers from NGOs 2.5 7.2 6.2 2.1 3.4 4.9 Transfers from Private organization 1.7 2.2 3.1 2.8 1.8 2.3
Transfers from Other (friends, neighbours, people of goodwill, etc.)
3.1 0.9 8.5 1.4 3.4 3.4
Other transfers 1.0 0.3 2.5 0.7 0.8 1.0 Transfer income 100.0 100.0 100.0 100.0 100.0 100.0
As in the distribution of expenditures discussed above, all SHC families are ranked into deciles by their total income. As shown in Table (7.7), the highest percentage of individuals falling in the bottom income decile is found in the West Bank (21.9 per cent) and the lowest is in Lebanon (1.4 per cent). On the other hand, the highest percentage for the top decile is recorded in Lebanon (24.2 per cent) and the lowest is in Syria and Gaza (3.7 per cent). Overall, for all income deciles, the trend in Gaza is similar to that in Syria and the trend in Jordan is similar to that in Lebanon, with the West Bank as being the exception. For Syria and Gaza, more than two-thirds of SHC families fall below the fifth decile, compared with 16.8 per cent for Lebanon and 28.7 per cent for Jordan.
Table (7.8) Distribution of individuals by field and by overall income deciles Income Deciles
West Bank
Gaza Lebanon Syria Jordan Total
Decile 1 21.9 12.5 1.4 13.8 1.7 10.0 Decile 2 11.3 14.2 1.2 17.6 5.0 10.0 Decile 3 9.0 14.5 2.3 17.9 4.8 10.0 Decile 4 11.2 12.7 4.8 11.8 7.7 10.0 Decile 5 9.0 11.9 7.2 11.0 9.5 10.0 Decile 6 7.4 9.5 9.6 8.5 14.3 10.0 Decile 7 7.6 8.6 13.2 6.6 14.0 10.0 Decile 8 7.1 6.6 15.8 4.8 16.5 10.0 Decile 9 7.1 6.0 20.4 4.3 13.4 10.0 Decile 10 8.5 3.7 24.2 3.7 13.1 10.0 Total 100.0 100.0 100.0 100.0 100.0 100.0
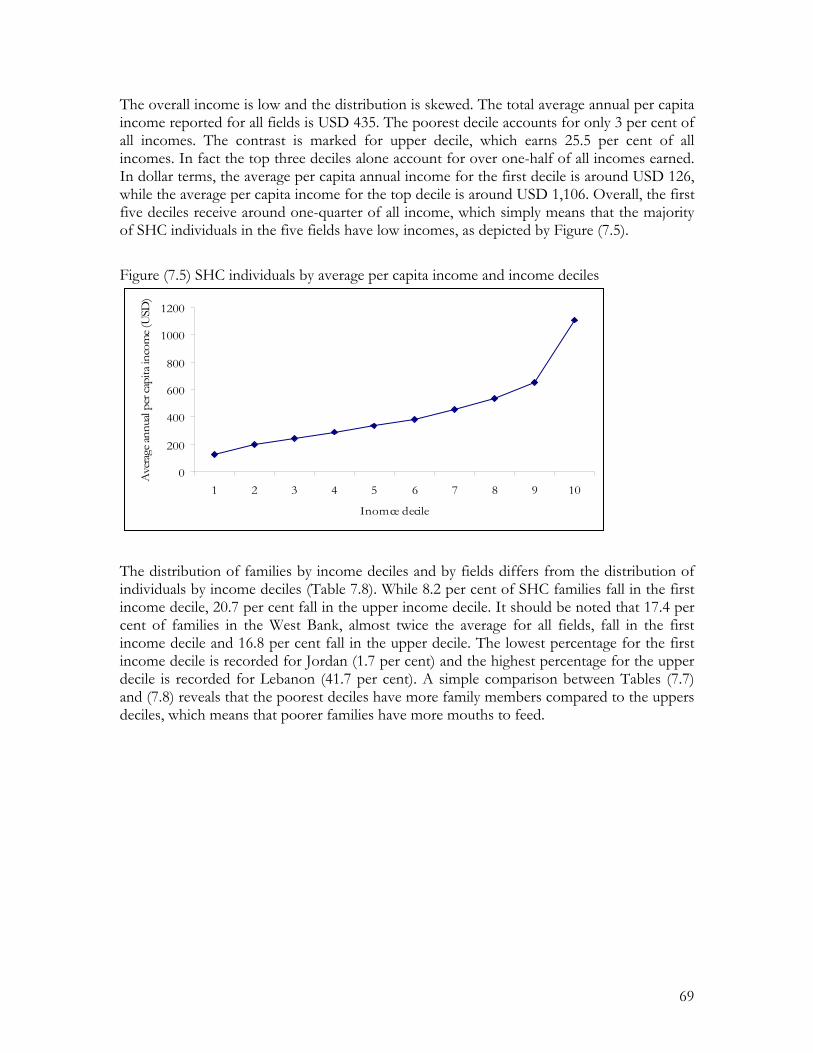
69
The overall income is low and the distribution is skewed. The total average annual per capita income reported for all fields is USD 435. The poorest decile accounts for only 3 per cent of all incomes. The contrast is marked for upper decile, which earns 25.5 per cent of all incomes. In fact the top three deciles alone account for over one-half of all incomes earned. In dollar terms, the average per capita annual income for the first decile is around USD 126, while the average per capita income for the top decile is around USD 1,106. Overall, the first five deciles receive around one-quarter of all income, which simply means that the majority of SHC individuals in the five fields have low incomes, as depicted by Figure (7.5).
Figure (7.5) SHC individuals by average per capita income and income deciles
0
200
400
600
800
1000
1200
1 2 3 4 5 6 7 8 9 10
Inomce decile
Ave
rage
annu
al pe
r cap
ita in
com
e (U
SD)
The distribution of families by income deciles and by fields differs from the distribution of individuals by income deciles (Table 7.8). While 8.2 per cent of SHC families fall in the first income decile, 20.7 per cent fall in the upper income decile. It should be noted that 17.4 per cent of families in the West Bank, almost twice the average for all fields, fall in the first income decile and 16.8 per cent fall in the upper decile. The lowest percentage for the first income decile is recorded for Jordan (1.7 per cent) and the highest percentage for the upper decile is recorded for Lebanon (41.7 per cent). A simple comparison between Tables (7.7) and (7.8) reveals that the poorest deciles have more family members compared to the uppers deciles, which means that poorer families have more mouths to feed.

70
Table (7.9) Per cent distribution of families by overall income deciles and by field Income Deciles
West Bank Gaza Lebanon Syria Jordan All
Decile 1 17.4 8.2 2.2 12.7 1.7 8.2 Decile 2 8.8 8.2 1.2 13.2 2.6 6.7 Decile 3 5.6 10.6 1.8 10.7 2.6 6.6 Decile 4 11.6 9.2 2.7 8.6 4.7 7.5 Decile 5 6.6 11.2 4.5 11.8 6.1 8.3 Decile 6 8 8.8 6.9 6.7 9.4 8.2 Decile 7 8.3 11.2 9.1 9.2 10.4 9.8 Decile 8 8.2 10.6 11.5 9.6 15.6 11.2 Decile 9 8.7 11 18.4 8.1 18.6 13 Decile 10 16.8 11 41.7 9.5 28.3 20.7 Total 100 100 100 100 100 100
Distribution of Income by Categories
While we have so far focused on income type, this section considers income type and the various categories of SHC families. While 95.1 per cent of SHC families in the “I” category rely on transfers as their main source of income, only 52.3 per cent of the “Z” category rely on transfer income as their main source of income. As far as wage income is concerned, more than one-third (38.3 per cent) of SHC families in the “Z” category depend on wages and 22.1 per cent of the “C” category rely on wages as the main source of income, as shown in Table (7.9). In addition to income types, a further analysis on categories by income deciles is undertaken. Overall, 8.3 per cent of SHC families in the “A” category are found in the bottom income decile, they represent 41.4 per cent of all families in the bottom decile, followed by the “M” category (28.7 per cent) and the lowest is in the “W” category (1.48 per cent). On the other hand, while 41.6 per cent of all SHC families in the “O” (orphans) category are found in the top decile (the highest amongst all categories), they only represent 3.1 per cent of all SHC families in the top decile. The same trend is also observed for “I” (dependent of the imprisoned) category, where 32.5 per cent of them are in the top decile, but they represent only 2 per cent of all SHC families in the top decile. The variations in the distribution of SHC families by income decile and by category indicate that more than 70 per cent of SHC families in the bottom decile are mostly from the “A” and the “M” categories. As for the top decile, the majority (80 per cent) of SHC families are from the “A” and the “W” categories. It is interesting to note that none of the SHC families in the “C” category are found in the top four deciles. The “C” category is only found in Syria, as revealed by the results of the survey.
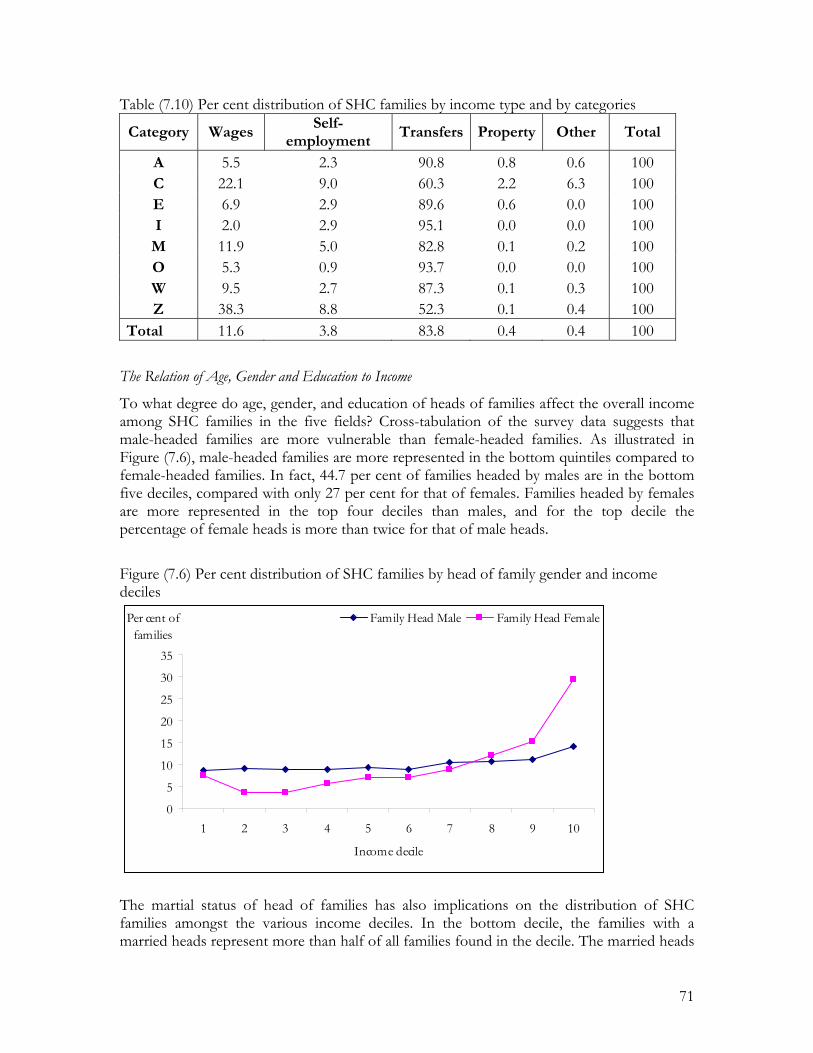
71
Table (7.10) Per cent distribution of SHC families by income type and by categories
Category Wages Self-
employment Transfers Property Other Total
A 5.5 2.3 90.8 0.8 0.6 100 C 22.1 9.0 60.3 2.2 6.3 100 E 6.9 2.9 89.6 0.6 0.0 100 I 2.0 2.9 95.1 0.0 0.0 100
M 11.9 5.0 82.8 0.1 0.2 100 O 5.3 0.9 93.7 0.0 0.0 100 W 9.5 2.7 87.3 0.1 0.3 100 Z 38.3 8.8 52.3 0.1 0.4 100
Total 11.6 3.8 83.8 0.4 0.4 100
The Relation of Age, Gender and Education to Income
To what degree do age, gender, and education of heads of families affect the overall income among SHC families in the five fields? Cross-tabulation of the survey data suggests that male-headed families are more vulnerable than female-headed families. As illustrated in Figure (7.6), male-headed families are more represented in the bottom quintiles compared to female-headed families. In fact, 44.7 per cent of families headed by males are in the bottom five deciles, compared with only 27 per cent for that of females. Families headed by females are more represented in the top four deciles than males, and for the top decile the percentage of female heads is more than twice for that of male heads.
Figure (7.6) Per cent distribution of SHC families by head of family gender and income deciles
0
5
10
15
20
25
30
35
1 2 3 4 5 6 7 8 9 10
Income decile
Per cent of families
Family Head Male Family Head Female
The martial status of head of families has also implications on the distribution of SHC families amongst the various income deciles. In the bottom decile, the families with a married heads represent more than half of all families found in the decile. The married heads
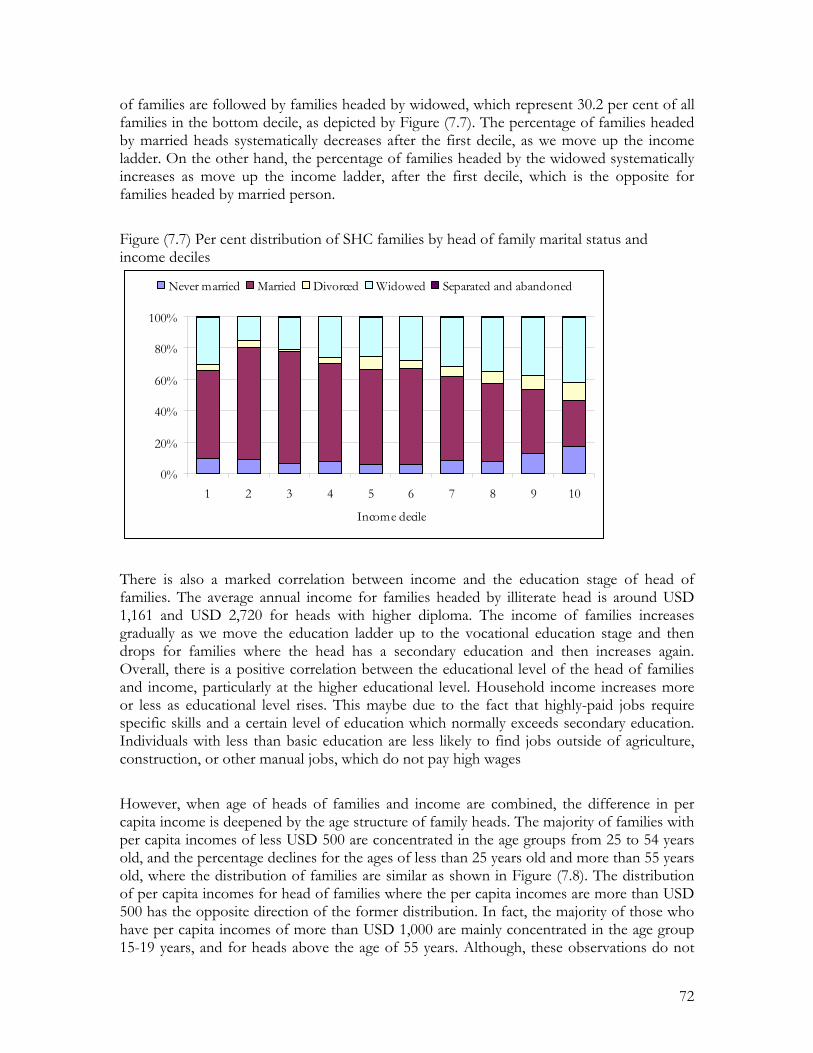
72
of families are followed by families headed by widowed, which represent 30.2 per cent of all families in the bottom decile, as depicted by Figure (7.7). The percentage of families headed by married heads systematically decreases after the first decile, as we move up the income ladder. On the other hand, the percentage of families headed by the widowed systematically increases as move up the income ladder, after the first decile, which is the opposite for families headed by married person.
Figure (7.7) Per cent distribution of SHC families by head of family marital status and income deciles
0%
20%
40%
60%
80%
100%
1 2 3 4 5 6 7 8 9 10
Income decile
Never married Married Divorced Widowed Separated and abandoned
There is also a marked correlation between income and the education stage of head of families. The average annual income for families headed by illiterate head is around USD 1,161 and USD 2,720 for heads with higher diploma. The income of families increases gradually as we move the education ladder up to the vocational education stage and then drops for families where the head has a secondary education and then increases again. Overall, there is a positive correlation between the educational level of the head of families and income, particularly at the higher educational level. Household income increases more or less as educational level rises. This maybe due to the fact that highly-paid jobs require specific skills and a certain level of education which normally exceeds secondary education. Individuals with less than basic education are less likely to find jobs outside of agriculture, construction, or other manual jobs, which do not pay high wages
However, when age of heads of families and income are combined, the difference in per capita income is deepened by the age structure of family heads. The majority of families with per capita incomes of less USD 500 are concentrated in the age groups from 25 to 54 years old, and the percentage declines for the ages of less than 25 years old and more than 55 years old, where the distribution of families are similar as shown in Figure (7.8). The distribution of per capita incomes for head of families where the per capita incomes are more than USD 500 has the opposite direction of the former distribution. In fact, the majority of those who have per capita incomes of more than USD 1,000 are mainly concentrated in the age group 15-19 years, and for heads above the age of 55 years. Although, these observations do not

73
follow the life-cycle pattern of individuals in terms of income, it should be noted that the majority of SHC families rely on transfer incomes as the main source of incomes, thus the unsystematic distribution of per capita incomes amongst the different age groups of heads of families.
Figure (7.8) Per cent distribution of SHC families by head of family age and income deciles
0
10
20
30
40
50
60
70
15 -19
20 -24
25 -29
30 -34
35 -39
40 -44
45 -49
50 -54
55 -59
60 -64
65 -69
70 -74
75 -79
80 +
Per cent Less than 500 More than 500
Differences in occupations and economic activity can to some degree explain the variation in income between SHC families. The highest annual income for head of families is recorded for those who work in restaurants and hotels (USD 3,784) followed by transportation (USD 3,583) and the lowest income is derived from working in the services and other sectors (USD 2,281 and 2,203, respectively). In terms of occupation, the highest annual income is obtained from working as machine operators and on assembly lines, followed by those working as technicians and associate professionals. The lowest income among SHC head of families are derived from working as clerks (USD 2,229), which is lower than the income derived from working in elementary occupations (USD 2,552).
Possession of Durable Goods
Closely linked to income, is the possession of household durables. Each SHC family was asked whether they own items on a list of 17 different consumer durables, ranging from essential items such as refrigerators and washing machines to luxury items such as satellite dishes, video/DVD and mobile telephones (Figure 7.9). Most SHC families possess the basic household items. 85.3 per cent of SHC families own refrigerators and TVs are owned by 8 in 10 SHC families. Other basic items such as washing machines and Gas cooking ovens are owned by 77 per cent of families. 6 in 10 families own electric fans, followed by 47 and 45 in 100 families own a record player/radio and Gas/electric stove, respectively. Interestingly, 32 per cent of SHC families own satellite dishes, 25.6 per cent have electric heaters and 22 per cent have telephones. A significant

74
drop is observed when we look at diesel heaters, which are owned by 13 per cent of families, as well as sewing machines and mobile telephones, which are owned by almost 1 in 10. Vacuum cleaners are owned by 8.1 per cent of families, and personal computers are owned by 6.8 per cent of families. Finally, freezers and video/DVD players are owned by 4 and 6 in 100 families, respectively.
There are marked variations amongst fields in terms of possession of durable goods. The majority of SHC families in Syria (95.2 per cent) and Lebanon (92.5 per cent) own refrigerators, compared with 80 per cent for Gaza and the West Bank. While 92.3 per cent of families in Lebanon own TVs, only around 72 per cent of families in the West Bank and Gaza own the item. The same trend is also observed for washing machines.
Figure (7.9) SHC families by ownership of durable goods
0 20 40 60 80 100
Refrigerator
FreezerGas/electric stove
Gas cooker/OvenWashing machine
Television
Record Player or RadioVacuum cleaner
Personal ComputerSatellite antenna
Video/DVD player
TelephoneHeater
Diesel heaterSewing machine
Electric fanMobile Phone
Per cent
The possession of personal computer is highest in Jordan (8.5 per cent) and it is lowest in the West Bank (5.4 per cent). Another revealing statistics relates to the possession of satellite dishes. While 64.2 per cent of families in Lebanon own the item, only 17.2 per cent own it in the West Bank and 21.8 per cent of families in Jordan own the item. Also, more than 4 in 10 families in Syria have telephones compared with only 1 in 10 in Gaza and 1.6 in 10 in the West Bank. On the other hand, the possession of mobile phones is highest in the West Bank (17.2 per cent), followed by Jordan (10.3 per cent) and it is lowest in Lebanon (3.6 per cent).
75
Finally, while 88.2 per cent of families in Syria own electric fans, only 45.6 per cent own the item in the West Bank. Overall, for all items, the West Bank and Gaza fare the worst in terms of having most of the items and Lebanon and Syria fare best, except on a few items such as mobile phones and cooking ovens, Gas/electric stove and satellite dishes in Gaza.
76
Chapter 8 Housing and Infrastructure
Socio-economic conditions of SHC families can not be understood or explained without some knowledge of housing standards and housing conditions and their effect on inhabitants. This chapter describes housing conditions and infrastructure, as well as the housing environment for SHC families in the five fields. The physical aspects of the dwellings are considered here including the size of the dwelling, type, ownership, location, construction materials, and availability of amenities, as well as the indoor living environment and its effect on family members.
The Dwellings
As shown in Table (8.1), more than two-thirds of SHC families live in dars (small houses) (66.23 per cent), apartments (27.89 per cent), huts/barracks (5.27 per cent), and the rest either live in tents (0.15 per cent) or other types of dwellings (0.46 per cent). Dars account for the majority of SHC dwellings in the camps, while apartments are more found outside camps. The survey data shows that none of the tents are found inside camps, and more of the hut and barracks kinds of dwellings are found inside camps, except for SHC families in Gaza and Lebanon. There are also variations across fields with regard to type of dwelling. While 75.6 per cent of the dwellings in Lebanon are dars (88.46 per cent inside camps and 54.37 per cent outside camps), dars account for 51.55 per cent of the dwellings in Syria. On the other hand, apartments in Syria account for the largest percentage amongst fields (43.52 per cent), and the smallest percentage for apartments is in Gaza (21.95 per cent). Most of the hut and barracks type of dwellings are found in Gaza (8.22 per cent), followed by Jordan (6.67 per cent), and the lowest ratio is in the West Bank (1.75 per cent). What is interesting to note in the table, although not significant statistically, is that none of the tent type dwellings are found in the camps, and none are in Syria as revealed by the results of the Survey.
There is relatively little of the improvised squatter-type housing found among SHC families, particularly in the camps, compared to the early years following the refugees’ arrival in host countries, when the tents were replaced with permanent shelters. This is evident by the survey data on construction materials used in the houses. 48.71 per cent of the dwellings are constructed from cement bricks, followed by dwellings built from concrete (33.74 per cent), cut-stone (11.66 per cent), clay and stone (3.4 per cent), asbestos, wood or zinc (1.66 per cent) and the rest were built from a combination of other materials. The building materials of dwellings differ amongst fields and inside and outside camps. The most common types of building material in the camps are cement bricks (58.18 per cent), followed by cement or concrete (28.9 per cent), cut stone (8.3 per cent), and clay and stones (2.71 per cent). Although, the dwellings in most camps are old and poorly maintained, only 1.95 per cent of the dwellings are made of non-permanent materials such as asbestos, wood or zinc. In part, this is due to the effort made by UNRWA in replacing the prefabricated material with permanent materials.
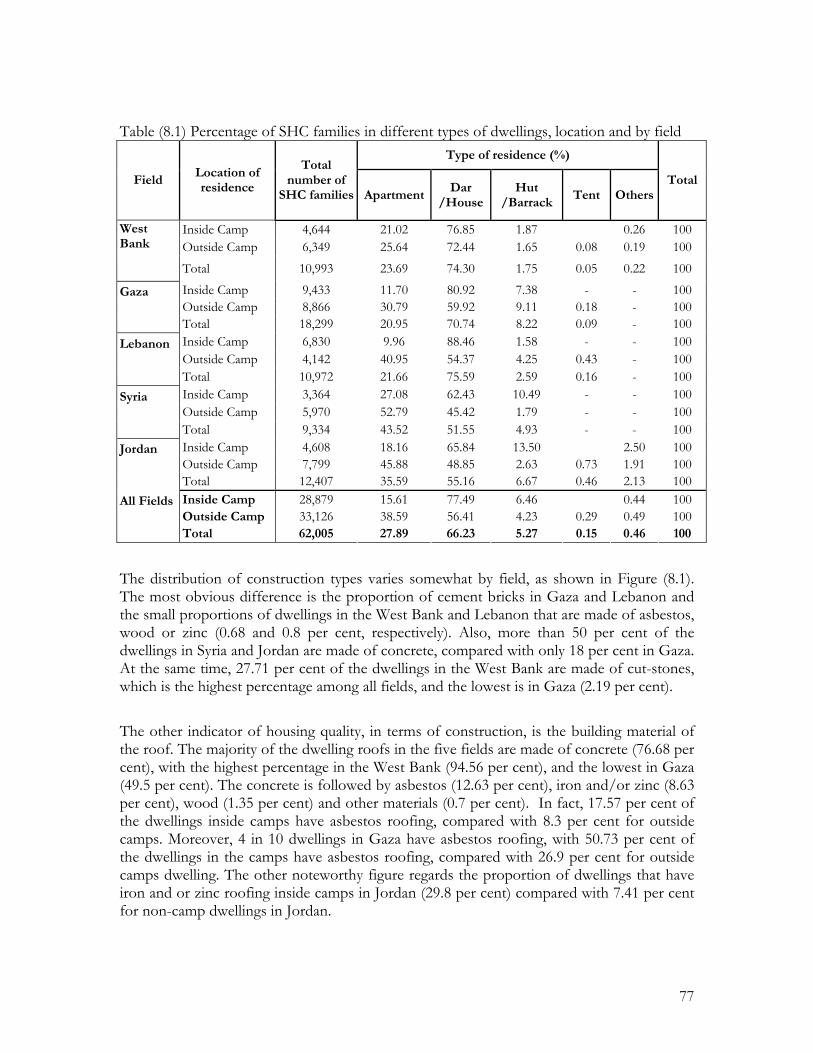
77
Table (8.1) Percentage of SHC families in different types of dwellings, location and by field Type of residence (%)
Field Location of residence
Total number of
SHC families ApartmentDar
/HouseHut
/Barrack Tent Others
Total
Inside Camp 4,644 21.02 76.85 1.87 0.26 100 Outside Camp 6,349 25.64 72.44 1.65 0.08 0.19 100
West Bank Total 10,993 23.69 74.30 1.75 0.05 0.22 100
Inside Camp 9,433 11.70 80.92 7.38 - - 100 Outside Camp 8,866 30.79 59.92 9.11 0.18 - 100
Gaza Total 18,299 20.95 70.74 8.22 0.09 - 100
Inside Camp 6,830 9.96 88.46 1.58 - - 100 Outside Camp 4,142 40.95 54.37 4.25 0.43 - 100
Lebanon Total 10,972 21.66 75.59 2.59 0.16 - 100
Inside Camp 3,364 27.08 62.43 10.49 - - 100 Outside Camp 5,970 52.79 45.42 1.79 - - 100
Syria Total 9,334 43.52 51.55 4.93 - - 100
Inside Camp 4,608 18.16 65.84 13.50 2.50 100 Outside Camp 7,799 45.88 48.85 2.63 0.73 1.91 100
Jordan Total 12,407 35.59 55.16 6.67 0.46 2.13 100
Inside Camp 28,879 15.61 77.49 6.46 0.44 100 Outside Camp 33,126 38.59 56.41 4.23 0.29 0.49 100
All Fields Total 62,005 27.89 66.23 5.27 0.15 0.46 100
The distribution of construction types varies somewhat by field, as shown in Figure (8.1). The most obvious difference is the proportion of cement bricks in Gaza and Lebanon and the small proportions of dwellings in the West Bank and Lebanon that are made of asbestos, wood or zinc (0.68 and 0.8 per cent, respectively). Also, more than 50 per cent of the dwellings in Syria and Jordan are made of concrete, compared with only 18 per cent in Gaza. At the same time, 27.71 per cent of the dwellings in the West Bank are made of cut-stones, which is the highest percentage among all fields, and the lowest is in Gaza (2.19 per cent).
The other indicator of housing quality, in terms of construction, is the building material of the roof. The majority of the dwelling roofs in the five fields are made of concrete (76.68 per cent), with the highest percentage in the West Bank (94.56 per cent), and the lowest in Gaza (49.5 per cent). The concrete is followed by asbestos (12.63 per cent), iron and/or zinc (8.63 per cent), wood (1.35 per cent) and other materials (0.7 per cent). In fact, 17.57 per cent of the dwellings inside camps have asbestos roofing, compared with 8.3 per cent for outside camps. Moreover, 4 in 10 dwellings in Gaza have asbestos roofing, with 50.73 per cent of the dwellings in the camps have asbestos roofing, compared with 26.9 per cent for outside camps dwelling. The other noteworthy figure regards the proportion of dwellings that have iron and or zinc roofing inside camps in Jordan (29.8 per cent) compared with 7.41 per cent for non-camp dwellings in Jordan.
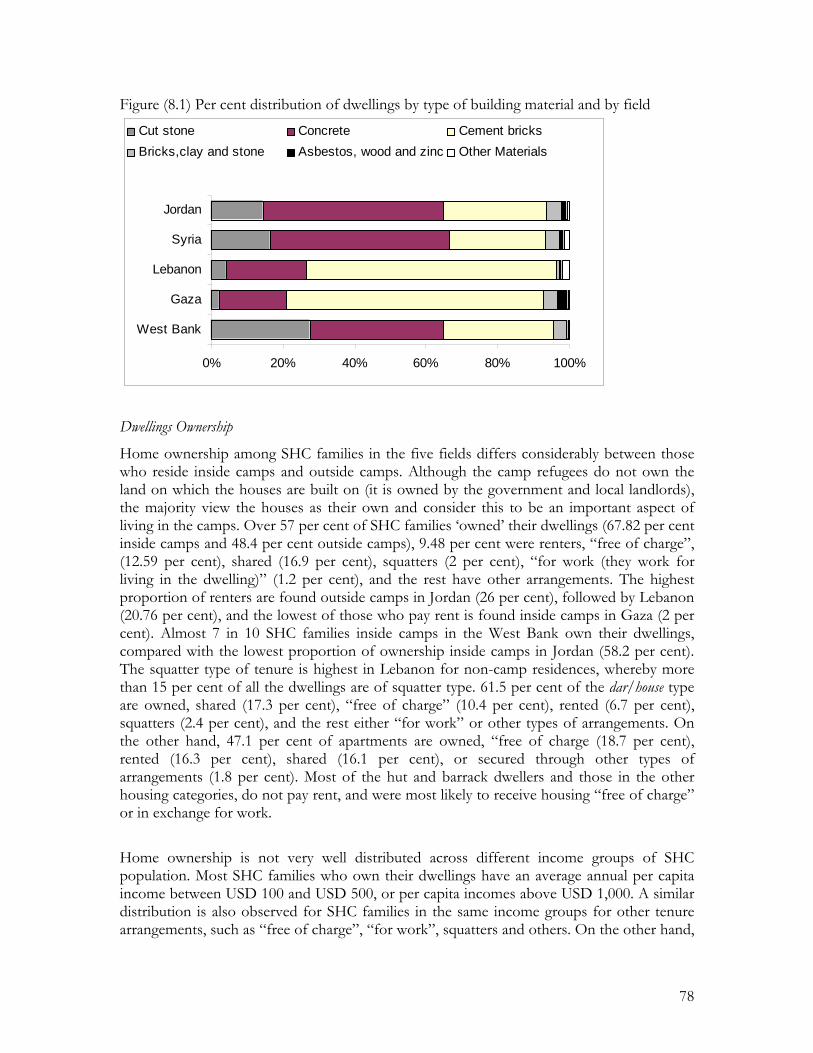
78
Figure (8.1) Per cent distribution of dwellings by type of building material and by field
0% 20% 40% 60% 80% 100%
West Bank
Gaza
Lebanon
Syria
Jordan
Cut stone Concrete Cement bricksBricks,clay and stone Asbestos, wood and zinc Other Materials
Dwellings Ownership
Home ownership among SHC families in the five fields differs considerably between those who reside inside camps and outside camps. Although the camp refugees do not own the land on which the houses are built on (it is owned by the government and local landlords), the majority view the houses as their own and consider this to be an important aspect of living in the camps. Over 57 per cent of SHC families ‘owned’ their dwellings (67.82 per cent inside camps and 48.4 per cent outside camps), 9.48 per cent were renters, “free of charge”, (12.59 per cent), shared (16.9 per cent), squatters (2 per cent), “for work (they work for living in the dwelling)” (1.2 per cent), and the rest have other arrangements. The highest proportion of renters are found outside camps in Jordan (26 per cent), followed by Lebanon (20.76 per cent), and the lowest of those who pay rent is found inside camps in Gaza (2 per cent). Almost 7 in 10 SHC families inside camps in the West Bank own their dwellings, compared with the lowest proportion of ownership inside camps in Jordan (58.2 per cent). The squatter type of tenure is highest in Lebanon for non-camp residences, whereby more than 15 per cent of all the dwellings are of squatter type. 61.5 per cent of the dar/house type are owned, shared (17.3 per cent), “free of charge” (10.4 per cent), rented (6.7 per cent), squatters (2.4 per cent), and the rest either “for work” or other types of arrangements. On the other hand, 47.1 per cent of apartments are owned, “free of charge (18.7 per cent), rented (16.3 per cent), shared (16.1 per cent), or secured through other types of arrangements (1.8 per cent). Most of the hut and barrack dwellers and those in the other housing categories, do not pay rent, and were most likely to receive housing “free of charge” or in exchange for work.
Home ownership is not very well distributed across different income groups of SHC population. Most SHC families who own their dwellings have an average annual per capita income between USD 100 and USD 500, or per capita incomes above USD 1,000. A similar distribution is also observed for SHC families in the same income groups for other tenure arrangements, such as “free of charge”, “for work”, squatters and others. On the other hand,

79
those who pay rent are concentrated in the income groups between USD 300 to USD 600 and those that have average per capita annual income of more than USD 1,000.
Figure (8.2) Owning, renting and other arrangements: Per cent distribution of SHC families by income groups
0
2
4
6
8
10
12
<
100
100
- <
200
200
- < 3
00
300
- < 4
00
400
- < 5
00
500
- < 6
00
600
- < 7
00
700
- < 8
00
800
- <90
0
900
- <10
00
1000
+
Per cent
OwnedRented
Others
Number of Rooms in the Dwellings, and Overcrowding
SHC families in the five fields have on average 2.6 rooms, not including kitchens, bathrooms and hallways, and 1.8 rooms are used for sleeping. In fact, 78.2 per cent of SHC families have less than three rooms, 15.7 per cent have four rooms, and only 5.6 per cent have more than five rooms. Also, more than 80 per cent have two rooms or less that are used for sleeping. The highest number of rooms are found in Syria (2.8 rooms) and the lowest number of sleeping rooms is in West Bank (1.5 rooms). The typical dar/house dwellings are generally smaller in size than apartments, and dwellings in camps (67 sqm) are smaller than dwellings outside camps (82 sqm). The average size for all type of dwellings is 75 sqm, with the largest built area for apartments 82.3 sqm and dar/house 73 sqm. The largest average built area for all types of dwellings is recorded for Gaza (87 sqm) and the smallest is in the West Bank (67 sqm). However, when per person average built area is considered for the five fields, the highest average built area is highest is in Syria (24 sqm), followed by Jordan (19.5 sqm), Gaza (18.3 sqm), the West Bank (17.2 sqm) and the smallest is in Lebanon (15.3 sqm), with an average of 18.5 sqm for the five fields. With regard to yard area, the average for the five fields is 28 sqm, with the largest yard area in the West Bank (38 sqm) and the smallest in Syria (12.4 sqm), with an average per person yard area of 6.9 sqm. Although, there are no difference between camp dwellers and non-camp dwellers in terms of the number of rooms and number of sleeping rooms in the dwellings, the size of the total built area, as discussed above, indicates that the average size of rooms in the camps is smaller than outside camps, which indicates that SHC families living in camps do suffer more from overcrowding compared to SHC families residing outside camps. Overall, for SHC families
80
in the five fields, there is on average 1.5 persons per room (1.8 persons per room in Gaza) and 2.2 persons per sleeping room (2.4 persons per sleeping room in Lebanon). In general, these statistics do not indicate serious overcrowding conditions in any of the fields, however, we have to bear in mind that some SHC families live in shared dwellings, and all household members are not included in the current SHC survey. This is mainly due to the specificity of the SHC survey, which enquired about SHC families only and did not include any other members of the household. The other reason lies in the structure of the SHC population, where more than 40 per cent of SHC families fall under the “A” (aged) category and those in general have smaller families (2.27 persons) compared with the “Z” category (7.14 persons).
Amenities and Sanitation
The SHC survey collected data on infrastructure and related services at both household and community levels, and included data on SHC families’ access to a number of infrastructure amenities related to electricity, water, heating, sewage, refuse, kitchen, bathrooms and other facilities.
The results from the survey indicate that the majority of SHC populations have potable water that is piped directly into their residence (84.7 per cent), 2.35 per cent, piped into buildings but not into residence, 1.21 per cent, piped into yards; 0.90 per cent use a public tap, 4.41 per cent use tanker water, 2.69 per cent use bottled water, and the rest either use collected rain water or well-water. Overall, SHC families residing in camps have more access to potable water (88.05 per cent) than those residing outside camps (81.74 per cent) except in Syria, where SHC families residing outside camps have more access to potable water. A simple comparison among fields reveals that SHC families in Gaza have the highest percentage (94.57 per cent) in terms of access to potable water, and the lowest is for SHC families in Lebanon (69.67 per cent).
Electricity power services are very widespread, with 97.5 per cent of households connected to the power grid, and there is not an observed difference between families residing inside and outside camps. It is used primarily for lighting and appliances, but not for heating or cooking. The main energy sources used for cooking and heating are gas, diesel, kerosene, and wood or charcoal. 96.44 per cent of households use gas for cooking, while the rest use kerosene (2.45 per cent), and other sources. The majority of SHC families use gas (15.84 per cent), kerosene (19.14 per cent), diesel (12.8 per cent), wood or coal (16 per cent), electricity (10.27 per cent), and central heating and other sources (1.9 per cent). Almost 1 in 4 SHC families have no heating at all, which is surprisingly high. In all cases, only parts of the dwellings are kept warm in winter because the heating devices used are ‘spot-specific’ devices and warm only the immediate location around them. Therefore, family members have to cluster around the heating device to keep warm.
About one-half of SHC families have their garbage collected, but another 41.7 per cent – mainly SHC families residing outside camps – dispose of soiled waste in open containers. About 4 in 10 of SHC families dispose of garbage in closed containers, mainly outside camps, and the rest either burn their garbage or dispose of it in another ways.

81
Even though toilets inside the living quarters are more common inside camps (91 per cent) compared with 80.6 per cent for outside camps, a small proportion have their toilets either inside the building but not inside the dwellings (9.9 per cent) and rest have their toilets outside the building, primarily for SHC families residing outside camps. Nearly three quarters of toilets are connected to a sewage network or a percolation pit/septic tanks (23.24 per cent) and the rest either have a covered dry latrine or other arrangements. Although housing and sanitation amenities are widely available for most of SHC families in the five fields, some areas and groups of people are better served than others. A comparison amongst fields in terms of connectivity to a sewage system reveals that the majority of SHC dwellings in Syria (93.4 per cent) are connected to a sewage system, followed by Lebanon (80.8 per cent), Jordan (73.3 per cent), Gaza (70.4 per cent) and the lowest is in the West Bank (60 per cent). For the West Bank, 88 per cent of SHC dwellings inside camps are connected to a sewage system compared with only 39.5 per cent for SHC dwellings outside camps (Figure 8.3). For other fields, a similar trend is observed in which more SHC dwellings inside camps are connected to a sewage network, except in Syria. The high proportion of connectivity to a sewage network inside camps is perhaps because UNRWA is the main provider of sewer networks.
Figure (8.3) Per cent distribution of SHC dwellings by connection to a sewage network for camp and non-camps dwellings
0102030405060708090
100
West Bank Gaza Lebanon Syria Jordan
Per cent Inside Camp Outside Camp
About 88 per cent of SHC families have a separate kitchen in their living quarters, and the rest do not have a separate kitchen. Amongst fields, 95 per cent of SHC families in Lebanon have separate kitchens, followed by Jordan (91.3 per cent) and the lowest percentage is in the West Bank (79.4 per cent). Overall, more than 90 per cent of SHC families living inside camps have a separate kitchen room compared with 85.5 per cent for outside camp dwellings. Moreover, 14.5 per cent of SHC families who do not have a separate kitchen are living outside camps compared with less than 10 per cent for families living inside camps.

82
The Indoor Environment
Although most SHC households have essential amenities, the indoor environment is not always comfortable, as shown Figure (8.4). Over 64 per cent of all SHC families find their dwellings cold and difficult to heat in winter months; 57.3 per cent say their dwellings are humid or damp, 56 per cent find their dwellings hot in summer, and around 42 per cent say their dwellings are dark and gloomy and poorly ventilated. Overall, SHC families living in Jordan suffer more from negative housing characteristics, compared to other fields except on humidity or damp, which is highest in the West Bank (66 per cent). In fact, 75 per cent of all dwellings inside camps in the West Bank suffer from humidity or damp, compared with the lowest ratio for inside camp residence in Gaza (54.5 per cent).
Figure (8.4) Percentage of households affected by negative housing characteristics
0 10 20 30 40 50 60 70
Humid / damp
Cold / difficult to heat
Hot in summer
Poorly ventilated
Dark and gloomy
Per cent
Another revealing indicator regarding indoor housing structure is the opinions of families on the overall structure of the dwellings. SHC families were asked if their dwellings have any structural defect. More than one-third of SHC families in the five fields reported that all or part of their dwellings suffer from some sort of a structural defect. The percentage of families reporting structural defect in their dwellings is higher for those living inside camps (37.5 per cent) compared with 32 per cent for those living outside camps, and the percentage is highest in Jordan and Gaza for both groups. Also, when families were asked whether they consider their dwellings to be a health hazard and in need of rehabilitation, 32.4 per cent of all SHC families consider their homes to be a health hazard and 42.5 per cent indicated that their dwellings are in need of rehabilitation.
Availability of Services
The last section on housing and environment concerns the availability of social and economic services within the community. Therefore, families were asked about the proximity and availability of hospitals (public and private), postal service, elementary, preparatory and secondary schools (including UNRWA schools), health centres (including

83
UNRWA health clinics), pharmacies, community centres, public markets and other services. As we can see from Figure (8.5), most SHC individuals can fulfil most of their daily needs quite close to home, or within less than 3 km, except for public and private hospitals. 38.3 per cent and 34 per cent of SHC families in the five fields have access to private and public hospitals within less than 3 km, respectively. Another 17.6 per cent and 21 per cent have them within less than 5 km, and 17 per cent and 11.6 per cent do not have the services within their communities. The rest have the hospitalization services within five to 20 km or more. This means that the majority of SHC families have to commute long distance, before they can get to the nearest private or public hospitals.
Figure (8.5) Per cent of SHC families with various community services within radius of 3 km or less
020406080
100Public market
UNRWA schools
UNRWA health centre
Secondary schools
Elementary school
Preparatory school
Pharmacy
Private hospital
Public hospital
Public health centre
As far as UNRWA education and health facilities are concerned, 4.2 per cent of SHC families indicated that they do not have access to an UNRWA health centre/clinic within their communities and another 5.2 per cent do not have access to UNRWA schools. 11.58 of the latter are located in the West Bank and 7.5 per cent are living in the Jordan field and all of them are residing outside camps. Overall, as shown in Figure (8.6), the West Bank fares worst in terms of access to public markets, UNRWA schools, UNRWA health centres, and pharmacies. With regards to elementary, preparatory and secondary education, and postal services, Lebanon has the lowest percentages of SHC families who have access to these services. The Jordan field fares worst in terms of access to private and public hospitals and public health centres. A comparison between camp and non-camp residence of SHC families indicates that overall the camp as a place of residence fares better (within less than 3 km) in terms of having to access to UNRWA schools and health clinics, public and private hospitals and access to pharmacies. On the other hand, those living outside camps have better access to elementary, preparatory and secondary education schools and public markets. Access to postal services has a similar distribution among both groups.
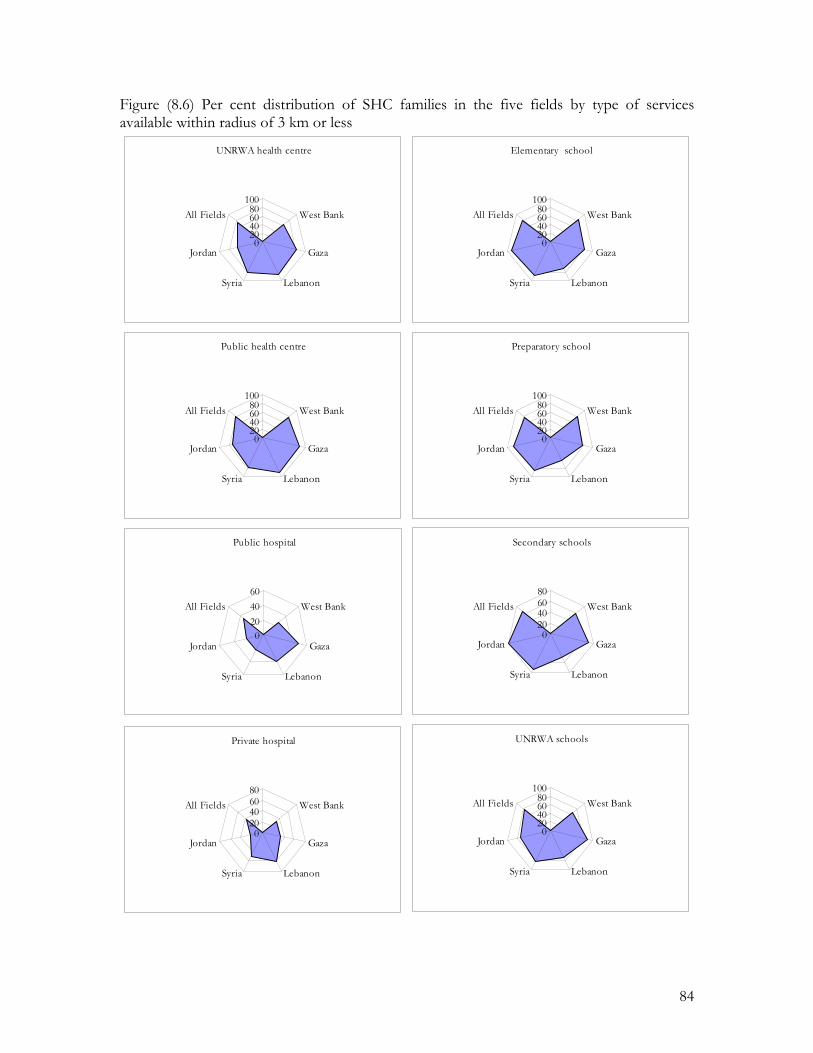
84
Figure (8.6) Per cent distribution of SHC families in the five fields by type of services available within radius of 3 km or less
UNRWA health centre
020406080
100West Bank
Gaza
LebanonSyria
Jordan
All Fields
Elementary school
020406080
100West Bank
Gaza
LebanonSyria
Jordan
All Fields
Secondary schools
020406080
West Bank
Gaza
LebanonSyria
Jordan
All Fields
Public hospital
0204060
West Bank
Gaza
LebanonSyria
Jordan
All Fields
UNRWA schools
020406080
100West Bank
Gaza
LebanonSyria
Jordan
All Fields
Private hospital
020406080
West Bank
Gaza
LebanonSyria
Jordan
All Fields
Preparatory school
020406080
100West Bank
Gaza
LebanonSyria
Jordan
All Fields
Public health centre
020406080
100West Bank
Gaza
LebanonSyria
Jordan
All Fields
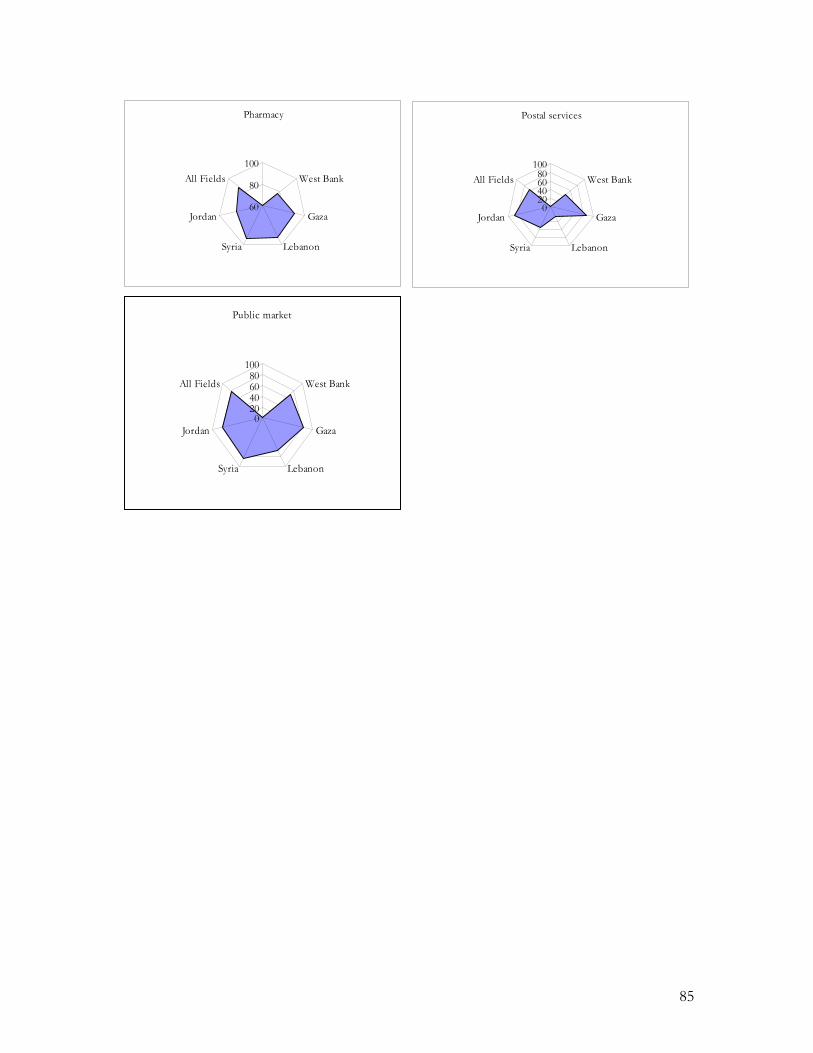
85
Public market
020406080
100
West Bank
Gaza
LebanonSyria
Jordan
All Fields
Pharmacy
60
80
100West Bank
Gaza
LebanonSyria
Jordan
All Fields
Postal services
020406080
100West Bank
Gaza
LebanonSyria
Jordan
All Fields

86
Chapter 9 Food Assessment
The last section of the survey probed SHCs opinions on a number of issues concerning the current distribution mechanisms of the SHC programme, including the consumption or non-consumption of the distributed food items, sufficiency of the quantities distributed, preferences in terms of replacement of the food items, and whether they would like to receive the SHC assistance in the form of “all cash”, “all food”, or a combination of “part-food and part-cash”, similar to the existing distribution mechanism. Therefore, this chapter analyze the main findings of the food assessment survey, with special focus on the preferences of SHC families regarding the current distribution mechanism of the SHC programme.
Consumption of Food Items
As stated in chapter two, the SHC programme provides SHC families with a quarterly food rations consisting of various food items, such as flour, sugar, rice, milk, cooking oil, lentils, and other food items. People were asked, as shown in Table (9.1), whether they “consume all” the quantities they receive, “consume-part and sell-part”, or if they “sell all” the quantities they receive.
Among all food items distributed to SHC families, flour is the least consumed item among all items. Overall, 67.4 per cent of families consume all the flour in the five fields, 17.7 per cent “consume-part and sell-part” and only 14.9 per cent of families “sell all” the quantities of flour they receive. In Gaza, 96.7 per cent of SHC families consume all the flour quantities and only 0.3 “sell all” the flour, with the rest selling part and consuming part (Figure 6.1). Among all fields, the lowest percentage for the consumption of “all flour” is recorded for SHC families in Syria (31.3 per cent), followed by Jordan (35.9 per cent). However, the highest percentage for selling all the flour quantities is reported for SHC families in the Jordan field, whereby about 34 per cent of families “sell all” the quantities of flour they receive, followed by SHC families in Syria (30.9 per cent). SHC families in Lebanon come third in order, with only about 15 per cent of families selling all the flour. In the West Bank, the majority of SHC families “consume all” the quantities of flour they receive, 9 per cent “consume-part and sell-part”, and the rest “sell all” the quantities of flour (4.4 per cent).
The difference in the results among fields maybe explained by the availability and prices of flour in local markets. In Jordan, the flour item is highly subsidized by the government and most families purchase ready-made bread from local bakeries, instead of baking it at home, especially in urban areas. Therefore, most SHC families either “sell all” the flour or “consume-part and sell-part” (usually for other usage than bread in urban areas). The same scenario applies for SHC families in Syria and to some extent in Lebanon. However, in the West Bank and Gaza, the situation differs considerably, due to political and security reasons, where the majority of SHC families bake their bread at home and consume almost all of the flour quantities.
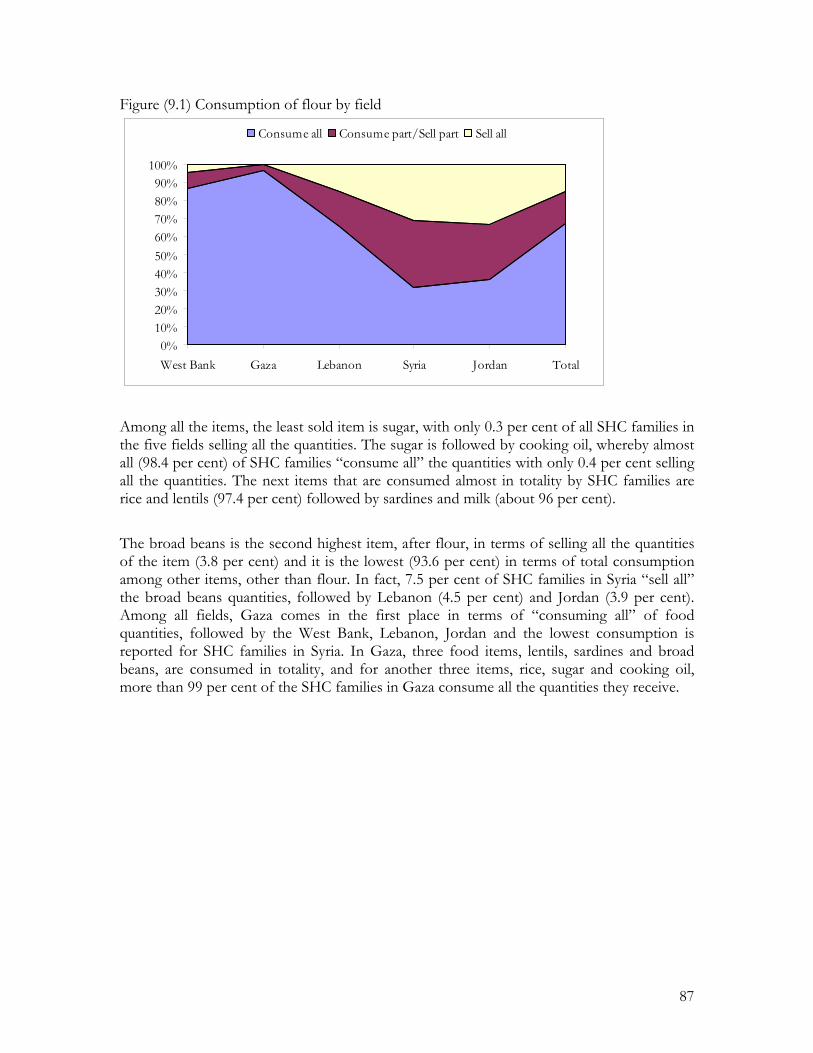
87
Figure (9.1) Consumption of flour by field
0%10%20%30%40%50%60%70%80%90%
100%
West Bank Gaza Lebanon Syria Jordan Total
Consume all Consume part/Sell part Sell all
Among all the items, the least sold item is sugar, with only 0.3 per cent of all SHC families in the five fields selling all the quantities. The sugar is followed by cooking oil, whereby almost all (98.4 per cent) of SHC families “consume all” the quantities with only 0.4 per cent selling all the quantities. The next items that are consumed almost in totality by SHC families are rice and lentils (97.4 per cent) followed by sardines and milk (about 96 per cent).
The broad beans is the second highest item, after flour, in terms of selling all the quantities of the item (3.8 per cent) and it is the lowest (93.6 per cent) in terms of total consumption among other items, other than flour. In fact, 7.5 per cent of SHC families in Syria “sell all” the broad beans quantities, followed by Lebanon (4.5 per cent) and Jordan (3.9 per cent). Among all fields, Gaza comes in the first place in terms of “consuming all” of food quantities, followed by the West Bank, Lebanon, Jordan and the lowest consumption is reported for SHC families in Syria. In Gaza, three food items, lentils, sardines and broad beans, are consumed in totality, and for another three items, rice, sugar and cooking oil, more than 99 per cent of the SHC families in Gaza consume all the quantities they receive.
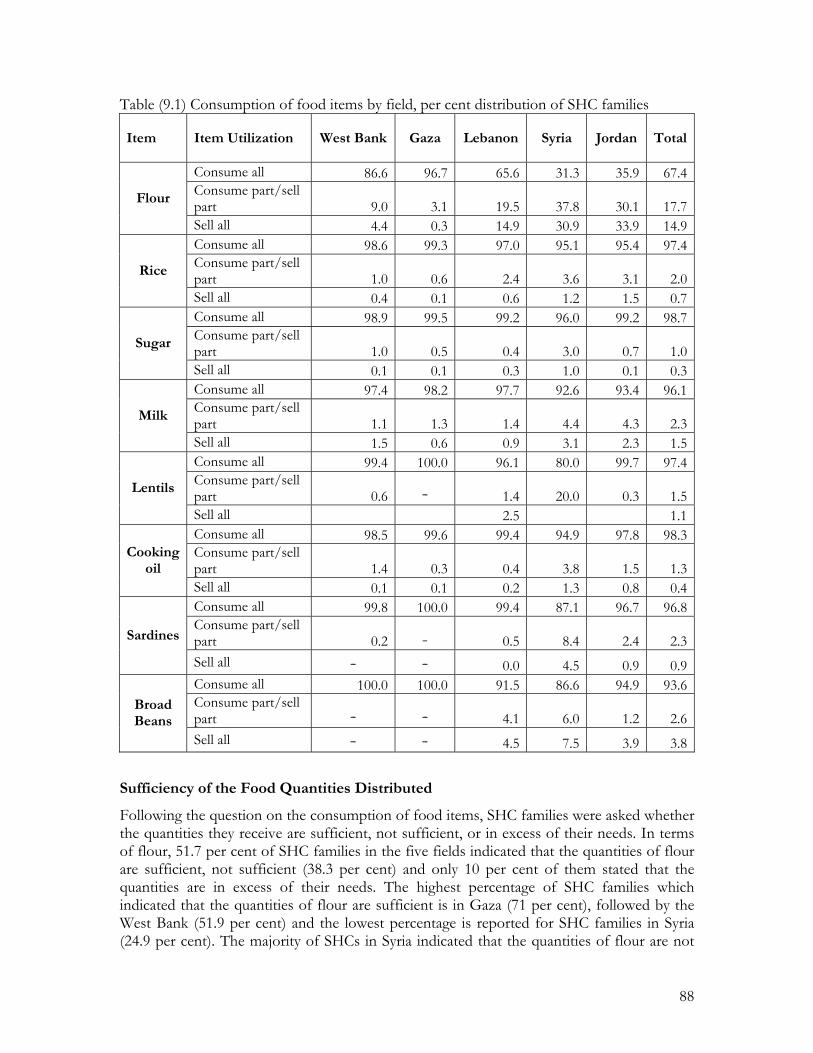
88
Table (9.1) Consumption of food items by field, per cent distribution of SHC families
Item Item Utilization West Bank Gaza Lebanon Syria Jordan Total
Consume all 86.6 96.7 65.6 31.3 35.9 67.4Consume part/sell part 9.0 3.1 19.5 37.8 30.1 17.7Flour
Sell all 4.4 0.3 14.9 30.9 33.9 14.9Consume all 98.6 99.3 97.0 95.1 95.4 97.4Consume part/sell part 1.0 0.6 2.4 3.6 3.1 2.0Rice
Sell all 0.4 0.1 0.6 1.2 1.5 0.7Consume all 98.9 99.5 99.2 96.0 99.2 98.7Consume part/sell part 1.0 0.5 0.4 3.0 0.7 1.0Sugar
Sell all 0.1 0.1 0.3 1.0 0.1 0.3Consume all 97.4 98.2 97.7 92.6 93.4 96.1Consume part/sell part 1.1 1.3 1.4 4.4 4.3 2.3Milk
Sell all 1.5 0.6 0.9 3.1 2.3 1.5Consume all 99.4 100.0 96.1 80.0 99.7 97.4Consume part/sell part 0.6 - 1.4 20.0 0.3 1.5Lentils
Sell all 2.5 1.1Consume all 98.5 99.6 99.4 94.9 97.8 98.3Consume part/sell part 1.4 0.3 0.4 3.8 1.5 1.3
Cooking oil
Sell all 0.1 0.1 0.2 1.3 0.8 0.4Consume all 99.8 100.0 99.4 87.1 96.7 96.8Consume part/sell part 0.2 - 0.5 8.4 2.4 2.3Sardines
Sell all - - 0.0 4.5 0.9 0.9Consume all 100.0 100.0 91.5 86.6 94.9 93.6Consume part/sell part - - 4.1 6.0 1.2 2.6
Broad Beans
Sell all - - 4.5 7.5 3.9 3.8
Sufficiency of the Food Quantities Distributed
Following the question on the consumption of food items, SHC families were asked whether the quantities they receive are sufficient, not sufficient, or in excess of their needs. In terms of flour, 51.7 per cent of SHC families in the five fields indicated that the quantities of flour are sufficient, not sufficient (38.3 per cent) and only 10 per cent of them stated that the quantities are in excess of their needs. The highest percentage of SHC families which indicated that the quantities of flour are sufficient is in Gaza (71 per cent), followed by the West Bank (51.9 per cent) and the lowest percentage is reported for SHC families in Syria (24.9 per cent). The majority of SHCs in Syria indicated that the quantities of flour are not

89
sufficient (60.8 per cent) and only 14.2 per cent stated the quantities are in excess of their needs. In comparison, only 0.8 per cent of SHC families in Gaza indicated that the quantities of flour are in excess of their needs, and about 28 per cent indicated that the quantities are not sufficient. The highest percentage of those who indicated that the quantities of flour are over their needs is found among SHC families in Jordan (18.7 per cent) and Lebanon (17.1 per cent). Although, the results are mixed between those who “sell all” the quantities of flour and those who reported the quantities are in excess of their needs in Jordan and Syria, the results for other fields are very close to the percentages of those who “sell all” quantities of flour. In fact, while 4.4 per cent and 0.3 per cent of SHCs in the West Bank and Gaza, respectively, “sell all” the flour quantities, 4.7 per cent and 0.8 per cent, respectively, indicated the quantities of flour are in excess of their needs. For Jordan and Syria, while 33.9 per cent and 30.9 per cent, respectively, “sell all” the flour quantities, only 18.7 per cent and 14.2 per cent, respectively, indicated the quantities are in excess of their needs.
The majority of SHCs who reported the quantities are in excess of their needs (89.3 per cent) sell all the extra quantities they receive, while the rest either exchange it with other items (8.4 per cent ), or dispose of it in other ways (2.4 per cent). Among fields, almost all extra quantities of flour in Gaza are sold (96.6 per cent), followed by Syria (95.1 per cent), Jordan (91.3 per cent), Lebanon (84.8 per cent) and the West Bank (79.7 per cent). The highest percentage for those who exchange flour with other items is reported for the West Bank (18 per cent) and the lowest is reported for Gaza (3.4 per cent). In terms of disposing the extra quantities in other ways, Lebanon comes first (5.7 per cent) followed by the West Bank (2.3 per cent) and Jordan (1.2 per cent).
Substitution of Food Items
Respondents were also asked if they want to replace any of the food items. As shown in Figure (9.2), overall 20.6 per cent wanted to replace the flour item, with the highest percentage in Jordan (49.7 per cent), followed by Syria (35.1 per cent), Lebanon (25.3 per cent), the West Bank (4.4 per cent), and only 0.2 per cent of families in Gaza wanted to replace the flour item. The second item on the replacement list is broad beans. Almost 2 in 10 families wanted to replace broad beans, with the highest percentage in Lebanon (36.5 per cent), followed by Syria (15.1 per cent), Jordan (12.1 per cent), and the West Bank (0.2 per cent); and none of the SHC families in Gaza wanted to replace broad beans. Lentils comes third in order, with 10.4 per cent of SHC families in Lebanon (23.3 per cent) and only 0.6 per cent of SHC families in the West Bank wanting to replace the item.
The fourth item is sardines with 5.9 per cent of families in all fields, except the West Bank field, wanting to replace the item. SHC families in Syria come in first place (11.2 per cent), followed by Jordan (8.9 per cent), Lebanon (1.9 per cent) and Gaza (1.3 per cent). Interestingly, while the majority of SHC families in Jordan consume almost all the rice (95.4 per cent) and milk (93.4 per cent), 11.2 per cent and 6.7 per cent, respectively, of them wanted to replace rice and milk. Also 4 per cent of SHC families in Lebanon and 2.1 per cent in the West Bank wanted to replace the rice. Among all items, cooking oil (1.3 per cent) and sugar (1.5 per cent) come in the last place in terms of replacing the items, which is almost consistent with overall consumption levels of both items.

90
Figure (9.2) Per cent of SHC families wanting to replace the food items
0 5 10 15 20 25
Flour
Rice
Sugar
Milk
Lentils
Cooking Oil
Sardines
Broad Beans
Per cent
The overall percentage of SHC families who wanted to replace the food items and the kind of alternative items is presented in Table (9.2). The table considers only SHC families who wanted to replace the food items, as a total population (100 per cent). While 20.6 per cent wanted to replace flour, 36.3 per cent of them wanted cash instead, 17.2 per cent wanted to replace it with other items, 13.3 per cent with sugar, 11.3 per cent with cooking oil, 8.7 per cent with rice, and the rest wanted to replace the flour with either milk or canned food. For all food items, the majority of SHC families wanted cash instead of the item except for lentils (about 22 per cent of SHC families wanted cooking oil instead), and sardines.
Table (9.2) Per cent of families wanting to replace food items and kind of replacement Replaced Items
Desired Items Flour
(20.6%) Rice
(3.8%)Sugar (1.5%)
Milk (2.7%)
Lentils (2.7%)
Cooking Oil (1.3%)
Sardines (5.9%)
Broad Beans
(18.9%) Cash 36.3 26.6 45.4 37.9 6.5 53.8 24.86 13.0 Sugar 13.3 16.2 12.2 16.5 8.6 6.42 11.5 Cooking Oil 11.3 21.8 8.2 13.5 21.8 - 16.62 13.8 Rice 8.5 13.2 6.6 2.6 - 3.89 8.7 Milk 7.3 11.9 8.9 9.3 10.0 11.64 7.4 Canned food 6.1 5.2 - 4.7 12.8 - 5.15 11.0 Tomato - 2.4 - 3.8 - 4.86 8.2 Chickpeas - - - 2.8 6.9 5.5 - 8.3 Other items 17.2 15.8 24.3 22.3 19.8 22.2 26.6 18.1 Total 100 100 100 100 100 100 100 100

91
Utilization of Cash Proceeds and Cash Subsidy
The survey also asked respondents who sell part or sell the entire item on the utilization of the cash proceeds. More than 4 in 10 families stated that they buy bread, 22.4 per cent spend the cash on daily needs, 9.6 per cent buy meat/fish, 9 per cent buy vegetables, 7.1 per cent spend the cash on medical expenses, and the rest either buy clothes, fruits, pay rent (1.1 per cent), or spend it on education.
The previous question on utilization of the cash proceeds is supported by the question on the utilization of the cash subsidy received by SHC families on a quarterly basis. As stated in chapter two, the per capita annual cash subsidy amounts to USD 40 that is given to each member of the family according to criteria stipulated in the RSI, given that the person is living with family. The majority of SHC families in the five fields spend the cash subsidy on daily needs and food (39.1 per cent), vegetables (16.2 per cent), other needs, (10.8 per cent), meat and chicken (8.8 per cent), medicine (8.1 per cent), and the rest is spent on clothes, paying bills, paying debt, transportation, gas, furniture, and fruits.
Preferences of SHC Families in Terms of Distribution Mechanism
The last section of the food survey asked respondents about their preference in terms of the current distribution mechanism of “part-food and part-cash”, and whether they prefer to keep the current mechanism in place, replace it with “all food” distribution or prefer to receive the assistance in the form of “all cash” and why? About 78 per cent of families indicated that they would like to keep the existing mechanism of distribution of “part-food and part-cash”, 18.2 per cent wanted the distribution to be in the form of “all cash”, and only 4 per cent wanted “all food”. The highest percentage for “all cash” is recorded for Jordan (28.8 per cent), followed by Syria (22.1 per cent), and the lowest percentage is recorded for SHC families in Gaza (11.4 per cent). Conversely, the highest percentage for “part-food and part-cash” is recorded for Gaza with 87.2 per cent of families wanting “part-food and part-cash” and the lowest is recorded for Jordan (63.6 per cent). Interestingly, the highest percentage for “all food” distribution is in Jordan (7.6 per cent), followed by Syria (6.6 per cent), and the lowest is in the West Bank (1.3 per cent).
With regard to the reasons for the choice of intervention, respondents gave over thirty-five reasons for each choice, but these were more or less aggregated into three categories for the first choice of “all food”, and four categories for “all cash” and “part-food and part-cash” choices, as depicted by Figures (9.4), (9.5), and (9.6). Over 46 per cent of SHC families who wanted “all food” indicated that the intervention of “all food” will make them “feel food secure”, 37.3 per cent indicated that the prices of food items distributed (when purchased by UNRWA) are cheaper than prevalent prices in local markets, and the rest indicated that the cash could be spent on non-essential items.
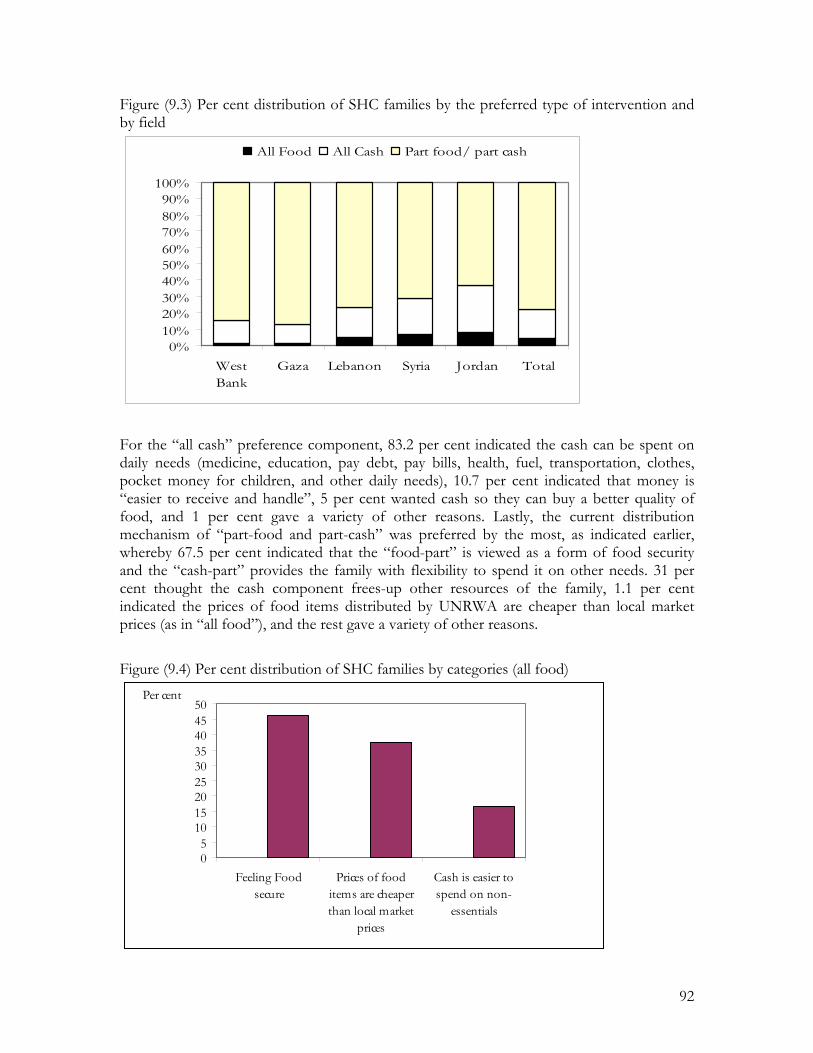
92
Figure (9.3) Per cent distribution of SHC families by the preferred type of intervention and by field
0%10%20%30%40%50%60%70%80%90%
100%
WestBank
Gaza Lebanon Syria Jordan Total
All Food All Cash Part food/ part cash
For the “all cash” preference component, 83.2 per cent indicated the cash can be spent on daily needs (medicine, education, pay debt, pay bills, health, fuel, transportation, clothes, pocket money for children, and other daily needs), 10.7 per cent indicated that money is “easier to receive and handle”, 5 per cent wanted cash so they can buy a better quality of food, and 1 per cent gave a variety of other reasons. Lastly, the current distribution mechanism of “part-food and part-cash” was preferred by the most, as indicated earlier, whereby 67.5 per cent indicated that the “food-part” is viewed as a form of food security and the “cash-part” provides the family with flexibility to spend it on other needs. 31 per cent thought the cash component frees-up other resources of the family, 1.1 per cent indicated the prices of food items distributed by UNRWA are cheaper than local market prices (as in “all food”), and the rest gave a variety of other reasons.
Figure (9.4) Per cent distribution of SHC families by categories (all food)
05
101520253035404550
Feeling Foodsecure
Prices of fooditems are cheaperthan local market
prices
Cash is easier tospend on non-
essentials
Per cent
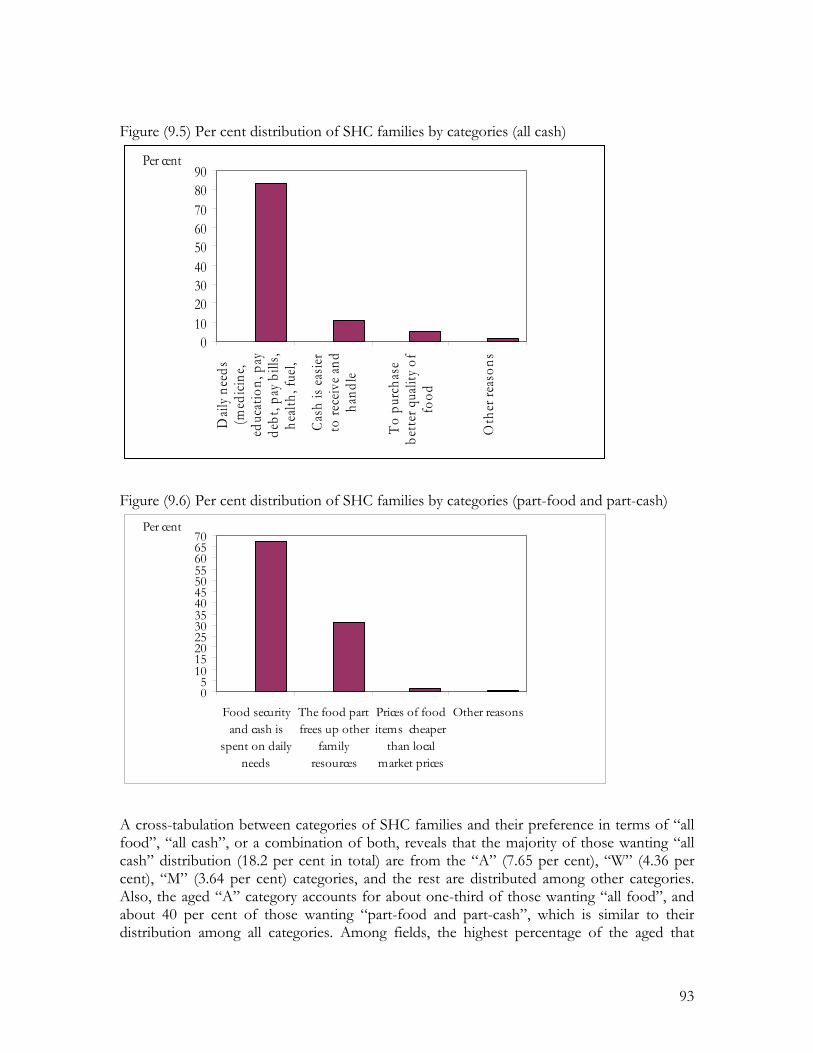
93
Figure (9.5) Per cent distribution of SHC families by categories (all cash)
0102030405060708090
Dail
y nee
ds(m
edici
ne,
educ
atio
n, p
ayde
bt, p
ay b
ills,
healt
h, fu
el,
Cash
is ea
sier
to re
ceiv
e and
hand
le
To p
urch
ase
bette
r qua
lity o
ffo
od
Oth
er re
ason
s
Per cent
Figure (9.6) Per cent distribution of SHC families by categories (part-food and part-cash)
05
10152025303540455055606570
Food securityand cash is
spent on dailyneeds
The food partfrees up other
familyresources
Prices of fooditems cheaper
than localmarket prices
Other reasons
Per cent
A cross-tabulation between categories of SHC families and their preference in terms of “all food”, “all cash”, or a combination of both, reveals that the majority of those wanting “all cash” distribution (18.2 per cent in total) are from the “A” (7.65 per cent), “W” (4.36 per cent), “M” (3.64 per cent) categories, and the rest are distributed among other categories. Also, the aged “A” category accounts for about one-third of those wanting “all food”, and about 40 per cent of those wanting “part-food and part-cash”, which is similar to their distribution among all categories. Among fields, the highest percentage of the aged that
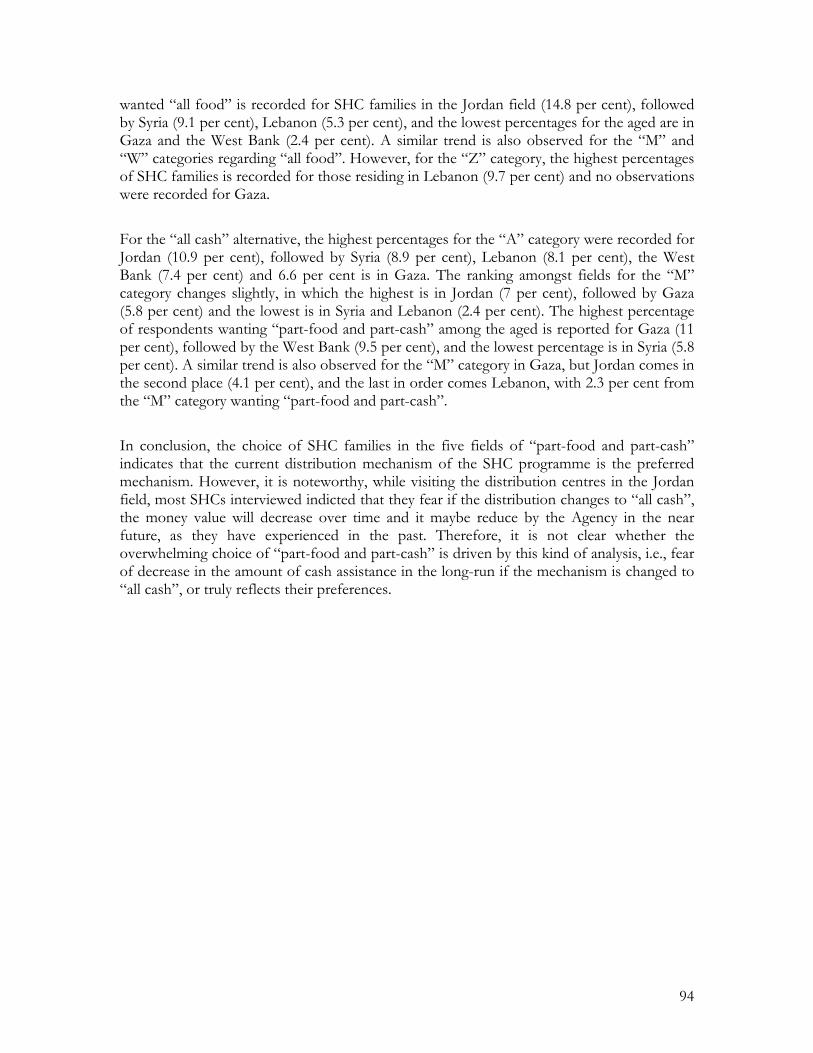
94
wanted “all food” is recorded for SHC families in the Jordan field (14.8 per cent), followed by Syria (9.1 per cent), Lebanon (5.3 per cent), and the lowest percentages for the aged are in Gaza and the West Bank (2.4 per cent). A similar trend is also observed for the “M” and “W” categories regarding “all food”. However, for the “Z” category, the highest percentages of SHC families is recorded for those residing in Lebanon (9.7 per cent) and no observations were recorded for Gaza.
For the “all cash” alternative, the highest percentages for the “A” category were recorded for Jordan (10.9 per cent), followed by Syria (8.9 per cent), Lebanon (8.1 per cent), the West Bank (7.4 per cent) and 6.6 per cent is in Gaza. The ranking amongst fields for the “M” category changes slightly, in which the highest is in Jordan (7 per cent), followed by Gaza (5.8 per cent) and the lowest is in Syria and Lebanon (2.4 per cent). The highest percentage of respondents wanting “part-food and part-cash” among the aged is reported for Gaza (11 per cent), followed by the West Bank (9.5 per cent), and the lowest percentage is in Syria (5.8 per cent). A similar trend is also observed for the “M” category in Gaza, but Jordan comes in the second place (4.1 per cent), and the last in order comes Lebanon, with 2.3 per cent from the “M” category wanting “part-food and part-cash”.
In conclusion, the choice of SHC families in the five fields of “part-food and part-cash” indicates that the current distribution mechanism of the SHC programme is the preferred mechanism. However, it is noteworthy, while visiting the distribution centres in the Jordan field, most SHCs interviewed indicted that they fear if the distribution changes to “all cash”, the money value will decrease over time and it maybe reduce by the Agency in the near future, as they have experienced in the past. Therefore, it is not clear whether the overwhelming choice of “part-food and part-cash” is driven by this kind of analysis, i.e., fear of decrease in the amount of cash assistance in the long-run if the mechanism is changed to “all cash”, or truly reflects their preferences.
95
Chapter 10 Conclusions and Policy Implications
Conclusions In this report, we have sought to examine the living conditions of SHC families in the five fields of UNRWA operations, covering population, housing and housing conditions, education, health and health conditions, labour force activities, expenditures and income, and a special focus was given to the assessment of the distributed food basket. The question that has been implicitly raised all along in previous chapters is how good or bad the living conditions of SHC families are in the five fields, and how they compare with each other?
It has been evident throughout the report that SHC families are a heterogeneous population and their living conditions differ quite considerably among fields and between camp and non-camp residence. The results show that SHC families, although in hardship by definition, suffer from deprivation in housing and housing conditions, inadequate access to education and health services, restrictions in the labour market and other forms of deprivation. A tabular overview of most basic social and economic indicators used in this report is presented in Table (10.1). In general, there are several conclusions to be drawn from the analysis of living conditions of SHC families in the five fields.
First, SHC families have a young population and they smaller families compared with the refugee population in general and host population. The median age for SHC individuals is 22 years, with about 18 per cent of individuals below the age of 9 years old and 56 per cent below the age of 30 years old. The average family size of SHC families is 4.01 persons, compared with 4.73 persons for registered refugees and 5.76 persons for host populations in the five fields. While the median family size is a three-person family, the highest proportion of SHC families live in one-person families, accounting for 26.4 per cent of all families and only about 4.8 per cent of families have ten persons or more. Therefore, SHC families are small by national and international standards. The small family size, however, is directly related to the criteria of the SHC programme, whereby about 40 per cent of SHC beneficiaries fall under the aged category.
Second, another revealing indicator that is directly linked to the criteria of the SHC programme is the large number of females compared to males among SHC population. Overall, females account for about 59 per cent of total SHC population. However, when the data is aggregated for heads of SHC families, the ratio of female-headed families (43.6 per cent) is lower than the ratio for male-headed families (56.4 per cent). The percentage of female-headed families among SHC families is almost four times higher than the percentage of female-headed families among the overall registered refugee population (13.72 per cent). Although, no conclusion can be drawn regarding the feminization of hardship, or for that matter poverty, the high ratio of female heads of families among SHC population and the close relation between income and gender and labour market outcomes may lead to the conclusion that SHC families who are headed by females are more vulnerable than male-headed families. The attachment to the labour force is, in fact, a major determining factor for ‘luring’ peoples into poverty, or ‘locking’ them in poverty.
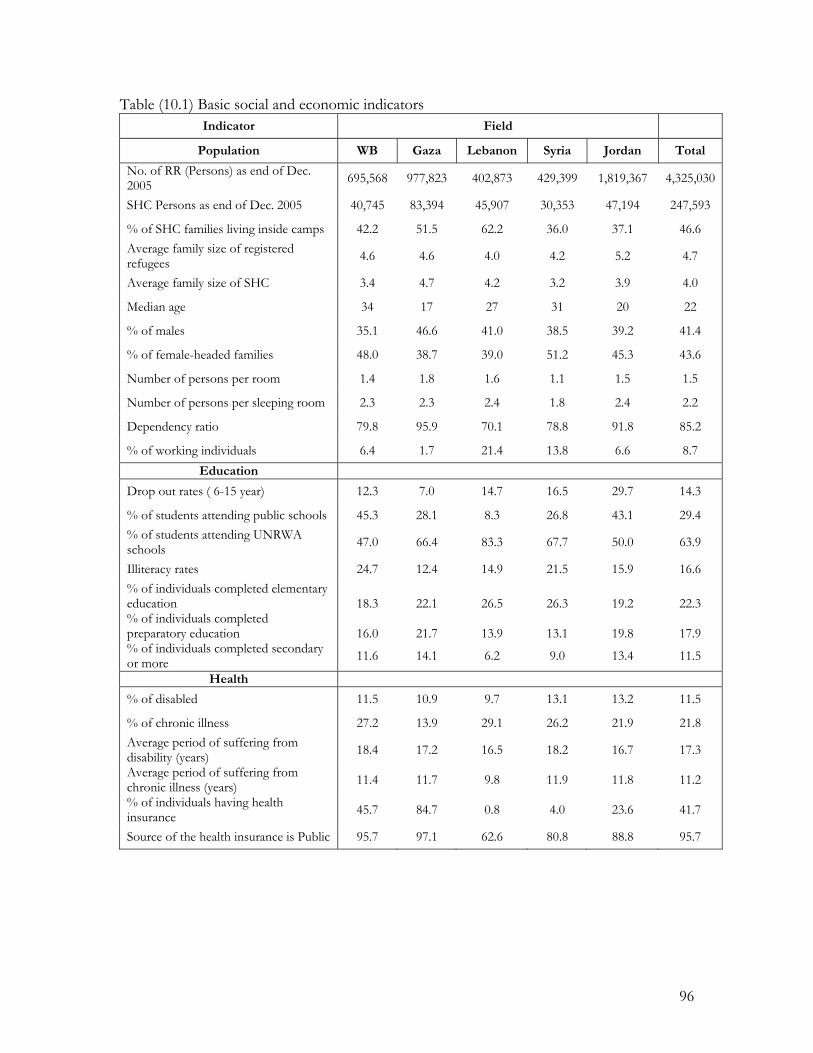
96
Table (10.1) Basic social and economic indicators Indicator Field
Population WB Gaza Lebanon Syria Jordan Total
No. of RR (Persons) as end of Dec. 2005 695,568 977,823 402,873 429,399 1,819,367 4,325,030
SHC Persons as end of Dec. 2005 40,745 83,394 45,907 30,353 47,194 247,593
% of SHC families living inside camps 42.2 51.5 62.2 36.0 37.1 46.6 Average family size of registered refugees 4.6 4.6 4.0 4.2 5.2 4.7
Average family size of SHC 3.4 4.7 4.2 3.2 3.9 4.0
Median age 34 17 27 31 20 22
% of males 35.1 46.6 41.0 38.5 39.2 41.4
% of female-headed families 48.0 38.7 39.0 51.2 45.3 43.6
Number of persons per room 1.4 1.8 1.6 1.1 1.5 1.5
Number of persons per sleeping room 2.3 2.3 2.4 1.8 2.4 2.2
Dependency ratio 79.8 95.9 70.1 78.8 91.8 85.2
% of working individuals 6.4 1.7 21.4 13.8 6.6 8.7 Education
Drop out rates ( 6-15 year) 12.3 7.0 14.7 16.5 29.7 14.3
% of students attending public schools 45.3 28.1 8.3 26.8 43.1 29.4 % of students attending UNRWA schools 47.0 66.4 83.3 67.7 50.0 63.9
Illiteracy rates 24.7 12.4 14.9 21.5 15.9 16.6 % of individuals completed elementary education 18.3 22.1 26.5 26.3 19.2 22.3 % of individuals completed preparatory education 16.0 21.7 13.9 13.1 19.8 17.9 % of individuals completed secondary or more 11.6 14.1 6.2 9.0 13.4 11.5
Health % of disabled 11.5 10.9 9.7 13.1 13.2 11.5
% of chronic illness 27.2 13.9 29.1 26.2 21.9 21.8 Average period of suffering from disability (years) 18.4 17.2 16.5 18.2 16.7 17.3
Average period of suffering from chronic illness (years) 11.4 11.7 9.8 11.9 11.8 11.2
% of individuals having health insurance 45.7 84.7 0.8 4.0 23.6 41.7
Source of the health insurance is Public 95.7 97.1 62.6 80.8 88.8 95.7
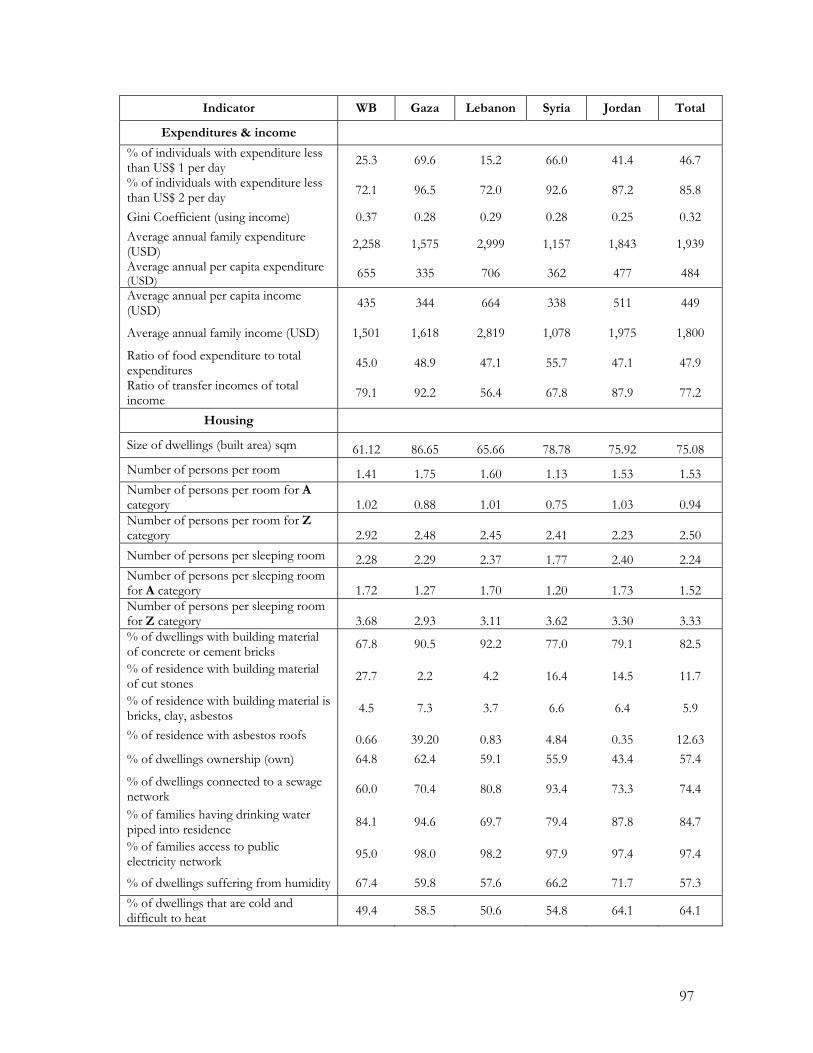
97
Indicator WB Gaza Lebanon Syria Jordan Total
Expenditures & income % of individuals with expenditure less than US$ 1 per day 25.3 69.6 15.2 66.0 41.4 46.7
% of individuals with expenditure less than US$ 2 per day 72.1 96.5 72.0 92.6 87.2 85.8
Gini Coefficient (using income) 0.37 0.28 0.29 0.28 0.25 0.32 Average annual family expenditure (USD) 2,258 1,575 2,999 1,157 1,843 1,939
Average annual per capita expenditure (USD) 655 335 706 362 477 484
Average annual per capita income (USD) 435 344 664 338 511 449
Average annual family income (USD) 1,501 1,618 2,819 1,078 1,975 1,800
Ratio of food expenditure to total expenditures 45.0 48.9 47.1 55.7 47.1 47.9
Ratio of transfer incomes of total income 79.1 92.2 56.4 67.8 87.9 77.2
Housing
Size of dwellings (built area) sqm 61.12 86.65 65.66 78.78 75.92 75.08 Number of persons per room 1.41 1.75 1.60 1.13 1.53 1.53 Number of persons per room for A category 1.02 0.88 1.01 0.75 1.03 0.94 Number of persons per room for Z category 2.92 2.48 2.45 2.41 2.23 2.50 Number of persons per sleeping room 2.28 2.29 2.37 1.77 2.40 2.24 Number of persons per sleeping room for A category 1.72 1.27 1.70 1.20 1.73 1.52 Number of persons per sleeping room for Z category 3.68 2.93 3.11 3.62 3.30 3.33 % of dwellings with building material of concrete or cement bricks 67.8 90.5 92.2 77.0 79.1 82.5
% of residence with building material of cut stones 27.7 2.2 4.2 16.4 14.5 11.7
% of residence with building material is bricks, clay, asbestos 4.5 7.3 3.7 6.6 6.4 5.9
% of residence with asbestos roofs 0.66 39.20 0.83 4.84 0.35 12.63 % of dwellings ownership (own) 64.8 62.4 59.1 55.9 43.4 57.4
% of dwellings connected to a sewage network 60.0 70.4 80.8 93.4 73.3 74.4
% of families having drinking water piped into residence 84.1 94.6 69.7 79.4 87.8 84.7
% of families access to public electricity network 95.0 98.0 98.2 97.9 97.4 97.4
% of dwellings suffering from humidity 67.4 59.8 57.6 66.2 71.7 57.3 % of dwellings that are cold and difficult to heat 49.4 58.5 50.6 54.8 64.1 64.1

98
Indicator WB Gaza Lebanon Syria Jordan Total
% of dwellings that are hot in summer 43.9 47.0 31.6 40.0 46.7 56.0
% of dwellings that are poorly ventilated 41.4 41.6 32.8 45.8 48.9 42.6
% of dwellings that are dark and gloomy 41.4 41.6 32.8 45.8 48.9 42.1
% of dwellings without heat 12.09 57.60 22.80 2.75 2.50 24.09
Food assessment
% of families that consume all quantities of flour 86.6 96.7 65.6 31.3 35.9 67.4
% of families that sell all quantities of flour 4.4 0.3 14.9 30.9 33.9 14.9
% of families that considered the quantities of flour not sufficient 43.4 28.2 37.4 60.8 32.6 38.3
%Distribution of households preferring all food 1.3 1.4 4.8 6.6 7.6 4.0
%Distribution of households preferring all cash 13.9 11.4 18.6 22.1 28.8 18.2
%Distribution of households preferring part-food and part-cash 84.8 87.2 76.6 71.4 63.6 77.8
Third, SHC families occupy a limited space, with an average dwelling size of 75 square meters and an average per person built area of 18.5 sqm. The size of the dwelling differs by place of residence, i.e., camp and outside camp, whereby the size of the dwelling inside camps is on average smaller than outside camps (67 sqm compared with 82 sqm for outside camp dwellings), which indicates that SHC families living in the camps suffer more from crowded conditions. The results indicate that this limited space is by no means the only factor that affects the living conditions of SHC families. The majority of the dwellings have three rooms or less, with an average of 1.5 persons per room and 2.2 persons per sleeping room. However, the average number of persons per room and per sleeping room for all fields conceals disparities among the various categories of the SHC programme. For example, the smallest number of persons per room and per sleeping room is observed for the “A”, “O” and “W” categories. In fact, the average number of persons per room for the “A”, “O” and “W” categories is 0.9, 0.8 and 1 persons per room and 1.5, 1.3 and 1.7 persons per sleeping rooms, respectively. On the other hand, the average number of persons per room for the “Z”, “M” and “E” categories is 2.5, 2.3 and 2.2 persons per room respectively. The average number of persons per sleeping room for the same categories increases even further, whereby 3.2 persons for the “Z” category, 3.1 persons for the “M” category and 2.7 persons per sleeping room for the “E” category. Therefore, the overall crowded conditions for the last three categories are a clear indicator of overcrowded living conditions by national and international standards. For the first three categories, discussed above, the average number of persons per room and per sleeping room does not represent crowded conditions. Based on these results, it is clear that the living conditions of SHC families differ quite considerably and any intervention to help these families would have to take into consideration the various living conditions of each family separately.

99
The limited space and family size may contribute to both overcrowding and lower economic status. However, these are not the only factors that affect the overall living conditions of SHC families. In addition to the limited space and family size, the majority of dwellings suffer from unhealthy indoor environments (humidity, poor ventilation, leakage during winter, etc.), which further contributes to lower living conditions. These conditions combined indicate clearly that almost one-half of dwellings are sub-standard and inadequate to live in, and that most are certainly in need of restructuring to make them properly serviceable. This picture is worsened by lack of physical infrastructure in some fields, whereby some of SHC dwellings, mainly outside camps are not connected to the sewage network, especially in the West Bank. In fact, about 60 per cent of SHC families living outside camps in the West Bank are not connected to a sewage network compared with only 12 per cent for SHC families living inside camps.
As seen in chapter 8, more than 84 per cent of SHC families have access to drinking water that is piped directly into their residence, regardless of place of residence. Yet, camp residences have a better overall access to amenities, which is partly explained by the services provided to the camps by UNRWA and host authorities. Also, almost all SHC families in the five fields have access to electricity, and nearly all households have independent kitchens and toilet facilities within the residence. Most SHC families have good access to public community services and can fulfil most of their daily needs quite close to home, except for public and private hospitals, whereby more than 60 per cent of SHC families have to commute more than 5 km to reach the closest hospitals, and some 11.6 per cent do not have the services at all within their communities. Overall, SHC camp residents tend to be better equipped with infrastructure facilities and services than to SHC families residing outside camps. Fourth, the analyses of educational levels and attainment show that increases in educational attainment have an important impact on reducing the probability that a household is in hardship. Indeed SHC individuals with higher education have generally achieved the highest income on average and are not part of the lower income groups. On the other hand, those with less than preparatory education represent the majority of the lower income groups in the five fields. Thus as educational achievement increases, the probability of being in the lower income groups decreases. It is evident from the results that SHC individuals have given priority to completing education up to the level where it is free of charge and provided either by UNRWA at the elementary and preparatory level (secondary level in Lebanon only), or by host authorities at the secondary level. Beyond these levels, the percentage of SHC individuals who go on to complete their education drops dramatically, especially for post-secondary education.
Another indicator of educational accomplishment that is used in this report is the drop out rate. The results indicate on average that more than 14 per cent of persons aged 6 to 15 years old drop out of school in all fields; this increases to 37.3 per cent for age groups 16 to 18 years old, i.e., the secondary cycle. In fact, at the age of 17 years, only around two-thirds of students are still enrolled and at the age of 18 years (the last year in secondary education cycle) the ratio drops down to almost one-half. The highest percentage of drop outs for persons between 6 and 15 years old is recorded for SHC families in Jordan (29.7 per cent) and the lowest is in Gaza (7 per cent). The highest drop out ratio for persons 18 years of age
100
is in Syria, in which more than 80 per cent of SHC individuals leave school before completing their secondary education. The high drop out rates among SHC individuals are mostly related to poverty of the family (20.6 per cent), school failure (15 per cent), marriage (12.7 per cent) social restriction (9.8 per cent) and other factors as well.
Fifth, the data reveals that health differences are closely associated with age. It comes as no surprise that bad health is associated with age. As seen in chapter five, 21.8 per cent of individuals suffer from a chronic health problem and another 11.5 per cent suffer from some kind of a disability. The percentages differ quite considerably for those above 50 years old, whereby more than 62 per cent of individuals suffer from a chronic health problem and another 20.3 per cent suffer from various disabilities. Overall, males suffer more than females from disabilities and chronic health problems across all age groups. Furthermore, while the health indicator adopted here is a simple assessment based on current suffering or illness, we have seen in chapter five that the situation is quite complex. For example, four kind of chronic illnesses account for more than 72 per cent of all illnesses among SHC individuals, with the highest percentage related to bones and muscles, diabetes, elevated blood pressure and heart and blood vessels. Another indicator of health service is related to the possession of health insurance. More than 58 per cent of SHC families do not have any type of health insurance, with almost all SHC families in Lebanon and only 15 per cent in Gaza not having health insurance. The absence of health insurance in Lebanon is a clear indicator that SHC families suffer the most compared to SHC families in other fields in this regard and endure higher costs for the provision of health services, which necessarily draws on the overall meagre resources of SHC families.
Sixth, the majority of SHC individuals do not work and are not labour force participants, although more than half of SHC individuals are of working age. Among individuals between the ages of 15 and 65 years old, 88 per cent of them do not work; the small percentage of those who work, work as paid employees, with the highest number of working individuals found in Lebanon (21.4 per cent of total SHC population in Lebanon). It has to be noted that the eligibility criteria of the SHC programme largely exclude adult individuals who are able to work9, hence, the small percentage of those who work among SHC families. The age distribution of workers follows in general the life-cycle pattern of workers in host countries, whereby participation in the labour force rises for the younger age groups and then declines as a person gets older, especially after the age of retirement.
Seventh, it is hardly news to report that SHC families have low income and expenditures levels overall. The majority of SHC families are in hardship by definition, although some have more income and expenditures levels than others. The results indicate that more than 68 per cent of SHC individuals have annual income of less than USD 600 and only 10 per cent have annual income of more than USD 1,000, with an average annual per capita income of USD 435. Although, these figures are higher than the World Bank subsistence poverty line of USD 1 per person per day, the averages conceals disparities among fields. For
9 The criteria of the SHC programme excludes adult individuals between the ages of 19-60 years old, as stipulated in the RSI.

101
example, in Syria the median per capita daily income is less than USD 1 and the average median income for all fields is slightly higher than USD 1 per person per day. A simple poverty analysis of expenditure levels among SHC individuals according to the World Bank standards of one and two US dollars a day, reveals that 46.7 per cent of SHC individual have expenditure levels of less than UDS 1 a day and 85.8 per cent have expenditure levels of less than USD 2 a day. The results differ quite considerably among fields, whereby almost all (96.5 per cent) of SHC individual in Gaza are below the USD 2 a day and around 70 per cent have expenditure levels of less than USD 1 a day. The lowest percentages of poverty levels are recoded for SHC individuals in Lebanon, whereby 15.2 per cent of individuals have expenditure levels of less than USD 1 a day and 72 per cent of individuals have expenditures of less than USD 2 a day. These results point directly to the different standards of living and purchasing power parity prevalent in host societies. Nonetheless, the results point directly to the low income/expenditure levels of SHC families in the five fields.
Transfer income, as explained in chapter seven, is the most important source of income for more than 83 per cent of SHC families and almost all families in the lowest income decile depend on it. The reliance on transfers diminishes slightly as we move up the income ladder and reaches its peak for the ninth decile — when the population is divided into ten deciles the bottom or the first decile represents the lowest income group and the top or the tenth decile represents the highest income group and so on — but decreases again for the tenth decile. Dependency on transfer incomes among lowest income groups is not a transitory phenomenon, since hardship among them is largely chronic. Eighth, regarding the current distribution mechanism of food rations, the majority (78 per cent) of SHC families prefer to keep the current distribution mechanism of part-food and part-cash, and only 18.2 per cent prefer to receive all the assistance in the form of all cash. The rationale provided for the former lies mainly in the security that the food part provides the family with, cheaper prices of food items when purchased by UNRWA than prevalent in local markets, and the cash part provides the family with the flexibility to purchase other needed items.
Regarding the utilization of the food items, the decision of the Agency to discontinue the distribution of flour in Jordan and Syria is in line with the overall consumption levels of the item. However, in the Lebanon field, around two-thirds of families consume all the flour quantities they receive and only about 15 per cent sell all the quantities, which does not concur with the decision of the Agency to discontinue the distribution of flour in Lebanon. In terms of other items, the overall consumption levels do not necessitate replacement of any of the items, since more than 93 per cent of the SHC families consume all the quantities they receive and only a fraction of them sell these quantities. It has been evident throughout the report that SHC families suffer from various social and economic problems. There is a clear ‘deficit’ in housing and housing conditions, education, health services, access to the labour market and access to community infrastructure, particularly public and private hospitals. Although, the SHC families identified in this report are in hardship by definition, the socio-economic analysis of living conditions point clearly to
102
the fact that a clear difference exists amongst them in terms of expenditures and income levels. The majority are at the bottom distribution scale of income and expenditures, while others fare much better. However, all SHC income decile groups receive the same level of assistance, regardless of their income level. The only deviation is related to family size in which a family with more members would receive more rations compared to a family with less family member. On the other hand, if two families are of the same size but have different income levels, both them would receive the same level of assistance regardless of their income, although one of them is poorer than the other. This fact calls for a revised payment schemes and eligibility criteria, which should consider only the needs of families based on their living standards.
Finally, having a low income restricts the ability of the poor to deal with a crisis from various risks such as illness and injury, old age, unemployment, closures, and other internal conflicts. Food aid and cash subsidy programs are one of the formal mechanisms to help the poor cope with the above types of crises and, if they are in place on a permanent basis, can also serve risk mitigating purposes. However, lack of sufficient funding for the SHC programme continues to be a hindrance towards making a dent on poverty, particularly since the combined value of food aid and cash subsidy is much lower than the established absolute poverty line, even much lower than the abject poverty line, i.e., the food poverty line in host countries.
103
Policy Implications
With the proposed restructuring of the SHC programme from a status-based to a needs-based approach, which includes the establishment of field-specific poverty thresholds to replace the current income thresholds, revision of eligibility criteria, development of a proxy means testing formula to predict the overall family expenditures, revision of the current benefit levels through the introduction of a Family Income Supplement scheme, and the restructuring of the field social study system (FSS) to include more socio-economic information on beneficiaries, the current socio-economic analysis of living conditions of SHC families in the five fields of UNRWA operations provides practical tools to consider various key policy options that will touch upon the lives of many poor families. The analyses in previous chapters have shown that SHC families suffer from various forms of deprivation, including low incomes, high drop out rates among children of schools age, low level of skills, inadequate health services, public infrastructure, and housing and housing conditions. To address these concerns, there is a need for a comprehensive development strategy that takes into consideration the assets of beneficiary families for the ultimate objective of “graduating them” out of the programme in the long-run, particularly for the transient poor. Such a strategy should address the prevailing circumstances from a realistic, flexible and incremental framework, taking into consideration the available resources of the Agency. The findings of the survey and the evaluation of the SHC programme have several key policy implications. 1. The main findings of the survey show that SHC families are a heterogeneous population
in terms of their socio-economic characteristics. The majority of them have low incomes overall, however, the SHC programme provides them with one-size-fits-all rations regardless of their living standards. Therefore, families whose incomes fall in the bottom income decile receive the same amount of rations as those falling in the top income decile, regardless of their needs. There is a need to recognize that SHC families are not a homogenous group and different segments have needs, which require differentiated response. Accordingly, there is a need to move from one-size-fits-all to a more contextualized approach that better addresses the actual needs of poor families.
2. The current income thresholds currently used by the programme are by no means
poverty lines. In fact, they are in most cases much higher than the established host authority poverty lines and therefore, many non-poor families are benefiting from the Programme. This fact calls for a total revision of income thresholds and adopting field-specific poverty lines that fulfils the basic determinants of the poverty line, such as local consumption habits, individuals needs, and economic of scale in consumption. These poverty lines can only be derived through the utilization of national Household Expenditures and Income Surveys that are representative of the whole population in host countries.
3. Considering the high proportion of refugees that live in poverty in the five fields, the
current level of assistance through the SHC programme does not come close to meeting

104
basic needs. Therefore, and in order to reduce poverty levels among the most vulnerable refugees, there is a need for a substantial enhancement of the targeting of the extremely poor and ensuring that their consumption level is not below the food poverty threshold (the abject poverty line), which is in line with the first Millennium Development Goal of eradicating extreme poverty by 2015. The highest priority policy should be given to address poverty among the poorest of the poor, which requires the design of instruments to target them accurately.
4. The large family size coupled with the young population in the M and Z categories of the
SHC programme require further investigation to ascertain family member skill levels, age and educational levels, especially among the young in order to provide them with opportunities to develop marketable skills that allow them to enter the labour market, upon completing their education.
5. The working poor are largely excluded from the programme by definition; however, they
should be an integral part of the programme. As demonstrated in previous analysis, the majority of working individuals among SHC families earn very low wages and this wage level does not provide them with an opportunity to escape poverty.
6. More than half (51.5 per cent) of SHC individuals are of working age, yet the majority
(88 per cent) of them do not work. However, it should be clarified that out those who do not work, 27.9 per cent suffer from some kind of a disability or a chronic illness and another 21.6 per cent are students. With regard to those who do not work and suffer form disabilities or chronic illnesses, only 44.8 per cent can potentially work. This means that 63 per cent of individuals who do not work are able to work. Therefore, special programmes for those who are not working and able to work should be put in place, with the first priority given to those with special skills and those with vocational training.
7. There is a need to stop the implied intergenerational transmission of poverty indicated
by the high dropout ratio among children of school age. Perhaps some education subsidies or conditionality could be introduced. Education is long acknowledged as one of the potent means for moving out of poverty.
8. Some individuals drop out of school because of lack of resources to continue their post-
secondary education. A policy should be adopted to the provision of special educational grants or scholarships for post-secondary education.
9. High illiteracy rates among SHC individuals, especially among female heads of families
require the introduction of special educational programmes for the eradication of illiteracy among them.
10. The results of the survey show that some SHC families do not possess any type of health
insurance, and in Lebanon almost all of SHC families do not benefit from such coverage. The absence of health insurance among SHC families in Lebanon is a clear indicator that SHC families suffer the most compared to SHC families in other fields in this regard and they endure higher costs for the provision of health services, which necessarily drains the overall meagre resources of families. Similar to the National Aid Fund beneficiaries in

105
Jordan, the second priority policy should be given to the provision of health insurance to all SHC families who do not have it.
11. The high incidence of chronic illnesses among SHC individuals requires further
investigation, assessment and possibly the need for an expansion of health interventions. 12. 33.5 per cent of individuals with some kind of disabilities indicated that they have
difficulty moving around the house without the help of others. This fact calls for further investigation and devising proper interventions to aid mobility of those individuals inside their houses.
13. Overcrowded living conditions among some groups of SHC families require further
investigation and evaluation on a case-by-case basis, especially for large household families.
14. The results of the SHC survey indicate that almost one-half of SHC dwellings are sub-
standard and inadequate to live in, and that most are certainly in need of restructuring and /or repair to make them properly serviceable.
15. The unhealthy indoor environment is further worsened by lack of some physical
infrastructure in some fields, whereby some SHC dwellings, mainly outside camps, are not connected to a sewage network, especially in the West Bank. Therefore, there is a need to raise the standards of sewage services in deprived localities to the national standards.
16. On the issue of cash verses in-kind transfers, two principles can be extracted from the
food assessment survey. First, the judgment about which resources to transfer should be based on a pre-assessment of local economic conditions, especially of availability of commodities and their prices. Second, the voices of the intended beneficiaries should be heard and, whenever possible, their preferences should be respected. This might entail transferring different resources to different categories of people. However, it should be pointed out that host authorities social assistance programmes that involve regular cash payments, such as in Jordan and oPt, give beneficiaries the most choice and the confidence to use some of this transfer income creatively. Therefore, social assistance programmes generate the highest value and broadest range of benefits at the individual level.
17. The fact that about two-thirds of SHC families in Lebanon indicated that they consume
all the flour they receive requires a further investigation on a field level as to the discontinuation of the flour in Lebanon.
18. Finally, lack of sufficient funding for the SHC programme continues to be a hindrance
towards making a dent on poverty, particularly since the combined value of food aid and cash subsidy is much lower than the established absolute poverty line, even much lower than the abject poverty line, i.e., the food poverty line in host countries.
106
Annex (1)
Methodological Note on the Sample
Sample Design
In line with the objectives of the survey of constructing a complete socio-economic profile of Special Hardship Case families and in order to draw conclusions about the whole SHC population in the five fields, required representation of the sample and taking into consideration various determinant variables in the design. In order to achieve these objectives, and utilizing the data available in the FSS, keeping in mind that constraints exist in the data, a stratified random sampling method was adopted for designing the sample, using the Nyman allocation method allocate the sample among the different stratum in each area. The Nyman allocation method is a sample allocation method that takes into consideration (1) the size of each stratum (number of SHC families in each stratum); and (2) the variance of family income in each stratum. The family income was used as the main variable in determining the sample size in each stratum and reaching a high precision level to achieve the objectives of the study.
The stratified random sampling method was determined to be the most applicable method because (1) it provides the data at the area level (UNRWA administrative unit); (2) to ensure homogeneity among SHC population in each stratum; and (3) because it simplifies the fieldwork, in terms of defining the scope of work and finding the proper addresses, and therefore, each centre was considered a stratum. .
Population Frame
UNRWA’s FSS database provides a comprehensive frame for all SHC families, which included, among others, the address for each SHC family the total income, and SHC categories. Therefore, the target population for this survey is well defined and available for drawing a sample.
Stratification
In order to provide homogeneity among the population in each stratum the frame was divided into fields and each field was divided into areas. The areas were then divided into centres, which formed the smallest geographic unit for analysis. The centre is considered a stratum for the purpose of this sample, and SHC families were selected from each centre. When the final sample was drawn for each field separately, the various categories of SHC families were taken into consideration to provide implicit stratification (well distribution of the sample among different SHC categories and to improve the quality of the sample) and to improve the efficiency of the sample design.
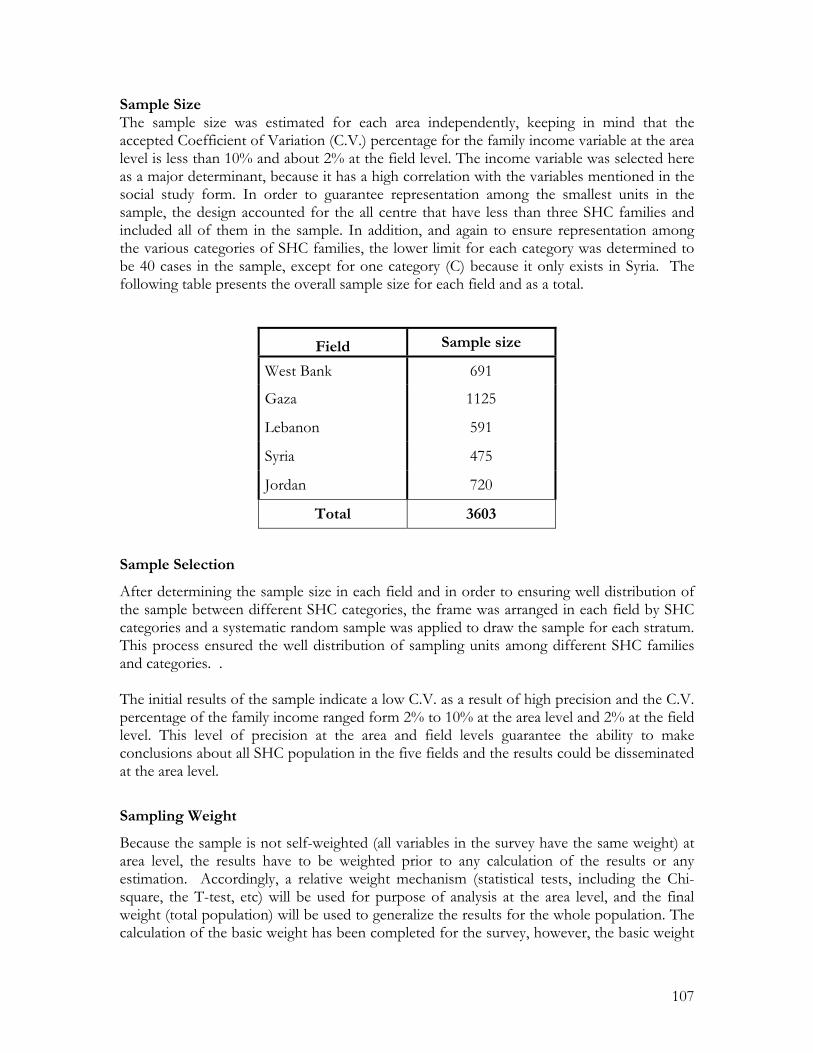
107
Sample Size The sample size was estimated for each area independently, keeping in mind that the accepted Coefficient of Variation (C.V.) percentage for the family income variable at the area level is less than 10% and about 2% at the field level. The income variable was selected here as a major determinant, because it has a high correlation with the variables mentioned in the social study form. In order to guarantee representation among the smallest units in the sample, the design accounted for the all centre that have less than three SHC families and included all of them in the sample. In addition, and again to ensure representation among the various categories of SHC families, the lower limit for each category was determined to be 40 cases in the sample, except for one category (C) because it only exists in Syria. The following table presents the overall sample size for each field and as a total.
Sample size Field
691 West Bank
1125 Gaza
591 Lebanon
475 Syria
720 Jordan
3603 Total
Sample Selection
After determining the sample size in each field and in order to ensuring well distribution of the sample between different SHC categories, the frame was arranged in each field by SHC categories and a systematic random sample was applied to draw the sample for each stratum. This process ensured the well distribution of sampling units among different SHC families and categories. . The initial results of the sample indicate a low C.V. as a result of high precision and the C.V. percentage of the family income ranged form 2% to 10% at the area level and 2% at the field level. This level of precision at the area and field levels guarantee the ability to make conclusions about all SHC population in the five fields and the results could be disseminated at the area level.
Sampling Weight
Because the sample is not self-weighted (all variables in the survey have the same weight) at area level, the results have to be weighted prior to any calculation of the results or any estimation. Accordingly, a relative weight mechanism (statistical tests, including the Chi-square, the T-test, etc) will be used for purpose of analysis at the area level, and the final weight (total population) will be used to generalize the results for the whole population. The calculation of the basic weight has been completed for the survey, however, the basic weight
108
will subject to adjustment after concluding the survey, taking into consideration the non-response in the sample.
109
Annex (2)
The Questionnaire

110
Annex (2)
UUNNIITTEEDD NNAATTIIOONNSS RREELLIIEEFF AANNDD WWOORRKKSS AAGGEENNCCYY Department of Relief and Social Services
Social Study Form: Re-Study
Questionnaire ID: |__|__|__|__|
1. Identification Information
101 Field: |__|
102 Area: |___|
103 Center |__|__|
104 Camp |__|__|
105 Registration No. |__|__|__|__|__|__|
| |106 Excode |__|__|__|__|__|__|
107 SHC No.: |__|__|__|__|__|__|
108 Category:
|__|
109 Distribution centre:
|__|__|__|__|
110 Name of head of family: __________________________________________________
111 Place of origin:
|__|__|__|__|__|
112
Address of family: _______________________________________________________
______________________________________________________________________
113 Telephone Number ( / )
114 Date of Submitted SHC Application (DD/MM/YYYY): |__|__|/|__|__|/|__|__|
| |
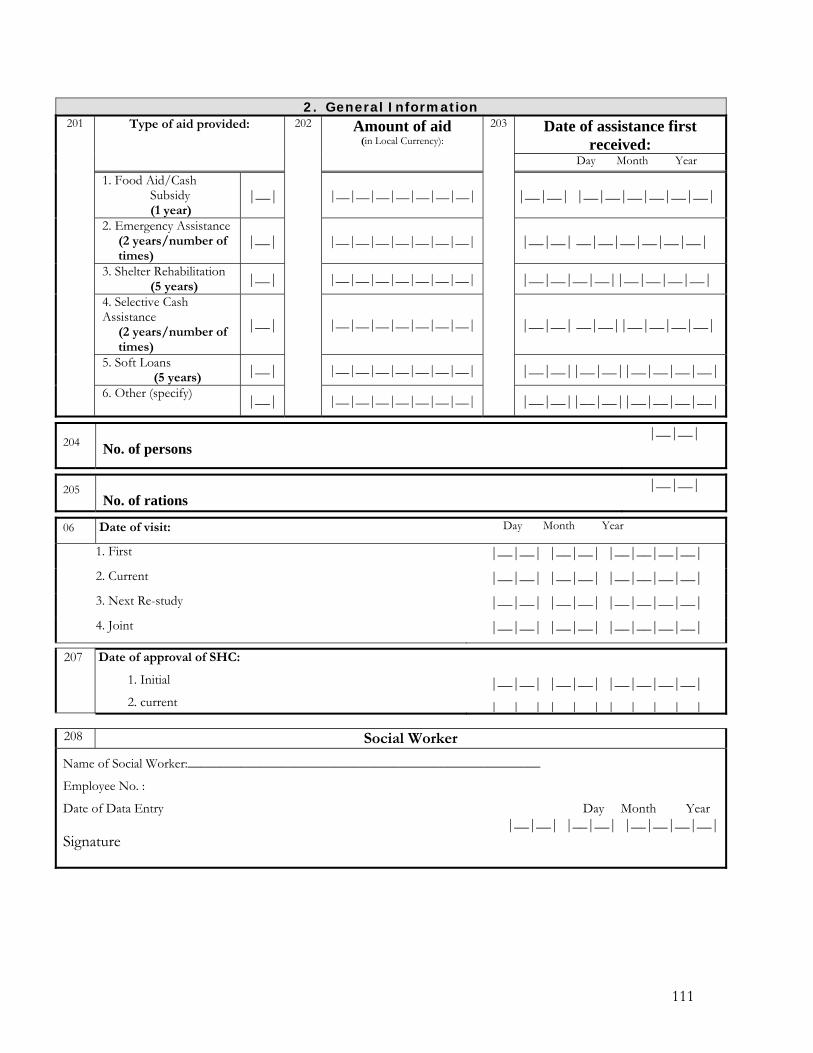
111
2. General Information Date of assistance first
received: Type of aid provided: Amount of aid
(in Local Currency):
Day Month Year
1. Food Aid/Cash Subsidy (1 year)
|__| |__|__|__|__|__|__|__| |__|__| |__|__|__|__|__|__|
2. Emergency Assistance (2 years/number of times)
|__| |__|__|__|__|__|__|__| |__|__| __|__|__|__|__|__|
3. Shelter Rehabilitation (5 years) |__| |__|__|__|__|__|__|__| |__|__|__|__||__|__|__|__|
4. Selective Cash Assistance
(2 years/number of times)
|__| |__|__|__|__|__|__|__| |__|__| __|__||__|__|__|__|
5. Soft Loans (5 years) |__| |__|__|__|__|__|__|__| |__|__||__|__||__|__|__|__|
201
6. Other (specify) |__|
202
|__|__|__|__|__|__|__|
203
|__|__||__|__||__|__|__|__|
204 No. of persons |__|__|
205 No. of rations
|__|__|
06 Date of visit: Day Month Year
1. First |__|__| |__|__| |__|__|__|__| 2. Current |__|__| |__|__| |__|__|__|__| 3. Next Re-study |__|__| |__|__| |__|__|__|__| 4. Joint |__|__| |__|__| |__|__|__|__|
207 Date of approval of SHC:
1. Initial
2. current
|__|__| |__|__| |__|__|__|__|
| | | | | | | | | | |
208 Social Worker
Name of Social Worker:_____________________________________________________
Employee No. :
Date of Data Entry Day Month Year |__|__| |__|__| |__|__|__|__|
Signature
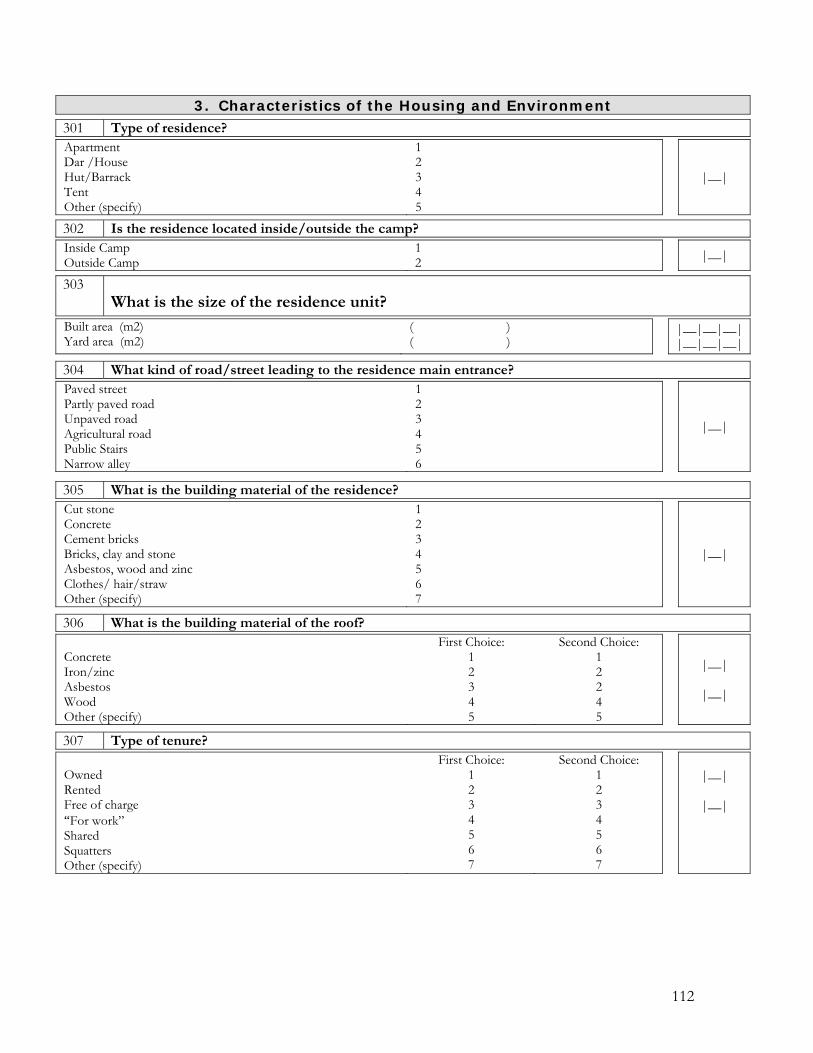
112
3. Characteristics of the Housing and Environment
301 Type of residence?
Apartment Dar /House Hut/Barrack Tent Other (specify)
1 2 3 4 5
|__|
302 Is the residence located inside/outside the camp?
Inside Camp Outside Camp
1 2 |__|
303 What is the size of the residence unit?
Built area (m2) Yard area (m2)
( ) ( )
|__|__|__| |__|__|__|
304 What kind of road/street leading to the residence main entrance?
Paved street Partly paved road Unpaved road Agricultural road Public Stairs Narrow alley
1 2 3 4 5 6
|__|
305 What is the building material of the residence?
Cut stone Concrete Cement bricks Bricks, clay and stone Asbestos, wood and zinc Clothes/ hair/straw Other (specify)
1 2 3 4 5 6 7
|__|
306 What is the building material of the roof?
Concrete Iron/zinc Asbestos Wood Other (specify)
First Choice: 1
2 3 4 5
Second Choice: 1 2 2 4 5
|__|
|__|
307 Type of tenure?
Owned Rented Free of charge “For work” Shared Squatters Other (specify)
First Choice: 1 2 3 4 5 6 7
Second Choice: 1 2 3 4 5 6 7
|__|
|__|

113
308 What type of toilet arrangements does the residence have? (circle what applies)
Toilet connected to sewage network Toilet connected to a percolation pit/ septic tank Covered dry latrine Other:
1 2 3 4
|__|
309 Location of Toilet Facilities?
In the Dwelling In Building, but outside of the dwelling Outside building DK
1 2 3 4
|__|
310 Does the residence have independent kitchen?
Yes No
1 2 |__|
311 What is the total number of rooms in the residence?
One Room Two Rooms Three Rooms Fours Rooms Five Rooms More than five rooms
1 2 3 4 5 6
|__|
312 How many rooms in the residence are used for sleeping?
One Room Two Rooms Three Rooms Fours Rooms Five Rooms More than five rooms
1 2 3 4 5 6
|__|
313 What are the two main sources for drinking water in the residence?
Piped into residence Piped into building, but not residence Piped into yard, plot Public tap Tanker truck Bottled water Well for collecting rainwater Well/borehole for ground water Other
First Choice: 1 2 3 4 5 6 7 8 9
Second Choice: 1 2 3 4 5 6 7 8 9
|__|
|__|
314 What are the two main sources of lighting in the residence?
The public electricity network Private generator Gas Kerosene Other (specify)
First Choice: 1 2 3 4 5
Second Choice: 1 2 3 4 5
|__|
|__|

114
315 What are the two main sources of heating in the residence?
Central heating Gas Kerosene Electricity Diesel Coal/ fire wood Other (specify) No heating
First Choice: 1 2 3 4 5 6 7 8
Second Choice: 1 2 3 4 5 6 7 8
|__|
|__|
316 What are the two main sources of fuel used for cooking?
Gas Kerosene Electricity Diesel Coal/ fire wood Other (specify)
First choice: 1 2 3 4 5 6
Second Choice: 1 2 3 4 5 6
|__|
|__|
317 How does the household dispose of garbage?
Open container Closed container Burn it Dig it down/ dumping Randomly thrown Collected Other (specify)
1 2 3 4 5 6 7
|__|
318 Type of Sewage system? Available & Used
Available Not Used
Not Available
Open 1 2 3 |__| Underground 1 2 3 |__| Septic Tanks 1 2 3 |__|
319 How far are the following services from the residence? (Mark the number in the next column)
1. Post Office |__| 2. Health Centres |__| 3. UNRWA health centre/clinic |__| 4. Public hospital |__| 5. Private hospital |__| 6. Pharmacy |__| 7. Community Centres |__| 8. Elementary school |__| 9. Preparatory school |__| 10. Basic school |__| 11. Secondary school |__| 12. UNRWA school |__| 13. Public market [street with shops, shopping malls]
1. Less than 500m 2. 500-2.9 km 3. 3-4.9 km 4. 5- 9.9 km 5. 10-19.9 km 6. 20km or more 7. Not available 8. DK
|__|
320 Are some or all of the rooms in the residence characterized by any of the following? (check all that applies)
All the house
Part of the
house
None
1. Humidity 1 2 3 |__| 2. Cold and difficult to heat in winter 1 2 3 |__|
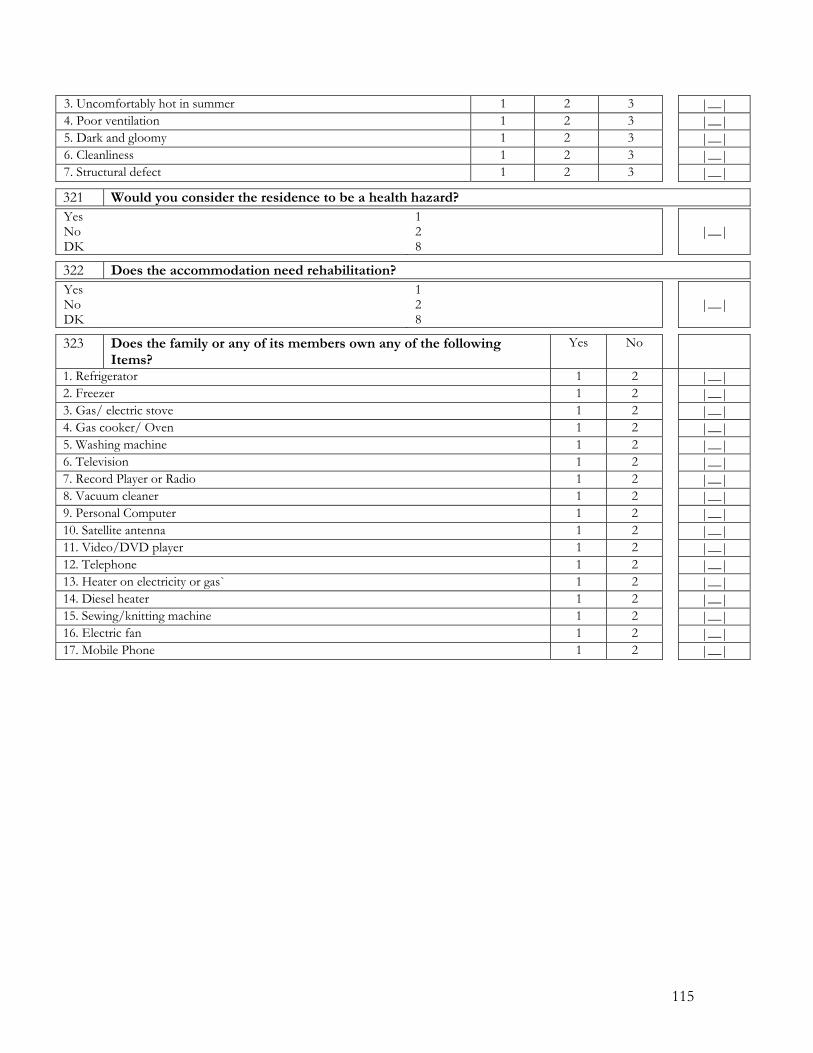
115
3. Uncomfortably hot in summer 1 2 3 |__| 4. Poor ventilation 1 2 3 |__| 5. Dark and gloomy 1 2 3 |__| 6. Cleanliness 1 2 3 |__| 7. Structural defect 1 2 3 |__|
321 Would you consider the residence to be a health hazard?
Yes No DK
1 2 8
|__|
322 Does the accommodation need rehabilitation?
Yes No DK
1 2 8
|__|
323 Does the family or any of its members own any of the following Items?
Yes No
1. Refrigerator 1 2 |__|
2. Freezer 1 2 |__|
3. Gas/ electric stove 1 2 |__|
4. Gas cooker/ Oven 1 2 |__|
5. Washing machine 1 2 |__|
6. Television 1 2 |__|
7. Record Player or Radio 1 2 |__|
8. Vacuum cleaner 1 2 |__|
9. Personal Computer 1 2 |__|
10. Satellite antenna 1 2 |__|
11. Video/DVD player 1 2 |__|
12. Telephone 1 2 |__|
13. Heater on electricity or gas` 1 2 |__|
14. Diesel heater 1 2 |__|
15. Sewing/knitting machine 1 2 |__|
16. Electric fan 1 2 |__|
17. Mobile Phone 1 2 |__|
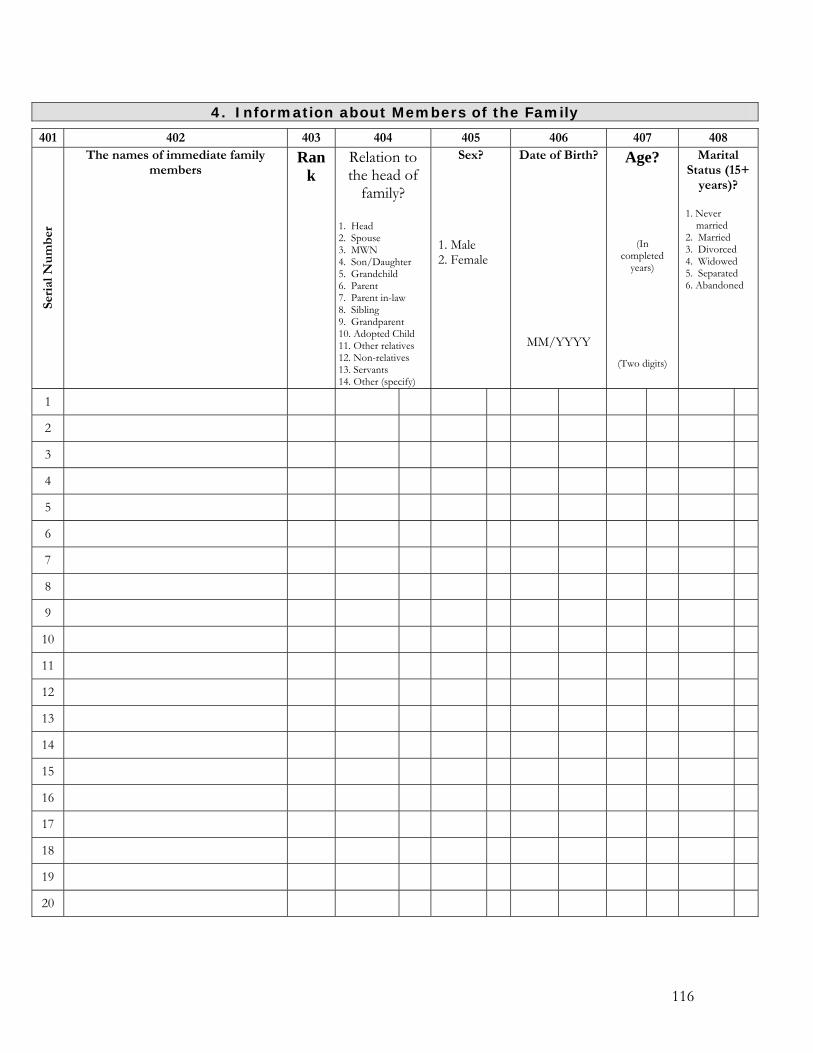
116
4. Information about Members of the Family
401 402 403 404 405 406 407 408
Seri
al N
um
ber
The names of immediate family members
Rank
Relation to the head of
family?
1. Head 2. Spouse 3. MWN 4. Son/Daughter 5. Grandchild 6. Parent 7. Parent in-law 8. Sibling 9. Grandparent 10. Adopted Child 11. Other relatives 12. Non-relatives 13. Servants 14. Other (specify)
Sex?
1. Male 2. Female
Date of Birth?
MM/YYYY
Age?
(In completed
years)
(Two digits)
Marital Status (15+
years)?
1. Never married 2. Married 3. Divorced 4. Widowed 5. Separated 6. Abandoned
1
2
3
4
5
6
7
8
9
10
11
12
13
14
15
16
17
18
19
20

117
4. Information about Members of the Family
Education 409 410 411 412
Individual Status
1. Living with the family 2. Imprisoned 3. Wanted 4. Boarding Student 5. Student Abroad 6. Moved away 7. Compulsory Military Services 8. Working abroad 9. Died 10. Other (specify)
Is s/he currently enrolled or has
ever been enrolled at an educational institution?
1. Yes, currently enrolled 2. No, before 3. No, never 4. N/A
What is the number of years s/he completed, except the
years in kindergarten?
(Write the number of years in two digits).
Years
What is the educational stage that s/he ever successfully completed? 1. Illiterate 2. Read and write 3. Elementary 4. Preparatory 5. Basic 6. Vocational Education 7. Secondary 8. Intermediate Diploma 9. B.A., B.Sc. 10. Higher diploma 11. M.A. 12. Ph.D.
Go to Q. 414
Go to Q. 415
Go to Q. 417

118
4. Information about Members of the Family
Education 413 414 415
What is his/here educational
Specialization?
(Write down the answer)
What is the supervising
agency of the educational
institution that s/he currently
attends? 1. Public 2. Private 3. UNRWA 4. Military 5. Other (specify)
What is the main reason for not enrolling or leaving
school? 1. Disability, illness 2. Poverty of family 3. Break-up of family 4. School not available or too far 5. Difficulties with transportation 6. Marriage 7. Caring for family/housework 8. School failure 9. Work 10. Did not like school 11. High cost of school 12. Pregnancy 13. Social restriction 14. Other (specify)
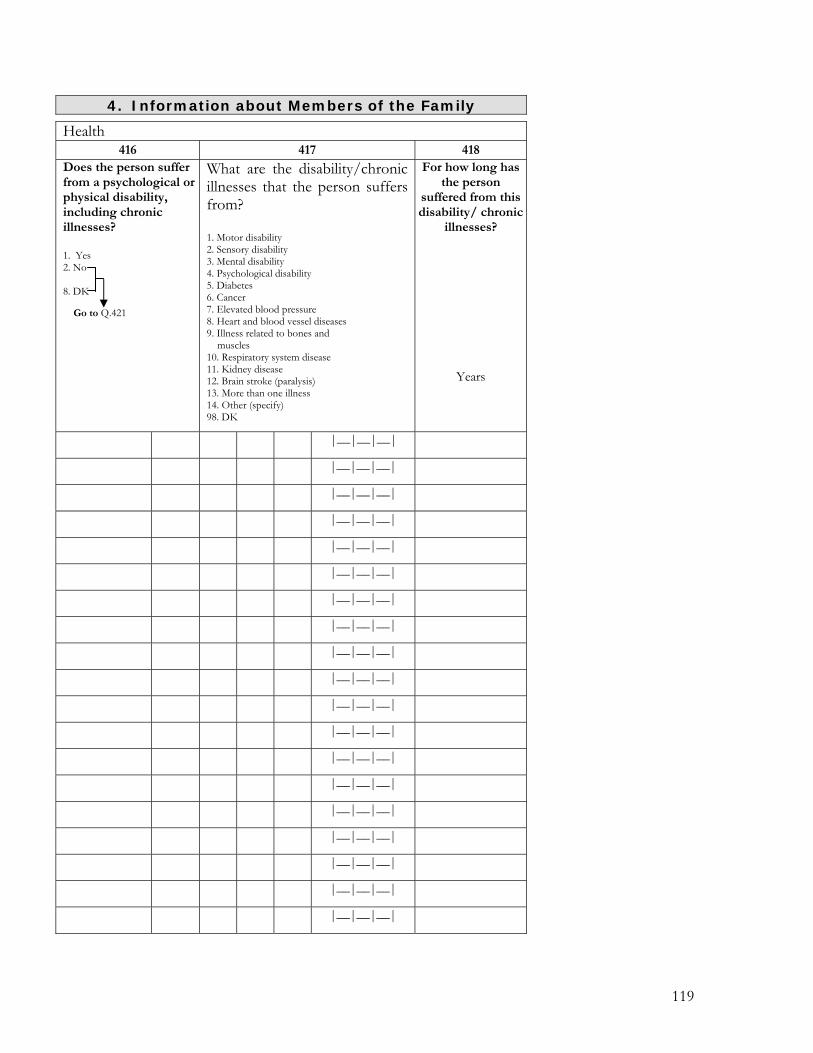
119
4. Information about Members of the Family
Health 416 417 418
Does the person suffer from a psychological or physical disability, including chronic illnesses? 1. Yes 2. No 8. DK
What are the disability/chronic illnesses that the person suffers from? 1. Motor disability 2. Sensory disability 3. Mental disability 4. Psychological disability 5. Diabetes 6. Cancer 7. Elevated blood pressure 8. Heart and blood vessel diseases 9. Illness related to bones and muscles 10. Respiratory system disease 11. Kidney disease 12. Brain stroke (paralysis) 13. More than one illness 14. Other (specify) 98. DK
For how long has the person
suffered from this disability/ chronic
illnesses?
Years
|__|__|__|
|__|__|__|
|__|__|__|
|__|__|__|
|__|__|__|
|__|__|__|
|__|__|__|
|__|__|__|
|__|__|__|
|__|__|__|
|__|__|__|
|__|__|__|
|__|__|__|
|__|__|__|
|__|__|__|
|__|__|__|
|__|__|__|
|__|__|__|
|__|__|__|
Go to Q.421

120
4. Information about Members of the Family
Health 419 420 421 422
Does this condition influence this
person's ability to work?
1. Partially 2. To a great level 3. Totally 4. Does not influence 8. DK
Does the person have difficulties leaving or moving around the house without help of others because of this disability/ chronic illnesses? 1. Yes 2. No 8. DK
Does the person
have health insurance?
1. Yes 2. No 8. DK __ Go to Q. 423
What is the source of the
health insurance?
1. Public 2. Military 3. Private sector 4. Other (Specify)
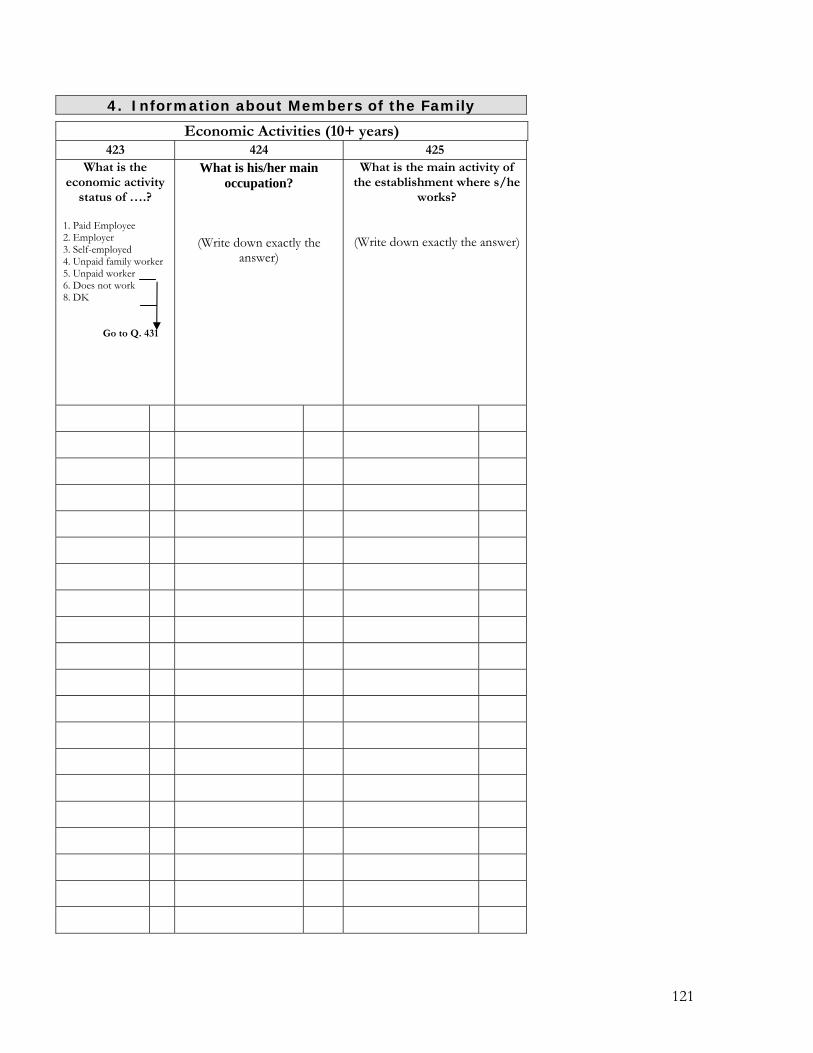
121
4. Information about Members of the Family
Economic Activities (10+ years) 423 424 425
What is the economic activity
status of ….?
1. Paid Employee 2. Employer 3. Self-employed 4. Unpaid family worker 5. Unpaid worker 6. Does not work 8. DK Go to Q. 431
What is his/her main occupation?
(Write down exactly the answer)
What is the main activity of the establishment where s/he
works?
(Write down exactly the answer)
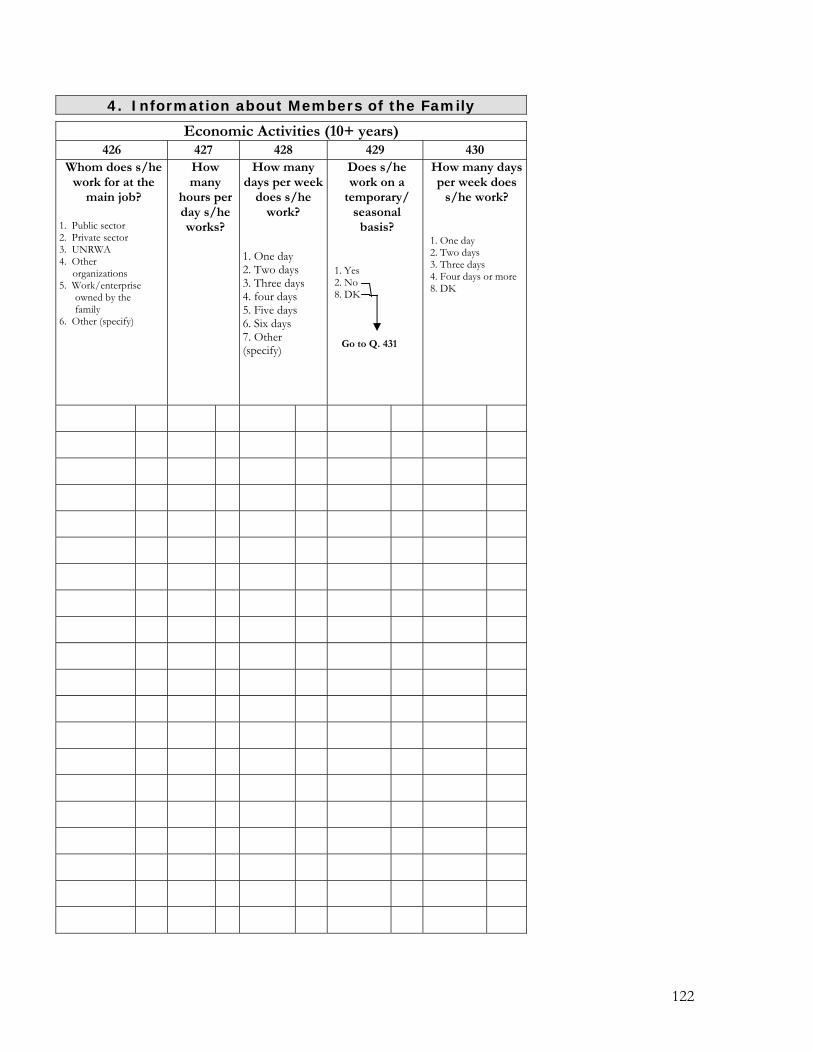
122
4. Information about Members of the Family
Economic Activities (10+ years) 426 427 428 429 430
Whom does s/he work for at the
main job?
1. Public sector 2. Private sector 3. UNRWA 4. Other organizations 5. Work/enterprise owned by the family 6. Other (specify)
How many
hours per day s/he works?
How many days per week
does s/he work?
1. One day 2. Two days 3. Three days 4. four days 5. Five days 6. Six days 7. Other (specify)
Does s/he work on a
temporary/ seasonal
basis?
1. Yes 2. No 8. DK
How many days per week does
s/he work?
1. One day 2. Two days 3. Three days 4. Four days or more 8. DK
Go to Q. 431
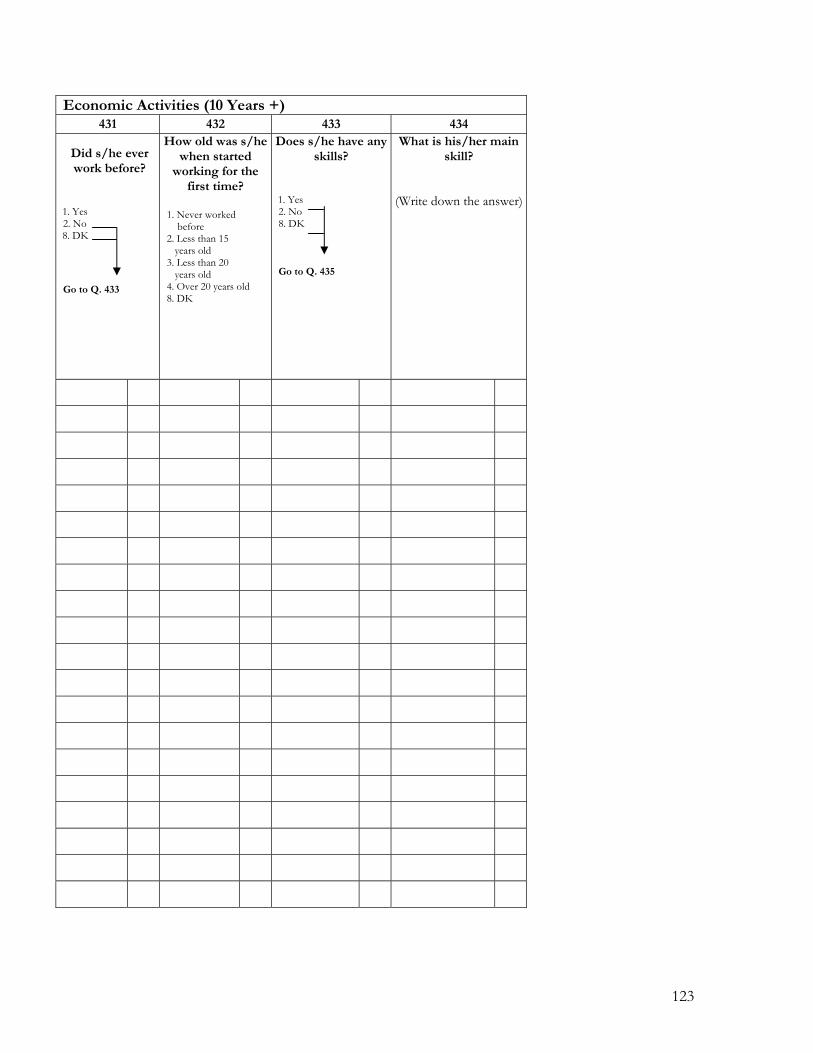
123
Economic Activities (10 Years +) 431 432 433 434
Did s/he ever work before?
1. Yes 2. No 8. DK Go to Q. 433
How old was s/he when started
working for the first time?
1. Never worked before 2. Less than 15 years old 3. Less than 20 years old 4. Over 20 years old 8. DK
Does s/he have any skills?
1. Yes 2. No 8. DK Go to Q. 435
What is his/her main skill?
(Write down the answer)
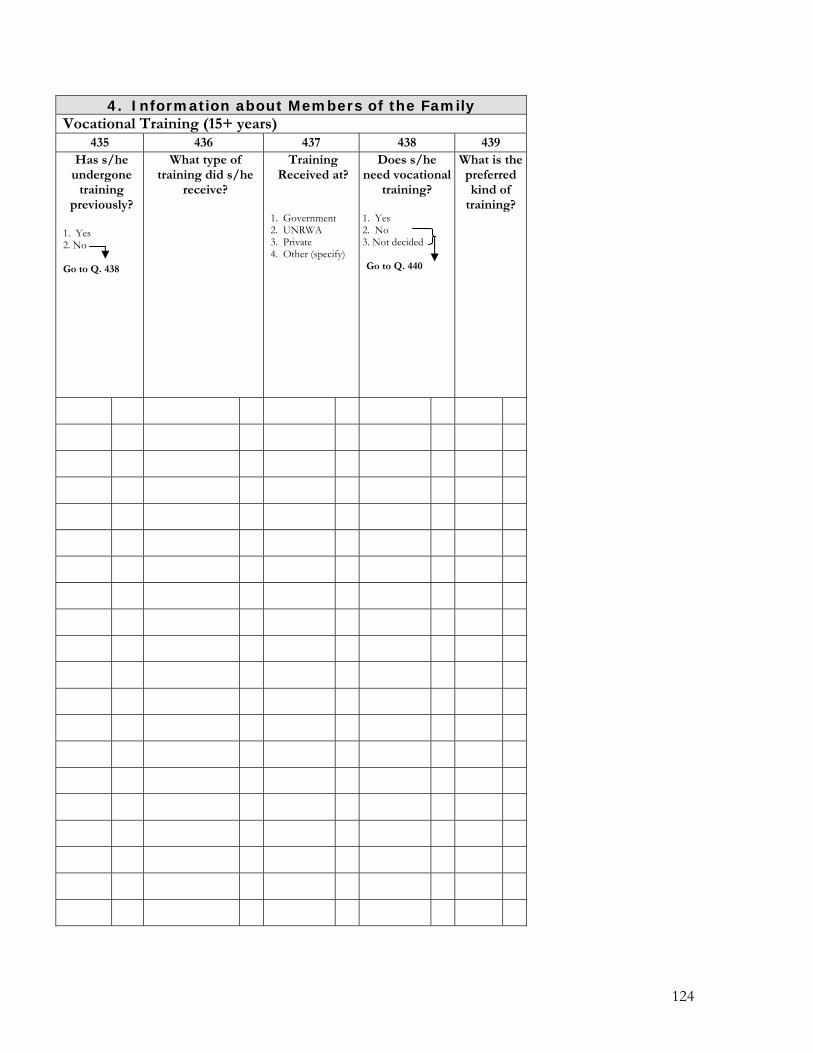
124
4. Information about Members of the Family Vocational Training (15+ years)
435 436 437 438 439 Has s/he
undergone training
previously?
1. Yes 2. No Go to Q. 438
What type of training did s/he
receive?
Training Received at?
1. Government 2. UNRWA 3. Private 4. Other (specify)
Does s/he need vocational
training?
1. Yes 2. No 3. Not decided Go to Q. 440
What is the preferred kind of
training?
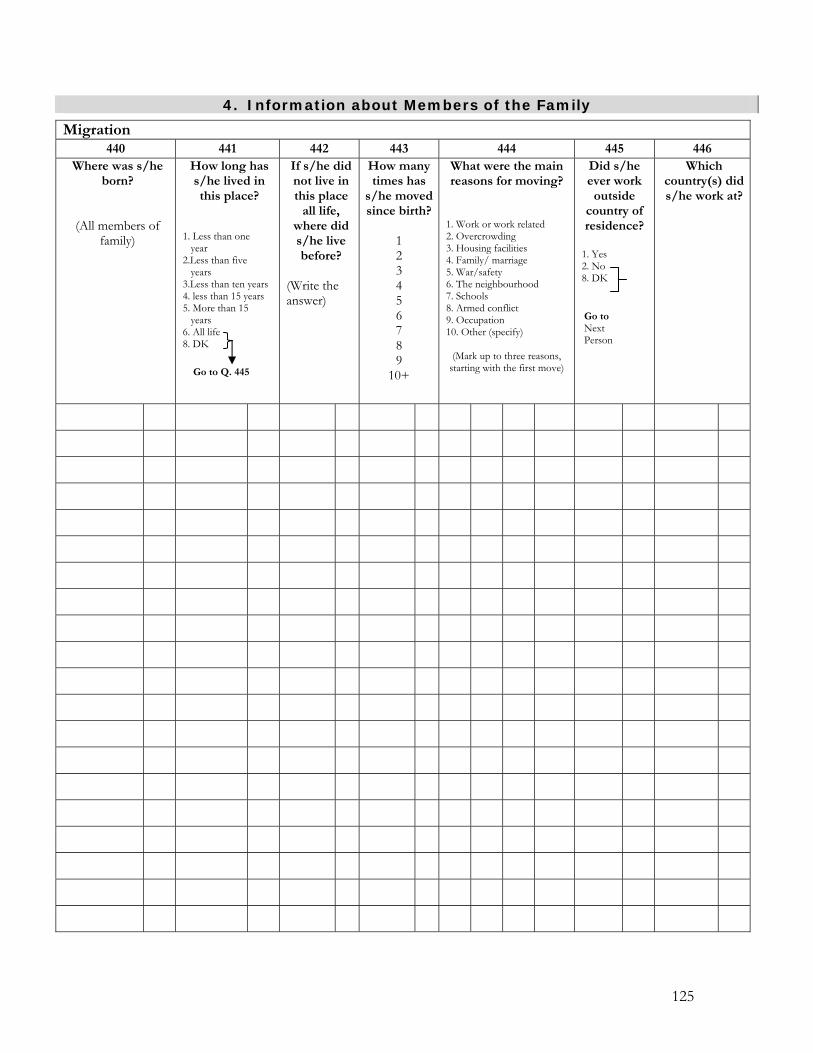
125
4. Information about Members of the Family
Migration 440 441 442 443 444 445 446
Where was s/he born?
(All members of family)
How long has s/he lived in this place?
1. Less than one year 2.Less than five years 3.Less than ten years 4. less than 15 years 5. More than 15 years 6. All life 8. DK
If s/he did not live in this place
all life, where did s/he live before?
(Write the answer)
How many times has
s/he moved since birth?
1 2 3 4 5 6 7 8 9
10+
What were the main reasons for moving?
1. Work or work related 2. Overcrowding 3. Housing facilities 4. Family/ marriage 5. War/safety 6. The neighbourhood 7. Schools 8. Armed conflict 9. Occupation 10. Other (specify)
(Mark up to three reasons, starting with the first move)
Did s/he ever work outside
country of residence?
1. Yes 2. No 8. DK
Which country(s) did s/he work at?
Go to Next Person
Go to Q. 445
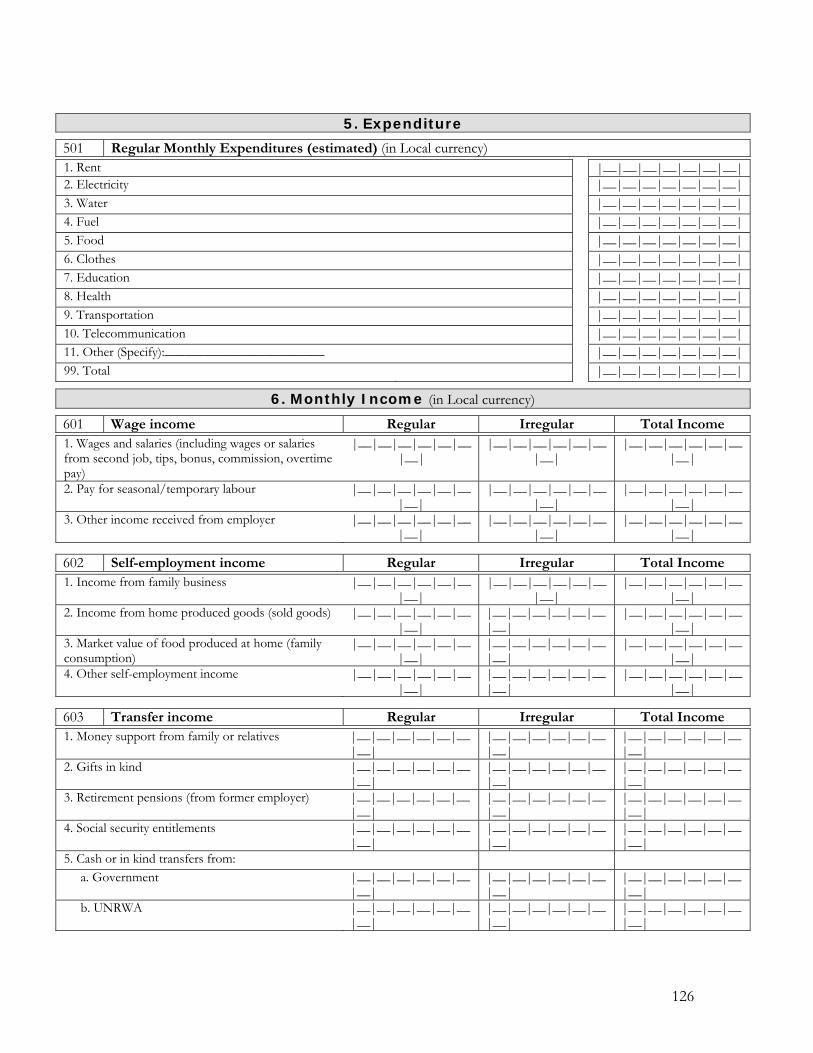
126
5. Expenditure
501 Regular Monthly Expenditures (estimated) (in Local currency)
1. Rent |__|__|__|__|__|__|__|2. Electricity |__|__|__|__|__|__|__|3. Water |__|__|__|__|__|__|__|4. Fuel |__|__|__|__|__|__|__|5. Food |__|__|__|__|__|__|__|6. Clothes |__|__|__|__|__|__|__|7. Education |__|__|__|__|__|__|__|8. Health |__|__|__|__|__|__|__|9. Transportation |__|__|__|__|__|__|__|10. Telecommunication |__|__|__|__|__|__|__|11. Other (Specify):________________________ |__|__|__|__|__|__|__|99. Total |__|__|__|__|__|__|__|
6. Monthly Income (in Local currency)
601 Wage income Regular Irregular Total Income
1. Wages and salaries (including wages or salaries from second job, tips, bonus, commission, overtime pay)
|__|__|__|__|__|__|__|
|__|__|__|__|__|__|__|
|__|__|__|__|__|__|__|
2. Pay for seasonal/temporary labour |__|__|__|__|__|__|__|
|__|__|__|__|__|__|__|
|__|__|__|__|__|__|__|
3. Other income received from employer |__|__|__|__|__|__|__|
|__|__|__|__|__|__|__|
|__|__|__|__|__|__|__|
602 Self-employment income Regular Irregular Total Income
1. Income from family business |__|__|__|__|__|__|__|
|__|__|__|__|__|__|__|
|__|__|__|__|__|__|__|
2. Income from home produced goods (sold goods) |__|__|__|__|__|__|__|
|__|__|__|__|__|__|__|
|__|__|__|__|__|__|__|
3. Market value of food produced at home (family consumption)
|__|__|__|__|__|__|__|
|__|__|__|__|__|__|__|
|__|__|__|__|__|__|__|
4. Other self-employment income |__|__|__|__|__|__|__|
|__|__|__|__|__|__|__|
|__|__|__|__|__|__|__|
603 Transfer income Regular Irregular Total Income
1. Money support from family or relatives |__|__|__|__|__|__|__|
|__|__|__|__|__|__|__|
|__|__|__|__|__|__|__|
2. Gifts in kind |__|__|__|__|__|__|__|
|__|__|__|__|__|__|__|
|__|__|__|__|__|__|__|
3. Retirement pensions (from former employer) |__|__|__|__|__|__|__|
|__|__|__|__|__|__|__|
|__|__|__|__|__|__|__|
4. Social security entitlements |__|__|__|__|__|__|__|
|__|__|__|__|__|__|__|
|__|__|__|__|__|__|__|
5. Cash or in kind transfers from: a. Government |__|__|__|__|__|__
|__| |__|__|__|__|__|__|__|
|__|__|__|__|__|__|__|
b. UNRWA |__|__|__|__|__|__|__|
|__|__|__|__|__|__|__|
|__|__|__|__|__|__|__|
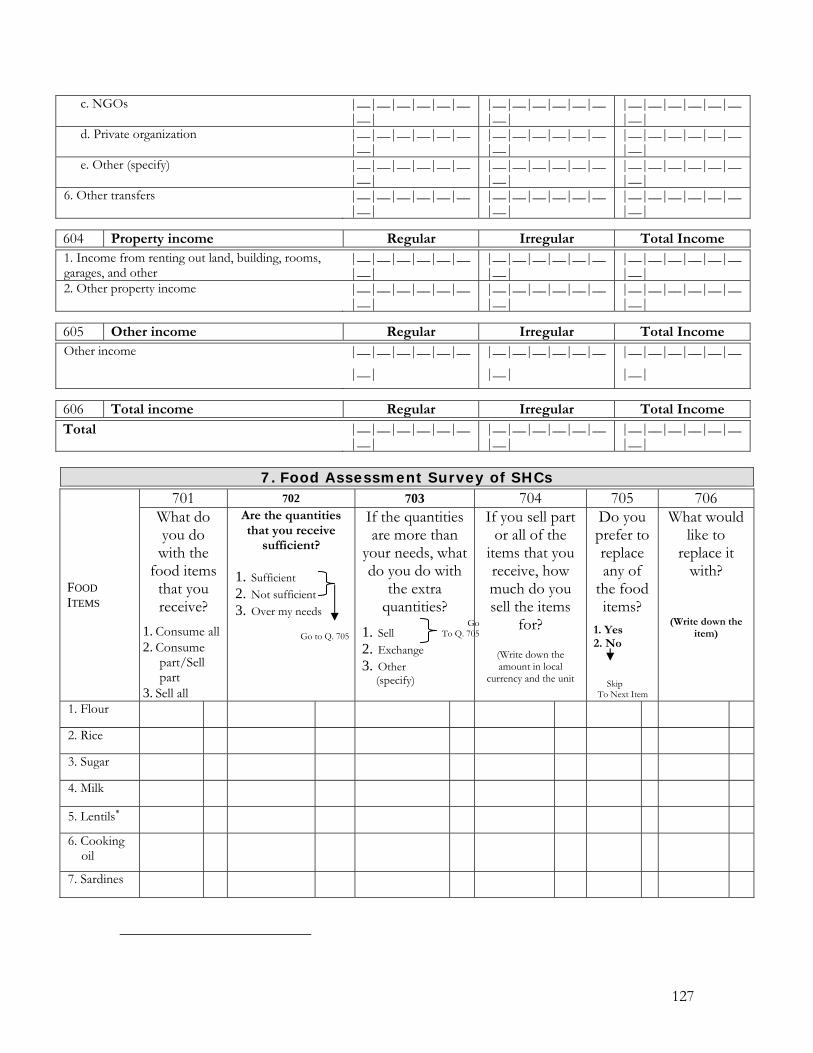
127
c. NGOs |__|__|__|__|__|__|__|
|__|__|__|__|__|__|__|
|__|__|__|__|__|__|__|
d. Private organization |__|__|__|__|__|__|__|
|__|__|__|__|__|__|__|
|__|__|__|__|__|__|__|
e. Other (specify) |__|__|__|__|__|__|__|
|__|__|__|__|__|__|__|
|__|__|__|__|__|__|__|
6. Other transfers |__|__|__|__|__|__|__|
|__|__|__|__|__|__|__|
|__|__|__|__|__|__|__|
604 Property income Regular Irregular Total Income
1. Income from renting out land, building, rooms, garages, and other
|__|__|__|__|__|__|__|
|__|__|__|__|__|__|__|
|__|__|__|__|__|__|__|
2. Other property income |__|__|__|__|__|__|__|
|__|__|__|__|__|__|__|
|__|__|__|__|__|__|__|
605 Other income Regular Irregular Total Income
Other income |__|__|__|__|__|__
|__| |__|__|__|__|__|__
|__| |__|__|__|__|__|__
|__|
606 Total income Regular Irregular Total Income
Total |__|__|__|__|__|__|__|
|__|__|__|__|__|__|__|
|__|__|__|__|__|__|__|
7. Food Assessment Survey of SHCs
701 702 703 704 705 706
FOOD ITEMS
What do you do with the
food items that you receive?
1. Consume all 2. Consume
part/Sell part
3. Sell all
Are the quantities that you receive
sufficient?
1. Sufficient 2. Not sufficient 3. Over my needs
If the quantities are more than
your needs, what do you do with
the extra quantities?
1. Sell 2. Exchange 3. Other
(specify)
If you sell part or all of the
items that you receive, how much do you sell the items
for?
(Write down the amount in local
currency and the unit
Do you prefer to replace any of
the food items?
1. Yes 2. No
What would like to
replace it with?
(Write down the item)
1. Flour
2. Rice
3. Sugar
4. Milk
5. Lentils∗
6. Cooking oil
7. Sardines
Go to Q. 705Go
To Q. 705
Skip To Next Item

128
8.Broad Beans
707 In case you sell all or part of the items received, what do you do with the money?
Buy Bread Buy Meat / Fish Buy Vegetables Buy Fruits Daily Needs Medical Expenses Buy Clothes Pay Rent Educational Expenses. Other (specify)
1 2 3 4 5 6 7 8 9 10
|__|__|
708 On what needs do you spend the cash subsidy that you receive?
1. ___________________________________________________________________________________ 2. ___________________________________________________________________________________ 3. ___________________________________________________________________________________ 4. ___________________________________________________________________________________ 5. ___________________________________________________________________________________
|__|__| |__|__| |__|__| |__|__| |__|__|
709 The practice of part food and part cash will continue in 2005-06. In the future, what would the family prefer to receive and why?
All Food All Cash Part food/part cash
1 2 3
|__|
710 Why?
1. ___________________________________________________________________________________ 2. ___________________________________________________________________________________ 3. ___________________________________________________________________________________
|__|__| |__|__| |__|__|
129
BIBLIOGRAPHY
DoS (1999) Employment and Unemployment Survey, First Round 1999. Amman: Department of Statistics.
DoS (2003) Jordan In Figures. Amman: Department of Statistics.
Ministry of Social Affairs and UNDP (2001) Mapping of Living Conditions in Lebanon. Beirut, Lebanon.
Schiff, B. (1995) Refugees unto the Third Generation: UN Aid to Palestinians. New York, Syracuse University Press.
The Annual Reports of the National Aid Fund (1998-2004). Amman, Jordan: The National Aid
Fund [In Arabic].
UNDP (2004) Arab Human Development Report: Towards Freedom in the Arab World. UNDP: Regional Bureau of Arab States, New York.
UNDP (2005) Poverty In Syria: 1996-2004. Damascus, Syria.
UNRWA. Reports of the Commissioner-General of the United Nations Relief and Works Agency For Palestine in the Near East. 1950-2004.
UNRWA (1986) UNRWA: Past, Present and Future: A Briefing Document. Vienna.
UNRWA (2000a) The Relief and Social Services Programme. Amman, Jordan: UNRWA HQ, Department of Relief and Social Services.
UNRWA (2000b) UNRWA and Palestine Refugee: 50 years of Service. Gaza: UNRWA HQ. UNRWA (2000c) Annual Report of the Department of Health. Amman, Jordan: UNRWA
HQ, Department of Health.
UNRWA (2002) The Relief and Social Services Programme. Amman, Jordan: UNRWA HQ, Department of Relief and Social Services.
World Bank (2004) The Hashemite Kingdom of Jordan: Poverty Assessment Report, Volume I and 2.
Washington, DC.: The World Bank.