reliable, energy-aware cross-layer protocol …4232/datastream...reliable, energy-aware cross-layer...
TRANSCRIPT

RELIABLE, ENERGY-AWARE CROSS-LAYER PROTOCOL FOR WIRELESS
SENSOR NETWORKS
by
Ahmed Badi
A Dissertation Submitted to the Faculty of
The College of Engineering and Computer Science
in Partial Fulfillment of the Requirements for the Degree of
Doctor of Philosophy
Florida Atlantic University
Boca Raton, FL
December 2009

c© Copyright by Ahmed Badi 2009
ii


ACKNOWLEDGMENTS
This is an opportunity to express my gratitude to Professor Imad Mahgoub,
for his guidance and continuous support. The success of this work is owing to the
open discussions that Dr.Mahgoub and I have had on various issues of the subject
matter. I am grateful for his constructive comments on my work. I also would like
to thank my dissertation committee members, Dr. Mihaela Cardei, Dr. Ed Callaway,
Dr. Mohammad Ilyas and Dr. A.Kader Mazouz. I benefited enormously from their
feedback, analyses and comments. Their input was vital in shaping this work. In
my various interactions with the committee members, I learned to be precise in my
discussions and rigorous in my analysis.
This work would not have been possible without the help of many people to
whom I would like to pay special thanks. First, I would like to thank my family
for their understanding, support and love. It is their countless sacrifices that made
this work possible. Special gratitude goes to my friends, the Ng-A-Fook family who
always been on my side through my studies. I will always be in debt to them for their
help, support and friendship. Grateful thanks are given to Dr. Martin Solomon, Dr.
Borko Furht, Dr. Clovis Tondo, Dr. Lofton Bullard, Dr. Ali Zilouchian, Dr. Thomas
Fernandez, Dr. Abhijit Pandya, and all my friends for their kind support.
I would like to thank the faculty and staff of the Department of Computer
Science and Engineering at Florida Atlantic University for their assistance and support,
and the staff of the Technical Services Group at the College of Engineering for their
help, efficiency and high professional standards. The Department of Defense through
Pragmatics Inc. has provided most of the funds to support this research work. I am
grateful for this support.
iv

ABSTRACT
Author: Ahmed Badi
Title: RELIABLE, ENERGY-AWARE CROSS-LAYERPROTOCOL FOR WIRELESS SENSOR NETWORKS
Institution: Florida Atlantic University
Dissertation Advisor: Dr. Imad Mahgoub
Degree: Doctor of Philosophy
Year: 2009
This research addresses communication reliability in the highly constrained wire-
less sensor networks environment. We propose a cross-layer, reliable wireless sensor
protocol design. The protocol benefits from the body of research in the two areas of
wireless sensors reliability research and wireless sensors energy conservation research.
The protocol introduces a new energy saving technique that considers reliability as a de-
sign parameter and constraint. The protocol also introduces a new back-off algorithm
that dynamically adjusts to the data messages reliability needs. Other cross-layer
techniques that the protocol introduces are dynamic MAC retry limit and dynamic
transmission power setting that is also based on the messages reliability requirements.
Cross layer design is defined as the interaction between the different stack layers
with the goal of improving performance. It has been used in ad hoc wireless systems to
improve throughput, latency, and quality of service (QoS). The improvements gained
v

in performance come at a price. This includes decreased architecture modularity and
designs may be hard to debug, maintain or upgrade.
Cross-layer design is valuable for wireless sensor networks due to the severe
resource constraints. The proposed protocol uses cross-layer design as a performance
and energy optimization technique. Nevertheless, the protocol avoids introducing layer
interdependencies by preserving the stack architecture and optimizes the overall sys-
tem energy and reliability performance by information sharing. The information is
embedded as flags in the data and control messages that are moving through the stack.
Each layer reads these flags and adjusts its performance and handling of the message
accordingly.
The performance of the proposed protocol is evaluated using simulation model-
ing. The reference protocol used for evaluation is APTEEN. We developed simulation
programs for the proposed protocol and for APTEEN protocol using the JiST/SWANS
simulation tool.
The performance evaluation results show that the proposed protocol achieves better
energy performance than the reference protocol. Several scalability experiments show
that the proposed protocol scales well and has better performance for large networks.
Also, exhaustive bandwidth utilization experiments show that for heavily-utilized or
congested networks, the proposed protocol has high reliability in delivering messages
classified as important.
vi

To my parents, Kamal Badi and Sayda Satti
To Sahar, Omer, Yasmeen and Mazen
To Ibrahim, Mahasin, Nawal and Sukaina
This work is especially dedicated to Professor Mustafa Badi
˜Ahmed Kamal Badi
RELIABLE, ENERGY-AWARE CROSS-LAYER PROTOCOL FOR WIRELESS
SENSOR NETWORKS
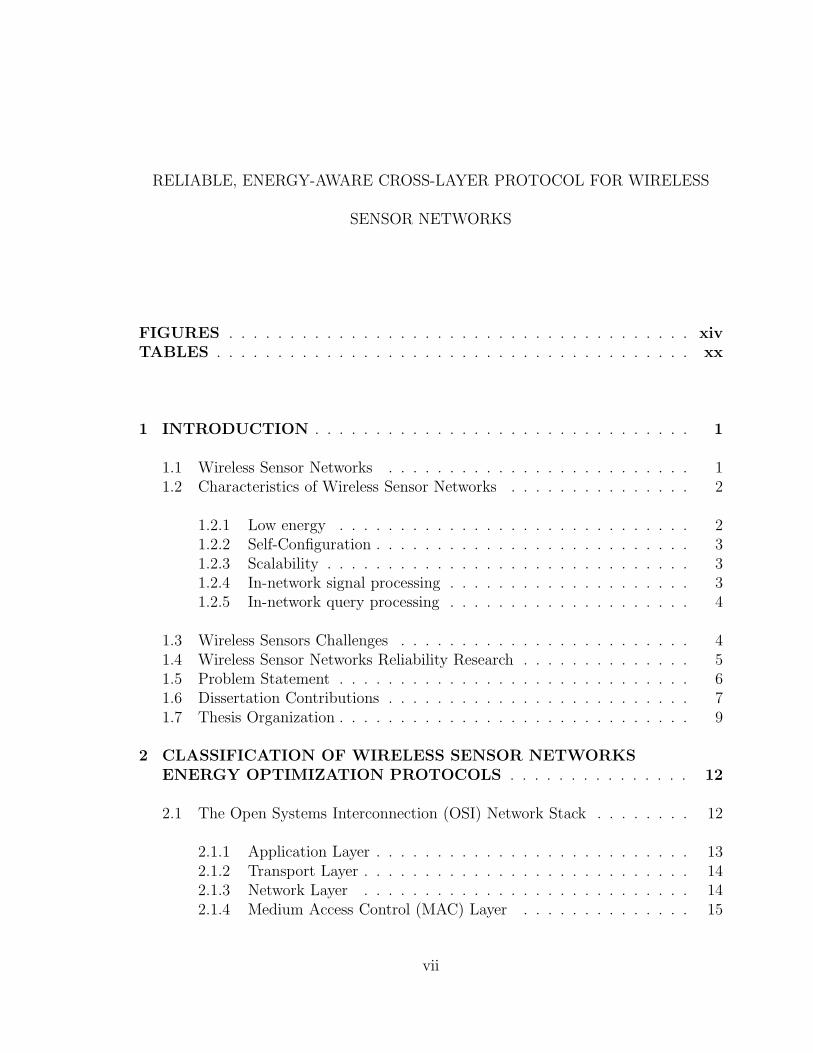
FIGURES . . . . . . . . . . . . . . . . . . . . . . . . . . . . . . . . . . . . . . xivTABLES . . . . . . . . . . . . . . . . . . . . . . . . . . . . . . . . . . . . . . . xx
1 INTRODUCTION . . . . . . . . . . . . . . . . . . . . . . . . . . . . . . . 1
1.1 Wireless Sensor Networks . . . . . . . . . . . . . . . . . . . . . . . . . 11.2 Characteristics of Wireless Sensor Networks . . . . . . . . . . . . . . . 2
1.2.1 Low energy . . . . . . . . . . . . . . . . . . . . . . . . . . . . . 21.2.2 Self-Configuration . . . . . . . . . . . . . . . . . . . . . . . . . . 31.2.3 Scalability . . . . . . . . . . . . . . . . . . . . . . . . . . . . . . 31.2.4 In-network signal processing . . . . . . . . . . . . . . . . . . . . 31.2.5 In-network query processing . . . . . . . . . . . . . . . . . . . . 4
1.3 Wireless Sensors Challenges . . . . . . . . . . . . . . . . . . . . . . . . 41.4 Wireless Sensor Networks Reliability Research . . . . . . . . . . . . . . 51.5 Problem Statement . . . . . . . . . . . . . . . . . . . . . . . . . . . . . 61.6 Dissertation Contributions . . . . . . . . . . . . . . . . . . . . . . . . . 71.7 Thesis Organization . . . . . . . . . . . . . . . . . . . . . . . . . . . . . 9
2 CLASSIFICATION OF WIRELESS SENSOR NETWORKSENERGY OPTIMIZATION PROTOCOLS . . . . . . . . . . . . . . . 12
2.1 The Open Systems Interconnection (OSI) Network Stack . . . . . . . . 12
2.1.1 Application Layer . . . . . . . . . . . . . . . . . . . . . . . . . . 132.1.2 Transport Layer . . . . . . . . . . . . . . . . . . . . . . . . . . . 142.1.3 Network Layer . . . . . . . . . . . . . . . . . . . . . . . . . . . 142.1.4 Medium Access Control (MAC) Layer . . . . . . . . . . . . . . 15
vii

2.1.5 Physical Layer . . . . . . . . . . . . . . . . . . . . . . . . . . . . 16
2.2 OSI Layers Optimization for Wireless Sensors . . . . . . . . . . . . . . 17
2.2.1 Application Layer . . . . . . . . . . . . . . . . . . . . . . . . . . 182.2.2 Transport Layer . . . . . . . . . . . . . . . . . . . . . . . . . . . 182.2.3 Network/ Routing Layer . . . . . . . . . . . . . . . . . . . . . . 19
2.2.3.1 Low-Energy Adaptive Clustering Hierarchy (LEACH) . 192.2.3.2 Power-Efficient Gathering in Sensor Information
Systems (PEGASIS) . . . . . . . . . . . . . . . . . . . 202.2.3.3 Threshold sensitive Energy efficient Sensor Network
Protocol/ Adaptive Periodic Threshold-sensitiveEnergy Efficient Sensor Network Protocol(TEEN/APTEEN) . . . . . . . . . . . . . . . . . . . . 22
2.2.3.4 Directed Diffusion . . . . . . . . . . . . . . . . . . . . 242.2.3.5 Geographical and Energy Aware Routing Protocol
(GEAR) . . . . . . . . . . . . . . . . . . . . . . . . . . 242.2.3.6 Sensor Protocols for Information via Negotiation
(SPIN) . . . . . . . . . . . . . . . . . . . . . . . . . . 252.2.3.7 Cost-effective Maximum Lifetime Routing (CMLR) . . 25
2.2.4 MAC Layer . . . . . . . . . . . . . . . . . . . . . . . . . . . . . 25
2.2.4.1 Sensor MAC (SMAC) . . . . . . . . . . . . . . . . . . 262.2.4.2 Delay MAC (DMAC) . . . . . . . . . . . . . . . . . . 272.2.4.3 TMAC . . . . . . . . . . . . . . . . . . . . . . . . . . . 272.2.4.4 WiseMAC . . . . . . . . . . . . . . . . . . . . . . . . . 282.2.4.5 Group-based Medium Access Control (GMAC) . . . . 292.2.4.6 Traffic-Adaptive Medium Access Protocol (TRAMA) . 31
2.2.5 Physical and Radio Layer . . . . . . . . . . . . . . . . . . . . . 312.2.6 Summary of OSI Layers Optimization Techniques for Wireless
Sensor Networks . . . . . . . . . . . . . . . . . . . . . . . . . . 33
2.3 Cross-layer Optimization . . . . . . . . . . . . . . . . . . . . . . . . . . 33
2.3.1 The Need for Cross-layer Optimizations in Wireless SensorNetworks . . . . . . . . . . . . . . . . . . . . . . . . . . . . . . 34
2.3.2 WSNs Cross-layer Energy Balance and Energy PerformanceAnalysis . . . . . . . . . . . . . . . . . . . . . . . . . . . . . . . 35
2.3.2.1 Cross-layer Energy Balance . . . . . . . . . . . . . . . 35
viii

2.3.2.2 Cross-layer Energy Performance Analysis . . . . . . . . 36
2.3.3 Multi-layer Cross-layer Optimization Techniques . . . . . . . . . 37
2.3.3.1 Cross-layer Optimization Using Forward ErrorCorrection . . . . . . . . . . . . . . . . . . . . . . . . . 38
2.3.3.2 Cross-layer Optimization Using Feedback OptimizationAgents . . . . . . . . . . . . . . . . . . . . . . . . . . . 39
2.3.4 WSNs Cross-layer Design Challenges and Open Research Issues 402.3.5 Cross-layer Design Challenges . . . . . . . . . . . . . . . . . . . 402.3.6 Cross-layer Open Research Issues . . . . . . . . . . . . . . . . . 41
2.4 Summary . . . . . . . . . . . . . . . . . . . . . . . . . . . . . . . . . . 43
3 RELIABILITY IN WIRELESS SENSOR NETWORKS . . . . . . . 45
3.1 Importance of Wireless Sensor Networks (WSNs) Reliability . . . . . . 453.2 Classification of WSNs Reliable Protocols . . . . . . . . . . . . . . . . . 47
3.2.1 Transport Layer . . . . . . . . . . . . . . . . . . . . . . . . . . . 47
3.2.1.1 Event-To-Sink Transport (ESRT) Protocol . . . . . . . 483.2.1.2 Reliable Multi-Segment Transport Protocol . . . . . . 503.2.1.3 Analysis and Classification of WSNs Reliable Transport
Protocols . . . . . . . . . . . . . . . . . . . . . . . . . 523.2.1.4 Improving Transport Reliability by Using MAC Layer
ARQ . . . . . . . . . . . . . . . . . . . . . . . . . . . . 54
3.2.2 Network Layer . . . . . . . . . . . . . . . . . . . . . . . . . . . 56
3.2.2.1 Reliable Routing Using Graph Theory Analysis . . . . 563.2.2.2 Multiple Routes and Erasure Codes Reliable Protocols 573.2.2.3 Reliable Routing Using Link Connectivity Statistics . . 60
3.2.3 MAC Layer . . . . . . . . . . . . . . . . . . . . . . . . . . . . . 61
3.2.3.1 Reliable Protocols Using MAC Layer Retransmission . 613.2.3.2 Reliable Protocols Using MAC Layer Contention
Window Size . . . . . . . . . . . . . . . . . . . . . . . 623.2.3.3 Reliable Protocols Using MAC RTS/CTS Messages . . 633.2.3.4 Reliable Protocols Using MAC ACK Messages . . . . . 64
3.2.4 Radio and Physical Layer . . . . . . . . . . . . . . . . . . . . . 64
ix

3.2.5 Cross-Layer Reliability . . . . . . . . . . . . . . . . . . . . . . . 67
3.2.5.1 Cross-Layer Reliable Protocol Using EmbeddedMessage Reliability Flag . . . . . . . . . . . . . . . . . 68
3.3 Wireless Sensor Networks Reliability Techniques . . . . . . . . . . . . . 693.4 Wireless Sensor Networks Reliability Challenges and Open Issues . . . 69
3.4.1 Wireless Sensor Networks Reliability Challenges . . . . . . . . . 693.4.2 Wireless Sensor Networks Reliability Open Issues . . . . . . . . 70
3.5 Summary . . . . . . . . . . . . . . . . . . . . . . . . . . . . . . . . . . 70
4 RELIABLE, ENERGY-AWARE CROSS-LAYER PROTOCOLFOR WIRELESS SENSOR NETWORKS . . . . . . . . . . . . . . . . 72
4.1 Classifying Wireless Sensor Networks Research . . . . . . . . . . . . . . 72
4.1.1 Wireless Sensor Networks Energy Optimization Research . . . . 734.1.2 Wireless Sensor Networks Reliability Research . . . . . . . . . . 734.1.3 Bridging the Gap . . . . . . . . . . . . . . . . . . . . . . . . . . 74
4.2 Proposed Protocol Network Settings . . . . . . . . . . . . . . . . . . . 744.3 Proposed Protocol Architecture . . . . . . . . . . . . . . . . . . . . . . 75
4.3.1 Protocol Messages . . . . . . . . . . . . . . . . . . . . . . . . . 75
4.3.1.1 Proposed Protocol Messages’ Reliability Settings . . . 774.3.1.2 Periodic Report Messages . . . . . . . . . . . . . . . . 774.3.1.3 Event Reporting Messages . . . . . . . . . . . . . . . . 784.3.1.4 Infrastructure Communication Messages . . . . . . . . 794.3.1.5 Proposed Hello and Hello-reply Messages . . . . . . . . 80
4.3.2 Proposed Protocol Routing and Clustering Algorithms . . . . . 81
4.3.2.1 Wireless Communication Challenges and ExistingSolutions . . . . . . . . . . . . . . . . . . . . . . . . . 81
4.3.2.2 Proposed Individualized Reliable Link Power SettingsUsing the Hello Exchange . . . . . . . . . . . . . . . . 82
4.3.2.3 Proposed Link Rating parameter . . . . . . . . . . . . 854.3.2.4 Clusters Formation Using the Proposed Link Rating
Parameter . . . . . . . . . . . . . . . . . . . . . . . . . 86
x

4.3.2.5 Proposed Protocol Energy Optimization UnderReliability Constraints . . . . . . . . . . . . . . . . . . 87
4.3.3 Proposed MAC Dynamic Back-off Algorithm . . . . . . . . . . . 874.3.4 Proposed Protocol Startup Phase . . . . . . . . . . . . . . . . . 894.3.5 Protocol Steady-State Operation . . . . . . . . . . . . . . . . . 90
4.4 Summary of Contributions . . . . . . . . . . . . . . . . . . . . . . . . . 914.5 Summary of Proposed Protocol’s Cross-layer Techniques . . . . . . . . 924.6 Related Protocols . . . . . . . . . . . . . . . . . . . . . . . . . . . . . . 94
4.6.1 LEACH . . . . . . . . . . . . . . . . . . . . . . . . . . . . . . . 954.6.2 TEEN/APTEEN . . . . . . . . . . . . . . . . . . . . . . . . . . 954.6.3 ESRT Protocol . . . . . . . . . . . . . . . . . . . . . . . . . . . 964.6.4 ETX, Erasures Codes Protocols . . . . . . . . . . . . . . . . . . 974.6.5 Cross-layer Protocols . . . . . . . . . . . . . . . . . . . . . . . . 98
4.6.5.1 Benefits of Cross-layer Designs . . . . . . . . . . . . . 984.6.5.2 Drawbacks of Cross-layer Designs . . . . . . . . . . . . 994.6.5.3 Avoiding Cross-layer Drawbacks in Proposed Protocol 99
4.7 Summary . . . . . . . . . . . . . . . . . . . . . . . . . . . . . . . . . . 100
5 RELIABLE, ENERGY-AWARE PROTOCOL PERFORMANCEEVALUATION . . . . . . . . . . . . . . . . . . . . . . . . . . . . . . . . . 102
5.1 Proposed Protocol Performance Evaluation Method . . . . . . . . . . . 1025.2 Performance Evaluation Tools . . . . . . . . . . . . . . . . . . . . . . . 103
5.2.1 Tool Selection Criteria . . . . . . . . . . . . . . . . . . . . . . . 1035.2.2 Simulation Tools Survey . . . . . . . . . . . . . . . . . . . . . . 103
5.2.2.1 Opnet . . . . . . . . . . . . . . . . . . . . . . . . . . . 1045.2.2.2 GloMoSim . . . . . . . . . . . . . . . . . . . . . . . . . 1045.2.2.3 NS-2 . . . . . . . . . . . . . . . . . . . . . . . . . . . . 1055.2.2.4 PDNS . . . . . . . . . . . . . . . . . . . . . . . . . . . 1055.2.2.5 JiST/SWANS . . . . . . . . . . . . . . . . . . . . . . . 105
5.2.3 JiST/SWANS Wireless Ad-hoc Network Simulator . . . . . . . . 106
5.2.3.1 Upgrading JiST/SWANS to a Wireless SensorNetworks Simulator . . . . . . . . . . . . . . . . . . . 108
xi

5.2.3.2 Validating the JiST/SWANS for WSNs Simulation . . 109
5.3 Proposed Protocol Evaluation Scenarios . . . . . . . . . . . . . . . . . 110
5.3.1 Routing and Cluster Head Selection Evaluation Scenarios . . . . 1115.3.2 MAC layer Evaluation Scenarios . . . . . . . . . . . . . . . . . . 1115.3.3 Radio and Physical Layers Evaluation Scenarios . . . . . . . . . 1135.3.4 Optimizing the Hello Messages Exchange . . . . . . . . . . . . . 114
5.4 Radio Model for Simulation . . . . . . . . . . . . . . . . . . . . . . . . 116
5.4.1 Disk Radio Model . . . . . . . . . . . . . . . . . . . . . . . . . . 1175.4.2 Rayleigh fading Radio Model . . . . . . . . . . . . . . . . . . . 1185.4.3 Rician fading Radio Model . . . . . . . . . . . . . . . . . . . . . 1185.4.4 First Order Radio Model . . . . . . . . . . . . . . . . . . . . . . 1185.4.5 Radio Model Used for Performance Analysis . . . . . . . . . . . 119
5.5 Performance Analyses . . . . . . . . . . . . . . . . . . . . . . . . . . . 120
5.5.1 Proposed Protocol performance using Default Parameters . . . . 122
5.5.1.1 Energy Performance . . . . . . . . . . . . . . . . . . . 1235.5.1.2 Reliability Performance . . . . . . . . . . . . . . . . . 1235.5.1.3 Latency Performance . . . . . . . . . . . . . . . . . . . 124
5.5.2 Varying Number of Reports per Round . . . . . . . . . . . . . . 126
5.5.2.1 Energy Performance . . . . . . . . . . . . . . . . . . . 1265.5.2.2 Reliability Performance . . . . . . . . . . . . . . . . . 127
5.5.3 Varying Maximum Number of Hello Messages . . . . . . . . . . 127
5.5.3.1 Energy Performance . . . . . . . . . . . . . . . . . . . 1285.5.3.2 Reliability Performance . . . . . . . . . . . . . . . . . 130
5.5.4 Varying Packet Size . . . . . . . . . . . . . . . . . . . . . . . . . 130
5.5.4.1 Energy Performance . . . . . . . . . . . . . . . . . . . 1315.5.4.2 Reliability Performance . . . . . . . . . . . . . . . . . 132
5.5.5 Varying Transmit-Receive Energy Ratio . . . . . . . . . . . . . 134
5.5.5.1 Energy Performance . . . . . . . . . . . . . . . . . . . 135
xii

5.5.5.2 Reliability Performance . . . . . . . . . . . . . . . . . 136
5.5.6 Varying Network size . . . . . . . . . . . . . . . . . . . . . . . . 137
5.5.6.1 Energy Performance . . . . . . . . . . . . . . . . . . . 1385.5.6.2 Reliability Performance . . . . . . . . . . . . . . . . . 1395.5.6.3 Latency Performance . . . . . . . . . . . . . . . . . . . 140
5.5.7 Varying Messages Inter-arrival Time . . . . . . . . . . . . . . . 141
5.5.7.1 Energy Performance . . . . . . . . . . . . . . . . . . . 1425.5.7.2 Reliability Performance . . . . . . . . . . . . . . . . . 1435.5.7.3 Latency Performance . . . . . . . . . . . . . . . . . . . 1455.5.7.4 Impact of Different Retry Limits . . . . . . . . . . . . 146
5.6 Summary . . . . . . . . . . . . . . . . . . . . . . . . . . . . . . . . . . 149
6 CONCLUSIONS AND FUTURE WORK . . . . . . . . . . . . . . . . 155
6.1 Conclusions . . . . . . . . . . . . . . . . . . . . . . . . . . . . . . . . . 1556.2 Future Work . . . . . . . . . . . . . . . . . . . . . . . . . . . . . . . . . 159
BIBLIOGRAPHY . . . . . . . . . . . . . . . . . . . . . . . . . . . . . . . . . 162
xiii

FIGURES
1.1 Components of sensor device. . . . . . . . . . . . . . . . . . . . . . . . . 3
2.1 OSI five layer protocol stack model. . . . . . . . . . . . . . . . . . . . . . 14
2.2 LEACH protocol configuration. . . . . . . . . . . . . . . . . . . . . . . . 21
2.3 PEGASIS protocol configuration. . . . . . . . . . . . . . . . . . . . . . . 22
2.4 S-MAC periodic listen and sleep schedule. . . . . . . . . . . . . . . . . . 27
2.5 DMAC staggered listen and sleep schedule. . . . . . . . . . . . . . . . . . 28
2.6 Cross-layer optimization framework [87]. . . . . . . . . . . . . . . . . . . 41
2.7 Adaptive cross-layer design operation [18]. . . . . . . . . . . . . . . . . . 42
3.1 Classification of the related work in WSNs [20]. . . . . . . . . . . . . . . 46
3.2 ESRT Event Radius [75]. . . . . . . . . . . . . . . . . . . . . . . . . . . . 49
3.3 EESRT Five reporting regions [75]. . . . . . . . . . . . . . . . . . . . . . 50
3.4 Reliability block diagram for RMST [78]. . . . . . . . . . . . . . . . . . . 53
3.5 Reliability block diagram for ESRT [78]. . . . . . . . . . . . . . . . . . . 53
3.6 Reliability block diagram for RBC [78]. . . . . . . . . . . . . . . . . . . . 54
3.7 Probability of arrival across 40 hops with an average error rate of 0.10 per
hop, given R retries per hop [86]. . . . . . . . . . . . . . . . . . . . . . . 55
3.8 Probability of arrival across 6 hops [86] . . . . . . . . . . . . . . . . . . . 56
3.9 (a) A wireless network, (b) The Graph model.[3]. . . . . . . . . . . . . . 57
xiv

3.10 Network Graph [3]. . . . . . . . . . . . . . . . . . . . . . . . . . . . . . . 58
3.11 Erasure Code Mechanism [44]. . . . . . . . . . . . . . . . . . . . . . . . . 59
3.12 RTS/CTS handshake to protect longer packets bursts [94]. . . . . . . . . 64
3.13 Reception probability of all links in a network with a line topology [101]. 66
3.14 Reception probability variation over time across a single link [101]. . . . . 67
4.1 Bridging the gap, reliable, energy-aware protocol design. . . . . . . . . . 75
4.2 Proposed protocol network setting. . . . . . . . . . . . . . . . . . . . . . 76
4.3 Application and infrastructure communication message format. . . . . . . 77
4.4 Hello message format. . . . . . . . . . . . . . . . . . . . . . . . . . . . . . 81
4.5 Hello-reply message format. . . . . . . . . . . . . . . . . . . . . . . . . . 81
4.6 Hello messages exchange flowchart. . . . . . . . . . . . . . . . . . . . . . 83
4.7 Minimum number of Hello messages exchanged. . . . . . . . . . . . . . . 86
4.8 Example of neighborhood table with data. . . . . . . . . . . . . . . . . . 88
4.9 Proposed Reliable Protocol steady-state operation flowchart. . . . . . . . 93
4.10 Proposed protocol Cross-layer techniques. . . . . . . . . . . . . . . . . . . 94
5.1 SWANS system architecture with energy model added. Reproduced from
[10]. . . . . . . . . . . . . . . . . . . . . . . . . . . . . . . . . . . . . . . 107
5.2 JiST/WANS additional components for WSNs simulation. . . . . . . . . 109
5.3 Optimized Hello messages exchange. . . . . . . . . . . . . . . . . . . . . . 116
5.4 Hello messages optimization, Variable minimum link power setting. . . . 116
5.5 Optimized Hello messages exchange. . . . . . . . . . . . . . . . . . . . . . 117
5.6 Simulation analysis radio model. . . . . . . . . . . . . . . . . . . . . . . . 119
5.7 Reliable protocol energy performance. . . . . . . . . . . . . . . . . . . . . 124
xv

5.8 Report messages reliability. . . . . . . . . . . . . . . . . . . . . . . . . . . 124
5.9 Control messages reliability. . . . . . . . . . . . . . . . . . . . . . . . . . 125
5.10 Event messages reliability. . . . . . . . . . . . . . . . . . . . . . . . . . . 125
5.11 Report messages latency. . . . . . . . . . . . . . . . . . . . . . . . . . . . 125
5.12 Control messages latency. . . . . . . . . . . . . . . . . . . . . . . . . . . . 126
5.13 Event messages latency. . . . . . . . . . . . . . . . . . . . . . . . . . . . . 126
5.14 Varying number of reports per round energy performance. . . . . . . . . . 128
5.15 Report messages reliability. . . . . . . . . . . . . . . . . . . . . . . . . . . 128
5.16 Control messages reliability. . . . . . . . . . . . . . . . . . . . . . . . . . 129
5.17 Event messages reliability. . . . . . . . . . . . . . . . . . . . . . . . . . . 129
5.18 Impact of maximum number of Hello messages on energy performance. . 130
5.19 Report Messages Reliability. . . . . . . . . . . . . . . . . . . . . . . . . . 130
5.20 Control Messages Reliability. . . . . . . . . . . . . . . . . . . . . . . . . . 131
5.21 Event Messages Reliability. . . . . . . . . . . . . . . . . . . . . . . . . . . 131
5.22 Varying packet size energy performance, normal packet size. . . . . . . . 132
5.23 Varying packet size energy performance, large packet size. . . . . . . . . . 132
5.24 Report messages reliability using normal packet sizes. . . . . . . . . . . . 133
5.25 Report messages reliability using large packet sizes. . . . . . . . . . . . . 133
5.26 Control messages reliability using normal packet sizes. . . . . . . . . . . . 133
5.27 Control messages reliability using large packet sizes. . . . . . . . . . . . . 134
5.28 Event messages reliability using normal packet sizes. . . . . . . . . . . . . 134
5.29 Event messages reliability using large packet sizes. . . . . . . . . . . . . . 134
5.30 Energy performance using Tx:Rx ratio = 1:2. . . . . . . . . . . . . . . . 135
xvi

5.31 Energy performance using Tx:Rx ratio = 2:1. . . . . . . . . . . . . . . . 136
5.32 Energy performance using Tx:Rx ratio = 1:2 vs. 1:1 vs. 2:1. . . . . . . . 136
5.33 Report messages reliability, Tx:Rx ratio = 1:2. . . . . . . . . . . . . . . . 137
5.34 Report messages reliability for Tx:Rx ratio = 2:1. . . . . . . . . . . . . . 137
5.35 Control messages reliability for Tx:Rx ratio = 1:2. . . . . . . . . . . . . . 138
5.36 Control messages reliability for Tx:Rx ratio = 2:1. . . . . . . . . . . . . . 138
5.37 Event messages reliability for Tx:Rx ratio = 1:2. . . . . . . . . . . . . . . 138
5.38 Event messages reliability for Tx:Rx ratio = 2:1. . . . . . . . . . . . . . . 139
5.39 Energy performance for large network (1600 nodes). . . . . . . . . . . . . 139
5.40 Report messages reliability performance. . . . . . . . . . . . . . . . . . . 140
5.41 Control messages reliability performance. . . . . . . . . . . . . . . . . . . 140
5.42 Event messages reliability performance. . . . . . . . . . . . . . . . . . . . 140
5.43 Report messages latency performance. . . . . . . . . . . . . . . . . . . . . 141
5.44 Control messages latency performance. . . . . . . . . . . . . . . . . . . . 141
5.45 Event messages latency performance. . . . . . . . . . . . . . . . . . . . . 142
5.46 Energy performance for different messages inter-arrival time, MAC default
retry limit= 3. . . . . . . . . . . . . . . . . . . . . . . . . . . . . . . . . . 143
5.47 Energy performance for different messages inter-arrival time, MAC default
retry limit= 4. . . . . . . . . . . . . . . . . . . . . . . . . . . . . . . . . . 143
5.48 Energy performance for different messages inter-arrival time, MAC default
retry limit= 6. . . . . . . . . . . . . . . . . . . . . . . . . . . . . . . . . . 144
5.49 Report messages reliability performance, APTEEN MAC default retry limit=
3. . . . . . . . . . . . . . . . . . . . . . . . . . . . . . . . . . . . . . . . . 145
xvii

5.50 Report messages reliability performance, APTEEN MAC default retry limit=
4. . . . . . . . . . . . . . . . . . . . . . . . . . . . . . . . . . . . . . . . . 145
5.51 Report messages reliability performance, APTEEN MAC default retry limit=
6. . . . . . . . . . . . . . . . . . . . . . . . . . . . . . . . . . . . . . . . . 146
5.52 Control messages reliability performance, APTEEN MAC default retry limit=
3. . . . . . . . . . . . . . . . . . . . . . . . . . . . . . . . . . . . . . . . . 146
5.53 Control messages reliability performance, APTEEN MAC default retry limit=
4. . . . . . . . . . . . . . . . . . . . . . . . . . . . . . . . . . . . . . . . . 146
5.54 Control messages reliability performance, APTEEN MAC default retry limit=
6. . . . . . . . . . . . . . . . . . . . . . . . . . . . . . . . . . . . . . . . . 147
5.55 Event messages reliability performance, APTEEN MAC default retry limit
= 3. . . . . . . . . . . . . . . . . . . . . . . . . . . . . . . . . . . . . . . 147
5.56 Event messages reliability performance, APTEEN MAC default retry limit
= 4. . . . . . . . . . . . . . . . . . . . . . . . . . . . . . . . . . . . . . . 148
5.57 Event messages reliability performance, APTEEN MAC default retry limit
= 6. . . . . . . . . . . . . . . . . . . . . . . . . . . . . . . . . . . . . . . 148
5.58 Report messages latency performance, APTEEN MAC default retry limit =
3. . . . . . . . . . . . . . . . . . . . . . . . . . . . . . . . . . . . . . . . . 148
5.59 Report messages latency performance, APTEEN MAC default retry limit =
4. . . . . . . . . . . . . . . . . . . . . . . . . . . . . . . . . . . . . . . . . 149
5.60 Report messages latency performance, APTEEN MAC default retry limit =
6. . . . . . . . . . . . . . . . . . . . . . . . . . . . . . . . . . . . . . . . . 149
xviii
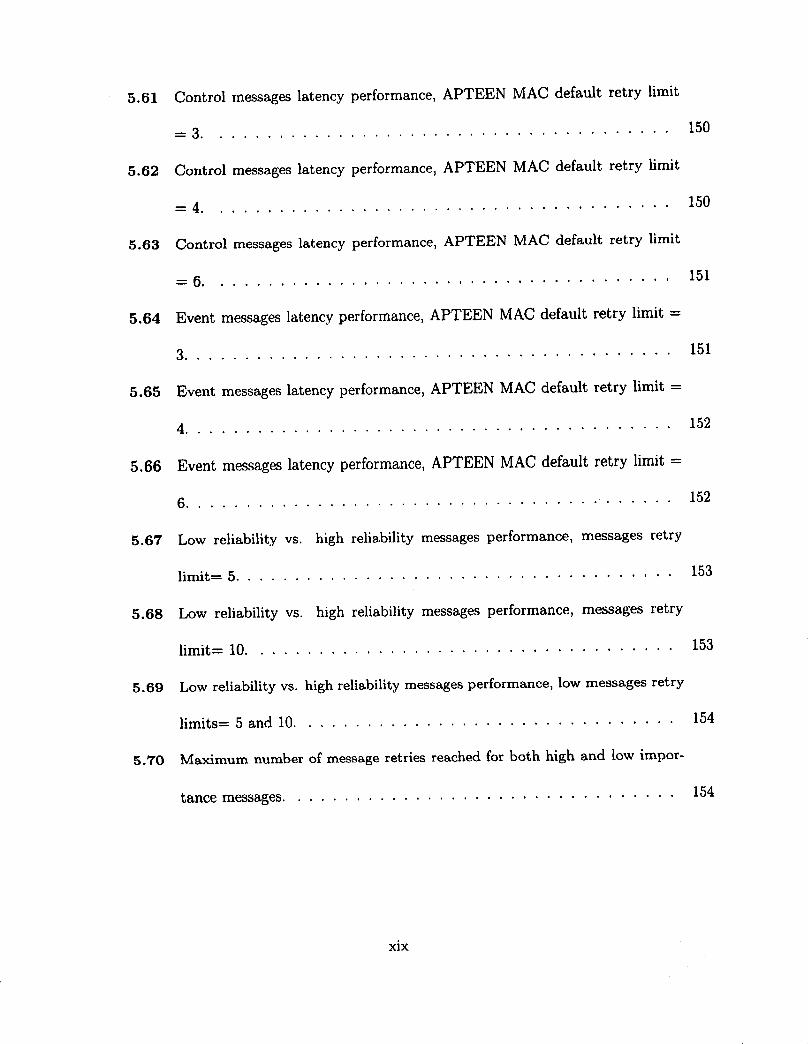
5.61 Control messages latency performance, APTEEN MAC default retry limit
= 3. 150
5.62 Control messages latency performance, APTEEN MAC default retry limit
= 4. 150
5.63 Control messages latency performance, APTEEN MAC default retry limit
= 6. 151
5.64 Event messages latency performance, APTEEN MAC default retry limit =
3. 151
5.65 Event messages latency performance, APTEEN MAC default retry limit =
4. 152
5.66 Event messages latency performance, APTEEN MAC default retry limit =
6. 152
5.67 Low reliability vs. high reliability messages performance, messages retry
limit= 5. 153
5.68 Low reliability vs. high reliability messages performance, messages retry
limit= 10. 153
5.69 Low reliability vs. high reliability messages performance, low messages retry
limits=5and10. 154
5.70 Maximum number of message retries reached for both high and low impor-
tance messages. 154
XIX


Chapter 1
INTRODUCTION
Wireless sensors are one of the fastest developing new technologies [13], [88], [77].
The availability of small, cheap low power embedded processors, radio transceivers and
sensors, often integrated on a single chip is leading to the use of sensing, computing and
wireless communication for monitoring and interacting with the physical world. These
wireless sensor devices are assembled of the hardware components mentioned above, an
energy source, in most cases battery together with networking and application firmware
and software. Depending on the size of the network and the complexity required of each
sensor, the cost of sensor devices could vary from hundreds of dollars to few dollars.
The size of a single sensor node can also vary. Sensors can be deployed in large numbers
to form networks that are used to collect data or to pervasively monitor the physical
environment.
1.1 Wireless Sensor Networks
A wireless sensor network (WSN) is a telecommunication network consisting
of spatially distributed sensors and a base station. These sensors monitor physical
or environmental conditions in a cooperative manner. Sensors collect data from their
surrounding environment, and use their networking infrastructure to aggregate and
1

send the collected data to the base station. These networks can be more accurately
described as distributed systems where participants agree to receive and forward data
messages sent by other network participants. The sensors self-organize to form dis-
tributed systems that can be used for a variety of purposes. Military applications such
as monitoring of troop movement and target tracking originally motivated the devel-
opment of wireless sensor networks. However, currently, wireless sensor networks are
found in many civilian applications as well.
1.2 Characteristics of Wireless Sensor Networks
The wireless sensors sensing capabilities cover physical measurements of quan-
tities such as temperature, sound, vibration, pressure, moisture, light intensity, mag-
netism, motion, radiation, or pollutants among many other physical and environmental
quantities. Sensors price, size and self-organization features make them cost-effective
solutions for many problems. They can be useful in applications such as security and
surveillance, smart spaces, monitoring of natural habitats and eco-systems, medical
monitoring, battlefield surveillance, health care applications, home automation, traffic
control, industrial process control, and structural health monitoring. Wireless ad-hoc
sensor network design requirements include the following:
1.2.1 Low energy
In many applications the sensors are battery powered as shown in Figure 1.1.
They are usually placed in remote areas where manual service of sensor nodes may not
be possible. In this case, the nodes lifetime will be dependent on the battery’s lifetime,
thereby requiring the optimization of energy consumption.
2

Figure 1.1: Components of sensor device.
1.2.2 Self-Configuration
With the large number of nodes in the network and their potential placement
in hostile locations, individual node configuration is not possible. Therefore, it is
essential that the network be self-configuring. In addition, nodes may fail due to
energy exhaustion, malfunction, or destruction and new nodes may be added to the
network. For these reasons, the network must be able to periodically reconfigure itself
so that it can continue to function. Also, depending on the nature of the application
the network needs to maintain some degree of connectivity.
1.2.3 Scalability
Wireless sensor networks are assumed to have large number of mostly station-
ary sensors. Networks of 10,000 or even 100,000 nodes are envisioned and network
scalability is a major issue.
1.2.4 In-network signal processing
To improve the quality of data collected, it is often useful to fuse data from
multiple sources. This requires the transmission of data and control messages to some
3

master node before sending it to the base station. This will impose some requirements
on the networks architecture.
1.2.5 In-network query processing
The sensor network may collect a large amount of data. This may overwhelm
the user who may not be able to process all this information. Instead, selected nodes
within the network will collect the data from their neighbors and create a representative
message.
1.3 Wireless Sensors Challenges
Wireless sensor networks (WSNs) represent a new networking model. They are
faster and cheaper to deploy than wired networks and other forms of wireless networks.
They can be deployed in inaccessible and hostile environment. Wireless sensor technol-
ogy still has many limitations that need to be addressed. Cost and size constraints re-
sult in severe limitations on energy, memory, processor speed and bandwidth resources.
The limited energy places the constraint that algorithms suggested for wireless sensor
networks must be energy efficient. The low processing speed constraint necessitates
that wireless sensor network algorithms cannot afford to be computationally intensive.
The limited memory constraints place restrictions on the buffering demands for wireless
sensor networks algorithms. The sheer number of sensors in a single network means
that wireless sensor networking algorithms must be scalable. Another challenge stems
for the fact that as nodes run out of energy, fresh ones are added to the network to
replace them. This constantly changing network places demands that mechanisms de-
signed for wireless sensor networks must be able to function correctly in this dynamic
4

environment. Probably the most important constraint is the limited energy resources.
This requires the careful consideration and design of energy-aware, signal and query
processing algorithms.
1.4 Wireless Sensor Networks Reliability Research
The research in reliability for wireless sensor networks is relatively new. Each
study on WSNs has defined reliability differently and in line with their approach. Reli-
ability can be studied as a coverage problem or as message delivery reliability problem
[23]. The message delivery reliability in turn affects the data messages transport relia-
bility, and the networking protocol control messages reliability, the later in turn affects
protocols correctness.
One way to measure reliability is to specify a data delivery probability [23]. This
is proportional to the energy cost, the higher the data delivery probability the higher
is the energy cost. This fact applies to all measures of reliability. Different types of
data streams within the same network may require different reliability measures [23]
e.g. reliability for single packet delivery as in the case of delivering aggregated data to
the sink vs. block of data delivery reliability as in the case of code update, vs. periodic
reports data reliability.
Several factors can affect the wireless link data delivery reliability. Packet loss
due to congestion was identified and studied as a factor affecting the transport layer
data delivery reliability in [75]. Therefore, congestion control is considered critical to
data delivery reliability. Other reliability publications considered link failure due to
radio frequency interferences and packet collisions as the main factor affecting data
5

delivery reliability [4], [95], [101], [78], [44]. Different solutions and techniques to im-
proving the wireless link reliability were proposed. These techniques include sending
the data message through multiple routes [44], using Erasure codes to add redun-
dancy to the data packets [44], using MAC layer retransmissions [95], [94], using MAC
layer ACK/NACK control messages [11], dynamically adjusting the transmission power
based on the channel noise conditions [3], [47], or using a mixture of the mentioned
techniques in a cross-layer fashion [41].
1.5 Problem Statement
As wireless sensor network research matures, it needs to move beyond stud-
ies that are focused on addressing the challenges of energy conservation and resource
constraints. To build trust in using these systems, more emphasis should be placed
on studying and analyzing the reliability and dependability of these systems. So far,
wireless sensor networks energy efficiency research has not taken reliability into con-
sideration as a performance parameter or as a design constraint. Currently, two focus
areas in wireless sensor networks (WSNs) research can be identified. One area is con-
cerned with optimizing the energy performance and improving network lifetime. The
second area is focused on studying the WSNs reliability problem independent of the
networking and energy performance issues.
Several mechanisms for improving the wireless communication networks relia-
bility are suggested in the literature. These include Link Layer retransmissions [78],
[86] and the use of erasure codes [71], [12], [55], [15], [60], by adding redundancy to
each message thus allowing the construction of m original messages from any received n
6

messages (given n > m). The reliability algorithms proposed in the literature observe
the importance of incorporating reliability as a parameter and constraints in wireless
sensor networks research. Nevertheless, they all failed to consider these networks’ se-
vere energy resource constraints. There is a need for practical communication protocols
solutions that are reliable and energy-efficient at the same time.
1.6 Dissertation Contributions
In this work, we propose a cross-layer, reliable wireless sensor protocol design.
The protocol introduces new energy saving techniques that consider reliability as a
design parameter and constraint. Below are the contributions of the proposed protocol
design:
• A reliable, energy-aware cross-layer protocol that benefits from the body of re-
search in the wireless sensor networks reliability and wireless sensor networks
energy conservation areas. The protocol optimizes energy consumption while
providing a reliable data delivery network.
• The proposed protocol classifies the network messages based on their type. We
outline a setting in which each message carries its own reliability requirements.
In the chosen network architecture, three message types are proposed: event
reporting, periodic reports, and infrastructure communication messages. A dif-
ferent level of importance and reliability requirement is then attached to each
message type.
7

• We propose a one-hop Hello message exchange that takes place at several different
power levels. This is needed in order to measure neighbors links power versus
reliability characteristics. Each node will store the collected statistics locally for
use in future routing and clustering decisions.
• A proposed Link Rating parameter that is used by the protocol’s networking layer
in optimizing the clusters formation. This optimization is done while observing
reliability constraints.
• An Individualized Link Power Settings algorithm. Nodes will communicate with
their cluster heads using this algorithm. This will optimize intra-cluster commu-
nication under reliability constraint.
• At the MAC layer, we propose a Dynamic Back-off algorithm. It is a random-
ized back-off algorithm that is applied to adjust the back-off timer based on the
message reliability setting. The result is that in congested or heavily utilized
bandwidth, messages with high reliability requirements will have shorter back-off
times, thus increasing their chance of getting delivered. Another part of the Dy-
namic Backoff algorithm is varying the number of MAC retransmission attempts.
The number of retransmissions depends on the message type. Messages with high
reliability requirements have higher number of retransmission attempts.
• We developed simulation models for the proposed protocol and a reference pro-
tocol, APTEEN [59]. The simulation models are developed for the proposed
protocol and the reference protocol using JiST/SWANS [9], [10] simulator.
8

1.7 Thesis Organization
This work presents a cross-layer, reliable wireless sensor protocol design. The
protocol benefits from the body of research in the two areas of wireless sensor reliability
and wireless sensors energy conservation. This dissertation is organized as follows:
• Chapter 1 is the introduction. It introduces the wireless sensors and wireless
sensor networks topic. It motivates the need for energy conservation and re-
liability in wireless sensor networks research. The chapter introduces wireless
sensor networks reliability research and point out the need for bridging the gap
between energy conservation research and reliability research in wireless sensor
networks. This paves the foundation for the problem statement and our contri-
butions. These are presented later in the chapter.
• Chapter 2 covers background material about the Open System Interconnection
(OSI) networking stack model. The chapter includes survey and classification
of related work in energy optimization protocols for wireless sensor networks
(WSNs). The classification follows the layers of the OSI network model.
• Chapter 3 is a survey of reliability research in wireless sensor networks. Although
the work in reliability for WSNs is in its infancy and found to be very diverse,
an attempt is made to classify it following the OSI stack model. This is in order
to keep it inline and similar to the survey of the energy optimization research,
presented in Chapter 2.
9
• Chapter 4 presents our contribution and the design details of the proposed pro-
tocol. The chapter starts by discussing the wireless sensor networks energy op-
timization research and reliability research. This motivates the discussion about
the need to bridge the gap between the two research concentrations. The chapter
then presents the proposed protocol network architecture and gives a classifica-
tion for the network messages based on their reliability needs. A justification is
given for each message class reliability setting chosen. The first component in the
proposal, the Hello, Hello-reply messages exchange is presented next. The rout-
ing layer component along with the proposed Link Rating parameter is discussed.
The chapter then covers the MAC layer proposed Dynamic Backoff algorithm.
The proposed protocol startup and steady state operation phases are then pre-
sented. The chapter also shows a comparison between the proposed protocol
and several related wireless sensor networks protocols. Finally, the chapter con-
cludes with a discussion of cross-layer design techniques, benefits and drawbacks.
We then show the techniques that the proposed protocol uses to benefit from
cross-layer optimization while avoiding the cross-layer drawbacks.
• Chapter 5 presents the performance evaluation. We start with presenting the
simulation tool and the tool selection criteria. Then, we discuss the upgrades
applied to transform the selected tool to fit our performance evaluation require-
ments. The chapter also includes the simulation scenarios, and performance
evaluation results and analysis.
10

• Chapter 6 presents our conclusions for this dissertation and present future work
and extensions to this research.
11

Chapter 2
CLASSIFICATION OF WIRELESS SENSOR NETWORKS
ENERGY OPTIMIZATION PROTOCOLS
This chapter presents background material about the Open Systems Intercon-
nection (OSI) model. The chapter includes a literature survey and classification of the
energy optimizations protocols proposed for wireless sensor networks. The OSI model
stack layers are used for the classification. A survey and discussion of cross-layer opti-
mization is presented at the end of the chapter.
2.1 The Open Systems Interconnection (OSI) Network Stack
The Open Systems Interconnection (OSI) model is a standard developed by the
International Organization of Standards (ISO) for how to transmit messages between
any two telecommunicating points in a network [23], [64]. The standard defines seven
layers of functions that take place at each end of a communication. Each layer is
responsible for a number of logical steps that it implements. Several performance
parameters of the OSI stack for wired networks have been optimized. These parameters
include latency, fairness and throughput.
In the OSI model, the communication process between two points in a network
is divided into seven layers: Application, Presentation, Session, Transport, Network,
12

Medium Access Control, and Physical layers [23]. An advantage of this view is that
the complexity of the communication process is also divided among the different layers
making the implementation of such systems manageable. The programming and hard-
ware that furnishes the seven layers, also known as the network stack, is usually found
partly in the computer operating system, in several stand alone applications such as
Web browsers, and in the network firmware and hardware interfaces that are common
parts of any computer system.
The above discussion presented the well-known OSI stack. It describes a fixed,
seven layer stack for networking communication protocols. Similarly, there is another
layered stack protocol, which is the simpler five layer stack model, also known as the
TCP/IP protocol stack shown in Figure 2.1. There are lots of similarity between the
two protocols since they attempt to define the same communication process, but the
definition of the different layers are some what different. Wireless sensors network
stack has more in common with the TCP/IP stack. These five layers are summarized
below:
2.1.1 Application Layer
The application layer sits at the top of the communication stack. It generates
the data that will be sent out or it will be the entity that ultimately receive and
decodes the data. At this layer the communicating partners are identified, quality
of service is defined and identified, data encryption and decryption is performed, and
user authentication and privacy issues are considered. In the seven-layer protocol stack
model, this layer is further divided into the presentation and session layers.
13

Figure 2.1: OSI five layer protocol stack model.
2.1.2 Transport Layer
The transport layer provides transparent data transfer between hosts. It is re-
sponsible for end-to-end error recovery and flow control. It is also responsible for pro-
viding a reliable, error-free communication over an unreliable communication medium
and ensuring complete data transfer. The well-known Transmission Control Protocol
(TCP) and User Datagram Protocol (UDP) are implementations of the transport layer
functionality.
2.1.3 Network Layer
The network layer performs error control, source to destination routing by in-
suring the sending of data messages in the right direction to the right destination on
14

outgoing transmissions, and receiving incoming packet transmissions. This layer is also
responsible for flow control, and data segmentation and de-segmentation. IPv4, IPv6,
and X.25 are the most commonly used implementations for this layer.
2.1.4 Medium Access Control (MAC) Layer
The MAC layer regulates the usage of the shared communication medium. Be-
fore transmitting frames a station must first gain access to the medium. For a Local
Area Network (LAN) this can be the token in a token ring network. In a wireless
network scenario the medium is the radio channel. The IEEE 802.11 R© [1] is a wireless
communication MAC standard that is widely adopted. In this standard, as a condition
to access the medium, the MAC layer checks the value of its network allocation vector
(NAV), which is a counter resident at each station that represents the amount of time
that the station accessing the channel needs to send its frames. The NAV must be
zero before a station can attempt to send a frame. Prior to transmitting a frame, a
station calculates the amount of time necessary to send the frame based on the frame’s
length and the channels data rate. The station places a value representing this time in
the duration field in the header of the frame. When stations receive the frame, they
examine this duration field value and use it as the basis for setting their corresponding
NAVs. This process reserves the medium for the sending station.
In general, contention-based medium access is implemented by the Distributed
Coordination Function (DCF), which is a random back off timer that stations use if they
detect a busy medium. If the channel is in use, the station must wait a random period
of time before attempting to access the medium again. This ensures that multiple
15

stations wanting to send data do not transmit at the same time. The random delay
causes stations to wait for different periods of time and prevents them from sensing the
medium at exactly the same time, finding the channel idle, transmitting, and colliding
with each other. The back off timer significantly reduces the number of collisions and
corresponding retransmissions especially when the number of active users increases.
For radio-based LANs, a transmitting station can’t listen for collisions while
sending data, mainly because the station cannot have its receiver on while transmitting
the frame. As a result, the receiving station needs to send an acknowledgment (ACK)
if no errors were detected in the received frame. If the sending station does not receive
an ACK within a specified period of time, the sending station will assume that there
was a collision or radio frequency (RF) interference and retransmits the same frame
again.
2.1.5 Physical Layer
The physical layer is the bottom layer of the OSI stack. It provides the hardware
means of sending and receiving data on a carrier and performs services requested by
the MAC layer.
The physical layer is the most basic network layer, providing only the means
of transmitting raw bits rather than packets over a physical data link. This layer
transmits the bit stream through the network as an electrical or electromagnetic sig-
nal. It provides bit-by-bit node-to-node delivery, signal modulation and demodulation,
equalization filtering, training sequences, pulse shaping and other signal processing of
physical signals. The physical layer determines the bit rate in bits per second (bits/s),
16

also known as channel capacity, digital bandwidth, maximum throughput or connection
speed. The physical layer also defines half duplex or full duplex transmission mode.
Since the inception of the ISO OSI layered communication stack model for the
wired Local Area Network (LAN) and Wide Area Network (WAN), the goals have been
to achieve compatibility and simplification of functional description of separate units.
The optimizations of the stack have also been in the direction of improving the latency,
quality of service (QoS), reliability and throughput matrices.
With the emergence of ad hoc and wireless networks, the OSI stack is ported
as is to this new technology. Research has been active in the study of ways to enhance
the stack to optimize it and bring it up to face the new challenges found in the wireless
communication field. Token ring protocols have been replaced by a new set of proto-
cols suitable for the wireless communication e.g. Ad-hoc On-demand Distance Vector
(AODV) [67], Dynamic Source Routing (DSR) [40], and Zone Routing Protocol (ZRP)
[33] to mention a few. In the medium access control layer, several new editions have
been introduced e.g. IEEE 802.11 and IEEE 802.15.4R© (ZigBee) [2] protocols.
2.2 OSI Layers Optimization for Wireless Sensors
The emergence of the new technology of wireless sensor networks (WSNs) in-
troduces a new set of constrains forcing the optimization of the OSI stack for yet new
parameters. New protocols and optimizations have been proposed by researchers to
address the energy and other requirements in wireless sensors. Below are the different
solutions and ideas classified by OSI layers.
17

2.2.1 Application Layer
Wireless sensor networks are known to be application specific. The nature of
message exchange between the nodes and the base station is mostly of reporting sensor
readings, which tend to be short messages. Given the vast number of applications
envisioned and already in existence for wireless sensors, along with their different traffic
patterns, it will be a challenge to achieve general optimization of the application layer
for energy performance. Yet, in several publications an indication is given to the need
for applications that have small memory footprint due to the limited storage resources
[13]. Other application characteristics that can be helpful in performance optimization
include the ability to tradeoff between energy and accuracy and dynamic adaptability
to node and network resources. The application layer may also assist the rest of the
stack layers with hints that will help them optimize their performance in a cross-layer
fashion.
2.2.2 Transport Layer
The transport layer provides congestion control and end to end reliable data flow.
The TCP type transport layer protocols may not be suitable for wireless sensors since
they rely on end-to-end acknowledgments and retransmissions, which waste valuable
energy resources [88]. The requirements for the transport layer reliability can be relaxed
to event-to-sink reliability instead of node-to-sink. This is possible due to the fact that
the same event will be reported by several nodes [77]. [38] introduces the Sensor TCP
(STCP), a generic transport layer protocol for wireless sensor networks. STCP is
applicable to event driven as well as continuous reporting application communication
18

scenarios. It addresses several requirements of the transport layer and wireless sensor
networks including scalability and congestion detection and avoidance. In [97] the
PSFQ (Pump slowly fetch quickly) transport layer protocol is presented. In PSFQ
data recovery and loss detection is done on hop-by-hop basis instead of the original
end to end method.
2.2.3 Network/ Routing Layer
Energy efficient protocols for wireless sensor networks exploit the fact that these
networks are not communication networks in the classical meaning, but rather they
are distributed systems where all the nodes collaborate to perform a given task or
set of tasks. This fact can be used to trade per node fairness and other networking
qualities for designs that will yield energy efficient protocols. The networking layer
is responsible for the end to end routing and delivery of data messages. This makes
designing of energy efficient protocols in the routing layer critical since this will affect
the number of transmissions, the distance covered per transmission and the load placed
on nodes participating in the relaying of the message. For these reasons, the network
layer attracted more attention than the other layers. Some of the early work on energy
efficient wireless sensor protocols has targeted this layer [35], [52], [58], [59]. In the rest
of this section, we survey some of the proposed network protocols for wireless sensor
networks.
2.2.3.1 Low-Energy Adaptive Clustering Hierarchy (LEACH)
Perhaps the first network protocol that is specifically designed for wireless sen-
sors is the LEACH protocol [35]. The main setting that this protocol addresses is
19

that of a large number of homogeneous, resource constrained nodes monitoring the
environment and periodically sending their readings to a base station located far away
from the field as shown in Figure 2.2. The protocol achieves its power saving goals
by allowing a small percentage of the nodes, called cluster heads, to collect data from
their surrounding neighbors, aggregate that data and send a report to the base station
representing the combined readings.
The protocol avoids depleting the cluster heads energies by selecting a new set
of cluster heads at the beginning of each round. The set up overhead is assumed to
be negligible since the setup time is small compared to the rounds duration. The
protocol uses a randomized routine for each node to elect itself as a cluster head. This
routine is run locally at each node to avoid the traffic overhead of a centralized routine.
Simulation results show that LEACH can increase the network lifetime by as much as
a factor of eight compared with direct transmission. The protocol suffers from few
shortcomings including the fact that the energy level and other node resources are not
taken into consideration in the election routine. Yet, LEACH is considered the first
energy efficient protocol targeting wireless sensors, and the benchmark against which
the performance of other protocols is compared.
2.2.3.2 Power-Efficient Gathering in Sensor Information Systems (PEGA-
SIS)
PEGASIS [52] is an improvement over the LEACH protocol by introducing the
following ideas:
1. Nodes transmit only for a short distance to the closest neighbor. Each node
20

Figure 2.2: LEACH protocol configuration.
defuses its data with the data it receives before transmitting as shown in Figure
2.3.
2. Only one node reports the collected data to the base station instead of a group
of cluster heads going through the expensive transmission.
3. The leader node receives at most two messages instead of an average of 20 mes-
sages in the case of the LEACH protocol with a 100 nodes network [52].
PEGASIS achieves 100-300% energy performance improvement over LEACH.
The protocol does not specify how the leader is selected. But since this is an enhance-
ment over LEACH, one can assume that it uses the same random equation by setting
the number of cluster heads to one. In which case, issues associated with LEACH
cluster heads selection routine can be assumed to be present in PEGASIS.
21

Figure 2.3: PEGASIS protocol configuration.
2.2.3.3 Threshold sensitive Energy efficient Sensor Network Protocol/ Adap-
tive Periodic Threshold-sensitive Energy Efficient Sensor Network
Protocol (TEEN/APTEEN)
In classifying the routing protocols for wireless sensor networks, two classes can
be identified, proactive and reactive protocols [58]. The LEACH and PEGASIS proto-
cols discussed above can be considered to be proactive protocols since they periodically
send reports to the base station. Reactive protocols, in which reporting is triggered by
the occurrence of the event of interest are more suitable for time critical applications
where immediate response to changes in the sensed parameter(s) is required.
The Threshold sensitive Energy Efficient sensor Network protocol (TEEN) [58]
and the Adaptive Periodic Threshold-sensitive Energy Efficient sensor Network Proto-
col (APTEEN) [59] fall under this reactive category. Similar to LEACH and PEGASIS,
TEEN is also a hierarchical protocol. The protocol defines and uses two parameters,
22

a hard threshold and a soft threshold. The sensors are assumed to monitor the en-
vironment continuously. If the value of the sensed parameter reaches or exceeds the
hard threshold value, the node will turn on its transmitter and send a report to its
cluster head. To prevent the nodes from flooding the network with reports once the
hard threshold is reached, the nodes will send a new report only if the value of the
sensed parameter exceeds the last reported value by an amount equals to at least the
soft threshold value. The TEEN protocol offers the following features:
1. Time critical data is reported immediately to the user.
2. Data transmission occurs only if the threshold value is reached, thus substantial
energy conservation is achieved.
3. By varying the values for the hard and the soft threshold parameters, the user
has control on the network reporting behavior. The soft threshold can also be
adjusted to trade off between accuracy and energy saving.
As already stated in [58], the main drawback of this protocol is that if the
threshold value is never reached, the user will get no reports at all and will not be aware
if all the nodes in the network are dead. The above limitation of the TEEN protocol
was removed by introducing a hybrid version of the protocol, the APTEEN protocol
[59]. APTEEN defines a new Count Time (CT ) parameter that is also under the
users control. The count time is defined as the maximum time between two successive
reports. By setting values for this count time APTEEN can act as a pure reactive, a
pure proactive, or a hybrid protocol.
23

2.2.3.4 Directed Diffusion
Directed diffusion [37] is a data-centric protocol where data consists of an
attribute-value named pair. It can be considered as a reactive protocol where data
is requested by sending an interest in the named data. The protocol relies on local
communication between neighbors. To a node, a request arriving from a neighbor will
be treated as if it originated from that neighbor and no global routes between source
and sink exist. Initially, a node will flood its neighbors with its interest. Later it will
enforce the selection of minimum delay routes, or routes that have been constantly
delivering timely data. This protocol is applicable to surveillance and target tracking
applications.
2.2.3.5 Geographical and Energy Aware Routing Protocol (GEAR)
GEAR [103] is an energy aware geographical routing protocol for wireless sen-
sors. The GEAR protocol assumes that nodes are aware of their geographical location
for its operation. This can be achieved by using Global Positioning Systems (GPS) or
some localization algorithms. The GEAR protocol is suitable for applications where
the operator is interested in querying a specific geographical region. When there is a
neighbor closer to the destination, the protocol forwards the request to that neighbor.
When more than one neighbor exists that is closer to the destination, the GEAR picks
the one that minimizes some cost function. When all the neighbors are further away
from the destination, a hole is said to exist in the path and the GEAR protocol chooses
the neighbor that minimizes the cost function to forward the request.
24

2.2.3.6 Sensor Protocols for Information via Negotiation (SPIN)
The SPIN protocol [34] is defined as an application-level approach to network
communication. It introduces the use of high-level data naming (metadata) for mes-
sage exchange. For the effectiveness of using metadata in this protocol, the metadata
messages are assumed to be much shorter that the actual data messages. SPIN uses
a simple Advertise-Request-Data handshake to enable a node to send its data to only
those nodes that are interested in obtaining it.
A variation of this protocol, named SPIN-2 achieves further energy conserva-
tion by requiring nodes to monitor their energy resources and participate in the data
exchange phase only if they have adequate amount of residual energy. Simulation of
the SPIN-2 protocol shows that 60% more data can be delivered using this setting
compared to basic flooding.
2.2.3.7 Cost-effective Maximum Lifetime Routing (CMLR)
The CMLR protocol [36] identifies a cost function and a maximum lifetime
function and attempt to select a route that minimizes the first function and maximizes
the second one. The authors argue that while the path selected will not be the one
with the least cost function or the maximum lifetime one, it will be the route that will
attempt to optimize both.
2.2.4 MAC Layer
As stated in the previous section, the networking layer is responsible for the
end to end routing and delivery of data messages. Designing energy efficient protocols
25

in the routing layer is important since this will affect the route selected, number of
hops per message, the distance covered per transmission, and the load placed on nodes
participating in the relaying of the data. At the other end, the MAC layer is responsible
for per hop transmission between neighboring nodes. For this reason, and similar to
the network layer, the MAC layer attracted significant attention.
2.2.4.1 Sensor MAC (SMAC)
The first protocol that addresses the energy problem at the MAC layer is the
SMAC [102]. SMAC identifies the sources of energy waste at the MAC layer as being
due to the following four factors:
1. collision
2. overhearing
3. control messages overhead
4. idle listening.
To reduce the effect of idle listening, SMAC introduces the concept of periodic
listen and sleep cycles as shown in Figure 2.4. Nodes follow a sleep and listen schedule
that synchronizes them together. SMAC also attempts to address the problem of con-
trol messages overhead by reducing the number of control messages needed for data
exchange between any sender and receiver pairs. For overhearing and collision issues,
SMAC borrows from the IEEE 802.11 [1] medium access standard. The standard de-
fines a pair of control messages, Request-To-Send and Clear-To-Send (RTS/CTS) for
26

initiating communication between sender and receiver. SMAC requires all nodes hear-
ing either or both RTS/CTS messages to refrain from accessing the medium to avoid
collision. For overhearing, the nodes use the network allocation vector (NAV) concept
introduced in the IEEE 802.11 standard. In this vector, a node will store the duration
of time that a communication between its neighbors will take. This time duration can
be obtained from the RTS or CTS messages that the node overhears. The node can
then switch off its radio and go to sleep for the duration of time while its neighbors are
using the channel. To achieve these energy savings the trade-offs introduced by SMAC
are increased delays, and compromised per-node fairness.
Figure 2.4: S-MAC periodic listen and sleep schedule.
2.2.4.2 Delay MAC (DMAC)
The delay problem introduced by SMAC is partially solved in the D-MAC [1]
protocol by exploiting the structure of data gathering trees. It solves the message
forward interruption by adding an offset to each nodes schedule. This offset depends
on the nodes depth within the forwarding tree as shown in Figure 2.5.
2.2.4.3 TMAC
S-MAC is further improved by using a variable length active period in the TMAC
protocol [91]. TMAC reduces idle listening by transmitting all queued messages in
27

bursts of variable length and going to sleep directly afterwards. During active time
the node will keep listening or transmitting and will go to sleep before the end of the
active period if no further activation events are heard within a defined Activation Time
period (TA).
Figure 2.5: DMAC staggered listen and sleep schedule.
2.2.4.4 WiseMAC
In the WiseMAC protocol [26], a node will wake up regularly for a very short
period to sense the medium. If no activity is detected in the channel, the node will
go back to sleep immediately until the next sampling time. The nodes sampling times
are not synchronized together. If a node finds the medium busy, it stays awake to
receive the transmitted data. If a node has data, it will precede its transmission with
a preamble of length equal to or greater than the network sampling period. The
advantage of using this scheme is that at low traffic levels, nodes will only wake up for
very short time at each sampling period. The disadvantages are the high transmission
cost of the preamble signal, and that all nodes hearing the preamble must stay awake
28
to hear the data transmission even if it was not meant for them. To minimize this
transmission cost, WiseMAC requires the nodes to keep a list of their neighbors and
their next wakeup times. Then a transmitting node can start the preamble signal
just ahead of the receivers wakeup schedule keeping the preamble transmission to a
minimum.
2.2.4.5 Group-based Medium Access Control (GMAC)
GMAC [14] is a cluster-centric, reservation based MAC protocol. Each frame
cycle is divided into a contention period and a contention-free period. A gateway
node collects all transmission requests from its members in the form of a Future-
Request-To-Send (FRTS) control messages. The gateway then schedules the nodes that
submitted requests for transmission during the contention-free period. The gateway
node is responsible for storing the transmission request, schedule the transmission time
slots, collecting the data messages from its members, and forwarding all the traffic out
of the cluster.
To avoid the depletion of the gateways battery, the GMAC protocol uses the
Resource Adaptive Voluntary Election (RAVE) scheme to periodically elect a new
gateway node. The RAVE is a self election contention back-off algorithm that takes
into consideration the nodes available levels of energy and other resources.
The algorithm is based on the batterys voltage range, which can be used as an
indication of residual energy. The voltage ranges are divided into four different levels
high, medium, low, and minimum as shown in Table 2.1. The node will set a Battery
Power Level parameter according to its battery level. This parameter is then used to
29

calculate a ’Resource Level’ (RL) for the node that can have one of four possible values
0, 1, 2, and 3 as shown in Table 2.2. Based on the nodes RL value, its cluster head
contention back-off can be dynamically adjusted using the following equation:
ElectionBackoff = Random(27) + (RL ∗ 128) (2.1)
The main advantage of using the above settings and equation is that nodes with better
energy resource have higher chance of becoming cluster heads due to shorter contention
period.
A potential limitation of the GMAC protocol is that a node may be forced to
miss its allocated time slot and contend using FRTS message in the next contention
round. This will happen if another node belonging to a different gateway and within
interference distance from the node uses the channel during that time slot for its
own transmission. This scenario can result in excessive delays and high probability of
collisions in densely deployed networks or in applications characterized by high network
traffic.
Table 2.1: RAVE battery resource level.
Battery power Power level Voltage rangelevel nomenclature00 HIGH 2.6 < power ≤ (3.0-3.6)01 MEDIUM 2.4 < power < 2.610 LOW 2.1 < power < 2.411 MINIMUM power ≤ 2.1
30

Table 2.2: RAVE Contention back off.
Resource level (RL) Election contention backoffElectionBackoff = Random(27) + (RL ∗ 128)
0 HIGH 0 to 127 slots (0 ms to 2 ms )1 MEDIUM 128 to 255 slots (2 ms to 4 ms)2 LOW 256 to 383 slots (4 ms to 6 ms)3 MINIMUM 384 to 511 slots (6 ms to 8 ms)
2.2.4.6 Traffic-Adaptive Medium Access Protocol (TRAMA)
The TRAMA protocol [14] is similar to GMAC in that the communication
channel is divided into frame cycles. Each frame is divided into a random access (con-
tention) period and a scheduled access (contention-free) period. The scheduled period
is divided into time slots. Nodes compete during the random access period to reserve
slots for their data transmission during the scheduled access period. To guarantee a
collision-free transmission, the TRAMA protocol uses the Neighbor Protocol (NP), the
Schedule Exchange Protocol (SEP), and the Adaptive Election Algorithm (AEA) to
obtain and exchange one and two hop information and schedules. Nodes with no data
to send will switch off their radios and go to sleep to conserve energy.
2.2.5 Physical and Radio Layer
At the physical and hardware level the focus in Complementary metaloxidesemi-
conductor (CMOS) circuit design and optimization is shifting from faster switching cir-
cuits to ones that are optimized for power consumption. The work in [70] summarizes
the challenges facing low power design for WSNs as:
1. Design of low power low cost transceiver.
31

2. Low power sensing and processing unit design.
3. Energy efficient modulation schemes and strategies to overcome signal propaga-
tion effects.
Several projects focused on the radio component and the design of energy effi-
cient transceivers [17], [65], [21], [19], [27], [22], [45], [99], [81], [72], [76] [43], [51], [5],
[42]. In [72], the power consumption of the sensing and detection technique used is
discussed. An example is given where the piezoresistive sensor will draw a large cur-
rent while a capacitive one will not. [81] Discusses hardware designs that use several
operation states to conserve energy. It also presents available hooks in hardware for
power management, and CPU clock-down under OS control. In [72] power consump-
tion was considered as a design constraint for motion sensors for physiological activity
monitoring. Work in [76] and [43] cover a low power Analog/Digital converter for wire-
less sensors and a low power hardware encryption circuit, respectively. [51] And [5]
proposed design methodology and architectures for low power sensor design.
Other research projects proposed the redesign of the physical and radio layer
parameters for energy optimization. [42] Discusses low power algorithms for source
coding. In [74] results are shown for packet size optimization for energy efficiency
under given communication channel characteristics. [18] Proposed selection of radio
parameters at design time with the goal of optimizing the one hop transmission range
for energy efficiency.
32

2.2.6 Summary of OSI Layers Optimization Techniques for Wireless Sen-
sor Networks
In Table 2.3, we summarize the techniques used at the OSI stack layers and the
impact of each layers optimization on energy efficiency.
Table 2.3: Impact of layer optimization techniques on energy efficiency.
Layer Optimization Techniques Impact
Application Dynamic adaptability to resources. Tradeoff between energy and accuracy Low
Transport Loss detection and data recovery on hop by hop instead of end to end. Low
Event-to-sink reliability [64], [39]
Network Clustering. Subset of nodes participating in data transmission. High
LEACH [35], PEGASIS [52], TEEN/APTEEN [58] [59],
Directed Diffusion [37], GEAR [103], SPIN [34], CLMR [36].
MAC Low power (Sleep) Cycles. SMAC [102], DMAC [54], High
TMAC [91], WiseMAC [26], GMAC [14], TRAMA [70]
Physical Energy efficient hardware design. Optimize radio parameters, data Medium
packet size, and transmission range at design time for energy efficiency
[17], [65], [21], [19], [27], [22], [45], [99], [81], [72], [76] [43], [51], [5], [42]
2.3 Cross-layer Optimization
One of the main design philosophies of the OSI layered architecture model is to
provide a well-defined functionality and interfaces for each layer. This allows changes in
the technology and allows designs in any individual layer to be transparent to the rest
of the stack [87]. The OSI model has been widely adopted for wired networks design.
Although arguably not optimal for wireless communication [30], the OSI model has
been migrated unaltered to wireless ad hoc systems design.
Cross layer design is defined as the interaction between the different stack layers
33

and the sharing of information with the goal of improving the overall system perfor-
mance. It has been used in ad hoc wireless systems to improve throughput, latency,
and quality of service (QoS) [30], [69]. This Section discusses the importance of cross-
layer design and optimizations for wireless sensor networks. Some of the techniques
proposed and their advantages and drawbacks are presented.
2.3.1 The Need for Cross-layer Optimizations in Wireless Sensor Networks
A summary of the benefits of cross-layer designs for wireless sensor networks
was presented in [62]. The reasons behind the need for these cross-layer improvements
were given as:
• The stringent energy, storage and processing capabilities of the sensor nodes
necessitates such approach.
• There is a significant overhead associated with the layered protocols resulting in
high inefficiency.
• Some recent empirical studies necessitates that the properties of low power ra-
dio transceivers, which is common to wireless sensors, and the wireless channel
characteristics be considered in protocol design.
• The event-centric nature of wireless sensor networks requires application-aware
communication protocols.
34

2.3.2 WSNs Cross-layer Energy Balance and Energy Performance Analysis
2.3.2.1 Cross-layer Energy Balance
The observation that minimum-energy routing can often unfairly penalize a
subset of the nodes was made in [68]. As noted, most efforts in this direction were
targeted towards wireless ad-hoc networks and were often not portable to wireless
sensor networks. The authors then move to proposing a cross-layer energy-balancing
scheme for wireless sensor networks. This involves using a cost function that uses
hardware information such as remaining energy, channel quality, and the number of
hops routing layer metric. The success of this approach relies on the existence of a
solid MAC layer protocol that minimized in-network interference.
The reliance on a MAC protocol that can provide interference-free communi-
cation was again present in [57]. Here, the focus is on a cross-layer design for the
computation of optimal transmission powers, rates, and link schedules that maximize
the network life. The proposed algorithm alternates between link scheduling and the
computation of optimal transmission rates and powers. The authors argue that using
transmission schemes that have the following characteristics can increase the networks
lifetime:
• Multihop routing. In wireless communication, the transmission power falls off as
the mth power of distance, with 2 < m < 6. Hence, short, multihop transmission
is preferred to long range transmissions
• Load balancing. This is necessary to avoid creating hotspots where some nodes
will die quickly causing the network to fail
35

• Interference control. Links that interfere with each other should be schedule at
different times to reduce the energy required by these links to overcome interfer-
ence
• Frequency reuse. Weakly interfering links should be scheduled simultaneously.
Drawbacks: The effectiveness and suitability of the schemes introduced in [68]
and [57] for wireless sensor networks are questionable. The proposed designs rely on the
availability of a MAC protocol that can provide interference-free communication. This
implies using TDMA type protocols, which may not be a good fit for large scale, densely
deployed wireless sensor networks. An energy performance survey of the different
wireless sensor networks MAC protocols was carried out in [32]. A cross-layer analysis
that covers the medium access control (MAC) and the radio transceiver that works
in union were given. As we just pointed above, all the protocols in the survey use
CSMA/CA in their implementation. TDMA-type MAC protocols are rarely suggested
for use for wireless sensor networks.
2.3.2.2 Cross-layer Energy Performance Analysis
In [53], the authors study the energy performance of wireless sensor networks
as a function of resource allocation for a detection system. The connection between a
single center and the fusion center is modeled as a two-state continuous time Markov
chain. The model takes into consideration channel physical parameters and link layer
message delay and message loss probabilities.
Finding the optimal number of network clusters that gives the best energy per-
formance in cross-layer manner was studied in [98]. The number of cluster heads is
36

factored into the energy minimization problem that provides a scheduling policy that
integrates the physical, MAC and the routing layers.
2.3.3 Multi-layer Cross-layer Optimization Techniques
In addition to cross-layer protocol designs that focus on pair-wise layer inter-
action, there are other more general approaches that target three or more layers. An
example is [57], which proposes a protocol that minimizes transmission power, trans-
mission rate, and link schedule for a TDMA-based wireless sensor networks protocol.
Another example is the joint scheduling algorithm proposed in [92], where the nodes
form distributed on-off schedules for each flow in the network while routes are estab-
lished such that the nodes are only awake when necessary. An extreme approach was
proposed in [28], in which the traditional OSI layer architecture is thrown away and a
new communication system is redesigned from the ground up for wireless sensor net-
works. A unified cross-layer module (XLM) that uses the receiver-based routing [82],
[108], [107] was introduced. The XLM module uses this in addition to received based
contention, local congestion control, and distributed duty cycle operations in order to
realize efficient and reliable communication.
A multi-layer framework for cross-layer design that spans several levels was
proposed for wireless ad-hoc and wireless sensor networks in [73]. The framework
accepts a set of possible routes as input and uses feedback information from the physical
and MAC layers to measure how well each of the routes meets the following objectives:
• The nodes constituting the path having high remaining battery energy.
• The route is power-efficient.
37

• Reliable packet delivery.
• The route is stable in respect to route maintenance and connection disturbance.
The drawback of the above approach is that it relies on the availability of multi-
ple routes between source and destination. This may not be applicable to hierarchical
network architectures commonly proposed for wireless sensor networks.
2.3.3.1 Cross-layer Optimization Using Forward Error Correction
As a promising technique, the effectiveness of using forward error control (FEC)
schemes for constructing channel-aware routing was studied in [96]. The low power
communication constraints of wireless sensors magnify the effects of the wireless channel
leading to error-prone links. The effect of multihop routing and the broadcast nature
of the wireless medium were investigated to drive the equations governing the energy
consumption, latency, and packet error rate of error control scheme. As a result, cross-
layer analysis considering routing, medium access and physical layers was devised.
Forward error control (FEC) coding improves the error resilience by sending redundant
bits through the wireless channel. In this case, lower signal-to-noise (SNR) values can
be supported to achieve the same error rate as an uncoded transmission for the same
power cost. In a multihop network, the advantage of incorporating FEC can also
be used to construct longer hops. In order to realize this hop length extension, the
authors propose a channel-aware routing algorithm in which the next hop is determined
according to the received signal-to-noise ratios (SNR) of the possible links.
38

2.3.3.2 Cross-layer Optimization Using Feedback Optimization Agents
An Optimization Agent framework for cross layer design was proposed in [87].
As defined, this optimization agent can be thought of as a stack-wide database where
each layer can deposit essential parameters that define its current working conditions.
Other layers can access these data and use the information to tune and optimize their
performance accordingly. The framework is to provide and control the exchange of
information between the different layers to improve the systems performance. The
authors argue that when designing wireless networks, the wireless channel has some
unique characteristics that need to be taken into consideration. The broadcast nature
of the radio communication, and the signal propagation that is affected by fading, at-
tenuation, transmission power, and the rapid signal degradation with distance between
sender and receiver. The authors also point out that in the layered approach, each layer
is to offer certain services to the next higher layer. This provides a level of transparency
and reduces the complexity by splitting the network into smaller manageable modules.
Such network design helps to provide easy standardization, inter-layer interoperability,
and peer-to-peer relationship among the different networks and equipments. It also
promotes adaptability at various layers based on information exchanged. Neverthe-
less, such design requires careful consideration to avoid unintentional and undesirable
consequences, e.g. deadlocks and loops.
The framework proposed in [87] is shown here in Figure 2.6. The framework
relies on the following concepts: at the physical layer channel quality estimation is
performed to obtain the signal-to-noise ratio (SNR) of a link and the data is used
to select the data rate. This in turns affects the transmission delay. At the network
39

layer, the routing protocol then makes decisions based on the delay associated with
each link. The framework includes the proposed optimization agent (OA) component
to facilitate the interaction between the different protocols and serves as a repository
or a database where essential information provided by the different layers are kept
and used as an aid in meeting the performance optimization objectives. This idea of
cross-layer information sharing was previously introduced in [50] but as a design time
tool to support adaptability and optimization for ad-hoc networks as shown in Figure
2.7.
2.3.4 WSNs Cross-layer Design Challenges and Open Research Issues
The authors in [62] point out that a systematic methodology to accurately model
and leverage cross-layer interactions is still missing. Several studies advocate that
communication protocols for wireless sensor networks need to be redesigned consid-
ering the wireless channel characteristics. In several conservative cross-layer projects,
only the cross-layer interaction is considered, where the traditional layered structure
is preserved, while each layer is informed about the conditions of other layers. As
an example, an experimental study on the effect of the communication channel on a
simple protocol such as flooding was investigated through testbed experiments in [29].
Accordingly, the broadcast and asymmetric nature of the wireless channel resulted in
a different performance than that predicted by using the disk graph models.
2.3.5 Cross-layer Design Challenges
The study in [62] concludes with some precautionary guidelines in cross-layer
design similar to the ones introduced in [30]. The improvements gained in performance
40
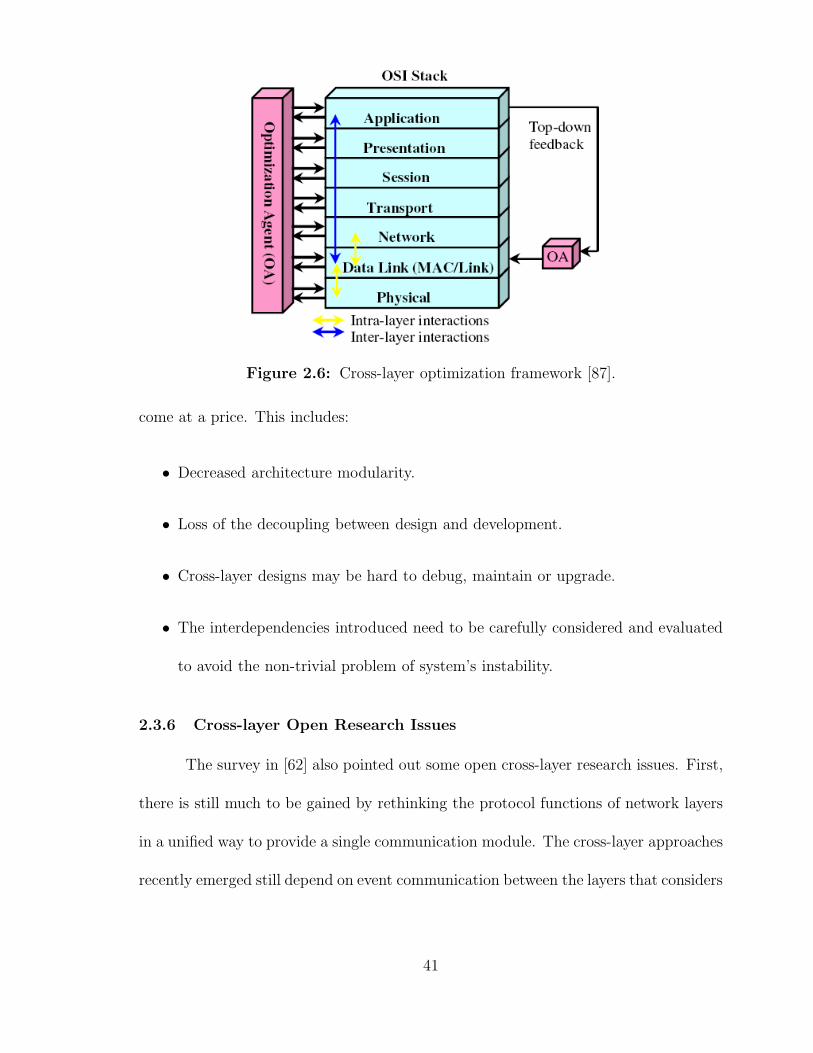
Figure 2.6: Cross-layer optimization framework [87].
come at a price. This includes:
• Decreased architecture modularity.
• Loss of the decoupling between design and development.
• Cross-layer designs may be hard to debug, maintain or upgrade.
• The interdependencies introduced need to be carefully considered and evaluated
to avoid the non-trivial problem of system’s instability.
2.3.6 Cross-layer Open Research Issues
The survey in [62] also pointed out some open cross-layer research issues. First,
there is still much to be gained by rethinking the protocol functions of network layers
in a unified way to provide a single communication module. The cross-layer approaches
recently emerged still depend on event communication between the layers that considers
41

Figure 2.7: Adaptive cross-layer design operation [18].
the transport, networking MAC functionalities with physical layer. Some open issues
towards the development of systematic techniques for cross-layer design include:
• Identifying adequate utility functions: Functions that represent the global
design objectives such as minimum energy consumption and maximum network
lifetime. These functions need to converge allowing for the location of a global
optimum operational point in an efficient manner
• Improved understanding of energy consumption: Existing studies focus
on optimizing functionalities at the different layers with the overall objective of
minimizing the energy consumption. Hence, further studies are needed to develop
modules and methodologies to solve the energy-oriented problems
• Accurate delay modeling: There is a need for accurate delay modeling due to
the interaction between the different layers. This is particularly important in the
42

design of cross-layer protocols for real time and delay-bonded applications such
as in monitoring and tracking applications
• Connectivity with realistic physical layer: Several studies concluded that
the effect of the physical layer and the impairments of the wireless channel on
the design and operation of the upper layers are not negligible. Accordingly, new
analytical models that take into consideration fading and other link connectivity
issues are needed.
• Cross-layer network simulators: Existing discrete-event network simulators
[61], [63], [93], [16], [48] may not be suitable for evaluating cross-layer designs.
The inner structures and implementation of these simulators are tightly coupled
to the layered architecture. Implementing a cross-layer solution on these simu-
lators may run into a non-trivial task. Hence, there is need for new simulators
that are based on a new paradigm so as to ease the development and evaluation
of cross-layer solutions
2.4 Summary
This chapter presented the Open Systems Interconnection (OSI) model and its
variant, the TCP/IP stack model. The chapter surveyed the energy optimizations
techniques proposed for wireless sensor networks classified based on the OSI stack
layer they aim to optimize. Finally, a discussion of cross-layer optimization was pre-
sented. The benefits, challenges and drawbacks of cross-layer designs were outlined.
43

The discussions here indicate that cross-layer design and optimization is critical to suc-
cessful WSN protocol design. The next chapter addresses reliability in wireless sensor
networks.
44

Chapter 3
RELIABILITY IN WIRELESS SENSOR NETWORKS
This chapter is a survey and classification of the wireless sensor networks reliable
protocols. The classification follows the OSI stack model that was explained and used
in Chapter 2. In this Chapter, we aim to highlight that fact that past research in
reliability for wireless sensor networks is in isolation from energy conservation research.
3.1 Importance of Wireless Sensor Networks (WSNs) Reliability
As the wireless sensor networks research matures, it needs to move beyond
studies that are focused on realizing these networks, e.g. studies that address the
challenges of energy conservation and resource constraints. To build trust in using these
systems, more emphasis should be placed on studying and analyzing the reliability and
dependability of WSNs. So far, wireless sensor networks energy efficiency research
has not taken reliability into consideration as a performance parameter or as a design
constraint.
WSNs reliability research is still in its infancy. There is no unified definition for
wireless sensors’ reliability and each work has defined reliability differently and in line
with their approach. Figure 3.1 shows a pie chart of the classification carried by [20]
of numerous IEEE and ACM publications and proceedings on wireless sensor networks
45

over the past few years. It shows that while routing and MAC layer have attracted
their share of attention, research in wireless sensor networks reliability acquired only
5% of those publications.
The OSI stack was instrumental in organizing the studies for WSNs energy con-
servation research and protocols. A similar organizing framework does not exit for
WSNs reliability protocols and WSNs reliability evaluation research. Reliability can
be studied as coverage problem or as message delivery reliability problem [100]. The
message delivery reliability in turn affects the message transport reliability, and the
networking protocol control messages reliability. The later affects protocol’s correct-
ness. In this work, we concern ourselves with the message delivery reliability challenges
and solutions.
Figure 3.1: Classification of the related work in WSNs [20].
46

3.2 Classification of WSNs Reliable Protocols
A previous survey work [100] discussed WSNs reliability challenges and intro-
duced some of the transport protocols that addressed WSNs reliability. The protocols
presented were classified according to their message data stream type as single packet
vs. block of packets vs. periodic stream of packets. The limitation of this classification
approach is that it leaves out a considerable number of WSN reliability studies that
approached the problem from a more abstract level and did not necessary fall under
any of the categories in the above classification. We present more general classifica-
tion terms that attempt to organize the WSNs reliable protocols under categories that
follow the OSI stack layers.
One way to measure reliability is to specify a ‘data delivery probability’ [100].
Higher data delivery probability requirements imply higher energy cost. This is true
regardless of the definition used for reliability. Different types of data streams within
the same network may require different reliability measures [100] e.g. single packet
delivery reliability as in the case of delivering aggregated data to the sink, block of
data delivery reliability as in the case of code update, and periodic reporting data
reliability. In this Section, we attempt to classify the reliable protocols proposed for
WSNs using the OSI stack layer as a classification platform similar to the classification
carried out in Chapter 2.
3.2.1 Transport Layer
In [78], the authors argue that while node redundancy, inherent in WSNs in-
crease the fault tolerance, no guarantee on the reliability levels can be assured. Further,
47
the frequent communication failures within WSNs impact the network’s reliability over
time and make it more challenging to achieve a desired reliability. Another issue is that
flooding of bursty raw data causes broadcast storms, which can result in collisions,
contentions and power wastage. In-network processing is an optimization that reduces
redundancy resulting in fewer collisions, contentions, and enhances responsiveness. In
order to model the reliability of data transport, all the operations on data starting from
its generation to dissemination, aggregation and transmission need to be considered.
A framework for modeling reliability in WSNs is currently missing [78]. Such a
framework will be useful in classifying existing transport protocols and in comparing
their reliability performance. Next, we present examples of reliable Transport layer
protocols proposed for wireless sensor networks.
3.2.1.1 Event-To-Sink Transport (ESRT) Protocol
The first reliable transport protocol proposed for wireless sensor networks is the
Event-To-Sink Transport (ESRT) protocol. The concept of event-to-sink reliability is
introduced in [75] as an alternative to the classical source to destination reliability.
This is more applicable to WSNs since data flows from nodes to sink are loss-tolerant.
Event detection and the reliable relaying of information to the sink is what matters in
determining the reliability and successful operation of the network. This is regardless
of how many sensors did successfully deliver information about the detected event. The
event radius defines a circle around the event within which all the enclosed nodes will
be able to sense (detect) the event as shown in Figure 3.2.
ESRT is a centralized protocol that runs only on the sink and thus leveraging its
48

abundance of computing and power resources and relieving the resource constrained
nodes. In ESRT, congestion control is identified as an important factor for reliable
data flow since packet loss due to congestion can impair event detection at the sink.
The reliability requirements are determined by the application layer. The transport
layer reliability is defined by a reliability factor that is the ratio between the number
of received packets at the sink to the optimal number of packets that is required for
reliable event detection. Ideally, the ratio should be maintained as close as possible to
one. The reporting frequency is defined as the number of reports that the nodes need
to generate per unit time to achieve required event detection reliability. This factor is
calculated and broadcasted to all nodes by the sink. The protocol operation also relies
on congestion detection. To do this the sink relies on the nodes setting a congestion
flag bit on their reply messages. A node will monitor its buffer fullness and the rate at
which the buffer is getting filled. The congestion flag bit will be set if the node predicts
that it will experience a buffer overflow during the next reporting period.
Figure 3.2: ESRT Event Radius [75].
The ESRT protocol identifies five network states as shown in Figure 3.3, these
states are:
49

1. 1 (NC, LR) not congested, low reliability.
2. 2 (NC, HR) not congested, high reliability.
3. 3 (C, HR) congested, high reliability.
4. 4 (C, LR) congested, low reliability.
5. 5 (OOR) optimal operating region.
The protocol will use the reporting frequency to control the transition of any of
the states to the OOR state as shown in Table 3.1.
Figure 3.3: EESRT Five reporting regions [75].
3.2.1.2 Reliable Multi-Segment Transport Protocol
The Reliable Multi-Segment Transport (RMST) protocol, a transport layer pro-
tocol design to be used with directed diffusion was presented in [86]. The authors point
out that the emphasis on energy conservation in sensor networks implies that poor
50

Table 3.1: ESRT protocol operation in each of the five states.
Network State (Si) ESRT Action(NC,LR) Multiplicatively increase f. Achieve required reliability as soon
as possible(NC,HR) Decrease f conservatively. Cautiously reduce energy consumption
so as not to compromise reliability(C,HR) Decrease f aggressively to state (NC,HR) to relieve congestion,
then follow actions in (NC,HR)(C,LR) Decrease f exponentially. Relieve congestion as soon as possibleOOR f remains unchanged
paths should not be selected during route discovery. Nor should they be artificially
bolstered via MAC Automatic Repeat Request (ARQ) mechanisms. Given the high
wireless link loss rate (between 2% - 30%), the authors address the tradeoffs between
implanting reliability in the MAC layer (i.e. hop-to-hop) vs. in the transport layer
(end-to-end). Several design choices were explored. MAC layer ARQ refers to the
hop-to-hop recovery of missing or erroneous packets. This includes using RTS/CTS
and ACK control messages. If the design is using no ARQ, the transmissions do not
employ MAC layer reliability mechanisms. In this mode reliability is deferred to the
transport or application layer. There are several benefits to this approach including:
• Significant amount of overhead associated with the RTS/CTS and ACK exchange
can be avoided
• Routing protocols attempt to select high quality paths for data transmission
The performance of caching and non-caching designs was also discussed in [86].
In caching, each node in the path caches the fragments that make up a larger data
51
entity. When a node senses a missing fragment, a repair request is sent to the next hop.
If the requested fragment is in the neighbor’s local cache a response is sent. Otherwise,
the request is forwarded towards the data source. In the non-caching design, only the
sinks can detect missing fragments and data errors.
3.2.1.3 Analysis and Classification of WSNs Reliable Transport Protocols
Shaikh, et al. in [78] present a definition for data transport reliability as that
the sink detects the phenomenon of interest within an application-specific time bound.
Existing WSNs data transport protocols were classified into two categories: end-to-end
(e2e) and event-to-sink. The RMST protocol [86] was used as example for e2e. It relies
on selective NACK to detect message loss at the sink. The ESRT protocol [75] was used
as an example for event-to-sink category. From the RMST reliability block diagram
shown in Figure 3.4, the equation for the protocol’s reliability is derived as given by
Equation 3.1. Similarly, from the block diagram for ESRT in Figure 3.5, the reliability
can be derived as shown in Equation 3.2. Using Equation 3.1, the positive impact of
increasing the number of retransmissions on RMST performance can be studied.
52

Figure 3.4: Reliability block diagram for RMST [78].
RRMST = 1(1 − RR) ∗ (1 − (RR ∗ RMLD))r (3.1)
Where r = number of retransmissions, RR is the routing reliability, and RMLD is the
reliability of message detection.
Figure 3.5: Reliability block diagram for ESRT [78].
RESRT = 1 − (1 − RR)n (3.2)
Where RR is the routing reliability and n is the number of sources reporting the phe-
nomenon to the sink.
As another example for event-to-sink reliable transport protocols, the RBC [106]
protocol was presented. The reliability block diagram for the protocol is shown in
53
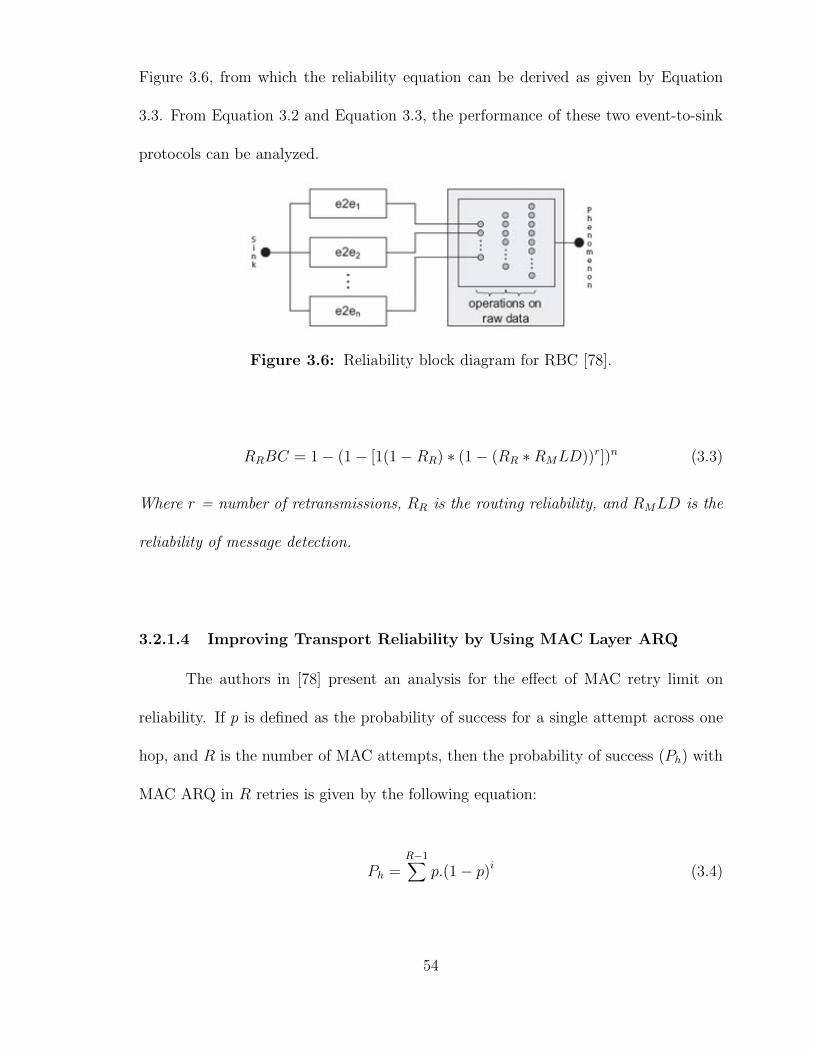
Figure 3.6, from which the reliability equation can be derived as given by Equation
3.3. From Equation 3.2 and Equation 3.3, the performance of these two event-to-sink
protocols can be analyzed.
Figure 3.6: Reliability block diagram for RBC [78].
RRBC = 1 − (1 − [1(1 − RR) ∗ (1 − (RR ∗ RMLD))r])n (3.3)
Where r = number of retransmissions, RR is the routing reliability, and RMLD is the
reliability of message detection.
3.2.1.4 Improving Transport Reliability by Using MAC Layer ARQ
The authors in [78] present an analysis for the effect of MAC retry limit on
reliability. If p is defined as the probability of success for a single attempt across one
hop, and R is the number of MAC attempts, then the probability of success (Ph) with
MAC ARQ in R retries is given by the following equation:
Ph =R−1∑
p.(1 − p)i (3.4)
54

This can be simplified as:
Ph = 1 − (1 − p)R (3.5)
For H hops, the end-to-end reliability (Pe ) is:
Pe = (Ph)H (3.6)
The graph in Figure 3.7 plots the probability of message arrival vs. MAC retry
limit for 40 hops and error rate of 0.10 per hop. It is very interesting to see that for
such a high link error rate, only few retransmissions are effective in achieving a high
probability of message arrival. Figure 3.8 shows the probability of message arrival
at the sink over 6 hops when using MAC ARQ (RTS/CTS and ACK) and when not
using ARQ. The graph shows clearly that the probability of arrival drops sharply while
increasing error rate for non-ARQ, but stays high when using MAC ARQ. This shows
the effectiveness of MAC layer ARQ in combating the unreliable nature of the wireless
link.
Figure 3.7: Probability of arrival across 40 hops with an average error rate of 0.10per hop, given R retries per hop [86].
55

Figure 3.8: Probability of arrival across 6 hops [86] .
3.2.2 Network Layer
3.2.2.1 Reliable Routing Using Graph Theory Analysis
Graph theory architectural models are used intensively in computer networks to
construct mathematical representations for these networks. In [56], a reliability analysis
using graph enumeration is presented. Reliability is defined as the probability that the
network will function. The network is modeled as a graph G = (V, E) composed
of elements that can fail statistically independent of one another and their failure
probabilities are known. Failure states enumeration, minimum paths enumeration, and
cuts enumeration between source and destination are used to calculate data delivery
probability. From the analysis it is clear that this is a source-to-sink communication
scenario.
The problem of computing a measure for reliability and the maximum message
delay in WSNs was addressed in [3]. Reliability is defined as the probability that there
exists an operational communication path between the sink and at least one operational
sensor in the target cluster (target area). The failure of one or mode nodes may not
56

cause the data sources to be disconnected from the data sinks. This can be considered
an event-to-sink reliability scenario. The network is modeled by a probabilistic graph
G = (V, E), where every node in the network is represented by a node in V . Each
node v in V has an associated operational probability Pv. An edge exists between two
nodes if they are within communication range from each other. The network and the
corresponding graph model are shown in Figure 3.9 (a) and Figure 3.9 (b), respectively.
Figure 3.9: (a) A wireless network, (b) The Graph model.[3].
3.2.2.2 Multiple Routes and Erasure Codes Reliable Protocols
A simple network as shown in Figure 3.10 was used to derive the reliability
definition used in [3]. The components reliabilities are as shown in the figure. From
the graph, the network reliability is derived as:
Rel(G) = PB(PH1(1 − (1PS1)(1PS2)) + (1PH1)PG.PH2.PS2) (3.7)
In the reliability analysis given, many networking factors were eliminated from
playing a role in the reliability calculation. An example is the effect of MAC layer
retransmissions on link layer reliability.
57

Some of the surveyed work introduced mechanisms for improving WSNs reliabil-
ity while observing their resource constraint. [44] Starts by introducing the equation:
Number of packets received = Psuccess ∗ Number of packets sent (3.8)
The per packet delivery success probability (Psuccess ) can be obtained through
empirical studies. This value is fixed and nothing more can be done to improve it.
The technique used here is to increase the number of packets sent sufficiently enough
so that all the data is received. The following mechanisms for improving the network’s
reliability were suggested:
• Link Layer retransmissions
• Use of erasure codes [71], [12], [55], [15], [60] which adds redundancy to each
message thus allowing the construction of m original messages from any received
n messages ( given n > m) as shown in Figure 3.11
• Providing alternative routes (multiple routes) to replace failing links
Figure 3.10: Network Graph [3].
58

Desirable properties for erasure codes algorithms used in wireless sensor net-
works were pointed out in [46] as:
• The ratio mn
needs to be dynamic since it is dependent on the current channel
error conditions
• There should be no restriction on the packet length
• Encoding and decoding should be inexpensive in their memory and processing
requirements
The authors point out limitations with traditional erasure codes [71], [12] used in
[44] such as Reed-Solomon codes since they fail to satisfy the above properties.
A suggested solution is to use the new classes of erasure codes such as Luby
transform [55], Raptor [15], and Online codes [60] that have better performance
for WSNs.
Figure 3.11: Erasure Code Mechanism [44].
Similar to the technique above, [24] suggests improving reliability by sending
the data message through multiple paths. The algorithm tries to find k disjoint paths
59

between source and destination and adding redundancy to each packet so that only
E (E < k) packets need to reach the destination for the original message to be con-
structed. The algorithm assigns a ’reputation coefficient‘ to each path based on its
past performance. The degree of redundancy added to each message depends on the
number of paths (k), and on the reputation coefficients of the available paths. The al-
gorithm and the associated analysis are built around the notion of source to destination
reliability.
Limitations of Erasure Codes and Multiple Routes Reliable Protocols: The
limitations with using erasure codes and multiple routes to improve reliability in WSNs
are the following:
• They depend on the existence of multiple routes between source and destina-
tion. This may not be applicable to hierarchal topologies that are the typical
architectures for large scale wireless sensor networks
• The surveyed Erasure Code protocols failed to study the energy consumption
overhead of adding redundant bits to each packet
• There is an energy overhead introduced by transmitting more packets than needed
to construct the original message
3.2.2.3 Reliable Routing Using Link Connectivity Statistics
In [101], Woo et al. state that the dynamic and lossy nature of the wireless
communication medium posses a major challenge to reliable self-organizing multi-hop
networks. This is more problematic with the simple, low-power transceivers commonly
60

used in sensor networks. To improve communication reliability, the authors propose
capturing link connectivity statistics dynamically by using efficient and adaptive link
estimators. Routing decisions should exploit such connectivity statistics.
Each node maintains a neighborhood table. The table stores link status, quality
and routing information. The link quality estimators can be very efficient in imple-
menting cost-based routing. A challenge arises that in dense networks, a node may
receive packets from more nodes than it can represent in its neighborhood table. The
challenge is for a node to decide in which nodes it should invest its limited neigh-
borhood table resources to maintain link statistics. The problem is that if a node is
not in the table, there is no place to record its link quality information. The authors
then attempt to develop an algorithm for neighborhood management that will keep
a sufficient number of good neighbors in the table regardless of the network density.
The problem addressed here has aspects in common with cache management and with
database statistical estimation techniques.
3.2.3 MAC Layer
The MAC layer uses a few mechanisms to improve the per-hop communication
reliability. Several reliable protocols that rely on these mechanisms have been proposed.
In this Section, we present some of these protocols classified by the MAC mechanisms
used.
3.2.3.1 Reliable Protocols Using MAC Layer Retransmission
Several studies have attempted to analyze the various WSNs parameters and
their impact on the overall network reliability and performance. As an example, MAC
61
retransmission is considered to be very effective in improving reliability. Nevertheless,
it is also an expensive operation and wastes valuable resources [4]. Challenges to
achieving reliability in WSNs were summarized as being due to:
• Nature of the wireless medium and burst errors
• Resource constraints
• Algorithms to achieve reliability cannot be computationally extensive
As stated in [95], one of the major factors affecting the reliability in multi-hop net-
works is the local retransmission reliability mechanism implemented in the MAC layer.
The performance of this mechanism depends mainly on the maximum number of re-
transmissions for packet failures. The effect of this mechanism on the overall network
performance was investigated and the results show that although there is a significant
difference between the maximum number of retransmissions, Rtmax = 4 and Rtmax =
7, further increase in the retransmission limit to 10 does not have a significant effect
on the overall network reliability.
3.2.3.2 Reliable Protocols Using MAC Layer Contention Window Size
Contention is one of the major sources of packet drop. For this reason con-
tention resolution mechanisms are needed at the MAC layer. Contention resolution
is performed via contention window adjustment. A node selects its random back-off
time between (0, cw), where cw is the contention window size. This window size is
initially set to minimum and as the contention level increases in the vicinity of the
62

node, the size of the contention window is increased. Hence, the current value of cw is
a representative of the local contention level.
The interaction between the contention window size and retransmission tech-
niques for improving end-to-end data delivery reliability was studied in [31]. The
authors point out that the radio link exhibits varying reliability over time, space and
from node to node. Similar to [75], where the primary source for data loss is due to
noise and environmental effects rather than congestion. The important findings in [11]
are the following:
• Link layer retransmissions are necessary for improving reliability
• A small number of retransmissions are sufficient for a satisfactory reliability im-
provement
• The cost of higher reliability is higher network overhead due to longer path lengths
and excessive retransmissions
3.2.3.3 Reliable Protocols Using MAC RTS/CTS Messages
In [94] the focus is on the reliable multihop bulk transfer of data. The authors
argue that the vast majority of research is focused on reliable and power-efficient trans-
fer of small amount of data. However, in a few WSN applications, reliable transfer of
mass data is essential. The authors present bulk transfer service that achieves reliabil-
ity by employing a simplified version of IEEE 802.11. This is achieved by RTS/CTS
handshake as shown in Figure 3.12 to protect long packet bursts and provide a simple,
63

efficient flow control by allowing only one data stream to communicate at any given
time.
Figure 3.12: RTS/CTS handshake to protect longer packets bursts [94].
3.2.3.4 Reliable Protocols Using MAC ACK Messages
The concept of event to sink reliability is used in [11]. The sink sends its query
to the network and indicates in the query if reliable delivery of the response is required,
by setting a flag in the query. The authors address the issue of a parent node failing
after receiving a message from its child. In this case, the child will not receive an ACK
and dynamic route switching algorithm will be executed. This will select a new parent
through which the data will be sent.
3.2.4 Radio and Physical Layer
The relationship between radio range and reliability was discussed in [3]. An
increase in the radio range results in an increase in the one hop reliability. The relation-
ship between radio range and power was also discussed, as radio range is proportional
to at least the square of the power. Therefore, increasing the radio range is effective
in improving the one-hop reliability, but extremely taxing on energy.
The work in [47] presents a cost-based reliable algorithm. The network tries
to set the one hop retry limit and the transmission power to a setting that minimizes
64

the power consumption metrics while meeting some reliability requirements constraint.
Here again the probability of one hop successful transmission is shown to be propor-
tional to the transmission power as given by the equation below:
P(successfulTx) = f(
Gain ∗ Tx power
Noise power
)(3.9)
The main theme in [79] is to study reliability as a coverage and connectivity
problem. Necessary and sufficient condition for a random grid network to cover a unit
square region was derived. Similarly, it provided sufficient conditions for connectivity.
The results can be used to determine the tradeoff between node diameter, reliability,
and power consumption since the radio propagation radius is directly related to the
transmission power. For a network with n nodes, if r(n) is the transmission or sensing
radius and Dij(n) is the number of transmissions required to traverse from node i to
node j. The diameter of the grid is then defined as:
D(n) = maxi,jDij(n) (3.10)
From which the authors derive the upper and lower bounds on the diameter of
the grid as:
√2 < r(n)D(n) <
2
1 − 2√πc
(3.11)
Where c is a parameter that decides how much power each node uses.
Two hardware empirical studies were conducted in [101] using Berkeley Mica
motes running TinyOS [49]. The goal was to test the reliability of the wireless commu-
nication link. For the first experiment, a group of sensors were placed linearly with a 2
feet spacing between each pair. One node was chosen as a transmitter sending periodic
65

packets at a given power level. The rest of the nodes were acting as receivers counting
the number of received packets. Figure 3.13 shows the results obtained. As expected,
there is a region within which all nodes have good reception. The size of this region
depends on the transmission power. There is also a distance beyond which all nodes
have poor connectivity. Between the two points there is a transitional region within
which the overall connectivity drops smoothly.
Figure 3.13: Reception probability of all links in a network with a line topology [101].
To test whether the link quality is stable over time, the second experiment was
conducted in an indoor environment using a pair of nodes. One node was configured
as a data source, sending 8 packets per second and the other node configured as a
receiver. The test was carried out for a period of 20 minutes at a distance of 15 feet.
The nodes were then brought to a distance of 8 feet and the experiment was continued
for a total time of 4 hours. Figure 3.14 shows the results of this experiment. At each
distance the mean link quality is relatively stable, but there is significant variation in
the instantaneous link quality. The authors in [101] also state the observation that
66
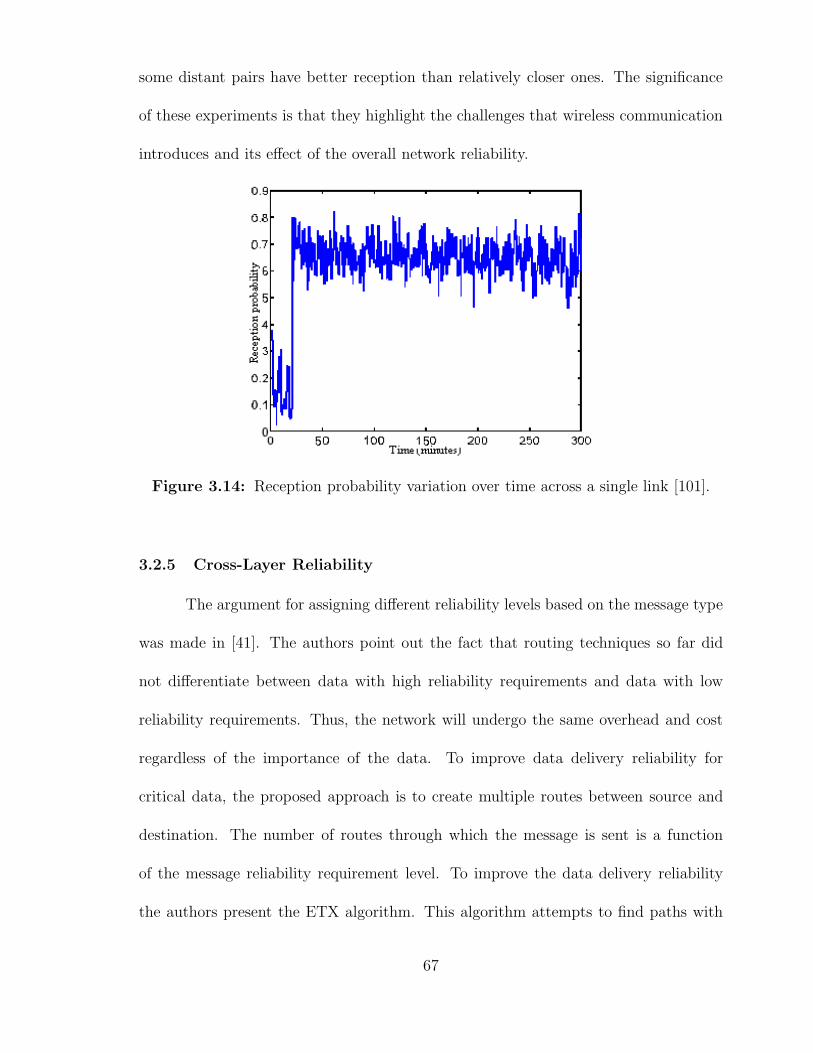
some distant pairs have better reception than relatively closer ones. The significance
of these experiments is that they highlight the challenges that wireless communication
introduces and its effect of the overall network reliability.
Figure 3.14: Reception probability variation over time across a single link [101].
3.2.5 Cross-Layer Reliability
The argument for assigning different reliability levels based on the message type
was made in [41]. The authors point out the fact that routing techniques so far did
not differentiate between data with high reliability requirements and data with low
reliability requirements. Thus, the network will undergo the same overhead and cost
regardless of the importance of the data. To improve data delivery reliability for
critical data, the proposed approach is to create multiple routes between source and
destination. The number of routes through which the message is sent is a function
of the message reliability requirement level. To improve the data delivery reliability
the authors present the ETX algorithm. This algorithm attempts to find paths with
67
the smallest number of expected transmissions (including retransmissions) required to
deliver a packet. It predicts the number of retransmissions required using per-link
measurements of packet loss ratio in both directions of each wireless link. This packet
loss ratio is calculated using the number of probes received in w seconds over the link
and the actual number of probes that should have been received. The protocol has
these characteristics: It is based on delivery ratio, which affect throughput. Can use
precise link loss ratio to make fine-grained decisions between routes. Penalizes routes
with more hops, which tends to have lower throughput due to interference
From the algorithm description, the data delivery reliability is translated to a
throughput and latency problem. The AODV [67], DSR [40] or other Ad-hoc protocols
are given as possible routing strategies to work on top of the ETX algorithm. Drawback:
This solution may be fit for source-to-destination communication style common to ad-
hoc type networks. This may not be the case for the typically hierarchal WSNs.
3.2.5.1 Cross-Layer Reliable Protocol Using Embedded Message Reliabil-
ity Flag
To improve network lifetime, nodes can buffer messages until their buffers are
filled and then send all messages to the upper level nodes. The impact of this in-
network buffering on reliability was studied in [25]. A one-bit reliability flag in the
message is proposed. If the flag is not set, the network will do its best effort to deliver
the message while conserving energy. If the flag is set, the network will transform itself
into a reliable data delivery system using MAC layer ACKs.
68

3.3 Wireless Sensor Networks Reliability Techniques
From the surveyed WSNs reliable protocols literature, some of the proposed
techniques for improving WSNs network reliability can be recognized.
• Link layer retransmissions.
• Increasing the one hop transmission power. This leads to longer transmission
range, but very taxing on the power requirements.
• Use of ACKs and NACKs (at the link or transport levels).
• Use of multiple disjoint paths to send the same message and adding redundancy
to each packet (erasure codes).
3.4 Wireless Sensor Networks Reliability Challenges and Open Issues
In this section, we summarize WSNs reliability challenges and point out some
open issues.
3.4.1 Wireless Sensor Networks Reliability Challenges
Some of the surveyed work point out some reliability challenges specific to
WSNs. [80] Discusses the need for incorporating Common Cause Failure (CCF) in
the reliability calculation of WSNs since communication failure can be due to link fail-
ure or node failure, which in turn can be due to CCF. CCF [66] represents node failure
that can be due to events that have a low probability of occurrence, but will disable
a large number of nodes when they do occur. Examples of CCF failure are flooding,
fire, and mud slides.
69

As another example of reliability challenges specific to WSNs, [20] points out
the challenges introduced by the silent failure of nodes due to energy depletion.
3.4.2 Wireless Sensor Networks Reliability Open Issues
As summarized in [100], wireless senor networks data delivery reliability has
room for research in the following areas:
• Design and evaluation of new mechanisms for improving reliability taking into
consideration the complex behavior of the wireless channel and the interaction
between the different networking stack layers.
• Ways to adaptively control the mixture of mechanisms used in the network ac-
cording to the current data delivery reliability measurements and the target re-
liability.
• Consideration of timing aspects and the effect of reliability demands on real time
requirements and on the network’s ability to meet deadlines.
Our proposal for this dissertation can be considered as an attempt to address
the wireless sensor networks reliability issues discussed above.
3.5 Summary
This chapter surveyed and classified the research in reliability for wireless sensor
networks. The classification followed the OSI stack model as explained and used in
Chapter 2. In this Chapter, we highlighted that fact that past research in reliability
for wireless sensor networks was in isolation from energy conservation research.
70

Energy-efficient protocols proposed for wireless sensor networks are surveyed
in Chapter 2. In this Chapter, we surveyed the reliable protocols for wireless sensor
networks. Cross-layer energy-efficient protocols and cross-layer reliable protocols pro-
posed in the literature are also covered in the surveys. In the next chapter, we present
our proposed reliable, energy-aware, cross-layer protocol for wireless sensor networks.
71
Chapter 4
RELIABLE, ENERGY-AWARE CROSS-LAYER
PROTOCOL FOR WIRELESS SENSOR NETWORKS
In classical systems reliability research, usually the challenge is finding models
and solutions to the randomness of the component failure problem. In wireless com-
munication systems, the inconsistent nature of the wireless communication channel
adds another unique set of communication reliability challenges. In this research, the
main goal is to raise the level of awareness about the need to consider communication
reliability in wireless sensor network research. It needs to be added as a constraint
to the energy optimization and other efforts. To achieve this goal, we design a reli-
able, energy-aware protocol for wireless sensor networks. The protocol benefits from
the greater optimization levels that cross-layer design provides. This is realized while
making sure to eliminate the problems that cross-layer designs are known to introduce.
In this chapter, we present the proposed protocol in details.
4.1 Classifying Wireless Sensor Networks Research
As discussed in the previous chapters, two focus areas in WSNs research can be
identified. One area is concerned with the problem of optimizing WSNs energy perfor-
mance. This area did not consider reliability as a design constraint or as a performance
72

parameter. The second area is focused on WSNs reliability modeling, analysis and reli-
able protocols design. Research in this area has usually been independent of the energy
conservation issues that characterize these networks. In several cases, the reliability
research in WSNs has been independent of the OSI networking stack.
4.1.1 Wireless Sensor Networks Energy Optimization Research
Wireless sensor networks are known to be application specific. The nature
of message exchange between the nodes and the Base Station is mostly of reporting
sensor readings. In many applications, the sensors are battery-powered and usually
placed in remote, hostile or hazardous areas. Manual service of sensor nodes after
their deployment may not be economically feasible. In some situations, manual service
may not be even possible. For this reason, the node’s lifetime is dependent on the
battery’s lifetime. This places greater challenges and constraints on the network design
thereby requiring the optimization of energy consumption. A new set of protocols and
optimizations has been proposed to address the energy and other challenges in wireless
sensor networks. A comprehensive survey and discussion of these energy optimizations
techniques and protocols have been presented in Chapter 2. Cross-layer optimizations
techniques, benefits and drawbacks have also been discussed there.
4.1.2 Wireless Sensor Networks Reliability Research
The research in reliability for wireless sensor networks is relatively new. There
has been no agreement so far on a unified definition for wireless sensors’ reliability. Each
study has defined reliability differently and in line with their approach. In Chapter 3,
we presented a survey of wireless sensor networks reliability research. There, we tried
73

as much as possible to classify the reliability protocols and algorithms into groups that
are aligned with the OSI network stack.
4.1.3 Bridging the Gap
In this research, we propose a reliable, cross-layer protocol for WSNs. The pro-
tocol benefits from the body of research in the two areas of wireless sensors reliability
research and wireless sensors energy conservation research. The protocol takes advan-
tage of the energy savings techniques while providing a reliable data delivery network.
Figure 4.1 shows an illustration of this proposal’s approach.
4.2 Proposed Protocol Network Settings
The network settings we consider for this protocol are very large, hierarchal,
monitoring and surveillance networks. The network is assumed to be hybrid in its
message generation, managing a combination of proactive and reactive messages. In
addition, we assume that the network is composed of stationary, homogeneous wireless
sensor nodes and one Base Station. The nodes are battery powered and energy effi-
ciency is a critical requirement for the nodes and for the network operations. Nodes
organize themselves in clusters around an elected cluster head (CH) node similar to
LEACH [35]. The Base Station is located far from the rest of the nodes as shown
in Figure 4.2. The Base Station has no restrictions on its energy resources and is
connected to a stable, continuous power supply.
74
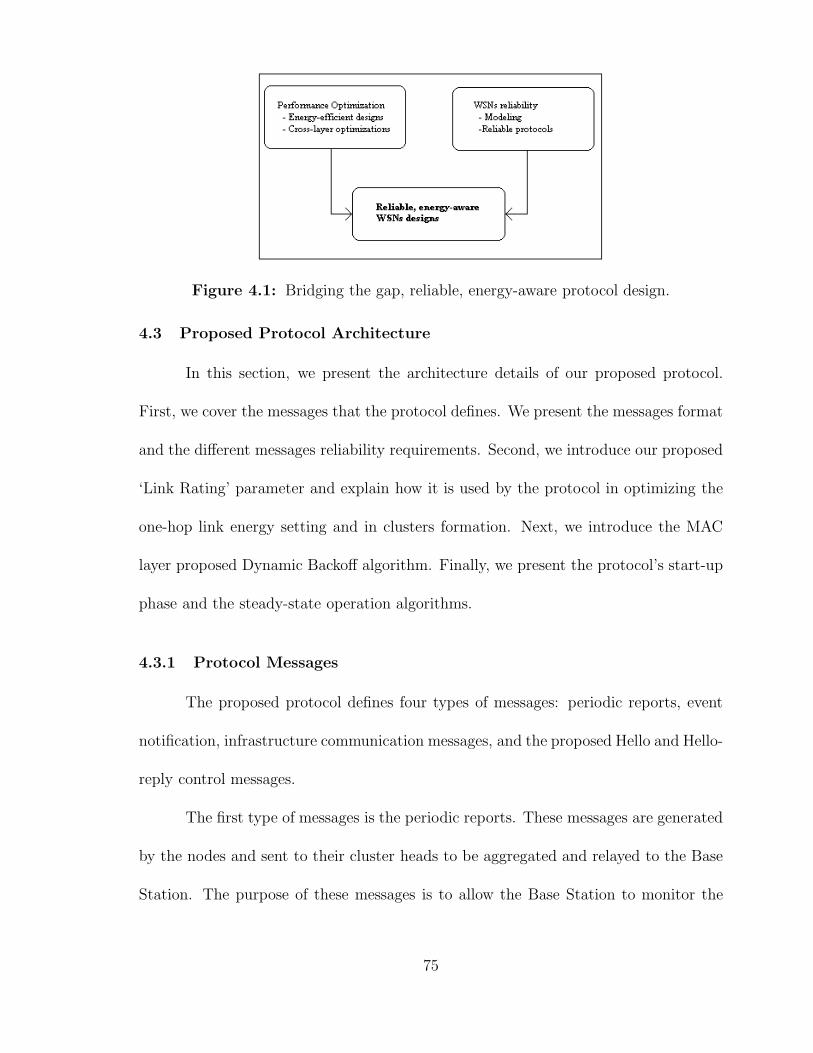
Figure 4.1: Bridging the gap, reliable, energy-aware protocol design.
4.3 Proposed Protocol Architecture
In this section, we present the architecture details of our proposed protocol.
First, we cover the messages that the protocol defines. We present the messages format
and the different messages reliability requirements. Second, we introduce our proposed
‘Link Rating’ parameter and explain how it is used by the protocol in optimizing the
one-hop link energy setting and in clusters formation. Next, we introduce the MAC
layer proposed Dynamic Backoff algorithm. Finally, we present the protocol’s start-up
phase and the steady-state operation algorithms.
4.3.1 Protocol Messages
The proposed protocol defines four types of messages: periodic reports, event
notification, infrastructure communication messages, and the proposed Hello and Hello-
reply control messages.
The first type of messages is the periodic reports. These messages are generated
by the nodes and sent to their cluster heads to be aggregated and relayed to the Base
Station. The purpose of these messages is to allow the Base Station to monitor the
75
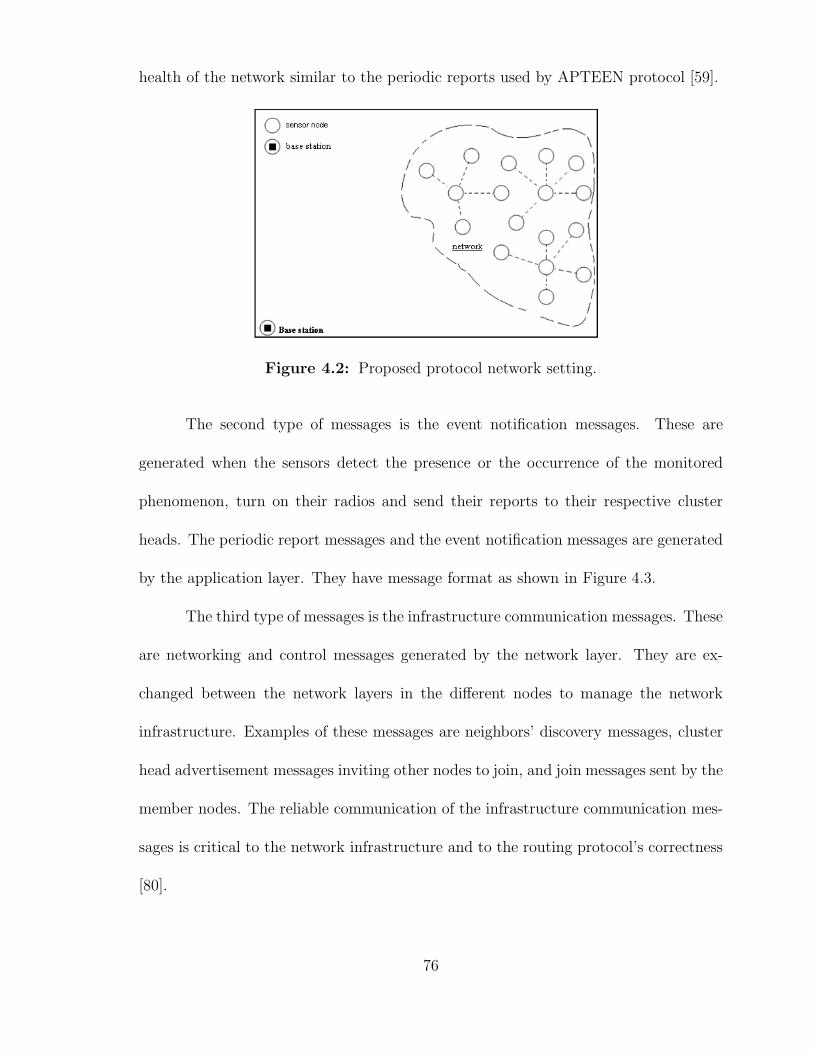
health of the network similar to the periodic reports used by APTEEN protocol [59].
Figure 4.2: Proposed protocol network setting.
The second type of messages is the event notification messages. These are
generated when the sensors detect the presence or the occurrence of the monitored
phenomenon, turn on their radios and send their reports to their respective cluster
heads. The periodic report messages and the event notification messages are generated
by the application layer. They have message format as shown in Figure 4.3.
The third type of messages is the infrastructure communication messages. These
are networking and control messages generated by the network layer. They are ex-
changed between the network layers in the different nodes to manage the network
infrastructure. Examples of these messages are neighbors’ discovery messages, cluster
head advertisement messages inviting other nodes to join, and join messages sent by the
member nodes. The reliable communication of the infrastructure communication mes-
sages is critical to the network infrastructure and to the routing protocol’s correctness
[80].
76

4.3.1.1 Proposed Protocol Messages’ Reliability Settings
The proposed protocol defines three levels of reliability. The highest level of
reliability is assigned to event reporting messages. The justification for this assignment
is that event reporting is the reason for establishing the network in the first place.
Periodic reports have the lowest reliability since they are only needed to show that
the network is alive and functioning. Also, if readings from one reporting period are
not received, there is a chance they will be acquired in the next reporting period. The
infrastructure communication messages will have medium reliability setting in between
the other two message types. The Hello and Hello-reply messages do not have reliability
settings attached to them. These messages are considered as mechanisms used by the
proposed protocol to determine links reliabilities.
Figure 4.3: Application and infrastructure communication message format.
4.3.1.2 Periodic Report Messages
As stated, these messages only serve the purpose of updating the Base Station
about the health of the network. This makes periodic reports the least demanding
in terms of their reliability requirements. At each reporting interval, the application
layer will generate a report message and set the message reliability flag to ‘LOW’. The
different reliability levels and the corresponding reliability flag values (RL) are shown
in Table 4.1.
77

The protocol’s objective for these messages is to optimize energy consumption
at the expense of the reliable delivery of these messages. A report message is created
by the application layer and passed to the network layer and from there to the MAC
layer. When the message is in the routing layer, the message’s reliability flag will be
used to select the corresponding power setting that will be used by the radio layer in
transmitting the message. When the message is at the MAC layer, the reliability flag
will be used to set the parameters of the proposed Dynamic Backoff algorithm. The
actual values assigned to these parameters will be application specific. The proposed
MAC layer Dynamic Backoff algorithm is presented and explained in Section 4.3.3 of
this chapter.
4.3.1.3 Event Reporting Messages
Event detection and reporting is the main mission of the wireless network. Event
notification messages then need to have the highest reliability settings. When an event
is detected, all nodes within the event detection radius will switch on their radios and
send an event notification message to their cluster heads. Once received by the cluster
head, the event message will be immediately relayed to the Base Station. The format
of this message is similar to the periodic reports as shown in Figure 4.3. The reliability
flag field will be set to ‘HIGH’.
Event-to-Sink vs. Source-to-Sink Reliability: As discussed previously in
Chapter 3, the successful detection of an event depends on the Base Station receiv-
ing a notification about the event. This is independent of the number of nodes that
were successful in delivering their event reporting messages to the Base Station. This
78

scenario is known as event-to-sink reliability [28]. It is different from the peer-to-peer
setting where the communication reliability depends on the successful reception of every
message. (The latter scenario is known as source-to-sink reliability.) In the proposed
protocol, the event-to-sink reliability is more applicable for the type of applications
considered for the protocol.
Table 4.1: Reliability level (RL) assignment and value for the three message types.
Message type Reliability requirements RL valueEvent notification HIGH 0Infrastructure messages MEDIUM 1Periodic reports LOW 2
4.3.1.4 Infrastructure Communication Messages
The infrastructure communication messages are control messages originating
from the networking layer. They are needed for setting up and maintaining the network
infrastructure. Examples of these messages are cluster head advertisement messages,
and reply messages from joining nodes. These messages are important for the network’s
infrastructure correctness.
When a node needs to advertise itself as a cluster head or when nodes are
interested in joining a particular cluster head, the network layer will construct and send
out an infrastructure communication message to communicate the interest. The format
of this message is similar to the periodic reports’ format shown in Figure 4.3, with
the reliability flag field set to ‘MEDIUM’. The difference between the infrastructure
communication messages, periodic reports, and event reporting messages is that the
79

infrastructure communication messages originate from the network layer while periodic
reports and event reporting messages are created by the application layer.
The CSMA MAC standard [1] defines and uses some control messages e.g. Re-
quest To Send (RTS), Clear To Send (CTS), Acknowledgment (ACK) and Negative
Acknowledgment (NACK). In the proposed protocol, these messages are not considered
as part of the infrastructure communication messages. They are considered as relia-
bility mechanisms used by the MAC layer to ensure upper layers message reliability.
Therefore, the reliable delivery of these MAC control messages is not considered by the
proposed protocol.
4.3.1.5 Proposed Hello and Hello-reply Messages
Once operational, the nodes will start sending periodic Hello messages to their
one-hop neighbors. This exchange will use different transmission power levels. This
Hello exchange is used for two different algorithms and calculations. First, it is used to
set up individualized link power settings. Second, it is used to calculate the proposed
Link Rating parameter for each of the node’s one-hop neighbors. The format of the
Hello message is shown in Figure 4.4.
The Hello messages will not be forwarded once received by a node. This can
be achieved by the node intelligently examining and identifying the message and not
forward it. Alternatively, this can be achieved by setting the time-to-live (tty) flag to
one in the message before transmitting it. The time-to-live (tty) flag is a standard
networking flag that indicates the number of hops that a message is allowed to traverse
before getting discarded.
80

The Hello-reply messages are unicasted back by the one-hop neighbors to the
Hello message originator. The format of the Hello-reply messages is shown in Figures
4.5. Each node will use this periodic exchange to build statistics for the per link
reliability-to-power ratio. A flowchart for the Hello messages exchange is shown in
Figure 4.6. This exchange between neighbors and the resulting per link reliability to
power ratios are needed for the proposed ‘Link Rating’parameter algorithms.
4.3.2 Proposed Protocol Routing and Clustering Algorithms
As stated earlier, the proposed protocol is a cross-layer design. It has a network
layer routing component, a MAC layer component and a radio component. The MAC
layer proposal, the Dynamic Backoff algorithm will be presented in the next section.
In this section, we present the proposed routing algorithms.
Figure 4.4: Hello message format.
Figure 4.5: Hello-reply message format.
4.3.2.1 Wireless Communication Challenges and Existing Solutions
The work in [25] points out that the link quality varies over time and from
node to node. This argument justifies using individualized link power settings. Several
81

publications have proposed methods for measuring and coping with the variations in
the link quality [95], [47], [25]. These methods were surveyed in Chapter 3.
In [47] the concept of blacklisting was introduced. A link will be classified ‘bad’as
soon as and for as long as its reliability falls below a certain threshold. Nodes maintain
a list of their one-hop links and will relay messages through the ‘good’links only. The
authors in [101] improved on the blacklisting concept and proposed a moving average
link reliability estimator, called Window Mean with Exponentially Weighted Moving
Average (WMEWMA). It is defined as the average success rate over a given link. These
methods attempt to build measures for the one-hop link reliability. Nevertheless, both
methods failed to consider the associated energy consumption. They also rely on the
existence of multiple routes between the source and the destination entities. This
may not be the case in hierarchal architectures typically suggested for wireless sensor
networks.
4.3.2.2 Proposed Individualized Reliable Link Power Settings Using the
Hello Exchange
Energy efficiency is critical to WSNs operations. We aim to rectify the short-
comings of the two methods discussed above by jointly considering energy and link
quality calculations.
The exact values for high, medium, and low reliability requirements are specified
by the application. On each link, nodes will exchange periodic Hello and Hello-reply
messages. The transmission power setting for the Hello messages will be varied in steps.
The initial (maximum) exchange power setting, the power step size, the minimum
82

Figure 4.6: Hello messages exchange flowchart.
exchange power setting, and the number of messages exchanged at each setting are
predefined and programmed in the sensors firmware.
Each node maintains a neighborhood table. An example of this table is shown
in Figure 4.8. Details about the different fields in the neighborhood table and how
they are used in our proposal will be covered in Section 4.3.4 and 4.3.5. For each
neighbor, the link reliability statistics for each power setting will be recorded. This
can be explained mathematically by the following formula:
83

Measured link reliability =number of Hello − reply messages received
number of Hello messages sent(4.1)
In order to obtain a value for the transmission power that will give ‘high’ relia-
bility on a given link, the node selects the record with the minimum power where the
reliability is higher than or equals to the ‘high’reliability value specified by the appli-
cation. The same procedure will be used to obtain the power setting for ‘medium’and
‘low’reliability on the link.
The method used in [95] assumes a fixed power setting and selects the link
that gives the best reliability. On the other hand, our proposed protocol varies the
transmission power and selects the minimum transmission power that meets or exceeds
the required reliability.
Impact of Hello, Hello-reply Overhead: The Hello, Hello-reply messages
exchange introduces non-negligible energy overhead. The energy savings gained maybe
compromised by the energy overhead introduced. Several optimizations can be applied
to reduce this energy overhead. As an example, the Hello exchange can be limited
to a predefined number of messages. The graph in Figure 4.7 was obtained through
simulation. It shows that the required power setting for each of the three reliability
levels was stable after 20 to 30 Hello messages exchanged. This is a clear indication
that any messages exchanged beyond that will not change the power settings and will
only be a waste of valuable energy resources.
Care must be exercised in setting the number of Hello messages per power
setting per link and the power step size. Otherwise, the energy savings gained will be
84

wasted on the overhead introduced by sending these Hello and Hello-reply messages.
The impact of this Hello exchange energy overhead is studied through simulation. This
is presented in details along with results in the performance evaluation chapter.
4.3.2.3 Proposed Link Rating parameter
The Hello messages exchange will be used to obtain link quality statistics, which
in turn will be used for the proposed Link Rating parameter. The Measured link relia-
bility was defined as given in Equation 4.1. The Link Rating is defined as the average
of ratios of the measured link reliabilities for high, medium and low reliabilities to the
power setting needed to achieve those reliabilities. This can be expressed mathemati-
cally as:
LinkRating =
∑ RL
PL
N(4.2)
Where RL is the measured reliability for level L, PL is the power value needed to achieve
level L’s reliability. N is the total number of reliability levels defined.
The Link Rating parameter, as defined in Equation 4.2, can be used for any
number of reliability levels (N). Since our protocol defines three levels of reliability
settings, low, medium, and high, the value of N in our proposed protocol will be three.
Also, since the Hello messages are periodic, this will result in the Link Rating parameter
almost always reflecting the current link quality. The Link Rating parameter will be
used for cluster formation as explained in the next section.
85

4.3.2.4 Clusters Formation Using the Proposed Link Rating Parameter
Similar to most WSNs protocols, the proposed protocol is hierarchal. Nodes
organize themselves in clusters around an elected cluster head (CH) node. Several
WSNs protocols use this hierarchal organization as an energy conservation technique
[35], [52], [58], [59].
The Link Rating parameter was introduced and explained in the previous sec-
tion. It is a local algorithm that every node executes for each of its one-hop neighbors.
The nodes calculate and store a Link Rating value for each of their one-hop neighbors.
At the end of each cluster cycle (or round), new set of nodes elect themselves as clus-
ter heads similar to LEACH election mechanism. The new cluster heads will generate
cluster head advertisement messages that are broadcasted to nodes within their cov-
erage region. When a non-cluster head node receives the cluster head advertisement
messages, the node will join the cluster head with the best Link Rating parameter
value resulting in the optimum reliability to link power setting.
Figure 4.7: Minimum number of Hello messages exchanged.
86

4.3.2.5 Proposed Protocol Energy Optimization Under Reliability Con-
straints
One of the objectives of this work is to couple reliable communication with en-
ergy optimization in wireless sensor networks. The proposed protocol uses the Link
Rating parameter in its cluster head selection algorithm. The individualized link power
settings algorithm was introduced in Section 4.3.2.2. The protocol uses the individual-
ized link power settings from the neighborhood table for the communication between
the nodes and their respective cluster heads. The use of these two techniques is where
our proposed protocol couples the energy conservation requirements with satisfying
reliability constraints.
4.3.3 Proposed MAC Dynamic Back-off Algorithm
The Dynamic Backoff algorithm is the second component of the proposed cross-
layer protocol. The protocol runs on top of CSMA-type MAC layer protocols. Exam-
ples of these protocols are IEEE 802.11 [1] and S-MAC [102].
The message reliability flag will be used to set the MAC back-off timer dynam-
ically using the equation below. The reliability level (RL) values will be set as given in
Table 4.1.
Backofftimer = C ∗ Random(x) + K ∗ (RL) (4.3)
Where Random(x) generate a random number in the range 0 to x, RL is the reliability
level required for the current message, k and C are constants.
87
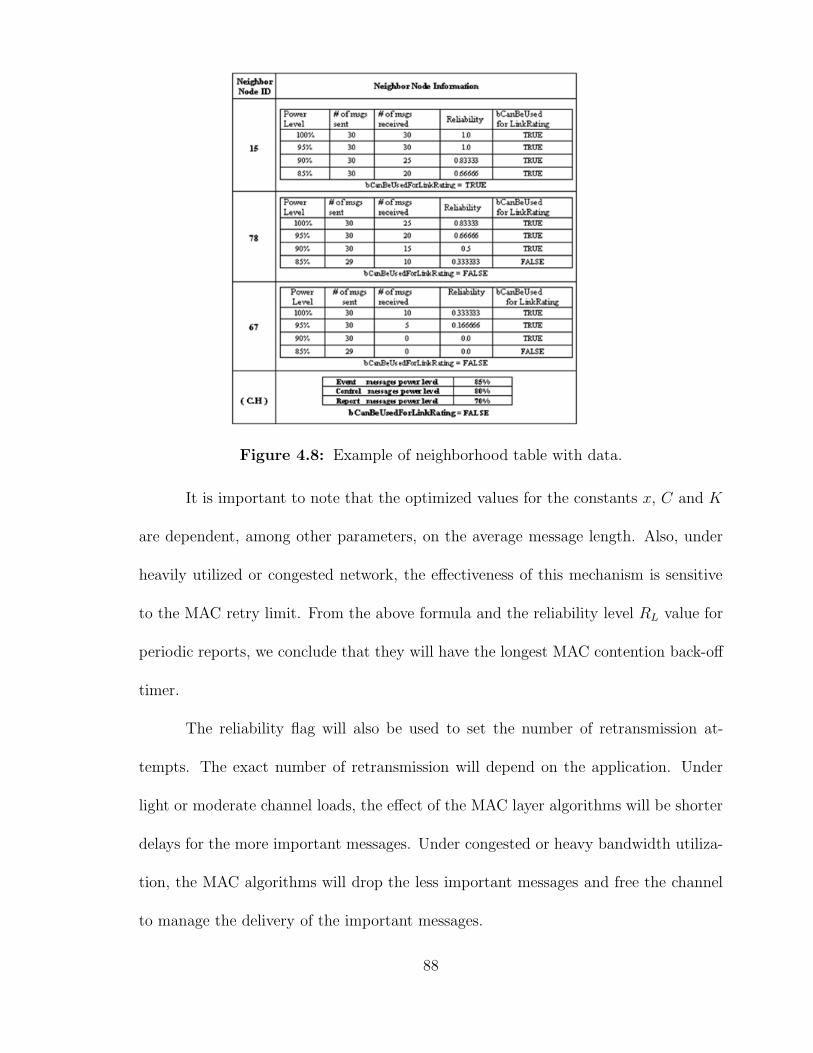
Figure 4.8: Example of neighborhood table with data.
It is important to note that the optimized values for the constants x, C and K
are dependent, among other parameters, on the average message length. Also, under
heavily utilized or congested network, the effectiveness of this mechanism is sensitive
to the MAC retry limit. From the above formula and the reliability level RL value for
periodic reports, we conclude that they will have the longest MAC contention back-off
timer.
The reliability flag will also be used to set the number of retransmission at-
tempts. The exact number of retransmission will depend on the application. Under
light or moderate channel loads, the effect of the MAC layer algorithms will be shorter
delays for the more important messages. Under congested or heavy bandwidth utiliza-
tion, the MAC algorithms will drop the less important messages and free the channel
to manage the delivery of the important messages.
88

The combination of maximum retransmission attempts and short back-off peri-
ods between successive attempts are meant to give event-reporting messages optimal
chance of being received by the Base Station. The impact of these algorithms is studied
through simulation analysis. As results presented in the next chapter will show, the
proposed protocol outperforms APTEEN in the successful delivery of event messages.
4.3.4 Proposed Protocol Startup Phase
When the network has just been deployed or when fresh nodes have been added
to an existing network, there is not enough data about the one-hop links quality for the
protocol to use. In this case, the nodes will start monitoring the radio channel and will
join the cluster head with the strongest signal power. This is similar to basic LEACH
protocol setting. Nodes will communicate with their respective cluster heads using the
minimum power that guarantees network connectivity. The same power setting will be
used for all intra-cluster communication, regardless of the message type. Again, this
is similar to LEACH protocol setting.
The nodes have already been programmed with the networking and other pa-
rameters that they will use. These parameters include the hard and soft threshold
values for the environmental variable that the network is monitoring and the amount
of time between two successive periodic reports similar to APTTEN protocol. The
nodes’ firmware is assumed to be preprogrammed with the frequency of sending the
one hop Hello messages, the number of message types and the reliability required for
each of these types. The nodes have also been programmed with the minimum number
89

of Hello messages needed per link per power level. This is the number of Hello mes-
sages needed before statistics collected about the reliability of the level can be used
by the protocol. While the link statistics are being collected, the protocol will behave
similar to APTEEN. This setting will persist until enough link statistical information
becomes available for the proposed cluster head selection and the individualized link
power setting algorithms to be used. There are many ways to develop algorithms to
ensure that the statistics collected are not used until the minimum exchange conditions
are met. Here, we explain the method we chose to implement.
As illustrated in Figure 4.8, a Boolean field is part of each node’s power level
record, called ‘bCanBeUsedForLinkRating’. The field initial value is FALSE. When the
predefined minimum number of Hello messages exchanged is reached, the value will be
set to TRUE and will not be modified again. Similarly, there is a Boolean field in each
node’s record. The initial value is also FALSE. This value will be set to TRUE when all
the power level records are TRUE. Finally, a Boolean value for the whole neighborhood
table is initially FALSE. The value will be set to TRUE when all the links records are
TRUE. The proposed protocol’s cluster head selection and individualized link power
setting algorithms will be used only when the table’s Boolean variable is TRUE. In the
performance evaluation, we examine the effect of varying the number of Hello messages
per power level on the protocol’s performance.
4.3.5 Protocol Steady-State Operation
When the network has been operational for some time, enough link statistics
will become available. Neighbors’ information stored can be used as indicated by a
90

TRUE value in the neighborhood table’s Boolean variable. Once the next cluster head
selection round starts, cluster head selection will be based on Link Rating performance.
The steady state operations are illustrated by the flow chart in Figure 4.9. The com-
munication with the cluster head will use the link power values corresponding to the
message’s reliability requirements. These values are available from the record associ-
ated with the cluster head in the node’s neighborhood table. The sooner these settings
can be used, the better the energy performance that can be obtained. On the other
hand, if the values are used too soon, they may not be the best optimal values. In the
next chapter, we present an investigation into these performance tradeoffs.
4.4 Summary of Contributions
The contributions of this work can be summarized in the following:
• A reliable, energy-aware cross-layer protocol that benefits from the body of re-
search in the wireless sensor networks reliability and wireless sensor networks
energy conservation areas. The protocol optimizes energy consumption while
providing a reliable data delivery network.
• The proposed protocol classifies the network messages based on their type. We
outline a cross layer setting in which each message carries its own reliability
requirements. In the selected network setting, three message types were proposed:
event reporting, periodic reports, and infrastructure communication messages. A
different level of importance and reliability requirements is then attached to each
message type.
91
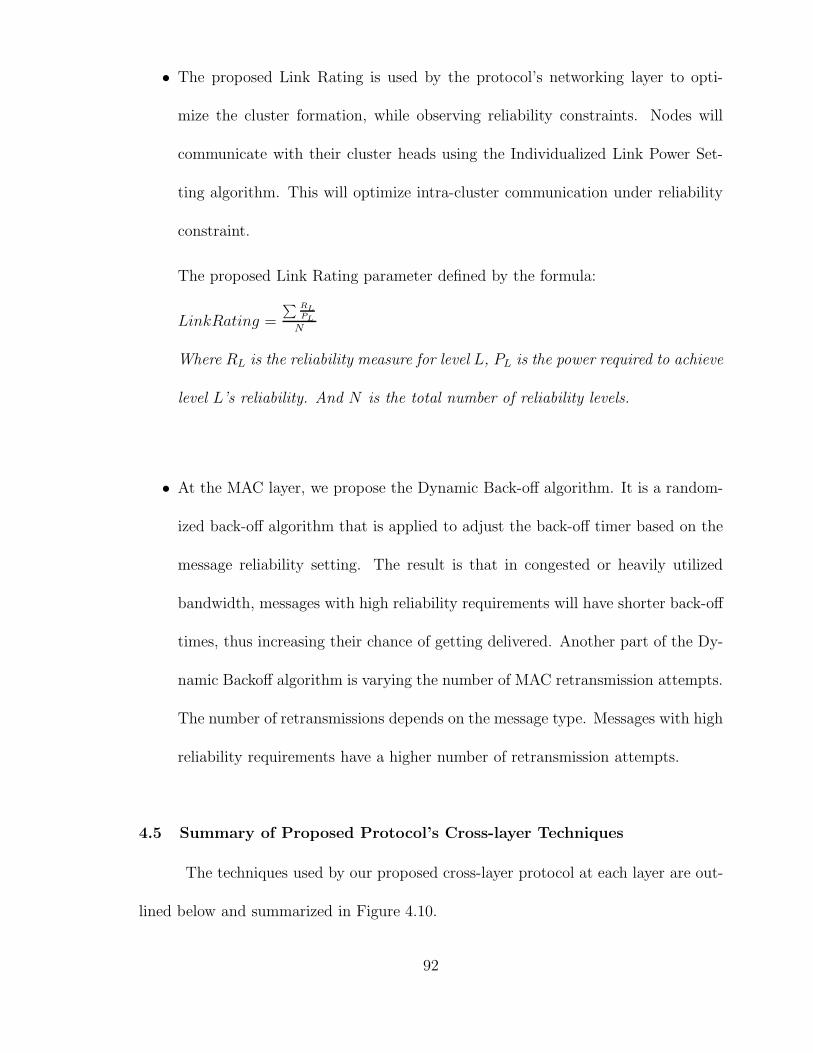
• The proposed Link Rating is used by the protocol’s networking layer to opti-
mize the cluster formation, while observing reliability constraints. Nodes will
communicate with their cluster heads using the Individualized Link Power Set-
ting algorithm. This will optimize intra-cluster communication under reliability
constraint.
The proposed Link Rating parameter defined by the formula:
LinkRating =
∑ RLPL
N
Where RL is the reliability measure for level L, PL is the power required to achieve
level L’s reliability. And N is the total number of reliability levels.
• At the MAC layer, we propose the Dynamic Back-off algorithm. It is a random-
ized back-off algorithm that is applied to adjust the back-off timer based on the
message reliability setting. The result is that in congested or heavily utilized
bandwidth, messages with high reliability requirements will have shorter back-off
times, thus increasing their chance of getting delivered. Another part of the Dy-
namic Backoff algorithm is varying the number of MAC retransmission attempts.
The number of retransmissions depends on the message type. Messages with high
reliability requirements have a higher number of retransmission attempts.
4.5 Summary of Proposed Protocol’s Cross-layer Techniques
The techniques used by our proposed cross-layer protocol at each layer are out-
lined below and summarized in Figure 4.10.
92
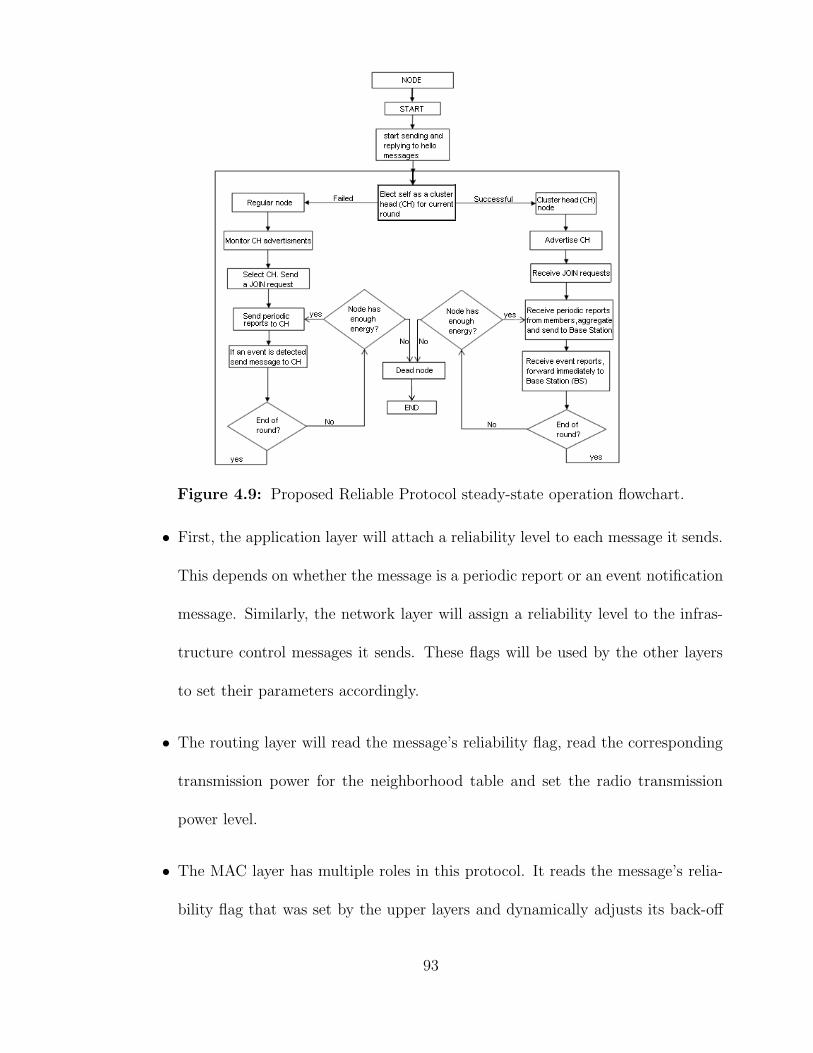
Figure 4.9: Proposed Reliable Protocol steady-state operation flowchart.
• First, the application layer will attach a reliability level to each message it sends.
This depends on whether the message is a periodic report or an event notification
message. Similarly, the network layer will assign a reliability level to the infras-
tructure control messages it sends. These flags will be used by the other layers
to set their parameters accordingly.
• The routing layer will read the message’s reliability flag, read the corresponding
transmission power for the neighborhood table and set the radio transmission
power level.
• The MAC layer has multiple roles in this protocol. It reads the message’s relia-
bility flag that was set by the upper layers and dynamically adjusts its back-off
93

Figure 4.10: Proposed protocol Cross-layer techniques.
timer. Messages with high reliability requirements have a shorter back-off, hence,
a better chance of getting through. This is also coupled with higher retransmis-
sion limits for messages with higher reliability requirements.
• The radio will use the transmission power that was set by the routing layer.
4.6 Related Protocols
In this section, we present a comparison between the proposed protocol and the
other similar protocols for wireless sensor networks.
94

4.6.1 LEACH
LEACH [35] is a hierarchical protocol proposed for WSNs with large number
of homogeneous, resource-constrained nodes monitoring the environment. Nodes are
periodically sending their readings to a base station located far away from the field.
The protocol achieves its power saving goals by allowing a small percentage of the
nodes, called cluster heads, to collect data from their surrounding neighbors, aggregate
that data and send a report to the Base Station representing the combined readings.
The protocol avoids depleting the cluster heads energies by selecting a new set of cluster
heads at the beginning of each round. The protocol uses a randomized routine for each
node to elect itself as a cluster head. This routine is run locally by each node, to avoid
the traffic overhead of a centralized routine. Simulation results show that LEACH
can increase the network lifetime by as much as a factor of eight compared to direct
transmission.
Our proposed protocol is similar to LEACH in being hierarchical and has pe-
riodic reports sent to the Base Station. But unlike LEACH, our proposed protocol
observes reliability constraints, cross-layer design and in addition to the periodic re-
ports, sends event notification messages.
4.6.2 TEEN/APTEEN
Similar to LEACH, TEEN [58] is also a hierarchical protocol. The protocol
defines and uses two parameters, a hard threshold and a soft threshold values. The
sensors are assumed to monitor the environment continuously. If the value of the sensed
parameter reached or exceeded the hard threshold value, the nodes will turn on their
95

transmitters and send event notification reports to their cluster heads. To prevent the
nodes from flooding the network with reports once the hard threshold is reached, the
nodes will send a new report only if the value of the sensed parameter exceeds the last
reported value by an amount equals to at least the soft threshold value. As already
stated in [58], the main drawback of this protocol is that if the threshold value is never
reached, the user will get no reports at all and will not be aware if all the nodes in the
network are dead. This limitation of the TEEN protocol was removed by introducing
a hybrid version of the protocol, the APTEEN protocol [59]. APTEEN defines a new
Count Time (CT ) parameter that is also under the user’s control. The count time is
defined as the maximum time between two successive reports.
Our proposed protocol shares the event-driven reporting mechanism introduced
in TEEN and APTEEN. It has the same hybrid reporting feature that APTEEN
uses. The differences between our proposed protocol and TEEN/APTEEN are that
our protocol takes advantage of cross-layer energy optimization techniques. It also
considers reliability as a design constraint.
4.6.3 ESRT Protocol
Event-To-Sink Transport (ESRT) is a reliable transport protocol proposed for
wireless sensor networks. It is a centralized protocol that runs only on the sink and thus
leveraging its abundance of computing and power resources and relieving the resource
constrained nodes. In ESRT, congestion control is identified as an important factor
for reliable data flow since packet loss due to congestion can impair event detection at
the sink. The reliability requirements are determined by the application layer. The
96
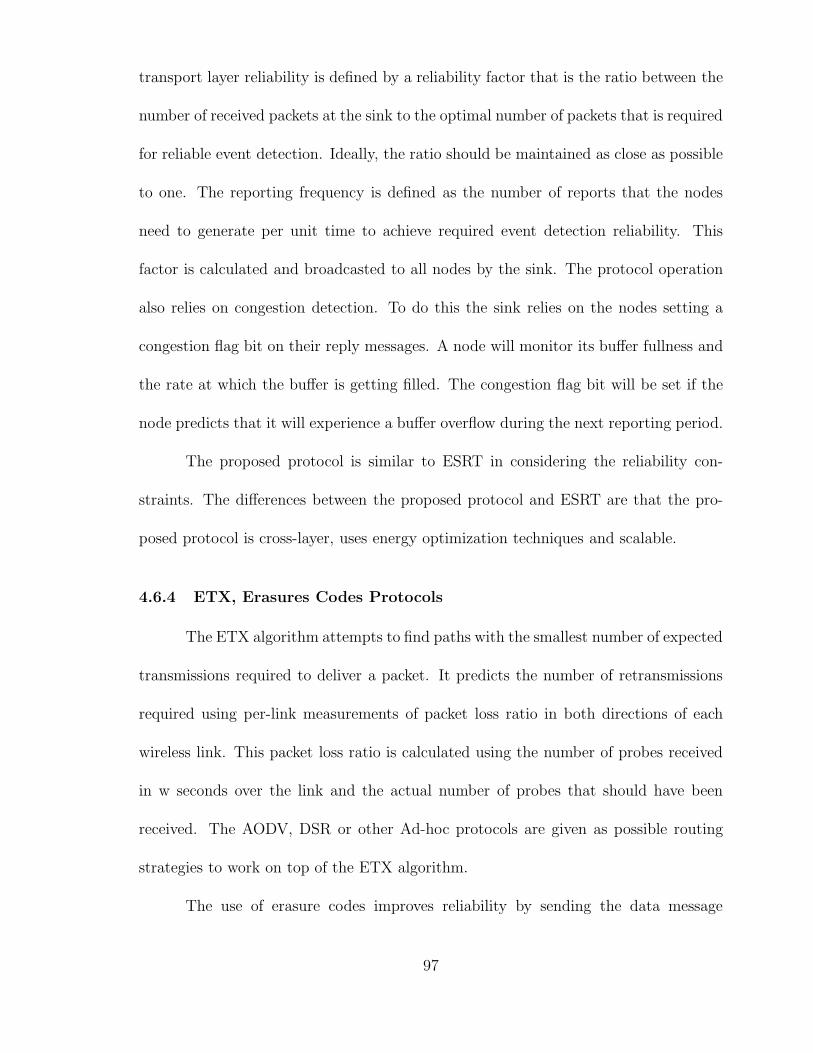
transport layer reliability is defined by a reliability factor that is the ratio between the
number of received packets at the sink to the optimal number of packets that is required
for reliable event detection. Ideally, the ratio should be maintained as close as possible
to one. The reporting frequency is defined as the number of reports that the nodes
need to generate per unit time to achieve required event detection reliability. This
factor is calculated and broadcasted to all nodes by the sink. The protocol operation
also relies on congestion detection. To do this the sink relies on the nodes setting a
congestion flag bit on their reply messages. A node will monitor its buffer fullness and
the rate at which the buffer is getting filled. The congestion flag bit will be set if the
node predicts that it will experience a buffer overflow during the next reporting period.
The proposed protocol is similar to ESRT in considering the reliability con-
straints. The differences between the proposed protocol and ESRT are that the pro-
posed protocol is cross-layer, uses energy optimization techniques and scalable.
4.6.4 ETX, Erasures Codes Protocols
The ETX algorithm attempts to find paths with the smallest number of expected
transmissions required to deliver a packet. It predicts the number of retransmissions
required using per-link measurements of packet loss ratio in both directions of each
wireless link. This packet loss ratio is calculated using the number of probes received
in w seconds over the link and the actual number of probes that should have been
received. The AODV, DSR or other Ad-hoc protocols are given as possible routing
strategies to work on top of the ETX algorithm.
The use of erasure codes improves reliability by sending the data message
97

through multiple paths. The algorithm tries to find k disjoint paths between source
and destination and adding redundancy to each packet so that only E (E < k) packets
need to reach the destination for the original message to be constructed.
The proposed protocol shares similarities with the ETX and Erasure codes pro-
tocols. They all observe reliability as a performance constraint. The differences be-
tween the proposed protocol, ETX and Erasure codes are that the proposed protocol
is cross-layer, uses energy optimization techniques, scalable and hierarchical.
4.6.5 Cross-layer Protocols
Cross layer design is defined as the interaction between the different stack layers
and the sharing of information with the goal of improving the overall system perfor-
mance. It has been used in the ad hoc wireless systems to improve throughput, latency,
and quality of service (QoS). Due to the severe energy constraints that are common
to wireless sensor networks operations, several publications have proposed cross-layer
design as an optimization technique [87], [73], [50], [68], [57], [96], [98], [53], [28], [104],
[82].
4.6.5.1 Benefits of Cross-layer Designs
As previously discussed in Chapter 2, Examples of the benefits of cross-layer
designs for wireless sensor networks are:
• The stringent energy, storage and processing capabilities of the sensor nodes
necessitates such approach
98

• There is a significant overhead associated with the layered protocols resulting in
high inefficiency
• Some recent empirical studies necessitate that the properties of low power ra-
dio transceivers, which is common to wireless sensors, and the wireless channel
characteristics be considered in protocol design
• The event-centric nature of wireless sensor networks requires application-aware
communication protocols.
4.6.5.2 Drawbacks of Cross-layer Designs
The cross-layer design performance improvements gained come at a price. This
includes decreased architecture modularity, and loss of the decoupling between design
and development. Cross-layer designs may also be hard to debug, maintain or upgrade.
The interdependencies introduced need to be carefully considered and evaluated to
avoid the non-trivial problem of system’s instability.
4.6.5.3 Avoiding Cross-layer Drawbacks in Proposed Protocol
Our proposed protocol uses cross-layer design as a performance and energy
optimization technique. The protocol avoids introducing layer interdependencies by
preserving the stack architecture and optimizes the overall system energy performance
by information sharing. The information is embedded as flags in the data and control
messages that are moving through the stack. Each layer reads these flags and adjusts
its performance and handling of the message accordingly.
99

The similarities and differences between our proposed protocol and the other
exiting protocols are summarized in Table 4.2.
Table 4.2: Comparison between proposed protocol and other well-known WSNs pro-tocols.
Protocol Reliable Scalable Cross- Hierar- Event- Periodiclayer chal driven reports
LEACH [35] X X No XTEEN [58] X X Source-to-sink
APTEEN [59] X X Source-to-sink XESRT [75] X Event-to-sink
ETX,[35] X NoErasure Codes[12]Proposed X X X X Event-to-sink Xprotocol
4.7 Summary
This chapter presented the network architecture and cross-layer algorithms of
the proposed protocol. The proposal suggests classifying messages based on their relia-
bility demands. The protocol introduces reliability as a constraint in reaching minimum
communication power levels. The proposed Link Rating parameter is presented in this
chapter. It is defined as the sum of ratios of link reliabilities to the power needed
to achieve those reliabilities. Nodes store a Link Rating value for each of their one-
hop neighbors and will join the cluster head nodes with the best Link Rating values.
The result is reliable communication with the least power expenditure. In addition,
the communication power level used is dependent on the message’s reliability require-
ments. The emphasis here is on using the least radio power that meets or exceeds the
100

reliability requirements. The proposed protocol forgoes achieving the highest reliability
levels attainable, in exchange for saving valuable energy resources.
The protocol also introduces a MAC layer component, the Dynamic Backoff
algorithm. The techniques introduced at the MAC layer are meant to boost the delivery
chance of the more important messages at the expense of the less important ones.
Minimum Communication Power: In Hierarchical wireless sensor networks protocols
design, it has been common to assume that nodes will communicate using minimum
power. This assumption has not been studied or qualified in the literature. This work
identified reliable communication as a constraint for this minimum communication
power assumption. The algorithms proposed in this work can be used as mechanisms
to find solutions that satisfy these conditions of minimum communication power.
The performance of this proposal is validated through simulation. Results and
analysis of the simulation experiments are presented in the next chapter.
101

Chapter 5
RELIABLE, ENERGY-AWARE PROTOCOL
PERFORMANCE EVALUATION
In this research, the objective is to design a reliable, energy-aware protocol for
wireless sensor networks. The protocol benefits from the greater optimization levels
that cross-layer design provides. This is done while making sure to eliminate the
problems that cross-layer designs are known to introduce. In the previous chapter,
the proposed protocol was presented in detail. This chapter covers the simulation
experiments and performance evaluation of the proposed protocol.
5.1 Proposed Protocol Performance Evaluation Method
Performance measurements in WSNs can be carried out using mathematical
modeling or simulation [80], [56].
WSN performance analysis is complex due to a number of factors. These include
the sheer number of nodes in the system, dynamic topology, network stack layers inter-
action, and power considerations and constraints. Simplifications to the mathematical
model are unavoidable otherwise it will be unsolvable. This in turn will affect the cor-
rectness of the results obtained. Simulation modeling, on the other hand, allows for the
complex networking details and interaction to be captured. In this view, a simulation
102

model can be as detailed and descriptive as we need it to be. This will be reflected on
the value and exactness of the results obtained. Due to the factors outlined, simulation
analysis is selected for the proposed protocol’s performance evaluation.
5.2 Performance Evaluation Tools
For the performance evaluation of the proposed protocol, simulation modeling
is used. Simulation is utilized to measure the impact of the proposed protocol and the
performance improvements achieved. In this section, we present our investigation into
finding a suitable simulation tool.
5.2.1 Tool Selection Criteria
Wireless sensor networks are very large networks. The number of deployed sen-
sors in a single network can range from hundreds of thousands to few millions. These
sensors are battery powered, often deployed in harsh and difficult to reach locations.
Serviceability of the nodes is impossible or at least not cost-effective. This discus-
sion shows that scalability and energy calculation are the main factors to use when
evaluating a simulation tool for wireless sensor networks.
5.2.2 Simulation Tools Survey
Several candidate tools were surveyed and evaluated for use in our proposed
protocol’s performance evaluation. Below is a summary description of the surveyed
tools.
103

5.2.2.1 Opnet
Opnet [16] is a commercial networking simulation tool. It is used by private
users, network designers and architects to predict the feasibility of any deployable
network. The tool is built on the underlying process model that works on finite-state
machine architecture. Opnet provides a large library of components such as routers
and processing stack protocols. The tool is free for academic users. However, it offers
only limited support for expressing and integrating novel ideas. Opnet scales only to
a few hundred nodes, and has no support for energy calculation. The tool is not open
source and design modifications to the stack layer architecture are not possible.
5.2.2.2 GloMoSim
GloMoSim [63] is written in Parsec (a C language extension) for parallel simu-
lation of wireless networks. It is designed using the parallel discrete-event simulation
capability provided by Parsec language. GloMoSim supports protocols for pure wire-
less networks. Communication protocol stack is divided into a set of layers, each with
its own application-programming interface (API). Models of protocols at one layer in-
teract with the other layers through these APIs. However, the tool is still currently
under development. It is expected to include hierarchal routing protocols to support
scalable network routing in the future. Its developers anticipate adding functionality to
simulate a wired as well as a hybrid network with both wired and wireless capabilities.
The tool scales to a few hundred nodes.
104

5.2.2.3 NS-2
NS-2 [61] is a discrete event simulator targeted at networking research. This is
one of the first simulation packages developed as educational and research software. It
is designed to study the network dynamics of TCP/IP network systems. NS-2 provides
substantial support for simulation of TCP, routing, and multicast protocols over wired
and wireless (local and satellite) networks. Many versions of NS-2 are now available.
It is currently being extended to parallel implementation to achieve scalability. Similar
to GloMoSim, the network order for NS-2 is in the hundreds of nodes.
5.2.2.4 PDNS
Parallel/Distributed NS [56]. This is a collection of Extensions and enhance-
ments to the NS-2 simulator. It allows a network simulation to be run in a parallel
and distributed fashion on a network of workstations. To achieve scalability, PDNS
has high hardware demands. The current version of PDNS has been tested on as many
as 136 processors simulating a 600,000+ nodes network topology.
5.2.2.5 JiST/SWANS
The JiST/SWANS [9], [10] is a highly scalable wireless network simulator with
reported results for a million node network. JiST [9] is a high-performance discrete
event simulation engine that runs over a standard Java virtual machine. It is a pro-
totype of a new general-purpose approach to building discrete event simulators, called
virtual machine-based simulation. The simulation platform is very memory efficient.
105

SWANS (Scalable Wireless Ad hoc Network Simulator) [10] is built on top of JiST
platform.
Table 5.1 is comparison and summary of the surveyed tools (excluding the
JiST/SWANS). Table 5.2 compares some JiST/SWANS time and memory space re-
sults running simulations of a beaconing node discovery protocol [9] against NS-2 and
GloMoSim simulators.
Table 5.1: Summary of surveyed tools (excluding JiST/SWANS) [105].
Attribute OPnet NS-2 Pdns GLoMoSimCommercially Network systems Network systems Library-based
Focus deployed user- under research under research parallel simulator
network systems study study for Ad-hoc NW
Object orientation C/C++ C++ C++ Extension to C
Memory (Unknown) Dynamic Dynamic Tightly coupled,
management allocation allocation shared & distributed
Simulation Packet-level Packet-level Packet-level Packet-level
resolution
Scale of Operation Few Hundred Few Hundred Few Thousand Few Thousand
(number of nodes)
Intended audience Private users, Network research, Network research Network research
Network designers protocol designers
5.2.3 JiST/SWANS Wireless Ad-hoc Network Simulator
The tool selected for our work is the JiST/SWANS wireless network simulator
[9],[10] because of its scalability. JiST (Java in Simulation Time) [9] is comprised of
four components: A compiler, a byte code rewriter, a simulation kernel and a vir-
tual machine. The simulation programs are written in plain Java. SWANS (Scalable
Wireless Ad hoc Network Simulator) [10] is built on top of the JiST platform. The
SWANS software is designed as separate independent software modules, which could be
106

combined to form one wireless network. The SWANS architecture is shown in Figure
5.1. Every SWANS component is encapsulated as a JiST entity, i.e. it stores its own
local state and interacts with other components via interfaces. Each SWANS wireless
device (node) is an entity. The entities within the node are the OSI stack application,
transport, network, routing, MAC, and physical layers. There are also mobility and
routing entities within the node component.
Table 5.2: Comparison between JiST/SWANS, GloMoSim and NS-2 memory andexecution time performance. Reproduced from [10].
Number Performance JiST/SWANS GLoMoSim NS-2of nodes parameter
Execution time 43 s 82 s 7136 s500Memory 1,101 KB 5,759 KB 5,8761 KB
Execution time 430 s 6191 s –5,000Memory 5,284 KB 27,570 KB –
Execution time 4377 s – –50,000Memory 49,262 KB – –
Execution time – – –1000,000Memory 933 MB – –
Figure 5.1: SWANS system architecture with energy model added. Reproduced from[10].
107

5.2.3.1 Upgrading JiST/SWANS to a Wireless Sensor Networks Simulator
The JiST/SWANS is a highly scalable ad-hoc wireless network simulator with
reported results for a million nodes network. However, the tool lacked many com-
ponents needed for wireless sensor networks simulation. In previous work, an energy
model and the S-MAC protocol for JiST/SWANS has been developed [89],[90]. Also,
the radio component has been upgraded to include several radio signal fading and path
loss models. This is discussed further in Section 5.4.5. The network layer has also been
upgraded with the ability to select between the default, no packet drop queue, and
a new queue model that drops packets after a certain number of packets are queued
(buffered). The number of packets the network layer can hold is under the user’s con-
trol. A predefined default setting will be activated, if the user does not set the node’s
buffer queue size.
Event creation and event detection is important to simulating wireless sensor
networks monitoring the physical environment. The ability to simulate physical event
taking place in the environment, and the nodes being equipped to sense the occurrence
of these event was not available. To solve this tool limitation, an architectural mod-
ification was implemented to add these capabilities to the JiST/SWANS. Figure 5.2
shows the new sensor, event and radio fading components that were added to transform
the tool to a wireless sensor network simulator.
The JiST/SWANS had a MAC layer implementation of the CSAM protocol
IEEE 802.11 [1] that was incomplete. A working CSMA protocol is needed for the im-
plementation and performance evaluation of the proposed MAC Dynamic Backoff algo-
rithms. Through several efforts, the JiST/SWANS IEEE 802.11 MAC implementation
108
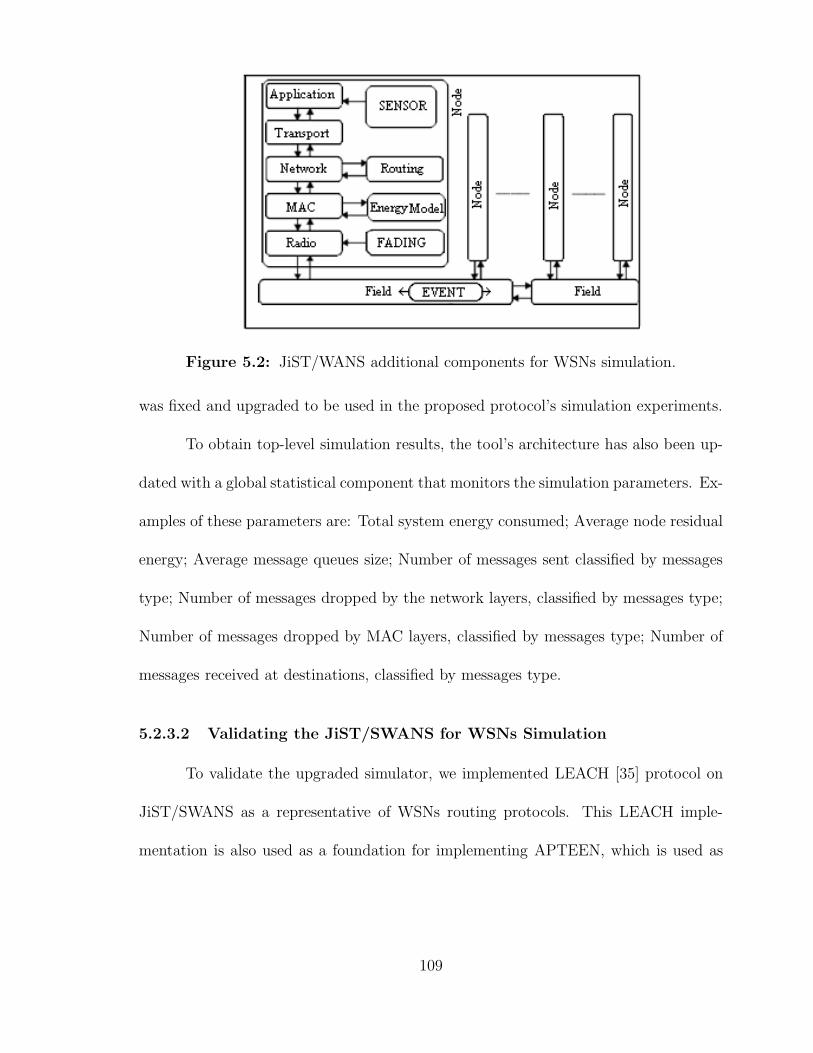
Figure 5.2: JiST/WANS additional components for WSNs simulation.
was fixed and upgraded to be used in the proposed protocol’s simulation experiments.
To obtain top-level simulation results, the tool’s architecture has also been up-
dated with a global statistical component that monitors the simulation parameters. Ex-
amples of these parameters are: Total system energy consumed; Average node residual
energy; Average message queues size; Number of messages sent classified by messages
type; Number of messages dropped by the network layers, classified by messages type;
Number of messages dropped by MAC layers, classified by messages type; Number of
messages received at destinations, classified by messages type.
5.2.3.2 Validating the JiST/SWANS for WSNs Simulation
To validate the upgraded simulator, we implemented LEACH [35] protocol on
JiST/SWANS as a representative of WSNs routing protocols. This LEACH imple-
mentation is also used as a foundation for implementing APTEEN, which is used as
109

the reference protocol in the performance evaluation. LEACH energy performance re-
sults obtained using JiST/SWANs were in close agreement with the protocol published
Matlab results.
5.3 Proposed Protocol Evaluation Scenarios
In this section, we present the simulation scenarios used to validate, and to
evaluate the performance of the proposed protocol. The reference protocol used in
the evaluation is APTEEN. Each message the proposed protocol generates will have
a field indicating its reliability level. This field will be set by the application layer
for messages created by the application, or by the network layer, for network control
messages originating from the network layer. Details of the proposed protocol messages
were given in Chapter 4, Section 4.3.1.
At every node in the network, the application layer will be sending periodic
reports. From the discussion in the previous chapter, these reports will have the least
reliability demands. Their reliability flag will indicate low reliability setting. Events
are assigned an event radius as discussed in [71]. Events are generated with some
predefined probability at random geographical locations. All nodes with coordinates
within the event radius, upon detecting the event, will send an event message reporting
the occurrence of the event. This type of messages has high reliability requirements.
The routing control messages, generated by the network layer, will have a medium
reliability setting. These messages are cluster head advertisement messages and the
join messages sent by new cluster members.
110

5.3.1 Routing and Cluster Head Selection Evaluation Scenarios
In the initial cluster head selection phase, and since the nodes have no informa-
tion about the link qualities for their one hop neighbors, the cluster head selection will
follow the random election algorithm similar to the one used by LEACH and APTEEN
protocols. Once the network is operational, nodes will start building statistics about
their one hop links using periodic ‘Hello’ messages and monitoring the signal levels.
This will be used for the calculation of link ratings that will influence the joining of
future cluster heads. A node will elect to join the cluster head that has the best av-
erage of link rating ratios. The link statistics will also be used to set the transmission
powers used to communicate with the cluster head. A member node will have three
transmission power settings, one for each of the message types.
For the routing layer, a comparison will be conducted between cluster-head
selection (CH) based on our proposed link rating scheme against the random APTEEN
selection criteria. This comparison will also include individualized link power setting
against APTEEN unified minimum intra-cluster transmission power. The performance
parameters measured here will be power consumption and reliability.
5.3.2 MAC layer Evaluation Scenarios
The performance of our protocol at the MAC layer will be tested against APTEEN
that uses SMAC protocol. In this setting, the APTEEN MAC layer has a pre-set re-
transmission limit that applies to all messages regardless of their type. The back-off
timer is also fixed and independent of the message type. For the proposed protocol,
111

the MAC layer will have different retransmission limits based on the message reliabil-
ity settings. Messages with high reliability requirements will have higher retry limits.
To be able to test the effectiveness of our proposed MAC layer algorithm, the data-
reporting rate will have to be set to a level that creates a heavily utilized or congested
network conditions. A congested network can be detected when intermediate nodes
start dropping packets because of full buffers.
The first set of experiments will test the effect of setting the retransmit limits
to values according to the following condition:
i < j < k (5.1)
Where i is report messages retry limit, j is control messages retry limit, and k is event
messages retry limit. The parameters i, j and k are integers.
The retransmit limit for the reference scenario will be set to be equivalent to
medium reliability messages. This way, report messages are given below average trans-
mission buffer lifetime and event messages are given better than average lifetime. The
performance parameters are energy consumption, average message latency for each of
the message types, and the reliability of data delivery for each of the message types.
For the periodic reports and the network control messages, the reliability of the mes-
sages will be calculated as the ratio of the number of messages sent to the number of
messages received. For event detection messages, the reliability will be calculated as
the ratio of the number of events detected by nodes to the number of events received
112

by the Base Station. This set of experiments will be repeated to test the above perfor-
mance in heavily congested network settings. The goal here is to obtain performance
results for the reliability of event reporting under unfavorable network conditions.
In the second set of experiments, the performance of varying the back-off timers
on reliability will be tested. This will be tested in isolation from the effect of the other
proposed elements. Here again the reference test case is a MAC protocol with a single
back-off timer that has a random duration equivalent to messages of medium reliability
requirements. The dynamic back-off timer has two components as shown below:
Backofftimer = C ∗ Random(x) + K ∗ (RL) (5.2)
Where Random(x) generate a random number in the range 0 to x, RL is the reliability
level required for the current message, k and C are constants.
The performance parameters for these experiments will be average message delay
for each of the three message types, power consumption, and data delivery reliability
for each of the message types.
5.3.3 Radio and Physical Layers Evaluation Scenarios
The radio and physical layer are not evaluated separately. Their evaluation
is part of the routing layer evaluation scenario. The radio for the reference scenario
will have constant radio power setting. This will be compared against the proposed
protocol radio component that sets the transmission power according to the message’s
113

power setting specified by the routing layer. The evaluation parameters used are power
consumption and event reporting reliability.
5.3.4 Optimizing the Hello Messages Exchange
As previously stated in Chapter 4, the Hello messages exchange introduces a
non-negligible energy overhead. This overhead may reduce or cancel the energy savings
gained by the Link Rating and the Individualized Link Power Setting algorithms. Below
are the techniques added to the Hello messages exchange algorithm to minimize the
impact of the energy overhead:
Limiting the Number of Hello Messages: Through exhaustive and ex-
tensive simulation experiments, graphs similar to the one shown in Figure 5.3 were
obtained. The graph shows the minimum link power that will result in a commu-
nication that meets the required reliabilities. These values for the reliabilities were
set to 90% for event reporting, 80% for control messages and 70% for periodic report
messages. The graph shows that the power percentages for the three message types
were stable after 20 rounds. In the worst case, the power was stable after 30 rounds.
Any Hello exchange beyond that will not change the power setting values and will only
waste energy and bandwidth resources. Limiting the Hello exchange to a number in
the 20 to 30 messages range will save energy while fulfilling its mission.
Multicasting Instead of Unicasting the Hello Messages: Considerable
energy savings can also be obtained by limiting the number of Hello messages nodes
send in each round. This optimization is achieved by multicasting the Hello and the
Hello-reply messages. Each node will send a single Hello message that contains a list of
114

intended recipients. Upon receiving a Hello message, a node will add the sender to its
reply list. After receiving Hello messages from its neighbors, a node will send a single
reply message containing a list of the intended recipients and the relevant information
for each recipient.
Dynamic Minimum Exchange Power Settings: The Hello messages will be
exchanged at different power levels. At the beginning, the messages will be sent at the
initial maximum power setting. After the predefined number of messages for the power
level are sent, the exchange power will be reduced by an amount equals to a predefined
step size. At each level, once the targeted number of messages is reached, the power
will be reduced, until the minimum power level is reached. In some situations, the link
connectivity can be superior. The minimum exchange power can give high reliability
levels. This may be due to the nodes close proximity to its cluster head. Such situation
provides a chance for extra energy savings. The minimum setting can be readjusted. If
for a given link the report messages power setting happens to be equal to the minimum
power level setting, This raises the possibility that a power level below the minimum
level may also produce a satisfactory performance. A new lower minimum power level
setting is selected from a predefined minimum power levels list. This list is stored as
part of the node’s firmware. A new Hello messages exchange will be triggered to test
the reliability performance of the power levels all the way down to the new minimum.
It is important to point out that this new Hello exchange will be triggered only if
the report messages power setting happens to be equal to the minimum setting. This
condition is required in order to avoid unnecessary and meaningless Hello exchange.
Several minimum power settings can be defined up to an absolute minimum. Figure
115

5.3.4 shows an example of such settings. Figure 5.5 is a flowchart for the optimized
Hello messages exchange algorithm. It summarizes the optimizations added to the
Hello messages exchange algorithms. These algorithms were discussed in Chapter 4,
Section 4.3.2.2.
Figure 5.3: Optimized Hello messages exchange.
Transmit power levels setting Percentage of inter-clustertransmit power
maximum power level setting 100%1st minimum power level setting 65%2nd minimum power level setting 45%3rd minimum power level setting 20%... ...absolute minimum power level setting 5%
Figure 5.4: Hello messages optimization, Variable minimum link power setting.
5.4 Radio Model for Simulation
Wireless communication link quality is dependent on the radio signal propa-
gation. Link reliability is a measure of the link quality. Modeling the wireless radio
channel is a challenging task [85]. Several factors affect the link quality, some of which
116
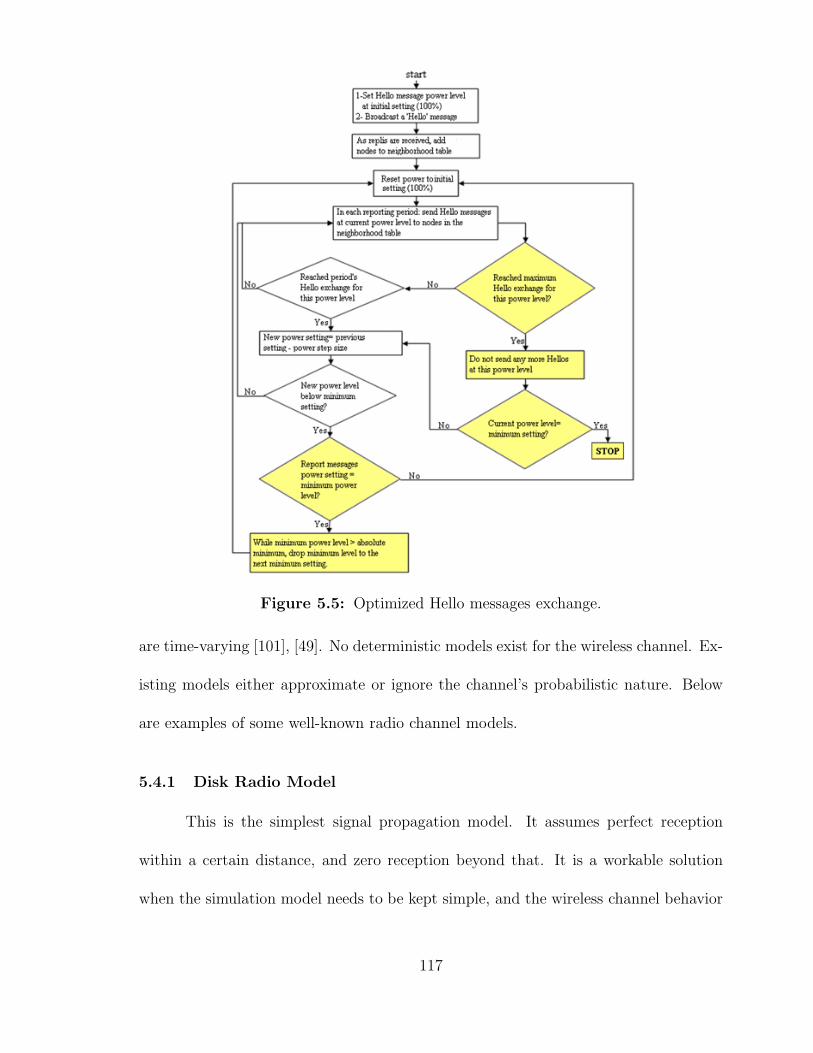
Figure 5.5: Optimized Hello messages exchange.
are time-varying [101], [49]. No deterministic models exist for the wireless channel. Ex-
isting models either approximate or ignore the channel’s probabilistic nature. Below
are examples of some well-known radio channel models.
5.4.1 Disk Radio Model
This is the simplest signal propagation model. It assumes perfect reception
within a certain distance, and zero reception beyond that. It is a workable solution
when the simulation model needs to be kept simple, and the wireless channel behavior
117

has negligible effect on the experiment’s outcome.
5.4.2 Rayleigh fading Radio Model
Rayleigh is a reasonable model when there are many objects in the environment
that scatter the radio signal before it arrives at the receiver. Rayleigh fading is most
applicable when there is no dominant propagation along a line of sight between the
transmitter and receiver. Rayleigh fading models assume that the magnitude of a signal
that has passed through such a channel will vary randomly according to a Rayleigh
distribution. Several mathematical models exist for generating this distribution.
5.4.3 Rician fading Radio Model
Rician fading is a stochastic model for radio propagation caused by partial
cancellation of a radio signal by itself. The signal arrives at the receiver through two
or more different paths. Rician fading occurs when one of the paths, typically a line of
sight signal, is much stronger than the others. The amplitude gain is characterized by
a Rician distribution.
5.4.4 First Order Radio Model
In the first order radio model, the signal strength is assumed to attenuate pro-
portional to some power of the distance traveled. The relationship between the trans-
mitted power and the received power can be expressed mathematically by the following
equation:
PTx = PRx + λ ∗ dn (5.3)
118

Where PTx is the transmission power, PRx is the received power, λ is the power-distance
propagation coefficient, d is the distance between the transmitter and the receiver, and
n is a power factor that depends on several environmental factors.
5.4.5 Radio Model Used for Performance Analysis
Several WSNs protocol studies have suggested and used the first order radio
model [35], [58], [59]. Our performance analysis will be carried out against one of these
protocols, APTEEN [59]. For these reasons, the first order radio is the model selected
and implemented in JiST/SWANS for the proposed protocol performance evaluation.
The value for the exponent variable n is known to vary between 2 for outdoors appli-
cations to slightly above 5 for some indoors settings. The exponent value is set to 2 in
all the simulation experiments in this work. The first order radio model, as given by
Equation 5.3, is deterministic. To capture the random nature of the radio channel, a
probabilistic component is added. This component will alter the received signal ran-
domly before delivering it to the destination. This is illustrated by the gray triangular
area in Figure 5.6.
Figure 5.6: Simulation analysis radio model.
119

5.5 Performance Analyses
In this section, the results of the simulation experiments will be presented. The
first set will show performance results for the reliable protocol versus APTEEN using
the default parameters settings. These settings are given in Table 5.3. Results for this
first set of experiments are presented in Section 5.5.1.
The Hello message exchange will produce a non-negligible energy impact on the
proposed protocol. At the same time, the proposed protocol techniques will not be
activated until a certain number of Hello messages have been exchanged. A node will
send out one Hello message and one Hello-reply message per report period. To test the
protocol’s sensitivity to this Hello overhead, the second set of experiments will vary the
number of reports per round. This will affect the number of Hello messages sent per
round. This will ultimately affect how soon the energy saving techniques are activated.
Results from this set of experiments are presented in Section 5.5.2.
In Section 5.3.4, we presented optimizations to the Hello messages exchange.
One of the proposed optimizations is setting a limit to the number of Hello messages
exchanged per link. In the third set of experiments, we vary the number of Hello
messages and analyze its impact on the proposed protocol’s performance. Results for
these experiments set are presented in Section 5.5.3.
The default packet size used in all experiments is 300 Bytes, as shown in Table
5.3. This should be adequate for most applications. In the fourth set of experiments,
we test the proposed protocol’s performance when varying the packet size. This will
indirectly test the protocol’s scalability in handling heavy traffic levels. Another scal-
ability test we conduct is increasing the network size. Varying the packet size analysis
120

is presented in Section 5.5.4.
Radio transceiver chip technology for wireless sensor networks is constantly im-
proving [17], [65], [21], [27], [22], [45]. Technical data sheets from various manufacturers
show different transmit to receive (Tx:Rx) power ratios. Earlier technologies show a
Tx:Rx ratio of around 2:1. Improvements in transceiver chip technology are towards
a smaller ratio. The simulation experiments default setting used for Tx:Rx ratio is
1:1, as shown in Table 5.3. In the fifth set of experiments, we test the effect of the
improvements in radio chip technology on the proposed protocol performance. In the
experiments of this set, three Tx:Rx ratios were compared, 2:1, 1:1 and 1:2. The results
of this set are given in Section 5.5.5.
Increasing the network size is the second scalability test. The first scalability
test is increasing the packet size. As shown in Table 5.3, the default number of nodes
is 100. In the sixth set of experiments, we increase the network size to 1600 nodes.
Results for this scalability test are presented in Section 5.5.6.
To test the MAC layer’s proposed Dynamic Backoff algorithm, the last set of
experiments create congested bandwidth conditions forcing the network to drop packets
due to full buffers. The default messages inter-arrival time is given in Table 5.3 as
1000 ∗ 106 nano seconds. This value was obtained through trial and error. It was
found to produce non-congested network utilization level. Message queues will hold
few messages, but no packets get dropped. For the MAC layer experiments, this value
was reduced to 1 ∗ 106 nano seconds. This creates a situation where all the nodes
buffers are full and the bandwidth is over-utilized. The network is forced to drop
packets, therefore, testing the effectiveness of the Dynamic Backoff algorithm at the
121

MAC layer. The results of this set are given in Section 5.5.7.
Table 5.3: Simulation default parameter values.Parameter Value
Number of nodes 100
Number of cluster heads (CH) 5 (5%)
Number of simulation rounds 100
Number of reports per round 50
Packet size 300 Bytes
Messages inter-arrival time 1000 * 106 nano sec
Required Report messages reliability 70%
Reliability Required Control messages reliability 80%
Required Event messages reliability 90%
Minimum Hello exchange before using 10
the Link Rating parameter
Maximum number of Hello messages per link per 10
power setting
Initial (maximum) transmit power -77 dB
Hello messages Minimum transmit power (1) a -81 dB
Minimum transmit power (2) -83 dB
Minimum transmit power (3) -86 dB
Absolute minimum transmit power -90 dB
Power step size 0.5 dB
Retry limit for Report messages 2
MAC retry limit Retry limit for Control messages 3
Retry limit for Event messages 4
Retry limit for APTEEN messages 3
Transmit:Receive ratio (Tx:Rx) 1:1
Radio Node default transmit power -77 dB
Cluster head to base station (BS) 10 dB
transmit power
a the use of several values for the minimum transmit power is explained in Section 5.3.4
5.5.1 Proposed Protocol performance using Default Parameters
These are the main simulation experiments that measure the impact and effec-
tiveness of the proposed protocol. In this set, the simulation parameters were set as
given in Table 5.3. The performance parameters monitored are energy performance,
reliability and latency.
122

5.5.1.1 Energy Performance
Figure 5.7 shows the energy performance of the proposed reliable protocol versus
APTEEN. The proposed protocol shows better energy performance before the 5th
round starts. From the graph, the gap between the two curves widens at around the
35th round. The reason is that the energy overhead due to the Hello messages exchange
the proposed protocol has incurred has been completely offset. After this point, the
energy savings that the protocol can achieve are clearly visible.
5.5.1.2 Reliability Performance
The reliability graphs for the report messages and the control messages are
shown in Figure 5.8 and Figure 5.9. These graphs show that the proposed protocol
has always exceeded the reliability requirements for the two message types. It is by
design that the proposed protocol has a lower reliability for these two message types.
It is this reliability relaxation that the proposed protocol uses to achieve the energy
savings shown in Figure 5.7.
The reliability graph for the event messages is shown in Figure 5.10. It shows the
proposed protocol has performed better than APTEEN. The proposed protocol takes
conservative approach to reliability. It does so by treating the application’s required
reliability values as constraints. The proposed protocol will use power settings that
are guaranteed to meet or exceed these values. As a result, it pursues event message
reliability for each event message reported. This coupled with higher retry limit at the
MAC layer has boosted the proposed protocol’s event reporting success rate. This is
while achieving better energy performance than APTEEN. This can be considered as
123

Figure 5.7: Reliable protocol energy performance.
Figure 5.8: Report messages reliability.
key accomplishment of this work.
5.5.1.3 Latency Performance
The latency performance results are shown in Figure 5.11, Figure 5.12 and
Figure 5.13 for report messages, control messages and event messages, respectively.
Improving latency was not an objective for the proposed protocol. Nevertheless, the
effect of the proposed protocol on latency warrant studying to verify whether there
are any effects on latency. From the graphs, it is clear that under normal bandwidth
124

Figure 5.9: Control messages reliability.
Figure 5.10: Event messages reliability.
utilization, the proposed protocol did not impact the latency performance. The latency
performance is revisited again later for congested network settings, and when the num-
ber of nodes in the network is increased. In these scenarios, the latency performance
is expected to degrade.
Figure 5.11: Report messages latency.
125

Figure 5.12: Control messages latency.
Figure 5.13: Event messages latency.
5.5.2 Varying Number of Reports per Round
In these experiments, the number of simulation rounds is set to 40. The rest
of the simulation parameters are kept as given in Table 5.3, with the exception of
the number of reports per round, which is the parameter varied in this set. The aim
in conducting this set of experiment is to measure the impact of the Hello messages
overhead.
5.5.2.1 Energy Performance
The energy performance results are shown in Figure 5.14. The graph shows that
for 10 Hello messages per round, the simulation was over before any energy savings can
be obtained. The two protocols have the same energy performance at around 20 reports
126

per round. Energy performance gains are obtained when the number of reports was 30
reports per round or more. It is important to state here that if these experiments were
carried out for 100 rounds, the outcome would have been favorable for the proposed
protocol. In conduction this set of experiments using 40 simulation rounds, we show
the sensitivities of the proposed protocol. There is an overhead associated with the
Hello messages exchange. To benefit from using the proposed protocol, the network
must to be expected to function for a long time. Since this is the type of applications
the protocol is targeting, there is a substantial energy gain on the long run. The results
also indicate that the proposed protocol is not suitable for short-lived networks. In such
settings, the network operations will be over before the proposed energy optimization
techniques have a chance to absorb the Hello messages overhead.
5.5.2.2 Reliability Performance
Figure 5.15 and Figure 5.16 show the reliability performance of the proposed
protocol vs. APTEEN for report messages and control messages, respectively. Similar
to the default performance, the protocol did meet or exceeded the reliability constraints
for the report messages and for the control message. The event messages reliability
results are shown in Figure 5.17. The protocol’s conservative approach to reliability
resulted in better performance for the event messages.
5.5.3 Varying Maximum Number of Hello Messages
In this set, the variable parameter is the number of Hello messages per link for
each of the power levels. This was varied from 10 Hello messages to 50 Hello messages.
127

Figure 5.14: Varying number of reports per round energy performance.
Figure 5.15: Report messages reliability.
The number of simulation rounds was set to 40. The rest of the simulation parameters
were kept as given in Table 5.3.
5.5.3.1 Energy Performance
The aim in conducting this set of experiments is to measure the impact of
the Hello messages overhead. The energy performance results are given in Figure
5.18. From the graph, an interesting result is obtained. Increasing the number of
Hello messages has a positive impact on the proposed protocol’s performance. The
expectations were that sending more Hellos will be taxing on the node’s energy and
therefore, will negatively impact the performance. The explanation was found after
128

Figure 5.16: Control messages reliability.
Figure 5.17: Event messages reliability.
careful study of the neighborhood tables in several nodes. The conservative approach to
link reliability meant that the communication power will be reduced only when enough
data justified dropping the power to a lower level. More Hello messages provided
the needed data for the power adjustment. Form the graph, it can be seen that the
energy performance improves in the range 20-30 Hello messages. It stays stable after
30 messages. This is consistent with the results obtained in separate experiments to
find the minimum number of Hello messages required before the link power settings
are stable. The results of that set were discussed in Section 5.3.4.
129

Figure 5.18: Impact of maximum number of Hello messages on energy performance.
5.5.3.2 Reliability Performance
The reliability results for the report, control and event messages are given in
Figures 5.19, 5.20 and 5.21, respectively. The reliability results were similar to the
default setting where the report and control messages did meet or exceed the reliability
constraints set by the application. The reliability results graph in Figure 5.21 shows
that the proposed protocol outperformed APTEEN for the event notification messages.
Figure 5.19: Report Messages Reliability.
5.5.4 Varying Packet Size
This is the first of two scalability experiments. The aim in conducting this set
is to evaluate how the proposed protocol scales to more data transfer. In this set,
130
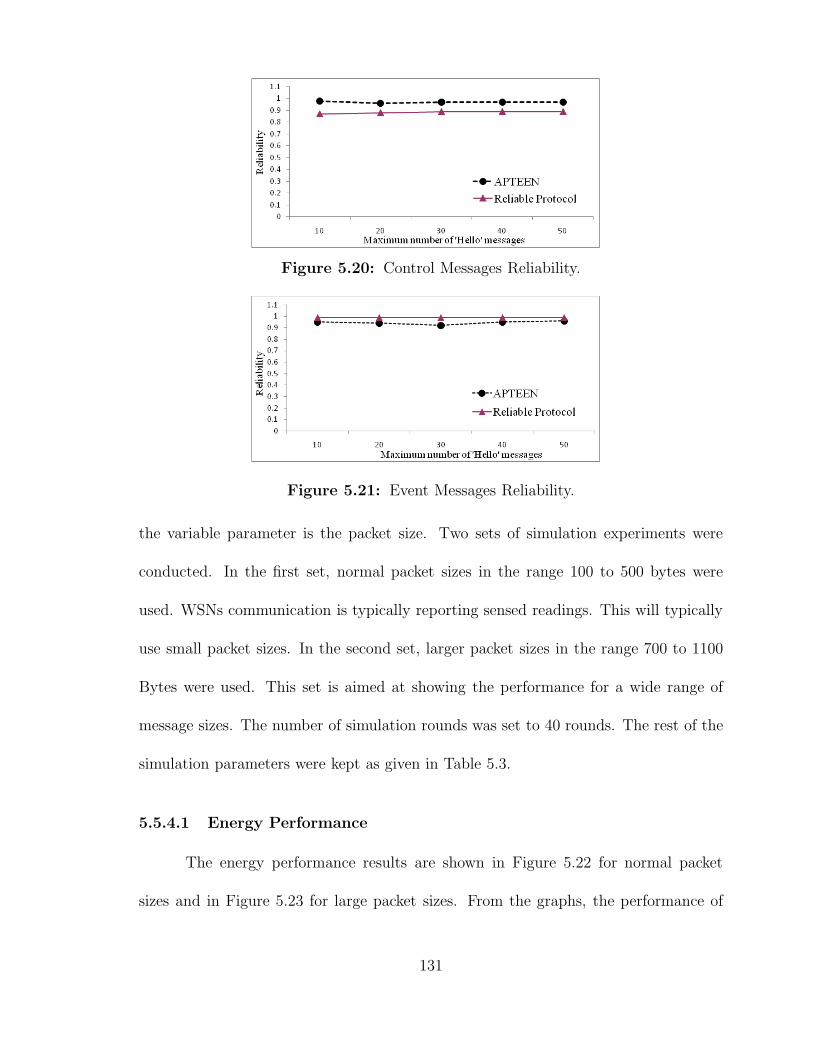
Figure 5.20: Control Messages Reliability.
Figure 5.21: Event Messages Reliability.
the variable parameter is the packet size. Two sets of simulation experiments were
conducted. In the first set, normal packet sizes in the range 100 to 500 bytes were
used. WSNs communication is typically reporting sensed readings. This will typically
use small packet sizes. In the second set, larger packet sizes in the range 700 to 1100
Bytes were used. This set is aimed at showing the performance for a wide range of
message sizes. The number of simulation rounds was set to 40 rounds. The rest of the
simulation parameters were kept as given in Table 5.3.
5.5.4.1 Energy Performance
The energy performance results are shown in Figure 5.22 for normal packet
sizes and in Figure 5.23 for large packet sizes. From the graphs, the performance of
131

the proposed protocol improved with increasing packet size. This results show that the
proposed protocol scales well and performs better with the increased amount of data
transferred.
Figure 5.22: Varying packet size energy performance, normal packet size.
Figure 5.23: Varying packet size energy performance, large packet size.
5.5.4.2 Reliability Performance
The reliability results for report messages, control messages and event messages
are shown in Figures 5.24 to 5.29 for different packet sizes . These results are for
both normal and large packet sizes. These results are consistent with the results
132

obtained in the previous sets. These graphs show that the proposed protocol has
satisfied the reliability constraints for the report messages and the control messages.
The protocol exceeded the reliability requirement for the report and control messages
and outperformed APTEEN for the event reporting messages.
Figure 5.24: Report messages reliability using normal packet sizes.
Figure 5.25: Report messages reliability using large packet sizes.
Figure 5.26: Control messages reliability using normal packet sizes.
133
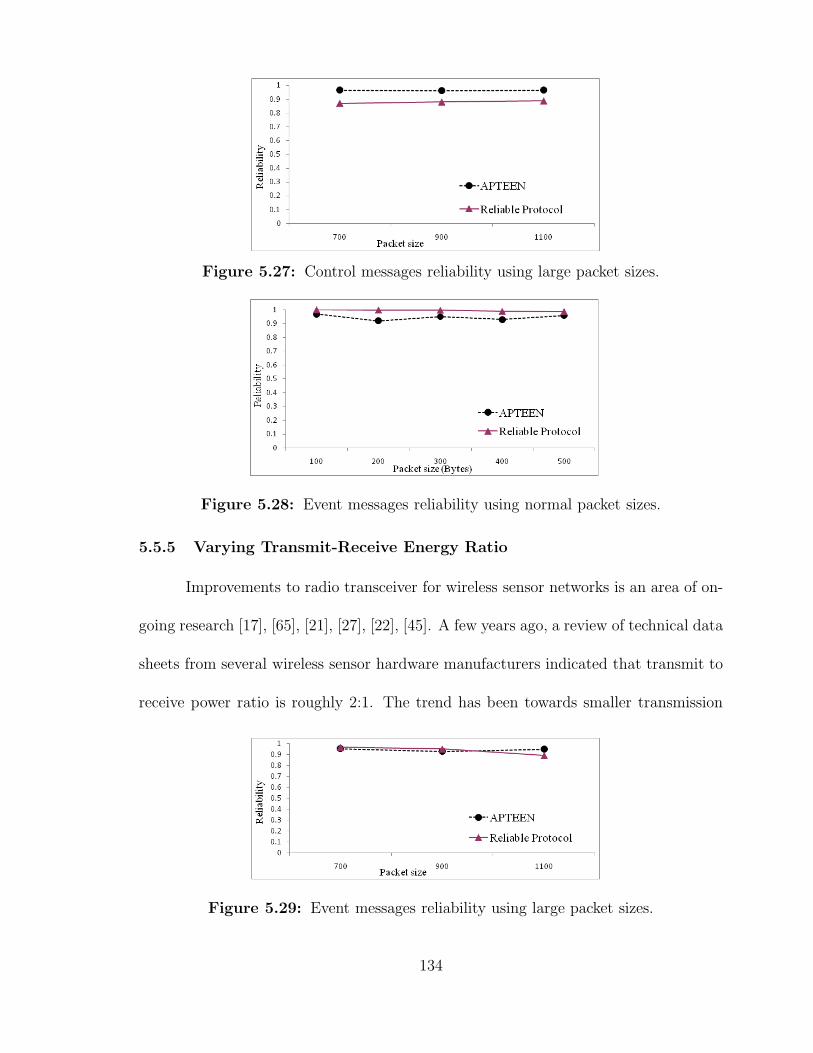
Figure 5.27: Control messages reliability using large packet sizes.
Figure 5.28: Event messages reliability using normal packet sizes.
5.5.5 Varying Transmit-Receive Energy Ratio
Improvements to radio transceiver for wireless sensor networks is an area of on-
going research [17], [65], [21], [27], [22], [45]. A few years ago, a review of technical data
sheets from several wireless sensor hardware manufacturers indicated that transmit to
receive power ratio is roughly 2:1. The trend has been towards smaller transmission
Figure 5.29: Event messages reliability using large packet sizes.
134

cost compared to receiving. To test the performance of the proposed protocol under
different radio hardware technologies, a set of experiments is conducted using different
transmit-to-receive power ratios. This set of experiments aims at testing the suitability
of the proposed protocol for future improved radio transceivers hardware. As shown in
Table 5.3, the default transmit:receive (Tx:Rx) ratio used throughout the simulations
is 1:1. In this set of experiments, transmit: receive (Tx:Rx) ratio of 1:2 and 2:1 were
tested.
5.5.5.1 Energy Performance
The results in Figure 5.30 show the energy performance of the proposed protocol
vs. APTEEN, for Tx:Rx power ratio 1:2. The proposed protocol shows a clear energy
performance improvement compared to APTEEN. This energy improvement is even
better when the ratio is on the other extreme 2:1, as shown in Figure 5.31. Figure
5.32 shows a comparison between the three energy ratios 2:1, 1:1 and 1:2, at the end of
40 simulation rounds for each of the settings. The proposed protocol has consistently
shown better energy performance than APTEEN.
Figure 5.30: Energy performance using Tx:Rx ratio = 1:2.
135

Figure 5.31: Energy performance using Tx:Rx ratio = 2:1.
Figure 5.32: Energy performance using Tx:Rx ratio = 1:2 vs. 1:1 vs. 2:1.
5.5.5.2 Reliability Performance
The reliability results for the report and control messages for Tx:Rx ratios 1:2
and 2:1 are given in Figure 5.33, Figure 5.34, Figure 5.35 and Figure 5.36. These
results show that the proposed protocol has met or exceeded the required reliability
levels. The reliability results using the defaults parameters for these two message types
were given earlier in Figure 5.8 and Figure 5.9. The Tx:Rx ratio used there is 1:1. From
these results, we conclude that the proposed protocol has always met or exceeded the
reliability constraints for the report and control messages.
136

For event reporting messages, the results for Tx:Rx ratios 1:2 and 2:1 are given
in Figure 5.37 and Figure 5.38, respectively. Adding these to the results for event
message’s performance for the ratio 1:1, given in Figure 5.10, we show that the proposed
protocol has outperformed APTEEN for event reporting, regardless of the Tx:Rx ratio.
Figure 5.33: Report messages reliability, Tx:Rx ratio = 1:2.
Figure 5.34: Report messages reliability for Tx:Rx ratio = 2:1.
5.5.6 Varying Network size
The first scalability test was performed by increasing the packet size. This was
discussed in Section 5.5.4. The second scalability test was performed by increasing the
network size. In these experiments, the number of nodes in the network is increased to
1600. As a result, the number of cluster heads (CH) is also increased to 80, to maintain
the 5% number of nodes to number of cluster heads ratio.
137
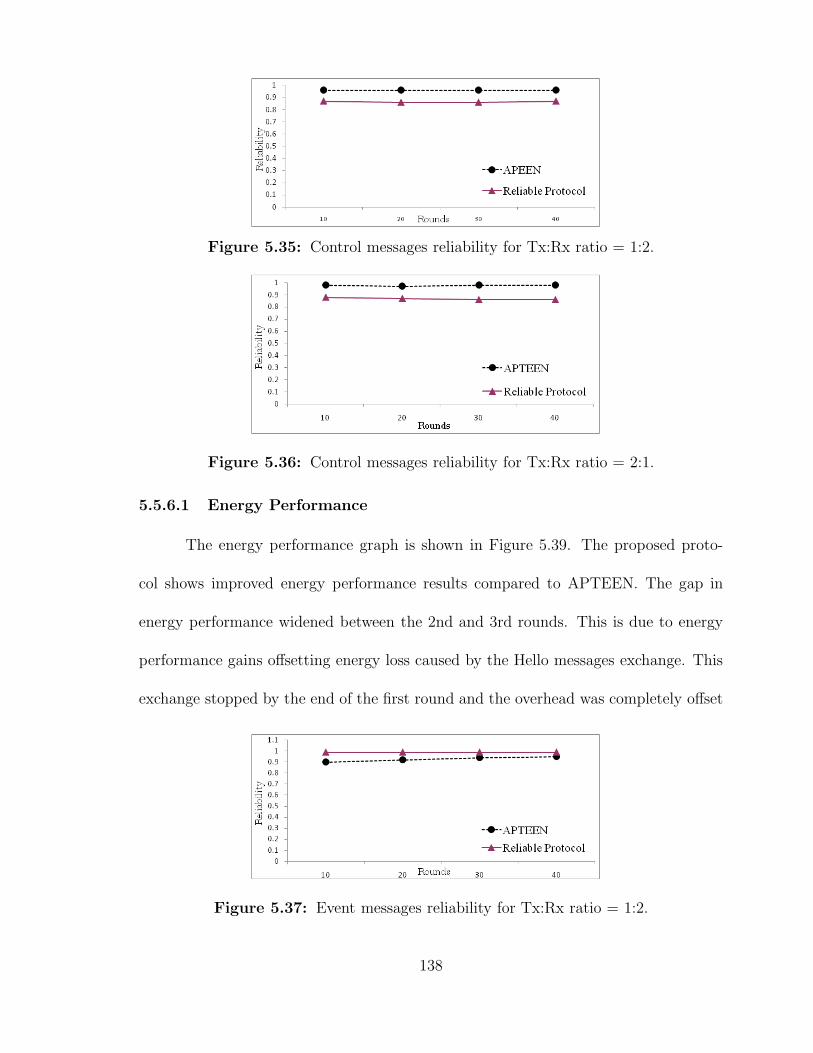
Figure 5.35: Control messages reliability for Tx:Rx ratio = 1:2.
Figure 5.36: Control messages reliability for Tx:Rx ratio = 2:1.
5.5.6.1 Energy Performance
The energy performance graph is shown in Figure 5.39. The proposed proto-
col shows improved energy performance results compared to APTEEN. The gap in
energy performance widened between the 2nd and 3rd rounds. This is due to energy
performance gains offsetting energy loss caused by the Hello messages exchange. This
exchange stopped by the end of the first round and the overhead was completely offset
Figure 5.37: Event messages reliability for Tx:Rx ratio = 1:2.
138

Figure 5.38: Event messages reliability for Tx:Rx ratio = 2:1.
by the 3rd round. This shows that the proposed protocol scales well and gives even
better energy savings for bigger networks and for larger packet sizes.
Figure 5.39: Energy performance for large network (1600 nodes).
5.5.6.2 Reliability Performance
The reliability graphs for the report and control messages are shown in Fig-
ure 5.40 and Figure 5.41, respectively. The graphs show similar results to the cases
presented previously. When the network size is increased, the proposed protocol still
meets and exceeds the reliability constraint specified. The event messages reliability
results were similar or better than APTEEN’s as shown in Figure 5.42.
139

Figure 5.40: Report messages reliability performance.
Figure 5.41: Control messages reliability performance.
5.5.6.3 Latency Performance
Figure 5.43, Figure 5.44 and Figure 5.45 show the latency performance of the
proposed protocol vs. APTEEN. Using the default parameters latency performance
is given in Figure 5.11, Figure 5.12 and Figure 5.13. Form these graphs, it can be
concluded that similar to the results obtained for the default parameters performance,
the proposed protocol has not impacted the latency when the network size is increased.
Figure 5.42: Event messages reliability performance.
140
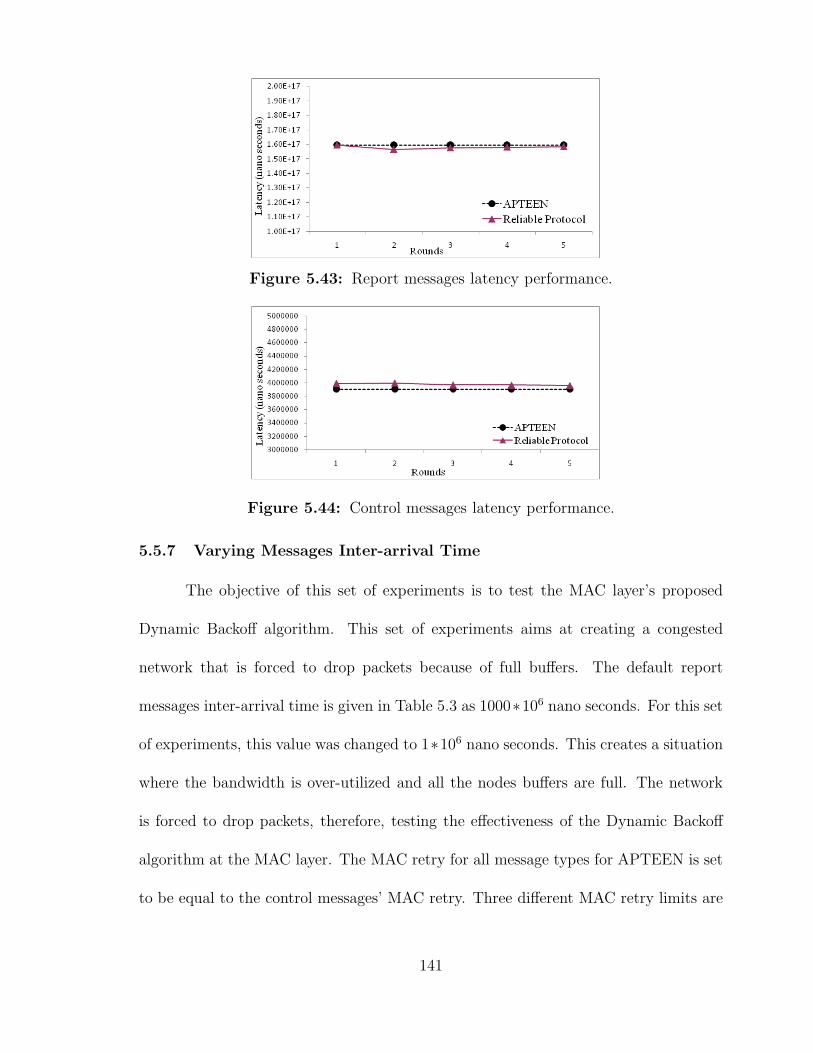
Figure 5.43: Report messages latency performance.
Figure 5.44: Control messages latency performance.
5.5.7 Varying Messages Inter-arrival Time
The objective of this set of experiments is to test the MAC layer’s proposed
Dynamic Backoff algorithm. This set of experiments aims at creating a congested
network that is forced to drop packets because of full buffers. The default report
messages inter-arrival time is given in Table 5.3 as 1000∗106 nano seconds. For this set
of experiments, this value was changed to 1∗106 nano seconds. This creates a situation
where the bandwidth is over-utilized and all the nodes buffers are full. The network
is forced to drop packets, therefore, testing the effectiveness of the Dynamic Backoff
algorithm at the MAC layer. The MAC retry for all message types for APTEEN is set
to be equal to the control messages’ MAC retry. Three different MAC retry limits are
141

Figure 5.45: Event messages latency performance.
tested 3, 4 and 6. For each of these APTEEN retry limits, a couple or more Dynamic
Backoff ratios were tested for the proposed protocol.
To aid in reading the graphs notations throughout this section, the notation
reliable protocol (x:y:z) means x= MAC retry limit for report messages, y= MAC
retry limit for control messages, z= MAC retry limit for event messages.
5.5.7.1 Energy Performance
The energy performance graphs are given in Figure 5.46, Figure 5.47 and Figure
5.48 for APTEEN retry limit 3,4 and 6, respectively. From these graphs, the proposed
protocol has consistently performed better that APTEEN. It worth pointing out that
some retry ratios offer better energy performance than others. As an example, there is
a noticeable difference in the energy performance between reliable protocol with ratios
1:3:8 in comparison to reliable protocol curve with ratios 2:3:5 in Figure 5.46. Another
example is the energy performance difference between the reliable protocol’s curve for
the ratios 2:6:8 compared to the curve of the reliable protocol with ratios 2:6:12 in
Figure 5.48.
142

Figure 5.46: Energy performance for different messages inter-arrival time, MAC de-fault retry limit= 3.
Figure 5.47: Energy performance for different messages inter-arrival time, MAC de-fault retry limit= 4.
5.5.7.2 Reliability Performance
The results of the reliability performance for the periodic report messages are
shown in Figure 5.49, Figure 5.50 and Figure 5.51 for APTEEN retry limits 3, 4 and
6, respectively. From the graphs, and due to the high level of network traffic, the
reliability of these messages is low. This fact holds irrespective of the protocol used.
The periodic report messages’ reliability for the proposed protocol lagged a little behind
APTEEN. This is also the case for control messages, as shown in Figure 5.52, Figure
143

Figure 5.48: Energy performance for different messages inter-arrival time, MAC de-fault retry limit= 6.
5.53 and Figure 5.54 for APTEEN retry limits of 3, 4 and 6 respectively. Nevertheless,
for the important event reporting messages, the proposed protocol assured high level
of messages delivery reliability. This is despite the challenge of an extremely congested
network conditions. These results are shown in Figure 5.55, Figure 5.56 and Figure
5.57 for APTEEN retry limits of 3, 4 and 6, respectively.
Assigning different MAC retry limits based on message type proved effective
in improving important message’s reliability. This performance has been consistent
in all experiment settings. Testing the effectiveness of the random backoff timers, on
the other hand, was inconclusive. Values that produced better reliability results in one
setting were at least ineffective or produced negative performance when e.g. the packet
size or the message queue size is changed. The test space and the number of variables
that affect this method suggest that this can be an investigation on its own.
144

Figure 5.49: Report messages reliability performance, APTEEN MAC default retrylimit= 3.
Figure 5.50: Report messages reliability performance, APTEEN MAC default retrylimit= 4.
5.5.7.3 Latency Performance
Figures 5.58 to 5.66 show the latency performance of the proposed protocol vs.
APTEEN. The default latency performance results were given in Figure 5.11, Figure
5.12 and Figure 5.13. Form the latency graphs presented here, it can be concluded
that except for the control messages, and similar to the results obtained for the default
parameters performance, the proposed protocol has not negatively affect the latency.
For the control messages, the latency is slightly increased as a result of event messages
staying alive longer in the nodes buffers. This fact increased the proposed protocol’s
event message’s reliability performance.
145

Figure 5.51: Report messages reliability performance, APTEEN MAC default retrylimit= 6.
Figure 5.52: Control messages reliability performance, APTEEN MAC default retrylimit= 3.
5.5.7.4 Impact of Different Retry Limits
The impact of varying the MAC retry limit is studied further using a stand-alone
simulation. This is to isolate the performance of the MAC retry limits from the complex
parameter space that the JiST/SWANS simulation tool imposes. In this setting, two
types of messages are defined, high reliability requirement (important) messages and
Figure 5.53: Control messages reliability performance, APTEEN MAC default retrylimit= 4.
146

Figure 5.54: Control messages reliability performance, APTEEN MAC default retrylimit= 6.
Figure 5.55: Event messages reliability performance, APTEEN MAC default retrylimit = 3.
low reliability requirement messages. One sender and one receiver are placed within
communication distance. The rate of sending the low reliability messages is made
variable. Figure 5.67 and Figure 5.68 show the results when both message types have
the same retry limits of 5 and 10, respectively. Under heavy network traffic loads, the
graphs show better reliability performance for the less important messages. This is due
to their higher sending rate. When the retry limits are different, 10 for the important
messages and 5 for the low reliability messages, the reliability performance is always
in favor of the important messages. This result is shown in Figure 5.69.
The higher retry limit has also enabled the important messages to have better
average number of retries. The results in Figure 5.70 show that for message interarrival
147

Figure 5.56: Event messages reliability performance, APTEEN MAC default retrylimit = 4.
Figure 5.57: Event messages reliability performance, APTEEN MAC default retrylimit = 6.
times 300, the important messages needed on average 9 retries. For the same data rate,
the low reliability messages reached their maximum retry limits.
Figure 5.58: Report messages latency performance, APTEEN MAC default retrylimit = 3.
148

Figure 5.59: Report messages latency performance, APTEEN MAC default retrylimit = 4.
Figure 5.60: Report messages latency performance, APTEEN MAC default retrylimit = 6.
5.6 Summary
Several simulation tests are developed to evaluate the performance of the pro-
posed protocol. Experiments covering a host of conditions are conducted to measure
their effect. These conditions included a default setting in which we tried as much as
possible to set the simulation parameters to typical WSNs operating conditions.
The protocol proposes a Hello messages exchange that introduces energy over-
head. To minimize this overhead, several optimization techniques are employed. The
Hello messages impact is measured through varying the maximum number of Hello
messages exchanged. Another test for the Hello messages impact is varying the num-
ber of Hello messages per round. This affects how soon the proposed protocol energy
149
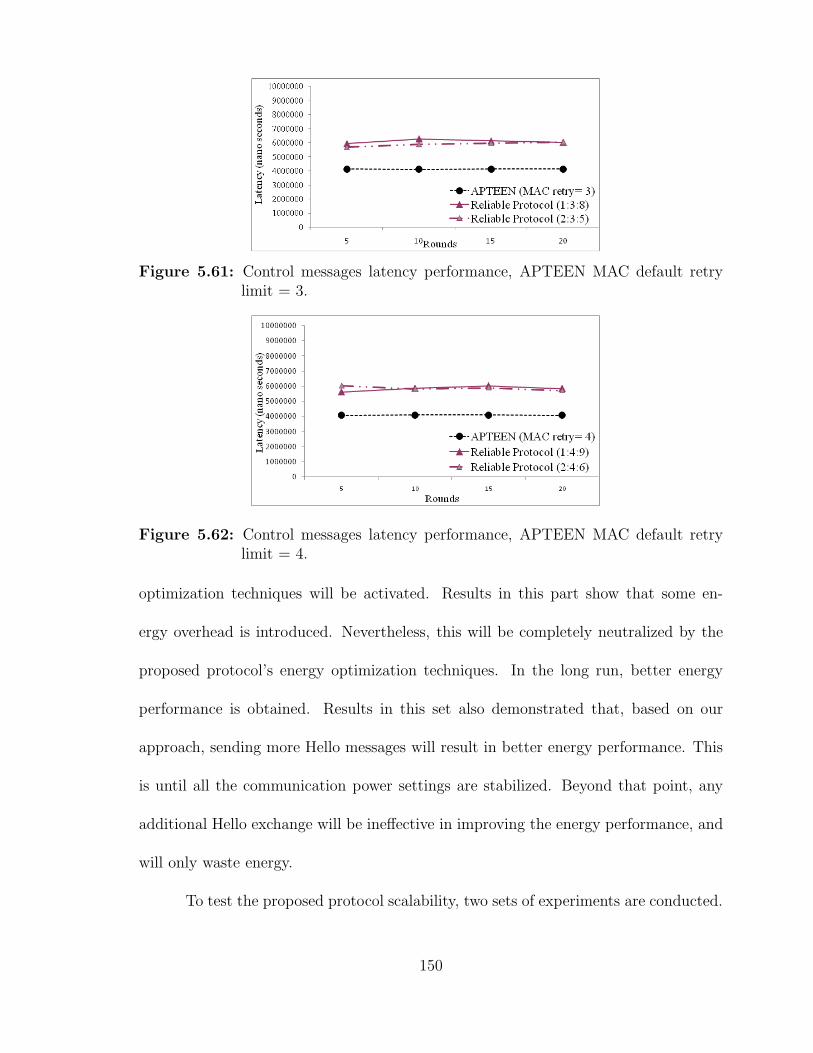
Figure 5.61: Control messages latency performance, APTEEN MAC default retrylimit = 3.
Figure 5.62: Control messages latency performance, APTEEN MAC default retrylimit = 4.
optimization techniques will be activated. Results in this part show that some en-
ergy overhead is introduced. Nevertheless, this will be completely neutralized by the
proposed protocol’s energy optimization techniques. In the long run, better energy
performance is obtained. Results in this set also demonstrated that, based on our
approach, sending more Hello messages will result in better energy performance. This
is until all the communication power settings are stabilized. Beyond that point, any
additional Hello exchange will be ineffective in improving the energy performance, and
will only waste energy.
To test the proposed protocol scalability, two sets of experiments are conducted.
150

Figure 5.63: Control messages latency performance, APTEEN MAC default retrylimit = 6.
Figure 5.64: Event messages latency performance, APTEEN MAC default retry limit= 3.
In the first set, the packet size is varied. This is to test the protocol’s response to
more data traffic. In the second scalability set, the network size (number of nodes) is
increased. This test shows how the energy saving techniques scale to more communi-
cating entities in the network. The results obtained for these two sets revealed that
the proposed techniques scale well and produce better results for larger networks.
Variations in the radio transceiver technologies used in wireless sensor hardware
warrant testing the proposed protocol’s behavior under these different technologies.
Another set of experiments tested the proposed protocol for different transmit: receive
(Tx:Rx) power ratios. The conclusion reached in this set of experiments is that the
151
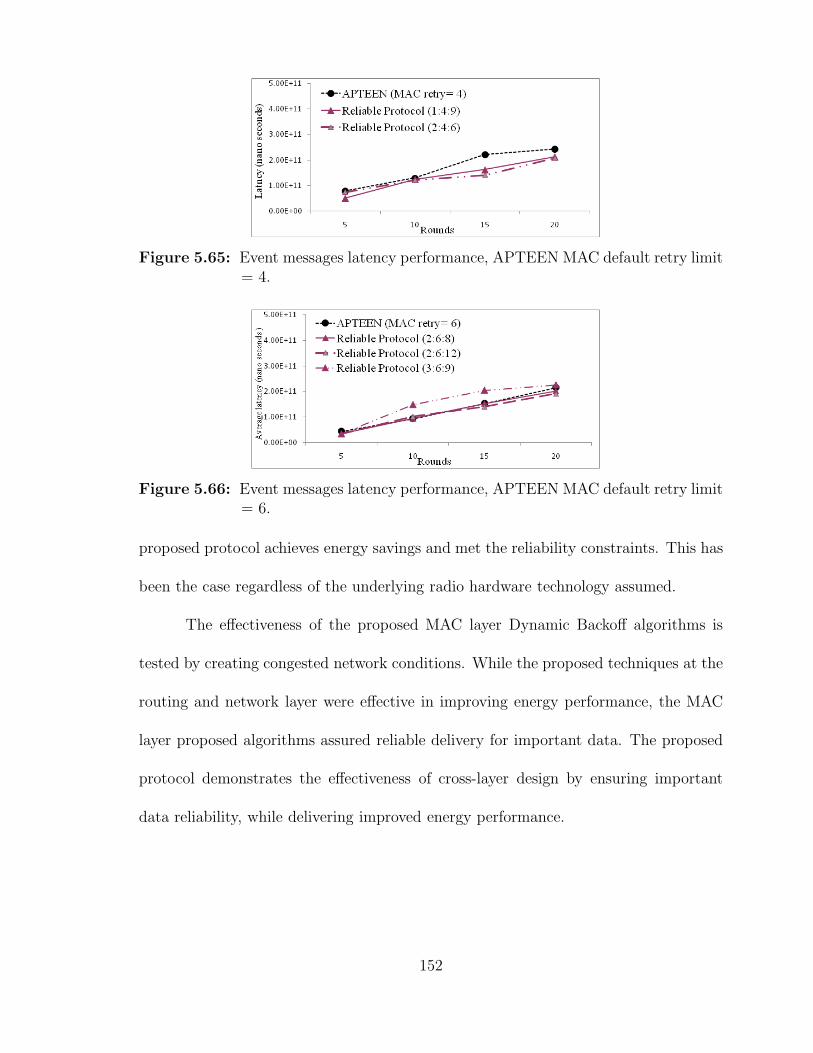
Figure 5.65: Event messages latency performance, APTEEN MAC default retry limit= 4.
Figure 5.66: Event messages latency performance, APTEEN MAC default retry limit= 6.
proposed protocol achieves energy savings and met the reliability constraints. This has
been the case regardless of the underlying radio hardware technology assumed.
The effectiveness of the proposed MAC layer Dynamic Backoff algorithms is
tested by creating congested network conditions. While the proposed techniques at the
routing and network layer were effective in improving energy performance, the MAC
layer proposed algorithms assured reliable delivery for important data. The proposed
protocol demonstrates the effectiveness of cross-layer design by ensuring important
data reliability, while delivering improved energy performance.
152

Figure 5.67: Low reliability vs. high reliability messages performance, messages retrylimit= 5.
Figure 5.68: Low reliability vs. high reliability messages performance, messages retrylimit= 10.
The proposed protocol shows better energy performance than the reference pro-
tocol APTEEN. This energy performance has been consistent regardless of the exper-
iment settings. Under normal network bandwidth utilization, the proposed protocol
has always met the reliability constraints, with no visible impact on latency. Also,
regardless of the experiment setting, the protocol has better reliability performance
than the reference protocol when handling important data.
Studying the effectiveness of assigning different backoff timers in JiST/SWANS
proved to be a substantial research on its own. This is due to the full-fledge simula-
tion environment and the host of variables the JiST/SWANS simulator imposes. This
153

Figure 5.69: Low reliability vs. high reliability messages performance, low messagesretry limits= 5 and 10.
Figure 5.70: Maximum number of message retries reached for both high and lowimportance messages.
coupled with the algorithm’s many sensitivities call for a separate study. A setup us-
ing a stand-alone simulation will isolate and control the unwanted effect of the many
variables existing in the JiST/SWANS environment. These variables can then be intro-
duced one at a time to study their impact of the random backoff timers. This also will
provide a chance to experiment with several possible variations of the backoff equation.
This is a possible and valid extension to the work carried out in this research.
154

Chapter 6
CONCLUSIONS AND FUTURE WORK
This chapter concludes the dissertation and considers future extensions to the
efforts presented.
6.1 Conclusions
Wireless sensor networks (WSNs) are one of the fastest developing new technolo-
gies. The availability of small, cheap low power embedded processors, radio transceivers
and sensors, integrated on a single chip is leading to the use of sensing, computing and
wireless communication for monitoring and interacting with the physical world.
A wireless sensor network (WSN) is a telecommunication network consisting
of spatially distributed sensors to monitor physical or environmental conditions in
a cooperative manner. Military applications such as monitoring of troop movement
and target tracking originally motivated the development of wireless sensor networks.
However, currently, wireless sensor networks are found in many civilian applications as
well.
As the wireless sensor networks research matures, it needs to move beyond
studies that are focused on studies that address the challenges of energy conservation
and resource constraints. To build trust in using these systems, more emphasis should
155

be placed on studying and analyzing the reliability and dependability of these systems.
So far, wireless sensor networks energy efficiency research has not taken reliability into
consideration as a performance parameter or as a design constraint. Two focus areas
in wireless sensor networks research can be identified. One area is concerned with
optimizing the energy performance and improving network lifetime. The second area
is focused on studying the WSNs reliability problem independent of the networking
and energy performance issues.
This work addresses communication reliability in the highly constrained wire-
less sensor networks environment. We propose a cross-layer, energy-efficient reliable
wireless sensor protocol design. The protocol benefits from the body of research in
the two areas of wireless sensors reliability and wireless sensors energy conservation.
The proposed protocol optimizes energy consumption while providing a reliable data
delivery network. The protocol introduces new energy saving techniques that consider
reliability as a design parameter and as a performance constraint. The protocol also
introduces a new medium access control layer (MAC) dynamic retry limit and dynamic
transmission power setting that are based on the messages reliability requirements.
Cross-layer design is defined as the interaction between the different stack layers
and the sharing of information with the goal of improving the overall system perfor-
mance. It has been used in ad hoc wireless systems to improve throughput, latency,
and quality of service (QoS). Due to the severe energy constraints that are common
to wireless sensor networks operations, several publications have proposed cross-layer
design as an optimization technique. It has been argued that cross-layer designs can
surpass the performance of the best-optimized protocol whose techniques target a single
156

layer of the network stack. The improvements gained in performance come at a price.
This includes decreased architecture modularity and loss of the decoupling between
design and development. Also, cross-layer designs may be hard to debug, maintain
or upgrade. The interdependencies introduced need to be carefully considered and
evaluated to avoid the non-trivial problem of system’s instability.
Our proposed protocol uses cross-layer design as a performance and energy op-
timization technique. Nevertheless, the protocol avoids introducing layer interdepen-
dencies by preserving the stack architecture and optimizes the overall system energy
and reliability performance by information sharing. The information is embedded as
flags in the data and control messages that are moving through the stack. Each layer
reads these flags and adjusts its performance and handling of the message accordingly.
The performance of the proposed cross-layer protocol is evaluated using simula-
tion. An ad-hoc simulation tool is upgraded by adding wireless sensor networks mod-
eling capabilities and used in the evaluation. The performance is compared against the
APTEEN protocol. Results show that the proposed protocol produced better energy
performance, met reliability requirements and performed better than the reference pro-
tocol in the reliable delivery of the class of messages that are tagged as important or
critical data.
Several simulation tests are developed to evaluate the performance of the pro-
posed protocol. Experiments covering a host of conditions and parameters are con-
ducted to measure their effect. These conditions included a default setting in which we
tried as much as possible to set the simulation parameters to typical WSNs operating
conditions.
157

The proposed protocol introduces a Hello message exchange to gather statistics
for the communication link quality for the node’s one hop neighbors. This Hello mes-
sages exchange introduces an energy overhead. To minimize the effect of this overhead,
several optimization techniques are employed.
The Hello messages impact is measured through varying the maximum number of Hello
messages exchanged. Another test to the Hello messages impact is varying the num-
ber of Hello messages per round. This affects how soon the proposed protocol energy
optimization techniques will be activated. Results in this part show that some en-
ergy overhead is introduced. Nevertheless, this will be completely neutralized by the
proposed protocol’s energy optimization techniques. In the long run, better energy
performance is obtained. Results in this set also demonstrated that, based on our
approach, sending more Hello messages will result in better energy performance. This
is until all the communication power settings are stabilized. Beyond that point, any
additional Hello exchange will be ineffective in improving the energy performance, and
will only waste energy.
To test the proposed protocol scalability, two sets of experiments are conducted.
In the first set, the packet size is varied. This is to test the protocol’s response to
more data traffic. In the second scalability set, the network size (number of nodes) is
increased. This test shows how the energy saving techniques scale to more communi-
cating entities in the network. The results obtained for these two sets revealed that
the proposed techniques scale well and produce better results for larger networks.
Variations in the radio transceiver technologies used in wireless sensor hardware
warrant testing the proposed protocol’s behavior under these different technologies.
158

Another set of experiments tested the proposed protocol for different transmit: receive
(Tx:Rx) power ratios. The conclusion reached in this set of experiments is that the
proposed protocol achieves energy savings and met the reliability constraints. This has
been the case regardless of the underlying radio hardware technology assumed.
The effectiveness of the proposed MAC layer Dynamic Backoff algorithms is
tested by creating congested network conditions. The improvements that the cross-
layer design approach can provide are evident in the proposed protocol. While the
proposed techniques at the network layer proved very effective in improving energy
performance, the MAC layer proposed algorithms assured reliable delivery for impor-
tant data. The proposed protocol demonstrates the effectiveness of cross-layer design
by ensuring important data reliability, while delivering improved energy performance.
The proposed protocol shows better energy performance than the reference pro-
tocol APTEEN. This energy performance has been consistent regardless of the experi-
ment settings. Under normal network bandwidth utilization, the proposed protocol has
always met the reliability constraints, with no visible impact on latency. Also, regard-
less of the experiment setting, the proposed protocol has better reliability performance
than the reference protocol when handling important data.
6.2 Future Work
This work is a first effort into combining multiple research proposals into one
deployable and practical solution. A great deal of work is still ahead and needed in
this direction. The following lists few opportunities:
• The Hello messages are instrumental in achieving the energy savings that the
159

proposed protocol enjoys. These energy savings are successfully in neutralizing
the overhead that the Hello messages produced. This Hello exchange gives the
nodes a local view of its neighbors. This view can be expanded as needed to
make the node aware of neighbors few hops away. This is possible by increasing
the amount and type of information that the Hello messages carry. Nodes will
then become aware of their expanded surroundings. This fact can be used to
assist with other networking challenges. There are many possibilities where this
exchange can provide a solution, an example is obtaining a balanced distribution
of cluster head (CH) nodes through the network. As it stands, all hierarchical
wireless sensor networks routing protocol use distributed cluster head selection
algorithms. These algorithms target, but do not guarantee uniform cluster heads
distribution.
• The results of the proposed MAC layer retry limit performance show some of the
proposed protocol ratios had better energy performance than others. This fact
needs more investigation into the exact behavior so more energy savings can be
achieved while ensuring that the reliability gains are not affected.
• Throughout the experimentation modeling and simulation phases, nodes are
given enough initial energy to stay alive till the end of the simulation rounds.
An investigation can be carried out for the effect of nodes consuming all their
energy resources, being removed from the network and fresh nodes being added.
Possible modifications to the proposed protocol to fit this more realistic view of
the network can be investigated.
160

• Studying the effectiveness of assigning different backoff timers in JiST/SWANS
proved to be a substantial research on its own. This is due to the full-fledge
simulation environment and the host of variables in the JiST/SWANS simulator.
This coupled with the algorithm’s many dependencies call for a separate study.
A setup using a stand-alone simulation will isolate and control the unwanted
effect of the many variables existing in the JiST/SWANS environment. These
variables can then be introduced one at a time to study their impact on the
random backoff timers. This also will provide a chance to experiment with several
possible variations of the backoff equation. This is a possible and valid extension
to the work carried out in this dissertation.
161

BIBLIOGRAPHY
[1] Ieee 802.11 standard documentations. http://www.ieee802.org/11/.
[2] Ieee 802.15.4 standard documentations. http://www.ieee802.org/15/.
[3] H. AboElFotoh, S. Iyengar, and K. Chakarbarty. Computing reliability and messagedelay for cooperative wireless distributed sensor networks subject to random failures.IEEE transactions on reliability, 54(1):145– 155, March 2005.
[4] Rachit Agrawal, Emanuel Popovici, and Brendan Flynn. Adaptive wireless sensornetworks: A system design approach to adaptive reliability. In IEEE 2nd Interna-tional Conference on Wireless Communication and Sensor Networks (WCSN 2006),2006.
[5] G. Asada, M. Dong, T.S. Lin, F. Newberg, G. Pottie, W.J. Kaiser, and H.O. Marcy.Wireless integrated network sensors: Low power systems on a chip. In Proceedingsof the 24th European Solid-State Circuits Conference, ESSCIRC 98, pages 9–16,September 1998.
[6] Ahmed Badi and Imad Mahgoub. Wireless Sensor Networks (WSNs): Optimizationof the OSI Network Stack for Energy Efficiency, volume 3, pages 1523–1533. Taylorand Francis Group, Auerbach Publishing Inc, 2008.
[7] Ahmed Badi, Imad Mahgoub, and Mohammad Ilyas. Mac layer dynamic backoffscheme for message delivery reliability in wireless sensor networks. IEEE 5th Inter-national Symposium on High Capacity Optical Networks and Enabling TechnologiesHONET 2008, November 2008.
[8] Ahmed Badi, Imad Mahgoub, and Mohammad Ilyas. Using individualized linkpower settings for energy optimization in hierarchal wireless sensor networks. IEEE6th International Symposium on High Capacity Optical Networks and Enabling Tech-nologies HONET 2009, December 2009.
[9] Rimon Barr. JiST Java in Simulation Time User Guide. Cornell University, March2004. http://jist.ece.cornell.edu.
162

[10] Rimon Barr. SWANS Scalable Wireless Ad hoc Network Simulator User Guide.Cornell University, March 2004. http://jist.ece.cornell.edu.
[11] S. Baydere, Y. Safkan, and O. Durmaz. Lifetime analysis of reliable wireless sen-sor networks. IEICE Transactions on Communications, E88-B(6):2465–2472, June2005.
[12] Johannes Blomer, Malik Kalfane, Marek Karpinski, Richard Karp, Michael Luby,and David Zuckerman. An xor-based erasure-resilient coding scheme. TechnicalReport TR-95-048, International Computer Science Institute, August 1995.
[13] Athanassios Boulis. Models for Programmability in Sensor Networks, chapter 7.CRC press, August 2004.
[14] M.I. Brownfield, K. Mehrjoo, A.S. Fayez, and N.J. Davis. Wireless sensor networkenergy-adaptive mac protocol. 3rd IEEE Consumer Communications and Network-ing Conference, CCNC, 2:778– 782, 2006.
[15] John W. Byers, Michael Luby, Michael Mitzenmacher, and Ashutosh Rege. A digitalfountain approach to reliable distribution of bulk data. ACM SIGCOMM ComputerCommunication Review, 28(4):56 – 67, October 1998.
[16] X. Chang. Network simulations with opnet. In Proceedings of the 31st WinterConference on Simulation, pages 307–314, 1999.
[17] Y. H. Chee, A. M. Niknejad, and J. Rabaey. A 46% efficient 0.8 dbm transmitterfor wireless sensor networks. In in Proc. IEEE Symp. VLSI Circuits, pages 52–53,June 2006.
[18] P. Chen, D.B. Oapos, and E. Callaway. Energy efficient system design with optimumtransmission range for wireless ad hoc networks. In IEEE International Conferenceon Communications, ICC 2002, volume 2, pages 945–952, 2002.
[19] Charles Chien, Igor Elgorriaga, and Charles McConaghy. Low-power direct-sequencespread-spectrum modem architecture for distributed wireless sensor networks. InEnrico Macii, Vivek De, and Mary Jane Irwin, editors, ISLPED, pages 251–254.ACM, 2001.
[20] Marcello Cinque, Domenico Cotroneo, Gianpaolo De Caro, and Massimiliano Pelella.Reliability requirements of wireless sensor networks for dynamic structural monitor-ing. In proc. of The first Workshop on Applied Software Reliability, 2006.
163

[21] B. W. Cook, A. Molnar, and K. S. J. Pister. Low power rf design for sensor networks.In IEEE Radio Frequency integrated Circuits (RFIC) Symposium, pages 357– 360,June 2005.
[22] D.C. Daly and A. P. Chandrakasan. An energy efficient ook transceiver for wirelesssensor networks. In IEEE Radio Frequency Integrated Circuits Symposium, pages279–282, June 2006.
[23] J.D. Day and H. Zimmermann. The osi reference model. In Proceedings of the IEEE,volume 71, pages 1334–1340, December 1983.
[24] S. Dulman, T. Nieberg, J. Wu, and P. Havinga. Trade-off between traffic overheadand reliability in multipath routing for wireless sensor networks. In Proc. IEEEWireless Communications and Networking (WCNC 2003), volume 3, pages 1918–1922. IEEE, March 2003.
[25] Ozlem Durmaz and Sebnem Baydere. Impact of in-network buffering on the reliabil-ity of sensor networks. In Proceedings of Second International Workshop on Sensorand Actor Network Protocols and Applications (SANPA 2004), 2004.
[26] Amre El-Hoiydi and Jean-Dominique Decotignie. WiseMAC: An Ultra Low PowerMAC Protocol for Multi-hop Wireless Sensor Networks, volume 3121, pages 18–31.Springer Berlin / Heidelberg, 2004.
[27] C. Enz, N. Scolari, and U. Yodprasit. Ultra low-power radio design for wirelesssensor networks. In Proceedings of the 2005 IEEE International Workshop on Radio-Frequency Integration Technology, pages 1–17, 2005.
[28] Ian F.Akyildiz, Mehmet C. Vuran, and Ozgur B. Akan. A cross-layer protocol forwireless sensor networks. In 40th Annual Conference on Information Science andSystems (CISS06), pages 1102–1107, March 2006.
[29] Deepak Ganesan, Bhaskar Krishnamachari, Alec Woo, David Culler, Deborah Es-trin, and Stephen Wicker. An empirical study of epidemic algorithms in large scalemultihop wireless networks. Technical report, Intel Research, 2002.
[30] Liljana Gavrilovska. Cross-layering approaches in wireless ad hoc networks. WirelessPersonal Communications Journal, 37(3-4):271–290, May 2006.
[31] Omprakash Gnawali, Mark Yarvis, John Heidemann, and Ramesh Govindan. In-teraction of retransmission, blacklisting, and routing metrics for reliability in sensornetwork routing. In First Annual IEEE Communications Society Conference on
164

Sensor and Ad Hoc Communications and Networks (IEEE SECON 2004), pages34–43. IEEE, October 2004.
[32] Jussi Haapola, Zach Shelby, Carlos Pomalaza, and Petri Mahonen. Cross-layerenergy analysis of multi-hop wireless sensor networks. In Proceeedings of the SecondEuropean Workshop on Wireless Sensor Networks, pages 33– 44, January 2005.
[33] Z.J. Haas. A new routing protocol for the reconfigurable wireless networks. In 6thIEEE International Conference on Universal Personal Communications (ICUPC97),volume 2, pages 562–566, October 1994.
[34] W. Heinzelman, J. Kulik, and H. Balakrishnan. Adaptive protocols for informationdissemination in wireless sensor networks. Proc. 5th ACM Mobicom, pages 174–185,August 1999.
[35] W. R. Heinzelman, A. Chandrakasan, and Balakrishnan H. Energy-efficient commu-nication protocol for wireless microsensor networks. Proceedings of the 33rd HawaiiInternational Conference on System Sciences, 2:10, January 2000.
[36] M.J. Hossain, O. Chae, M. Mamun-Or-Rashid, and C.S. Hong. Cost-effective max-imum lifetime routing protocol for wireless sensor networks. Proceedings of the Ad-vanced Industrial Conference on Telecommunications/Service Assurance with Partialand Intermittent Resources Conference/ELearning on Telecommunications Work-shop, pages 314–319, July 2005.
[37] C. Intanagonwiwat, R. Govindan, D. Estrin, and F. Heidemann, J.and Silva. Di-rected diffusion for wireless sensor networking. IEEE/ACM Transactions on Net-working, 11:1–16, Feburay 2003.
[38] Y.G. Iyer, S. Gandham, and S. Venkatesan. Stcp: a generic transport layer pro-tocol for wireless sensor networks. In 14th International Conference on ComputerCommunications and Networks ICCCN, pages 449–454, October 2005.
[39] N. Joehl, C. Dehollain, P. Favre, P. Deval, and M. Declercq. A low-power 1-ghzsuper-regenerative transceiver with time-shared pll control. IEEE Journal of Solid-State Circuits, 36(7):1025 – 1031, July 2001.
[40] D.B. Johnson. Routing in ad hoc networks of mobile hosts. In Workshop on MobileComputing Systems and Applications, pages 158–163, 1994.
[41] L. Joseph and G. Uma. Reliability based routing in wireless sensor networks. Inter-national Journal of Computer Science and Network Security, 6(12):331–338, 2006.
165

[42] J. Kim and J.G. Andrews. An energy efficient source coding and modulation schemefor wireless sensor networks. In IEEE 6th Workshop on Signal Processing Advancesin Wireless Communications, pages 710–714, 2005.
[43] M. Kim, J. Kim, and Y. Choi. Low power circuit architecture of aes crypto modulefor wireless sensor network. Enformatika Transactions on Engineering, Computingand Technology, 8, October 2005.
[44] S. Kim, R. Fonseca, and D. Culler. Reliable transfer on wireless sensor networks.In First Annual IEEE Communications Society Conference on Sensor and Ad HocCommunications and Networks, pages 449– 459, October 2004.
[45] W. Kluge, F. Poegel, H. Roller, M. Lange, T. Ferchland, L. Dathe, and D. Eggert. Afully integrated 2.4-ghz ieee 802.15.4-compliant transceiver for zigbee applications.IEEE Journal of Solid-State Circuits, 41(12):2767–2775, December 2006.
[46] R. Kumar, A. Paul, U. Ramachandran, and D. Kotz. On improving wireless broad-cast reliability of sensor networks using erasure codes. In 2nd International Confer-ence on Mobile Ad-hoc and Sensor Networks (MSN 2006), pages 155–170, 2006.
[47] Hojoong Kwon, Tae Hyun Kim, Sunghyun Choi, and Byeong Gi Lee. A crosslayer strategy for energy-efficient reliable delivery in wireless sensor networks. IEEETransaction on Wireless Communication, 5(12):3689–3699, December 2006.
[48] P. Levis, N. Lee, M. Welsh, and D. Culler. Tossim: Accurate and scalable simulationof entire tinyos application. In Proc. 1st International Conference on EmbeddedNetworked Sensor Systems, pages 126–137, 2003.
[49] Philip Levis. Tinyos online documentation. http://www.tinyos.net.
[50] Xu Li and Zheng Bao-yu. Study on cross-layer design and power conservation inad hoc networks. In Proc. of the 4th IEEE International Conference on Paralleland Distributed Computing, Applications and Technologies, pages 324– 328, August2003.
[51] Y. Li, F. De Bernardinis, B. Otis, J.M. Rabaey, and A.S. Vincentelli. A low-powermixed-signal baseband system design for wireless sensor networks. In Proceedings ofthe IEEE 2005 Custom Integrated Circuits Conference, pages 55–58, 2005.
[52] S. Lindsey and C. Raghavendra. Pegasis: Power-efficient gathering in sensor infor-mation systems. IEEE Aerospace Conference Proceedings, 3:1125–1130, 2002.
166

[53] Lingjia Liu and Jean-Francois Chamberland. Cross-layer optimization and infor-mation assurance in decentralized detection over wireless sensor networks. In 14thAsilomar Conference on Signals, Systems and Computers (ACSSC ’06, pages 271–275, 2006.
[54] G. Lu, B. Krishnamachari, and C.S. Raghavendra. An adaptive energy efficient andlow-latency mac for data gathering in wireless sensor networks. 18th InternationalParallel and Distributed Processing Symposium, page 224, April 2004.
[55] Michael Luby. Lt codes. In IEEE 43rd Symposium on Foundations of ComputerScience (FOCS), 2002.
[56] Corinne Lucet and Jean francois Manouvrier. Exact methods to compute networkreliability. In Proc. of 1st International Conference on Math. Methods in Reliability,September 1997.
[57] Ritesh Madan, Shuguang Cui, Sanjay Lall, and Andrea Goldsmith. Cross-layerdesign for lifetime maximization in interference-limited wireless sensor networks.IEEE Transactions on Wireless Communications, 5(11):3142–3152, November 2006.
[58] A. Manjeshwar and D. Agrawal. Teen: A routing protocol for enhanced efficiencyin wireless sensor networks. Proceedings of the 15th International Parallel and Dis-tributed Processing Symposium, page 20092015, April 2001.
[59] A. Manjeshwar and D. Agrawal. Apteen: a hybrid protocol for efficient routingand comprehensive information retrieval in wireless sensor networks. InternationalParallel and Distributed Processing Symposium IPDPS, 2002.
[60] P. Maymounkov. Online codes. Technical Report TR2002-833, New York University,2002.
[61] S. McCanne and S. Floyed. ns network simulator. http://www.isi.edu/nsnam/ns/.
[62] Tommaso Melodia, Mehmet C. Vuran, and Dario Pompili. The state of the artin cross-layer design for wireless sensor networks,in. In Proceedings of EuroNGIWorkshops on Wireless and Mobility, Springer Lecture Notes on Computer Science,LNCS 388, pages 78–92, 2005.
[63] Lokesh Bajaj Mineo, Mineo Takai, Rajat Ahuja, Ken Tang, Rajive Bagrodia, andMario Gerla. Glomosim: A scalable network simulation environment. Technicalreport, UCLA Computer Science Department, May 1999.
167

[64] J. Neumann. The reality of osi. In Proceedings of the 13th Conference on LocalComputer Networks, page 157 161, October 1988.
[65] B. Otis, Y. Chee, R. Lu, N. Pletcher, and J.M. Rabaey. An ultra-low power mems-based two-channel transceiver for wireless sensor networks. In Symposium on VLSICircuits, pages 20–23, June 2004.
[66] L. Page and J.E. Perry. A model for system reliability with common-cause failures.IEEE transactions on reliability, 38(4):406–410, October 1989.
[67] C.E. Perkins and E.M Royer. Ad-hoc on-demand distance vector routing. In IEEE2nd Workshop on Mobile Computer Systems and Applications (WMCSA 99), pages90–100, 1999.
[68] D. Puccinelli, E. Sifakis, and M. Haenggi. A cross-layer approach to energy balancingin wireless sensor networks. Lecture Notes in Control and Information Sciences,331:309–324, 2006.
[69] Vijay T. Raisinghani and Sridhar Iyer. Cross layer design optimizations in wire-less protocol stacks. Computer Communications (ELSEVIER), 27(8):720–724, May2004.
[70] V. Rajendran, K. Obraczka, and J. Garcia-Luna-Aceves. Energy-efficient mac:energy-efficient collision-free medium access control for wireless sensor networks.ACM Conference on Embedded Networked Sensor Systems SENSYS, 2003.
[71] Luigi Rizzo. Effective erasure codes for reliable computer communication protocols.ACM SIGCOMM Computer Communication Review, 27(2):24–36, April 1997.
[72] A. Sadat, H. Qu, C. Yu, J. S. Yuan, and H. Xie. Low-power cmos wireless memsmotion sensor for physiological activity monitoring. IEEE Transactions on Circuitsand Systems, 52(12):2539– 2551, December 2005.
[73] A.M. Safwat. A novel framework for cross-layer design in wireless ad hoc and sensornetworks. In IEEE Global Telecommunications Conference Workshops (GlobeCom),pages 130–135, December 2004.
[74] Y. Sankarasubramaniam, I.F. Akyildiz, and S.W. McLaughlin. Energy efficiencybased packet size optimization in wireless sensor networks. In Proceedings of the1st IEEE International Workshop on Sensor Network Protocols and ApplicationsSNPA’03, pages 1–8, May 2003.
168

[75] Yogesh Sankarasubramaniam, Ozgur Akan, and Ian Akyildiz. Esrt: Event-to-sinkreliable transport in wireless sensor networks. IEEE/ACM Transactions on Net-working (TON), 13(5), October 2005.
[76] D. Schroeder. Adaptive low-power analog/digital converter for wireless sensor net-works. In Third International Workshop on Intelligent Solutions in Embedded Sys-tems, page 70 78, May 2005.
[77] Rahul C. Shah, Dragan Petrovic, and Jan M. Rabaey. Energy-Aware Routing andData Funneling in Sensor Networks, chapter 9. Taylor and Francis Group, CRCPress LLC, 2006.
[78] F. Shaikh, A. Khelil, and N. Suri. On modeling the reliability of data transportin wireless sensor networks. In IEEE 15th Euromicro International Conference onParallel, Distributed and Network-Based Processing, pages 395–402, 2007.
[79] S. Shakkottai, R. Srikant, and N. Shroff. Unreliable sensor grid: Coverage, con-nectivity and diameter. In IEEE Societies Twenty-Second Annual Joint Conferenceof the IEEE Computer and Communications (INFOCOM 2003), volume 2, pages1073– 1083, April 2003.
[80] Akhilesh Shrestha, Liudong Xing, and Hong Liu. Infrastructure communicationreliability of wireless sensor networks. In proc. Of the 2nd IEEE International sym-posium on dependable, automatic and secure computing (DASC06), pages 250–257,October 2006.
[81] Amit Sinha and Anantha Chandrakasan. Dynamic Power Management in SensorNetworks, chapter 14. CRC Press LLC, 2006.
[82] Primoz Skraba, Hamid Aghajan, and Ahmad Bahai. Cross-layer optimization forhigh density sensor networks: Distributive passive routing decisions. In Ioanis Niko-laidis, Michel Barbeau, and Evangelos Kranakis, editors, Third International Con-ference on Ad Hoc Networks and Wireless Self Organizing Systems, Ad-Hoc NOW,volume 3158 of Lecture Notes in Computer Science. Springer, 2004.
[83] Mike Slavik, Imad Mahgoub, Ahmed Badi, and Fadi Sibai. A functional componentbased framework for cross-layer design. In Proceedings of the 4th International Con-ference on Innovations in Information Technology (Innovations07), pages 372–376,November 2007.
[84] Mike Slavik, Imad Mahgoub, Ahmed Badi, and Fadi Sibai. A Cross-Layer DesignFramework using Functional Components, volume 4, pages 24–35. IGI Global, 2008.
169

[85] S. Soro and W. B. Heinzelman. Cluster head election techniques for coverage preser-vation in wireless sensor networks. Ad Hoc Networks, 7(5):955–972, July 2008.
[86] F. Stann and J. Hheidemann. Rmst: Reliable data transport in sensor networks. InIEEE International Conference on Sensor Net Protocols and Applications (SNPA),pages 102–112, 2003.
[87] W. Su and T.L Lim. Cross-layer design and optimization for wireless sensor net-works. In Proceedings of the Seventh ACIS International Conference on SoftwareEngineering, Artificial Intelligence, Networking, and Parallel/Distributed Comput-ing (SNPD’06), pages 278–284, June 2006.
[88] Weilian Su, Erdal Cayirci, and Ozgur B. Akan. Overview of Communication Proto-cols for Sensor Networks, chapter 4. CRC Press LLC, 2006.
[89] Trishla Sutaria, Imad Mahgoub, Ali Humos, and Ahmed Badi. Implementation ofan energy model for jist/swans wireless network simulator. In Proceedings of theSixth International Conference on Networking (ICN’07), page 24, April 2007.
[90] Veerendra Tippanagoudar, Imad Mahgoub, and Ahmed Badi. Implementation ofthe sensor-mac protocol for the jist/swans simulator. In Proceedings of IEEE/ACSInternational Conference on Computer Systems and Applications (AICCSA ’07),pages 225–232, May 2007.
[91] T. van Dam and K. Langendoen. An adaptive energy-efficient mac protocol forwireless sensor networks. ACM 1st international conference on Embedded networkedsensor systems, page 171180, 2003.
[92] Lodewijk van Hoesel, Tim Nieberg, Jian Wu, and Paul J. M. Havinga. Prolongingthe lifetime of wireless sensor networks by cross-layer interaction. IEEE WirelessCommunications, 11(6):78–86, 2004.
[93] A. Varga. Omnet++ documentation. http://www.omnetpp.org.
[94] Peter Volgyesi, Andras Nadas, Akos Ledeczi, and Karoly Molnar. Reliable multihopbulk transfer service for wireless sensor networks. In Proceedings of the IEEE 13thAnnual International Symposium and Workshop on Engineering of Computer BasedSystems (ECBS 2006), pages 112 – 122. IEEE, 2006.
[95] Mehmet Vuran, Vehbi Gungor, and Ozgur Akan. On the interdependence of conges-tion and contention in wireless sensor networks. In ACM 3rd International Workshop
170

on Measurement, Modeling, and Performance Analysis of Wireless Sensor Networks(SenMetrics 2005), page 897=909, 2005.
[96] Mehmet C. Vuran and Ian F. Akyildiz. Cross-layer analysis of error control inwireless sensor networks. In Proceedings of the 3rd Annual IEEE CommunicationsSociety Conference on Mesh, Sensor and Ad Hoc Communications and Networks(SECON 06), pages 585–594, September 2006.
[97] C. Wan, A. T. Campbell, and L. Krishnamurthy. Reliable transport for sensor net-works: PSFQ Pump slowly fetch quickly paradigm, pages 153–182. Kluwer AcademicPublishers, 2004.
[98] Li-Chun Wang, Chuan-Ming Liu, and Chung-Wei Wang. Optimizing the number ofclusters in a wireless sensor network using cross-layer analysis. In IEEE InternationalConference on Mobile Ad-hoc and Sensor Systems, pages 585–587, October 2004.
[99] Brett Warneke. Miniaturizing Sensor Networks with MEMS, chapter 5. CRC PressLLC, 2006.
[100] Andreas Willig and Holger Karl. Data transport reliability in wireless sensornetworks-a survey of issues and solutions. Praxis der Informationsverarbeitung undKommunikation, 28(2):86–92, June 2005.
[101] A. Woo, T. Tong, and D. Culler. Taming the underlying challenges of reliablemultihop routing in sensor networks. In Proc. ACM Sensys,2003, pages 14–27, 2003.
[102] W. Ye, J. Heidemann, and D. Estrin. An energy-efficient mac protocol for wirelesssensor networks. IEEE INFOCOM, 3:1567 1576, June 2002.
[103] Y. Yu, R. Govindan, and D. Estrin. Geographical and energy aware routing: arecursive data dissemination protocol for wireless sensor networks. Technical report,UCLA Computer Science Department Technical Report UCLA/CSD-TR-01-0023,May 2001.
[104] Jun Yuan and Wei Yu. Distributed cross-layer optimization of wireless sensor net-works: A game theoretic approach. In IEEE Global Telecommunications Conference(GLOBECOM ’06), pages 1–5, 2006.
[105] Bernard P. Zeigler and Saurabh Mittal. Modeling and simulation of ultra-large networks: A framework for new research directions. Technical Report:http://www.acims.arizona.edu/ EVENTS/ULN/ULNdoc2.pdf, 2002.
171

[106] H. Zhang, A. Arora, Y. Choi, and M. G. Gouda. Reliable bursty convergecast inwireless sensor networks. In Proceedings of the 6th ACM International Symposiumon Mobile Ad Hoc Networking and Computing (MobiHoc), page 266276, 2005.
[107] M. Zorzi and R. R. Rao. Geographic random forwarding (geraf) for ad hoc andsensor networks: energy and latency performance. IEEE Transactions on MobileComputing, 2(4):349–365, 2003.
[108] M. Zorzi and R. R. Rao. Geographic random forwarding (geraf) for ad hoc andsensor networks: multihop performance. IEEE Transactions on Mobile Computing,2(4):337–348, 2003.
172