reliability of scores on the summative performance · pdf filereliability of scores on the...
TRANSCRIPT
Reliability of Scores on the Summative Performance Assessments
Yanyun YangAlbert OosterhofYan Xia
January 2013194
131
secondary colors
1245
1205Center for Advancement of Learning and Assessment
Florida State University, Tallahassee, FLwww.cala.fsu.edu
Reliability of Scores on the Summative Performance Assessments
Yanyun Yang Educational Psychology and Learning Systems College of Education 3204-H Stone Building 1114 W. Call Street Florida State University Tallahassee, FL 32306-4459 [email protected] Albert Oosterhof and Yan Xia Center for Advancement of Learning and Assessment 210-B Sliger Building 2035 E. Paul Dirac Drive Florida State University Tallahassee, FL 32306-2801 [email protected] [email protected]
Reliability of Scores on the Summative Performance Assessments
Center for Advancement of Learning and Assessment 2
Acknowledgments
The work reported in this paper is supported through a grant from Education Research Programs at the Institute of Education Sciences (IES), award number R305A110121, administered by the U.S. Department of Education. Faranak Rohani is the principal investigator for this research. Related information is available at http://www.cala.fsu.edu/ies/. Findings and opinions do not reflect the positions or policies of IES or the U.S. Department of Education. Copyright © 2013 by the Center for Advancement of Learning and Assessment, Florida State University. All rights reserved. Cover photo by Bastien Vaucher
Reliability of Scores on the Summative Performance Assessments
Center for Advancement of Learning and Assessment 3
Reliability of Scores on the Summative Performance Assessments
Yanyun Yang, Albert Oosterhof, and Yan Xia
Background
This paper addresses the reliability of scores obtained on the summative performance assessments during the pilot year of our research. Among other activities, our research project includes a series of performance assessments independently developed and scored by teachers and CALA researchers, referred to respectively as internal and external assessments. The teachers and CALA researchers developed their assessments from the same set of performance assessment specifications.
During the project’s first year, four seventh-grade science teachers (two from each of the two pilot middle schools) developed performance assessments from four specifications. The teachers within each school worked collaboratively, but each produced two sets of formative and summative assessments to be used with their own students. Each teacher’s students completed the two summative assessments developed by their teacher, and also the two external summative assessments that were developed from the same specifications. Teachers at each school scored the summative assessments they developed and the ones developed by the other teacher; therefore, each internal assessment was scored by two teachers. The corresponding external assessments were also scored by raters, but in that case, by two CALA researchers. This paper reports the results of an analysis of inconsistencies associated with two facets relevant to the summative assessments: inconsistencies between raters and inconsistencies associated with agents. The “rater” facet is one widely used in generalizability studies involving subjectively scored performance assessments. The “agent” facet pertains to inconsistencies in measurement associated with teachers and CALA researchers independently developing and scoring their own summative assessments, albeit from the same specifications. Two agents are involved: the internal (teachers) and the external (CALA researchers).
Reliability is concerned with the consistency of a measure. A measure is said to be reliable if it produces consistent scores across similar circumstances. Consistency within scores is an important consideration when interpreting performance on an assessment. If an individual has not changed with respect to a particular trait, that individual’s score on a test used to measure that trait also should not change. For instance, different raters scoring a complex performance assessment should assign the same score to each student’s performance, since any difference in scores assigned by the raters is the result of something other than changes in the student’s proficiency with the trait being assessed. Likewise, if the specific task used in a performance assessment is changed, but these alternate tasks supposedly measure the same trait, then using either of the alternate tasks should again result in a student receiving the same score, since changing the task does not alter the student’s proficiency with the trait that the comparable tasks are expected to measure.
The reliability of scores represents a continuum, ranging from very low or even zero to very high or conceivably even perfect consistency. Degree of consistency is often expressed using a reliability coefficient that ranges from 0.00 to represent no consistency to 1.00 to

Reliability of Scores on the Summative Performance Assessments
Center for Advancement of Learning and Assessment 4
represent perfect consistency. An important consideration in educational measurement is developing and using assessments whose reliability coefficients are close enough to 1.00 that scores on the assessments are interpretable and usable. The question of how close has to be answered within the context of multiple issues, such as the significance of the assessment with respect to its use and what is reasonable or obtainable with respect to reliability. This is not unlike the signal versus noise consideration in electronic measurements such as with audio recordings. Noise is undesirable but always present. If noise is too high relative to the signal, the signal becomes unusable. The amount of noise that is acceptable depends on how the signal is being used and on the reasonableness of obtaining a particular low level of noise.
High reliability is desirable, since inconsistency at the very least complicates the interpretation of scores. Specifically, if something other than the trait to be measured is influencing scores obtained through an assessment, this has direct implications to the assessment’s validity because a factor other than that which is supposed to be measured is influencing performance on the assessment. Evaluating the reliability of scores is an essential aspect of interpreting and using assessments. Again, perfect reliability is likely unobtainable. Also, high reliability, and even perfect reliability, by itself does not verify that an assessment is measuring the trait being targeted by the assessment. However, a high degree of consistency is an important enabler that facilitates obtaining valid assessments.
Among the different options for analyzing inconsistency within test scores, classical test theory (CTT) provides historically the earliest and most frequently used approach. It assumes that an observed score (X) is the sum of the true score (T) and a random error score (E) (Feldt & Brennan, 1989). That is,
X=T+E.
With the true and error score components of observed scores being independent of each other, the variance in scores on a test can be thought of as literally the sum of its true and error variances:
. Within this framework, a reliability coefficient is the proportion of observed variance that is true variance, or
22
2T
XTX
σρσ
= .
True variance is the variability of test scores with inconsistency removed. An individual’s true score cannot be directly observed or measured, and a variety of ways are used to estimate the reliability coefficient, including the use of parallel forms and internal consistency reliability.
Reliability of Scores on the Summative Performance Assessments
Center for Advancement of Learning and Assessment 5
With CTT, all sources of inconsistency are considered as a whole and not differentiated. CTT, therefore, limits the possibility to disentangle the sources of inconsistency and is not able to determine which source contributes the most to the inconsistency. Generalizability theory (G-theory) provides an alternate statistical framework for conceptualizing and analyzing the reliability of scores. Using analysis of variance (ANOVA) techniques, G-theory estimates separate variance components, thus providing the potential to differentiate various sources of inconsistency (Cronbach, Rajaratnam, & Gleser, 1963). In addition, it provides estimates of variance associated with each source of errors and their interactions. With performance assessments, for instance, inconsistencies associated with using alternate tasks, raters, and their interaction can be estimated in one analysis. Using G-theory, one can separate the error variances into their multiple sources, which can help determine specific aspects of a complex assessment that needs improvement. For this reason, G-theory is often used when examining the sources of inconsistencies within performance assessments.
G-theory uses the term “facet” to refer to a source of variation of scores. Facet is analogous to a factor in the ANOVA terminology. Task could be a facet if we are interested in generalizing students’ performance assessment from a set of tasks to a larger set of tasks. Each facet is composed of multiple levels. For instance, a rater facet has two levels if each individual student is rated by two raters. Two facets, A and B, are crossed (A×B) if for each level of facet A, all levels of facet B have been observed, and vice versa. Facet A is nested within facet B (A:B) if one or more levels of facet A appear with only one level of facet B. If two raters provide ratings on the first occasion and the other two raters provide ratings on the second occasion, then the rater facet is nested within the occasion facet. Furthermore, a facet might be fixed or random. It is fixed if the number of levels in its universe equals the number of levels in the data set. For a fixed facet, we do not infer the results to a larger population of facet levels because the whole population of levels is inclusively considered in the data set. Gender, for example, is a typical fixed facet. On the other hand, a facet is random if the number of levels in its universe is greater than the number of levels in the data set, and researchers are interested in generalizing the results from the chosen levels to a wider range of levels. In a generalizability study, each of these considerations has computational implications.
Specific sources of inconsistency included in an analysis depend on what data are available. For example, a rater facet can be included only if scores derived by multiple raters are available. Also, nontraditional facets can be included. In addition to a rater facet, our analysis includes what we refer to as an agent facet. Students in our study completed similar tasks created and scored by two different agents: their classroom teacher and the researchers who represent an agency external to the school. Analyzing inconsistencies associated with an agent facet is important to our research since one of the questions we are examining is whether teachers and an external agent can independently produce and score comparable performance assessments if these assessments are developed from a common specification.
In the current stage of our study, the agent and rater facets were considered. The agent facet consisted of two levels with teachers (the internal agent) and researchers (the external agent) each developing tasks based on a set of common specifications. Since we were interested in examining whether results based on those two agents’ assessments could help validate each other and only these two agents were of interest, agent was considered a fixed facet. Within each agent level, two raters, i.e., two teachers for the teacher agent and two researchers for the researcher agent, scored students’ performance on the respective assessment tasks. Therefore, the rater facet also involved two levels and was nested within the agent facet. Since there exist essentially an
Reliability of Scores on the Summative Performance Assessments
Center for Advancement of Learning and Assessment 6
infinite number of raters, and we were interested in the generalizability of the two raters to the universe of the rater facet, we considered the rater facet as random.
As with CTT, G-theory implies that each test score includes an error component and an error-free value that characterizes the examinee at the time of testing. In CTT, this error-free value is referred to as a person’s true score; with G-theory the comparable concept is called the universe score (American Educational Research Association, 1999). Similar to reliability coefficients in CTT, G-theory provides a summary statistic referred to as a generalizability coefficient (G-coefficient) that ranges from 0 to 1. Analogous to reliability coefficients, a G-coefficient estimates the proportion of observed score variance that is attributable to the variance of people’s true or universe scores (see equations 4 and 5 in the later section). In the context of traditional reliability coefficients, Nunnally (1978) considered coefficients greater than 0.80 to be desirable and 0.70 to be minimal.
G-theory can be used in the context of both relative and absolute decisions. Relative decisions involve norm-referenced interpretations such as those associated with the Graduate Record Examination. Correlational studies rely on relative decisions because they are concerned with the relative position of individuals on variables. Absolute decisions pertain to criterion or domain-referenced interpretations such as those associated with driver’s license tests. Shavelson and Webb (2004) described how the context of relative versus absolute decisions influences which variance components are included in the analysis. For instance, altering the difficulty of test items used to measure a particular trait would influence absolute but not relative scores on the test; that is, the overall percentage scores on the test will change but not the percentile scores. Using items of different difficulty does not change individuals’ proficiency with the trait being measured; therefore, associated changes in scores would be represented as error variance that occurs with absolute but not relative decisions based on the scores. This difference as to which error components influence the relative error variance or absolute error variance is represented later in this paper through the contrast of equations 2 and 3.
As with our analysis, a generalizability study (G-study) is often followed by what is referred to as a decision study (D-study). Whereas a G-study analyzes observed scores in terms of their universe and error components, a D-study uses this information to ask what would happen if particular aspects of the G-study are changed. For instance, how many raters or how many tasks would be needed to obtain a G-coefficient greater than 0.80?
The present G-study is based on data obtained during the first year or pilot phase of our study. Four middle-school science teachers and their students from 2 schools were involved. During the second and third years of the project, 10 teachers and students from 5 schools are involved.
Methods
Participants Two middle schools in the northern region (Panhandle) of Florida were selected as
research sites for the first year. In each school, two 7th-grade science teachers and their students were selected to participate in the study. Written parental consent was required for students to participate. The numbers of students who participated were 20, 11, 21, and 23 for these 4 classes.
Reliability of Scores on the Summative Performance Assessments
Center for Advancement of Learning and Assessment 7
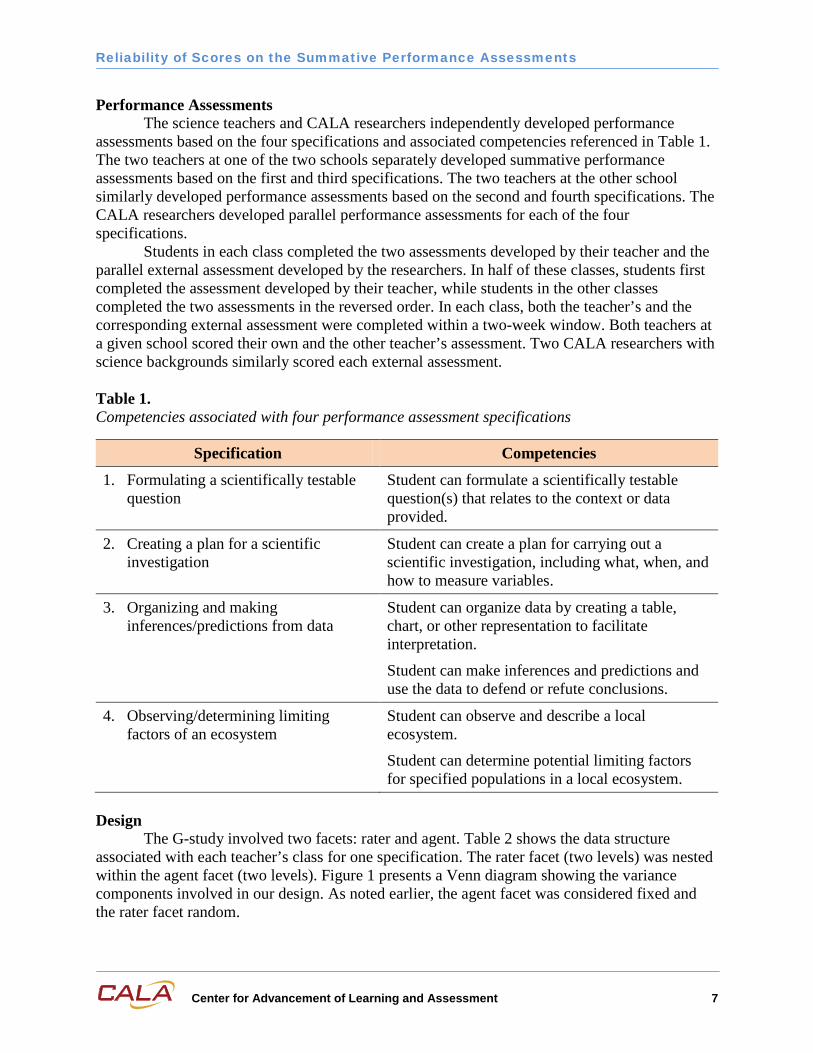
Performance Assessments The science teachers and CALA researchers independently developed performance
assessments based on the four specifications and associated competencies referenced in Table 1. The two teachers at one of the two schools separately developed summative performance assessments based on the first and third specifications. The two teachers at the other school similarly developed performance assessments based on the second and fourth specifications. The CALA researchers developed parallel performance assessments for each of the four specifications.
Students in each class completed the two assessments developed by their teacher and the parallel external assessment developed by the researchers. In half of these classes, students first completed the assessment developed by their teacher, while students in the other classes completed the two assessments in the reversed order. In each class, both the teacher’s and the corresponding external assessment were completed within a two-week window. Both teachers at a given school scored their own and the other teacher’s assessment. Two CALA researchers with science backgrounds similarly scored each external assessment.
Table 1. Competencies associated with four performance assessment specifications
Specification Competencies
1. Formulating a scientifically testable question
Student can formulate a scientifically testable question(s) that relates to the context or data provided.
2. Creating a plan for a scientific investigation
Student can create a plan for carrying out a scientific investigation, including what, when, and how to measure variables.
3. Organizing and making inferences/predictions from data
Student can organize data by creating a table, chart, or other representation to facilitate interpretation.
Student can make inferences and predictions and use the data to defend or refute conclusions.
4. Observing/determining limiting factors of an ecosystem
Student can observe and describe a local ecosystem.
Student can determine potential limiting factors for specified populations in a local ecosystem.
Design
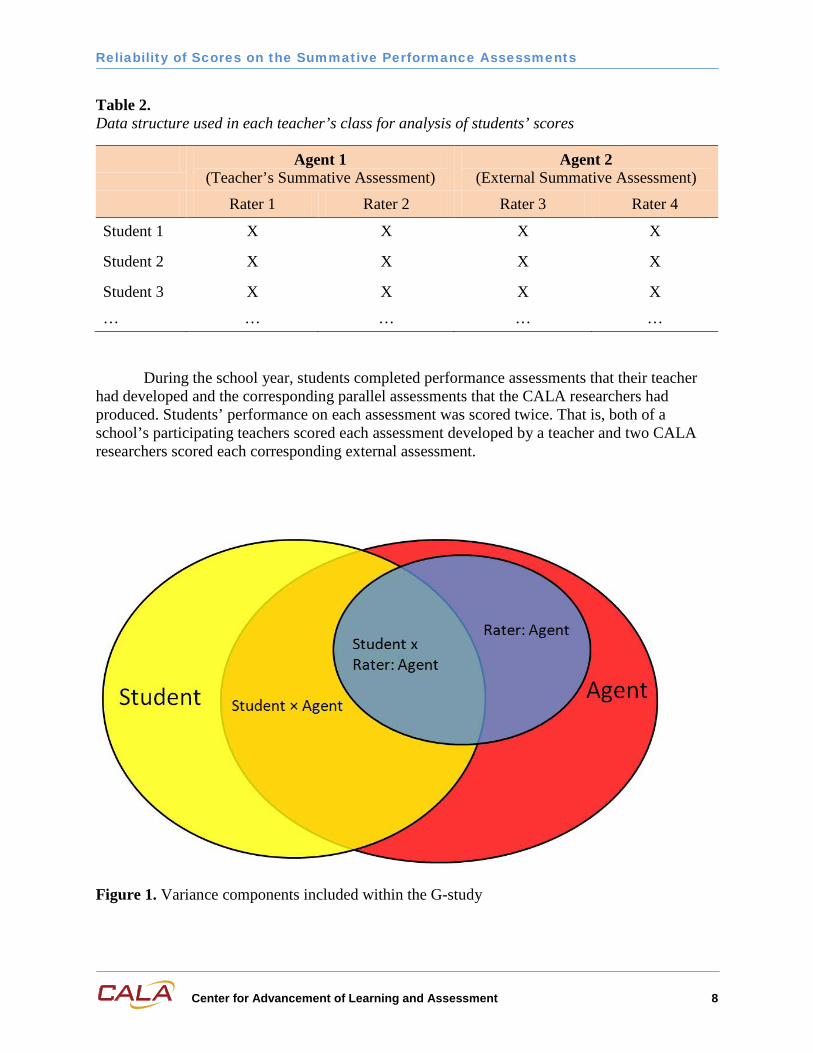
The G-study involved two facets: rater and agent. Table 2 shows the data structure associated with each teacher’s class for one specification. The rater facet (two levels) was nested within the agent facet (two levels). Figure 1 presents a Venn diagram showing the variance components involved in our design. As noted earlier, the agent facet was considered fixed and the rater facet random.
Reliability of Scores on the Summative Performance Assessments
Center for Advancement of Learning and Assessment 8
Table 2. Data structure used in each teacher’s class for analysis of students’ scores
Agent 1 (Teacher’s Summative Assessment)
Agent 2 (External Summative Assessment)
Rater 1 Rater 2 Rater 3 Rater 4
Student 1 X X X X
Student 2 X X X X
Student 3 X X X X
… … … … …
During the school year, students completed performance assessments that their teacher had developed and the corresponding parallel assessments that the CALA researchers had produced. Students’ performance on each assessment was scored twice. That is, both of a school’s participating teachers scored each assessment developed by a teacher and two CALA researchers scored each corresponding external assessment.
Figure 1. Variance components included within the G-study
Reliability of Scores on the Summative Performance Assessments
Center for Advancement of Learning and Assessment 9
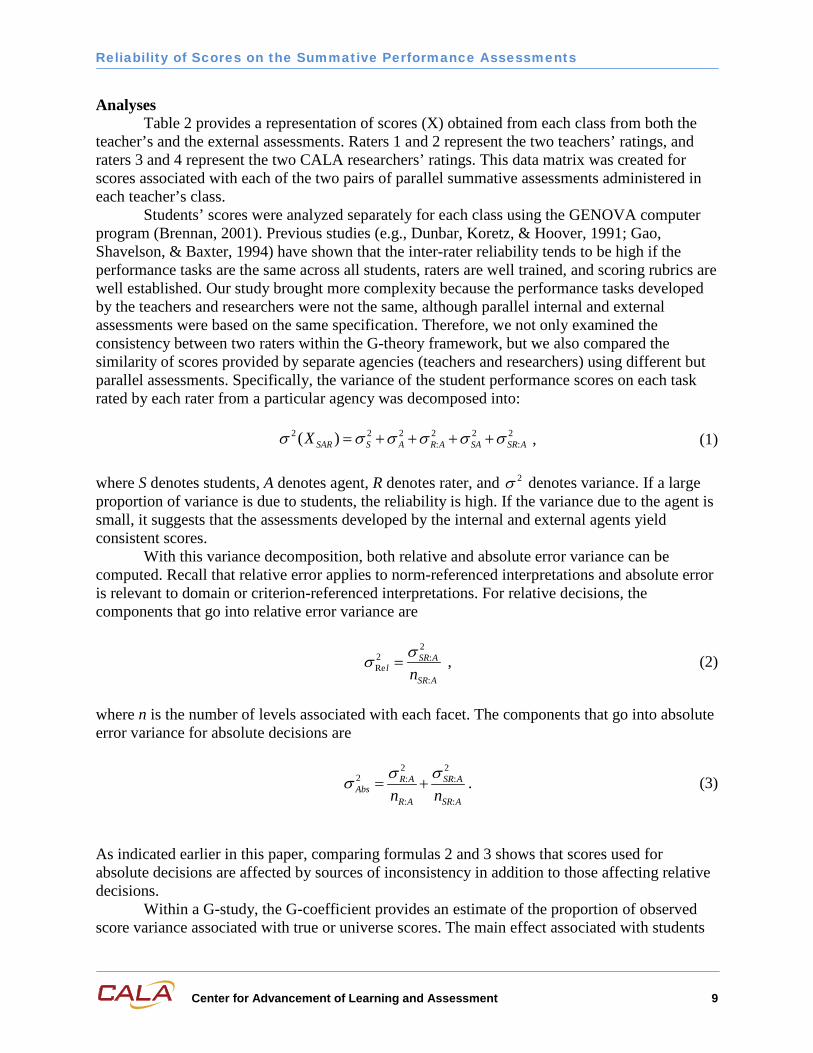
Analyses Table 2 provides a representation of scores (X) obtained from each class from both the
teacher’s and the external assessments. Raters 1 and 2 represent the two teachers’ ratings, and raters 3 and 4 represent the two CALA researchers’ ratings. This data matrix was created for scores associated with each of the two pairs of parallel summative assessments administered in each teacher’s class.
Students’ scores were analyzed separately for each class using the GENOVA computer program (Brennan, 2001). Previous studies (e.g., Dunbar, Koretz, & Hoover, 1991; Gao, Shavelson, & Baxter, 1994) have shown that the inter-rater reliability tends to be high if the performance tasks are the same across all students, raters are well trained, and scoring rubrics are well established. Our study brought more complexity because the performance tasks developed by the teachers and researchers were not the same, although parallel internal and external assessments were based on the same specification. Therefore, we not only examined the consistency between two raters within the G-theory framework, but we also compared the similarity of scores provided by separate agencies (teachers and researchers) using different but parallel assessments. Specifically, the variance of the student performance scores on each task rated by each rater from a particular agency was decomposed into:
, (1)
where S denotes students, A denotes agent, R denotes rater, and denotes variance. If a large proportion of variance is due to students, the reliability is high. If the variance due to the agent is small, it suggests that the assessments developed by the internal and external agents yield consistent scores.
With this variance decomposition, both relative and absolute error variance can be computed. Recall that relative error applies to norm-referenced interpretations and absolute error is relevant to domain or criterion-referenced interpretations. For relative decisions, the components that go into relative error variance are
22 :Re
:
SR Al
SR Anσσ = , (2)
where n is the number of levels associated with each facet. The components that go into absolute error variance for absolute decisions are
2 22 : :
: :
R A SR AAbs
R A SR An nσ σσ = + . (3)
As indicated earlier in this paper, comparing formulas 2 and 3 shows that scores used for absolute decisions are affected by sources of inconsistency in addition to those affecting relative decisions.
Within a G-study, the G-coefficient provides an estimate of the proportion of observed score variance associated with true or universe scores. The main effect associated with students
2 2 2 2 2 2: :( )SAR S A R A SA SR AXσ σ σ σ σ σ= + + + +
2σ
Reliability of Scores on the Summative Performance Assessments
Center for Advancement of Learning and Assessment 10
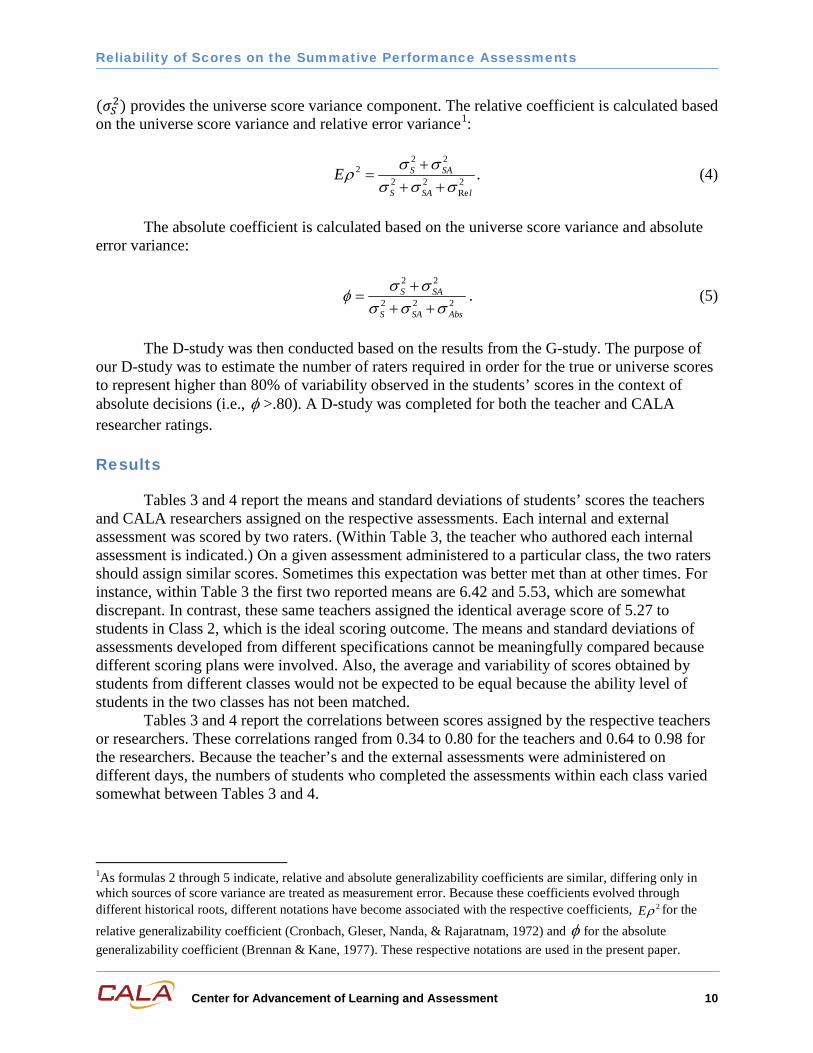
(𝜎𝑆2) provides the universe score variance component. The relative coefficient is calculated based on the universe score variance and relative error variance1
:
2 22
2 2 2Re
.S SA
S SA l
E σ σρσ σ σ
+=
+ + (4)
The absolute coefficient is calculated based on the universe score variance and absolute
error variance:
2 2
2 2 2S SA
S SA Abs
σ σφσ σ σ
+=
+ +. (5)
The D-study was then conducted based on the results from the G-study. The purpose of
our D-study was to estimate the number of raters required in order for the true or universe scores to represent higher than 80% of variability observed in the students’ scores in the context of absolute decisions (i.e., φ >.80). A D-study was completed for both the teacher and CALA researcher ratings.
Results
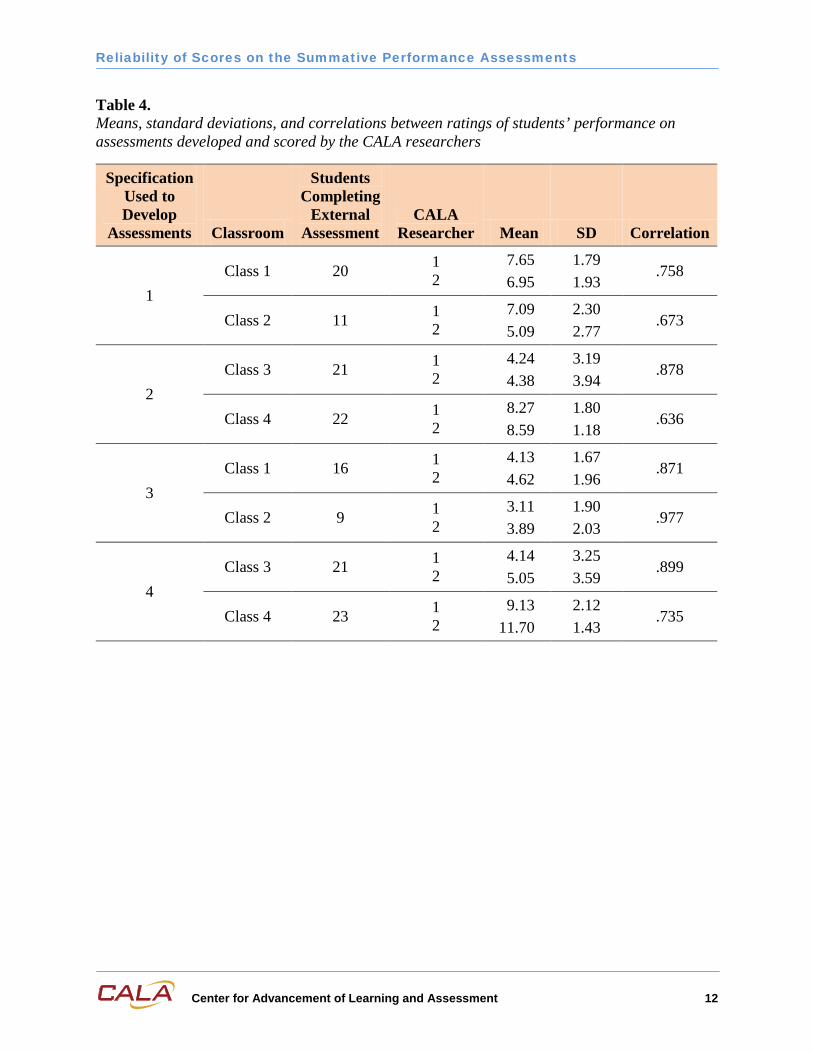
Tables 3 and 4 report the means and standard deviations of students’ scores the teachers and CALA researchers assigned on the respective assessments. Each internal and external assessment was scored by two raters. (Within Table 3, the teacher who authored each internal assessment is indicated.) On a given assessment administered to a particular class, the two raters should assign similar scores. Sometimes this expectation was better met than at other times. For instance, within Table 3 the first two reported means are 6.42 and 5.53, which are somewhat discrepant. In contrast, these same teachers assigned the identical average score of 5.27 to students in Class 2, which is the ideal scoring outcome. The means and standard deviations of assessments developed from different specifications cannot be meaningfully compared because different scoring plans were involved. Also, the average and variability of scores obtained by students from different classes would not be expected to be equal because the ability level of students in the two classes has not been matched.
Tables 3 and 4 report the correlations between scores assigned by the respective teachers or researchers. These correlations ranged from 0.34 to 0.80 for the teachers and 0.64 to 0.98 for the researchers. Because the teacher’s and the external assessments were administered on different days, the numbers of students who completed the assessments within each class varied somewhat between Tables 3 and 4.
1As formulas 2 through 5 indicate, relative and absolute generalizability coefficients are similar, differing only in which sources of score variance are treated as measurement error. Because these coefficients evolved through different historical roots, different notations have become associated with the respective coefficients, 2Eρ for the relative generalizability coefficient (Cronbach, Gleser, Nanda, & Rajaratnam, 1972) and φ for the absolute generalizability coefficient (Brennan & Kane, 1977). These respective notations are used in the present paper.

Reliability of Scores on the Summative Performance Assessments
Center for Advancement of Learning and Assessment 11
Table 3. Means, standard deviations, and correlations between ratings of students’ performance on assessments developed and scored by the teachers
Specification Used to Develop
Assessments Classroom
Students Completing
Internal Assessment Teacher Mean SD Correlation
1 Class 1 19 1*
2 6.42 5.53
2.29 2.22
.347
Class 2 11 1 2*
5.27 5.27
2.37 2.53
.802
2 Class 3 21 3*
4 2.19 3.52
1.81 3.27
.720
Class 4 23 3 4*
9.17 10.70
2.06 1.77
.651
3 Class 1 18 1*
2 2.78 3.11
1.77 1.53
.575
Class 2 10 1 2*
2.60 3.20
.97 1.40
.724
4 Class 3 21 3*
4 4.29 4.52
3.21 3.79
.620
Class 4 23 3 4*
11.61 12.13
2.21 1.25
.446
*Teacher who developed the assessment
Reliability of Scores on the Summative Performance Assessments
Center for Advancement of Learning and Assessment 12
Table 4. Means, standard deviations, and correlations between ratings of students’ performance on assessments developed and scored by the CALA researchers
Specification Used to Develop
Assessments Classroom
Students Completing
External Assessment
CALA Researcher Mean SD Correlation
1 Class 1 20 1
2 7.65 6.95
1.79 1.93
.758
Class 2 11 1 2
7.09 5.09
2.30 2.77
.673
2 Class 3 21 1
2 4.24 4.38
3.19 3.94
.878
Class 4 22 1 2
8.27 8.59
1.80 1.18
.636
3 Class 1 16 1
2 4.13 4.62
1.67 1.96
.871
Class 2 9 1 2
3.11 3.89
1.90 2.03
.977
4 Class 3 21 1
2 4.14 5.05
3.25 3.59
.899
Class 4 23 1 2
9.13 11.70
2.12 1.43
.735
Reliability of Scores on the Summative Performance Assessments
Center for Advancement of Learning and Assessment 13
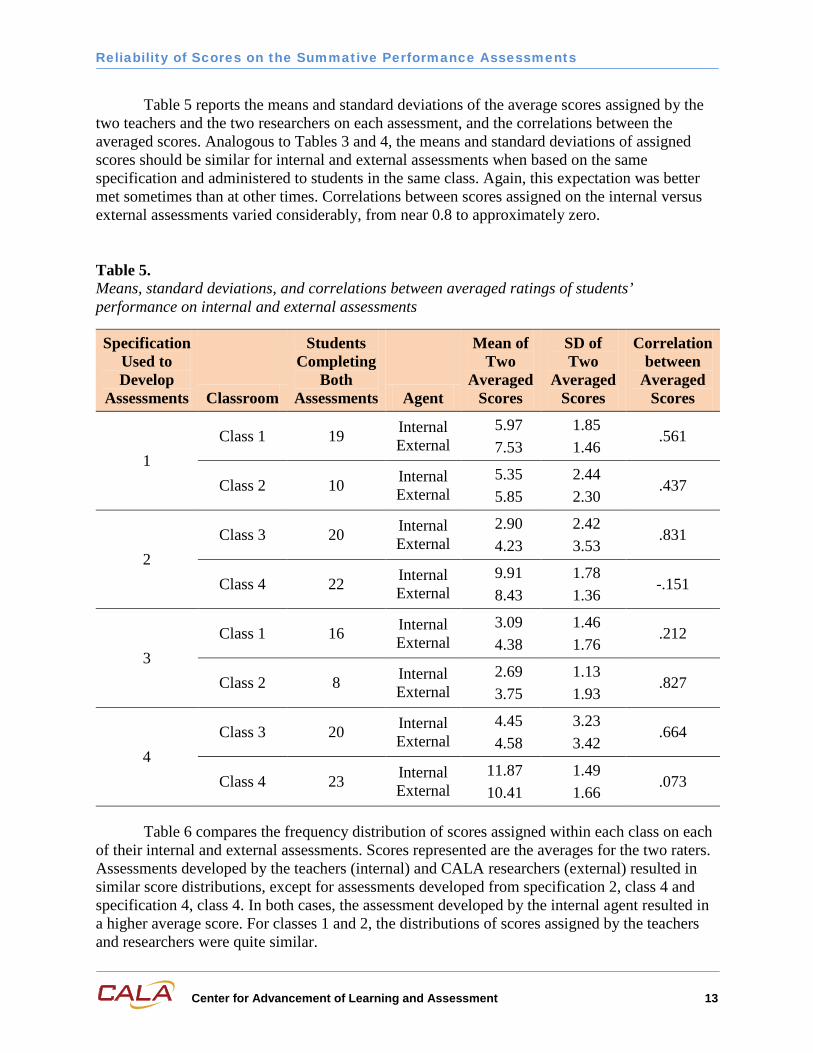
Table 5 reports the means and standard deviations of the average scores assigned by the two teachers and the two researchers on each assessment, and the correlations between the averaged scores. Analogous to Tables 3 and 4, the means and standard deviations of assigned scores should be similar for internal and external assessments when based on the same specification and administered to students in the same class. Again, this expectation was better met sometimes than at other times. Correlations between scores assigned on the internal versus external assessments varied considerably, from near 0.8 to approximately zero.
Table 5. Means, standard deviations, and correlations between averaged ratings of students’ performance on internal and external assessments
Specification Used to Develop
Assessments Classroom
Students Completing
Both Assessments Agent
Mean of Two
Averaged Scores
SD of Two
Averaged Scores
Correlation between
Averaged Scores
1 Class 1 19 Internal
External 5.97 7.53
1.85 1.46
.561
Class 2 10 Internal External
5.35 5.85
2.44 2.30
.437
2 Class 3 20 Internal
External 2.90 4.23
2.42 3.53
.831
Class 4 22 Internal External
9.91 8.43
1.78 1.36
-.151
3 Class 1 16 Internal
External 3.09 4.38
1.46 1.76
.212
Class 2 8 Internal External
2.69 3.75
1.13 1.93
.827
4 Class 3 20 Internal
External 4.45 4.58
3.23 3.42
.664
Class 4 23 Internal External
11.87 10.41
1.49 1.66
.073
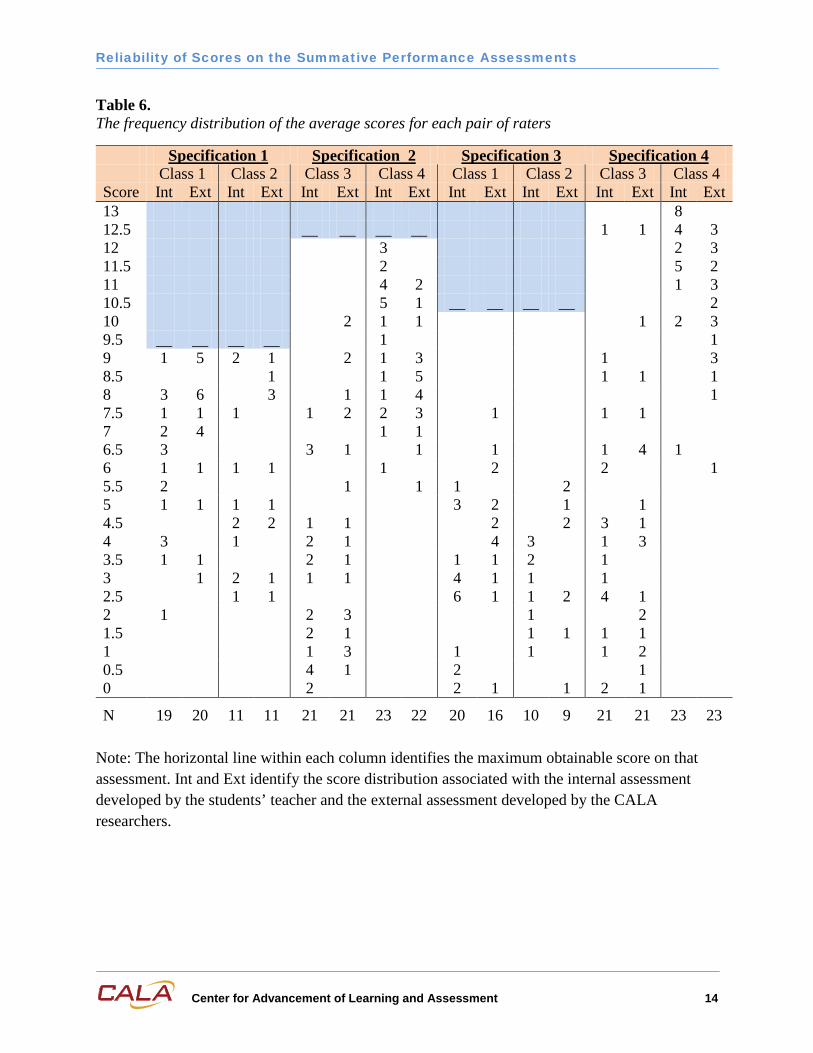
Table 6 compares the frequency distribution of scores assigned within each class on each of their internal and external assessments. Scores represented are the averages for the two raters. Assessments developed by the teachers (internal) and CALA researchers (external) resulted in similar score distributions, except for assessments developed from specification 2, class 4 and specification 4, class 4. In both cases, the assessment developed by the internal agent resulted in a higher average score. For classes 1 and 2, the distributions of scores assigned by the teachers and researchers were quite similar.
Reliability of Scores on the Summative Performance Assessments
Center for Advancement of Learning and Assessment 14
Table 6. The frequency distribution of the average scores for each pair of raters
Specification 1 Specification 2 Specification 3 Specification 4 Class 1 Class 2 Class 3 Class 4 Class 1 Class 2 Class 3 Class 4 Score Int Ext Int Ext Int Ext Int Ext Int Ext Int Ext Int Ext Int Ext 13 8 12.5 __ __ __ __ 1 1 4 3 12 3 2 3 11.5 2 5 2 11 4 2 1 3 10.5 5 1 __ __ __ __ 2 10 2 1 1 1 2 3 9.5 __ __ __ __ 1 1 9 1 5 2 1 2 1 3 1 3 8.5 1 1 5 1 1 1 8 3 6 3 1 1 4 1 7.5 1 1 1 1 2 2 3 1 1 1 7 2 4 1 1 6.5 3 3 1 1 1 1 4 1 6 1 1 1 1 1 2 2 1 5.5 2 1 1 1 2 5 1 1 1 1 3 2 1 1 4.5 2 2 1 1 2 2 3 1 4 3 1 2 1 4 3 1 3 3.5 1 1 2 1 1 1 2 1 3 1 2 1 1 1 4 1 1 1 2.5 1 1 6 1 1 2 4 1 2 1 2 3 1 2 1.5 2 1 1 1 1 1 1 1 3 1 1 1 2 0.5 4 1 2 1 0 2 2 1 1 2 1
N 19 20 11 11 21 21 23 22 20 16 10 9 21 21 23 23
Note: The horizontal line within each column identifies the maximum obtainable score on that assessment. Int and Ext identify the score distribution associated with the internal assessment developed by the students’ teacher and the external assessment developed by the CALA researchers.
Reliability of Scores on the Summative Performance Assessments
Center for Advancement of Learning and Assessment 15
Table 7. The percentages of variance components and G-coefficients
Specification
Variance Components G-Coefficients
Classroom N S% A% R:A% SA% SR:A% Relative Absolute
1 Class 1 19 35.0 11.2 4.1 4.7 44.9 .76 .74
Class 2 10 42.3 0 13.9 28.6 15.3 .92 .85
2 Class 3 20 66.8 2.7 2.8 8.6 19.2 .93 .92
Class 4 22 15.4 7.0 9.9 45.1 22.6 .73 .66
3 Class 1 16 32.0 8.0 0.7 38.3 21.0 .86 .85
Class 2 8 62.4 5.7 5.9 15.9 10.1 .96 .94
4 Class 3 20 62.8 0 1.1 18.3 17.8 .93 .93
Class 4 23 16.7 1.2 28.7 27.0 26.4 .72 .55
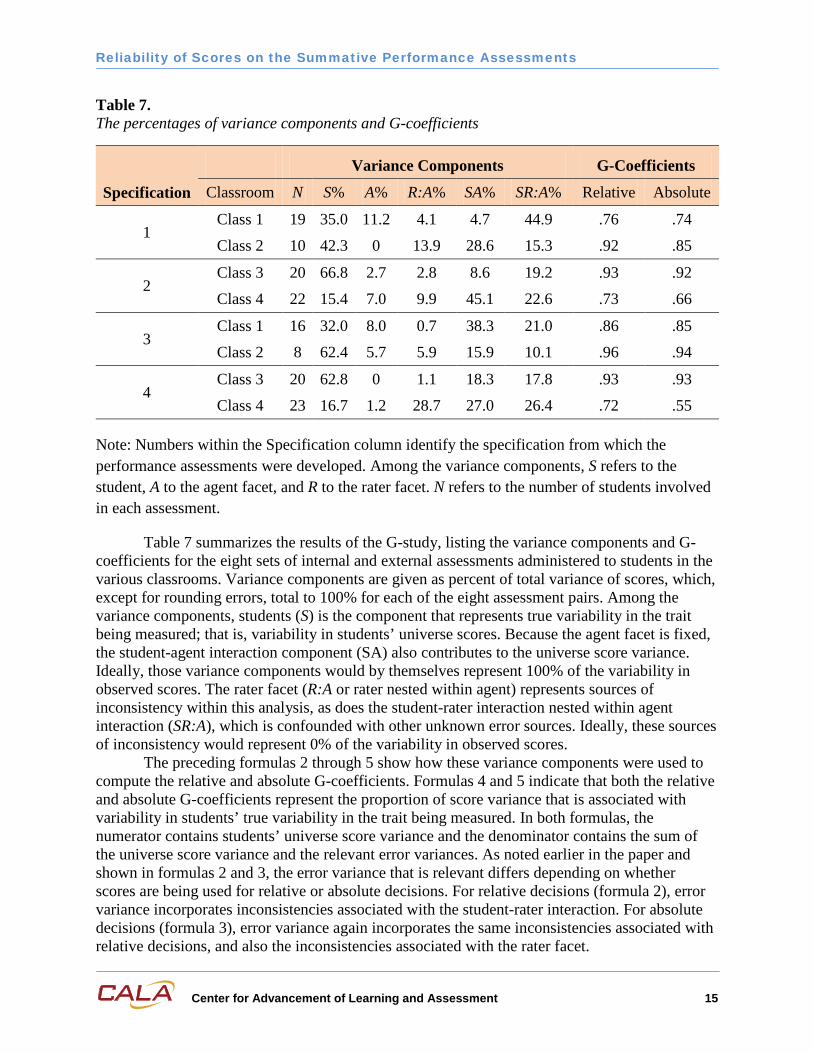
Note: Numbers within the Specification column identify the specification from which the performance assessments were developed. Among the variance components, S refers to the student, A to the agent facet, and R to the rater facet. N refers to the number of students involved in each assessment.
Table 7 summarizes the results of the G-study, listing the variance components and G-coefficients for the eight sets of internal and external assessments administered to students in the various classrooms. Variance components are given as percent of total variance of scores, which, except for rounding errors, total to 100% for each of the eight assessment pairs. Among the variance components, students (S) is the component that represents true variability in the trait being measured; that is, variability in students’ universe scores. Because the agent facet is fixed, the student-agent interaction component (SA) also contributes to the universe score variance. Ideally, those variance components would by themselves represent 100% of the variability in observed scores. The rater facet (R:A or rater nested within agent) represents sources of inconsistency within this analysis, as does the student-rater interaction nested within agent interaction (SR:A), which is confounded with other unknown error sources. Ideally, these sources of inconsistency would represent 0% of the variability in observed scores.
The preceding formulas 2 through 5 show how these variance components were used to compute the relative and absolute G-coefficients. Formulas 4 and 5 indicate that both the relative and absolute G-coefficients represent the proportion of score variance that is associated with variability in students’ true variability in the trait being measured. In both formulas, the numerator contains students’ universe score variance and the denominator contains the sum of the universe score variance and the relevant error variances. As noted earlier in the paper and shown in formulas 2 and 3, the error variance that is relevant differs depending on whether scores are being used for relative or absolute decisions. For relative decisions (formula 2), error variance incorporates inconsistencies associated with the student-rater interaction. For absolute decisions (formula 3), error variance again incorporates the same inconsistencies associated with relative decisions, and also the inconsistencies associated with the rater facet.
Reliability of Scores on the Summative Performance Assessments
Center for Advancement of Learning and Assessment 16
The last two columns of Table 7 present the relative and absolute G-coefficients calculated for each assessment. Among the relative G-coefficients, all are either above or close to 0.80 value, which is the target referenced in our research. Because additional sources of inconsistency are included when scores are used for absolute decisions, the absolute G- coefficients can be no higher and likely are lower than the corresponding relative coefficients. Our absolute G-coefficients range from 0.55 to 0.92 with the middle four being between 0.74 and 0.92. Three of the absolute coefficients are below the referenced 0.80 target.
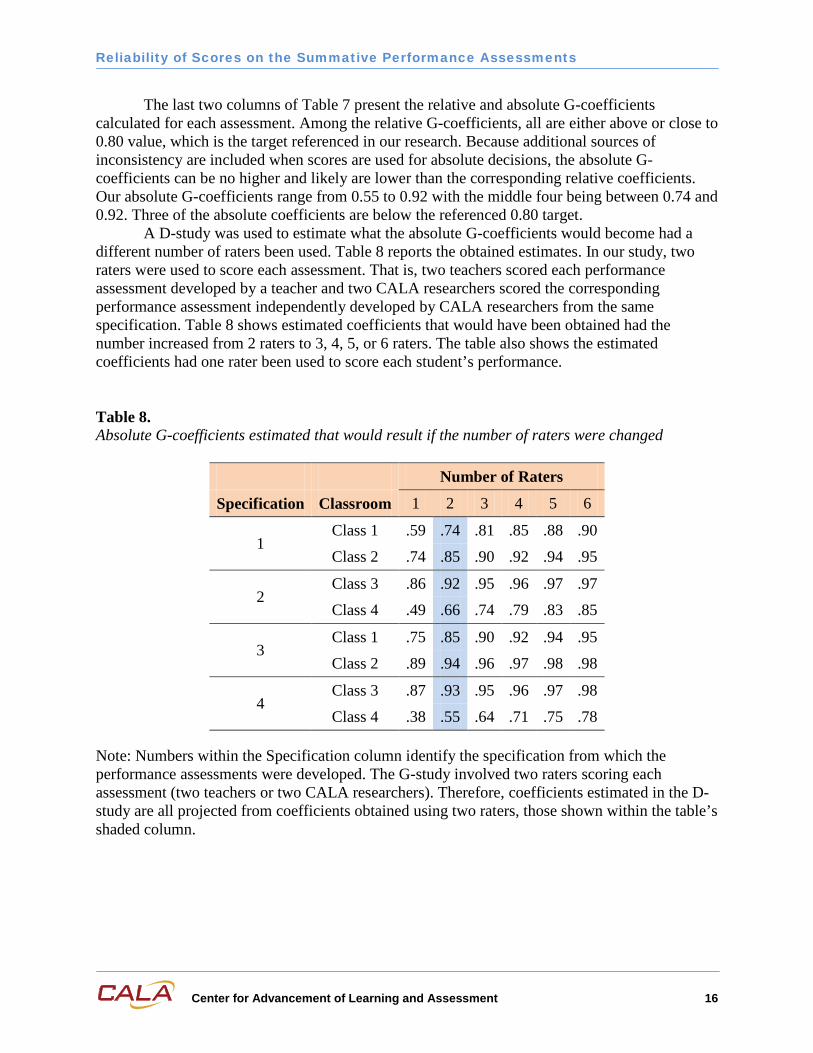
A D-study was used to estimate what the absolute G-coefficients would become had a different number of raters been used. Table 8 reports the obtained estimates. In our study, two raters were used to score each assessment. That is, two teachers scored each performance assessment developed by a teacher and two CALA researchers scored the corresponding performance assessment independently developed by CALA researchers from the same specification. Table 8 shows estimated coefficients that would have been obtained had the number increased from 2 raters to 3, 4, 5, or 6 raters. The table also shows the estimated coefficients had one rater been used to score each student’s performance.
Table 8. Absolute G-coefficients estimated that would result if the number of raters were changed
Number of Raters
Specification Classroom 1 2 3 4 5 6
1 Class 1 .59 .74 .81 .85 .88 .90
Class 2 .74 .85 .90 .92 .94 .95
2 Class 3 .86 .92 .95 .96 .97 .97
Class 4 .49 .66 .74 .79 .83 .85
3 Class 1 .75 .85 .90 .92 .94 .95
Class 2 .89 .94 .96 .97 .98 .98
4 Class 3 .87 .93 .95 .96 .97 .98
Class 4 .38 .55 .64 .71 .75 .78
Note: Numbers within the Specification column identify the specification from which the performance assessments were developed. The G-study involved two raters scoring each assessment (two teachers or two CALA researchers). Therefore, coefficients estimated in the D-study are all projected from coefficients obtained using two raters, those shown within the table’s shaded column.
Reliability of Scores on the Summative Performance Assessments
Center for Advancement of Learning and Assessment 17
Discussion
The present G-study is based on data collected during the first year of our research. Participating students completed both the internally and externally developed summative performance assessments. Two teachers scored each internal assessment and two CALA researchers scored each external assessment. The G-study focused on inconsistencies associated with two facets. The first facet is agent: inconsistency associated with an internal and external agent, which independently developed and scored separate performance assessments, albeit from common specifications. The second facet is rater: either two teachers or two CALA researchers who scored a given student’s performance. This analysis was then supplemented using a D-study technique to estimate what the G-coefficients would have been had the number of raters scoring students’ performance been increased or decreased.
(Subsequent to the pilot year, the number of teachers participating has been expanded to 10 science teachers from 5 schools, the numbers of each teacher’s students included in the study has been increased, and the number of specifications from which performance assessments are being developed has been expanded to 8.)
Comparing the score distributions of alternate test forms is a common technique used to address comparability. The assessment strategy we have been examining involves administering external assessments, such as a statewide assessment to samples of students. Although this would allow substantially expanding use of complex performance assessments, the use of samples would not allow the external assessment to document the competency of individual students. That responsibility would have to be delegated to teachers. This approach requires compatibility between the teachers’ and the external assessments.
Compatibility of assessments is far from being assured in our proposed approach, given that the teachers and the external agent would be independently developing, administering, and scoring their respective assessment tasks. Their respective tasks would be developed from common specifications that describe how assessment tasks are to be selected and how performance is to be scored; however, an important question is whether this would result in comparable scores.
As shown in Table 6, the distributions of students’ scores assigned by the teachers versus the CALA researchers do overall appear to be quite similar. The most dissimilar distributions occurred between the internal and external assessments based on Specification 2, administered to students enrolled in Class 3, and those based on Specification 4, administered to students in Class 4. With the former, the teacher’s assessment resulted in lower scores. In the latter case, the teacher’s assessment resulted in higher scores with a noticeably negative skew.
These distribution comparisons provide promising results related to comparability, particularly given the pilot-level stage at which the present data were collected. These comparisons will be repeated with data obtained during the project’s second and third years. As noted earlier, subsequent analyses will involve greater numbers of students and the assessments will be based on an expanded set of specifications.
The G-studies provide a more detailed picture. Because of the design employed, the G-coefficients reported here are sensitive to inconsistencies associated with raters, an important consideration given the complexity of scoring the assessment tasks, and also inconsistencies attributed to the use of two agent levels, with the internal and external assessments independently developed and scored by different people. Relative and absolute G-coefficients were computed.
Reliability of Scores on the Summative Performance Assessments
Center for Advancement of Learning and Assessment 18
As indicated earlier, Nunnally (1978), in the context of traditional reliability coefficients, considered coefficients greater than 0.80 to be desirable and 0.70 to be minimal. One is not strictly comparing oranges to oranges when relating CTT to G-theory. The former provides broad indications of internal consistency or consistency between alternate forms. G-theory, in contrast, provides a more focused analysis that can be aimed at particular sources of inconsistency or facets. A common quality that traditional and G-coefficients share is they both indicate the proportion of score variance that represents variance in students’ true or universe scores.
Traditional reliability coefficients are more like relative than absolute G-coefficients. Among the eight assessments used in our pilot phase, five of eight relative G-coefficients are greater than 0.80; all are higher than 0.70. Absolute G-coefficients do not have a counterpart among traditional reliability coefficients and are sensitive to additional sources of inconsistencies. For instance, neither traditional reliability coefficient nor relative G-coefficients are affected by inconsistency in students’ percentage scores that can be attributed to using alternate raters or alternate test forms; absolute G-coefficients can detect these inconsistencies. Whether Nunnally’s recommendation should apply equally to traditional coefficients and absolute G-coefficients is debatable. Nevertheless, one certainly should favor minimizing sources of inconsistency in any measurement context. Among the absolute G-coefficients, five of the eight are higher than 0.80; two are below 0.70.
A particular advantage of G-theory is its ability to partition error variance into components. Percentages of error variance associated with the agent and rater facets, including their interactions, are provided in Table 7. Percentages associated with the agent facet main effect are favorably low. This indicates that, overall, providing students two different assessment tasks, both developed from the same specification, did not result in a substantial change in students’ absolute performance. In the present study, detailed specifications were developed to help control the development and scoring of the performance assessments. Teachers and CALA researchers were then trained how to use these specifications. Attention was given to consistent implementation of the established scoring plans.
The G-study found larger percentages of error variance associated with the interaction components. This was true with both the interactions of students with agent and possibly also students with rater. The latter is indeterminable within the present generalizability design because raters are nested within the agent facet. Whether the student-rater interaction is large or not remains unknown since it is mixed with other error sources. This inconsistency possibly is attributed to the different teachers and/or the different CALA researchers. Comparing the correlations in Tables 3 and 4 suggests the CALA researchers were somewhat more consistent as to which students received higher scores than were the teachers, although both teachers’ and CALA researchers’ ratings include instances where correlations departed substantially from unity.
During debriefing, teachers indicated that when scoring their own students, they were sometimes influenced by what they already knew about a student. The teacher who was scoring the other teacher’s assessments would be less able to use that added information. Regardless, using variables outside those established by the assessment’s scoring plan is likely to introduce error variance through inconsistent familiarity with students. Ratings by CALA researchers showed a somewhat similar tendency to go outside the realm of the scoring plan, reading between the lines and allowing insights into a student’s response that the other rater did not see to somewhat influence judgments made in scores assigned. That said, the obtained G-coefficients
Reliability of Scores on the Summative Performance Assessments
Center for Advancement of Learning and Assessment 19
overall are not bad, particularly given the pilot status of the research at the time the present data were collected.
Increasing the number of raters results in very predictable results. Specifically, increasing the number of raters always increases G-coefficients. Also, situations that initially obtained higher G-coefficients continue to be the situations with the higher coefficients as the number of raters is increased. The important question is when sufficiently high generalizability has been realized. The answer is complicated, even when holding aside the issue as to whether the 0.80 standard is applicable to absolute G-coefficients. With one of the assessments administered to Class 4, an absolute G-coefficient above 0.80 was never realized, even when projected to six raters. Reaching any particular standard 100% of the time likely is not achievable unless that standard is set quite low.
Perhaps a more appropriate question would be how often a particular standard should be realized; for instance, above 0.80 seventy percent of the time and above 0.70 ninety percent of the time. (This example is just an illustration, not a recommendation.) As with setting performance standards for student achievement, any standard must be and is heavily influenced by what is realistic. Knowing how much inconsistency is present and prevalent represents a critical issue for sensing the amount of confidence that should be attributed to students’ scores. Taking steps to reduce inconsistency within scores is crucial. Present indications based on our pilot data suggest that the use of assessments that are independently produced and scored by different agencies is not going to be insurmountable with regard to test reliability. Instead, considerable attention must be given to both expectations and training related to utilizing established scoring plans, helping to ensure that criteria specified by the scoring plans are understood and consistently applied across raters.
Looking ahead to ongoing research, G-theory can be used to investigate any source of measurement inconsistency as long as the statistical design and the available data support inclusion of that source. One facet that often is used within generalizability studies is task. That is, were an assessment based on an alternate and equally defensible set of tasks, would similar results be realized? For instance, in our study, we identified 37 essential middle-school science competencies that go unassessed in Florida’s statewide assessments because they cannot be assessed efficiently. Most statewide assessments would probably not include these particular competencies for the same reason. For a subset of these competencies, we subsequently developed specifications that delineated evidence we would use to indicate student proficiency. If alternate but equally defensible evidence statements were used, would conclusions about students’ science proficiency be the same? With large-scale assessments, for group-level analysis (for instance, determining the overall proficiency of middle school students in Florida or even in a particular Florida school district), this likely would not be a concern. Group-level statistics control inconsistency quite easily for the same reason that distributions of sample means have smaller standard deviations than distributions of individual scores. Generalizability across tasks is more difficult to achieve for assessments used to make decisions about individual students.
Our present study does not include a task facet because of the limited number of assessments that we are able to assign to each classroom. This is noted in order to better delineate what we are finding. The particular aspects of generalizability we are examining are critical, and we fortunately are observing results that are positive, particularly given the constraints of the project’s pilot phase. We are finding ways to meaningfully control inconsistencies within complex assessments that relate to rater and agent facets. The latter has not been previously researched and is of particular importance to the broader assessment
Reliability of Scores on the Summative Performance Assessments
Center for Advancement of Learning and Assessment 20
approach we have been examining. The task facet represents an important consideration. Building on present research, we and other researchers will meaningfully address this potential source of inconsistency.
Reliability of Scores on the Summative Performance Assessments
Center for Advancement of Learning and Assessment 21
References American Educational Research Association. (1999). Standards for educational and
psychological testing. Washington, DC: American Psychological Association. Brennan, R. L. (2001). Generalizability theory. New York: Springer-Verlag. Brennan, R. L., & Kane, M. T. (1977). An index of dependability for mastery tests. Journal of
Educational Measurement, 14, 277–289. Cronbach, L. J., Gleser, G. C., Nanda, H., & Rajaratnam, N. (1972). The dependability of
behavioral measurements: Theory of generalizability for scores and profiles. New York: Wiley.
Cronbach, L. J., Rajaratnam, N., & Gleser, G. C. (1963). Theory of generalizability: A liberalization of reliability theory. British Journal of Statistical Psychology, 16(2), 137–163.
Dunbar, S. B., Koretz, D. M., & Hoover, H. D. (1991). Quality control in the development and use of performance assessments. Applied Measurement in Education, 4, 289–303.
Feldt, L. S., & Brennan, R. (1989). Reliability. In R. L. Linn (Ed.), Educational measurement (3rd ed., pp. 105–146). New York: Macmillan.
Gao, X., Shavelson, R. J., & Baxter, G. P. (1994). Generalizability of large-scale performance assessments in science: Promises and problems. Applied Measurement in Education. 7(4), 323–342.
Nunnally, J. C. (1978). Psychometric theory. New York: McGraw-Hill, 2nd edition. Shavelson, R. J. & Webb, N. M. (2004). Generalizability theory. Encyclopedia of Social
Measurement. New York: Academic Press.