“reliability is the precondition for trust.” although a...
TRANSCRIPT


“Reliability is the precondition for trust.” Although a very redundant expression, at SPEL we all strive to be always steady and firm to foster our customers’ most valued input—their trust. Though, being reliable, committed, passionate, and upright at all instances is really hard but of course not impossible! SPEL, for almost four decades has been developing long-term strategic relationships with its customers by providing unparalleled services and uncompromised quality. Thus, asserting to be professionally reliable, no matter what, is a very apt declaration that truly captures the gist of SPEL’s business focus, our great customers!

ContentsVision 2
Overall Strategic Objectives 2
Core Values 4
Company Profile 5
Corporate Information 6
Code of Business Conduct and Ethical Principles 8
Geographical Presence 9
Our Major Products 10
Critical Performance Indicators 11
Calendar of Noteable Events 12
Profile of the Directors 14
Role of Chairman and CEO 19
Awards 21
Board Committees 22
Management Review 24
Cash Flow Statement Direct Method 27
Quarterly Performance Analysis 28
Share Price Sensitivity Analysis 29
Risk and Opportunity Report 30
Duo Pont Analysis 32
Organogram 33
Company Policies 34
Report of the Board Audit Committee 37
Corporate Social Responsibility 38
Directors’ Report To The Shareholders 41
Six Years Financial Information 47
Graphical Representation 50
Vertical Financial Analysis 52
Horizontal Financial Analysis 53
Comments on Financial Analysis 54
Statement of Wealth Generated and Distributed 55
Review Report to the Members 56
Statement of Compliance 57
Financial Statements
Auditors’ Report to The Member 61
Unconsolidated Balance Sheet 62
Unconsolidated Profit and Loss Account 64
Unconsolidated Statement of Comprehensive Income 65
Unconsolidated Statement of Change in Equity 66
Unconsolidated Cash Flow Statement 67
Notes to the Unconsolidated Financial Statements 68
Consolidated Financial Statements
Group Directors’ Report 106
Auditors’ Report on Consolidated Financial Statements 107
Consolidated Balance Sheet 108
Consolidated Profit and Loss Account 110
Consolidated Statement of Comprehensive Income 111
Consolidated Statement of Change in Equity 112
Consolidated Cash Flow Statement 113
Notes to the Consolidated Financial Statements 114
Pattern of Shareholding 149
Notice of AGM 152
Glossary of Terms 154
Directors’ Report (Urdu)
Group Directors’ Report (Urdu)
Form of Proxy
1Annual Report 2016

We are committed to be reliable supplier for our customers by meeting their expectations through innovation, continuous improvement and by utilizing the economic and human resource effectively. We would value our shareholder by effective outlay of resources.
We aim to develop the long term sustainability of the organization by constantly upgrading our technologies, developing and training our employees and committing the ethical and moral business values.
We are focused to be a market leader for the quality products and to grow continuously by adding new products and new customer in our portfolio.
To become Premium Player in the market by building a professional organization, having state of the art technology and expanding product range. Become the most progressive and profitable Company in the sector.
Overall Strategic
Vision
Objectives
2 SPEL | Reliable No Matter What

3Annual Report 2016

Core ValuesFollowing are the core values of SPEL:
CustomerSatisfaction
• On time Delivery• Quality• Quick Response• Relationships• Service and
Support
Respect
• Respect for customers employees and all stakeholders
• Business is about human beings. They want to be treated well.
• CSR is one way to respect our society
Integrity
• Building trust • Honoring
Commitments • Dependability• Staying within
ethical and legal boundaries
• Reward Honesty
Ownership
• Empowerment• Punctuality• Value time• Capability• Responsibility
with authority• Delegation• Train people
for growth and continuous improvement
• Prepare Leaders
Save Environment
• Eliminate waste• Save energy,
water, air and natural resources
4 SPEL | Reliable No Matter What

SPEL is one of the leading manufacturers of technology intensive engineering and plastic products in Pakistan. Initially in 1978, SPEL started its operations as a partnership concern. In 1982, SPEL incorporated as a private limited company and then converted into a public limited company in 2008. The Company got listed on Pakistan Stock Exchange in the year 2015.
SPEL is engaged in manufacturing of following products:
• Automotive Parts• Food and FMCG Packaging• Molds and Dies
Group StructureSPEL owns a wholly owned subsidiary namely SPEL Pharmatec (Private) Limited.
Nature of BusinessSPEL is a manufacturing company and has B2B (Business to Business) relations with most of its customers. It is principally engaged in the manufacturing and sale of plastic parts for the automotive industry, plastic packaging for Food & FMCG industry, and moulds & dies.
The major products of the Company for food and FMCG industry include 19 liter water bottles, shampoo bottles, crates for beverages including yogurt cups, plastic glasses, disposable containers. Auto parts include door trims, door handles, steering wheels, etc. Major Customers of the Company in the auto sector include Toyota, Honda, Suzuki, Massey Ferguson and in the FMCG sector include Nestle, Unilever, Coca Cola, Pepsi, KFC and some overseas customers.
Company Pro�le
5Annual Report 2016

Corporate InformationBoard of DirectorsMr. Almas HyderChairman/Non-Executive Director
Mr. Zia Hyder NaqiChief Executive Officer/ Executive Director
Dr. S. M. NaqiNon-Executive Director
Dr. Syed Salman Ali ShahIndependent Non-Executive Director
Mr. Muhammad Tabassum MunirIndependent Non-Executive Director
Mr. Khawar Anwar KhawajaIndependent Non-Executive Director
Mr. Raza Haider NaqiNon-Executive Director
Mr. Sheikh Naseer HyderNon-Executive Director
Mr. Abid Saleem KhanChief Operating Officer/ Executive Director
CFO & Company SecretaryMr. Khalil Ahmad Hashmi, FCA
Audit CommitteeDr. Syed Salman Ali ShahChairman
Mr. Muhammad Tabassum MunirMember
Mr. Almas HyderMember
Dr. S. M. NaqiMember
Mr. Sheikh Naseer HyderMember
Human Resource & Remuneration CommitteeMr. Almas HyderChairman
Dr. S. M. NaqiMember
Mr. Khawar Anwar KhawajaMember
Mr. Muhammad Tabassum MunirMember
Mr. Zia Hyder NaqiMember
Mr. Abid Saleem KhanMember
Finance CommitteeMr. Almas HyderChairman
Dr. Syed Salman Ali ShahMember
Mr. Khawar Anwar KhawajaMember
Mr. Zia Hyder NaqiMember
Registered Office127-S Quaid-e-Azam Industrial Estate Township,Kot Lakhpat, Lahore.Ph: 042-111-005-005Fax: 042-35118507
Factory4-km Off Feroz Pur Road Raiwind Lilliani Link, Road Pandoki Lahore.
Share RegistrarTHK Associates (Pvt) Ltd2nd Floor State Life Building # 3,Dr. Ziauddin Ahmad Road Karachi.
Statutory AuditorKPMG Taseer Hadi and Co.Chartered Accountants
Head of Internal AuditMr. Abu Bakar, ACA
Tax ConsultantPWC A.F. FergusonChartered Accountants
Legal AdvisorsCornelius, Lane and MuftiAdvocates & Solicitors
BankersAllied Bank LimitedConventional WindowBank Islami Pakistan LimitedIslamic WindowHabib Bank LimitedConventional WindowHabib Metropolitan Bank LimitedConventional Window
MCB Bank Limited Conventional Window
Meezan Bank Limited Islamic Window
Standard Chartered Bank (Pakistan) LimitedConventional Window
United Bank LimitedIslamic WindowNational Bank of PakistanConventional Window
Websitewww.spelgroup.com
Stock SymbolSPEL
6 SPEL | Reliable No Matter What

7Annual Report 2016

SPEL is committed to conduct its business with honesty, integrity and in ethical manner. For this purpose, the Company has developed a code of conduct to manage the Company’s affairs.
The code is intended to set out principles relating to the behavior that should be observed in SPEL.
This code includes the following aspects:
• act with integrity and truthfully• respect each other• work together as a team• comply with all applicable laws and regulations
Code of Business Conduct and Ethical Principles
• never involve in any activity which leads to insiders’ trading
• follow rules and regulations of the Company• maintain work environment free from sexual
harassment• disclose personal interest, if any, in Company’s
matters and avoid conflict of interest• inform any misconduct observed to immediate boss
and management immediately
8 SPEL | Reliable No Matter What

Geographical Presence
Karachi
Lahore
Rawalpindi
Multan
Bahawalpur
Sargodha
Faisalabad
DistributionNetwork
Head Office
Factory
Gujranwala
9Annual Report 2016

Our Major Products
10 SPEL | Reliable No Matter What

Critical Performance Indicators
Sales RevenueRs. in Million
2016 2,32220152,166
DividendRs. / Share
2016 1.5020151.00
Return on CapitalEmployed
Percentage
2016 20%201518%
Pro�t After TaxRs. in Million
2016 3562015230
Gross Pro�tRs. in Million
2016 5822015493
DividendPayout Ratio
Percentage
2016 32.6%201528.7%
Current Ratio
Times
2016 2.1320152.23
Number of SharesOut Standing
(000’s)
2016 77,350201577,350
TotalAssets
Rs. in Million
2016 2,48120152,365
Debt to Equity
Times
2016 0.0620150.11
Breakup ValuePer Share
Rs.
2016 23.74201520.14
Price to Earning Ratio
Times
2016 10.19201515.76
Net AssetsPer Share
Rs.
2016 23.74201520.14
Earning per Share-Basic and Diluted
Rs.
2016 4.6020153.48
ShareholdersEquity
Rs. in Million
2016 1,83620151,558
Market PricePer Share
Rs.
2016 46.90201554.87
11Annual Report 2016

July 15
September 15
September 15
October 15
November 15
December 15Land purchased at Rahim Yar Khan for establishing
a manufacturing facility
Annual accounts approved by the Directors
Election of Directors
Final cash dividend paid to the shareholders
1st Extra Ordinary General Meeting held
QCC Competition held to promote the
culture of continuous improvement
Calender of Noteable EventsFor the Year 2015-16
12 SPEL | Reliable No Matter What

May 16
June 16May 16
May 16Won first position in the Professional
Excellence Award – 2016 from ICAP
Annual Iftar dinner held for all employees of the Company to
promote social relations among the employees
Appreciation Award received from Pak Suzuki
Interim cash dividend paid to shareholders
13Annual Report 2016

Pro�le of The Directors
Mr. Almas Hyder is an Engineering graduate from University of Engineering & Technology, a Certified Trainer of Entrepreneurship and has completed his OPM (Owner/President Management Program) from Harvard Business School. He is currently a member of the Institute of Engineers in Pakistan, Institute of Material in London and Vice President of the Harvard Club of Pakistan.
Mr. Hyder also serves at senior positions for many organizations. His current engagements include:
• Senior Vice President, Lahore Chamber of Commerce & Industries
• Director, Lahore Knowledge Park Company• Director, National Transmission & Dispatch Company
(NTDC) Limited• Director, Punjab Skills Development Funds• Director, SPEL Technology Support (Private) Limited• Director, SPEL Pharmatec (Private) Limited• CEO, Entrepreneurship Development and Advisory
Services (Private) Limited• CEO, AJ Power (Private) Limited• CEO, RT Power (Private) Limited• CEO, MST Power (Private) Limited
To his credit is also the writing of the ‘Engineering Vision 2012 of Pakistan’. He established TUSDEC (Technology Up-gradation and Skills Development Company), where he was the Founder Chairman, under the Ministry of Industries, Production and Special Initiatives.
Mr. Hyder was the first President of the Quaid-e-Azam Industrial Estate Board, set up Punjab Industrial Estate Development and Management Company of the Government of Punjab in an effort to manage and upgrade the infrastructure of Kot Lakhpat Industrial Estate in Lahore.
Through his hard work and effective leadership, Mr. Hyder has had an everlasting positive impact in both the plastic industry and the entrepreneurship circles of Pakistan.
Mr. Almas HyderChairman
14 SPEL | Reliable No Matter What

Dr. S. M. Naqi is a Chartered Engineer from London and has a Ph.D. in Entrepreneurship from the US. He is a member of the Institute of Mechanical Engineers in London, European Institute of Project Management in the United Kingdom, Institute of Metallurgical Engineers in Pakistan, and the Institute of Electrical Engineers in Pakistan. He is also a visiting faculty member of the Institute of Business Administration at the Punjab University and several other business schools in Lahore.
Dr. Naqi has offered his expertise in many senior positions in Pakistan. He has been the Managing Director for Karachi Pipe Mills Limited, Pakistan Engineering Company Limited (PECO), and the Lahore Engineering Foundry Limited (LEFO). He has also served as the Chairman of the Management Association of Pakistan, Lahore Advisory Board as well as the Federal Light Engineering Corporation.
Dr. Naqi received a civil award (Tamgha-e-Quaid-e-Azam) from the President of Pakistan for his distinguished services towards the country. He has published seven books, and is in the process of writing his eighth. He is a known personality around Pakistan and is acknowledged for his hard work, commitment and integrity. He is mentor for many of his students who have been trained by him.
Dr. Naqi is Director in SPEL Technology Support (Private) Limited.
Dr. S. M. NaqiFounder Chairman
Non-Executive Director
15Annual Report 2016

Pro�le of The Directors
Mr. Zia Hyder Naqi completed his Mechanical Engineering from the University of Engineering & Technology in Lahore. He then went on to complete his MBA in Finance from the Institute of Management Sciences. He is a certified Project Management Professional, IT Expert, and has participated in a number of training programs in Japan, Germany and Canada. He has completed two sessions of the Owner/President Management Program (OPM) from Harvard Business School, USA.
Mr. Zia Hyder Naqi serves on the Board of Directors of the Quaid-e-Azam Industrial Estate in Lahore. He has been associated with Synthetic Products Enterprises Limited for 27 years.
His current engagements include:
• Director, SPEL Technology Support (Private) Limited• Director, SPEL Pharmatec (Private) Limited• Director, AJ Power (Private) Limited• Director, RT Power (Private) Limited• Director, MST Power (Private) Limited
Mr. Zia Hyder NaqiChief Executive Officer
16 SPEL | Reliable No Matter What

Mr. Khawar Anwar Khawaja holds a bachelor’s degree in Mechanical Engineering. He has served as the Chief Executive Officer of Grays of Cambridge (Pakistan) Limited. He has also been President of the Sialkot Chamber of Commerce and Industry.
Mr. Khawar has travelled widely in connection with his business, and has gained immense technical and marketing experience. He has demonstrated his abilities of funds & investment management. Under his effective management and leadership, Grays of Cambridge (Pakistan) Limited has won the top 25 companies award on the Karachi Stock Exchange multiple times.
Currently, Mr. Khawar also holds these positions:
• CEO, Sialkot International Airport Limited
• CEO, Port Services (Private) Limited• Director, Gujranwala Power Supply
Company Limited• Director, Anwar Khawaja Injustries
(Private) Limited
Mr. Khawar Anwar KhawajaIndependent Director
Mr. Muhammad Tabassum Munir has worked with Lahore Stock Exchange for more than 3 decades. He has served as Vice President of Lahore Stock Exchange. He has also been a member of the Pakistan Mercantile Exchange and director of Annoor Textile Mills Limited.
His skills of managing and participating in all-inclusive capital markets and their infrastructure development is widely known. He has participated in numerous seminars, round tables and conferences, gaining valuable experience and knowledge. This has strengthened his role and capacity in the management of finance and advisory services.
His other engagements include:
• CEO, MTM Securities (Private) Limited • Director, Hi Tech Lubricants Limited
Mr. Muhammad Tabassum MunirIndependent Director
Dr. Syed Salman Ali Shah is Ph. D in Finance from the Kelley School of Business in Indiana, USA. He has served as an advisor to the Prime Minister of Pakistan on various fields including Finance, Revenue, Economic Affairs and Statistics.
Dr. Salman has worked as the former Chairman of the Privatization Commission of Pakistan. He has also served on the Board of Governors of the State Bank of Pakistan (SBP), Pakistan International Airlines (PIA), Foundation University, and the Bank of Punjab (BoP).
Currently, Dr. Salman holds the following positions:
• Chairman, Pakistan Mercantile Exchange Limited
• Chairman, Dairy and Rural Development Foundation
• Director, MCB Arif Habib Savings and Investments Limited
• Director, Mughal Iron and Steel Industries Limited
• Director, World Call Telecom Limited
Dr. Syed Salman Ali ShahIndependent Director
17Annual Report 2016

Pro�le of The Directors
Mr. Abid Saleem Khan has an MBA from the Institute of Management Sciences. He is a graduate of Management Development Program from Lahore University of Management Sciences (LUMS). He has been working with SPEL for 20 years and has a good understanding of the automobile industry and the Japanese systems of management.
He is also CEO of SPEL Pharmatec (Private) Limited.
Mr. Abid Saleem KhanChief Operating Officer / Executive Director
Mr. Raza Haider is a Chemical Engineer and has an MBA in Marketing. He began his career from manufacturing electronic security systems for both cars and homes. He has tremendous amount of insight into sales and marketing. He is now into Real Estate business in Canada.
Mr. Raza Haider NaqiNon- Executive Director
Mr. Naseer Hyder completed his BBA from Wilfred Laurier University in Canada. He then went on to complete his MBA from Cardiff University in the United Kingdom, where he completed his masters with a distinction. He is currently working at a senior position in a large American Corporation operates in Canada.
Mr. Sheikh Naseer HyderNon- Executive Director
18 SPEL | Reliable No Matter What

Role of ChairmanThe position of Chairman is held by a Non-Executive Director who is not involved in the day to day activities of the Company.
The principal role of the Chairman of the Board is to manage and to provide leadership to the Board of Directors of the Company. The Chairman is accountable to the Board and acts as a direct liaison between the Board and the management of the Company, through the Chief Executive Officer (“CEO”). The Chairman acts as the communicator for Board decisions where appropriate. He is Responsible for:
• Ensuring that the Board plays an effective role in fulfilling its responsibilities by providing equal opportunity to all Board members to express their ideas or concerns in a free environment and to contribute their professional input for the betterment of the Company.
• Ensuring that the Board as a whole is sufficiently equipped with requisite skills, competence, knowledge, experience, philosophical perspective and diversity considered necessary for managing a successful Company.
• Promoting highest moral, ethical and professional values and good governance throughout the Company.
• Reviewing the performance of the Board and to suggest training and development of the Board on individual and collective basis.
• Managing the conflicts of interests, if any.
• Reviewing the strategic direction of the company regularly, and counseling and advising the Chief Executive Officer.
Role of Chairman and CEO
Role of Chief Executive O�cer The CEO is the Head of the Company’s management. This position is held by an Executive Director responsible for the overall operations and performance of the Company. He is primarily responsible:
• To lead, in conjunction with the Board, the development of the Company’s strategy;
• To lead and oversee the implementation of the Company’s long and short term plans in accordance with its strategy.
• To ensure the Company is appropriately organized and staffed as necessary to enable it to achieve the approved strategy.
• To assess the principal risks of the Company and to ensure that these risks are being monitored and managed.
• To ensure effective internal controls and management information systems are in place.
• To ensure that the Company has appropriate systems to enable it to conduct its activities both lawfully and ethically.
• To ensure that the Company maintains high standards of corporate citizenship and social responsibility wherever it does business.
• To act as a liaison between management and the Board.
19Annual Report 2016

• To communicate effectively with shareholders, employees, Government authorities, other stakeholders and the public.
• To ensure that the Directors are properly informed and that sufficient information is provided to the Board to enable the Directors to form appropriate judgments.
• To ensure the integrity of all public disclosure by the Company.
• Keeping abreast of changes in the industry and suggesting improvements in the overall strategic plan including diversification, consolidation, mergers and acquisitions etc.
• Developing an organizational culture of development, growth, innovation, efficiency and productivity, moral, ethical & professional values and good governance.
• In concert with the Chairman, to develop Board agendas.
• To request that special meetings of the Board be called when appropriate.
• In concert with the Chairman, to determine the date, time and location of the annual meeting of shareholders and to develop the agenda for the meeting.
• To sit on committees of the Board where appropriate as determined by the Board.
20 SPEL | Reliable No Matter What

Awards
APPRECIATIONAWARD
PROFESSIONALEXCELLENCE AWARD
Pak Suzuki Motor Company awarded Appreciation Award in May 2016 to SPEL in recognition of devoted efforts for completion of 50,000 taxis for the Government of Punjab.
Institute of Chartered Accountants of Pakistan awarded SPEL 1st Position in the Professional Excellence Award 2016 on adopting the concept of Behavioural Finance.
21Annual Report 2016

Audit CommitteeThe Board has constituted an Audit Committee comprising of following members:
Name Position Status
Dr. Syed Salman Ali Shah Chairman Independent Non-Executive Director
Mr. Almas Hyder Member Non-Executive Director
Dr. S. M. Naqi Member Non-Executive Director
Mr. Muhammad Tabassum Munir Member Independent Non-Executive Director
Mr. Sheikh Naseer Hyder Member Non-Executive Director
Board Committees
Terms of Reference of the Audit Committee includes:
• Determination of appropriate measures to safeguard the Company’s assets;
• Review of quarterly, half-yearly and annual financial statements of the Company, prior to their approval by the Board of Directors, focusing on:• major judgmental areas;• significant adjustments resulting from the audit;• the going concern assumption;• any changes in accounting policies and practices;• compliance with applicable accounting standards;• compliance with listing regulations and other
statutory and regulatory requirements; and• significant related party transactions.
• Review of preliminary announcements of results prior to publication;
• Facilitating the external audit and discussion with external auditors of major observations arising from interim and final audits and any matter that the auditors may wish to highlight (in the absence of management, where necessary);
• Review of management letter issued by external auditors and management’s response thereto;
• Ensuring coordination between the internal and external auditors of the Company;
• Review of the scope and extent of internal audit and ensuring that the internal audit function has adequate resources and is appropriately placed within the Company;
• Consideration of major findings of internal investigations of activities characterized by fraud, corruption and abuse of power and management’s response thereto;
• Ascertaining that the internal control systems including financial and operational controls, accounting systems for timely and appropriate recording of purchases and sales, receipts and payments, assets and liabilities and the reporting structure are adequate and effective;
• Review of the Company’s statement on internal control systems prior to endorsement by the Board of Directors and internal audit reports;
• Instituting special projects, value for money studies or other investigations on any matter specified by the Board of Directors, in consultation with the CEO and to consider remittance of any matter to the external auditors or to any other external body;
• Determination of compliance with relevant statutory requirements;
• Monitoring compliance with the best practices of corporate governance and identification of significant violations thereof; and
• Consideration of any other issue or matter as may be assigned by the Board of Directors.
22 SPEL | Reliable No Matter What

Human Resource and Remuneration Committee
Finance Committee
The Board has constituted a Human Resource and Remuneration Committee which comprises of following members:
Name Position Status
Mr. Almas Hyder Chairman Non-Executive Director
Dr. S. M. Naqi Member Non-Executive Director
Mr. Khawar Anwar Khawaja Member Independent Non-Executive Director
Mr. Muhammad Tabassum Munir Member Independent Non-Executive Director
Mr. Zia Hyder Naqi Member Executive Director
Mr. Abid Saleem Khan Member Executive Director
The committee shall be responsible for:
• Recommending human resource management policies to the board;
• Recommending to the board the selection, evaluation, compensation (including retirement benefits) and succession planning of the CEO;
• Recommending to the board the selection, evaluation, compensation (including retirement benefits) of COO, CFO, Company Secretary and Head of Internal Audit; and
• Consideration and approval on recommendations of CEO on such matters for key management positions who report directly to CEO or COO.
The Board has constituted a Finance Committee which comprises of the following members:
Name Position Status
Mr. Almas Hyder Chairman Non-Executive Director
Dr. Syes Salman Ali Shah Member Independent Non-Executive Director
Mr. Khawar Anwar Khawaja Member Independent Non-Executive Director
Mr. Zia Hyder Naqi Member Executive Director
23Annual Report 2016

Management Objectives and StrategiesThe objectives of the management are well aligned and synchronised with the overall strategic objectives of the Company. Following strategies were adopted by the management to achieve its objectives:
Objective Strategies to achieve objectives
Reliability Encouraging a culture of innovation and continuous improvementProviding quality products to customers Delivering the product on time
Create value for shareholders Utilizing economic and human resources optimallyEarning best returns on investment Growing revenue
Ensure long term sustainability Constantly upgrading technologiesDeveloping and training employeesCommitted to the ethical business values
Continue as market leader for quality products
Using the leading edge technologiesPromoting Quality Control Circles and 5SWorking with world class supplier for raw materials
Grow continuously Being responsive and keeping customers satisfiedContinuously adding new products to the portfolio Adding new customer to the portfolio
The results of these objectives are reflected in our increased revenue, controlled costs and enhanced profitability. These objective are same as previous year’s.
Management Review
Liquidity and Capital StructureCash Flows and Capital StructureThe Company is earning profits since consistently which has significantly helped in strengthening the liquidity position and healthy cash flows of the Company. In order to finance the Company’s expansion plans and to maintain a healthy debt equity ratio, the Company raised fresh equity of Rs. 580.5 million by issuing new shares to the general public in the year 2014-15. These funds have been invested in the year under review for expansion.
These factors have added to the sustainable growth of the Company, increased profitability and business stability. We monitor and control the gearing of the Company in line with the business objectives. All installments of leases, long term loans, musharika finance, Ijara, FATR, markup were paid on due dates.
Liquidity Management The Company has a policy to finance the capital expenditure through equity or through long term loans. The management continuously monitors its cash flows on daily basis and keeps in view the future needs. It re-aligns the financing facilities for optimized Company’s operations constantly.
The Company observes a self-defined formula for sustainable growth which requires that the amount invested in expansion plans should approximate the amount of profits earned in the year plus depreciation. This has greatly helped in managing a strong liquidity position.
Keeping in view the current liquidity position, available short-term finance facilities and future business plans, the management is confident that the Company would not face any liquidity issues in the foreseeable future.
24 SPEL | Reliable No Matter What

Analysis of Financial and Non-Financial TargetsThere is a well-organized structure by which the key performance indicators (KPIs) and relevant targets are set and monitored throughout the year through regular review meetings.
Financial targets are set for sales, costs, profitability, gearing, liquidity etc, while non-financial targets are set for production efficiencies, quality improvements, automation, 5S, health and safety, quality control circles, human resource development, growth / expansion etc.
All the targets are translated into numbers in the form of a budget which is duly approved by the Board of Directors.
During the year under review, we surpassed the key targets set in last year’s budget especially pertaining to profitability, gross profit ratio, and net profit ratio.
Although there was an increase in the top line, the desired growth was not achieved mainly due to depressed oil prices which resulted in lower prices of our raw material and the effect was passed through to our customers in the share of reduced prices of our products.
Financing Arrangements The Company has good business relations with all the reputed banks and financial institutions of the country. Adequate unutilized short-term financing facilities are available at the Company’s disposal. In the past the Company has obtained long-term loans to finance expansion projects at attractive mark-up rates.
The Company has good arrangements with the reputed banks to manage short term and long term financing needs. The management is confident to maintain this relationship in the future.
The financial performance of the Company is better than the previous year. For detail analysis, data for six years Financial information is available on page 47.
Fair Value of Property Plant and EquipmentThe fair value of the property plant and equipment is Rs. 1.658 billion as on 30 June 2016
Human ResourceThe Company has established an effective human resource department which is engaged in hiring and training of employees. The Company provides an attractive working environment and career to all its employees.
Prospects of TargetsThe Company makes annual and periodic targets for all major functions including Sales, Purchases, Production, Investments, expansion etc. These targets are approved by the board of directors annually and strictly reviewed by the management on monthly basis.
Strategy to overcome LiquidityThe Company maintains good relationships with reputed banks and have financing arrangements to overcome any liquidity problem (if any) faced by the Company.
Measures to overcome Industrial E�uentsThe Company is ISO 140001 certified and manages effluents and wastes, to protect the environment and nearby communities.
25Annual Report 2016

Materiality ApproachThe Board of Directors approved a materiality threshold which the management uses for day to day operations. The board critically evaluates this threshold. In the period under review there is no major change in this threshold.
Energy Saving MeasuresDuring the purchase process of any equipment, energy efficiency is consideration. The expansion during the year is based on energy efficient machines.
Quality of ProductsSPEL is known in the market for its quality and reliability. Quality is the cornerstone of our production. Modern techniques are used and trainings are conducted frequently on improvement of quality control and assurance.
Issues raised in last AGMLast year AGM was conducted on 31 October 2015. There was no issue raised. All agenda items were resolved unanimously.
Disaster Recovery PlanThe Company has a comprehensive Disaster Recovery Plan. The critical IT equipments are placed in a fire proof premises, in addition, the management has arranged offsite data storage facilities. Employees are aware of the steps required to be taken in case of any emergency.
Shariah ComplianceThe Company is shariah complaint as per the criteria mentioned in KSE Meezan Index (KMI). The criteria require that in order to be a Shariah Compliant; a company has to be filtered against the following parameters:
Shariah Screening Filters
• Core business should be shariah compliant
• Interest bearing debt to total assets should be less than 37%
• Non-compliant investments to total assets should be less than 33%
• Non-compliant income to total revenue should be less than 5%
• Non-liquid assets to total assets should be at least 25%
• Market price equal to or greater than the net liquid asset per share
Technical Screening Filters
• Not on defaulter counter/ No trading suspended
• Securities availability at CDC
• Formal listing history of at least 2 months on KSE
• Operational track record of at least one financial year
• Minimum free-float shares of 5% of total outstanding shares
• Securities are traded for 75% of the total trading days
• Not a mutual fund
Threshold for Trading in Shares
of the CompanyAs per requirements of the Code of Corporate Governance as mentioned in Explanation to Rule 5.19.11(xii) of the PSX Rule Book, the Board decided that any employee of SPEL having monthly gross salary of Rs. 100,000 or above should be considered as “Executive” for the purposes of Rule 5.19.11 and Rule 5.9.15 of the PSX Rule Book.
Segment ReviewThe sales of the Company can broadly be categorised into FMCG & auto industry. The segment wise breakup is as follows:
0
10%
20%
30%
40%
50%
60%
70%
80%
90%
100%
2014 2015 2016
FMCG Auto
58 %
42 %
52 %
48 %
54 %
46 %
Segment Analysis
26 SPEL | Reliable No Matter What

Cash Flow Statement Direct Method for the year ended 30 June 2016
2016 2015 Rupees Rupees
Cash flows from operating activities
Cash receipts from customers 2,289,848,153 2,101,775,975 Cash paid to suppliers and employees (1,813,926,026) (1,775,962,756)
Cash generated from operations 475,922,127 325,813,219
Workers’ Profit Participation Fund and Workers’ Welfare Fund paid (20,620,438) (12,122,756)Finance cost paid (40,322,350) (55,008,182)Taxes paid (61,962,590) (60,116,033)Long term deposits - net (9,967,098) 5,357,244
(132,872,476) (121,889,727)
Cash generated from operating activities 343,049,651 203,923,492
Cash flows from investing activities
Fixed capital expenditure (561,444,827) (185,121,601)Intangibles acquired (1,671,830) (226,200)Proceeds from disposal of property, plant and equipment 929,595 5,117,851 Proceeds from disposal of investment in associate – 4,674,194 Refund of advance for issue of shares 1,700,000 – Short term investments 505,500,000 (580,500,000)
Net cash used in investing activities (54,987,062) (756,055,756)
Cash flows from financing activities
Proceeds from issuance of capital - net – 540,891,050 Principal repayment of lease liability (47,701,543) (47,165,458)Long term finance obtained – 47,250,000 Long term finance and diminishing musharika repaid (21,113,732) (9,197,030)Short term borrowings - net 10,461,442 (88,765,114)Cash dividend paid (77,211,637) (38,537,756)
Net cash generated from / (used in) financing activities (135,565,470) 404,475,692
Net increase / (decrease) in cash and cash equivalents 152,497,119 (147,656,572)
Cash and cash equivalents at beginning of the year (151,704,231) (4,047,659)
Cash and cash equivalents at end of the year 792,888 (151,704,231)
27Annual Report 2016

Taxation The company is entitled to certain tax credits for making investment in plant and machinery, the condition to avail such credits were fulfilled in the last quarter of the year, hence, all the tax credits were accounted for in last quarter which has resulted in lower tax expenses and accordingly a tax reversal is seen in the fourth quarter, bringing the overall tax expense at Rs. 37.75 million.
Quarterly Results AnalysisSalesSales of the Company grew @ 7.21% in the FY 2016 as compared to previous year. The sales to the food and FMCG Packaging industry is seasonal and accordingly the sales declined in the second quarter whereas the number was highest in the fourth quarter, the Company follows the similar pattern almost every year.
Cost of Sales The cost of sales remained stable throughout the year except in the second quarter. The percentage of cost to sales increased due to less absorption of fixed cost due to lower sales volume and maintenance expenses incurred in preparation for the upcoming seasonal requirements.
Operating Pro�tThe operating profit represents the operational performance of the Company. In the first quarter the company earned a good profit, which declined by Rs. 62.5 million in the second quarter due to seasonal impact. The third and fourth quarter operating profit remained stable.
Nomenclature 1st Quarter 2nd Quarter 3rd Quarter 4th Quarter Total
Sales –net 576,580,887 514,058,016 557,155,235 674,056,464 2,321,850,602 Cost of sales (428,503,969) (403,012,807) (411,560,534) (496,279,918) (1,739,357,228)
Gross profit 148,076,918 111,045,209 145,594,701 177,776,546 582,493,374
Administrative exp. (25,656,485) (28,630,544) (26,465,632) (35,971,126) (116,723,787)Selling and dist. exp. (11,088,042) (10,470,897) (11,822,643) (14,063,411) (47,444,993)
Operating profit 111,332,391 71,943,768 107,306,426 127,742,009 418,324,594
Other income 13,614,482 15,047,235 8,601,166 6,287,061 43,549,944 Other charges (8,125,606) (5,305,810) (7,285,752) (9,175,316) (29,892,484)Finance cost (11,882,079) (10,926,585) (10,416,292) (5,214,333) (38,439,289)
Profit before taxation 104,939,188 70,758,608 98,205,548 119,639,421 393,542,765
Taxation (18,332,383) (22,410,033) (20,157,376) 23,147,708 (37,752,084)
Profit after taxation 86,606,805 48,348,575 78,048,172 142,787,129 355,790,681
Earnings per share 1.12 0.63 1.01 1.85 4.60
0
20
40
60
80
100
120
Sales Cost of Sales Profit Before Tax Profit After Tax
1st Qtr 2nd Qtr 3rd Qtr 4th Qtr
29 %
24 %
22 %
25 %
29 %
24 %
23 %
25 %
30 %
25 %
18 %
27 %
40 %
22 %
14 %
24 %
Quarterly Performance Analysis
28 SPEL | Reliable No Matter What

Share Price Sensitivity Analysis
The performance of Synthetic Products Enterprises Limited (“the Company”) is affected by various factors including internal and external variables which impact the profitability of the Company. As a result of change in the bottom line, the Company’s share price eventually fluctuates. In addition the fundamentals of stock market e.g. risk free rate of return, risk factors, cost of equity, market perception, perspective of foreign investors, etc. also impact the price of Company’s share. The performance of share price and volume traded during the year 2015-16 is as follows:
30-J
un-1
5
70 1,200,000
1,000,000
800,000
600,000
400,000
200,000
0
60
50
40
30
20
10
0
10-J
ul-1
520
-Jul
-15
30-J
ul-1
509
-Aug
-15
19-A
ug-1
529
-Aug
-15
08-S
ep-1
518
-Sep
-15
28-S
ep-1
508
-Oct
-15
18-O
ct-1
528
-Oct
-15
07-N
ov-1
517
-Nov
-15
27-N
ov-1
5
07-D
ec-1
517
-Dec
-15
27-D
ec-1
506
-Jan
-16
16-J
an-1
626
-Jan
-16
05-F
eb-1
615
-Feb
-16
25-F
eb-1
606
-Mar
-16
16-M
ar-1
626
-Mar
-16
05-A
pr-1
615
-Apr
-16
25-A
pr-1
6
05-M
ay-1
615
-May
-16
25-M
ay-1
604
-Jun
-16
14-J
un-1
624
-Jun
-16
Volume (’000)Share Price (PKR)
30-J
un-1
510
-Jul
-15
20-J
ul-1
5
30-J
ul-1
509
-Aug
-15
19-A
ug-1
529
-Aug
-15
08-S
ep-1
518
-Sep
-15
28-S
ep-1
508
-Oct
-15
18-O
ct-1
528
-Oct
-15
07-N
ov-1
517
-Nov
-15
27-N
ov-1
5
07-D
ec-1
517
-Dec
-15
27-D
ec-1
506
-Jan
-16
16-J
an-1
626
-Jan
-16
05-F
eb-1
615
-Feb
-16
25-F
eb-1
606
-Mar
-16
16-M
ar-1
626
-Mar
-16
05-A
pr-1
615
-Apr
-16
25-A
pr-1
6
05-M
ay-1
615
-May
-16
25-M
ay-1
604
-Jun
-16
14-J
un-1
624
-Jun
-16
Volume (’000)Share Price (PKR)
29Annual Report 2016

Risk and Opportunity Report
Risk and opportunitiesRisksThe objectives of the management are well aligned and harmonized with the overall strategic objectives of the Company. Following strategies were adopted by the management to achieve its objectives:
Risks Mitigants
Strategic Risks
Technological risk
Technological obsolescence The company has been constantly upgrading its technologies. In the present expansion plan also the Company acquired current generation technologies which are energy efficient, to stay ahead of the pack.
Regulatory Risk
Imposition/enhancement of duties, taxes, levies and other conditions may adversely affect the operations.
Current government policies are business friendly. However any levies go across the board, so we shall stay competitive.
Commercial risks
Pricing Risk
With new entrants in the market, there is a likeli-hood of price competition which might squeeze margins.
The Company is constantly sourcing competitive suppliers, improving its technology, efficiency and productivity. Also, since SPEL has in-house capability to develop products with fast turn around time, that by itself obviates possibilities of competition affecting SPEL. The Company has developed interdependence with its customers and is considered a strategic supplier.
Competition Risk
Increasing entrants making their way into the plastic industry.
SPEL’s diversification of business activities and technical expertise makes it adequately prepared to face these challenges.
Operational risks
Human Resource Risk
Increasing competition for skilled human resources may lead to higher turnover causing deterioration in service standards or increased payroll.
The company HR Manager practices including arranging trainings and development programs for its employees, conducive work environment and competitive packages. Constant efforts in improving and training HR would offset this risk.
Machine Breakdown RiskMachine breakdown due to electricity load shedding may affect the operational performance of the Company.
Adequate electricity backup systems are in place to overcome the problem. Adequate spares are also kept in stock.
Financial Risks
Foreign Exchange Risk
Raw material prices are linked with oil prices and major upward surge may erode margins. Rupee devaluation may push the prices of raw material up.
SPEL has every 3 months raw material prices true-up arrangement with all key customers which mitigates the risk of profitability erosion.
30 SPEL | Reliable No Matter What

Opportunities:Modern Technology: SPEL is using state of the art modern technology which provides an opportunity to lead in the market for premium quality products.
In House Mold Shop: In-house design and mold shop is the strength which gives competitive advantage through which SPEL produced most of its innovations. The design and mold shop was established soon after the inception of SPEL. It is now one of the biggest mold shops in Pakistan.
Long Term Business Relationships: SPEL maintains long term business relationships with its customers and trade partners. Most of the major customers are blue chip companies and are working with us since many years.
Risks Mitigants
Liquidity Risk
Liquidity risk is the risk that the Company will encounter difficulty in meeting the obligations associated with its financial liabilities that are settled by delivering cash or another financial asset.
The Company’s approach to managing liquidity is to ensure, as far as possible, that it will always have sufficient liquidity to meet its liabilities when due, under both normal and stressed conditions. The Company finances its operations through equity, long term and short term borrowings to maintain adequate working capital. With a view to maintaining an appropriate mix between various sources of finance to minimize risks. The management aims to maintain flexibility in funding by keeping regular committed credit lines with reputed banks.
Credit Risk
Credit risk is the risk of financial loss to the Company if a customer or counterparty to a financial instrument fails to meet its contractual obligations.
To manage credit risk the Company maintains procedures covering the application for credit approvals, and monitoring of exposures against credit limits. As part of these processes the financial viability of all counterparties is regularly monitored and assessed.
Forward Looking StatementKeeping in view the historical trends and depth in the market, the management is geared towards achieving growth in both segments, i.e. auto and packaging for food and FMCG industries. The investment made in plant and machinery in the year under review will help in catering for the upcoming requirements of customers. Another round of investment is also planned in the financial year 2016 – 2017 to cater for future requirements of customers. The human resource is sufficiently trained to manage this growth. A detailed training plan has been prepared for further strengthening the capabilities of employees to cater for future growth.
31Annual Report 2016

Duo Pont AnalysisAs at 30 June 2016
Net Pro�t Margin15 %
Gross Pro�t Ratio25 %
Gross Pro�t582,493
Shareholders Equity1,836,334
Asset Turnover0.94 times
Other Expenses Ratio10 %
Net Sales2,321,851
Other Expenses226,703
Net Sales2,321,851
Net Sales2,321,851
Total Assets2,481,024
Total Assets2,481,024
Total Liabilities644,690
Current Assets943,727
Non-Current Assets1,537,298
Total Assets2,481,024
Return on Equity19%
Return on Assets 14 %
Shareholders Equity Ratio0.74 times
+
x
–
–
Note: PKR in Thousand
32 SPEL | Reliable No Matter What

Organogram
Functional ReportingAdministrative Reporting
Board of DirectorsFinance Committee
HR & R Committee
Audit Committee
Chief Executive Officer
Chief Operating Officer Chief Financial Officer
GM Production
Company Secretary
Headof
Corporate
PlantHead
(Unit 1)
PlantHead
(Unit 2)
PlantHead
(Unit 3)
PlantHead
(Unit 4)
Headof
Marketing
Headof
Purchase
HeadofIT
Headof
Admin/HR
Headof
Finance
Headof
Accounts
Head of Internal
Audit
33Annual Report 2016

Company Policies
Con�ict of Interest PolicyThe Company stands fully committed to the transparent disclosures, management and monitoring of actual, potential or perceived conflicts of interest.
Any Director with personal interest, relationship or responsibility which conflicts with the interest of the Company or its shareholders shall excuse himself or herself from any discussions on the matter that would give rise to conflict of interest and, if necessary, from the Board meeting, or applicable part thereof.
All Directors under the policy are obligated and have a duty to avoid actual, potential or perceived conflicts of interest.
The policy provides guidance on what constitutes a conflict of interest and how it will be managed and monitored by the Company. The policy is applicable to Directors as the Company strongly believes that a Director owes certain fiduciary duties, including the duties of loyalty, diligence and confidential to the Company which requires that the Directors act in good faith on behalf of the Company and to exercise his or her powers for stakeholders’ interests and not for their own or others interests.
IT Governance PolicyWe have strong devotion to continuously explore the prospects of implementing the latest IT infrastructure for
efficient and timely decision making and to economize the costs related to operating and decision making processes.
Our IT governance is based on the following key features:
• To promote culture of paperless environment
• Providing a disciplined and well established decision making processes for IT investment decisions
• To avoid redundancy
• To ensure integration and compatibility
• To promote culture of accountability, transparency and dialogues about technology that facilitates effective strategy adoption
• To promote innovation in IT function
Whistle Blowing Policy SPEL have a properly documented and implemented whistle blowing policy to ensure doing the business lawfully, ethically and with integrity.
SPEL encourages a culture to detect, identify and report any activity which is not in line with the Code of Ethics, Corporate Governance, Company’s policies, or involves any misuse of Company’s properties or any breach of law, etc which may affect the reputation of the Company.
SPEL encourages whistle blower to raise the issue directly to competent authority provided that:
34 SPEL | Reliable No Matter What

• the whistle blower has appropriate evidence(s) substantiating the genuineness of the fact;
• the whistle blower understands that his act will add more value than the harm to the Company and he is doing this because of his loyalty with the Company;
• the whistle blower understands the seriousness of his action and is ready to assume his own responsibility; and
• SPEL shall provide reasonable protection to employee(s) who report the issue(s) as per this policy.
Environment Health & Safety PolicyIt is policy of SPEL to:
• Place continuous and concerted efforts towards minimizing the impacts on the environment and use of energy and natural resources.
• Strive to reduce waste, emission to air, water and land; and are committed to comply with all the applicable legal requirements.
• Ensure adequate controls to prevent any adverse effect on the environment and to reduce or eliminate health and safety hazards.
• Practice efficient energy management with resource conservation and promote recycling, reuse, reduction and replacement wherever possible.
• Promote awareness, responsibility and commitment for the conservation of the global environment as well as health safety and protection amongst all levels of employees.
• Educate employees on the issues of health, safety and environment.
• Work in the spirit of cooperation with the relevant authorities.
Investors’ Grievances Policy It is policy of SPEL to:
• Prohibit the selective disclosure of material, nonpublic information about the Company,
• Set forth procedures designed to prevent such disclosure, and
• Provide for the broad, public distribution of material information regarding SPEL.
At all times SPEL will guard the Company’s need for confidentiality about key business and operating strategies & SECP’s directive on nonpublic earnings guidance.
Disclosure ProcessSPEL will communicate its anticipated approach to disclosure in general and compliance with the SECP regulation by posting the Investor Relations policy on the website www.spelgroup.com
Communication ChannelsThe CEO or CFO or their nominee(s) will be the primary contacts who may communicate on behalf of the Company to analysts, securities market professionals, institutional investors, and major shareholders of the Company. Quarterly Earnings Release & Analyst Brie�ngSPEL will release earnings information quarterly as required by the Stock Exchange soon after the accounts are reviewed by the Board of Directors at date to be announced publicly and post the same on the Company Website which may be followed by an Analyst briefing, date and venue to be posted on web site and communicated to the Stock Exchange.
Analyst Earnings Models and ReportsSPEL will not share earnings projections and will not provide focused guidance to analysts in their efforts to develop earnings estimates.
Closed PeriodSPEL expects to observe a “closed period”, at time of finalizing quarterly / annual earnings during which the Company will not participate in any further one-on-one or group conversations that relate to the Company’s financial performance or current business activities and presentations. Duration of this period to be posted on website.
Safety of Records PolicyThe Company pursues an effective policy for the safety of its records and to ensure that authentic, reliable and usable records are created, captured and stored to meet the needs of the Company’s business and statutory requirements. The policy ensures that:
• Complete and accurate record of the transactions of the Company is created, captured and stored physically and in soft form along with proper backup;
• Records are to be maintained in conditions suitable for
35Annual Report 2016

the length of time to cater for the Company’s needs and statutory requirements;
• Records and archives are protected against the risks of unauthorized access, damage caused by fire, natural calamities and physical deterioration etc.
• The Records will be available to the authorized persons within the constraints of security, confidentiality, privacy and archival access conditions.
• Records are destroyed or disposed of in accordance with the disposal policies, procedures and guidelines of the Company.
Stakeholders’ EngagementsThe Company considers stakeholders engagement as a significant part of the business and it takes necessary steps to ensure that the interest of the Stakeholders are given due care and are protected.
The following stakeholders are engaged to add value to the Company:
a) Institutional Investors and Banks (other lenders): We meet the investors’ needs by providing timely information and, if necessary, followed by corporate briefing. We consider our lenders as our business partners and make payment of all dues on time.
b) Customers: We communicate with customers in many ways as part of our normal business, through our dynamic marketing team who keep in closed contact with the customers and discuss day to day issues. There is a constant engagement between the top management with the customer’s senior management also, to discuss on going and strategic expansions.
c) Suppliers: We communicate and work closely with suppliers to ensure that they maintain high standards required by the Company by conducting formal supplier assessments and by holding suppliers conventions. Procurement Department and users communicate constantly with suppliers to ensure reliability of supplies.
d) Regulators & Government: The Company has a policy to comply with all legal requirements and to provide appropriate and timely information to the relevant regulatory and Government authorities. Furthermore, we participate in providing input to the legislative development process through direct interaction, and through associations, institutes, or chamber of commerce.
e) Employees: The Company engages with its employees through regular communication, the employees are free to discuss their matters with any level in the organization without any barrier. In addition, certain structured annual events are in place to further strengthening the employees’ relations.
Human Resource Management SPEL hires for attitudes while giving due consideration to qualification, capability and skills of required for the each respective position. The Company provides a congenial and healthy working environment to utilize the capabilities of its employees efficiently. The Company believes that its core strength is its people, who strive every day to meet individual challenges and help the Company achieve its collective targets. There is well structured Performance Review Process in place which helps in recognizing the employees’ contribution and reward them according to their performances.
Succession PlanningSPEL puts great emphasis on training all its employees and preparing them for the next positions. The Company has a process for identifying and developing people who has the potential to fill key business leadership positions. This process increases the availability of experienced and capable employees who are prepared to assume these roles as they get to that level.
Industrial RelationsSPEL maintains excellent relations with its employees & labour and the Company takes every reasonable step for swift and amicable resolution of all their issues.
Company Policies
36 SPEL | Reliable No Matter What

Report of the Board Audit CommitteeThe Audit Committee of the Company comprises of five non-executive directors including two independent directors. The Chairman of the Committee is an independent Director and holds a Ph. D Degree in Finance from the Kelly School of Business Administration, Indiana University, USA.
The Audit Committee reviewed the quarterly and annual financial statements of the Company and recommended them for approval of the Board of Directors.
The Audit Committee has reviewed and approved all related party transactions.
The internal control framework has been effectively implemented through an independent in-house Internal Audit function established by the Board which is independent of the External Audit function.
The Head of Internal Audit has direct access to Chairman of the Audit Committee and the Committee has ensured staffing of personnel with sufficient internal audit acumen.
Audit Committee has ensured that the internal audit function team has access to Management and the right to seek information and explanations and that the team is satisfied with the level of co-operation of the Company’s staff.
Audit Committee has ensured that the knowledge and skill level of the Head of Internal Audit was suffice for the performance of his role.
The external auditors KPMG Taseer Hadi & Co. Chartered Accountants were allowed direct access to the Audit Committee and necessary coordination with internal auditors was ensured. Major findings arising from audits and any matters that the external auditors wished to highlight were freely discussed with them.
The external auditors have been allowed direct access to the Committee and the effectiveness, independence and objectivity of the auditors has thereby been ensured. The auditors attended the General Meetings of the Company during the year and have confirmed attendance of the upcoming Annual General Meeting scheduled for 21 September 2016 and have indicated their willingness to continue as Auditors.
The Audit Committee reviewed the Management Letter issued by the external auditors and the management response thereto. Observations were discussed with the auditors and required actions recorded.
Appointment of external auditors was reviewed and the Audit Committee following this review, recommended to the Board of Directors re-appointment of M/s KPMG Taseer Hadi and Co. Chartered Accountants as external auditors for the year 2016-17.
–sd–
Dr. Syed Salman Ali ShahChairman of the Board Audit Committee
Date: 26 July 2016 Lahore
37Annual Report 2016

SPEL believes that investing on welfare of society is a sign of good corporate citizen. SPEL supports the community by spending on health, education, community welfare and social causes.
SPEL is further improving the social and economic conditions of its community by providing financial assistance to project that work for the welfare of the society.
SPEL has taken the following initiatives to cater to the welfare of society:
• SPEL contributes funds to charitable institutions for education and welfare purposes.
• SPEL has arranged free medical camps for the unprivileged people living in nearby villages.
• SPEL provides financial assistance to its employees who wish to improve their educational qualification.
Energy ConservationPakistan is facing an energy crisis which has affected its economy. Energy demand-supply gap is further widening. To play our part in reducing the energy crises, we are using the following measures:
• Conversion to energy efficient machinery and equipment.
• Street lights are being converted into solar lights.• Emphasizing the need for smart consumption efforts
and training the employees on how to minimize energy consumption.
• Placing of glass windows and other openings in walls to optimize the usage of daylight.
• Conversion of computer monitors to LCDs.• Enhanced use of energy saver bulbs.
Environmental Protection MeasuresSPEL has implement environmental sustainability measures to its core operations. The following measures have been taken to protect the environment:
• Use of “Canopy Generators” to minimize noise pollution.• Use of diesel based generators instead of furnace oil
based generator as the furnace oil based engines are noisier and more environmentally hazardous.
• Plantation of trees to promote a greener environment. SPEL has planted 500 trees in the year under review.
Corporate Social Responsibility
Community Investment and Welfare SchemesSPEL has invested on the welfare of community in the following way:• Safeguard the environment from emissions and hazards.• Creating employment opportunities for the society.• Compliant and paying taxes.• Helping the society through donations and other welfare
activities.
Consumer Protection Measures We ensure that quality products are delivered to consumers. In packaging manufacturing unit we use food grade materials and keep the facility clean as per requirements of international health and safety standards. SPEL has obtained the FSSC 22000 certification to ensure safety of food and drink packaging.
Industrial RelationsSPEL has established rules and procedures for better industrial relations. Employees’ motivation and satisfaction is of vital importance. Annual bonuses, market competitive salaries and benefits, provident fund, leave encashment and other benefits reflect our best efforts for good industrial relations. SPEL is also offering incentive schemes to employees on achieving various milestones; SPEL is an equal opportunity employer.
Employment of Special PersonsSpecial persons are a part of our community who need proper attention, care and opportunities so that they can live independently without becoming burden on the society. As a principle, we welcome special persons to work with us, we consider that providing employment to such persons will help create an egalitarian society.
38 SPEL | Reliable No Matter What

Occupational Safety and healthSPEL believes that employee health and safety are of the utmost importance. We have implemented employee training programs to create awareness about work place safety measures. Furthermore, there are fire safety systems in place to cater to any emergency situation that may arise. Fire safety drills are carried out on a periodic basis. There are regular medical tests conducted for employees from reputed medical laboratories. SPEL also has a congenial working environment, which serves to the social needs of employees. We have ISO certification for standard operating procedures both to maximize efficiency and to ensure safety of operators.
Business Ethics & Anti-Corruption MeasuresSPEL has built a corruption free culture. SAP has been implemented as a database management system which ensures transparency. SPEL has also engaged a qualified consultant to improve the integrity of procurement system. His responsibility is to analyze the existing system, identify weaknesses if any, and suggest measures to improve it and plug and loop holes.
National Cause DonationsDuring the year under review, SPEL has donated for flood relief operations, orphanages and educational scholarships and for other similar causes to contribute for the betterment of the society.
Contribution to National ExchequerDuring the year under review, SPEL has contributed an amount of Rs. 546,118,080 to National Exchequer in the form of Income Tax, Sales Tax, Custom duties, Federal Excise Duties, Levies, Cess, etc.
Investor Relations The Company is maintaining an Investor Relations section on its website for providing detailed information to the users. Interested members may log in to www.spelgroup.com for getting more information.
39Annual Report 2016

40 SPEL | Reliable No Matter What

Directors’ Report to the ShareholdersFor the year ended 30 June 2016
Dear ShareholdersThe Directors of your Company are pleased to place before you the Company’s Annual Report on the results of its operations along with the Audited Accounts for the year ended 30 June 2016.
41Annual Report 2016

Financial Overview Financial ResultsThe financial results of the Company for the year under review and of the previous year are as follows:
2016 2015 Rupees in million
Turnover 2,321.85 2,165.70Gross profit 582.49 492.80Operating profit 418.3 346.05Financial cost 38.44 59.03Profit before taxation 393.54 286.31Taxation 37.75 56.56Profit after tax 355.8 229.75
2016 2015 Rupees in million
Dividends and Appropriations Opening balance of un-appropriated profit 527.19 248.74Interim cash dividend @ 5% (2015: @5%) 38.68 38.68Proposed final cash dividend @ 10% (2015: @5%) 77.35 38.67
Sub total 116.03 77.35Un-appropriated profit carried forward 411.16 171.39
Total Dividend 15% 10%
Earnings Per ShareThe earnings per share for the current and the previous year are as follows:
Basic and diluted EPS – 2016 Rs. 4.60Basic and diluted EPS – 2015 Rs. 3.48
TaxationDuring the year under review, the Company has claimed a tax credit under section 65E of the Income Tax Ordinance, 2001 at the rate of 41% of tax payable on account of investing in plant and machinery financed through new equity, the company is entitled to claim this credit for the next four years as well.
In addition, a one-time tax credit under section 65B of the Income Tax Ordinance, 2001 at the rate of 10% of the amount invested in plant and machinery, has been claimed. Such credits can be claimed in future also subject to investment in plant and machinery in the respective years .
OperationsOperationsThe financial year 2015-16 was another successful year for the Company with sales, operating income and profits surpassing all previous heights.
Inspite of the commodity prices crash, the sales revenue of the Company increased by 7.2% from Rupees 2,166 million to Rupees 2,322 million. The gross profit increased by 18% due to higher sales volume and production efficiencies. Operating profit and net profit also increased by 21% and 55% respectively. During the year under review, the Company has developed tooling worth Rs. 81 million. The relevant overheads have been capitalized.
To increase productivity and to cater to growing market demand, the Company invested Rs. 481 million (2015: Rs. 121 million) in Plant and Machinery. The investment helped achieve higher productivity, lower cost and tax credits. Significant amount has also been spent for the technology upgradation and automation to ensure better quality, timely deliveries and improving efficiency. Most of the machinery became operational in the last quarter of financial year 2016, hence, the depreciation on new machinery is charged from the month in which it becomes available for use. This is in accordance with the accounting policy of the Company as mentioned in note number 3.2 to the accounts. This investment has added capacity which will be reflected in future.
There have been no material changes since 30 June 2016 to the date of this report and the Company has not entered into any commitment during this period, which would have an adverse impact on the financial position of the Company.
Directors’ Report to the ShareholdersFor the year ended 30 june 2016
42 SPEL | Reliable No Matter What

Award and RecognitionIt gives us great pleasure to inform that the Company has the honour of receiving the following awards
Professional Excellence AwardInstitute of Chartered Accountants of Pakistan awarded SPEL 1st Position in the Professional Excellence Award 2016 on adopting the concept of Behavioural Finance.
Appreciation AwardPak Suzuki Motor Company awarded Appreciation Award in May 2016 to SPEL in recognition of devoted efforts for completion of 50,000 taxis for the Government of Punjab.
Human Resource Development:We believe that our core strength is our people, who strive every day to meet individual challenges and help the Company to achieve its objectives. Developing the personal and organizational skills, knowledge and abilities has been a priority of the Company. The trainings ranged from fundamental skills for team measures to refresher courses on Toyota Production Systems (TPS), Kaizen, 5S and strategic managerial skills.
Corporate Social ResponsibilityThe Company considers social, environmental and ethical matters as an important element of the business activity. SPEL support the community by spending on health, education, community welfare and social causes. During the year under review, we have given donations to different
organizations. We have arranged free medical camp for the unprivileged people living in nearby villages and provided financial assistance to the deserving employees who wished to enhance their education.
CorporateElection of Directors During the year under review, the election of Directors was conducted as per requirements of the Companies Ordinance, 1984. The previous Board had fixed nine seats for election of Directors against which nine nominations were received and all the persons consented were elected by the shareholders in the 33rd Annual General Meeting held on 31 October 2015.
A formal orientation was given to all directors on induction. The Board include three independent directors who constitutes one-third of the total number of directors. The Board has a good balance of independent, non-executive and executive directors.
43Annual Report 2016

Meetings of the Board and Attendance During the year under review, five (05) Board meetings were held and attendance by each director is given below:
Name Status Meetings attended
Mr. Almas Hyder Chairman/Non-Executive Director 5
Dr. S. M. Naqi Non-Executive director 5
Mr. Zia Hyder Naqi CEO/Executive director 5
Dr. Syed Salman Ali Shah Independent Non-Executive Director 3*
Mr. Khawar Anwar Khawaja Independent Non-Executive Director 3*
Mr. Muhammad Tabassum Munir
Independent Non-Executive Director 5
Mr. Raza Haider Naqi Non-Executive Director 4
Mr. Sheikh Naseer hyder Non-Executive Director 4
Mr. Abid Saleem khan Executive Director 5
* Dr. Syed Salman Ali Shah and Mr. Khawar Anwar Khawaja were elected as directors on 31 October 2015. After their appointment only three board meetings were held during the year.
Leave of absence was granted to the members who could not attend the meeting.
Board Audit CommitteeDuring the year under review, four (04) Board Audit Committee meetings were held and attendance by each member is given below:
Name Status Meetings attended
Dr. Syed Salman Ali Shah Committee Chairman 2*
Mr. Almas Hyder Member 4
Dr. S. M. Naqi Member 4
Mr. Muhammad Tabassum Munir Member 4
Mr. Sheikh Naseer Hyder Member 1
* Dr. Syed Salman Ali Shah has joined the Committee on 12 November 2015 after his appointment only two (02) meetings of the Committee were held during the year. Before his joining Mr. Muhammad Tabassum Munir was Chairman of the Committee.
Leave of absence was granted to the members who could not attend the meeting.
Human Resource & Remuneration CommitteeHuman Resource and Remuneration Committee comprises of following members. During the year two (02) Human Resource and Remuneration Committee meetings were held.
Name Status Meetings attended
Mr. Almas Hyder Chairman 2
Dr. S. M. Naqi Member 2
Mr. Sheikh Naseer Hyder Member 2
Mr. Khawar Anwar Khawaja Member 1*
Mr. Abid Saleem Khan Member 2
Mr. Muhammad Tabassum Munir Member 1*
* Mr. Muhammad Tabassum Munir and Mr. Khawar Anwar Khawaja joined the committee on 12 November 2015. After their joining only one meeting was held.
Leave of absence was granted to the members who could not attend the meeting.
Finance CommitteeFinance Committee comprises of the following members. During the year no meeting of Finance Committee was held.
Name Status
Mr. Almas Hyder Committee Chairman
Mr. Zia Hyder Naqi Member
Dr. Syed Salman Ali Shah Member
Mr. Khawar Anwar Khawaja Member
Training by Directors During the year under review, Mr. Zia Hyder Naqi attended the second session of Owner President Management Program at Harvard Business School. In addition, Dr. Syed Salman Ali Shah and Mr. Muhammad Tabassum Munir have attended the Directors Training Program by the Institute of Chartered Accountants of Pakistan.
Directors’ Report to the ShareholdersFor the year ended 30 june 2016
44 SPEL | Reliable No Matter What

Appointment of AuditorsThe present auditors, M/s KPMG Taseer Hadi & Co. Chartered Accountants will retire at the conclusion of the upcoming Annual General Meeting to be held on 21 September 2016 and being eligible, offer themselves for re-appointment. The Board Audit Committee of the Company has suggested and the Board has recommended their re-appointment as auditors of the Company for the year ended 2016-17.
Pattern of ShareholdingThe pattern of shareholding is annexed to this report.
Corporate and Financial Reporting FrameworkThe company is in compliance with the all requirements of the Corporate and Financial Reporting Framework as enumerated in the Code of Corporate Governance and we confirm that:
• The financial statements, prepared by the management of the Company, present fairly its state of affairs, the result of its operations, cash flows and changes in equity.
• Proper books of account of the Company have been maintained.
• Appropriate accounting policies have been consistently applied in preparation of financial statements and accounting estimates are based on reasonable and prudent judgment.
• International Financial Reporting Standards, as applicable in Pakistan have been followed in preparation of financial statements and any departures there from has been adequately disclosed and explained.
• The system of internal controls is sound in design and has been effectively implemented and monitored.
• There are no significant doubts upon the company’s ability to continue as a going concern.
• Key operating and financial data for the last six years is annexed.
• Information about taxes and levies is given in notes to the Financial Statements.
• There is no likelihood of any delayed payments or default in respect of all loans availed by the Company.
• The Company operates a contributory Provident Fund Scheme for all its eligible employees. The value of investment as on 30 June 2016 of the investments
made by the Company’s Provident and other relevant information has been mentioned in notes to the Financial Statements.
• The detail of trading in shares of the Company by the Company’s Directors, Chief Executive Officer, Chief Operating Officer, Chief Financial Officer, Company Secretary Head of Internal Audit, Executives their spouses and minor children is annexed.
• The Board has reviewed and decided that any employee of SPEL having monthly gross salary of Rs. 100,000 or above should be considered as “Executive” for the purposes of Rule 5.19.11 and Rule 5.9.15 of the PSX Rule Book.
Abstract under section 218 of the Companies Ordinance, 1984The Board of Directors in their meeting held on 12 November 2015 had approved the following remuneration packages of below mentioned directors:
Name DesignationMonthly
Salary
Mr. Almas Hyder Chairman/ Non-Executive Director Rs. 700,000/-
Mr. Zia Hyder Naqi Chief Executive Officer/Director Rs. 700,000/-
Mr. Abid Saleem Khan Executive Director Rs. 430,000/-
Dr. S. M. Naqi Advisor/Non-Executive Director Rs. 450,000/-
The above directors are also entitled for the perquisites and benefits e.g. use of company maintained cars for official and private purposes, medical, telecommunication and travelling expenses, memberships of clubs and personal support staff as per the Company policy or as may be approved by the Board of Directors from time to time. Their remuneration is subject to such increments, adjustments and other entitlements as may be granted by the Board of Directors. The above directors have interest to the extent of their respective remuneration and benefits to which they are entitled.
45Annual Report 2016

Future outlook The Company is on the path of steady growth. Manufacturing facilities are being expanded, Investments are being made to achieve efficiency and improve profitability. The geographical footprint is also being enlarged. Ground breaking of new plant in Rahim Yar Khan has been done and construction started.
We are positive on the stability of our markets. The Company has the ability and capacity to develop strategies to maintain pattern of sustained growth.
The Company has a blue-chip clientele, which provides natural growth to sales as the clients are growing. The Company is investing on horizontal growth also by developing and adding new product lines.
Directors’ Report to the ShareholdersFor the year ended 30 june 2016
AcknowledgementWe are pleased to acknowledge that the relation with employees remained congenial throughout the year. The management recognizes and records its sincere appreciation to all employees for their continued dedication, commitment and hard work without which this performance could not have been possible.
We would also like to appreciate our valuable customers for their continued support and reliance on our products as well as quality. The support extended by financial institutions is also encouraging for us, and we extend our gratitude to them.
Almas Hyder Zia Hyder NaqiChairman Chief Executive Officer
Place: Lahore26 July 2016
46 SPEL | Reliable No Matter What

Six Years Financial Information
Financial Summary 2016 2015 2014 2013 2012 2011
Balance Sheet
Share capital Rs. in 000 773,500 773,500 580,000 412,275 329,820 242,439 No of shares (closing) No. in 000 77,350 77,350 58,000 41,227 32,982 24,244 Fixed assets Rs. in 000 1,515,337 1,030,345 873,185 629,246 504,469 489,318 Total assets Rs. in 000 2,481,024 2,364,932 1,524,452 1,319,885 1,164,426 999,291 Equity Rs. in 000 1,836,335 1,557,894 825,933 518,284 458,097 386,642 Long term loans & leases Rs. in 000 41,332 92,707 75,091 83,843 25,974 56,417 Current assets Rs. in 000 943,727 1,320,570 618,881 670,609 649,513 491,979 Stocks Rs. in 000 333,875 337,658 260,073 319,781 331,603 293,723 Debtors Rs. in 000 281,158 249,155 185,228 225,236 127,770 110,922 Cash and bank Balances Rs. in 000 51,063 37,633 78,903 17,436 82,182 7,583 Creditors Rs. in 000 128,045 127,469 82,923 191,474 199,457 111,502 Current liabilities Rs. in 000 443,987 592,197 501,811 614,880 594,271 457,034 Non-Current liabilities Rs. in 000 200,703 214,841 196,708 186,720 112,059 155,616 Total liabilities Rs. in 000 644,690 807,038 698,519 801,600 706,330 612,649 Short term finances Rs. in 000 311,800 456,605 414,784 418,089 373,527 322,310 Working capital Rs. in 000 469,658 443,378 352,712 351,941 257,893 291,389
Profit and Loss Account
Sales Rs. in 000 2,321,851 2,165,703 1,718,561 1,415,829 1,399,020 1,191,922 Cost of sales Rs. in 000 1,739,357 1,672,903 1,371,825 1,183,530 1,145,326 977,548 Gross profit Rs. in 000 582,493 492,801 346,736 232,299 253,694 214,374 Profit before taxation Rs. in 000 393,543 286,310 175,120 78,603 96,547 80,898 Depreciation Rs. in 000 89,120 74,345 63,523 48,868 44,178 42,215 Amortization Rs. in 000 1,588 1,387 1,342 - - - Financial cost Rs. in 000 38,439 59,028 56,462 50,352 47,813 50,571 Profit after tax Rs. in 000 355,791 229,745 121,933 60,188 71,455 55,763 EBIT Rs. in 000 431,982 345,338 231,582 128,954 144,360 131,469 EBITDA Rs. in 000 522,690 421,070 296,447 177,822 188,538 173,684
Cash Flow Statement
Cash flow from operating activities Rs. in 000 343,050 203,923 212,996 61,060 153,316 43,475 Cash flow from investing activities Rs. in 000 (54,987) (756,056) (98,246) (48,640) (62,883) (59,713)Cash flow from financing activities Rs. in 000 (135,565) 404,476 (65,105) 1,560 (70,720) 29,853 Opening cash & cash equivalents Rs. in 000 (151,704) (4,048) (53,694) (67,674) (87,387) (101,002)Closing cash & cash equivalents Rs. in 000 793 (151,704) (4,048) (53,694) (67,674) (87,387)
47Annual Report 2016

Six Years Financial Information
Signi�cant Ratios 2016 2015 2014 2013 2012 2011
Pro�tability
Gross profit ratio %age 25% 23% 20% 16% 18% 18%Net profit ratio %age 15% 11% 7% 4% 5% 5%EBIDTA margin to sales %age 23% 19% 17% 13% 13% 15%Return on equity %age 19% 15% 15% 12% 16% 14%Return on capital employed %age 20% 18% 16% 11% 15% 14%
Liquidity / Leverage
Current ratio Times 2.13 2.23 1.23 1.09 1.09 1.08Quick/Acid test ratio Times 1.37 1.66 0.72 0.57 0.53 0.43Cash to current liabilities %age 12% 6% 16% 3% 14% 2%Cash flow from operations to sales %age 20% 15% 17% 7% 13% 7%
Activity/Turnover Ratios
Inventory turnover ratio Times 5.18 5.60 4.73 3.63 3.66 3.95No of days in inventory Days 70.46 65.21 77.14 100.44 99.64 92.29Debtor turnover ratio Times 8.76 9.97 8.37 8.02 11.72 10.62No of days in receivables Days 41.68 36.60 43.59 45.50 31.14 34.36Creditor turnover ratio Times 13.61 15.90 10.00 6.05 7.37 8.54No of days in payables Days 26.81 22.95 36.50 60.28 49.55 42.72Fixed assets turnover ratio Times 1.53 2.10 1.97 2.25 2.77 2.44Total assets turnover ratio Times 0.94 0.92 1.13 1.07 1.20 1.19Operating cycle Days 85.33 78.86 84.23 85.66 81.23 83.92
Investment/Market Ratios Earning per share - Reported Rs. 4.60 3.48 2.10 1.46 1.73 1.75Dividend yield ratio* %age 3.2% 1.8% N/A N/A N/A N/ADividend payout ratio* %age 32.6% 28.7% N/A N/A N/A N/ADividend cover ratio Times 3.07 3.48 2.10 0.00 0.00 1.25Cash dividend per share** Rs. 1.50 1.00 1.00 0.00 0.00 1.40Market value per share at the year end* Rs. 46.90 54.87 N/A N/A N/A N/AMarket value per share high* Rs. 67.13 64.25 N/A N/A N/A N/AMarket value per share low* Rs. 37.00 31.49 N/A N/A N/A N/ABreakup value per share (without land’s revaluation surplus) Rs. 20.81 17.21 10.33 12.57 13.89 15.95Breakup value per share (with land’s revaluation surplus) Rs. 23.74 20.14 14.24 12.57 13.89 15.95
* Cash and cash equivalents represents the cash & bank balances net of short term running finances
48 SPEL | Reliable No Matter What

Signi�cant Ratios 2016 2015 2014 2013 2012 2011
Capital Structure Ratios
Financial leverage ratio Times 0.19 0.35 0.59 0.97 0.87 0.98Operating leverage ratio Times 0.55 0.25 0.34 -0.92 0.06 0.00Weighted average cost of debt %age 9% 11% 11% 11% 12% 15%Debt to equity ratio Times 0.06 0.11 0.15 0.25 0.13 0.22Interest cover ratio Times 11.24 5.85 4.10 2.56 3.02 2.60
Return to Shareholders
R.O.E. before tax %age 21% 18% 21% 15% 21% 21%R.O.E. after tax %age 19% 15% 15% 12% 16% 14%EPS Rs. 4.60 3.48 2.10 1.46 1.73 1.75
Solvency
Debtors turnover Times 8.76 9.97 8.37 8.02 11.72 10.62Creditors turnover Times 13.61 15.90 10.00 6.05 7.37 8.54
Other Information
Sale growth rate %age 7% 26% 21% 1% 17% 8%
* N/A refers to “not applicable” as the Company was not listed during those years. ** This includes interim dividend paid during the year and Final dividend to be approved at annual general meeting to be held on 21-Sep-2016.
49Annual Report 2016

Graphical Presentation
2016 Assets (Rs. in 000)
1,515,337
943,727
Fixed assets Current assets
2015 Assets (Rs. in 000)
1,320,570 1,030,345
Fixed assets Current assets
2016 Equity and Liabilites (Rs. in 000)
1,836,335
200,703
443,987
Equity Non-Current Liabilites Current Liabilites
2015 Equity and Liabilites (Rs. in 000)
1,557,894
214,841
592,197
Equity Non-Current Liabilites Current Liabilites
Total Assets
Year
(Rs.
in 0
00
)
0
500,000
1,000,000
1,500,000
2,000,000
2,500,000
3,000,000
2011 2012 2013 2014 2015 2016
999,291
1,164,4261,319,885
1,524,452
2,364,9322,481,024
Fixed Assets
Year
(Rs.
in 0
00
)
0
200,000
400,000
600,000
800,000
1,000,000
1,200,000
1,400,000
1,600,000
2011 2012 2013 2014 2015 2016
489,318 504,469
629,246
873,185
1,030,345
1,515,337
50 SPEL | Reliable No Matter What

Sales
Year
(Rs.
in 0
00
)
0
500,000
1,000,000
1,500,000
2,000,000
2,500,000
2011 2012 2013 2014 2015 2016
1,919,922
1,399,020 1,415,829
1,718,561
2,165,703
2,321,851
Gross Profit
(Rs.
in 0
00
)
0
100,000
200,000
300,000
400,000
500,000
600,000
700,000
2011 2012 2013 2014 2015 2016
214,374
253,694
346,736
232,299
492,801
582,493
Year
Profit After Tax
(Rs.
in 0
00
)
0
50,000
100,000
150,000
200,000
250,000
300,000
350,000
400,000
2011 2012 2013 2014 2015 2016
55,76371,455
121,933
60,188
229,745
355,791
Year
EPS(R
up
ees)
0
0.50
1.00
1.50
2.00
2.50
3.00
3.50
4.00
4.50
5.00
2011 2012 2013 2014 2015 2016
1.75 1.73
2.10
1.46
3.48
4.60
Year
Current Ratio
(Tim
es)
0
0.25
0.50
0.75
1.00
1.25
1.50
1.75
2.00
2.25
2.50
2011 2012 2013 2014 2015 2016
1.08 1.09
1.23
1.09
2.232.13
Year
Return on Equity
2011 2012 2013 2014 2015 2016
Year
14%
16%
12%
15% 15%
19%
0
5%
10%
15%
20%
25%
Graphical Presentation
51Annual Report 2016

2016
20
15
2014
20
13
2012
20
11
Rs. in
000
%
Rs. in
000
%
Rs. in
000
%
Rs. in
000
%
Rs. in
000
%
Rs. in
000
%
Nom
encla
ture
Equit
y and
rese
rves
1,60
9,392
64
.87
1,33
0,951
56
.28
598,9
90
39.29
51
8,284
39
.27
458,0
97
39.34
38
6,642
38
.69Su
rplus
on re
valua
tion o
f land
22
6,943
9.1
5 22
6,943
9.6
0 22
6,943
14
.89
–
–
–
–
–
–
Long
term
loan
s 24
,585
0.99
63,32
6 2.6
8 34
,147
2.24
–
–
–
–
–
–
Non c
urren
t liab
ilities
17
6,117
7.1
0 15
1,516
6.4
1 16
2,561
10
.66
186,7
20
14.15
11
2,059
9.6
2 15
5,616
15
.57To
tal cu
rrent
liabil
ities
443,9
87
17.90
59
2,197
25
.04
501,8
11
32.92
61
4,880
46
.59
594,2
71
51.04
45
7,034
45
.74
2,
481,0
24
100.0
0 2,
364,9
32
100.0
0 1,
524,4
52
100.0
0 1,
319,8
85
100.0
0 1,
164,4
26
100.0
0 99
9,291
10
0.00
Prop
erty p
lant a
nd eq
uipme
nt 1,
515,3
37
61.08
1,
030,3
45
43.57
87
3,185
57
.28
629,2
46
47.67
50
4,469
43
.32
489,3
18
48.97
Long
Term
Inve
stmen
ts 43
8 0.0
2 2,
546
0.11
4,49
6 0.2
9 4,
417
0.33
3,91
6 0.3
4 4,
157
0.42
Non c
urren
t ass
ets - O
thers
21,52
2 0.8
7 11
,471
0.49
17,99
0 1.1
8 15
,614
1.18
6,52
8 0.5
6 13
,838
1.38
Stores
spare
s and
loos
e too
ls 17
,330
0.70
15,96
6 0.6
8 9,
666
0.63
1,60
3 0.1
2 2,
023
0.17
1,75
4 0.1
8Sto
ck in
trade
31
6,545
12
.76
321,6
91
13.60
25
0,407
16
.43
318,1
79
24.11
32
9,580
28
.30
291,9
69
29.22
Trade
debts
28
1,158
11
.33
249,1
55
10.54
18
5,228
12
.15
225,2
36
17.06
12
7,770
10
.97
110,9
22
11.10
Incom
e Tax
Rec
eivab
les
146,3
48
5.90
84,90
2 3.5
9 80
,833
5.30
92,56
3 7.0
1 76
,945
6.61
67,03
3 6.7
1Sh
ort Te
rm In
vestm
ent
75,00
0 3.0
2 58
0,500
24
.55
–
–
–
–
8,88
5 0.7
6 –
–
Ad
vanc
es, d
epos
its, pr
epay
ments
and o
ther re
ceiva
bles
56,28
4 2.2
7 30
,722
1.30
23,74
4 1.5
6 15
,592
1.18
22,12
9 1.9
0 12
,718
1.27
Cash
and B
ank B
alanc
es
51,06
3 2.0
6 37
,633
1.59
78,90
3 5.1
8 17
,436
1.32
82,18
2 7.0
6 7,
583
0.76
2,48
1,024
10
0.00
2,36
4,932
10
0.00
1,52
4,452
10
0.00
1,31
9,885
10
0.00
1,16
4,426
10
0.00
999,2
91
100.0
0
Nom
encla
ture
Sales
- net
2,32
1,851
10
0.00
2,16
5,703
10
0.00
1,71
8,561
10
0.00
1,41
5,829
10
0.00
1,39
9,020
10
0.00
1,19
1,922
10
0.00
Cost
of sa
les
1,73
9,357
74
.91
1,67
2,903
77
.25
1,37
1,825
79
.82
1,18
3,530
83
.59
1,14
5,326
81
.87
977,5
48
82.01
Gros
s pro
�t
582,4
93
25.09
49
2,801
22
.75
346,7
36
20.18
23
2,299
16
.41
253,6
94
18.13
21
4,374
17
.99Ad
min e
xpen
ses
116,7
24
5.03
104,3
35
4.82
80,50
7 4.6
8 70
,852
5.00
68,65
5 4.9
1 57
,092
4.79
Sellin
g and
distr
ibutio
n exp
ense
s 47
,445
2.04
42,41
7 1.9
6 33
,102
1.93
33,33
5 2.3
5 39
,611
2.83
30,47
1 2.5
6
Oper
atin
g pr
o�t
418,3
25
18.02
34
6,049
15
.98
233,1
27
13.57
12
8,112
9.0
5 14
5,428
10
.39
126,8
11
10.64
Othe
r cha
rges
29
,892
1.29
30,90
2 1.4
3 13
,159
0.77
4,49
3 0.3
2 7,
916
0.57
6,00
1 0.5
0Fin
ance
cost
38,43
9 1.6
6 59
,028
2.73
56,46
2 3.2
9 50
,352
3.56
47,81
3 3.4
2 50
,571
4.24
349,9
93
15.07
25
6,120
11
.83
163,5
06
9.51
73,26
7 5.1
7 89
,699
6.41
70,23
8 5.8
9
Othe
r inco
me
43,55
0 1.8
8 30
,191
1.39
11,61
4 0.6
8 4,
835
0.34
7,08
9 0.5
1 10
,659
0.89
Share
of af
ter ta
x profi
t/(los
s) of
an as
socia
ted co
mpan
y –
–
–
–
–
–
50
0 0.0
4 -24
1 -0.
02
–
–
Pro�
t bef
ore t
ax
393,5
43
16.95
28
6,310
13
.22
175,1
20
10.19
78
,603
5.55
96,54
7 6.9
0 80
,898
6.79
Taxa
tion
37
,752
1.63
56,56
5 2.6
1 53
,187
3.09
18,41
5 1.3
0 25
,092
1.79
25,13
4 2.1
1Pr
ofit a
fter ta
x 35
5,791
15
.32
229,7
45
10.61
12
1,933
7.1
0 60
,188
4.25
71,45
5 5.1
1 55
,763
4.68
Vertical Financial Analysis
52 SPEL | Reliable No Matter What

Horizontal Financial Analysis 20
16
2015
20
14
2013
20
12
2011
Rs. in
000
%
Rs. in
000
%
Rs. in
000
%
Rs. in
000
%
Rs. in
000
%
Rs. in
000
%
Nom
encla
ture
Equit
y and
rese
rves
1,60
9,392
20
.92
1,33
0,951
12
2.20
598,9
90
15.57
51
8,284
13
.14
458,0
97
18.48
38
6,642
16
.85Su
rplus
on re
valua
tion o
f land
22
6,943
–
22
6,943
–
22
6,943
10
0.00
–
–
–
–
–
–
Long
term
loan
s 24
,585
-61.18
63
,326
85.45
34
,147
100.0
0 –
–
–
–
–
–
No
n curr
ent li
abilit
ies
176,1
17
16.24
15
1,516
-6.
79
162,5
61
-12.94
18
6,720
66
.63
112,0
59
-27.99
15
5,616
52
.62To
tal cu
rrent
liabil
ities
443,9
87
-25.03
59
2,197
18
.01
501,8
11
-18.39
61
4,880
3.4
7 59
4,271
30
.03
457,0
34
8.11
2,48
1,024
4.9
1 2,
364,9
32
55.13
1,
524,4
52
15.50
1,
319,8
85
13.35
1,
164,4
26
16.53
99
9,291
16
.79
Prop
erty p
lant a
nd eq
uipme
nt 1,
515,3
37
47.07
1,
030,3
45
18.00
87
3,185
38
.77
629,2
46
24.73
50
4,469
3.1
0 48
9,318
15
.66Lo
ng te
rm in
vestm
ents
438
-82.79
2,
546
-43.38
4,
496
1.81
4,41
7 12
.77
3,91
6 -5.
79
4,15
7 0.0
0No
n curr
ent a
ssets
- othe
rs 21
,522
87.62
11
,471
-36.23
17
,990
15.21
15
,614
139.1
9 6,
528
-52.83
13
,838
46.52
Stores
spare
s and
loos
e too
ls 17
,330
8.54
15,96
6 65
.18
9,66
6 50
3.12
1,60
3 -20
.78
2,02
3 15
.33
1,75
4 -47
.59Sto
ck in
trade
31
6,545
-1.
60
321,6
91
28.47
25
0,407
-21
.30
318,1
79
-3.46
32
9,580
12
.88
291,9
69
48.00
Trade
debts
28
1,158
12
.84
249,1
55
34.51
18
5,228
-17
.76
225,2
36
76.28
12
7,770
15
.19
110,9
22
-2.23
Incom
e tax
rece
ivable
s 14
6,348
72
.37
84,90
2 5.0
3 80
,833
-12.67
92
,563
20.30
76
,945
14.79
67
,033
27.18
Short
term
inve
stmen
t 75
,000
-87.08
58
0,500
10
0.00
–
–
–
-100.0
0 8,
885
100.0
0 –
-10
0.00
Adva
nces
, dep
osits,
prep
ayme
nts an
d othe
r rece
ivable
s 56
,284
83.20
30
,722
29.39
23
,744
52.28
15
,592
-29.54
22
,129
73.99
12
,718
4.61
Cash
and b
ank b
alanc
es
51,06
3 35
.68
37,63
3 -52
.30
78,90
3 35
2.52
17,43
6 -78
.78
82,18
2 98
3.82
7,58
3 -80
.54
2,
481,0
24
4.91
2,36
4,932
55
.13
1,52
4,452
15
.50
1,31
9,885
13
.35
1,16
4,426
16
.53
999,2
91
16.79
Sales
- net
2,32
1,851
7.2
1 2,
165,7
03
26.02
1,
718,5
61
21.38
1,
415,8
29
1.20
1,39
9,020
17
.38
1,19
1,922
8.4
6Co
st of
sales
1,
739,3
57
3.97
1,67
2,903
21
.95
1,37
1,825
15
.91
1,18
3,530
3.3
4 1,
145,3
26
17.16
97
7,548
11
.01
Gros
s pro
�t
582,4
93
18.20
49
2,801
42
.13
346,7
36
49.26
23
2,299
-8.
43
253,6
94
18.34
21
4,374
-1.
82Ad
min e
xpen
ses
116,7
24
11.87
10
4,335
29
.60
80,50
7 13
.63
70,85
2 3.2
0 68
,655
20.25
57
,092
5.21
Sellin
g and
distr
ibutio
n exp
ense
s 47
,445
11.85
42
,417
28.14
33
,102
-0.70
33
,335
-15.84
39
,611
30.00
30
,471
2.22
Oper
atin
g pro
�t
418,3
25
20.89
34
6,049
48
.44
233,1
27
81.97
12
8,112
-11
.91
145,4
28
14.68
12
6,811
-5.
56Ot
her c
harg
es
29,89
2 -3.
27
30,90
2 13
4.83
13,15
9 19
2.90
4,49
3 -43
.24
7,91
6 31
.91
6,00
1 -7.
77Fin
ance
cost
38,43
9 -34
.88
59,02
8 4.5
4 56
,462
12.14
50
,352
5.31
47,81
3 -5.
45
50,57
1 36
.11
349,9
93
36.65
25
6,120
56
.64
163,5
06
123.1
6 73
,267
-18.32
89
,699
27.71
70
,238
-22.48
Othe
r inco
me
43,55
0 44
.25
30,19
1 15
9.96
11,61
4 14
0.21
4,83
5 -31
.80
7,08
9 -33
.49
10,65
9 20
9.94
Share
of af
ter ta
x profi
t/(los
s) of
an as
socia
ted co
mpan
y –
–
–
–
–
-1
00.00
50
0 30
7.76
-240.7
9 -10
0.00
–
0.00
Pro�
t bef
ore t
ax
393,5
43
37.45
28
6,310
63
.49
175,1
20
122.7
9 78
,603
-18.59
96
,547
19.35
80
,898
-13.98
Taxa
tion
37
,752
-33.26
56
,565
6.35
53,18
7 18
8.83
18,41
5 -26
.61
25,09
2 -0.
17
25,13
4 -27
.16Pr
ofit a
fter ta
x 35
5,791
54
.86
229,7
45
88.42
12
1,933
10
2.59
60,18
8 -15
.77
71,45
5 28
.14
55,76
3 -6.
35
53Annual Report 2016

Comments on Ratios Profitability: The Company has been performing well over the last six years. The net profit ratio has increased from 5% in the year 2011 to 15% in 2016 whereas the GP ratio has improved from 18% in the year 2011 to 25% in the year 2016. The improvement was result of year on sales growth and effective & efficient utilization of economic resources. This resulted in an improved return on equity of 19% compared to 14% in the base year.
Liquidity: With better profitability, improved cash flows and equity injection, to finance the fixed capital expenditure, the liquidity of the company has strengthened during the last six years.
Activity / Turnover: The Company maintains reasonable inventory and debtor turn-over ratios as per the industry practice. The Company strives to implement efficient and effective inventory management systems which are helping in maintaining the inventory turnover at optimum level. Most of raw materials of the Company are imported; hence, the Company has to maintain reasonable levels of stocks. The Company extends credit to its customers keeping in view the credit worthiness of the customer. The Company has strong relation with creditors to assure smooth supply of goods and services for which the Company has to keep creditors turnover at an attractive level.
Investment / Market Ratios: The Company got listed during the FY 2014-15, hence, the data for market price of the shares is not available for the last six years. The EPS has improved from Rs. 1.75 in 2011 to Rs. 4.6 in 2016 whereas the break-up value has increased from Rs. 15.95 per share to Rs. 23.74 per share in 2016.
Capital Structure: The Company continuously monitors its capital structure and aims to keep it at its optimum level. Currently, the Company has a strong debt and equity ratio having lesser interest cost and lower credit risk.
Comments on Horizontal Analysis The Company has been performing well over the last six years. The net profit has increased from Rs. 55.76 million in the year 2011 to Rs. 355.79 million in 2016. The gross profit has improved from Rs. 214.37 million in the year 2011 to Rs. 582.49 million in the year 2016. The improvement was mainly caused to the year on sales growth and effective and efficient utilization of economic resources. This resulted in an improved return on equity of 19% from 14% in the base year.
During the last six years, liquidity of the Company has improved significantly and the capital structure has also improved. A significant amount has been invested in property, plant and equipment to cater for growing needs of the customers.
Comments on Vertical AnalysisThe sales revenue of the Company increased by 7.2% from Rupees 2,166 million to Rupees 2,322 million. The gross profit of the company stood at 25.09% as compared to 22.75% in the last year. The Company has witnessed a net profit ratio of 15.32% which is 4.7% higher compared to net profit ratio of last year .
To increase productivity and to cater to growing market demand, the Company invested Rs. 481 million (2015: Rs. 121 million) in Plant and Machinery. This investment helped achieve higher productivity, lower cost and in getting tax credits. Significant amount has also been spent for technology automation to ensure better quality, timely deliveries and improved efficiency.
Comments on Cash FlowsCash Flow from Operating Activities: There is an increase in cash flows from operating activities due to higher profitability from FY 2011 to FY 2016.
Cash Flows from Investing Activities: Net cash out flows from investing activities represent investment in plant and machinery, which was envisaged, at the time of initial public offering.
Cash Flows from Financing Activities: Cash outflow from financing activities increased during the current year because there was no equity injection in the current year, increased dividend payout and repayment of long term loans.
Comments on Financial Analysis
54 SPEL | Reliable No Matter What

2016Distribution,
administration andother expenses
4%
Employeesremuneration
including WPPF8%
Financial charges1%
Government taxesincluding WWF
16%
Profit for the Year13%
Other29%
Cost of Sales exluding
employees’ remuneration
58%
2015Distribution,
administration andother expenses
4%
Employeesremuneration
including WPPF8%
Financial charges2%
Government taxesincluding WWF
17%
Profit for the Year9%
Other26%
Cost of Sales exluding
employees’ remuneration
60%
Statement of Wealth Generated and Distributed
2016 2015
Rs. in 000 % Rs.in 000 %
Total Revenue inclusive of sales tax 2,723,549 98 2,533,780 99Other Income 43,550 2 30,191 1 2,767,099 100 2,563,971 100
WEALTH DISTRIBUTION
Cost of Sales excluding employees’ remuneration 1,594,920 58 1,535,175 60Distribution, administration and other expenses 104,916 4 103,893 4Employees remuneration including WPPF 225,547 8 206,497 8Financial charges 38,439 1 59,028 2Government taxes including WWF 447,486 16 429,633 17Profit for the Year 355,791 13 229,745 9 2,767,099 100 2,563,971 100
55Annual Report 2016

Review Report to the Members on the Statement of Compliance with the Code of Corporate Governance
We have reviewed the enclosed Statement of Compliance with the best practices contained in the Code of Corporate Governance (‘‘the Code’’) prepared by the Board of Directors of Synthetic Products Enterprises Limited (“the Company”) for the year ended 30 June 2016 to comply with the requirements of Listing Regulations of the Pakistan Stock Exchange Limited where the Company is listed.
The responsibility for compliance with the Code is that of the Board of Directors of the Company. Our responsibility is to review, to the extent where such compliance can be objectively verified, whether the Statement of Compliance reflects the status of the Company’s compliance with the provisions of the Code and report if it does not and to highlight any non-compliance with the requirements of the Code. A review is limited primarily to inquiries of the Company’s personnel and review of various documents prepared by the Company to comply with the Code.
As a part of our audit of the financial statements we are required to obtain an understanding of the accounting and internal control systems sufficient to plan the audit and develop an effective audit approach. We are not required to consider whether the Board of Directors’ statement on internal control covers all risks and controls or to form an opinion on the effectiveness of such internal controls, the Company’s corporate governance procedures and risks.
The Code requires the Company to place before the Audit Committee, and upon recommendation of the Audit Committee, place before the Board of Directors for their review and approval its related party transactions distinguishing between transactions carried out on terms equivalent to those that prevail in arm’s length transactions and transactions which are not executed at arm’s length price and recording proper justification for using such alternate pricing mechanism. We are only required and have ensured compliance of this requirement to the extent of the approval of the related party transactions by the Board of Directors upon recommendation of the Audit Committee. We have not carried out any procedures to determine whether the related party transactions were undertaken at arm’s length price or not.
Based on our review, nothing has come to our attention which causes us to believe that the Statement of Compliance does not appropriately reflect the Company’s compliance, in all material respects, with the best practices contained in the Code as applicable to the Company for the year ended 30 June 2016.
Lahore KPMG Taseer Hadi & Co.Date: 26 July 2016 Chartered Accountants
(M. Rehan Chughtai)
56 SPEL | Reliable No Matter What

Statement of Compliance with Code ofCorporate GovernanceFor the year ended 30 June 2016
This statement is being presented to comply with the Code of Corporate Governance (the Code) set out in the listing regulations of Pakistan Stock Exchange Limited for the purpose of establishing a framework of good governance, whereby a listed company is managed in compliance with the best practices of corporate governance.
The company has applied the principles contained in the CCG in the following manner:
1. The company encourages representation of independent non-executive directors and directors representing minority interests on its board of directors. At present the Board includes:
Category Name
Independent Directors
Dr. Syed Salman Ali ShahMr. Khawar Anwar KhawajaMr. Muhammad Tabassum Munir
Non Executive Directors
Mr. Almas HyderDr. Sheikh Muhammad NaqiMr. Raza Haider NaqiMr. Sheikh Naseer Hyder
Executive Directors Mr. Zia Hyder NaqiMr. Abid Saleem Khan
The independent directors meets the criteria of independence under clause 5.19.1 (b) of the CCG.
2. The directors have confirmed that none of them is serving as a director on more than seven listed companies, including this Company.
3. All the resident directors of the company are registered as taxpayers and none of them has defaulted in payment of any loan to a banking company, a DFI or an NBFI or, being a member of a stock exchange, has been declared as a defaulter by that stock exchange.
4. No casual vacancy occurred on the board during the
current year.
5. The company has prepared a “Code of Conduct” and has ensured that appropriate steps have been taken to disseminate it throughout the company along with its supporting policies and procedures.
6. The board has developed a vision/mission statement, overall corporate strategy and significant policies of the company. A complete record of particulars of significant policies along with the dates on which they were approved or amended has been maintained.
7. All the powers of the board have been duly exercised and decisions on material transactions, including appointment and determination of remuneration and terms and conditions of employment of the CEO and other executive and non-executive directors have been taken by board.
8. The meetings of the board were presided over by the Chairman and the board met at least once in every quarter. Written notices of the board meetings, along with agenda and working papers, were circulated at least seven days before the meeting. The minutes of the meeting were appropriately recorded and circulated.
9. Dr. Syed Salman Ali Shah and Mr. Muhammad Tabassum Munir attended directors training program conducted by the Institute of Chartered Accountants of Pakistan this year.
10. The board has approved appointment of CFO, Company Secretary and Head of Internal Audit, including their remuneration and terms and conditions of employment.
11. The directors’ report for this year has been prepared in compliance with the requirements of the CCG and fully describes the salient matters required to be disclosed.
12. The financial statements of the company were duly endorsed by CEO and CFO before approval of the board.
13. The Directors, CEO and Executives do not hold any interest in the shares of the company other than that disclosed in the pattern of shareholding.
14. The company has complied with all the corporate and financial reporting requirements of the CCG.
57Annual Report 2016

15. The board has formed an Audit Committee. It comprises of five members, all of them are Non-Executive Directors and the Chairman of the committee is an independent director.
16. The meetings of the audit committee were held at least once every quarter prior to approval of interim and final results of the company and as required by the CCG. The terms of reference of the committee have been formed and advised to the committee for compliance.
17. The board has formed a Human Resource and Remuneration Committee. It comprises of six members, of whom four are non-executive directors including the Chairman of the committee.
18. The Board has set up an effective Internal Audit function, which is considered suitably qualified and experienced for the purpose and is conversant with policies and procedures of the Company.
19. The statutory auditors of the company have confirmed that they have been given a satisfactory rating under the quality control review program of the ICAP, that they or any of the partners of the firm, their spouses and minor children do not hold shares of the company and that the firm and all its partners are in compliance with International Federation of Accountants (IFAC) guidelines on code of ethics as adopted by the ICAP.
20. The statutory auditors or the persons associated with them have not been appointed to provide other services except in accordance with the listing regulations and the auditors have confirmed that they have observed IFAC guidelines in this regard.
21. The ‘closed period’, prior to the announcement of interim/final results, and business decisions, which may materially affect the market price of company’s securities, was determined and intimated to directors, employees and stock exchange(s).
22. Material/price sensitive information has been disseminated among all market participants at once through stock exchange(s).
23. We confirm that all other material principles enshrined in the CCG have been complied with.
Zia Hyder NaqiChief Executive Officer
Dated: 26 July 2016Lahore.
58 SPEL | Reliable No Matter What


59Annual Report 2016
Financial StatementsFor the year ended 30 June 2016

60 SPEL | Reliable No Matter What

61Annual Report 2016
Auditors’ Report to The Members
We have audited the annexed unconsolidated balance sheet of Synthetic Products Enterprises Limited (“the Company”) as at 30 June 2016, the related unconsolidated profit and loss account, unconsolidated statement of comprehensive income, unconsolidated cash flow statement and unconsolidated statement of changes in equity together with the notes forming part thereof, for the year ended and we state that we have obtained all the information and explanations which, to the best of our knowledge and belief, were necessary for the purposes of our audit.
It is the responsibility of the Company’s management to establish and maintain a system of internal control, and prepare and present the above said statements in conformity with the approved accounting standards and the requirements of the Companies Ordinance, 1984. Our responsibility is to express an opinion on these statements based on our audit.
We conducted our audit in accordance with the auditing standards as applicable in Pakistan. These standards require that we plan and perform the audit to obtain reasonable assurance about whether the above said statements are free of any material misstatement. An audit includes examining on a test basis, evidence supporting the amounts and disclosures in the above said statements. An audit also include assessing the accounting policies and significant estimates made by management, as well as, evaluating the overall presentation of the above said statements. We believe that our audit provides a reasonable basis for our opinion and, after due verification, we report that:
a) in our opinion, proper books of account have been kept by the Company as required by the Companies Ordinance, 1984;
b) in our opinion:
i) the unconsolidated balance sheet and unconsolidated profit and loss account together with the notes thereon have been drawn up in conformity with the Companies Ordinance, 1984, and are in agreement with the books of account and are further in accordance with accounting policies consistently applied, except for the change as indicated in note 3.1 with which we concur;
ii) the expenditure incurred during the year was for the purpose of the Company’s business; and
iii) the business conducted, investments made and the expenditure incurred during the year were in accordance with the objects of the Company;
c) in our opinion and to the best of our information and according to the explanations given to us, the unconsolidated balance sheet, unconsolidated profit and loss account, unconsolidated statement of comprehensive income, unconsolidated cash flow statement and unconsolidated statement of changes in equity together with the notes forming part thereof conform with approved accounting standards as applicable in Pakistan, and, give the information required by the Companies Ordinance, 1984, in the manner so required and respectively give a true and fair view of the state of the Company’s affairs as at 30 June 2016 and of the profit, its cash flows and changes in equity for the year then ended; and
d) in our opinion, Zakat deductible at source under the Zakat and Ushr Ordinance, 1980 (XVIII of 1980), was deducted by the Company and deposited in the Central Zakat Fund established under section 7 of that Ordinance.
Date: 26 July 2016 KPMG Taseer Hadi & Co.Lahore Chartered Accountants
(M. Rehan Chughtai)

62 SPEL | Reliable No Matter What
2016 2015 Note Rupees Rupees
Equity And Liabilities
Share capital and reserves
Authorized share capital of Rs. 10 each 5 1,000,000,000 1,000,000,000
Issued, subscribed and paid-up capital 5 773,500,000 773,500,000 Share premium 6 347,391,050 347,391,050 Accumulated profit 488,500,699 210,060,018
1,609,391,749 1,330,951,068
Surplus on revaluation of land 7 226,943,081 226,943,081 Non-current liabilities
Long term finance - secured 8.1 24,585,369 53,306,045 Diminishing musharika - secured 8.2 – 11,069,808 Liabilities against assets subject to finance lease 9 16,746,867 29,381,452 Deferred taxation 10 159,370,532 122,134,405
200,702,768 215,891,710 Current liabilities
Trade and other payables 11 128,044,640 127,468,516 Short term borrowings - secured 12 251,844,351 380,450,601 Current maturity of long term liabilities 13 59,955,727 76,154,092 Accrued mark up 14 4,142,042 7,072,992
443,986,760 591,146,201
2,481,024,358 2,364,932,060
Contingencies and commitments 15 The annexed notes 1 to 46 form an integral part of these unconsolidated financial statements.
Unconsolidated Balance SheetAs at 30 June, 2016
Lahore Chief Executive Director

63Annual Report 2016
2016 2015 Note Rupees Rupees
Assets
Non-current assets
Property, plant and equipment 16 1,515,337,213 1,030,345,221 Intangibles 17 4,291,029 4,207,204 Investment - related party 18 438,245 2,546,005 Long term deposits 19 17,231,046 7,263,948
1,537,297,533 1,044,362,378 Current assets
Stores, spares and loose tools 17,329,657 15,966,041 Stock-in-trade 20 316,544,988 321,691,498 Trade debts - unsecured, considered good 281,157,522 249,155,073 Income tax - net 21 146,348,210 84,901,576 Advances, deposits, prepayments and other receivables 22 56,283,534 30,722,007 Short term investments 23 75,000,000 580,500,000 Cash and bank balances 24 51,062,914 37,633,487
943,726,825 1,320,569,682
2,481,024,358 2,364,932,060
Lahore Chief Executive Director

64 SPEL | Reliable No Matter What
2016 2015 Note Rupees Rupees
Sales - net 25 2,321,850,602 2,165,703,472 Cost of sales 26 (1,739,357,228) (1,672,902,798)
Gross profit 582,493,374 492,800,674 Administrative expenses 27 (116,723,787) (104,335,115)Selling and distribution expenses 28 (47,444,993) (42,416,731)
Operating profit 418,324,594 346,048,828 Other income 29 43,549,944 30,190,882 Other charges 30 (29,892,484) (30,901,663)Finance cost 31 (38,439,289) (59,027,591)
Profit before taxation 393,542,765 286,310,456 Taxation 32 (37,752,084) (56,564,959)
Profit after taxation 355,790,681 229,745,497 Earnings per share - basic and diluted 33 4.60 3.48 The annexed notes 1 to 46 form an integral part of these unconsolidated financial statements.
Unconsolidated Profit and Loss Accountfor the year ended 30 June, 2016
Lahore Chief Executive Director

65Annual Report 2016
2016 2015 Rupees Rupees
Profit after taxation 355,790,681 229,745,497 Other comprehensive income – –
Total comprehensive income for the year 355,790,681 229,745,497 The annexed notes 1 to 46 form an integral part of these unconsolidated financial statements.
Unconsolidated Statement of Comprehensive Incomefor the year ended 30 June, 2016
Lahore Chief Executive Director

66 SPEL | Reliable No Matter What
Capital Revenue reserve reserve
Issued, subscribed Advance and paid-up against Share Accumulated capital share capital premium profit Total
Rupees
As at 30 June 2014 580,000,000 – – 18,989,521 598,989,521
Total comprehensive income for the year
Profit after taxation – – – 229,745,497 229,745,497 Other comprehensive income – – – – –
– – – 229,745,497 229,745,497 Transactions with owners of the Company
Advance received against shares – 580,500,000 – – 580,500,000 Shares issued during the year 19,350,000 shares of Rs. 10 each 193,500,000 (193,500,000) – – – Share premium – (387,000,000) 387,000,000 – –Expenses incurred on issuance of shares – – (39,608,950) – (39,608,950)Interim cash dividend for the year ended 30 June 2015 @ Rs. 0.5 per share – – – (38,675,000) (38,675,000)
193,500,000 – 347,391,050 (38,675,000) 502,216,050
As at 30 June 2015 773,500,000 – 347,391,050 210,060,018 1,330,951,068
Total comprehensive income for the year
Profit after taxation – – – 355,790,681 355,790,681 Other comprehensive income – – – – –
– – – 355,790,681 355,790,681 Transactions with owners of the Company
Final cash dividend for the year ended 30 June 2015 @ Rs. 0.5 per share – – – (38,675,000) (38,675,000)Interim cash dividend for the year ended 30 June 2016 @ Rs. 0.5 per share – – – (38,675,000) (38,675,000)
– – – (77,350,000) (77,350,000)
As at 30 June 2016 773,500,000 – 347,391,050 488,500,699 1,609,391,749
The annexed notes 1 to 46 form an integral part of these unconsolidated financial statements.
Unconsolidated Statement of Change in Equityfor the year ended 30 June, 2016
Lahore Chief Executive Director

67Annual Report 2016
2016 2015 Note Rupees Rupees
Cash flows from operating activities
Cash generated from operations 34 475,922,127 325,813,219
Workers’ Profit Participation Fund and Workers’ Welfare Fund paid (20,620,438) (12,122,756)Finance cost paid (40,322,350) (55,008,182)Taxes paid (61,962,590) (60,116,033)Long term deposits - net (9,967,098) 5,357,244
Cash generated from operating activities 343,049,651 203,923,492
Cash flows from investing activities
Fixed capital expenditure (561,444,827) (185,121,601)Intangibles acquired (1,671,830) (226,200)Proceeds from disposal of property, plant and equipment 929,595 5,117,851 Proceeds from disposal of investment in associate – 4,674,194 Refund of advance for issue of shares 1,700,000 – Short term investments 505,500,000 (580,500,000)
Net cash used in investing activities (54,987,062) (756,055,756)
Cash flows from financing activities
Proceeds from issuance of capital - net – 540,891,050 Principal repayment of lease liability (47,701,543) (47,165,458)Long term finance obtained – 47,250,000 Long term finance and diminishing musharika repaid (21,113,732) (9,197,030)Short term borrowings - net 10,461,442 (88,765,114)Cash dividend paid (77,211,637) (38,537,756)
Net cash generated from / (used in) financing activities (135,565,470) 404,475,692
Net increase / (decrease) in cash and cash equivalents 152,497,119 (147,656,572)Cash and cash equivalents at beginning of the year (151,704,231) (4,047,659)
Cash and cash equivalents at end of the year 35 792,888 (151,704,231) The annexed notes 1 to 46 form an integral part of these unconsolidated financial statements.
Unconsolidated Cash Flow Statementfor the year ended 30 June, 2016
Lahore Chief Executive Director

68 SPEL | Reliable No Matter What
Notes to the Unconsolidated Financial Statementsfor the year ended 30 June, 2016
1 Legal status and nature of business
Synthetic Products Enterprises Limited (“the Company”) was incorporated in Pakistan on 16 May 1982 under the Companies Act, 1913 (now the Companies Ordinance, 1984) as a private limited company. The Company converted into public limited company on 21 July 2008 and subsequently listed on Pakistan Stock Exchange on 10 February 2015. The registered office of the Company is situated at 127-S, Quaid-e-Azam Industrial Estate, Kot Lakhpat, Lahore. The Company is principally engaged in the manufacturing and sale of plastic auto parts, plastic packaging for food and FMCG industry and moulds & dies.
2 Basis of preparation
2.1 Separate financial statements
These financial statements are the separate financial statements of the Company in which investment in subsidiary is accounted for on the basis of direct equity interest rather than on the basis of reported results and net assets of the investee. Consolidated financial statements of the Company are prepared and presented separately.
The Company has the following long term investment:
2016 2015 (Direct holding percentage)
Subsidiary Company
SPEL Pharmatec (Private) Limited 100 100 2.2 Statement of compliance
These unconsolidated financial statements have been prepared in accordance with approved accounting standards as applicable in Pakistan and the requirements of Companies Ordinance, 1984. Approved accounting standards comprise of such International Financial Reporting Standards (“IFRSs”) issued by the International Accounting Standards Board as notified under the provisions of the Companies Ordinance, 1984. Wherever, the requirements of the Companies Ordinance, 1984 or directives issued by the Securities and Exchange Commission of Pakistan differ with the requirements of these standards, the requirements of Companies Ordinance, 1984 or the requirements of the said directives shall prevail.
2.3 Basis of measurement
These unconsolidated financial statements have been prepared under the historical cost convention except for certain items of property, plant and equipment which are stated at revalued amounts as referred in note 3.2.
2.4 Judgments, estimates and assumptions
The preparation of unconsolidated financial statements requires management to make judgments, estimates and assumptions that affect the application of accounting policies and the reported amounts of assets, liabilities, income and expenses. The estimates and associated assumptions and judgments are based on historical experience and various other factors that are believed to be reasonable under the circumstances, the result of which forms the basis of making judgments about carrying values of assets and liabilities that are not readily apparent from other sources. Actual results may differ from these estimates. Estimates and underlying assumptions are reviewed on an ongoing basis. Revisions to accounting estimates are recognized in the period in which the estimate is revised and in any future periods affected. Judgments made by management in the application of approved accounting standards that have significant effect on the financial statements and estimates with a risk of material adjustment in subsequent years are as follows:
2.4.1 Depreciation method, rates and useful lives of property, plant and equipment
The management of the Company reassesses useful lives, depreciation method and rates for each item of property, plant and equipment annually by considering expected pattern of economic benefits that the Company expects to derive from that item and the maximum period up to which such benefits are expected to be available. The rates of depreciation are specified in note 16.1.

69Annual Report 2016
2.4.2 Recoverable amount of assets / cash generating units and impairment
The management of the Company reviews carrying amounts of its assets and cash generating units for possible impairment and makes formal estimates of recoverable amount if there is any such indication.
2.4.3 Taxation
The Company takes into account the current income tax law and decisions taken by appellate authorities while estimating its tax liabilities. Instances where the Company’s views differ from the views taken by the income tax department at the assessment stage and where the Company considers that its view on items of material nature is in accordance with law, the amounts are shown as contingent liabilities.
The Company also regularly reviews the trend of proportion of income between Presumptive Tax Regime income and Normal Tax Regime income and the change in proportions, if significant, is accounted for in year of change.
2.4.4 Provisions
Provisions are based on best estimate of the expenditure required to settle the present obligation at the reporting date, that is, the amount that the Company would rationally pay to settle the obligation at the reporting date or to transfer it to a third party.
2.4.5 Revaluation of property, plant and equipment
Revaluation of property, plant and equipment is carried out by independent professional valuers. The frequency of revaluations depends upon the changes in fair values of the items of land being revalued. When
the fair value of a revalued asset differs materially from its carrying amount, a further revaluation is required. Further the surplus on revaluation is utilized in accordance with the provisions of section 235 of the Companies
Ordinance, 1984. 2.4.6 Stores, spare parts and loose tools
The Company reviews the stores, spare parts and loose tools for possible impairment on an annual basis. Any change in estimates in future years might affect the carrying amounts of the respective items of stores and spare parts and loose tools with a corresponding effect on the provision.
2.4.7 Stock in trade
The Company reviews the carrying amount of stock-in-trade on a regular basis. Carrying amount of stock-in-trade is adjusted where the net realisable value is below the cost.
2.4.8 Provisions against trade debts, advances and other receivables
The Company reviews the recoverability of its trade debts, advances and other receivables to assess amount of bad debts provision required there against on an annual basis.
2.5 Functional and presentation currency
These unconsolidated financial statements have been prepared in Pak Rupees which is the Company’s functional currency.
3 Significant accounting policies
The significant accounting policies adopted in the preparation of these unconsolidated financial statements are set out below. Except for a change as mentioned in note 3.1, the policies have been consistently applied to all the years presented, unless otherwise stated.

70 SPEL | Reliable No Matter What
3.1 During the year the Company has adopted IFRS 13 ‘Fair Value Measurement’ which became effective for the financial periods beginning on or after 1 January 2015. IFRS 13 Fair Value Measurement establishes a single framework for measuring fair value and making disclosures about fair value measurements when such measurements are required or permitted by other IFRSs. It unifies the definition of fair values as the prices that would be received to sell an asset or paid to transfer a liability in an orderly transaction between market participants at the measurement date. It replaces and expands the disclosure requirements about fair value measurements in other IFRSs, including IFRS 7 Financial Instruments Disclosures. As a result, the Company has included the additional disclosure in this regard in note 37.5 to the unconsolidated financial statements. In accordance with the transitional provisions of IFRS 13, the Company has applied the new fair value measurement guidance prospectively and has not provided any comparative information for new disclosures. Notwithstanding the above, the change has no such significant impacts on the measurements of the Company’s financial assets and liabilities. The Company has also adopted IFRS 10 ‘Consolidated Financial Statements’, IFRS 11 ‘Joint Arrangements’, IFRS 12 ‘Disclosure of Interest in Other Entities’ which became applicable from 1 January, 2015, as per the adoption status of IFRS in Pakistan.
The application of IFRS 10, IFRS 11 and IFRS 12 did not have any impact on the unconsolidated financial statements of the Company.
3.2 Property, plant and equipment
Items of property, plant and equipment are measured at cost less accumulated depreciation and accumulated impairment losses with the exception of freehold land, which is measured at revalued amount less accumulated impairment losses and capital work in progress, which is stated at cost less accumulated impairment loss. Cost comprises purchase price, including import duties and non-refundable purchase taxes, after deducting trade discounts and rebates, and includes other costs directly attributable to the acquisition or construction, erection and installation. Cost in relation to certain property, plant and equipment signifies historical cost and borrowing costs as referred to in note 3.19.
Major renewals and improvements to an item of property, plant and equipment are recognized in the carrying amount of the item if it is probable that the embodied future economic benefits will flow to the Company and the cost of renewal or improvement can be measured reliably. The cost of the day-to-day servicing of property, plant and equipment are recognized in unconsolidated profit and loss account as incurred.
The Company recognizes depreciation by applying reducing balance method, over the useful life of each item of property, plant and equipment using rates specified in note 16.1 to the unconsolidated financial statements, except for leasehold land which is amortised using straight line basis. Depreciation on additions to property, plant and equipment is charged from the month in which the item becomes available for use. Depreciation is discontinued from the month in which it is disposed or classified as held for disposal.
Any gain or loss on disposal of property, plant and equipment is recognized in unconsolidated profit and loss
account. Surplus on revaluation is utilized in accordance with the provisions of section 235 of the Companies Ordinance,
1984.
Capital work in progress
Capital work in progress is stated at cost less any identified impairment and includes the expenditures on material, labour and appropriate overheads directly relating to the project. These costs are transferred to property, plant and equipment as and when assets are available for intended use.
Notes to the Unconsolidated Financial Statementsfor the year ended 30 June, 2016

71Annual Report 2016
3.3 Intangibles
The cost of acquisition, development and installation of identifiable software products having finite useful lives of more than one year is recognized as an intangible asset at cost and are amortized on a straight line basis. Subsequent to initial recognition, it is measured at cost less accumulated amortization and accumulated impairment losses, if any. The rate of amortization is specified in note 17.
3.4 Stores, spares and loose tools
These are stated at lower of cost and net realizable value. Cost is determined using the weighted average method. Items in transit are valued at cost comprising invoice value plus other charges paid thereon. The Company reviews the carrying amount of stores and spares on a regular basis and provision is made for obsolescence if there is any change in usage pattern and physical form of related stores, spares and loose tools. Impairment is also made for slow moving items.
3.5 Stock in trade
These are valued at lower of cost and net realizable value, with the exception of stock of waste which is valued at net realizable value. Cost is determined using the following basis:
Raw materials Moving average Packing materials Moving average Work in process Average manufacturing cost Finished goods Average manufacturing cost Stock in transit Invoice price plus related expense incurred up to the reporting date Average manufacturing cost in relation to work in process and finished goods consists of direct material, labour
and a proportion of appropriate manufacturing overheads. Net realizable value signifies the estimated selling price in the ordinary course of business less estimated costs of
completion and estimated costs necessary to make the sale. 3.6 Employee benefits
The Company operates an approved defined contributory provident fund for its employees. Equal contributions are made by the Company and employees at 10.00% of basic salary. The Company’s contribution is charged to unconsolidated profit and loss account currently.
3.7 Investment in equity instruments of subsidiary
Investment in subsidiary company is measured at cost as per the requirements of IAS 27 “Consolidated and Separate Financial Statements”. However, at subsequent reporting dates, the Company reviews the carrying amount of the investment and its recoverability to determine whether there is an indication that such investment has suffered an impairment loss. If any such indication exists the carrying amount of the investment is adjusted to the extent of impairment loss. Impairment losses are recognized as an expense in unconsolidated profit and loss account. Where impairment losses subsequently reverse, the carrying amounts of the investments are increased to the revised recoverable amounts but limited to the extent of initial cost of investments. A reversal of impairment loss is recognized in unconsolidated profit and loss account.
3.8 Loans and receivables
Loans and receivables are non-derivative financial asset with fixed or determinable payments that are not quoted in an active market. They are carried at amortized cost less impairment, if any.

72 SPEL | Reliable No Matter What
3.9 Financial instruments
Financial assets and liabilities are recognized when the Company becomes party to the contractual provisions of the instruments. Financial assets are de-recognized when the Company looses control of the contractual rights that comprise the financial assets. Financial liabilities are de-recognized when they are extinguished, that is, when the obligation specified in the contract is extinguished, cancelled, or expired. Any gain or loss on de-recognizing of the financial assets and financial liabilities is taken to unconsolidated profit and loss account currently.
The particular measurement methods adopted for various financial instruments are disclosed in the individual policy statements associated with each item.
3.10 Off-setting
A financial asset and a financial liability is offset and the net amount reported in the balance sheet if the Company has legally enforceable right to set-off the recognized amounts and intends either to settle on a net basis or to realize the asset and settle the liability simultaneously.
3.11 Regular way purchases and sales of financial assets
Regular way purchases and sales of financial assets are recognized on trade dates.
3.12 Loans and borrowings
Loans and borrowings are classified as ‘financial liabilities at amortized cost’. On initial recognition, these are measured at cost, being fair value at the date the liability is incurred, less attributable transaction costs. Subsequent to initial recognition, these are measured at amortized cost with any difference between cost and value at maturity recognized in the profit and loss account over the period of the borrowings on an effective interest basis.
3.13 Finance leases
Leases in terms of which the Company assumes substantially all risks and rewards of ownership are classified as finance leases. Assets subject to finance lease are classified as ‘property, plant and equipment’. On initial recognition, these are measured at an amount equal to the lower of its fair value and the present value of minimum lease payments. Subsequent to initial recognition, these are measured at cost less accumulated depreciation and accumulated impairment losses. Depreciation, subsequent expenditure, de-recognition, and gains and losses on de-recognition are accounted for in accordance with the respective policies for property, plant and equipment. Liabilities against assets subject to finance lease and deposits against finance lease are classified as ‘financial liabilities at amortized cost’ and ‘loans and receivables’ respectively. Subsequent to initial recognition, minimum lease payments made under finance leases are apportioned between the finance charge and the reduction of outstanding liability. The finance charge is allocated to each period during the lease term so as to produce a constant periodic rate of interest on the remaining balance of the liability. Deposits against finance leases, subsequent to initial recognition are carried at amortised cost, less impairment, if any.
3.14 Operating leases
Leases that do not transfer substantially all risks and rewards of ownership are classified as operating leases. Payments made under operating leases are recognized in unconsolidated profit and loss account on a straight line basis over the lease term.
3.15 Trade and other payables
Trade and other payables are initially recognized at fair value and subsequently at amortized cost using effective interest rate method.
3.16 Provisions and contingencies
Provisions are recognized when the Company has a legal and constructive obligation as a result of past events and it is probable that outflow of resources embodying economic benefits will be required to settle the obligation and a reliable estimate can be made of the amount of obligation. Provision is recognized at an amount that is the
Notes to the Unconsolidated Financial Statementsfor the year ended 30 June, 2016

73Annual Report 2016
best estimate of the expenditure required to settle the present obligation at the reporting date. Where outflow of resources embodying economic benefits is not probable, or where a reliable estimate of the amount of obligation cannot be made, a contingent liability is disclosed, unless the possibility of outflow is remote.
3.17 Trade and other receivables
On initial recognition, these are measured at cost, being their fair value at the date of transaction. Subsequent to initial recognition, these are measured at amortized cost less impairment losses if any, using the effective interest method, with interest recognized in profit and loss account. Bad debts are written off when identified.
3.18 Revenue
Revenue is measured at the fair value of the consideration received or receivable, net of returns allowances, trade discounts and rebates, and represents amounts received or receivable for goods and services provided and other income earned in the normal course of business. Revenue is recognized when it is probable that the economic benefits associated with the transaction will flow to the Company, and the amount of revenue and the associated costs incurred or to be incurred can be measured reliably.
– Revenue from sale of goods is recognized when risks and rewards incidental to the ownership of goods are
transferred to the buyer;
– Dividend income is recognized when the Company’s right to receive payment is established; and
– Interest income is recognized as and when accrued on effective interest method.
3.19 Borrowing costs
Borrowing costs directly attributable to the acquisition, construction or production of qualifying assets, which are assets that necessarily take a substantial period of time to get ready for their intended use or sale, are added to the cost of those assets, until such time as the assets are substantially ready for their intended use or sale. Investment income earned on the temporary investment of specific borrowings pending their expenditure on qualifying asset is deducted from the borrowing costs eligible for capitalization. All other borrowing costs are recognized in unconsolidated profit and loss account as incurred.
3.20 Taxation
Income tax expense comprises current tax and deferred tax. Income tax expense is recognized in unconsolidated profit and loss account except to the extent that it relates to items recognized directly in other comprehensive income, or equity, in which case it is recognized in other comprehensive income, or equity, as the case may be.
Current taxation
Current tax is the amount of tax payable on taxable income for the year, using tax rates enacted or substantively enacted by the reporting date, and any adjustment to the tax payable in respect of previous years. Provision for current tax is based on current rates of taxation in Pakistan after taking into account tax credits, rebates and exemptions available, if any. The amount of unpaid income tax in respect of the current or prior periods is recognized as a liability. Any excess paid over what is due in respect of the current or prior periods is recognized as an asset.
Deferred taxation
Deferred tax is accounted for using the balance sheet approach providing for temporary differences between the carrying amounts of assets and liabilities for financial reporting purposes and the amounts used for tax purposes. In this regard, the effects on deferred taxation of the portion of income that is subject to final tax regime is also considered in accordance with the treatment prescribed by the Institute of Chartered Accountants of Pakistan. Deferred tax is measured at rates that are expected to be applied to the temporary differences when they reverse, based on laws that have been enacted or substantively enacted by the reporting date. A deferred tax liability is recognized for all taxable temporary differences. A deferred tax asset is recognized for deductible temporary

74 SPEL | Reliable No Matter What
differences to the extent that future taxable profits will be available against which temporary differences can be utilized. Deferred tax assets are reviewed at each reporting date and are reduced to the extent that it is no longer probable that the related tax benefit will be realized.
3.21 Earnings per share (EPS)
Basic EPS is calculated by dividing the profit and loss account attributable to ordinary shareholders of the Company by the weighted average number of ordinary shares outstanding during the year.
3.22 Cash and cash equivalents
Cash and cash equivalents comprise running finances, cash balances and call deposits with maturities of three months or less from the acquisition date that are subject to an insignificant risk of changes in their fair value, and are used by the Company in the management of its short-term commitments.
3.23 Foreign currency transactions and balances
Transactions in foreign currencies are translated to the respective functional currencies of the Company at exchange rates at the dates of the transactions. Monetary assets and liabilities denominated in foreign currencies at the reporting date are retranslated to the functional currency at the exchange rate at that date. The foreign currency gain or loss on monetary items is the difference between amortized cost in the functional currency at the beginning of the year, adjusted for effective interest and payments during the year, and the amortized cost in foreign currency translated at the exchange rate at the end of the year.
Non-monetary assets and liabilities that are measured at fair value in a foreign currency are retranslated to the functional currency at the exchange rate prevailing at the date that the fair value was determined. Non-monetary items that are measured based on historical cost in a foreign currency are not translated.
Foreign currency differences arising on retranslation are generally recognized in unconsolidated profit and loss account.
3.24 Impairment
3.24.1 Financial assets
A financial asset is assessed at each reporting date to determine whether there is any objective evidence that it is impaired. Individually significant financial assets are tested for impairment on an individual basis. The remaining financial assets are assessed collectively in groups that share similar credit risk characteristics. A financial asset is considered to be impaired if objective evidence indicates that one or more events have had a negative effect on the estimated future cash flows of the asset.
An impairment loss in respect of a financial asset measured at amortized cost is calculated as the difference between its carrying amount, and the present value of the estimated future cash flows discounted at the original effective interest rate. Impairment loss in respect of a financial asset measured at fair value is determined by reference to that fair value. All impairment losses are recognized in profit and loss account. An impairment loss is reversed if the reversal can be related objectively to an event occurring after the impairment loss was recognized. An impairment loss is reversed only to the extent that the financial asset’s carrying amount after the reversal does not exceed the carrying amount that would have been determined, net of amortization, if no impairment loss had been recognized.
3.24.2 Non-financial assets
The carrying amount of the Company’s non-financial assets, other than inventories and deferred tax assets are reviewed at each reporting date to determine whether there is any indication of impairment. If any such indication exists, then the asset’s recoverable amount is estimated. The recoverable amount of an asset or cash generating unit is the greater of its value in use and its fair value less cost to sell. In assessing value in use, the estimated future cash flows are discounted to their present values using a pre-tax discount rate that reflects current market assessments of the time value of money and the risks specific to the asset or cash generating unit.
Notes to the Unconsolidated Financial Statementsfor the year ended 30 June, 2016

75Annual Report 2016
An impairment loss is recognized if the carrying amount of the assets or its cash generating unit exceeds its estimated recoverable amount. Impairment losses are recognized in unconsolidated profit and loss account. Impairment losses recognized in respect of cash generating units are allocated to reduce the carrying amounts of the assets in a unit on a pro rata basis. Impairment losses recognized in prior periods are assessed at each reporting date for any indications that the loss has decreased or no longer exists. An impairment loss is reversed if there has been a change in the estimates used to determine the recoverable amount. An impairment loss is reversed only to that extent that the asset’s carrying amount after the reversal does not exceed the carrying amount that would have been determined, net of depreciation and amortization, if no impairment loss had been recognized.
3.25 Dividend to ordinary shareholders
Dividend to ordinary shareholders is recognized as a deduction from accumulated profit in statement of changes in equity and as a liability, in the Company’s unconsolidated financial statements in the year in which the dividends are approved.
3.26 Share capital
Incremental cost directly attributable to the issue of ordinary shares are recognised as deduction from equity.
4 New and revised approved accounting standards, interpretations and amendments thereto
The following standards, amendments and interpretations of approved accounting standards will be effective for accounting periods beginning on or after 01 July 2016:
– Amendments to IAS 38 Intangible Assets and IAS 16 Property, Plant and Equipment (effective for annual periods beginning on or after 1 January 2016) introduce severe restrictions on the use of revenue-based amortization for intangible assets and explicitly state that revenue-based methods of depreciation cannot be used for property, plant and equipment. The rebuttable presumption that the use of revenue-based amortization methods for intangible assets is inappropriate can be overcome only when revenue and the consumption of the economic benefits of the intangible asset are ‘highly correlated’, or when the intangible asset is expressed as a measure of revenue. The amendments are not likely to have an impact on Company’s unconsolidated financial statements.
– Investment Entities: Applying the Consolidation Exception (Amendments to IFRS 10 – Consolidated Financial Statements and IAS 28 – Investments in Associates and Joint Ventures) [effective for annual periods beginning on or after 1 January 2016] clarifies (a) which subsidiaries of an investment entity are consolidated; (b) exemption to present consolidated financial statements is available to a parent entity that is a subsidiary of an investment entity; and (c) how an entity that is not an investment entity should apply the equity method of accounting for its investment in an associate or joint venture that is an investment entity. The amendments are not likely to have an impact on Company’s unconsolidated financial statements.
– Accounting for Acquisitions of Interests in Joint Operations – Amendments to IFRS 11 ‘Joint Arrangements’ (effective for annual periods beginning on or after 1 January 2016) clarify the accounting for the acquisition of an interest in a joint operation where the activities of the operation constitute a business. They require an investor to apply the principles of business combination accounting when it acquires an interest in a joint operation that constitutes a business. The amendments are not likely to have an impact on Company’s unconsolidated financial statements.
– Amendment to IAS 27 ‘Separate Financial Statements’ (effective for annual periods beginning on or after 1 January 2016) allows entities to use the equity method to account for investments in subsidiaries, joint ventures and associates in their separate financial statements. The amendment is not likely to have an impact on the Company’s unconsolidated financial statements.
– Agriculture: Bearer Plants [Amendment to IAS 16 and IAS 41] (effective for annual periods beginning on or after 1 January 2016). Bearer plants are now in the scope of IAS 16 Property, Plant and Equipment for measurement and disclosure purposes. Therefore, a company can elect to measure bearer plants at cost. However, the produce growing on bearer plants will continue to be measured at fair value less costs to sell under IAS 41 Agriculture. A

76 SPEL | Reliable No Matter What
bearer plant is a plant that: is used in the supply of agricultural produce; is expected to bear produce for more than one period; and has a remote likelihood of being sold as agricultural produce. Before maturity, bearer plants are accounted for in the same way as self-constructed items of property, plant and equipment during construction. The amendments are not likely to have an impact on Company’s unconsolidated financial statements.
– Amendments to IAS 12 ‘Income Taxes’ are effective for annual periods beginning on or after 1 January 2017. The amendments clarify that the existence of a deductible temporary difference depends solely on a comparison of the carrying amount of an asset and its tax base at the end of the reporting period, and is not affected by possible future changes in the carrying amount or expected manner of recovery of the asset. The amendments are not likely to have an impact on the Company’s unconsolidated financial statements.
Amendments to IAS 7 ‘Statement of Cash Flows’ are part of IASB’s broader disclosure initiative and are effective for annual periods beginning on or after 1 January 2017. The amendments require disclosures that enable users of financial statements to evaluate changes in liabilities arising from financing activities, including both changes arising from cash flow and non-cash changes.
Amendments to IFRS 2 - Share-based Payment clarify the accounting for certain types of arrangements and are effective for annual periods beginning on or after 1 January 2018. The amendments cover three accounting areas (a) measurement of cash-settled share-based payments; (b) classification of share-based payments settled net of tax withholdings; and (c) accounting for a modification of a share-based payment from cash-settled to equity-settled. The new requirements could affect the classification and/or measurement of these arrangements and potentially the timing and amount of expense recognised for new and outstanding awards. The amendments are not likely to have an impact on Company’s unconsolidated financial statements.
Annual Improvements 2012-2014 cycles (amendments are effective for annual periods beginning on or after 1 January 2016). The new cycle of improvements contain amendments to the following standards:
– IFRS 5 Non-current Assets Held for Sale and Discontinued Operations. IFRS 5 is amended to clarify that if an entity changes the method of disposal of an asset (or disposal group) i.e. reclassifies an asset from held for distribution to owners to held for sale or vice versa without any time lag, then such change in classification is considered as continuation of the original plan of disposal and if an entity determines that an asset (or disposal group) no longer meets the criteria to be classified as held for distribution, then it ceases held for distribution accounting in the same way as it would cease held for sale accounting.
– IFRS 7 ‘Financial Instruments- Disclosures’. IFRS 7 is amended to clarify when servicing arrangements on continuing
involvement in transferred financial assets in cases when they are derecognized in their entirety are in the scope of its disclosure requirements. IFRS 7 is also amended to clarify that additional disclosures required by ‘Disclosures: Offsetting Financial Assets and Financial Liabilities (Amendments to IFRS7)’ are not specifically required for inclusion in condensed interim financial statements for all interim periods.
– IAS 19 ‘Employee Benefits’. IAS 19 is amended to clarify that high quality corporate bonds or government bonds used in determining the discount rate should be issued in the same currency in which the benefits are to be paid.
– IAS 34 ‘Interim Financial Reporting’. IAS 34 is amended to clarify that certain disclosures, if they are not included in the notes to interim financial statements and disclosed elsewhere should be cross referred.
The above amendments are not likely to have an impact on the Company’s unconsolidated financial statements.
Notes to the Unconsolidated Financial Statementsfor the year ended 30 June, 2016

77Annual Report 2016
5 Share capital
5.1 Authorized share capital
2016 2015 2016 2015Number of Number of Rupees Rupees
shares shares
100,000,000 100,000,000 Ordinary shares of Rs. 10 each 1,000,000,000 1,000,000,000
5.2 Issued, subscribed and paid-up capital
19,791,940 19,791,940 Ordinary shares of Rs. 10 each, fully paid in cash 197,919,400 197,919,400 49,893,060 49,893,060 Fully paid bonus shares of Rs. 10 each 498,930,600 498,930,600 7,665,000 7,665,000 Shares of Rs. 10 each, issued under scheme of amalgamation 76,650,000 76,650,000
77,350,000 77,350,000 773,500,000 773,500,000
5.3 Reconciliation of ordinary shares
77,350,000 58,000,000 Balance at 01 July 773,500,000 580,000,000 – 19,350,000 Shares issued during the year - note 5.4 – 193,500,000
77,350,000 77,350,000 Balance at 30 June 773,500,000 773,500,000
5.4 During the previous year, the Company issued of 19.35 million ordinary shares of Rs. 10 each at a price of Rs. 30 per share (including premium of Rs. 20 per share), through Initial Public Offer.
5.5 Directors hold 55,236,635 (2015: 56,548,135) ordinary shares of Rs. 10 each of the Company.
6 Share premium
This reserve can be utilized by the Company only for the purpose specified in Section 83(2) of the Companies Ordinance, 1984 (refer note 5.4 for details).
7 Surplus on revaluation of land
Land of the Company was revalued on 30 June 2014 by a firm of independent valuers, Hamid Mukhtar & Company (Private) Limited. The valuation was determined with respect to current market value of similar properties.
2016 2015
Note Rupees Rupees
8 Long term finance - secured
These comprise of:
8.1 Long term finance
- Standard Chartered Bank (Pakistan) Limited (conventional window) 8.1.1 5,005,728 11,680,008 - Loan from customer 8.1.2 49,504,723 48,300,329
54,510,451 59,980,337 Less: Current maturity 13 (29,925,082) (6,674,292)
24,585,369 53,306,045 8.2 Diminishing musharika
- United Bank Limited - I 8.2.1 1,638,800 3,605,360 - United Bank Limited - II 8.2.2 9,431,000 18,862,000
11,069,800 22,467,360 Less: Current maturity 13 (11,069,800) (11,397,552)
– 11,069,808
24,585,369 64,375,853

78 SPEL | Reliable No Matter What
2016 2015 Rupees Rupees
8.3 Type of loans
Interest / mark-up based loans 54,510,451 59,980,337 Islamic mode of financing 11,069,800 22,467,360
65,580,251 82,447,697
8.1.1 The long term finance amounting to Rs. 20.02 million has been obtained from Standard Chartered Bank (Pakistan) Limited (“SCB”) for the purpose of retirement of letters of credit established with Meezan Bank Limited and SCB for import of plant and machinery (“the Assets”) for the Company’s business. The term finance agreement (“the Agreement”) was entered on 21 March 2014 between the Company and SCB. As per terms of the Agreement, principal is payable in thirty six equal monthly installments started from 30 April 2014 and ending on 31 March 2017. This finance carries mark-up at the rate of three months KIBOR plus a spread of 1.75% per annum (2015: three months KIBOR plus a spread rate of 1.75% per annum), payable quarterly.
The loan along with other facilities provided by SCB are secured by:
– exclusive first charge by way of hypothecation on plant and machinery amounting to Rs. 31 million;
– first pari passu over present and future current assets of the Company by way of hypothecation amounting to Rs. 126.67 million;
– first pari passu over present and future plant and machinery of the Company by way of hypothecation amounting to Rs. 126.67 million; and
During the year, the Company has made repayments amounting to Rs. 6.67 million.
8.1.2 This represents a loan from a customer for production of specific items to be utilized for the customer’s order. This carries mark up at 7.7 % per annum. Loan is being repaid in 24 monthly installments which started from June 2016.
During the year, the Company has made repayments amounting to Rs. 1.99 million. 8.2.1 The facility amounting to Rs. 5.90 million has been obtained from United Bank Limited, Islamic Bank Branch (“UBL
Ameen”) for import of machinery and equipment (“Machinery”). The diminishing musharika agreement (“DMA - I”) was entered on 14 April 2014 between the Company and UBL Ameen. As per terms of the DMA - I, musharika units are repayable in thirty six equal monthly installments starting from 15 May 2014 and ending on 15 April 2017. Under the musharika agreement, the Company holds joint ownership of the machine with UBL Ameen. The finance carries mark-up at six months KIBOR plus a spread of 2.00% per annum (2015: six months KIBOR plus a spread of 2.00% per annum), payable monthly.
The facility is secured in favour of UBL Ameen by:
– hypothecation charge on the machinery;
– demand promissory note amounting to Rs. 9.60 million; and
During the year, the Company has made repayments amounting to Rs. 1.97 million. 8.2.2 The facility amounting to Rs. 18.86 million has been obtained from United Bank Limited, Islamic Bank Branch (“UBL
Ameen”) to finance the acquisition of conductors, poles and other related accessories for independent feeder (“Equipments”) from Water and Power Development Authority (“WAPDA”) for uninterrupted power supply. The diminishing musharika agreement (“DMA - II”) was entered on 26 June 2014 between the Company and UBL Ameen. As per terms of the DMA - II, musharika units are repayable in twenty four equal monthly installments starting from 30 July 2015 and ending on 30 June 2017. Under the musharika agreement, the Company holds joint
Notes to the Unconsolidated Financial Statementsfor the year ended 30 June, 2016

79Annual Report 2016
ownership of the equipment with UBL Ameen. The finance carries mark-up at six months KIBOR plus a spread of 2.00% per annum (2015: six months KIBOR plus a spread of 2.00% per annum), payable monthly.
The facility is secured in favour of UBL Ameen by:
– hypothecation charge on the equipment; and
– demand promissory note amounting to Rs. 22.64 million.
During the year, the Company has made repayments amounting to Rs. 9.43 million.
2016 2015
9 Liability against assets subject to finance lease
Salient features of the leases are as follows:
Discounting factor 7.15% to 13.16% 8.9% to 13.30% Period of lease 36 - 60 months 36 months Security deposits 10% 10%
Year of maturity 2016-2020 2015-2017
The Company has entered into finance lease arrangements with various financial institutions for lease of plant and machinery and vehicles as shown in note 16.1. The liabilities under these arrangements are payable in monthly installments. Interest rates implicit in the leases are used as discounting factor to determine the present value of minimum lease payments. The Company’s finance lease liability is interest / markup based. Finance lease liabilities are obtained from conventional mode of leasing.
All lease agreements carry purchase option at the end of lease term and the Company intends to exercise its option to purchase the leased assets upon completion of the respective lease terms. Residual value of the leased assets has already been paid by the Company at inception of the lease in form of security deposit. There are no financial restrictions imposed by lessor. Taxes, repairs, replacements and insurance costs are borne by the lessee.
The amount of future minimum lease payments along with their present value and the periods during which they will fall
due are:
2016
Total future Finance charges minimum lease allocated to payments future periods Principal
Rupees Not later than one year 20,831,101 1,870,256 18,960,845 Later than one year and not later than five years 17,753,096 1,006,229 16,746,867
38,584,197 2,876,485 35,707,712
2015
Total future Finance charges minimum lease allocated to payments future periods Principal
Rupees Not later than one year 63,568,697 5,486,449 58,082,248 Later than one year and not later than five years 31,280,561 1,899,109 29,381,452
94,849,258 7,385,558 87,463,700

80 SPEL | Reliable No Matter What
2016 2015 Rupees Rupees
10 Deferred taxation
The liability for deferred taxation comprises temporary differences relating to: Deferred tax liability arising on: – accelerated tax depreciation 188,327,012 151,947,683 Deferred tax asset arising on: – finance lease transactions - net (10,712,314) (27,577,079) – impairment loss on subsidiary and others (18,244,166) (2,236,199)
159,370,532 122,134,405 11 Trade and other payables
Trade creditors 54,348,126 57,998,145 Accrued liabilities 31,458,235 35,538,246 Advances from customers 6,830,205 9,834,869 Workers’ Profit Participation Fund 21,151,351 15,331,647 Workers’ Welfare Fund 8,035,413 4,990,831 Payable to Provident Fund Trust 1,122,499 997,325 Withholding tax payable 612,627 1,747,779 Unclaimed dividend 275,607 137,244 Others 4,210,577 892,430
128,044,640 127,468,516 12 Short term borrowings - secured
These represent short term finances utilized under interest / mark-up arrangements from banking companies and financial institutions.
2016 2015 Note Rupees Rupees
Type of loans
Interest / mark-up based loans 95,332,958 289,177,271 Islamic mode of financing 156,511,393 91,273,330
251,844,351 380,450,601 Short term running finance 12.1 50,270,026 189,337,718 Finance against trust receipts 12.2 201,574,325 191,112,883
251,844,351 380,450,601
Notes to the Unconsolidated Financial Statementsfor the year ended 30 June, 2016

81Annual Report 2016
12.1 This represents utilized amount of short term running finance facilities available from commercial banks aggregating Rs. 295 million (2015: Rs. 412 million). These carry mark-up rates ranging from one month to three months KIBOR plus an agreed spread (2015: one month to three months KIBOR plus an agreed spread).
12.2 This represents utilized amount of finance against trust receipt available from commercial banks aggregating Rs. 535 million (2015: Rs. 535 million). These carry mark-up rates ranging from one month to three months KIBOR plus an agreed spread (2015: one month to three months KIBOR plus an agreed spread).
12.3 These facilities are secured by first pari passu registered hypothecation charge on current and fixed assets of the Company, by lien over import documents and pledge of imported goods, local currency deposits.
2016 2015 Note Rupees Rupees
13 Current maturity of long term liabilities
Long term finance 8.1 29,925,082 6,674,292 Diminishing musharika 8.2 11,069,800 11,397,552 Liabilities against assets subject to finance lease 9 18,960,845 58,082,248
59,955,727 76,154,092 14 Accrued mark up
Diminishing musharika 5,630 18,061 Short term borrowings 4,136,412 7,054,931
4,142,042 7,072,992
15 Contingencies and commitments
15.1 Contingencies
15.1.1 Counter guarantees given by the Company to its bankers as at the reporting date amount to Rs. 25.43 million (2015: Rs. 50.97 million).
15.1.2 The Deputy Commissioner Inland Revenue has issued an order on 23 January 2015 against the Company in respect
of tax year (TY) 2009 raising a demand of Rs. 45.8 million. The order was annulled by the Commissioner Inland Revenue (Appeals) against which the tax department has filed appeal before the Income Tax Appellate Tribunal (Tribunal) on 30 April 2015. As the decision of appeal is expected in favour of the Company, therefore no provision is recorded in these unconsolidated financial statements.
15.1.3 The Deputy Commissioner Inland Revenue has issued an assessment order on 27 June 2015 against SPEL Packaging
Industries (Private) Limited (which was merged with Company in financial year 2011-12) in respect of TY 2009 and assessed Rs. 53.2 million payable by the Company. The Company filed an appeal before the Commissioner Inland Revenue (Appeals) which was decided against the Company. The management has filed a second appeal before the Tribunal. No provision has been made in these unconsolidated financial statements as the management is confident of favourable outcome of the matter.

82 SPEL | Reliable No Matter What
15.1.4 The Deputy Commissioner Inland Revenue had issued an order against the Company raising demand of sales tax of Rs. 7.6 million pertaining to TY 2012 based on a procedural matter. The Company had filed appeal before the Tribunal which was decided in favor of the Company through order No. 597/LB/2015 dated 07 October 2015.
15.1.5 The Additional Commissioner Inland Revenue has passed an assessment order against the Company on 30 April 2015 raising demand of Rs. 6.1 million pertaining to TY 2013. The Company had filed appeal against the order before Commissioner Inland Revenue (Appeals). As a result, the case was remanded back to Additional Commissioner Inland Revenue. As there is no expectation of any liability arising from the case therefore no provision is recorded in this regard.
15.1.6 The Deputy Commissioner Inland Revenue (DCIR) has passed an order against the Company on 20 June 2016 raising demand of Rs. 3.7 million under Section 25(3) of the Sales Tax Act, 1990. The Company filed appeal against the order before Commissioner Inland Revenue (Appeals), decision of which is pending.
15.1.7 Petition No. 39131 / 2015 was filed by the Company for issuance of exemption certificate under section 148 of the Income Tax Ordinance, 2001 in Lahore High Court in respect of import of plant and machinery. The same is still pending. However, the interim relief has been granted to the Company subject to furnishing bank guarantee.
2016 2015 Note Rupees Rupees
15.2 Commitments
15.2.1 Commitments under irrevocable letters of credit for:
– Purchase of machinery 63,077,729 72,384,510 – Purchase of raw material 148,896,931 141,076,786
211,974,660 213,461,296 16 Property, plant and equipment
Operating fixed assets 16.1 1,471,554,511 990,506,538 Capital work in progress 16.6 43,782,702 39,838,683
1,515,337,213 1,030,345,221
Notes to the Unconsolidated Financial Statementsfor the year ended 30 June, 2016

83Annual Report 2016
16
.1
Op
erat
ing
fixe
d a
sset
s
20
16
Cost
Accu
mul
ated
dep
reci
atio
n
As a
t 01
As a
t 30
Rate
As
at 0
1 Fo
r the
Tr
ansf
ers
Dis
posa
ls
As a
t 30
Net b
ook
July
201
5 Ad
ditio
n Tr
ansf
ers
Dis
posa
ls
June
201
6
July
201
5 ye
ar
June
201
6 va
lue
as a
t
30
June
201
6
Rupe
es
%
Rupe
es
Rupe
es
Ow
ned
Free
hold
land
– co
st
20,
481,
919
5
6,72
6,92
5
–
–
77,
208,
844
–
–
–
–
–
–
7
7,20
8,84
4
–
reva
luat
ion
226
,943
,081
–
–
–
2
26,9
43,0
81
– –
–
–
–
–
2
26,9
43,0
81
247
,425
,000
5
6,72
6,92
5
–
–
304
,151
,925
–
–
–
–
–
304,
151,
925
Bu
ildin
gs o
n fre
ehol
d la
nd
36,
990,
667
8
,112
,710
–
–
4
5,10
3,37
7
10%
2
2,79
2,19
5
1,7
84,0
93
–
–
24,
576,
288
2
0,52
7,08
9
Pl
ant a
nd m
achi
nery
9
04,5
28,3
66
480
,822
,787
1
35,6
31,6
97
–
1,52
0,98
2,85
0
10%
3
94,8
50,2
95
64,
225,
265
2
9,93
2,78
9
-
489
,008
,349
1
,031
,974
,501
O
ffice
equ
ipm
ent
3,5
57,9
57
2,2
10,0
04
–
–
5,7
67,9
61
10%
1
,643
,814
2
79,8
22
–
–
1,9
23,6
36
3,8
44,3
25
To
ols a
nd e
quip
men
t 6
,985
,119
2
,759
,371
–
–
9
,744
,490
10
%
2,4
27,2
68
571
,849
–
–
2
,999
,117
6
,745
,373
Co
mpu
ter e
quip
men
t 1
0,05
3,91
8
729
,273
–
–
1
0,78
3,19
1
30%
8
,084
,396
7
14,8
22
–
–
8,7
99,2
18
1,9
83,9
73
Fu
rnitu
re a
nd fi
tting
s 9
,931
,983
4
,709
,944
–
–
1
4,64
1,92
7
10%
3
,351
,170
8
91,2
68
–
–
4,2
42,4
38
10,
399,
489
Ve
hicl
es
21,
983,
513
7
,780
,405
2
,093
,000
(1
,718
,779
) 3
0,13
8,13
9
20%
6
,696
,605
4
,220
,803
1
,241
,065
(1
,287
,344
) 1
0,87
1,12
9
19,
267,
010
1,2
41,4
56,5
23
563
,851
,419
1
37,7
24,6
97
(1,7
18,7
79)
1,9
41,3
13,8
60
4
39,8
45,7
43
72,
687,
922
3
1,17
3,85
4
(1,2
87,3
44)
542
,420
,175
1
,398
,893
,685
Le
ased
Le
aseh
old
land
(not
e 16
.2)
22,
083,
915
–
–
–
2
2,08
3,91
5
1.67
%
2,2
12,8
08
368
,801
–
–
2
,581
,609
1
9,50
2,30
6
Pl
ant a
nd m
achi
nery
1
89,5
14,4
73
–
(135
,631
,697
) –
5
3,88
2,77
6
10%
2
3,38
5,87
5
14,
764,
037
(2
9,93
2,78
9)
–
8,2
17,1
23
45,
665,
653
Ve
hicl
es
4,5
87,0
00
6,7
48,0
00
(2,0
93,0
00)
– 9
,242
,000
20
%
1,6
90,9
47
1,2
99,2
51
(1,2
41,0
65)
–
1,7
49,1
33
7,4
92,8
67
216
,185
,388
6
,748
,000
(1
37,7
24,6
97)
–
85,
208,
691
27,
289,
630
1
6,43
2,08
9
(31,
173,
854)
–
12,
547,
865
7
2,66
0,82
6
20
16
1,4
57,6
41,9
11
570
,599
,419
–
(1
,718
,779
) 2
,026
,522
,551
467
,135
,373
8
9,12
0,01
1
–
(1,2
87,3
44)
554
,968
,040
1
,471
,554
,511

84 SPEL | Reliable No Matter What
20
15
Cost
Accu
mul
ated
dep
reci
atio
n
As a
t 01
As a
t 30
Rate
As
at 0
1 Fo
r the
Tr
ansf
ers
Dis
posa
ls
As a
t 30
Net b
ook
July
201
4 Ad
ditio
n Tr
ansf
ers
Dis
posa
ls
June
201
5
July
201
4 ye
ar
June
201
5 va
lue
as a
t
30
June
201
5
Rupe
es
%
Rupe
es
Rupe
es
Ow
ned
Free
hold
land
– co
st
20,
481,
919
–
–
–
2
0,48
1,91
9
–
–
–
–
–
–
2
0,48
1,91
9
–
reva
luat
ion
226
,943
,081
–
–
–
2
26,9
43,0
81
–
–
–
–
–
–
226
,943
,081
247
,425
,000
–
–
–
2
47,4
25,0
00
–
–
–
–
–
–
247,
425,
000
Bu
ildin
gs o
n fre
ehol
d la
nd
33,
472,
011
3
,518
,656
–
–
3
6,99
0,66
7
10%
2
1,42
5,20
2
1,3
66,9
93
–
–
22,
792,
195
1
4,19
8,47
2
Pl
ant a
nd m
achi
nery
7
78,1
02,2
26
121
,280
,079
2
7,82
1,06
1
(22,
675,
000)
9
04,5
28,3
66
10%
3
46,1
03,2
03
52,
864,
161
1
0,55
7,10
2
(14,
674,
171)
3
94,8
50,2
95
509
,678
,071
O
ffice
equ
ipm
ent
2,1
15,7
53
1,4
42,2
04
–
–
3,5
57,9
57
10%
1
,453
,587
1
90,2
27
– –
1,6
43,8
14
1,9
14,1
43
To
ols a
nd e
quip
men
t 3
,926
,931
3
,058
,188
–
–
6
,985
,119
10
%
2,1
36,7
31
290
,537
–
–
2,4
27,2
68
4,5
57,8
51
Co
mpu
ter e
quip
men
t 9
,392
,594
6
61,3
24
–
–
1
0,05
3,91
8
30%
7
,402
,847
6
81,5
49
–
– 8
,084
,396
1
,969
,522
Fu
rnitu
re a
nd fi
tting
s 5
,970
,689
3
,961
,294
–
–
9,9
31,9
83
10%
2
,726
,909
6
24,2
61
–
– 3
,351
,170
6
,580
,813
Ve
hicl
es
8,3
11,9
95
12,
702,
518
1
,742
,000
(7
73,0
00)
21,
983,
513
20
%
5,2
44,1
52
1,2
69,8
75
713
,366
(5
30,7
88)
6,6
96,6
05
15,
286,
908
1,0
88,7
17,1
99
146
,624
,263
2
9,56
3,06
1
(23,
448,
000)
1
,241
,456
,523
386
,492
,631
5
7,28
7,60
3
11,
270,
468
(1
5,20
4,95
9)
439
,845
,743
8
01,6
10,7
80
Le
ased
Le
aseh
old
land
2
2,08
3,91
5
–
–
–
22,
083,
915
1.
67%
1
,844
,007
3
68,8
01
–
–
2,2
12,8
08
19,
871,
107
Pl
ant a
nd m
achi
nery
1
63,4
52,7
57
53,
882,
777
(2
7,82
1,06
1)
–
189
,514
,473
10
%
17,
978,
710
1
5,96
4,26
7
(10,
557,
102)
–
2
3,38
5,87
5
166
,128
,598
Ve
hicl
es
6,3
29,0
00
–
(1,7
42,0
00)
–
4,5
87,0
00
20%
1
,680
,300
7
24,0
13
(713
,366
) –
1
,690
,947
2
,896
,053
191
,865
,672
5
3,88
2,77
7
(29,
563,
061)
–
2
16,1
85,3
88
2
1,50
3,01
7
17,
057,
081
(1
1,27
0,46
8)
– 2
7,28
9,63
0
188
,895
,758
20
15
1,2
80,5
82,8
71
200
,507
,040
–
(2
3,44
8,00
0)
1,4
57,6
41,9
11
4
07,9
95,6
48
74,
344,
684
–
(1
5,20
4,95
9)
467
,135
,373
9
90,5
06,5
38
Notes to the Unconsolidated Financial Statementsfor the year ended 30 June, 2016

85Annual Report 2016
16.2 Leasehold land comprises of land situated in Karachi which was obtained by the Company on lease and is being amortized over the term of 60 years. The title of land remains with the lessor at end of the lease term. However, leasehold land has been included in property, plant and equipment in accordance with clarification issued by Institute of Chartered Accountants of Pakistan through selected opinion issued on IAS 17 Leases.
2016 2015 Rupees Rupees
16.3 The depreciation charge for the year has been allocated as follows: Cost of goods sold 77,055,795 66,166,769 Capital work in progress 3,152,214 743,447 Administrative expenses 4,456,001 3,717,234 Selling and distribution expenses 4,456,001 3,717,234
89,120,011 74,344,684 16.4 The carrying value of freehold land would have been Rs. 77.20 million (2015: Rs. 20.48 million), had there been no
revaluation. 16.5 Disposal of property, plant and equipment
Accumulated Written Mode of Particulars
Particulars Cost depreciation down Sales Gain/(loss) disposal of buyer
value Proceeds
Rupees
Vehicles
Motor cycle CD 70 73,509 12,849 60,660 66,410 5,750 Insurance claim against theft
Motor cycle CD 70 71,027 43,873 27,154 29,520 2,366 Company Policy Mr. Muhammad Akhtar
Motor cycle CD 70 71,027 43,873 27,154 24,998 (2,156) Company Policy Mr. Muhammad Abbas
Motor cycle CD 70 71,027 43,873 27,154 40,527 13,373 Company Policy Mr. Muhammad Atif
Motor cycle CD 70 71,027 43,873 27,154 35,000 7,846 Company Policy Mr. Muhammad Fiaz
Motor cycle CD 70 71,027 45,813 25,214 35,000 9,786 Company Policy Mr. Muhammad Ashraf
Motor cycle CD 70 71,027 44,851 26,176 27,512 1,336 Company Policy Mr. Muhammad Mumtaz
Motor cycle CD 70 71,027 46,298 24,729 30,628 5,899 Company Policy Mr. Abdul Rasheed
Toyota Corolla XLI 935,000 830,422 104,578 500,000 395,422 Company Policy Mr. Khuram Jahangir
Motor cycle CD 70 71,027 43,873 27,154 50,000 22,846 Negotiation Mr. Khalil Ahmad
Motor cycle CD 70 71,027 43,873 27,154 45,000 17,846 Negotiation Mr. M. Rizwan Hadyat
Motor cycle CD 70 71,027 43,873 27,154 45,000 17,846 Negotiation Mr .Muhammad Amjad
1,718,779 1,287,344 431,435 929,595 498,160
2016 1,718,779 1,287,344 431,435 929,595 498,160
2015 23,448,000 15,204,959 8,243,041 5,117,851 (3,125,190)

86 SPEL | Reliable No Matter What
16.6 Capital Work In Progress
30 June 2016 As at As at
01 July 2015 Additions Transfers 30 June 2016
Rupees
Capital Work In Progress 39,838,683 336,438,284 332,494,265 43,782,702
30 June 2015 As at As at
01 July 2014 Additions Transfers 30 June 2015
Rupees
Capital Work In Progress 597,898 49,786,747 10,545,962 39,838,683
2016 2015 Rupees Rupees
16.7 The breakup is as follows Plant and machinery 43,374,711 39,838,683 Civil works 407,991 –
43,782,702 39,838,683 16.8 During the year the Company has capitalized borrowing cost of Rs. 3.19 million in plant and machinery at markup
rate of 7.7 % per annum
2016 2015 Rupees Rupees
17 Intangibles
Cost 8,608,436 6,936,606 Accumulated amortization (4,317,407) (2,729,402)
As at 30 June 4,291,029 4,207,204
Amortization rate 20% 20%
17.1 Balance as at 01 July 4,207,204 5,368,325 Additions during the year 1,671,829 226,200 Amortization charge for year (1,588,004) (1,387,321)
Balance as at 30 June 4,291,029 4,207,204 This represents expenditure incurred on implementation of SAP business one suite. The amortization charge has
been allocated to administrative expenses.
Notes to the Unconsolidated Financial Statementsfor the year ended 30 June, 2016

87Annual Report 2016
2016 2015 Note Rupees Rupees
18 Investment - related party
18.1 Investment in subsidiary
SPEL Pharmatec (Private) Limited
600,002 (2015: 600,002) fully paid ordinary shares of Rs. 10 each Capital held: 100% (2015: 100%) Activity: medical and surgical equipment Cost 6,000,020 6,000,020 Advance for purchase of shares 18.1.1 2,299,980 3,999,980
8,300,000 10,000,000 Less: Accumulated impairment during the year (7,861,755) (7,453,995)
438,245 2,546,005
18.1.1 The Company acquired a wholly-owned subsidiary, SPEL Pharmatec (Private) limited, as on 01 November 2013. During the year, advance for purchase of shares amounting to Rs. 1.70 million was repaid back to the Company.
2016 2015
Note Rupees Rupees
19 Long term deposits
Financial institutions 19.1 13,954,799 5,637,101 Utility companies and regulatory authorities 1,626,847 1,626,847 Others 1,649,400 –
17,231,046 7,263,948
19.1 These represent deposits with various banking companies and financial institutions against finance lease and margin on guarantees.
2016 2015
Note Rupees Rupees
20 Stock-in-trade
Raw and packing material 246,185,243 255,622,377 Stock in transit 39,403,293 32,697,008 Work in process 11,658,090 12,712,071 Finished goods 20.1 19,298,362 20,660,042
316,544,988 321,691,498
20.1 This includes net realizable value adjustment of Nil (2015: Rs. 2.68 million).
2016 2015 Rupees Rupees
21 Income tax - net
Income tax refundable 79,910,745 78,072,559 Advance taxation - net 66,437,465 6,829,017
146,348,210 84,901,576

88 SPEL | Reliable No Matter What
2016 2015 Rupees Rupees
22 Advances, deposits, prepayments and other receivables
Advances - unsecured, considered good – to employees 451,987 422,781 – to suppliers for raw material 3,130,679 3,268,756 Amounts paid against future shipments 6,486,686 3,627,520 Short term deposits 249,400 10,802,445 Sales tax receivable - net 36,277,281 3,160,873 Interest receivable 430,228 8,482,699 Prepaid insurance 4,128,457 956,933 Other receivables 5,128,816 –
56,283,534 30,722,007 23 Short term investments
These represent term deposit receipts of Habib Bank Limited carrying interest rate ranging from 6.35% to 6.7% (2015: 6.7% - 7.7%) per annum and are for the period from six to twelve months. These are under interest / markup based arrangements from conventional window of the bank.
2016 2015
Note Rupees Rupees
24 Cash and bank balances
Cash in hand 25,000 25,000 Cash at bank – current accounts in local currency 24.1 47,127,786 36,957,483 – current accounts in foreign currency with conventional banks 216,770 532,119 – saving accounts in local currency 24.2 3,693,358 118,885
51,037,914 37,608,487
51,062,914 37,633,487
24.1 These include deposits amounting to Rs. 36.80 million (2015: Rs. 10.58 million) placed under an arrangement permissible under Shariah. Remaining balance represents deposits with conventional windows of the banks.
24.2 These carry return at 3.5% to 5% per annum (2015: 5% to 5.50% per annum). This represents deposits placed under an arrangement permissible under Shariah.
2016 2015
Rupees Rupees
25 Sales - net
Local 2,704,985,470 2,510,037,505 Export 18,563,317 23,742,819
2,723,548,787 2,533,780,324 Less: Sales tax (401,698,185) (368,076,852)
2,321,850,602 2,165,703,472
Notes to the Unconsolidated Financial Statementsfor the year ended 30 June, 2016

89Annual Report 2016
2016 2015 Note Rupees Rupees
26 Cost of goods sold
Raw and packing materials consumed 1,338,097,984 1,278,447,735 Stores, spare parts and loose tools consumed 9,038,932 6,396,086 Salaries, wages and benefits 26.1 144,437,204 137,727,612 Electricity, fuel and water charges 123,242,590 154,782,029 Depreciation on property, plant and equipment 16.3 77,055,795 66,166,769 Repairs and maintenance 35,678,255 32,741,565 Sorting charges 3,284,347 3,537,979 Insurance 3,197,322 4,179,529 Oil and lubricants 2,909,138 2,184,318
1,736,941,567 1,686,163,622 Work in progress
- At beginning of the year 12,712,071 10,361,284 - At end of the year (11,658,090) (12,712,071)
Cost of goods manufactured 1,737,995,548 1,683,812,835
Finished goods
- At beginning of the year 20,660,042 9,750,005 - At end of the year (19,298,362) (20,660,042)
Cost of goods sold 1,739,357,228 1,672,902,798
26.1 Salaries, wages and benefits include Rs. 4.63 million (2015: Rs. 3.58 million) in respect of defined contribution plan.
2016 2015 Note Rupees Rupees
27 Administrative expenses
Salaries, wages and benefits 27.1 23,534,294 19,219,577 Directors’ remuneration 40 32,218,474 29,986,863 Traveling expenses 20,678,270 19,290,902 Legal and professional charges 4,052,637 5,757,077 Vehicle running expenses 3,910,154 3,353,783 Insurance 1,539,232 1,877,759 Repair and maintenance 1,877,803 1,723,240 Telephone and postage 3,039,037 2,869,981 Depreciation on property, plant and equipment 16.3 4,456,001 3,717,234 Amortization on intangibles 17.1 1,588,004 1,387,321 Printing and stationery 3,502,562 2,309,526 Staff training and development 5,038,766 4,888,570 Fee and subscription 1,854,883 795,347 Rent, rates and taxes 421,595 176,255 Entertainment 2,706,737 1,503,292 Donations 27.2 620,000 856,000 Auditors’ remuneration 27.3 840,000 775,000 Research and development 1,294,198 693,808 Miscellaneous expenses 3,551,140 3,153,580
116,723,787 104,335,115

90 SPEL | Reliable No Matter What
27.1 Salaries, wages and benefits include Rs. 0.94 million (2015: Rs. 0.76 million) in respect of defined contribution plan.
27.2 None of Directors and their spouses had any interest in any of the donees.
2016 2015 Note Rupees Rupees
27.3 Auditors’ remuneration
Statutory audit fee including consolidation 550,000 500,000 Half yearly review 150,000 150,000 Certifications – 50,000 CDC audit 75,000 – Out of pocket expenses 65,000 75,000
840,000 775,000 28 Selling and distribution expenses
Salaries and benefits 28.1 4,205,596 4,231,139 Depreciation on property, plant and equipment 16.3 4,456,001 3,717,234 Freight and forwarding 36,207,837 31,800,941 Advertisement 1,534,359 1,459,917 Sales promotion expenses 1,041,200 1,207,500
47,444,993 42,416,731
28.1 Salaries, wages and benefits include Rs. 0.15 million (2015: Rs. 0.19 million) in respect of defined contribution plan.
2016 2015 Rupees Rupees
29 Other income
Income from financial assets
Profit on bank deposits - arrangements permissible under Shariah 32,024 – Profit on short term investments - interest / markup based arrangement from conventional windows of the banks 28,285,255 16,653,783 Gain on forex transactions- net - actual currency conversion 806,400 137,522 Income from non-financial assets
Sale of unusable items 13,319,434 10,635,269 Gain on disposal of property, plant and equipment 498,160 – Reversal of impairment loss on investment in associate – 277,828 Other income 608,671 2,486,480
14,426,265 13,399,577
43,549,944 30,190,882 30 Other charges
Workers’ Profit Participation Fund 21,151,351 15,331,647 Workers’ Welfare Fund 8,333,373 4,990,831 Loss on disposal of property, plant and equipment – 3,125,190 Impairment loss - subsidiary 407,760 7,453,995
29,892,484 30,901,663
Notes to the Unconsolidated Financial Statementsfor the year ended 30 June, 2016

91Annual Report 2016
2016 2015 Rupees Rupees
31 Finance cost
Mark-up on: – short term borrowings - secured 30,007,666 42,884,943 – long term finance - secured 2,668,541 5,553,023 – advance from customer – 52,850 – lease finance 4,602,899 9,100,866 Bank charges 1,160,183 1,435,909
38,439,289 59,027,591 32 Taxation
Current : – for the year 110,564 56,047,642 – prior year 405,394 – Deferred – for the year 37,236,126 517,317
37,752,084 56,564,959
32.1 Relationship between tax expense and accounting profit
Profit before taxation 393,542,765 286,310,456
Tax at 32%/33% 125,933,685 94,482,450 Tax effect of: – income under Final Tax Regime (301,696) (1,497,710) – tax rate adjustment – (17,163,164) – change in proportion of local and export sales – 4,137,320 – tax credits (69,790,664) (29,128,764) – others (18,089,241) 5,734,827
37,752,084 56,564,959
Unit 2016 2015
33 Earnings per share
33.1 Basic earnings per share
Profit for the year after taxation Rupees 355,790,681 229,745,497
Weighted average number of ordinary shares in issue during the year Number 77,350,000 66,062,500
Earnings per share Rupees 4.60 3.48 33.2 Reconciliation of weighted average number of shares
Ordinary shares issued at 01 July Number 77,350,000 58,000,000 Effect of shares issued under initial public offer Number – 8,062,500
Weighted average number of ordinary shares Number 77,350,000 66,062,500

92 SPEL | Reliable No Matter What
33.3 Diluted earnings per share
There is no dilutive effect on the basic earnings per share of the Company.
2016 2015 Note Rupees Rupees
34 Cash generated from operations
Profit before taxation 393,542,765 286,310,456
Adjustments for non-cash items: Finance cost 38,439,289 59,027,591 Depreciation on property, plant and equipment 85,967,797 73,601,237 Amortization of intangibles 1,588,004 1,387,321 Impairment loss on investment in subsidiary 407,760 7,453,995 Reversal of impairment loss on investment in associate – (277,828) (Gain) / loss on disposal of property, plant and equipment (498,160) 3,125,190 Provision for Workers’ Profit Participation Fund and Workers’ Welfare Fund 29,484,724 20,322,478
155,389,414 164,639,984
Operating profit before working capital changes 548,932,179 450,950,440
(Increase) / decrease in current assets: Stores, spares and loose tools (1,363,616) (6,299,942) Stock-in-trade 5,146,510 (71,284,442) Trade debts (32,002,449) (63,927,497) Advances, deposits, prepayments and other receivables (36,363,972) (19,834,222)
(64,583,527) (161,346,103) Increase / (decrease) in current liabilities: Trade and other payables (8,426,525) 36,208,882
475,922,127 325,813,219 35 Cash and cash equivalents
Short term running finance 12 (50,270,026) (189,337,718) Cash and bank balances 24 51,062,914 37,633,487
792,888 (151,704,231)
Notes to the Unconsolidated Financial Statementsfor the year ended 30 June, 2016

93Annual Report 2016
36 Related party transactions and balances
Related parties comprise of subsidiary Company, associated undertaking, key management personnel (including chief executive and directors), post employment benefit plan and entities in which the directors have significant influence. Details of transactions and balances with related parties is as follows:
2016 2015
Transactions Transactions
during the closing during the closing
Name of parties Nature of relationship Nature of transactions Note year balance year balance
Rupees
SPEL Pharmatec Subsidiary Company Reimbursement of expenses – – 529,606 –
(Private) Limited Adjustment of advance
through issuance of shares – 5,900,020
18 2,299,980 3,999,980
Refund of advance for
issuance of shares 1,700,000 – – –
SPEL Technology Support Associated Company Purchase of goods – 201,250
(Private) Limited Reimbursement of expenses – 1,196,268
Provident Fund Trust Post employment Contribution 12,167,892 9,737,688
benefit fund 11 1,122,499 997,325
Directors Dividend - as 55,243,135 28,274,068
shareholders
Key Management Personnel Remuneration 40 54,280,812 46,601,482
37 Financial risk management
The Company has exposure to the following risks from its use of financial instruments:
– Credit risk – Liquidity risk– Market risk
Risk Management Framework
The Board of Directors has the overall responsibility for establishment and oversight of risk management framework. The Board of Directors has developed a risk policy that sets out fundamentals of risk management framework. The risk policy focuses on unpredictability of financial markets, the Company’s exposure to risk of adverse effects thereof and objectives, policies and processes for measuring and managing such risks. The Company’s risk management policies are established to identify and analyze the risks faced by the Company, to set appropriate risk limits and controls, and to monitor risks and adherence to limits. Risk management policies and systems are reviewed regularly to reflect changes in market conditions and the Company’s activities.
The Company’s audit committee oversees how management monitors compliance with the Company’s risk management policies and procedures and reviews the adequacy of the risk management framework in relation to the risks faced by the Company. Audit committee is assisted in its oversight role by internal audit department. Internal audit department undertakes both regular and ad hoc reviews of risk management controls and procedures, the results of which are reported to the audit committee.
The Company’s exposure to financial risks, the way these risks affect the financial position and performance, and forecast transactions of the Company and the manner in which such risks are managed as follows:

94 SPEL | Reliable No Matter What
37.1 Credit risk
Credit risk is the risk of financial loss to the Company if a customer or counterparty to a financial instrument fails to meet its contractual obligations. To manage credit risk the Company maintains procedures covering the application for credit approvals, and monitoring of exposures against credit limits. As part of these processes the financial viability of all counterparties is regularly monitored and assessed.
37.1.1 Exposure to credit risk
The carrying amount of financial assets represents the maximum credit exposure. The maximum exposure to credit risk at the reporting period was as follows:
2016 2015 Note Rupees Rupees
Loans and receivables
Long term deposits 19 17,231,046 7,263,948 Trade debts 281,157,522 249,155,073 Deposits and other receivables 22 679,628 19,285,144 Short term investments 23 75,000,000 580,500,000 Bank balances 24 51,037,914 37,608,487
425,106,110 893,812,652 37.1.2 Concentration of credit risk
The Company identifies concentrations of credit risk by reference to type of counter party. Maximum exposure to credit risk by type of counterparty is as follows:
2016 2015
Rupees Rupees Customers 281,157,522 249,155,073 Banking companies and financial institutions 140,672,341 643,030,732 Others 3,276,247 1,626,847
425,106,110 893,812,652 37.1.3 Credit quality and impairment
Credit quality of financial assets is assessed by reference to external credit ratings, where available, or to historical information about counterparty default rates. All counterparties, with the exception of customers, have external credit ratings determined by various credit rating agencies. Credit quality of customers is assessed by reference to historical defaults rates and present ages.
Notes to the Unconsolidated Financial Statementsfor the year ended 30 June, 2016

95Annual Report 2016
37.1.3(a) Counterparties with external credit ratings
These include banking companies and financial institutions, which are counterparties to term deposits, bank balances, security deposits, and accrued return on deposits. Credit risk is considered minimal as these counterparties have reasonably high credit ratings as determined by various credit rating agencies. Due to long standing business relationships with these counterparties and considering their strong financial standing, management does not expect non-performance by these counterparties on their obligations to the Company. Following are the credit ratings of counterparties with external credit ratings:
Rating
Short Long Rating 2016 2015 term term agency Rupees
Bank
Allied Bank Limited A1+ AA+ PACRA 4,029 611,719 Bank Islami Pakistan Limited A1 A+ PACRA 4,509,528 10,235,178 Habib Bank Limited A-1+ AAA JCR-VIS 247,990 550,746 Habib Metropolitan Bank Limited A1+ AA+ PACRA 2,396,536 19,683,287 KASB Bank Limited A3 BBB PACRA 16,118 8,153 MCB Bank Limited A1+ AAA PACRA 731,002 819,848 Meezan Bank Limited A-1+ AA JCR-VIS 32,282,990 338,042 National Bank of Pakistan A1+ AAA JCR-VIS 3,395,659 84,368 United Bank Limited A-1+ AA+ JCR-VIS 7,454,062 5,277,146
51,037,914 37,608,487
Security deposits
MCB Bank Limited A1+ AAA PACRA 8,567,097 – First National Bank Modaraba A1+ AAA JCR-VIS 249,400 964,262 Habib Bank Limited A-1+ AAA JCR-VIS 5,387,702 15,475,284
14,204,199 16,439,546
Short term investments
Habib Bank Limited A-1+ AAA JCR-VIS 75,000,000 580,500,000
Interest receivable
Habib Bank Limited A-1+ AAA JCR-VIS 430,228 8,482,699
140,672,341 643,030,732
37.1.3(b) Counterparties without external credit ratings
These include customers which are counter parties to trade receivables. The analysis of ages of trade receivables of the Company as at the reporting date is as follows:
Carrying amount
2016 2015 Rupees Rupees
The aging of trade debts at the reporting date is: Not due 206,144,081 189,278,799 Past due 0 - 30 days 64,467,374 51,189,065 Past due 31 - 60 days 7,574,825 4,298,679 Past due 61 - 90 days 1,018,861 1,346,503 Past due 91 - 120 days 1,655,009 702,639 Past due 120 days 297,372 2,339,388
281,157,522 249,155,073

96 SPEL | Reliable No Matter What
Based on past experience the management believes that no impairment allowance is necessary in respect of trade debts past due as some receivables have been recovered subsequent to the year end and for other receivables there are reasonable grounds to believe that the amounts will be recovered in short course of time. As at year end, trade debts do not include any balance receivable from related parties (2015: nil).
37.2 Liquidity risk
Liquidity risk is the risk that the Company will encounter difficulty in meeting the obligations associated with its financial liabilities that are settled by delivering cash or another financial asset, or that such obligations will have to be settled in a manner unfavorable to the Company. Prudent liquidity risk management implies maintaining sufficient cash and marketable securities and availability of adequate funds through committed credit facilities. The Company’s approach to managing liquidity is to ensure, as far as possible, that it will always have sufficient liquidity to meet its liabilities when due, under both normal and stressed conditions. The Company finances its operations through equity, borrowings and working capital with a view to maintaining an appropriate mix between various sources of finance to minimize risk. The management aims to maintain flexibility in funding by keeping regular committed credit lines.
37.2.1 Exposure to liquidity risk
37.2.1(a) Contractual maturities of financial liabilities
The following are the remaining contractual maturities of financial liabilities at the reporting date. The cash flows are undiscounted, and include estimated interest payments.
2016
Carrying Contractual One year One to Three to
Note amount cash flow or less three year five year
Rupees
Non-derivative financial liabilities
Long term finances 8 65,580,251 70,453,889 44,911,911 25,541,978 –
Liabilities against assets subject
to finance lease 9 35,707,712 38,584,197 20,831,101 14,149,357 3,603,739
Trade and other payables 11 91,415,044 91,415,044 91,415,044 – –
Short term borrowings 12 251,844,351 251,844,351 251,844,351 – –
Accrued mark up 14 4,142,042 4,142,042 4,142,042 – –
448,689,400 456,439,523 413,144,449 39,691,335 3,603,739
2015
Carrying Contractual One year One to Three to
Note amount cash flow or less three year five year
Rupees
Non-derivative financial liabilities
Long term finances 8 82,447,697 87,401,500 22,960,292 64,441,208 –
Liabilities against assets subject
to finance lease 9 87,463,700 94,849,258 63,568,697 31,280,561 –
Trade and other payables 11 95,563,390 95,563,390 95,563,390 – –
Short term borrowings 12 380,450,601 380,450,601 380,450,601 – –
Accrued mark up 14 7,072,992 7,072,992 7,072,992 – –
652,998,380 665,337,741 569,615,972 95,721,769 –
Notes to the Unconsolidated Financial Statementsfor the year ended 30 June, 2016
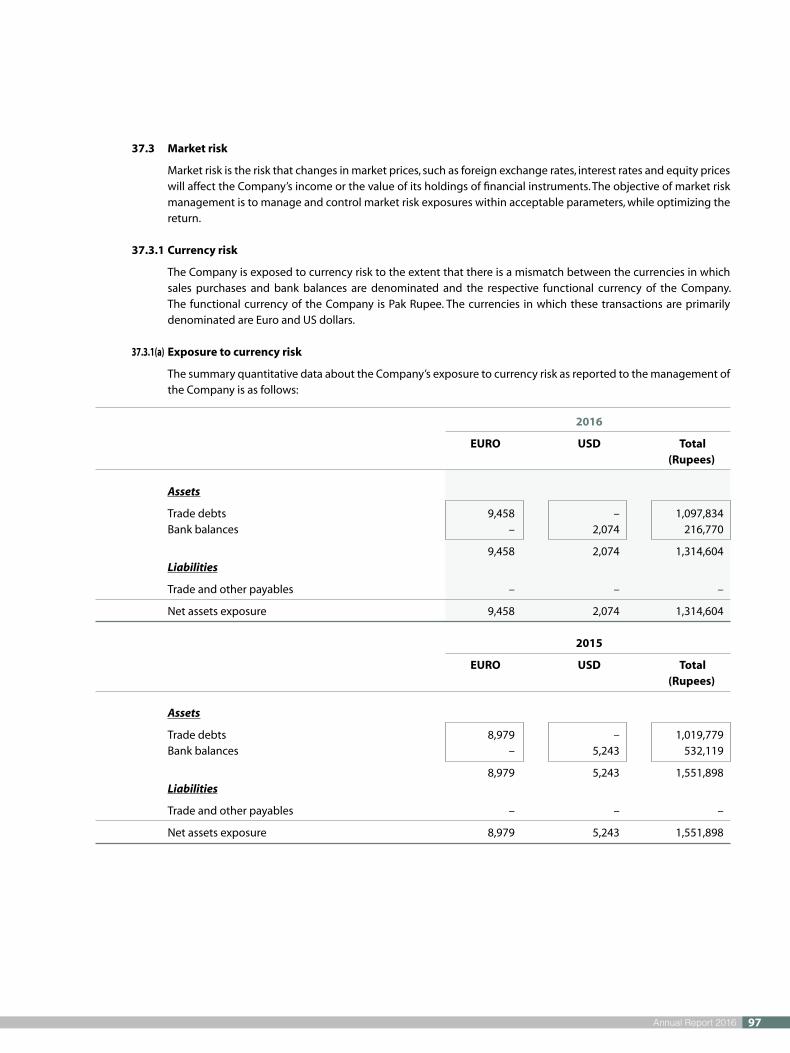
97Annual Report 2016
37.3 Market risk
Market risk is the risk that changes in market prices, such as foreign exchange rates, interest rates and equity prices will affect the Company’s income or the value of its holdings of financial instruments. The objective of market risk management is to manage and control market risk exposures within acceptable parameters, while optimizing the return.
37.3.1 Currency risk
The Company is exposed to currency risk to the extent that there is a mismatch between the currencies in which sales purchases and bank balances are denominated and the respective functional currency of the Company. The functional currency of the Company is Pak Rupee. The currencies in which these transactions are primarily denominated are Euro and US dollars.
37.3.1(a) Exposure to currency risk
The summary quantitative data about the Company’s exposure to currency risk as reported to the management of the Company is as follows:
2016
EURO USD Total (Rupees) Assets
Trade debts 9,458 – 1,097,834 Bank balances – 2,074 216,770
9,458 2,074 1,314,604 Liabilities
Trade and other payables – – –
Net assets exposure 9,458 2,074 1,314,604 2015
EURO USD Total (Rupees)
Assets
Trade debts 8,979 – 1,019,779 Bank balances – 5,243 532,119
8,979 5,243 1,551,898 Liabilities
Trade and other payables – – –
Net assets exposure 8,979 5,243 1,551,898

98 SPEL | Reliable No Matter What
37.3.1(b) Exchange rates applied during the year
The following significant exchange rates have been applied during the year:
EURO USD
2016 2015 2016 2015Rupees Rupees
Reporting date spot rate – buying 116.08 113.57 104.50 101.50 – selling 116.31 113.70 104.70 101.70 Average rate for the year 114.92 124.02 103.10 100.03
37.3.1(c) Sensitivity analysis
A reasonably possible strengthening / (weakening) of 10% in Pak Rupee against the following currencies would have affected the measurement of financial instruments denominated in foreign currency and affected equity and profit or loss by the amounts shown below. The analysis assumes that all other variables, in particular interest rates, remain constant and ignores any impact of forecast sales and purchases.
2016 2015
Rupees Rupees Effect on profit and loss
EURO 109,783 101,978 USD 21,677 53,212
131,460 155,190 37.3.1(d) Currency risk management
Since the maximum amount exposed to currency risk is only 0.306% (2015: 0.174%) of the Company’s financial assets, any adverse / favorable movement in functional currency with respect to US dollar and Euro will not have any material impact on the operational results.
37.3.2 Interest rate risk
Interest rate risk is the risk that fair values or future cash flows of a financial instrument will fluctuate because of changes in interest rates. Sensitivity to interest rate risk arises from mismatch of financial assets and financial liabilities that mature or re-price in a given period.
37.3.2(a) Interest / mark-up bearing financial instruments
The effective interest / mark-up rates for interest / mark-up bearing financial instruments are mentioned in relevant notes to the unconsolidated financial statements. The Company’s interest / mark-up bearing financial instruments as at the reporting date are as follows:
2016 2015
Financial Financial Financial Financialasset liability asset liability
Rupees Rupees
Non-derivative financial instruments
Fixed rate instruments 78,693,358 49,504,723 580,618,885 48,300,329 Variable rate instruments – 303,627,591 – 502,061,669
Notes to the Unconsolidated Financial Statementsfor the year ended 30 June, 2016

99Annual Report 2016
Fair value sensitivity analysis for fixed rate instruments
The Company does not account for any fixed rate financial assets and liabilities at fair value through profit and loss account. Therefore, a change in profit / mark-up / interest rates at the reporting date would not affect profit and loss account.
37.3.2(b) Cash flow sensitivity analysis for variable rate instruments
A reasonably possible change of 100 basis points in interest rates at the reporting date would have increased / (decreased) equity and profit by amounts shown below. The analysis assumes that all other variables, in particular foreign exchange rates, remain constant.
Profit
2016 2015 Rupees Rupees
Increase of 100 basis points (3,036,276) (5,020,617)
Decrease of 100 basis points 3,036,276 5,020,617 37.3.2(c) Interest rate risk management
The Company manages these mismatches through risk management strategies where significant changes in gap position can be adjusted. The short term borrowing, finance lease and loans and advances by the Company has variable rate pricing that is mostly dependent on Karachi Inter Bank Offer Rate (“KIBOR”) as indicated in respective notes.
37.3.3 Other price risk
Price risk represents the risk that the fair value or future cash flows of financial instrument will fluctuate because of changes in market prices (other than those arising from interest rate risk or currency risk) whether those changes are caused by factors specific to the individual financial instrument or its issuer, or factors affecting all similar financial instruments traded in market. The Company is not exposed to commodity price risk since it has a diverse portfolio of commodity suppliers.
The Company is not exposed to equity price risk. 37.4 Fair values
37.4.1 Fair value estimation
All financial assets and financial liabilities are initially recognised at the fair value of consideration paid or received, net of transaction costs as appropriate, and subsequently carried at fair value or amortized cost. Carrying value of all financial instruments approximate their carrying value.
Fair values have been determined for measurement and / or disclosure purposes based on the following methods. Non-derivative financial instrument
The fair value of non-derivative financial asset is estimated as the present value of future cash flows, discounted at the market rate of interest at the reporting date. This fair value is determined for disclosure purposes.
Non-Derivative financial liabilities
Fair value, which is determine for disclosures purposes, is calculated based on the present value of future principal and interest cash flows, discounted at market rate of interest at the reporting date.

100 SPEL | Reliable No Matter What
37.5 Financial instruments-fair values
The additional disclosures due to the adoption of IFRS 13 Fair value measurement are as follows:
Carrying Amount Fair Value
Loans and Other
receivables financial Total Level 1 Level 2 Level 3
Note Rupees
On-Balance sheet financial instruments
30 June 2016
Financial assets measured at fair value – – – – – –
– – – – – –
Financial assets not measured at fair value
Cash and bank balances 51,062,914 – 51,062,914 – – –
Deposits and other receivables 5,808,444 – 5,808,444 – – –
Long term deposits 17,231,046 – 17,231,046 – – –
Trade debts - unsecured, considered good 281,157,522 – 281,157,522 – – –
Short term investments 75,000,000 – 75,000,000 – – –
37.6 430,259,926 – 430,259,926 – – –
Financial liabilities measured at fair value – – – – – –
– – – – – –
Financial liabilities not measured at fair value
Long term finances and diminishing musharika – 65,580,251 65,580,251 – – –
Liabilities against assets subject –
to finance lease – 35,707,712 35,707,712 – – –
Trade and other payables – 91,415,044 91,415,044 – – –
Short term borrowing – 251,844,351 251,844,351 – – –
Accrued mark up – 4,142,042 4,142,042 – – –
37.6 – 448,689,400 448,689,400 – – –
37.6 The Company has not disclosed the fair values of these financial assets and liabilities as these are for short term or reprice over short term. Therefore, their carrying amounts are reasonable approximation of fair value.
Land has been carried at revalued amounts determined by professional valuers (level 3 measurement) based on their assessment of the market values as disclosed in note 7. The valuations are conducted by the valuation experts appointed by the Company. The valuation experts used a market based approach to arrive at the fair value of the Company’s land. The effect of changes in the unobservable inputs used in the valuation can not be determined with certainty, accordingly a qualitative disclosure of sensitivity has not been presented in these unconsolidated financial statements.
38 Capital management
The Board’s policy is to maintain an efficient capital base so as to maintain investor, creditor and market confidence and to sustain the future development of its business. The Board of Directors monitors the return on capital employed, which the Company defines as operating income divided by total capital employed. The Board of Directors also monitors the level of dividends to ordinary shareholders.
Notes to the Unconsolidated Financial Statementsfor the year ended 30 June, 2016

101Annual Report 2016
The Company’s objectives when managing capital are:
i. to safeguard the entity’s ability to continue as a going concern, so that it can continue to provide returns for shareholders and benefits for other stakeholders, and
ii. to provide an adequate return to shareholders.
The Company manages the capital structure in the context of economic conditions and the risk characteristics of the underlying assets. In order to maintain or adjust the capital structure, the Company may adjust the amount of dividends paid to shareholders, issue new shares, or sell assets to reduce debt.
There were no changes in the Company’s approach to capital management during the year. The Company is not subject
to externally imposed capital requirements.
2016 2015 Rupees Rupees
39 Restriction on title and assets pledged as security against long and short term borrowings
Mortgages and charges
Hypothecation charge over plant and machinery 806,260,000 673,670,000 Hypothecation over current assets 684,340,000 551,010,000
40 Remuneration of chief executive, directors and executives
The aggregate amount charged in the financial statements for the year in respect of remuneration, including all benefits to the Chief Executive, Directors and Executives of the Group is as follows:
2016
Directors
Chairman Chief Non- Executive Executives
executive executive
Rupees
Managerial remuneration 5,600,000 5,600,000 – 3,457,200 10,446,955
Utilities and house rent 2,800,000 2,800,000 – 1,702,800 5,225,045
Contribution to provident fund – – – 344,017 1,025,102
Bonus and rewards – – – 3,220,000 5,365,236
Meeting fee – – 875,000 – –
Advisory fee – – 5,400,000 – –
Other benefits 169,957 109,654 53,666 86,180 –
8,569,957 8,509,654 6,328,666 8,810,197 22,062,338
Number of persons 1 1 3 1 8

102 SPEL | Reliable No Matter What
2015
Directors
Chairman Chief Non- Executive Executives
executive executive
Rupees
Managerial remuneration 5,600,000 5,600,000 – 3,200,000 8,120,400
Utilities and house rent 2,800,000 2,800,000 – 1,600,000 3,999,600
Contribution to provident fund – – – 319,968 807,919
Bonus and rewards – – – 1,500,000 3,686,700
Advisory fee – – 5,400,000 – –
Other benefits 396,780 319,527 450,588 – –
8,796,780 8,719,527 5,850,588 6,619,968 16,614,619
Number of persons 1 1 1 1 6
40.1 The Company also provides the chief executive and some of the directors and executives the Company’s maintained cars.
40.2 Meeting fee was paid to non executive directors during the year for Rs 875,000 (2015: Nil)
41 Plant capacity and actual production
Installed processing capacity Actual processing
2016 2015 2016 2015
Small, medium and large
mould making facility 60 to 70 moulds 60 to 70 moulds 43 moulds 48 to 50 moulds
Injection mould facility 3,300 tons plastic 3,100 tons plastic 1,727 tons of plastic 1,516 tons of plastic
Blow moulding facility 2,560 tons plastic 1,680 tons plastic 1,609 tons plastic 1,112 tons plastic
Extrusion 5,700 tons plastic 5,400 tons plastic 2,301 tons plastic 2,000 tons plastic
Thermoforming 2,200 tons plastic 1,700 tons plastic 1024 tons plastic 966 tons plastic
Lower capacity utilization of plant is due to gap between demand and supply of products. The capacity figures are based on 300 days.
42 Provident Fund Trust
The following information is based on financial statements of Provident Fund Trust.
Un-audited AuditedUnit 2016 2015
Size of the fund - total assets Rupees 35,508,944 31,233,815
Cost of investments made Rupees 33,124,766 27,294,976
Percentage of investments made Percentage 93.29% 87.39%
Fair value of investments Rupees 33,124,766 27,294,976
Notes to the Unconsolidated Financial Statementsfor the year ended 30 June, 2016

103Annual Report 2016
Lahore Chief Executive Director
The breakup of fair value of investments is as follows:
2016 2015
Rupees Percentage Rupees Percentage
Defence Saving Certificates 4,977,932 15.03% 4,775,367 17.50% Bank balances 1,146,834 3.46% 1,519,609 5.60% Certificate of musharika 27,000,000 81.51% 21,000,000 76.90%
33,124,766 100.00% 27,294,976 100.00%
42.1 The provident fund trust is a common fund for employees of the Group. Entity wise break up of the fund as on 30 June is as follows:
(Un-Audited) 30 June 2016 (Audited) 30 June 2015
% of total fund Rupees % of total fund Rupees
Synthetic Products Enterprises Limited 98.69% 35,045,161 98.12% 30,646,619
SPEL Pharmatec (Private) Limited 0% – 1.49% 465,384
SPEL Technology Support Limited 1.31% 463,783 0.39% 121,812
The investments out of provident fund have been made in accordance with the provision of Section 227 of the Companies Ordinance, 1984 and the rules formulated for this purpose.
43 Number of employees
The Company has employed following number of persons including permanent and contractual staff:
Number of Employees
2016 2015 – Average number of employees 462 465
– As at 30 June 444 448
44 Non adjusting events after the balance sheet date
The Board of Directors of the Company in its meeting held on 26 July 2016 has proposed a final cash dividend of Rs. 1.0 (2015: Rs.0.5) per share, for the year ended 30 June 2016, for approval of the members in the Annual General Meeting to be held on 21 September 2016.
45 Date of authorization for issue
These unconsolidated financial statements were authorized for issue by the Board of Directors of the Company in its meeting held on 26 July 2016.
46 General
Figures have been rounded off to the nearest rupee.

104 SPEL | Reliable No Matter What

105Annual Report 2016
Consolidated Financial StatementsFor the year ended 30 June 2016

106 SPEL | Reliable No Matter What
Group Directors’ Report to the ShareholdersFor the year ended 30 June 2016
The Directors are pleased to place before you the Group’s Annual Report on the results of its operations along with the Audited Accounts for the year ended 30 June 2016.
The GroupThe group comprises Synthetic Products Enterprises Limited and it wholly owned subsidiary SPEL Pharmatec (Private) Limited.
State of Group’s A�airs
The Directors’ report giving complete information about the performance of Synthetic Products Enterprises Limited for the year ended 30 June 2016 has been presented separately along with its respective financial statements. However, SPEL Pharmatec (Private) Limited has stopped its operations till identification of an appropriate product line.
Subsequent EventsNo material changes or commitments affecting the financial position of the Group Companies have occurred between the end of the financial year of the Companies and the date of this report, except as disclosed in the financial statement of Synthetic Products Enterprises Limited.
Auditor’s ReportThe auditors have expressed unqualified opinions on the financial statement of each group Company.
Pattern of ShareholdingAll the shares of SPEL Pharmatec (Private) Limited are held by Synthetic Products Enterprises Limited. The pattern of shareholding of Synthetic Products Enterprises Limited is annexed to its Directors’ Report.
Country of IncorporationAll Group Companies have been incorporated in Pakistan.
Earnings Per ShareThe earnings per share for the financial year 2016 is Rs. 4.60/-
Payment of DebtsThere is no default in any payment by the Company either on account of principal or mark-up/profit.
Almas Hyder Zia Hyder NaqiChairman Chief Executive Officer
Place: Lahore26 July 2016

107Annual Report 2016
Auditors’ Report onConsolidated Financial StatementsWe have audited the annexed consolidated financial statements comprising consolidated Balance Sheet of Synthetic Products Enterprises Limited (“the Holding Company”) and its subsidiary Company as at 30 June 2016 and the related consolidated Profit and Loss Account, consolidated Statement of Comprehensive Income, consolidated Cash Flow Statement and consolidated Statement of Changes in Equity together with the notes forming part thereof, for the year then ended. We have also expressed separate opinions on the financial statements of Synthetic Products Enterprises Limited and its subsidiary company. These financial statements are the responsibility of the Holding Company’s management. Our responsibility is to express an opinion on these financial statements based on our audit.
We conducted our audit in accordance with the International Standards on Auditing and accordingly included such tests of accounting records and such other auditing procedures as we considered necessary in the circumstances.
In our opinion, the consolidated financial statements present fairly the financial position of Synthetic Products Enterprises Limited and its subsidiary company as at 30 June 2016 and the results of their operations for the year then ended.
Date: 26 July 2016 KPMG Taseer Hadi & Co.Lahore Chartered Accountants
(M. Rehan Chughtai)

108 SPEL | Reliable No Matter What
2016 2015 Note Rupees Rupees
Equity And Liabilities
Share capital and reserves
Authorized share capital of Rs. 10 each 5.1 1,000,000,000 1,000,000,000
Issued, subscribed and paid-up capital 5.2 773,500,000 773,500,000 Share premium 6 347,391,050 347,391,050 Accumulated profit 486,142,173 207,808,962
1,607,033,223 1,328,700,012
Surplus on revaluation of land 7 226,943,081 226,943,081 Non-current liabilities
Long term finance - secured 8.1 24,585,369 53,306,045 Diminishing musharika - secured 8.2 – 11,069,808 Liabilities against assets subject to finance lease 9 16,746,867 29,381,452 Deferred taxation 10 161,729,058 124,370,604
203,061,294 218,127,909 Current liabilities
Trade and other payables 11 128,169,404 127,659,350 Short term borrowings - secured 12 251,844,351 380,450,601 Current maturity of long term liabilities 13 59,955,727 76,154,092 Accrued mark up 14 4,142,042 7,072,992
444,111,524 591,337,035
2,481,149,122 2,365,108,037
Contingencies and commitments 15 The annexed notes 1 to 44 form an integral part of these consolidated financial statements.
Consolidated Balance SheetAs at 30 June, 2016
Lahore Chief Executive Director

109Annual Report 2016
2016 2015 Note Rupees Rupees
Assets
Non-current assets
Property, plant and equipment 16 1,515,353,994 1,030,363,969 Intangibles 17 4,291,029 4,207,204 Long term deposits 18 17,231,046 7,263,948
1,536,876,069 1,041,835,121
Current assets
Stores, spares and loose tools 17,329,657 15,966,041 Stock-in-trade 19 316,544,988 321,691,498 Trade debts - unsecured, considered good 281,157,522 249,451,311 Income tax - net 20 146,444,813 84,987,657 Advances, deposits, prepayments and other receivables 21 56,600,730 31,097,917 Short term investments 22 75,000,000 582,103,302 Cash and bank balances 23 51,195,343 37,975,190
944,273,053 1,323,272,916
2,481,149,122 2,365,108,037
Lahore Chief Executive Director

110 SPEL | Reliable No Matter What
2016 2015 Note Rupees Rupees
Sales - net 24 2,321,735,945 2,166,769,428 Cost of sales 25 (1,739,357,228) (1,673,470,689)
Gross profit 582,378,717 493,298,739 Administrative expenses 26 (117,067,186) (107,644,835)Selling and distribution expenses 27 (47,447,393) (43,035,884)
Operating profit 417,864,138 342,618,020 Other income 28 43,621,700 30,474,069 Other charges 29 (29,484,724) (23,447,668)Finance cost 30 (38,442,557) (59,030,566)
Profit before taxation 393,558,557 290,613,855 Taxation 31 (37,875,346) (58,811,818)
Profit after taxation 355,683,211 231,802,037 The annexed notes 1 to 44 form an integral part of these consolidated financial statements.
Consolidated Profit and Loss Accountfor the year ended 30 June, 2016
Lahore Chief Executive Director

111Annual Report 2016
2016 2015 Rupees Rupees
Profit after taxation 355,683,211 231,802,037 Other comprehensive income – –
Total comprehensive income for the year 355,683,211 231,802,037 The annexed notes 1 to 44 form an integral part of these consolidated financial statements.
Consolidated Statement of Comprehensive Incomefor the year ended 30 June, 2016
Lahore Chief Executive Director

112 SPEL | Reliable No Matter What
Capital Revenue reserve reserve
Issued subscribed Advance and paid-up against Share Accumulated capital share capital premium profit Total
Rupees
As at 30 June 2014 580,000,000 – – 14,681,925 594,681,925
Total comprehensive income for the year
Profit after taxation – – – 231,802,037 231,802,037 Other comprehensive income – – – – –
– – – 231,802,037 231,802,037 Transactions with owners of the Company
Advance received against shares – 580,500,000 – – 580,500,000 Shares issued during the year 19,350,000 shares of Rs. 10 each 193,500,000 (193,500,000) – – –Share premium – (387,000,000) 387,000,000 – –Expenses incurred on issuance of shares – – (39,608,950) – (39,608,950)Interim cash dividend for the year ended 30 June 2015 @ Rs. 0.5 per share – – – (38,675,000) (38,675,000)
193,500,000 – 347,391,050 (38,675,000) 502,216,050
As at 30 June 2015 773,500,000 – 347,391,050 207,808,962 1,328,700,012
Total comprehensive income for the year
Profit after taxation – – – 355,683,211 355,683,211 Other comprehensive income – – – – –
– – – 355,683,211 355,683,211 Transactions with owners of the Company
Final cash dividend for the year ended 30 June 2015 @ Rs. 0.5 per share – – – (38,675,000) (38,675,000)Interim cash dividend for the year ended 30 June 2016 @ Rs. 0.5 per share – – – (38,675,000) (38,675,000)
– – – (77,350,000) (77,350,000)
As at 30 June 2016 773,500,000 – 347,391,050 486,142,173 1,607,033,223
The annexed notes 1 to 44 form an integral part of these consolidated financial statements.
Consolidated Statement of Change in Equityfor the year ended 30 June, 2016
Lahore Chief Executive Director

113Annual Report 2016
2016 2015 Note Rupees Rupees
Cash flows from operating activities
Cash generated from operations 32 475,821,008 322,683,442
Workers’ Profit Participation Fund and Workers’ Welfare Fund paid (20,620,438) (12,122,756)Finance cost paid (40,322,350) (55,011,157)Taxes paid (61,974,047) (60,202,324)Long term deposits - net (9,967,098) 5,357,244
Cash generated from operating activities 342,937,075 200,704,449
Cash flows from investing activities
Fixed capital expenditure (561,444,827) (185,121,601)Intangibles acquired (1,671,830) (226,200)Proceeds from disposal of property, plant and equipment 929,595 5,117,851 Proceeds from disposal of investment in associate – 4,674,194 Short term investments 507,103,302 (582,103,302)
Net cash used in investing activities (55,083,760) (757,659,058)
Cash flows from financing activities
Proceeds from issuance of capital - net – 540,891,050 Principal repayment of lease liability (47,701,543) (47,165,458)Long term finance obtained – 47,250,000 Long term finance and diminishing musharika repaid (21,113,732) (9,197,030)Short term borrowings - net 10,461,442 (88,765,114)Cash dividend paid (77,211,637) (38,537,756)
Net cash (used in) / generated from financing activities (135,565,470) 404,475,692
Net increase / (decrease) in cash and cash equivalents 152,287,845 (152,478,917)Cash and cash equivalents at beginning of the year (151,362,528) 1,116,389
Cash and cash equivalents at end of the year 33 925,317 (151,362,528)
The annexed notes 1 to 44 form an integral part of these consolidated financial statements.
Consolidated Cash Flow Statementfor the year ended 30 June, 2016
Lahore Chief Executive Director

114 SPEL | Reliable No Matter What
1 Legal status and nature of business
The Group comprises of the following Companies:
1.1 Synthetic Products Enterprises Limited - (“the Holding Company”)
Synthetic Products Enterprises Limited was incorporated in Pakistan on 16 May 1982 under the Companies Act 1913 (now the Companies Ordinance, 1984) as a private limited company. The Company converted into public limited company on 21 July 2008 and subsequently listed on Pakistan Stock Exchange on 10 February 2015. The registered office of the Company is situated at 127-S, Quaid-e-Azam Industrial Estate, Kot Lakhpat, Lahore. The Company is principally engaged in the manufacturing and sale of plastic auto parts, plastic packaging for food and FMCG industry and moulds & dies.
1.2 SPEL Pharmatec (Private) Limited - (“the Subsidiary Company”)
SPEL Pharmatec (Private) Limited was incorporated on 01 November 2013 under the Companies Ordinance, 1984 as a private limited company. The principal business of the Subsidiary company is trading and manufacturing of medical devices, machines, disposable items, surgical instruments, drugs and pharmaceuticals. The registered office of the Company is situated at 127-S, Quaid-e-Azam Industrial Estate, Kot Lakhpat, Lahore.
2 Basis of preparation
2.1 Statement of compliance
These consolidated financial statements have been prepared in accordance with approved accounting standards as applicable in Pakistan and the requirements of Companies Ordinance, 1984. Approved accounting standards comprise of such International Financial Reporting Standards (“IFRSs”) issued by the International Accounting Standards Board as notified under the provisions of the Companies Ordinance, 1984.Wherever, the requirements of the Companies Ordinance, 1984 or directives issued by the Securities and Exchange Commission of Pakistan differ with the requirements of these standards, the requirements of Companies Ordinance, 1984 or the requirements of the said directives shall prevail.
2.2 Basis of measurement
These consolidated financial statements have been prepared under the historical cost convention except for certain items of property, plant and equipment which are stated at revalued amounts as referred in note 3.3.
2.3 Judgments, estimates and assumptions
The preparation of consolidated financial statements requires management to make judgments, estimates and assumptions that affect the application of accounting policies and the reported amounts of assets, liabilities, income and expenses. The estimates and associated assumptions and judgments are based on historical experience and various other factors that are believed to be reasonable under the circumstances, the result of which forms the basis of making judgments about carrying values of assets and liabilities that are not readily apparent from other sources. Actual results may differ from these estimates. Estimates and underlying assumptions are reviewed on an ongoing basis. Revisions to accounting estimates are recognized in the period in which the estimate is revised and in any future periods affected. Judgments made by management in the application of approved accounting standards that have significant effect on the financial statements and estimates with a risk of material adjustment in subsequent years are as follows:
2.3.1 Depreciation method, rates and useful lives of property, plant and equipment
The management of the Group reassesses useful lives, depreciation method and rates for each item of property, plant and equipment annually by considering expected pattern of economic benefits that the Group expects to derive from that item and the maximum period up to which such benefits are expected to be available. The rates of depreciation are specified in note 16.1.
Notes to the Consolidated Financial Statementsfor the year ended 30 June, 2016

115Annual Report 2016
2.3.2 Recoverable amount of assets / cash generating units and impairment
The management of the Group reviews carrying amounts of its assets and cash generating units for possible impairment and makes formal estimates of recoverable amount if there is any such indication.
2.3.3 Taxation
The Group takes into account the current income tax law and decisions taken by appellate authorities while estimating its tax liabilities. Instances where the Group’s views differ from the views taken by the income tax department at the assessment stage and where the Group considers that its view on items of material nature is in accordance with law, the amounts are shown as contingent liabilities.
The Group also regularly reviews the trend of proportion of income between Presumptive Tax Regime income and Normal Tax Regime income and the change in proportions, if significant, is accounted for in year of change.
2.3.4 Provisions
Provisions are based on best estimate of the expenditure required to settle the present obligation at the reporting date, that is, the amount that the Group would rationally pay to settle the obligation at the reporting date or to transfer it to a third party.
2.3.5 Revaluation of property, plant and equipment
Revaluation of property, plant and equipment is carried out by independent professional valuers.
The frequency of revaluations depends upon the changes in fair values of the items of land being revalued. When the fair value of a revalued asset differs materially from its carrying amount, a further revaluation is required.
Further the surplus on revaluation is utilized in accordance with the provisions of section 235 of the Companies
Ordinance, 1984. 2.3.6 Stores, spares and loose tools
The Group reviews the stores, spares and loose tools for possible impairment on an annual basis. Any change in estimates in future years might affect the carrying amounts of the respective items of stores and spares and loose tools with a corresponding effect on the provision.
2.3.7 Stock-in-trade
The Group reviews the carrying amount of stock-in-trade on a regular basis. Carrying amount of stock-in-trade is adjusted where the net realisable value is below the cost.
2.3.8 Provisions against trade debts, advances and other receivables
The Group reviews the recoverability of its trade debts, advances and other receivables to assess amount of bad debts provision required there against on an annual basis.
2.4 Functional and presentation currency
These consolidated financial statements have been prepared in Pak Rupees which is the Group’s functional currency.
3 Significant accounting policies
The significant accounting policies adopted in the preparation of these consolidated financial statements are set out below. Except for a change as mentioned in note 3.1, the policies have been consistently applied to all the years presented, unless otherwise stated.
116 SPEL | Reliable No Matter What
3.1 During the year the Group has adopted IFRS 13 ‘Fair Value Measurement’ which became effective for the financial periods beginning on or after 1 January 2015. IFRS 13 Fair Value Measurement establishes a single framework for measuring fair value and making disclosures about fair value measurements when such measurements are required or permitted by other IFRSs. It unifies the definition of fair values as the prices that would be received to sell an asset or paid to transfer a liability in an orderly transaction between market participants at the measurement date. It replaces and expands the disclosure requirements about fair value measurements in other IFRSs, including IFRS 7 Financial Instruments Disclosures. As a result, the Group has included the additional disclosure in this regard in note 35.5 to the consolidated financial statements. In accordance with the transitional provisions of IFRS 13, the Group has applied the new fair value measurement guidance prospectively and has not provided any comparative information for new disclosures. Notwithstanding the above, the change has no such significant impacts on the measurements of the Group’s financial assets and liabilities. The Group has also adopted IFRS 10 ‘Consolidated Financial Statements’, IFRS 11 ‘Joint Arrangements’, IFRS 12 ‘Disclosure of Interest in Other Entities’ which became applicable from 1 January, 2015, as per the adoption status of IFRS in Pakistan.
The application of IFRS 10, IFRS 11 and IFRS 12 did not have any impact on the consolidated financial statements of the Company.
3.2 Basis of consolidation
3.2.1 Subsidiary
The financial statements of the Subsidiary Company have been consolidated on a line-by-line basis and the carrying values of the investments held by the Holding Company have been eliminated against the shareholders’ equity in the Subsidiary Company.
The financial statements of the subsidiaries are prepared for the same reporting year as the Holding Company, using consistent accounting policies.
All intragroup balances, transactions, income and expenses and profits and losses resulting from intragroup transactions that are recognised in assets, have been eliminated in full.
3.3 Property, plant and equipment
Items of property, plant and equipment are measured at cost less accumulated depreciation and accumulated impairment losses with the exception of freehold land, which is measured at revalued amount less accumulated impairment losses and capital work in progress, which is stated at cost less accumulated impairment loss. Cost comprises purchase price, including import duties and non-refundable purchase taxes, after deducting trade discounts and rebates, and includes other costs directly attributable to the acquisition or construction, erection and installation. Cost in relation to certain property, plant and equipment signifies historical cost and borrowing costs as referred to in note 3.19.
Major renewals and improvements to an item of property, plant and equipment are recognized in the carrying amount of the item if it is probable that the embodied future economic benefits will flow to the Group and the cost of renewal or improvement can be measured reliably. The cost of the day-to-day servicing of property, plant and equipment are recognized in consolidated profit and loss account as incurred.
The Group recognizes depreciation by applying reducing balance method, over the useful life of each item of property, plant and equipment using rates specified in note 16.1 to the consolidated financial statements, except for leasehold land which is amortised using straight line basis. Depreciation on additions to property, plant and equipment is charged from the month in which the item becomes available for use. Depreciation is discontinued from the month in which it is disposed or classified as held for disposal.
Any gain or loss on disposal of property, plant and equipment is recognized in consolidated profit and loss account.
Surplus on revaluation is utilized in accordance with the provisions of section 235 of the Companies Ordinance, 1984.
Notes to the Consolidated Financial Statementsfor the year ended 30 June, 2016

117Annual Report 2016
Capital work in progress
Capital work in progress is stated at cost less any identified impairment and includes the expenditures on material, labour and appropriate overheads directly relating to the project. These costs are transferred to property, plant and equipment as and when assets are available for intended use.
3.4 Intangibles
The cost of acquisition, development and installation of identifiable software products having finite useful lives of more than one year is recognized as an intangible asset at cost and are amortized on a straight line basis. Subsequent to initial recognition, it is measured at cost less accumulated amortization and accumulated impairment losses, if any. The rate of amortization is specified in note 17.
3.5 Stores, spares and loose tools
These are stated at lower of cost and net realizable value. Cost is determined using the weighted average method. Items in transit are valued at cost comprising invoice value plus other charges paid thereon. The Group reviews the carrying amount of stores and spares on a regular basis and provision is made for obsolescence if there is any change in usage pattern and physical form of related stores, spares and loose tools. Impairment is also made for slow moving items.
3.6 Stock-in-trade
These are valued at lower of cost and net realizable value, with the exception of stock of waste which is valued at net realizable value. Cost is determined using the following basis:
Raw materials Moving average Packing materials Moving average Work in process Average manufacturing cost Finished goods Average manufacturing cost Stock in transit Invoice price plus related expense incurred up to the reporting date Average manufacturing cost in relation to work in process and finished goods consists of direct material, labour
and a proportion of appropriate manufacturing overheads. Net realizable value signifies the estimated selling price in the ordinary course of business less estimated costs of
completion and estimated costs necessary to make the sale. 3.7 Employee benefits
The Group operates an approved defined contributory provident fund for its employees. Equal contributions are made by the Group and employees at 10.00% of basic salary. The Group’s contribution is charged to consolidated profit and loss account currently.
3.8 Loans and receivables
Loans and receivables are non-derivative financial asset with fixed or determinable payments that are not quoted in an active market. They are carried at amortized cost less impairment, if any.
3.9 Financial instruments
Financial assets and liabilities are recognized when the Group becomes party to the contractual provisions of the instruments. Financial assets are de-recognized when the Group looses control of the contractual rights that comprise the financial assets. Financial liabilities are de-recognized when they are extinguished, that is, when the obligation specified in the contract is extinguished, cancelled, or expired. Any gain or loss on de-recognizing of the financial assets and financial liabilities is taken to consolidated profit and loss account currently.
The particular measurement methods adopted for various financial instruments are disclosed in the individual
policy statements associated with each item.

118 SPEL | Reliable No Matter What
3.10 Off-setting
A financial asset and a financial liability is offset and the net amount reported in the balance sheet if the Group has legally enforceable right to set-off the recognized amounts and intends either to settle on a net basis or to realize the asset and settle the liability simultaneously.
3.11 Regular way purchases and sales of financial assets
Regular way purchases and sales of financial assets are recognized on trade dates.
3.12 Loans and borrowings
Loans and borrowings are classified as ‘financial liabilities at amortized cost’. On initial recognition, these are measured at cost, being fair value at the date the liability is incurred, less attributable transaction costs. Subsequent to initial recognition, these are measured at amortized cost with any difference between cost and value at maturity recognized in consolidated profit and loss account over the period of the borrowings on an effective interest basis.
3.13 Finance leases
Leases in terms of which the Group assumes substantially all risks and rewards of ownership are classified as finance leases. Assets subject to finance lease are classified as ‘property, plant and equipment’. On initial recognition, these are measured at an amount equal to the lower of its fair value and the present value of minimum lease payments. Subsequent to initial recognition, these are measured at cost less accumulated depreciation and accumulated impairment losses. Depreciation, subsequent expenditure, de-recognition, and gains and losses on de-recognition are accounted for in accordance with the respective policies for property, plant and equipment. Liabilities against assets subject to finance lease and deposits against finance lease are classified as ‘financial liabilities at amortized cost’ and ‘loans and receivables’ respectively. Subsequent to initial recognition, minimum lease payments made under finance leases are apportioned between the finance charge and the reduction of outstanding liability. The finance charge is allocated to each period during the lease term so as to produce a constant periodic rate of interest on the remaining balance of the liability. Deposits against finance leases, subsequent to initial recognition are carried at amortised cost, less impairment, if any.
3.14 Operating leases
Leases that do not transfer substantially all risks and rewards of ownership are classified as operating leases. Payments made under operating leases are recognized in consolidated profit and loss account on a straight line basis over the lease term.
3.15 Trade and other payables
Trade and other payables are initially recognized at fair value and subsequently at amortized cost using effective interest rate method.
3.16 Provisions and contingencies
Provisions are recognized when the Group has a legal and constructive obligation as a result of past events and it is probable that outflow of resources embodying economic benefits will be required to settle the obligation and a reliable estimate can be made of the amount of obligation. Provision is recognized at an amount that is the best estimate of the expenditure required to settle the present obligation at the reporting date. Where outflow of resources embodying economic benefits is not probable, or where a reliable estimate of the amount of obligation cannot be made, a contingent liability is disclosed, unless the possibility of outflow is remote.
3.17 Trade and other receivables
On initial recognition, these are measured at cost, being their fair value at the date of transaction. Subsequent to initial recognition, these are measured at amortized cost less impairment losses if any, using the effective interest method, with interest recognized in consolidated profit and loss account. Bad debts are written off when identified.
Notes to the Consolidated Financial Statementsfor the year ended 30 June, 2016

119Annual Report 2016
3.18 Revenue
Revenue is measured at the fair value of the consideration received or receivable, net of returns, allowances, trade discounts and rebates, and represents amounts received or receivable for goods and services provided and other income earned in the normal course of business. Revenue is recognized when it is probable that the economic benefits associated with the transaction will flow to the Group, and the amount of revenue and the associated costs incurred or to be incurred can be measured reliably.
– Revenue from sale of goods is recognized when risks and rewards incidental to the ownership of goods are transferred to the buyer;
– Dividend income is recognized when the Group’s right to receive payment is established; and
– Interest income is recognized as and when accrued on effective interest method.
3.19 Borrowing costs
Borrowing costs directly attributable to the acquisition, construction or production of qualifying assets, which are assets that necessarily take a substantial period of time to get ready for their intended use or sale, are added to the cost of those assets, until such time as the assets are substantially ready for their intended use or sale. Investment income earned on the temporary investment of specific borrowings pending their expenditure on qualifying asset is deducted from the borrowing costs eligible for capitalization. All other borrowing costs are recognized in consolidated profit and loss account as incurred.
3.20 Taxation
Income tax expense comprises current tax and deferred tax. Income tax expense is recognized in consolidated profit and loss account except to the extent that it relates to items recognized directly in other comprehensive income, or equity, in which case it is recognized in other comprehensive income, or equity, as the case may be.
Current taxation
Current tax is the amount of tax payable on taxable income for the year, using tax rates enacted or substantively enacted by the reporting date, and any adjustment to the tax payable in respect of previous years. Provision for current tax is based on current rates of taxation in Pakistan after taking into account tax credits, rebates and exemptions available, if any. The amount of unpaid income tax in respect of the current or prior periods is recognized as a liability. Any excess paid over what is due in respect of the current or prior periods is recognized as an asset.
Deferred taxation
Deferred tax is accounted for using the balance sheet approach providing for temporary differences between the carrying amounts of assets and liabilities for financial reporting purposes and the amounts used for tax purposes. In this regard, the effects on deferred taxation of the portion of income that is subject to final tax regime is also considered in accordance with the treatment prescribed by the Institute of Chartered Accountants of Pakistan. Deferred tax is measured at rates that are expected to be applied to the temporary differences when they reverse, based on laws that have been enacted or substantively enacted by the reporting date. A deferred tax liability is recognized for all taxable temporary differences. A deferred tax asset is recognized for deductible temporary differences to the extent that future taxable profits will be available against which temporary differences can be utilized. Deferred tax assets are reviewed at each reporting date and are reduced to the extent that it is no longer probable that the related tax benefit will be realized.
3.21 Cash and cash equivalents
Cash and cash equivalents comprise running finances, cash and bank balances and call deposits with maturities of three months or less from the acquisition date that are subject to an insignificant risk of changes in their fair value, and are used by the Group in the management of its short-term commitments.

120 SPEL | Reliable No Matter What
3.22 Foreign currency transactions and balances
Transactions in foreign currencies are translated to the respective functional currencies of the Group at exchange rates at the dates of the transactions. Monetary assets and liabilities denominated in foreign currencies at the reporting date are retranslated to the functional currency at the exchange rate at that date. The foreign currency gain or loss on monetary items is the difference between amortized cost in the functional currency at the beginning of the year, adjusted for effective interest and payments during the year, and the amortized cost in foreign currency translated at the exchange rate at the end of the year.
Non-monetary assets and liabilities that are measured at fair value in a foreign currency are retranslated to the functional currency at the exchange rate prevailing at the date that the fair value was determined. Non-monetary items that are measured based on historical cost in a foreign currency are not translated.
Foreign currency differences arising on retranslation are generally recognized in consolidated profit and loss account.
3.23 Impairment
3.23.1 Financial assets
A financial asset is assessed at each reporting date to determine whether there is any objective evidence that it is impaired. Individually significant financial assets are tested for impairment on an individual basis. The remaining financial assets are assessed collectively in groups that share similar credit risk characteristics. A financial asset is considered to be impaired if objective evidence indicates that one or more events have had a negative effect on the estimated future cash flows of the asset.
An impairment loss in respect of a financial asset measured at amortized cost is calculated as the difference between its carrying amount, and the present value of the estimated future cash flows discounted at the original effective interest rate. Impairment loss in respect of a financial asset measured at fair value is determined by reference to that fair value. All impairment losses are recognized in consolidated profit and loss account. An impairment loss is reversed if the reversal can be related objectively to an event occurring after the impairment loss was recognized. An impairment loss is reversed only to the extent that the financial asset’s carrying amount after the reversal does not exceed the carrying amount that would have been determined, net of amortization, if no impairment loss had been recognized.
3.23.2 Non-financial assets
The carrying amount of the Group’s non-financial assets, other than inventories and deferred tax assets are reviewed at each reporting date to determine whether there is any indication of impairment. If any such indication exists, then the asset’s recoverable amount is estimated. The recoverable amount of an asset or cash generating unit is the greater of its value in use and its fair value less cost to sell. In assessing value in use, the estimated future cash flows are discounted to their present values using a pre-tax discount rate that reflects current market assessments of the time value of money and the risks specific to the asset or cash generating unit.
An impairment loss is recognized if the carrying amount of the assets or its cash generating unit exceeds its estimated recoverable amount. Impairment losses are recognized in consolidated profit and loss account. Impairment losses recognized in respect of cash generating units are allocated to reduce the carrying amounts of the assets in a unit on a pro rata basis. Impairment losses recognized in prior periods are assessed at each reporting date for any indications that the loss has decreased or no longer exists. An impairment loss is reversed if there has been a change in the estimates used to determine the recoverable amount. An impairment loss is reversed only to that extent that the asset’s carrying amount after the reversal does not exceed the carrying amount that would have been determined, net of depreciation and amortization, if no impairment loss had been recognized.
Notes to the Consolidated Financial Statementsfor the year ended 30 June, 2016

121Annual Report 2016
3.24 Dividend to ordinary shareholders
Dividend to ordinary shareholders is recognized as a deduction from accumulated profit in statement of changes in equity and as a liability in the Group’s consolidated financial statements in the year in which the dividends are approved.
3.25 Share capital
Incremental cost directly attributable to the issue of ordinary shares are recognised as deduction from equity.
3.26 Segment reporting
Operating segment is reported in a manner consistent with the internal reporting provided to the chief operating decision maker. The chief operating decision maker who is responsible for allocating resources and assessing performance of the operating segments, has been identified as the Board of Directors of the Group that makes strategic decisions. The management has determined that the Holding Company which has significant operations has a single reportable segment as the Board of Directors views the Holding Company’s operations as one reportable segment. However, the Group derives revenue from local and export sales.
4 New and revised approved accounting standards, interpretations and amendments thereto
The following standards, amendments and interpretations of approved accounting standards will be effective for accounting periods beginning on or after 1 July 2016:
– Amendments to IAS 38 Intangible Assets and IAS 16 Property, Plant and Equipment (effective for annual periods beginning on or after 1 January 2016) introduce severe restrictions on the use of revenue-based amortization for intangible assets and explicitly state that revenue-based methods of depreciation cannot be used for property, plant and equipment. The rebuttable presumption that the use of revenue-based amortization methods for intangible assets is inappropriate can be overcome only when revenue and the consumption of the economic benefits of the intangible asset are ‘highly correlated’, or when the intangible asset is expressed as a measure of revenue. The amendments are not likely to have an impact on Group’s consolidated financial statements.
– Investment Entities: Applying the Consolidation Exception (Amendments to IFRS 10 – Consolidated Financial Statements and IAS 28 – Investments in Associates and Joint Ventures) [effective for annual periods beginning on or after 1 January 2016] clarifies (a) which subsidiaries of an investment entity are consolidated; (b) exemption to present consolidated financial statements is available to a parent entity that is a subsidiary of an investment entity; and (c) how an entity that is not an investment entity should apply the equity method of accounting for its investment in an associate or joint venture that is an investment entity. The amendments are not likely to have an impact on Group’s consolidated financial statements.
– Accounting for Acquisitions of Interests in Joint Operations – Amendments to IFRS 11 ‘Joint Arrangements’ (effective
for annual periods beginning on or after 1 January 2016) clarify the accounting for the acquisition of an interest in a joint operation where the activities of the operation constitute a business. They require an investor to apply the principles of business combination accounting when it acquires an interest in a joint operation that constitutes a business. The amendments are not likely to have an impact on Group’s consolidated financial statements.
– Amendment to IAS 27 ‘Separate Financial Statements’ (effective for annual periods beginning on or after 1 January
2016) allows entities to use the equity method to account for investments in subsidiaries, joint ventures and associates in their separate financial statements. The amendment is not likely to have an impact on the Group’s consolidated financial statements.
– Agriculture: Bearer Plants [Amendment to IAS 16 and IAS 41] (effective for annual periods beginning on or after 1
January 2016). Bearer plants are now in the scope of IAS 16 Property, Plant and Equipment for measurement and disclosure purposes. Therefore, a Group can elect to measure bearer plants at cost. However, the produce growing on bearer plants will continue to be measured at fair value less costs to sell under IAS 41 Agriculture. A bearer plant is a plant that: is used in the supply of agricultural produce; is expected to bear produce for more than one period;

122 SPEL | Reliable No Matter What
and has a remote likelihood of being sold as agricultural produce. Before maturity, bearer plants are accounted for in the same way as self-constructed items of property, plant and equipment during construction. The amendments are not likely to have an impact on Group’s consolidated financial statements.
– Amendments to IAS 12 ‘Income Taxes’ are effective for annual periods beginning on or after 1 January 2017. The amendments clarify that the existence of a deductible temporary difference depends solely on a comparison of the carrying amount of an asset and its tax base at the end of the reporting period, and is not affected by possible future changes in the carrying amount or expected manner of recovery of the asset. The amendments are not likely to have an impact on the Group’s consolidated financial statements.
– Amendments to IAS 7 ‘Statement of Cash Flows’ are part of IASB’s broader disclosure initiative and are effective for annual periods beginning on or after 1 January 2017. The amendments require disclosures that enable users of financial statements to evaluate changes in liabilities arising from financing activities, including both changes arising from cash flow and non-cash changes.
– Amendments to IFRS 2 ‘Share-based Payment’ clarify the accounting for certain types of arrangements and are
effective for annual periods beginning on or after 1 January 2018. The amendments cover three accounting areas (a) measurement of cash-settled share-based payments; (b) classification of share-based payments settled net of tax withholdings; and (c) accounting for a modification of a share-based payment from cash-settled to equity-settled. The new requirements could affect the classification and/or measurement of these arrangements and potentially the timing and amount of expense recognised for new and outstanding awards. The amendments are not likely to have an impact on Group’s consolidated financial statements.
Annual Improvements 2012-2014 cycles (amendments are effective for annual periods beginning on or after 1 January
2016). The new cycle of improvements contain amendments to the following standards: – IFRS 5 Non-current ‘Assets Held for Sale and Discontinued Operations’. IFRS 5 is amended to clarify that if an entity
changes the method of disposal of an asset (or disposal group) i.e. reclassifies an asset from held for distribution to owners to held for sale or vice versa without any time lag, then such change in classification is considered as continuation of the original plan of disposal and if an entity determines that an asset (or disposal group) no longer meets the criteria to be classified as held for distribution, then it ceases held for distribution accounting in the same way as it would cease held for sale accounting.
– IFRS 7 ‘Financial Instruments - Disclosures’. IFRS 7 is amended to clarify when servicing arrangements on continuing
involvement in transferred financial assets in cases when they are derecognized in their entirety are in the scope of its disclosure requirements. IFRS 7 is also amended to clarify that additional disclosures required by ‘Disclosures: Offsetting Financial Assets and Financial Liabilities (Amendments to IFRS7)’ are not specifically required for inclusion in condensed interim financial statements for all interim periods.
– IAS 19 ‘Employee Benefits’. IAS 19 is amended to clarify that high quality corporate bonds or government bonds used in determining the discount rate should be issued in the same currency in which the benefits are to be paid.
– IAS 34 ‘Interim Financial Reporting’. IAS 34 is amended to clarify that certain disclosures, if they are not included in the notes to interim financial statements and disclosed elsewhere should be cross referred.
The above amendments are not likely to have an impact on the Group’s consolidated financial statements.
Notes to the Consolidated Financial Statementsfor the year ended 30 June, 2016

123Annual Report 2016
5 Share capital
5.1 Authorized share capital
2016 2015 2016 2015Number of Number of Rupees Rupees
shares shares
100,000,000 100,000,000 Ordinary shares of Rs. 10 each 1,000,000,000 1,000,000,000
5.2 Issued, subscribed and paid-up capital
19,791,940 19,791,940 Ordinary shares of Rs. 10 each, fully paid in cash 197,919,400 197,919,400 49,893,060 49,893,060 Fully paid bonus shares of Rs. 10 each 498,930,600 498,930,600 7,665,000 7,665,000 Shares of Rs. 10 each, issued under scheme of amalgamation 76,650,000 76,650,000
77,350,000 77,350,000 773,500,000 773,500,000
5.3 Reconciliation of ordinary shares
77,350,000 58,000,000 Balance at 01 July 773,500,000 580,000,000 – 19,350,000 Shares issued during the year - note 5.4 – 193,500,000
77,350,000 77,350,000 Balance at 30 June 773,500,000 773,500,000
5.4 During the previous year, the Group issued 19.35 million ordinary shares of Rs. 10 each at a price of Rs. 30 per share (including premium of Rs. 20 per share), through Initial Public Offer.
5.5 Directors hold 55,236,635 (2015: 56,548,135) ordinary shares of Rs. 10 each of the Group.
6 Share premium
This reserve can be utilized by the Group only for the purpose specified in Section 83(2) of the Companies Ordinance, 1984 (refer note 5.4 for details).
7 Surplus on revaluation of land
Land of the Group was revalued on 30 June 2014 by a firm of independent valuers, Hamid Mukhtar & Company (Private) Limited. The valuation was determined with respect to current market value of similar properties.
2016 2015 Note Rupees Rupees
8 Long term finance - secured
These comprise of:
8.1 Long term finance
– Standard Chartered Bank (Pakistan) Limited (conventional window) 8.1.1 5,005,728 11,680,008 – Loan from customer 8.1.2 49,504,723 48,300,329
54,510,451 59,980,337 Less: Current maturity 13 (29,925,082) (6,674,292)
24,585,369 53,306,0458.2 Diminishing musharika
– United Bank Limited - I 8.2.1 1,638,800 3,605,360 – United Bank Limited - II 8.2.2 9,431,000 18,862,000
11,069,800 22,467,360 Less: Current maturity 13 (11,069,800) (11,397,552)
– 11,069,808
24,585,369 64,375,853

124 SPEL | Reliable No Matter What
2016 2015 Rupees Rupees
8.3 Type of loans
Interest / mark-up based loans 54,510,451 59,980,337 Islamic mode of financing 11,069,800 22,467,360
65,580,251 82,447,697
8.1.1 The long term finance amounting to Rs. 20.02 million has been obtained from Standard Chartered Bank (Pakistan) Limited (“SCB”) for the purpose of retirement of letters of credit established with Meezan Bank Limited and SCB for import of plant and machinery (“the Assets”) for the Group’s business. The term finance agreement (“the Agreement”) was entered on 21 March 2014 between the Group and SCB. As per terms of the Agreement, principal is payable in thirty six equal monthly installments started from 30 April 2014 and ending on 31 March 2017. This finance carries mark-up at the rate of three months KIBOR plus a spread of 1.75% per annum (2015: three months KIBOR plus a spread rate of 1.75% per annum), payable quarterly.
The loan along with other facilities provided by SCB are secured by:
– exclusive first charge by way of hypothecation on plant and machinery amounting to Rs. 31 million;
– first pari passu over present and future current assets of the Group by way of hypothecation amounting to Rs. 126.67 million;
– first pari passu over present and future plant and machinery of the Group by way of hypothecation amounting to Rs. 126.67 million; and
During the year, the Group has made repayments amounting to Rs. 6.67 million.
8.1.2 This represents a loan from a customer for production of specific items to be utilized for the customer’s order. This carries mark up at 7.7 % per annum. Loan is being repaid in 24 monthly installments which started from June 2016.
During the year, the Group has made repayments amounting to Rs. 1.99 million. 8.2.1 The facility amounting to Rs. 5.90 million has been obtained from United Bank Limited, Islamic Bank Branch (“UBL
Ameen”) for import of machinery and equipment (“Machinery”). The diminishing musharika agreement (“DMA - I”) was entered on 14 April 2014 between the Group and UBL Ameen. As per terms of the DMA - I, musharika units are repayable in thirty six equal monthly installments starting from 15 May 2014 and ending on 15 April 2017. Under the musharika agreement, the Group holds joint ownership of the machine with UBL Ameen. The finance carries mark-up at six months KIBOR plus a spread of 2.00% per annum (2015: six months KIBOR plus a spread of 2.00% per annum), payable monthly.
The facility is secured in favour of UBL Ameen by:
– hypothecation charge on the machinery;
– demand promissory note amounting to Rs. 9.60 million; and
During the year, the Company has made repayments amounting to Rs. 1.97 million. 8.2.2 The facility amounting to Rs. 18.86 million has been obtained from United Bank Limited, Islamic Bank Branch (“UBL
Ameen”) to finance the acquisition of conductors, poles and other related accessories for independent feeder (“Equipments”) from Water and Power Development Authority (“WAPDA”) for uninterrupted power supply. The diminishing musharika agreement (“DMA - II”) was entered on 26 June 2014 between the Group and UBL Ameen. As per terms of the DMA - II, musharika units are repayable in twenty four equal monthly installments starting from 30 July 2015 and ending on 30 June 2017. Under the musharika agreement, the Group holds joint ownership of the equipment with UBL Ameen. The finance carries mark-up at six months KIBOR plus a spread of 2.00% per annum
Notes to the Consolidated Financial Statementsfor the year ended 30 June, 2016

125Annual Report 2016
(2015: six months KIBOR plus a spread of 2.00% per annum), payable monthly.
The facility is secured in favour of UBL Ameen by:
– hypothecation charge on the equipment; and
– demand promissory note amounting to Rs. 22.64 million.
During the year, the Group has made repayments amounting to Rs. 9.43 million.
2016 2015
9 Liability against assets subject to finance lease
Salient features of the leases are as follows:
Discounting factor 7.15% to 13.16% 8.9% to 13.30% Period of lease 36 - 60 months 36 months Security deposits 10% 10%
Year of maturity 2016-2020 2015-2017
The Group has entered into finance lease arrangements with various financial institutions for lease of plant and machinery and vehicles as shown in note 16.1. The liabilities under these arrangements are payable in monthly installments. Interest rates implicit in the leases are used as discounting factor to determine the present value of minimum lease payments. The Group’s finance lease liability is interest / markup based. Finance lease liabilities are obtained from conventional mode of leasing.
All lease agreements carry purchase option at the end of lease term and the Group intends to exercise its option to
purchase the leased assets upon completion of the respective lease terms. Residual value of the leased assets has already been paid by the Group at inception of the lease in form of security deposit. There are no financial restrictions imposed by lessor. Taxes, repairs, replacements and insurance costs are borne by the lessee.
The amount of future minimum lease payments along with their present value and the periods during which they will fall
due are:
2016
Total future Finance charges minimum lease allocated to payments future periods Principal
Rupees Not later than one year 20,831,101 1,870,256 18,960,845 Later than one year and not later than five years 17,753,096 1,006,229 16,746,867
38,584,197 2,876,485 35,707,712
2015
Total future Finance charges minimum lease allocated to payments future periods Principal
Rupees Not later than one year 63,568,697 5,486,449 58,082,248 Later than one year and not later than five years 31,280,561 1,899,109 29,381,452
94,849,258 7,385,558 87,463,700

126 SPEL | Reliable No Matter What
2016 2015 Rupees Rupees
10 Deferred taxation
The liability for deferred taxation comprises temporary differences relating to: Deferred tax liability arising on: – accelerated tax depreciation 188,327,012 151,947,683 Deferred tax asset arising on: – finance lease transactions - net (10,712,314) (27,577,079) – others (15,885,640) –
161,729,058 124,370,604 11 Trade and other payables
Trade creditors 54,348,126 57,998,145 Accrued liabilities 31,508,235 35,648,685 Advances from customers 6,830,205 9,834,869 Workers’ Profit Participation Fund 21,151,351 15,331,647 Workers’ Welfare Fund 8,035,413 4,990,831 Payable to Provident Fund Trust 1,122,499 1,007,325 Withholding tax payable 612,627 1,750,115 Unclaimed dividend 275,607 137,244 Others 4,285,341 960,489
128,169,404 127,659,350 12 Short term borrowings - secured
These represent short term finances utilized under interest / mark-up arrangements from banking companies and financial institutions.
2016 2015
Note Rupees Rupees Type of loans
Interest / mark-up based loans 95,332,958 289,177,271 Islamic mode of financing 156,511,393 91,273,330
251,844,351 380,450,601 Short term running finance 12.1 50,270,026 189,337,718 Finance against trust receipts 12.2 201,574,325 191,112,883
251,844,351 380,450,601
Notes to the Consolidated Financial Statementsfor the year ended 30 June, 2016

127Annual Report 2016
12.1 This represents utilized amount of short term running finance facilities available from commercial banks aggregating Rs. 295 million (2015: Rs. 412 million). These carry mark-up rates ranging from one month to three months KIBOR plus an agreed spread (2015: one month to three months KIBOR plus an agreed spread).
12.2 This represents utilized amount of finance against trust receipt available from commercial banks aggregating Rs. 535 million (2015: Rs. 535 million). These carry mark-up rates ranging from one month to three months KIBOR plus an agreed spread (2015: one month to three months KIBOR plus an agreed spread).
12.3 These facilities are secured by first pari passu registered hypothecation charge on current and fixed assets of the Group, by lien over import documents and pledge of imported goods, local currency deposits.
2016 2015 Note Rupees Rupees
13 Current maturity of long term liabilities
Long term finance - secured 8 29,925,082 6,674,292 Diminishing musharika - secured 8 11,069,800 11,397,552 Liabilities against assets subject to finance lease 9 18,960,845 58,082,248
59,955,727 76,154,092
14 Accrued mark up
Diminishing musharika 5,630 18,061 Short term borrowings 4,136,412 7,054,931
4,142,042 7,072,992
15 Contingencies and commitments
15.1 Contingencies
15.1.1 Counter guarantees given by the Group to its bankers as at the reporting date amount to Rs. 25.43 million (2015: Rs. 50.97 million).
15.1.2 The Deputy Commissioner Inland Revenue has issued an order on 23 January 2015 against the Holding Company
in respect of tax year (TY) 2009 raising a demand of Rs. 45.8 million. The order was annulled by the Commissioner Inland Revenue (Appeals) against which the tax department has filed appeal before the Income Tax Appellate Tribunal (Tribunal) on 30 April 2015. As the decision of appeal is expected in favour of the Holding Company, therefore no provision is recorded in these consolidated financial statements.
15.1.3 The Deputy Commissioner Inland Revenue has issued an assessment order on 27 June 2015 against SPEL
Packaging Industries (Private) Limited (which was merged with Holding Company in financial year 2011-12) in respect of TY 2009 and assessed Rs. 53.2 million payable by the Holding Company. The Holding Company filed an appeal before the Commissioner Inland Revenue (Appeals) which was decided against the Holding Company. The management has filed a second appeal before the Tribunal. No provision has been made in these consolidated financial statements as the management is confident of favourable outcome of the matter.
15.1.4 The Deputy Commissioner Inland Revenue had issued an order against the Holding Company raising demand of sales tax of Rs. 7.6 million pertaining to TY 2012 based on a procedural matter. The Holding Company had filed appeal before the Tribunal which was decided in favor of the Holding Company through order No. 597/LB/2015 dated 07 October 2015.

128 SPEL | Reliable No Matter What
15.1.5 The Additional Commissioner Inland Revenue has passed an assessment order against the Holding Company on 30 April 2015 raising demand of Rs. 6.1 million pertaining to TY 2013. The Holding Company had filed appeal against the order before Commissioner Inland Revenue (Appeals). As a result, the case was remanded back to Additional Commissioner Inland Revenue. As there is no expectation of any liability arising from the case therefore no provision is recorded in this regard in these consolidated financial statements
15.1.6 The Deputy Commissioner Inland Revenue (DCIR) has passed an order against the Holding Company on 20 June 2016 raising demand of Rs. 3.7 million under Section 25(3) of the Sales Tax Act, 1990. The Holding Company filed appeal against the order before Commissioner Inland Revenue (Appeals), decision of which is pending.
15.1.7 Petition No. 39131 / 2015 was filed by the Holding Company for issuance of exemption certificate under section 148 of the Income Tax Ordinance, 2001 in Lahore High Court in respect of import of plant and machinery. The same is still pending. However, the interim relief has been granted to the Holding Company subject to furnishing bank guarantee.
2016 2015 Note Rupees Rupees
15.2 Commitments
15.2.1 Commitments under irrevocable letters of credit for:
– Purchase of machinery 63,077,729 72,384,510 – Purchase of raw material 148,896,931 141,076,786
211,974,660 213,461,296
16 Property, plant and equipment
Operating fixed assets 16.1 1,471,571,292 990,525,286 Capital work in progress 16.6 43,782,702 39,838,683
1,515,353,994 1,030,363,969
Notes to the Consolidated Financial Statementsfor the year ended 30 June, 2016

129Annual Report 2016
16
.1
Op
erat
ing
fixe
d a
sset
s
20
16
Cost
Accu
mul
ated
dep
reci
atio
n
As a
t 01
As a
t 30
Rate
As
at 0
1 Fo
r the
Tr
ansf
ers
Dis
posa
ls
As a
t 30
Net b
ook
July
201
5 Ad
ditio
n Tr
ansf
ers
Dis
posa
ls
June
201
6
July
201
5 ye
ar
June
201
6 va
lue
as a
t
30
June
201
6
Rupe
es
%
Rupe
es
Rupe
es
Ow
ned
Free
hold
land
– co
st
20,
481,
919
5
6,72
6,92
5
–
–
77,
208,
844
–
–
–
–
–
– 77
,208
,844
–
reva
luat
ion
226
,943
,081
–
–
–
2
26,9
43,0
81
– –
–
–
–
–
226
,943
,081
247
,425
,000
5
6,72
6,92
5
–
–
304
,151
,925
–
–
–
– –
30
4,15
1,92
5
Bu
ildin
gs o
n fre
ehol
d la
nd
36,
990,
667
8
,112
,710
–
–
4
5,10
3,37
7
10%
2
2,79
2,19
5
1,7
84,0
93
–
– 2
4,57
6,28
8
20,
527,
089
Pl
ant a
nd m
achi
nery
9
04,5
28,3
66
480
,822
,787
1
35,6
31,6
97
–
1,52
0,98
2,85
0
10%
3
94,8
50,2
95
64,
225,
265
2
9,93
2,78
9
–
489
,008
,349
1
,031
,974
,501
O
ffice
equ
ipm
ent
3,5
71,5
47
2,2
10,0
04
–
–
5,7
81,5
51
10%
1
,645
,419
2
81,0
21
–
–
1,9
26,4
40
3,8
55,1
11
To
ols a
nd e
quip
men
t 6
,985
,119
2
,759
,371
–
–
9
,744
,490
10
%
2,4
27,2
68
571
,849
–
–
2,9
99,1
17
6,7
45,3
73
Co
mpu
ter e
quip
men
t 1
0,05
4,66
8
729
,273
–
–
1
0,78
3,94
1
30%
8
,084
,687
7
14,9
60
–
– 8
,799
,647
1
,984
,294
Fu
rnitu
re a
nd fi
tting
s 9
,939
,292
4
,709
,944
–
–
1
4,64
9,23
6
10%
3
,352
,175
8
91,8
98
–
– 4
,244
,073
1
0,40
5,16
3
Ve
hicl
es
21,
983,
513
7
,780
,405
2
,093
,000
(1
,718
,779
) 3
0,13
8,13
9
20%
6
,696
,605
4
,220
,803
1
,241
,065
(1
,287
,344
) 1
0,87
1,12
9
19,
267,
010
1,2
41,4
78,1
72
563
,851
,419
1
37,7
24,6
97
(1,7
18,7
79)
1,9
41,3
35,5
09
4
39,8
48,6
44
72,
689,
889
3
1,17
3,85
4
(1,2
87,3
44)
542
,425
,043
1
,398
,910
,466
Le
ased
Le
aseh
old
land
(not
e 16
.2)
22,
083,
915
–
–
–
2
2,08
3,91
5
1.67
%
2,2
12,8
08
368
,801
–
–
2,5
81,6
09
19,
502,
306
Pl
ant a
nd m
achi
nery
1
89,5
14,4
73
– (1
35,6
31,6
97)
– 5
3,88
2,77
6
10%
2
3,38
5,87
5
14,
764,
037
(2
9,93
2,78
9)
–
8,2
17,1
23
45,
665,
653
Ve
hicl
es
4,5
87,0
00
6,7
48,0
00
(2,0
93,0
00)
– 9
,242
,000
20
%
1,6
90,9
47
1,2
99,2
51
(1,2
41,0
65)
– 1
,749
,133
7
,492
,867
216
,185
,388
6
,748
,000
(1
37,7
24,6
97)
–
85,
208,
691
27,
289,
630
1
6,43
2,08
9
(31,
173,
854)
–
12,
547,
865
7
2,66
0,82
6
20
16
1,4
57,6
63,5
60
570
,599
,419
–
(1
,718
,779
) 2
,026
,544
,200
467
,138
,274
8
9,12
1,97
8
–
(1,2
87,3
44)
554
,972
,908
1
,471
,571
,292

130 SPEL | Reliable No Matter What
20
15
Cost
Accu
mul
ated
dep
reci
atio
n
As a
t 01
As a
t 30
Rate
As
at 0
1 Fo
r the
Tr
ansf
ers
Dis
posa
ls
As a
t 30
Net b
ook
July
201
4 Ad
ditio
n Tr
ansf
ers
Dis
posa
ls
June
201
5
July
201
4 ye
ar
June
201
5 va
lue
as a
t
30
June
201
5
Rupe
es
%
Rupe
es
Rupe
es
Ow
ned
Free
hold
land
– co
st
20,
481,
919
–
–
–
2
0,48
1,91
9
–
–
–
–
–
–
20,
481,
919
–
reva
luat
ion
226
,943
,081
–
–
–
2
26,9
43,0
81
–
–
–
–
–
–
226
,943
,081
247
,425
,000
–
–
–
2
47,4
25,0
00
–
–
–
–
–
2
47,4
25,0
00
Bu
ildin
gs o
n fre
ehol
d la
nd
33,
472,
011
3
,518
,656
–
–
3
6,99
0,66
7
10%
2
1,42
5,20
2
1,3
66,9
93
–
–
22,
792,
195
1
4,19
8,47
2
Pl
ant a
nd m
achi
nery
7
78,1
02,2
26
121
,280
,079
2
7,82
1,06
1
(22,
675,
000)
9
04,5
28,3
66
10%
3
46,1
03,2
03
52,
864,
161
1
0,55
7,10
2
(14,
674,
171)
3
94,8
50,2
95
509
,678
,071
O
ffice
equ
ipm
ent
2,1
29,3
43
1,4
42,2
04
–
–
3,5
71,5
47
10%
1
,453
,860
1
91,5
59
–
–
1,6
45,4
19
1,9
26,1
28
To
ols a
nd e
quip
men
t 3
,926
,931
3
,058
,188
–
–
6
,985
,119
10
%
2,1
36,7
31
290
,537
–
–
2
,427
,268
4
,557
,851
Co
mpu
ter e
quip
men
t 9
,393
,344
6
61,3
24
–
–
10,
054,
668
30
%
7,4
02,9
41
681
,746
–
–
8
,084
,687
1
,969
,981
Fu
rnitu
re a
nd fi
tting
s 5
,977
,998
3
,961
,294
–
–
9
,939
,292
10
%
2,7
27,2
14
624
,961
–
–
3
,352
,175
6
,587
,117
Ve
hicl
es
8,3
11,9
95
12,
702,
518
1
,742
,000
(7
73,0
00)
21,
983,
513
20
%
5,2
44,1
52
1,2
69,8
75
713
,366
(5
30,7
88)
6,6
96,6
05
15,
286,
908
1,0
88,7
38,8
48
146
,624
,263
2
9,56
3,06
1
(23,
448,
000)
1
,241
,478
,172
386
,493
,303
5
7,28
9,83
2
11,
270,
468
(1
5,20
4,95
9)
439
,848
,644
8
01,6
29,5
28
Le
ased
Le
aseh
old
land
2
2,08
3,91
5
–
–
–
22,
083,
915
1.
67%
1
,844
,007
3
68,8
01
–
–
2,2
12,8
08
19,
871,
107
Pl
ant a
nd m
achi
nery
1
63,4
52,7
57
53,
882,
777
(2
7,82
1,06
1)
–
189
,514
,473
10
%
17,
978,
710
1
5,96
4,26
7
(10,
557,
102)
–
2
3,38
5,87
5
166
,128
,598
Ve
hicl
es
6,3
29,0
00
–
(1,7
42,0
00)
–
4,5
87,0
00
20%
1
,680
,300
7
24,0
13
(713
,366
) –
1
,690
,947
2
,896
,053
191
,865
,672
5
3,88
2,77
7
(29,
563,
061)
–
216
,185
,388
21,
503,
017
1
7,05
7,08
1
(11,
270,
468)
–
2
7,28
9,63
0
188
,895
,758
20
15
1,2
80,6
04,5
20
200
,507
,040
–
(23,
448,
000)
1
,457
,663
,560
407
,996
,320
7
4,34
6,91
3
–
(15,
204,
959)
4
67,1
38,2
74
990
,525
,286
Notes to the Consolidated Financial Statementsfor the year ended 30 June, 2016

131Annual Report 2016
16.2 Leasehold land comprises of land situated in Karachi which was obtained by the Group on lease and is being amortized over the term of 60 years. The title of land remains with the lessor at end of the lease term. However, leasehold land has been included in property, plant and equipment in accordance with clarification issued by Institute of Chartered Accountants of Pakistan through selected opinion issued on IAS 17 Leases.
2016 2015 Rupees Rupees
16.3 The depreciation charge for the year has been allocated as follows: Cost of goods sold 77,055,795 66,166,769 Capital work in progress 3,152,214 743,447 Administrative expenses 4,457,968 3,719,463 Selling and distribution expenses 4,456,001 3,717,234
89,121,978 74,346,913 16.4 The carrying value of freehold land would have been Rs. 77.20 million (2015: Rs. 20.48 million), had there been no
revaluation. 16.5 Disposal of property, plant and equipment
Accumulated Written Mode of Particulars
Particulars Cost depreciation down Sales Gain/(loss) disposal of buyer
value Proceeds
Rupees
Vehicles
Motor cycle CD 70 73,509 12,849 60,660 66,410 5,750 Insurance claim against theft
Motor cycle CD 70 71,027 43,873 27,154 29,520 2,366 Group Policy Mr. Muhammad Akhtar
Motor cycle CD 70 71,027 43,873 27,154 24,998 (2,156) Group Policy Mr. Muhammad Abbas
Motor cycle CD 70 71,027 43,873 27,154 40,527 13,373 Group Policy Mr. Muhammad Atif
Motor cycle CD 70 71,027 43,873 27,154 35,000 7,846 Group Policy Mr. Muhammad Fiaz
Motor cycle CD 70 71,027 45,813 25,214 35,000 9,786 Group Policy Mr. Muhammad Ashraf
Motor cycle CD 70 71,027 44,851 26,176 27,512 1,336 Group Policy Mr. Muhammad Mumtaz
Motor cycle CD 70 71,027 46,298 24,729 30,628 5,899 Group Policy Mr. Abdul Rasheed
Toyota Corolla XLI 935,000 830,422 104,578 500,000 395,422 Group Policy Mr. Khuram Jahangir
Motor cycle CD 70 71,027 43,873 27,154 50,000 22,846 Negotiation Mr. Khalil Ahmad
Motor cycle CD 70 71,027 43,873 27,154 45,000 17,846 Negotiation Mr. M. Rizwan Hadyat
Motor cycle CD 70 71,027 43,873 27,154 45,000 17,846 Negotiation Mr .Muhammad Amjad
1,718,779 1,287,344 431,435 929,595 498,160
2016 1,718,779 1,287,344 431,435 929,595 498,160
2015 23,448,000 15,204,959 8,243,041 5,117,851 (3,125,190)

132 SPEL | Reliable No Matter What
16.6 Capital Work In Progress
30 June 2016 As at As at
01 July 2015 Additions Transfers 30 June 2016
Rupees
Capital Work In Progress 39,838,683 336,438,284 332,494,265 43,782,702 30 June 2015 As at As at 01 July 2014 Additions Transfers 30 June 2015
Rupees Capital Work In Progress 597,898 49,786,747 10,545,962 39,838,683
2016 2015 Rupees Rupees
16.7 The breakup is as follows Plant and machinery 43,374,711 39,838,683 Civil works 407,991 –
43,782,702 39,838,683 16.8 During the year the Group has capitalized borrowing cost of Rs. 3.19 million in plant and machinery at markup rate
of 7.7 % per annum.
2016 2015 Rupees Rupees
17 Intangibles
Cost 8,608,436 6,936,606 Accumulated amortization (4,317,407) (2,729,402)
As at 30 June 4,291,029 4,207,204
Amortization rate 20% 20%
17.1 Balance as at 01 July 4,207,204 5,368,325 Additions during the year 1,671,829 226,200 Amortization charge for year (1,588,004) (1,387,321)
Balance as at 30 June 4,291,029 4,207,204 This represents expenditure incurred on implementation of SAP business one suite. The amortization charge has
been allocated to administrative expenses.
2016 2015 Note Rupees Rupees
18 Long term deposits
Financial institutions 18.1 13,954,799 5,637,101 Utility companies and regulatory authorities 1,626,847 1,626,847 Others 1,649,400 –
17,231,046 7,263,948
Notes to the Consolidated Financial Statementsfor the year ended 30 June, 2016

133Annual Report 2016
18.1 These represent deposits with various banking companies and financial institutions against finance lease and margin on guarantees.
2016 2015 Note Rupees Rupees
19 Stock-in-trade
Raw and packing material 246,185,243 255,622,377 Stock in transit 39,403,293 32,697,008 Work in process 11,658,090 12,712,071 Finished goods 19.1 19,298,362 20,660,042
316,544,988 321,691,498
19.1 This includes net realizable value adjustment of Nil (2015: Rs. 2.68 million).
2016 2015 Rupees Rupees
20 Income tax - net
Income tax refundable 80,008,283 78,072,559 Taxation - net 66,436,530 6,915,098
146,444,813 84,987,657 21 Advances, deposits, prepayments and other receivables
Advances - unsecured, considered good – to employees 451,987 426,374 – to suppliers for raw material 3,447,875 3,641,073 Amount paid against future shipments 6,486,686 3,627,520 Short term deposits 249,400 10,802,445 Sales tax receivable - net 36,277,281 3,160,873 Interest receivable 430,228 8,482,699 Prepaid insurance 4,128,457 956,933 Other receivables 5,128,816 –
56,600,730 31,097,917 22 Short term investments
These represent term deposit receipts of Habib Bank Limited under interest / markup based arrangement from conventional window of the bank amounting to Rs. 75 million (2015:Rs. 580.5 million); and First National Bank Modaraba under Shariah permissible arrangement amounting to Nil (2015:Rs. 1.6 million). These carry return ranging from 6.35% to 6.7% (2015: 6.7% - 7.7%) per annum and are for the period from six to twelve months.
2016 2015
Note Rupees Rupees
23 Cash and bank balances
Cash in hand 25,087 25,087 Cash at bank – current accounts in local currency 23.1 47,128,696 36,958,393 – current accounts in foreign currency with conventional banks 216,770 532,119 – saving accounts in local currency 23.2 3,824,790 459,591
51,170,256 37,950,103
51,195,343 37,975,190

134 SPEL | Reliable No Matter What
23.1 These include deposits amounting to Rs. 36.80 million (2015: Rs. 10.58 million) placed under an arrangement permissible under Shariah. Remaining balance represents deposits with conventional windows of the banks.
23.2 These carry return at 3.5% to 5% per annum (2015: 5% to 5.50% per annum). These include Rs. 3.69 million (2015 : Rs. 0.12 million) placed under Shariah permissible arrangement.
2016 2015
Note Rupees Rupees
24 Sales - net
Local 2,704,870,813 2,511,103,461 Export 18,563,317 23,742,819
2,723,434,130 2,534,846,280 Less: Sales tax (401,698,185) (368,076,852)
2,321,735,945 2,166,769,428 25 Cost of sales
Raw and packing materials consumed 1,338,097,984 1,278,955,838 Stores, spare and loose tools consumed 9,038,932 6,396,086 Salaries, wages and benefits 25.1 144,437,204 137,727,612 Electricity, fuel and water charges 123,242,590 154,782,029 Depreciation on property, plant and equipment 16.3 77,055,795 66,166,769 Repair and maintenance 35,678,255 32,741,565 Sorting charges 3,284,347 3,537,979 Insurance 3,197,322 4,179,529 Oil and lubricants 2,909,138 2,184,318
1,736,941,567 1,686,671,725 Work in progress
- At beginning of the year 12,712,071 10,361,284 - At end of the year (11,658,090) (12,712,071)
Cost of goods manufactured 1,737,995,548 1,684,320,938
Finished goods
- At beginning of the year 20,660,042 9,809,793 - At end of the year (19,298,362) (20,660,042)
Cost of goods sold 1,739,357,228 1,673,470,689
25.1 Salaries, wages and benefits include Rs. 4.63 million (2015: Rs. 3.58 million) in respect of defined contribution plan.
Notes to the Consolidated Financial Statementsfor the year ended 30 June, 2016

135Annual Report 2016
2016 2015 Note Rupees Rupees
26 Administrative expenses
Salaries, wages and benefits 26.1 23,774,294 21,156,962 Directors’ remuneration 32,218,474 29,986,863 Traveling expenses 20,702,792 19,682,905 Legal and professional charges 4,053,272 5,899,922 Vehicle running expenses 3,910,154 3,353,783 Insurance 1,539,232 1,877,759 Repair and maintenance 1,882,803 1,724,570 Telephone and postage 3,040,037 2,902,724 Depreciation on property, plant and equipment 16.3 4,457,968 3,719,463 Amortization on intangibles 17.1 1,588,004 1,387,321 Printing and stationery 3,503,627 2,580,286 Staff training and development 5,038,766 4,888,570 Fee and subscription 1,862,118 1,221,688 Rent, rates and taxes 427,195 176,255 Entertainment 2,706,737 1,503,292 Donations 26.2 620,000 856,000 Auditors’ remuneration 26.3 890,000 825,000 Research and development 1,294,198 705,058 Miscellaneous expenses 3,557,515 3,196,414
117,067,186 107,644,835
26.1 Salaries, wages and benefits include Rs. 0.97 million (2015: Rs. 0.81 million) in respect of defined contribution plan.
26.2 None of Directors and their spouses had any interest in any of the donees.
2016 2015 Note Rupees Rupees
26.3 Auditors’ remuneration
Statutory audit fee including consolidation 550,000 500,000 Half yearly review 150,000 150,000 Subsidiary audit fee 50,000 50,000 Certifications – 50,000 CDC audit 75,000 – Out of pocket expenses 65,000 75,000
890,000 825,000 27 Selling and distribution expenses
Salaries and benefits 27.1 4,205,596 4,231,139 Depreciation on property, plant and equipment 16.3 4,456,001 3,717,234 Freight and forwarding 36,207,837 31,800,941 Advertisement 1,534,359 1,497,517 Sales promotion expenses 1,043,600 1,789,053
47,447,393 43,035,884
27.1 Salaries, wages and benefits include Rs. 0.15 million (2015: Rs. 0.19 million) in respect of defined contribution plan.

136 SPEL | Reliable No Matter What
2016 2015 Rupees Rupees
28 Other income
Income from financial assets
Profit on bank deposits - arrangements permissible under Shariah 32,024 – Profit on short term investments - interest / markup based arrangement from conventional windows of the banks 28,357,011 16,936,970 Gain on forex transactions-net-actual currency conversion 806,400 137,522 Income from non-financial assets
Sale of unusable items 13,319,434 10,635,269 Gain on disposal of property, plant and equipment 498,160 – Reversal of impairment loss on investment in associate – 277,828 Other income 608,671 2,486,480
14,426,265 13,399,577
43,621,700 30,474,069 29 Other charges
Workers’ Profit Participation Fund 21,151,351 15,331,647 Workers’ Welfare Fund 8,333,373 4,990,831 Loss on disposal of property, plant and equipment – 3,125,190
29,484,724 23,447,668 30 Finance cost
Mark-up on: – short term borrowings - secured 30,007,666 42,884,943 – long term finance - secured 2,668,541 5,553,023 – advance from customer – 52,850 – lease finance 4,602,899 9,100,866 Bank charges 1,163,451 1,438,884
38,442,557 59,030,566 31 Taxation
Current : – for the year 111,499 56,058,302 – prior year 405,394 – Deferred – for the year 37,358,453 2,753,516
37,875,346 58,811,818
Notes to the Consolidated Financial Statementsfor the year ended 30 June, 2016

137Annual Report 2016
2016 2015 Rupees Rupees
31.1 Relationship between tax expense and accounting profit Profit before taxation 393,558,557 290,613,855
Tax at 32% / 33% 125,938,738 95,902,572 Tax effect of: – income under Final Tax Regime (301,696) (1,497,710) – tax rate adjustment – (17,163,164) – change in proportion of local and export sales – 4,137,320 – permanent difference – 5,511,207 – tax credits (69,790,664) (29,128,764) – deferred tax asset not recognised 125,430 1,039,697 – minimum tax under section 113 of Income Tax Ordinance, 2001 935 10,660 – others (18,097,397) –
37,875,346 58,811,818 32 Cash generated from operations
Profit before taxation 393,558,557 290,613,855 Adjustments for non-cash items: Finance cost 38,439,289 59,030,566 Depreciation on property, plant and equipment 85,969,764 73,603,466 Amortization of intangibles 1,588,004 1,387,321 Reversal of impairment loss on investment in associate – (277,828) (Gain) / loss on disposal of property, plant and equipment (498,160) 3,125,190 Provision for Workers’ Profit Participation Fund and Workers’ Welfare Fund 29,484,724 20,322,478
154,983,621 157,191,193
Operating profit before working capital changes 548,542,178 447,805,048
(Increase) / decrease in current assets: Stores, spares and loose tools (1,363,616) (6,299,942) Stock-in-trade 5,146,510 (71,224,654) Trade debts (31,706,211) (64,223,735) Advances, deposits, prepayments and other receivables (36,305,258) (19,525,969)
(64,228,575) (161,274,300) Increase / (decrease) in current liabilities: Trade and other payables (8,492,595) 36,152,694
475,821,008 322,683,442
33 Cash and cash equivalents
Short term running finance 12 (50,270,026) (189,337,718) Cash and bank balances 23 51,195,343 37,975,190
925,317 (151,362,528)

138 SPEL | Reliable No Matter What
34 Related party transactions and balances
Related parties comprise of subsidiary Company, associated undertaking, key management personnel (including chief executive and directors), post employment benefit plan and entities in which the directors have significant influence. Details of transactions and balances with related parties is as follows:
2016 2015
Transactions Transactions
during the closing during the closing
Name of parties Nature of relationship Nature of transactions Note year balance year balance
Rupees
SPEL Technology Support Associated Company Purchase of goods – 201,250
(Private) Limited Reimbursement of
expenses – 1,196,268
Provident Fund Trust Post employment
benefit fund Contribution 12,182,892 9,883,386
Balance at year end 11 1,122,499 1,007,325
Directors Dividend - as shareholders 55,243,135 28,274,068
Key Management Personnel Remuneration 38 54,280,812 47,541,482
35 Financial risk management
The Group has exposure to the following risks from its use of financial instruments:
– Credit risk – Liquidity risk – Market risk
Risk Management Framework
The Board of Directors has the overall responsibility for establishment and oversight of risk management framework. The Board of Directors has developed a risk policy that sets out fundamentals of risk management framework. The risk policy focuses on unpredictability of financial markets, the Group’s exposure to risk of adverse effects thereof and objectives, policies and processes for measuring and managing such risks. The Group’s risk management policies are established to identify and analyze the risks faced by the Group, to set appropriate risk limits and controls, and to monitor risks and adherence to limits. Risk management policies and systems are reviewed regularly to reflect changes in market conditions and the Group’s activities.
The Group’s audit committee oversees how management monitors compliance with the Group’s risk management policies
and procedures and reviews the adequacy of the risk management framework in relation to the risks faced by the Group. Audit committee is assisted in its oversight role by internal audit department. Internal audit department undertakes both regular and ad hoc reviews of risk management controls and procedures, the results of which are reported to the audit committee.
The Group’s exposure to financial risks, the way these risks affect the financial position and performance, and forecast transactions of the Group and the manner in which such risks are managed as follows:
Notes to the Consolidated Financial Statementsfor the year ended 30 June, 2016

139Annual Report 2016
35.1 Credit risk
Credit risk is the risk of financial loss to the Group if a customer or counterparty to a financial instrument fails to meet its contractual obligations. To manage credit risk the Group maintains procedures covering the application for credit approvals, and monitoring of exposures against credit limits. As part of these processes the financial viability of all counterparties is regularly monitored and assessed.
35.1.1 Exposure to credit risk
The carrying amount of financial assets represents the maximum credit exposure. The maximum exposure to credit risk at the reporting period was as follows:
2016 2015
Note Rupees Rupees
Loans and receivables
Long term deposits 18 17,231,046 7,263,948 Trade debts 281,157,522 249,451,311 Deposits and other receivables 21 679,628 19,285,144 Short term investments 22 75,000,000 582,103,302 Bank balances 23 51,170,256 37,950,103
425,238,452 896,053,808 35.1.2 Concentration of credit risk
The Group identifies concentrations of credit risk by reference to type of counter party. Maximum exposure to credit risk by type of counterparty is as follows:
2016 2015
Rupees Rupees Customers 281,157,522 249,451,311 Banking companies and financial institutions 140,804,683 644,975,650 Others 3,276,247 1,626,847
425,238,452 896,053,808 35.1.3 Credit quality and impairment
Credit quality of financial assets is assessed by reference to external credit ratings, where available, or to historical information about counterparty default rates. All counterparties, with the exception of customers, have external credit ratings determined by various credit rating agencies. Credit quality of customers is assessed by reference to historical defaults rates and present ages.

140 SPEL | Reliable No Matter What
35.1.3(a) Counterparties with external credit ratings
These include banking companies and financial institutions, which are counterparties to term deposits, bank balances, security deposits, and accrued return on deposits. Credit risk is considered minimal as these counterparties have reasonably high credit ratings as determined by various credit rating agencies. Due to long standing business relationships with these counterparties and considering their strong financial standing, management does not expect non-performance by these counterparties on their obligations to the Group. Following are the credit ratings of counterparties with external credit ratings:
Rating
Short Long Rating 2016 2015 term term agency Rupees
Bank
Allied Bank Limited A1+ AA+ PACRA 4,029 611,719 Bank Islami Pakistan Limited A1 A+ PACRA 4,509,528 10,235,178 Habib Bank Limited A-1+ AAA JCR-VIS 379,422 891,452 Habib Metropolitan Bank Limited A1+ AA+ PACRA 2,397,446 19,684,197 KASB Bank Limited A3 BBB PACRA 16,118 8,153 MCB Bank Limited A1+ AAA PACRA 731,002 819,848 Meezan Bank Limited A-1+ AA JCR-VIS 32,282,990 338,042 National Bank of Pakistan A1+ AAA JCR-VIS 3,395,659 84,368 United Bank Limited A-1+ AA+ JCR-VIS 7,454,062 5,277,146
51,170,256 37,950,103
Security deposits
First National Bank Modaraba A1+ AAA JCR-VIS 249,400 964,262 MCB Bank Limited A1+ AAA PACRA 8,567,097 – Habib Bank Limited A-1+ AAA JCR-VIS 5,387,702 15,475,284
14,204,199 16,439,546
Short term investments
Habib Bank Limited A-1+ AAA JCR-VIS 75,000,000 580,500,000 First National Bank Modaraba A-1 A JCR-VIS – 1,603,302
75,000,000 582,103,302
Interest receivable
Habib Bank Limited A-1+ AAA JCR-VIS 430,228 8,482,699
140,804,683 644,975,650
35.1.3(b) Counterparties without external credit ratings
These include customers which are counter parties to trade receivables. The analysis of ages of trade receivables of the Group as at the reporting date is as follows:
Carrying amount
2016 2015 Rupees Rupees
The aging of trade debts at the reporting date is: Not due 206,144,081 189,278,799 Past due 0 - 30 days 64,467,374 51,485,303 Past due 31 - 60 days 7,574,825 4,298,679 Past due 61 - 90 days 1,018,861 1,346,503 Past due 91 - 120 days 1,655,009 702,639 Past due 120 days 297,372 2,339,388
281,157,522 249,451,311
Notes to the Consolidated Financial Statementsfor the year ended 30 June, 2016

141Annual Report 2016
Based on past experience the management believes that no impairment allowance is necessary in respect of trade debts past due as some receivables have been recovered subsequent to the year end and for other receivables there are reasonable grounds to believe that the amounts will be recovered in short course of time. As at year end, trade debts do not include any balance receivable from related parties (2015: nil).
35.2 Liquidity risk
Liquidity risk is the risk that the Group will encounter difficulty in meeting the obligations associated with its financial liabilities that are settled by delivering cash or another financial asset, or that such obligations will have to be settled in a manner unfavorable to the Group. Prudent liquidity risk management implies maintaining sufficient cash and marketable securities and availability of adequate funds through committed credit facilities. The Group’s approach to managing liquidity is to ensure, as far as possible, that it will always have sufficient liquidity to meet its liabilities when due, under both normal and stressed conditions. The Group finances its operations through equity, borrowings and working capital with a view to maintaining an appropriate mix between various sources of finance to minimize risk. The management aims to maintain flexibility in funding by keeping regular committed credit lines.
35.2.1 Exposure to liquidity risk
35.2.1(a) Contractual maturities of financial liabilities
The following are the remaining contractual maturities of financial liabilities at the reporting date. The cash flows are undiscounted, and include estimated interest payments.
2016
Carrying Contractual One year One to Three to
Note amount cash flow or less three year five year
Rupees
Non-derivative financial liabilities
Long term finances 8 65,580,251 70,453,889 44,911,911 25,541,978 –
Liabilities against assets subject
to finance lease 9 35,707,712 38,584,197 20,831,101 14,149,357 3,603,739
Trade and other payables 91,539,808 91,539,808 91,539,808 – –
Short term borrowings 12 251,844,351 251,844,351 251,844,351 – –
Accrued mark up 14 4,142,042 4,142,042 4,142,042 – –
448,814,164 456,564,287 413,269,213 39,691,335 3,603,739
2015
Carrying Contractual One year One to Three to
Note amount cash flow or less three year five year
Rupees
Non-derivative financial liabilities
Long term finances 8 82,447,697 87,401,500 22,960,292 64,441,208 –
Liabilities against assets subject
to finance lease 9 87,463,700 94,849,258 63,568,697 31,280,561 –
Trade and other payables 95,751,888 95,751,888 95,751,888 – –
Short term borrowings 12 380,450,601 380,450,601 380,450,601 – –
Accrued mark up 14 7,072,992 7,072,992 7,072,992 – –
653,186,878 665,526,239 569,804,470 95,721,769 –

142 SPEL | Reliable No Matter What
35.3 Market risk
Market risk is the risk that changes in market prices, such as foreign exchange rates, interest rates and equity prices will affect the Group’s income or the value of its holdings of financial instruments. The objective of market risk management is to manage and control market risk exposures within acceptable parameters, while optimizing the return.
35.3.1 Currency risk
The Group is exposed to currency risk to the extent that there is a mismatch between the currencies in which sales purchases and bank balances are denominated and the respective functional currency of the Group. The functional currency of the Group is Pak Rupee. The currencies in which these transactions are primarily denominated are Euro and US dollars.
35.3.1(a) Exposure to currency risk
The summary quantitative data about the Group’s exposure to currency risk as reported to the management of the Group is as follows:
2016
EURO USD Total (Rupees) Assets
Trade debts 9,458 – 1,097,834 Bank balances – 2,074 216,770
9,458 2,074 1,314,604 Liabilities
Trade and other payables – – –
Net assets exposure 9,458 2,074 1,314,604 2015
EURO USD Total (Rupees)
Assets
Trade debts 8,979 – 1,019,779 Bank balances – 5,243 532,119
8,979 5,243 1,551,898 Liabilities
Trade and other payables – – –
Net assets exposure 8,979 5,243 1,551,898
Notes to the Consolidated Financial Statementsfor the year ended 30 June, 2016

143Annual Report 2016
35.3.1(b) Exchange rates applied during the year
The following significant exchange rates have been applied during the year: EURO USD
2016 2015 2016 2015 Rupees Rupees Reporting date spot rate – buying 116.08 113.57 104.50 101.50 – selling 116.31 113.70 104.70 101.70 Average rate for the year 114.92 124.02 103.10 100.03
35.3.1(c) Sensitivity analysis
A reasonably possible strengthening / (weakening) of 10% in Pak Rupee against the following currencies would have affected the measurement of financial instruments denominated in foreign currency and affected equity and profit or loss by the amounts shown below. The analysis assumes that all other variables, in particular interest rates, remain constant and ignores any impact of forecast sales and purchases.
2016 2015
Rupees Rupees Effect on profit and loss
EURO 109,783 101,978 USD 21,677 53,212
131,460 155,190 35.3.1(d) Currency risk management
Since the maximum amount exposed to currency risk is only 0.306% (2015: 0.174%) of the Group’s financial assets, any adverse / favorable movement in functional currency with respect to US dollar and Euro will not have any material impact on the operational results.
35.3.2 Interest rate risk
Interest rate risk is the risk that fair values or future cash flows of a financial instrument will fluctuate because of changes in interest rates. Sensitivity to interest rate risk arises from mismatch of financial assets and financial liabilities that mature or re-price in a given period.
35.3.2(a) Interest / mark-up bearing financial instruments
The effective interest / mark-up rates for interest / mark-up bearing financial instruments are mentioned in relevant notes to the consolidated financial statements. The Group’s interest / mark-up bearing financial instruments as at the reporting date are as follows:
2016 2015
Financial Financial Financial Financialasset liability asset liability
Rupees Rupees
Non-derivative financial instruments
Fixed rate instruments 78,824,790 49,504,723 582,562,893 48,300,329 Variable rate instruments – 303,627,591 – 502,061,669

144 SPEL | Reliable No Matter What
Fair value sensitivity analysis for fixed rate instruments
The Group does not account for any fixed rate financial assets and liabilities at fair value through profit and loss account. Therefore, a change in profit / mark-up / interest rates at the reporting date would not affect profit and loss account.
35.3.2(b) Cash flow sensitivity analysis for variable rate instruments
A reasonably possible change of 100 basis points in interest rates at the reporting date would have increased / (decreased) equity and profit by amounts shown below. The analysis assumes that all other variables, in particular foreign exchange rates, remain constant.
Profit
2016 2015 Rupees Rupees
Increase of 100 basis points (3,036,276) (5,020,617)
Decrease of 100 basis points 3,036,276 5,020,617 35.3.2(c) Interest rate risk management
The Group manages these mismatches through risk management strategies where significant changes in gap position can be adjusted. The short term borrowing, finance lease and loans and advances by the Group has variable rate pricing that is mostly dependent on Karachi Inter Bank Offer Rate (“KIBOR”) as indicated in respective notes.
35.3.3 Other price risk
Price risk represents the risk that the fair value or future cash flows of financial instrument will fluctuate because of changes in market prices (other than those arising from interest rate risk or currency risk) whether those changes are caused by factors specific to the individual financial instrument or its issuer, or factors affecting all similar financial instruments traded in market. The Group is not exposed to commodity price risk since it has a diverse portfolio of commodity suppliers.
The Group is not exposed to equity price risk. 35.4 Fair values
35.4.1 Fair value estimation
All financial assets and financial liabilities are initially recognised at the fair value of consideration paid or received, net of transaction costs as appropriate, and subsequently carried at fair value or amortized cost. Carrying value of all financial instruments approximate their carrying value.
Fair values have been determined for measurement and / or disclosure purposes based on the following methods. Non-derivative financial instrument
The fair value of non-derivative financial asset is estimated as the present value of future cash flows, discounted at the market rate of interest at the reporting date. This fair value is determined for disclosure purposes.
Non-Derivative financial liabilities
Fair value, which is determine for disclosures purposes, is calculated based on the present value of future principal and interest cash flows, discounted at market rate of interest at the reporting date.
Notes to the Consolidated Financial Statementsfor the year ended 30 June, 2016

145Annual Report 2016
35.5 Financial instruments-fair values
The additional disclosures due to the adoption of IFRS 13 Fair value measurement are as follows:
Carrying Amount Fair Value
Loans and Other
receivables financial Total Level 1 Level 2 Level 3
Note Rupees
On-Balance sheet financial instruments
30 June 2016
Financial assets measured at fair value – – – – – –
– – – – – –
Financial assets not measured at fair value
Cash and bank balances 51,195,343 – 51,195,343 – – –
Deposits and other receivables 679,628 – 679,628 – – –
Long term deposits 17,231,046 – 17,231,046 – – –
Trade debts - unsecured, considered good 281,157,522 – 281,157,522 – – –
Short term investments 75,000,000 – 75,000,000 – – –
35.6 425,263,539 – 425,263,539 – – –
Financial liabilities measured at fair value – – – – – –
– – – – – –
Financial liabilities not measured at fair value
Long term finances and diminishing musharika – 65,580,251 65,580,251 – – –
Liabilities against assets subject
to finance lease – 35,707,712 35,707,712 – – –
Trade and other payables – 91,539,808 91,539,808 – – –
Short term borrowings – 251,844,351 251,844,351 – – –
Accrued mark up – 4,142,042 4,142,042 – – –
35.6 – 448,814,164 448,814,164 – – –
35.6 The Group has not disclosed the fair values of these financial assets and liabilities as these are for short term or reprice over short term. Therefore, their carrying amounts are reasonable approximation of fair value.
Land has been carried at revalued amounts determined by professional valuers (level 3 measurement) based on their assessment of the market values as disclosed in note 7. The valuations are conducted by the valuation experts appointed by the Group. The valuation experts used a market based approach to arrive at the fair value of the Group’s land. The effect of changes in the unobservable inputs used in the valuation can not be determined with certainty, accordingly a qualitative disclosure of sensitivity has not been presented in these consolidated financial statements.
36 Capital management
The Board’s policy is to maintain an efficient capital base so as to maintain investor, creditor and market confidence and to sustain the future development of its business. The Board of Directors monitors the return on capital employed, which the Group defines as operating income divided by total capital employed. The Board of Directors also monitors the level of dividends to ordinary shareholders.

146 SPEL | Reliable No Matter What
The Group’s objectives when managing capital are:
i. to safeguard the entity’s ability to continue as a going concern, so that it can continue to provide returns for shareholders and benefits for other stakeholders, and
ii. to provide an adequate return to shareholders.
The Group manages the capital structure in the context of economic conditions and the risk characteristics of the underlying assets. In order to maintain or adjust the capital structure, the Group may adjust the amount of dividends paid to shareholders, issue new shares, or sell assets to reduce debt.
There were no changes in the Group’s approach to capital management during the year. The Group is not subject to
externally imposed capital requirements.
2016 2015 Rupees Rupees
37 Restriction on title and assets pledged as security against long and short term borrowings
Mortgages and charges
Hypothecation charge over plant and machinery 806,260,000 673,670,000 Hypothecation over current assets 684,340,000 551,010,000
38 Remuneration of chief executive, directors and executives
The aggregate amount charged in the financial statements for the year in respect of remuneration, including all benefits to the Chief Executive, Directors and Executives of the Group is as follows:
2016
Directors
Chairman Chief Non- Executive Executives
executive executive
Rupees
Managerial remuneration 5,600,000 5,600,000 – 3,457,200 10,446,955
Utilities and house rent 2,800,000 2,800,000 – 1,702,800 5,225,045
Contribution to provident fund – – – 344,017 1,025,102
Bonus and rewards – – – 3,220,000 5,365,236
Meeting fee – – 875,000 – –
Advisory fee – – 5,400,000 – –
Other benefits 169,957 109,654 53,666 86,180 –
8,569,957 8,509,654 6,328,666 8,810,197 22,062,338
Number of persons 1 1 3 1 8
Notes to the Consolidated Financial Statementsfor the year ended 30 June, 2016

147Annual Report 2016
2015
Directors
Chairman Chief Non- Executive Executives
executive executive
Rupees
Managerial remuneration 5,600,000 5,600,000 – 3,200,000 8,720,400
Utilities and house rent 2,800,000 2,800,000 – 1,600,000 4,299,600
Contribution to provident fund – – – 319,968 847,919
Bonus and rewards – – – 1,500,000 3,686,700
Advisory fee – – 5,400,000 – –
Other benefits 396,780 319,527 450,588 – –
8,796,780 8,719,527 5,850,588 6,619,968 17,554,619
Number of persons 1 1 1 1 7
38.1 The Group also provides the chief executive and some of the directors and executives the Group’s maintained cars.
38.2 Meeting fee was paid to non executive directors during the year amounting to Rs. 875,000 (2015: Nil.)
39 Plant capacity and actual production
Installed processing capacity Actual processing
2016 2015 2016 2015
Small, medium and large
mould making facility 60 to 70 moulds 60 to 70 moulds 43 moulds 48 to 50 moulds
Injection mould facility 3,300 tons plastic 3,100 tons plastic 1,727 tons of plastic 1,516 tons of plastic
Blow moulding facility 2,560 tons plastic 1,680 tons plastic 1,609 tons plastic 1,112 tons plastic
Extrusion 5,700 tons plastic 5,400 tons plastic 2,301 tons plastic 2,000 tons plastic
Thermoforming 2,200 tons plastic 1,700 tons plastic 1024 tons plastic 966 tons plastic
Lower capacity utilization of plant is due to gap between demand and supply of products. The capacity figures are based on 300 days.
40 Provident Fund Trust
The following information is based on financial statements of Provident Fund Trust.
Un-audited AuditedUnit 2016 2015
Size of the fund - total assets Rupees 35,508,944 31,233,815
Cost of investments made Rupees 33,124,766 27,294,976
Percentage of investments made Percentage 93.29% 87.39%
Fair value of investments Rupees 33,124,766 27,294,976

148 SPEL | Reliable No Matter What
The breakup of fair value of investments is as follows:
2016 2015
Rupees Percentage Rupees Percentage
Defence Saving Certificates 4,977,932 15.03% 4,775,367 17.50% Bank balances 1,146,834 3.46% 1,519,609 5.60% Certificate of musharika 27,000,000 81.51% 21,000,000 76.90%
33,124,766 100.00% 27,294,976 100.00%
40.1 The provident fund trust is a common fund for employees of the Group. Entity wise break up of the fund as on 30 June is as follows:
(Un-audited) 30 June 2016 (Audited) 30 June 2015
% of total fund Rupees % of total fund Rupees
Synthetic Products Enterprises Limited 98.69% 35,045,161 98.12% 30,646,619
SPEL Pharmatec (Private) Limited 0% – 1.49% 465,384
SPEL Technology Support Limited 1.31% 463,783 0.39% 121,812
The investments out of provident fund have been made in accordance with the provision of Section 227 of the Companies Ordinance, 1984 and the rules formulated for this purpose.
41 Number of employees
The Group has employed following number of persons including permanent and contractual staff:
Number of Employees
2016 2015
– Average number of employees 463 467
– As at 30 June 444 449 42 Non adjusting events after the balance sheet date
The Board of Directors of the Group in its meeting held on 26 July 2016 has proposed a final cash dividend of Rs. 1.0 (2015: Rs.0.5) per share, for the year ended 30 June 2016, for approval of the members in the Annual General Meeting to be held on 21 September 2016.
43 Date of authorization for issue
These consolidated financial statements were authorized for issue by the Board of Directors of the Group in its meeting held on 26 July 2016.
44 General
Figures have been rounded off to the nearest rupee.
Lahore Chief Executive Director
Notes to the Consolidated Financial Statementsfor the year ended 30 June, 2016

149Annual Report 2016
Pattern of ShareholdingAs on 30 June, 2016
Shareholding
Total No. ofNo. of Shareholders From To Shares held Percentage
98 1 100 1,355 0.00181455 101 500 724,914 0.9372273 501 1000 270,852 0.3502241 1001 5000 659,537 0.852760 5001 10000 489,700 0.633126 10001 15000 345,500 0.446715 15001 20000 273,000 0.352911 20001 25000 253,600 0.32796 25001 30000 173,180 0.22399 30001 35000 301,500 0.38981 35001 40000 36,000 0.04653 40001 45000 128,500 0.16616 45001 50000 291,093 0.37631 50001 55000 51,150 0.06611 55001 60000 56,500 0.07301 60001 65000 63,000 0.08142 70001 75000 150,000 0.19391 80001 85000 83,000 0.10731 85001 90000 90,000 0.11645 95001 100000 495,000 0.63992 140001 145000 285,000 0.36851 150001 155000 155,000 0.20041 185001 190000 186,000 0.24051 220001 225000 223,000 0.28832 245001 250000 496,500 0.64191 250001 255000 255,000 0.32972 295001 300000 600,000 0.77571 300001 305000 304,500 0.39371 355001 360000 359,648 0.46501 385001 390000 390,000 0.50421 420001 425000 423,000 0.54691 430001 435000 430,500 0.55661 495001 500000 500,000 0.64641 515001 520000 519,000 0.67101 615001 620000 620,000 0.80161 725001 730000 727,500 0.94051 845001 850000 846,669 1.09461 995001 1000000 1,000,000 1.29281 1030001 1035000 1,032,000 1.33421 1335001 1340000 1,339,500 1.73171 1395001 1400000 1,395,200 1.80371 1450001 1455000 1,451,250 1.87621 1465001 1470000 1,467,365 1.89701 2530001 2535000 2,533,500 3.27541 4570001 4575000 4,572,818 5.91192 10025001 10030000 20,050,724 25.92211 30245001 30250000 30,248,945 39.1066
2247 77,350,000 100.0000

150 SPEL | Reliable No Matter What
Pattern of Shareholding as per Code of Corporate Governance 2012As on 30 June, 2016
Particulars Shareholding
Associated Companies, Undertakings and Related Parties NIL
Sponsors, Directors, CEO and Children
Mr. Almas Hyder 30,248,945 Mr. Zia Hyder Naqi 10,025,362 Mr. Raza Haider Naqi 10,025,362 Dr. S. M. Naqi 4,572,818 Mrs. Munawar Naqi 2,467,365 Mr. Sheikh Naseer Hyder 359,648 Mr. Abid Saleem Khan 2,500 Dr. Syed Salman Ali Shah 1,000 Mr. Khawar Anwar Khawaja 500 Mr. Muhammad Tabassum Munir 500 Mutual Funds
CDC - Trustee Unit Trust Of Pakistan 1,339,500 MCBFSL - Trustee JS Value Fund 1,032,000 MC FSL - Trustee JS Growth Fund 727,500 CDC - Trustee NAFA Islamic Active Allocation Equity Fund 304,500 CDC - Trustee NIT-Equity Market Opportunity Fund 255,000 CDC - Trustee NAFA Islamic Stock Fund 246,500 CDC-Trustee JS Islamic Pension Savings Fund-Equity Account 186,000 CDC - Trustee NAFA Pension Fund Equity Sub-Fund Account 98,000 CDC - Trustee NAFA Islamic Pension Fund Equity Account 97,000 MCBFSL - Trustee Pak Oman Advantage Asset Allocation Fund 35,000 MCBFSL - Trustee Pak Oman Islamic Asset Allocation Fund 30,000 Executives 47,680 Public Sector Companies And Corporations NIL
Banks, Development Finance Institutions, NBFCs, Insurance
companies, Takaful and Modarabas 4,230,700
Shareholders Holding Five Percent or More Voting Rights
Mr. Almas Hyder 30,248,945 Mr. Zia Hyder Naqi 10,025,362 Mr. Raza Haider Naqi 10,025,362 Dr. S. M. Naqi 4,572,818

151Annual Report 2016
Sr. No Particulars No. Folio No. of Shares Percentage
1 Sponsors, Directors, CEO And Children 11 57,704,000 74.60122 NIT And ICP 1 223,000 0.28833 Banks, DFI and NBFI 1 300,000 0.38784 Insurance Companies 2 3,928,700 5.07915 Modarabas and Mututal Funds 12 4,353,000 5.62776 General Public (Local) 2155 8,122,414 10.50097 General Public (Foreign) 42 913,385 1.18088 Others 23 1,805,501 2.3342
Total 2247 77,350,000 100.00
Trading by Directors, Executives, their Spouses and Minor ChildrenSr. No. Name of Shareholder Gifted Gift Acquired Sale Purchase
1 Dr. S. M. Naqi 13,300,000 – – – 2 Mr. Almas Hyder – 4,000,000 – – 3 Mr. Zia Hyder Naqi – 4,000,000 – – 4 Mr. Raza Haider Naqi – 4,000,000 – – 5 Mrs. Munawar Naqi – 1,000,000 – – 6 Mr. Abid Saleem Khan – – 13,000 – 7 Mr. Khalil Ahmad Hashmi – – – 2,500 8 Mr. Abu Bakar – – 1,500 – 9 Mr. Harris Islam – – 1,500 –
Category wise Shareholding

152 SPEL | Reliable No Matter What
Notice of Annual General Meetingfor the year ended 30 June, 2016
Notice is hereby given that the Thirty Forth Annual General Meeting of the shareholders of Synthetic Products Enterprises Limited will be held on Wednesday 21 September 2016 at 3:30 PM at Jinnah Auditorium of Lahore Chamber of Commerce & Industries, Shahrah Aiwan-e-Tijarat, Lahore to transact the following business:
Ordinary Business:
1. To confirm the minutes of the Last Extra Ordinary General Meeting held on 17 December 2015;
2. To receive, consider and adopt the audited financial statements including consolidated financial statements for the year ended 30 June 2016 together with Directors’ and Auditors’ Report thereon;
3. To approve the payment of cash dividend @ 10% i.e. Re 1.00 per ordinary share, out of the reserves for the year ended 30 June 2016, as recommended by the Directors;
4. To appoint auditors for the year ended 2016-17 and fix their remuneration. The Board, has recommended, as suggested by the board audit committee, the appointment of M/s KPMG Taseer Hadi and Co., Chartered Accountants, the retiring auditors and being eligible offer themselves for re-appointment.
By the Order of the Board
30 August 2016 Khalil Ahmad Hashmi, FCALahore Company Secretary

153Annual Report 2016
Notice of Annual General Meetingfor the year ended 30 June, 2016
Notes:
1. The share transfer books of the Company will remain closed from September 15, 2016 to September 21, 2016 (both days inclusive). Transfers received in order at the Shares Department of M/s THK Associates (Pvt.) Limited, 2nd Floor, State Life Building No. 3, Dr. Ziauddin Ahmed Road, P. O. Box No. 8533, Karachi-75530, Pakistan at the close of business on September 14, 2016 will be treated in time for the purpose of payment of final cash dividend, if approved by the shareholders.
2. A member entitled to attend and vote at the meeting is entitled to appoint any other member as his/her proxy to attend and vote. Proxies in order to be effective must be received at the Registered Office of the Company, 127-S Quaid-e-Azam Industrial Estate Township Kot Lakhpat, Lahore duly stamped and signed not less than 48 hours before the time of the meeting. A proxy need not be a member of the Company. The proxy shall produce his/her original CNIC or passport at the time of the meeting.
3. An individual beneficial owner of shares, keeping shares in the Central Depository Company, entitled to vote at this meeting must bring his/her CNIC along with the participant ID numbers and sub account numbers with him/her to prove his/her identity and in case of proxy must enclose and attested copy of his/her CNIC. Representatives of corporate members should bring the usual documents required for such purposes.
4. Pursuant to SECP Circular No 10 dated May 21, 2014, if the Company receives consent from members holding in aggregate 10% or more shareholding residing at geographical location, to participate in the meeting through video conference at least 10 days prior to the date of meeting, the Company will arrange video conference facility in that city subject to availability of such facility in that city.
Payment of Cash Dividend Electronically
5. In accordance with SECP’s letter no. 8(4) SM/CDC 2008 dated 5th April 2013, we would like to apprise the shareholders that SECP has devised a strategy for implementation and promotion of e-dividend mechanism whereby the cash dividend amount would be directly credited into the respective bank account of the shareholder through electronic fund transfer facilities.
6. The shareholders can avail benefits of the e-dividend facility by providing dividend mandate in their CDC accounts through their Participants and in case of physical shares to the share registrar.
Withholding Tax on Dividend
7. As per requirements of Income Tax Ordinance, 2001, Income tax @ 12.5% will be withheld in case of filers and @ 20% in case of non-filers of tax returns, the shareholders are advised to make sure that their names are entered into the list of Active Tax Payers before the date of book closure of cash dividend, to avoid higher rate of tax deduction.
8. All shareholders who hold shares jointly are requested to provide shareholding proportions of principal shareholder and joint shareholder(s) in respect of shares held by them to our shares registrar, before the date of book closure, in wiring as follows:
Kindly note that in case of non-receipt of the information then each Account Holder will be assumed to hold equal proportion of shares and the deduction will be made accordingly.
9. Shareholders claiming tax exemption under clause 47(B) of Part IV of the Second Schedule of Income Tax Ordinance, 2001 are requested to provide valid exemption certificate under section 159(1) of the Income Tax Ordinance, 2001, or copy of stay order, if any, before the date of book closure, to our Share Registrar as required vide FBR clarification letter No. 1(43) DG (WHT)/2008 - Vol. II-66417-R dated 12 May 2015. In case of non-submission of the requisite documents, deduction of tax under relevant sections shall be made as per requirements of law.
Electronic Transmission of Audited Financial Statements and Notices
10. Through SRO 787 (1)/2014 dated 8th September 2015 the Securities and Exchange Commission of Pakistan has permitted companies to circulate their annual audited financial statements and notice of annual general meetings through e-mail to its shareholders. Those shareholders who wish to receive the Company’s Annual Report through e-mail are requested to provide a duly completed Consent Form. The forms are available on the Company’s website. “www.spelgroup.com.”
Name of Principal Shareholder/Joint Holders
Shareholding Proportion CNIC No.(copy attached) Signature

154 SPEL | Reliable No Matter What
Glossary of Terms
AGM: Annual General Meeting to be held as per requirement of law.
SPEL: Synthetic Products Enterprises Limited
HS&E: Health, Safety and Environment.
EBITDA: Earnings before Interest, Taxes, Depreciation and Amortization.
Return on Equity (ROE): The value found by dividing the Company’s net income by its net assets.
Current Ratio: The current ratio indicates a company’s ability to meet short-term debt obligations.
Acid Test Ratio: The ratio of liquid assets to current liabilities.
Operating Cycle: The average time between purchasing or acquiring inventory and receiving cash proceeds from its sale.
Earnings Per Share: Earnings arrived at by dividing the net income of the Company by the number of shares of common outstanding shares.
Price-Earnings Ratio (P/E): The ratio arrived at by dividing market price per share by earnings per share (This ratio indicates what investors think of the firm’s earnings’ growth and risk prospects).
Dividend Payout Ratio: The ratio arrived at by dividing the annual dividends per share by the annual earnings per share.
Debt-to-Equity Ratio: The ratio arrived at by dividing total debt by the equity (all assets minus debts) held in stock.
IASB: International Accounting Standards Board.
IFRS: International Financial Reporting Standard.
Amortisation: To charge a regular portion of an expenditure over a fixed period of time.
KIBOR: Karachi Inter Bank Offer Rate.
Spread: Rate charged by the bank over KIBOR.
Gearing Ratio: Compares some form of owner’s equity (or capital) to borrow funds.
Security: A pledge made to secure the performance of a contract or the fulfillment of an obligation.
Principal: In commercial law, the principal is the amount that is received, in the case of a loan, or the amount from which flows the interest.
Debt: An amount owed for funds borrowed.
Debt Service: Amount of payment due regularly to meet a debt agreement; usually a monthly, quarterly or annual obligation.
Net Working Capital: Current assets minus current liabilities.
Company: Synthetic Products Enterprises Limited
WPPF: Workers’ Profit Participation Fund
WWF: Workers’ Welfare Fund


