reliability demonstration test - pvqat
TRANSCRIPT

[email protected] - www.PVEL.com
Reliability Demonstration Test
Jenya Meydbray, [email protected]
415.335.9710
1

[email protected] - www.PVEL.com
Overview
For companies developing PV products and projects, PVEL is the premier solar panel performance and reliability testing lab.
We provide secure, expert testing and validation services so you can be confident that you're making intelligent decisions based on the most reliable data.
2

[email protected] - www.PVEL.com
Capabilities
We specialize in 3rd party performance and reliability reports for Bankability, R&D, and manufacturing.
State-of-the-Art indoor lab facilities in Berkeley
Outdoor Research Center in Davis called PV-USA
3

[email protected] - www.PVEL.com
Why do we need testing?
TechnicalSolar panels deployed today will be under warranty in 2035• Your unborn children will be graduated from college
What Range Target
Initial Light Soak +5% to -5% max power +5% to -1%
Annual Degradation 0 to over -5% max power 0 to -0.5%
Catastrophic Failures (recalls/fires) 0 to 100% minimal

[email protected] - www.PVEL.com
Why do we need testing?
CommercialProject finance and insurance providers are risk averse• > 600 active PV module manufacturers (many more launching soon)• Module quality control in project dev is not widely adopted yet• Panel degradation and system downtime significantly impact LCOE

[email protected] - www.PVEL.com
RDT Development Strategy
Compile List of Failure
Modes Seen in the Field
Identify Stress Tests
that stimulate failures
Identify Techniques
to Characterize
Failures
Draft Test Plan Based
on Extensive Team
Experience
6

[email protected] - www.PVEL.com
Reliability Demonstration Test Development TeamWho Organization Experience
David King PV Evolution Labs 35 years of working in PV reliability and testing
Jenya Meydbray PV Evolution LabsPVEL CEO, developed and developed and executedSunPower’s solar panel supply quality strategy
Jennifer Granata Sandia Nat’l LabsHead of Sandia PV Test, Evaluation, and Characterization Technologies
Michael Quintana Sandia Nat’l LabsHead of Sandia PV Systems Reliability, manufacturing, and Diagnostics
John Wohlgemuth NRELOver 35 years in PV reliability and testing, chair of TC82 WG2
Joseph Del Cueto NRELOver 25 years in PV technology development, NREL senior scientist
Ralph Romero Black & VeatchOver 20 years in the industry, Leads of B&V bankability team
Derek Djeu Black & VeatchLead IE engagements for lenders and project finance of utility-scale solar PV
7

[email protected] - www.PVEL.com
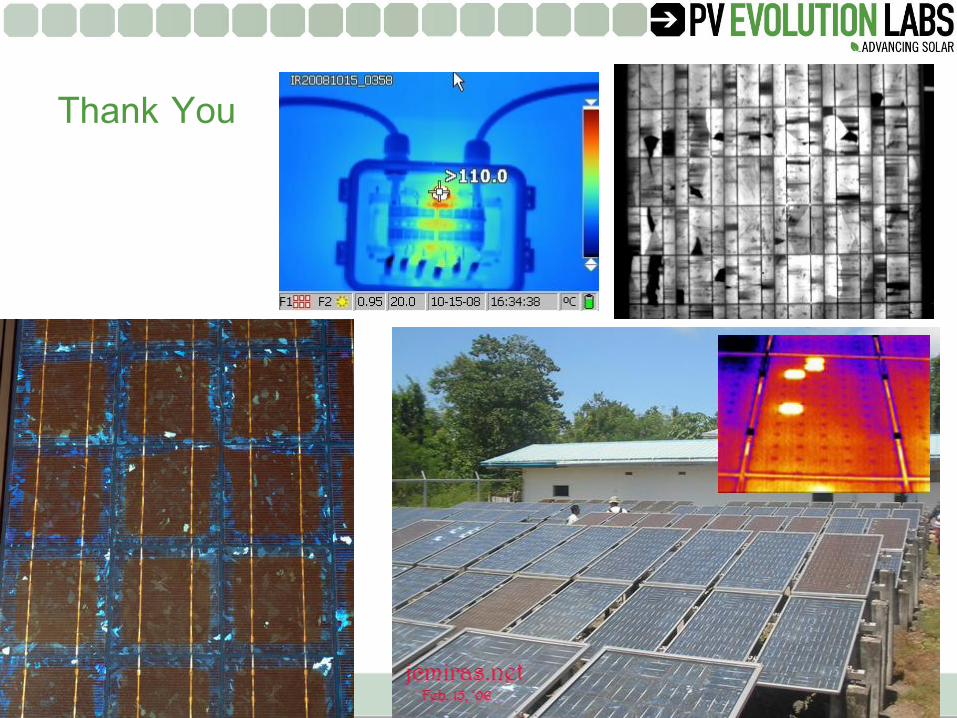
Common PV Module Failure Modes (no particular order)
Quick connector reliability (embrittlement, moisture ingress)
Cell/busbar arc to frame
Junction box failure (poor solder joints, arcing, etc.) Light-induced cell degradation (LID)
Glass fractureOutgassing of in-laminate materials (Chemical incompatibilities)
Bypass diode failureBacksheet embrittlement leading to exposed conductor
Cracked cells (soldering processes, strain, etc.)Busbar sharp edges, solder peaks, cutting through backsheet leading to exposed conductor
Solder joint degradationElectrochemical corrosion of busbars or cell metallization
Reduced adhesion leading delamination Polarization (charge build-up at interfaces)
Optical degradation of encapsulantIon migration from glass to cell surface creating leakage paths, ground faults
8

[email protected] - www.PVEL.com
Correlation of Failures To Stress & Characterization(partial list)
FAILURE MECHANISM STRESS CHARACTERIZATION
Cracked cells TC, Load EL, LIV
Reduced adhesion leading to corrosion and/ or delamination
DH, HF, UV Visual, wet hipot, LIV
Light-induced cell degradation Sun Soak LIV
Delamination / Outgassing of in-laminate materials (Chemical incompatibilities) DH, HF Wet Hipot, Visual, UV-Vis
Polarization (charge build-up at interfaces) LT V Bias EL, LIV
9
“…it would be counterproductive to require a test that doesn’t correlate with field experience”, Sarah Kurtz, NREL

[email protected] - www.PVEL.com
Test Plan
Objective: Comprehensive assessment of all failure modesTest Duration: 5 Months
Module Characterization1. Visual Inspection2. Light IV3. Dark IV4. Wet Hipot at 1kV5. EL Image6. IR Image
[email protected] - www.PVEL.com
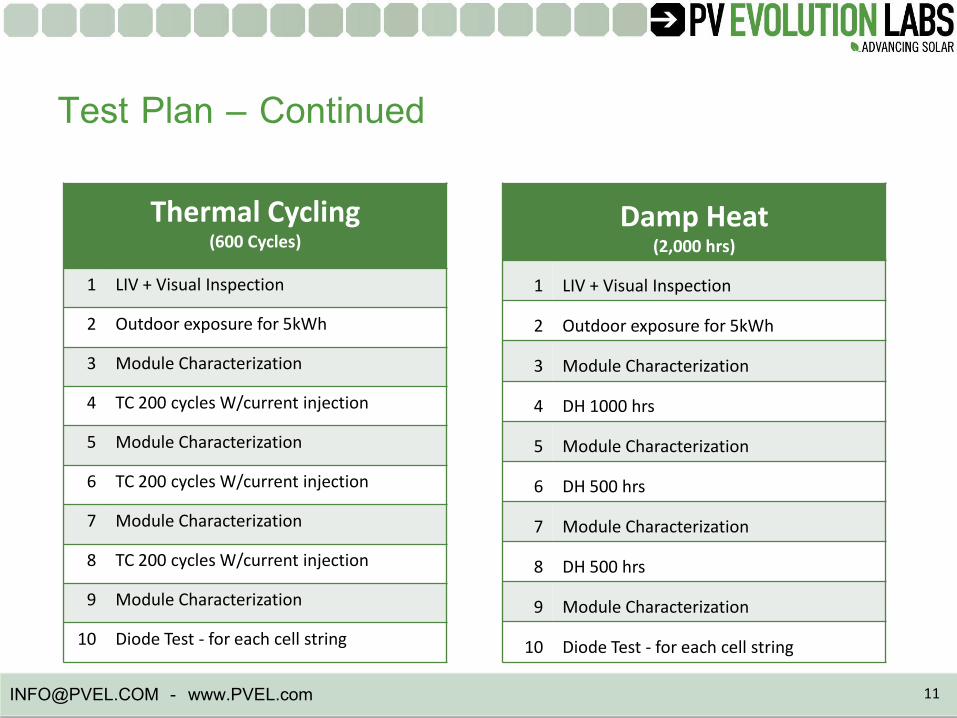
Test Plan – Continued
Thermal Cycling(600 Cycles)
1 LIV + Visual Inspection
2 Outdoor exposure for 5kWh
3 Module Characterization
4 TC 200 cycles W/current injection
5 Module Characterization
6 TC 200 cycles W/current injection
7 Module Characterization
8 TC 200 cycles W/current injection
9 Module Characterization
10 Diode Test - for each cell string
Damp Heat(2,000 hrs)
1 LIV + Visual Inspection
2 Outdoor exposure for 5kWh
3 Module Characterization
4 DH 1000 hrs
5 Module Characterization
6 DH 500 hrs
7 Module Characterization
8 DH 500 hrs
9 Module Characterization
10 Diode Test - for each cell string
11

[email protected] - www.PVEL.com
Test Plan – Continued
Humidity Freeze(30 cycles)
1 LIV + Visual Inspection
2 Outdoor exposure for 5kWh
3 Module Characterization
4 HF 10 cycles
5 Module Characterization
6 HF 10 cycles
7 Module Characterization
8 HF 10 cycles
9 Module Characterization
10 Diode Test
11 Static Mechanical Load
UV(125 kWh at 90C)
1 LIV + Visual Inspection
2 Outdoor exposure for 5kWh
3 LIV + Visual Inspection
4 UV 125 kWh with Imp injected
5 Module Characterization
6 Diode Test
12

[email protected] - www.PVEL.com
Test Plan – Continued
Mechanical
1 LIV + Visual Inspection
2 Outdoor exposure for 5kWh
3 Module Characterization
4 1,000 mechanical load cycles
5 Module Characterization
6 TC 50 cycles
7 Module Characterization
8 HF 10 cycles
9 Module Characterization
10 Diode Test
Electrical - 11 LIV + Visual Inspection
2 Outdoor exposure for 5kWh
3 Hot Spot Test
4 LIV + Visual Inspection
5 EL Image
6 IR Image
7 + 1kV bias 1000 hrs (40C, < 50% RH)
8 LIV + Visual Inspection
9 EL Image
10 IR Image
11 Hot Spot Test
12 Bypass Diode Thermal Test
13 Diode Test
13

[email protected] - www.PVEL.com
Test Plan – Continued
Electrical - 21 LIV + Visual Inspection
2 Outdoor exposure for 5kWh
3 Hot Spot Test
4 LIV + Visual Inspection
5 EL Image
6 IR Image
7 - 1kV bias 1000 hrs (40C, < 50% RH)
8 LIV + Visual Inspection
9 EL Image
10 IR Image
11 Hot Spot Test
12 Bypass Diode Thermal Test
13 Diode Test
Control1 Outdoor exposure for 5kWh
LIV when testing modules under stress test
Store in dark with leads shorted when between tests
Following tests to be performed at the end
2 LIV + Visual Inspection
3 EL Image
4 Wet Hipot at 1kV
5 IR Image
14

[email protected] - www.PVEL.com
Things To Be Careful Of
What PVEL Capabilities
Spectral MismatchTester 2 times better than Class A spectrum(recently certified Class A+A+A+)
Light UniformityBetter than 0.3% across panel (10 times better than Class A)
Current Injection for EL, IR, TC Computer controlled custom system
Sample temperature UniformityUnique laminar air flow chambers (top to bottom air flow)
UV spectrum and intensity Spectroradiometer characterization
Point loading in Mechanical Testing Patented bladder based dynamic load tester
15