reliability assessment of rukhia gas turbine power plant...
TRANSCRIPT
International Journal of Current Engineering and Technology, Vol.2, No.1 (March 2012) ISSN 2277 - 4106
184
Research Article
Reliability Assessment of Rukhia Gas Turbine Power Plant in Tripura
Asis Sarkara*
, Dhiren Kumar Beherab, Suresh Kumar
c ,Manoj Singha
c
a Department of Mechanical Engineering, National Institute of Technology, Agarthala-799 001, India
bDepartment of Mechanical Engineering, I.G.I.T., Sarang, Odisha–759146, India c Department of Production Engineering, Jadavpur University, Kolkata-70000326India
Accepted 12 Feb 2012, Available online1 March. 2012
Abstract
The reliability indicators of the GTPPS were analyzed based on a five and half -year failure database. Such reliability
indicators like failure rate (l), repair rate (μ ) and mean time to repair (z ) have been estimated. The analyses showed
that gas turbine unit (GT4 and GT5) has maximum failure rate ( max F ) of once in 100 h in 2005 with system
availability (Y ) of 0. 0.4950 and 0.977 and minimum failure rate ( min 1.256 ) of once in 1000 h in 2005 with Y of 0.983.
GT1 has maximum mean time to repair ( max z ) of 8.091 h in 2005 with Y of 0.98 and minimum mean time to repair
( min z ) of 1.75h in 2006 with Y of 0.99. For the period under study, GT1 has min Y of 0.98 in the year 2005 and max Y
of 0.99 in 2005. The minimum availability (0.299 and 0.314 ) was observed in the case of unit 7 and unit 8 in the year
2010. Almost all the units showed consistent availability improvement in different years. Measures to improve the
reliability (R(t)) indicators of the plant have been suggested such as training and retraining of technical personnel on
the major equipment being used and just in time availability of spares.
Keywords: Gas Turbine Power Plant (GTPP); gas turbines; reliability indicators, maintainability.
1. Introduction
1Reliability analysis techniques have been gradually
accepted as standard tools for the planning, design,
operation and maintenance of electric power system. The
function of an electric power system is to provide
electricity to its customers efficiently and with a
reasonable assurance of continuity and quality (Adegboye
and Ekundayo, 2010; Billinton and Allen, 1992; Kucherov
et al., 2005). The task of achieving economic efficiency is
assigned to system operators or competitive markets,
depending on the type of industry structure adopted. On
the other hand, the quality of the service is evaluated by
the extent to which the supply of electricity is available to
customers at a usable voltage and frequency. The
reliability of power supply is, therefore, related to the
probability of providing customers with continuous
service and with a voltage and frequency within prescribed
ranges around the nominal values (Wang et al.,
2002;Wang and Billinton, 2003; Sikos and Klemeš, 2010).
A modern power system is complex, highly integrated
and very large. Fortunately, the system can be divided into
appropriately subsystems or functional areas that can be
analyzed separately (Gupta and Tewari, 2009a, b; Kuo and
Zuo, 2003; Lakhoua, 2009). These functional areas are
generation, transmission and distribution. Reliability
studies are carried out individually and in combinations of
* Corresponding author’s email: [email protected]
the three areas. This work is limited to the evaluation of
the generation reliability. Generation system reliability
focuses on the reliability of generators in the whole
electric power system where electric power is produced
from the conversion process of primary energy (fuel) to
electricity before transmission. The generation system is
an important aspect of electricity supply chain and it is
crucial that enough electricity is generated at every
moment to meet demand. Generating units will
occasionally fail to operate and the system operator has to
make sure that enough reserve is available to be operated
when this situation arises (Barabady and Kumar, 2007;
Caraza and Martha de Souza, 2009; Eti et al., 2007;
Sukhwinder and Wadhwa, 2004). Reliability of the
generation system is divided into adequacy and security
(Hooshmand et al., 2009; Valdma et al., 2007). System
adequacy relates to the existence of sufficient generators
within the system to satisfy the customer load demand or
system operational constraints. System adequacy is
associated with static conditions of the system and do not
include system disturbances. System security on the other
hand relates to the ability of the system to respond to
disturbances arising within the system. Therefore, system
security is associated with response of the system to
whatever perturbation it is subjected to various factors. In
this study, the reliability valuations will be focused on the
generation system adequacy and will not take into
consideration system security. In a generation system
study, the total system generation is examined to
Asis Sarkar et al International Journal of Current Engineering and Technology, Vol.2, No.1 (March 2012)
185
determine its adequacy to meet the total system load
requirement. This
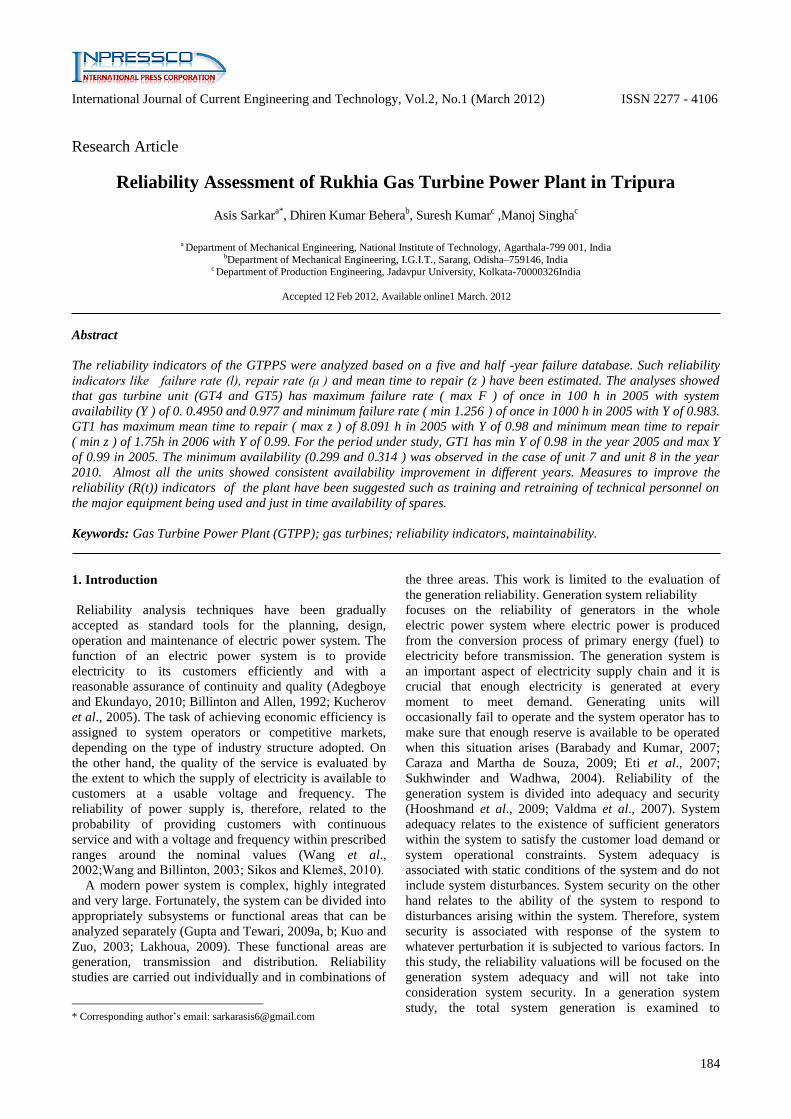
Fig.1 Block diagram of a Gas Turbine Power Plant.
activity is usually termed “ generating system adequacy
assessment”. The transmission system is ignored in
generating system adequacy assessment and is treated as a
load point (Valdma et al., 2007). The main reason of the
generating system adequacy assessment is to estimate the
generating capacity required to meet the system demand
and to have excess capacity to cater for planned and forced
outages events.
A failure in a generating unit results in the unit being
removed from service in order to be repaired or replaced,
this event is known as outage. Such outages can
compromise the ability of the system to supply the
required load and affect system reliability. An outage may
or may not cause an interruption of service depending on
the margins of generation provided. Outages also occur
when the unit undergoes maintenance or other scheduled
work necessary to keep it operating in good condition. A
forced outage is an outage that results from emergency
conditions, requiring that component be taken out of
service immediately. A scheduled or planned outage is an
outage that results when a component is deliberately taken
out of service, usually for purpose of preventive
maintenence or repair.
During the last decade, Tripura has been trying to
restructuring her power sector, abondoning the former
regulated monopolistic model which ruled the provision of
electric energy during most part of this century (Obodeh
and Isaac, 2011). The new “deregulated” structures are
based on free market principles, favouring competition
among central government participants and new entrants
into the power market such as independent(joint
collaboration) power producers (IJPPs) and national
integrated power projects (NIPPs) and consumer
choice.(Basically Tripura Government runs on socialistic
philosophy where deregularization was limited to central
sectors, joint sectors and Private participators are very few
entrants in power generation.) In this new environment,
each generating company should provide its reliability and
associated price to ensure customer satisfaction and
personal preference. One such organisation that generate
power for its use and the state is Gas Turbine Power Plant
company of Rukhia (GTPPSR). It is one of the
subsidiaries of Tripura state electricity power corporation
(TSEPCL). Like many organisational setups involved in
production, the scheduled working time contribute to the
productive capacity of the company. It is important
therefore to ensure that equipment usage is maximised to
save time and money. Again, production managers are
demanding strict guaranteed performance to meet
production targets. Continuous power supply is necessary
for the achievement of these targets. In Tripura, power
supply to many consumers has over the years been done
by the Tripura state electricity power corporation
(TSEPCL). but this supply has always been unreliable,
with its many power outages. Due to the unreliability of
power supply from BTPPS ( Barmura thermal Power plant
station, another subsidiary unit of TSEPCL), TSEPCL
management established another thermal power station in
the year 1992. The station consists of: gas turbine with
total capacity of 82 MW(actual generation capacity =74
M.W.,one unit of 8 M.W. is kept as standby).It has 7
generating units (Unit no -1(8 M.W.) , Unit no -3 (8
M.W.), Unit no -4(8 M.W.), Unit no -5(8 M.W.), Unit no -
6(8 M.W.), Unit no -7(21 M.W.), Unit no -8 (21 M.W.) a
combined cycle unit of one 20 M.W, unit for utilization
of the exhaust gases are in the pipeline for major
expansion. The different units are represented as
GT1,GT3, GT4,GT5 .GT6, GT7, GT8 The study herein
covers GT1 GT1,GT3, GT4,GT5.GT6, GT7 and GT8
units.The theoretical basis of deregulation in the electricity
industry are not completely developed yet and the
practical experience with electricity markets is still limited
( Kucherov et al., 2005; Prisyazhniuk, 2008; Wang and
Billinton, 2003 ) and it is fully depended on Government
initiatives in Tripura.. In effect, the restructuring
processes have brought about new problems and many
open questions, especially regarding the introduction of
competitive or market-based mechanisms and their effect
on the reliability of power supply. However, it is
becoming increasingly necessary to guarantee plant
reliability and economic efficiency in order to improve
plant utilization (Kucherov et al., 2005).
The increasing electricity demand, the increasingly
competitive environment and the recent deregulation of
Tripura’s electricity supply sector will result in increased
competition among the IJPPs. To survive, suppliers must
reduce maintenance costs, prioritize maintenance actions
and raise reliability. The aim of this study is to find ways
to increase equipment reliability and extend the
equipment’s life through cost-effective maintenance using
GTPPSR as a case study.
2. Materials and methods
The records of failure frequency of installations,
containing the description and analysis of the failure and
other materials filed by the operation monitoring services
constitute the basic source of information on the failure

Asis Sarkar et al International Journal of Current Engineering and Technology, Vol.2, No.1 (March 2012)
186
frequency and range of repairs of generating devices of the
power units. The reliability was calculated considering a
five and half year operational database. In processing the
data, mean time between failures (m), mean time to repair
R t
obtained. Mean time between failures (m) is a measure of
how long, on average, an equipment will perform as
specified before an unplanned failure will occur.
m = 1/λ ------ (1)
Where λ = Expected no of failure
λ = Φn/βt ------ (2)
Where Φn = no of failure between maintenance , βt =
total operating time between maintenance, Mean time to
repair ( ζ) is a measure of how long on average it will
take to bring the equipment back to normal serviceability
when it does fail.
ζ = ψi / Φn ------ (3)
When ψi = total outage hours per year., Φ n= number of
failures per year and ζ = 1/μ ------ (4)
Where μ = expected repair rate.
Availability (ψ) is a measure of the percentage of time
that an equipment is capable of producing its end product
at some specified acceptable level. In the case of a turbine
in a power plant, availability is a measure of the fraction
of time that it is generating the nominal power output.
Ψ =
--------(5)
or ψ =
--------(6)
Using equations (1) and (4) in equation (6), we have: ψ =
------- (7)
Reliability ( R(t)) is regarded as the ability of an
equipment to perform its required function satisfactory
under stated conditions during a given period of time
(Ireson et al., 1996; Smith and Hinchcliffe, 2004). In order
words, reliability is a probability that the equipment is
operating without failure in the time period t.
R(t) = --------(8)
Using equation (1) in equation (8) yields
R(t) = e –λt
--------(9)
Where, t = specified period of failure-free operation.
3. Evaluation of MTTF and MTBF
Table 1 Failures over the years
Since Datas are not recorded according to our choices So
it is taken as one year running time between maintenance
= 365 days = 8760 hours. Here one error is that Units are
assumed of running over the years. In the year 2010 we
have taken 7 months as running months instead of 12
months. =210 days=5040 hours.
Table 2 Calculation of Failure rate over the years
As the product matures, the weaker units fail, the failure
rate becomes nearly constant, and devices have entered
what is considered the normal life period. This period is
characterized by a relatively constant failure rate. The
length of this period is also referred to as the “system life”
of a product or component. It is during this period of time
that the lowest failure rate occurs. The useful life period is
the most common time frame for making reliability
prediction.
λ = Φn/βt , where Φn = no of failure between maintenance
βt = total operating time between maintenance. Total
Running Hours of unit: - 6 months, 180 days = 4320
hours.
Asis Sarkar et al International Journal of Current Engineering and Technology, Vol.2, No.1 (March 2012)
187
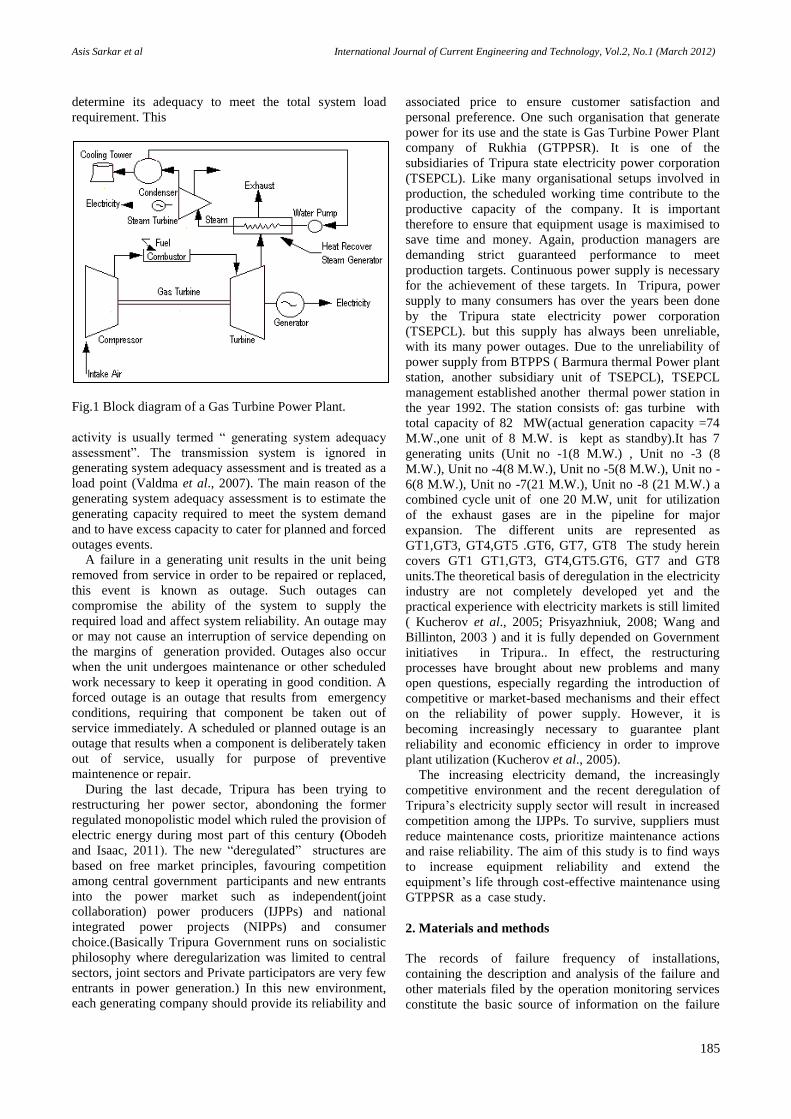
ζ = ψi / Φn------- (3) , when ψi = total outage hours per
year.Φ n= number of failures per year and ζ = 1/ μ= mean
time to repair (mean time between failures (m).
Table 3A Number of Failures and corresponding outage
over the years
Table 3B Number of Failures and corresponding outage
over the years
Table 4 Repair hours over the years
Mean time between failures (MTBF) is the predicted
elapsed time between inherent failures of a system during
operation. MTBF can be calculated as the arithmetic mean
(average) time between failures of a system. The MTBF is
typically part of a model that assumes the failed system is
immediately repaired (MTTR), as a part of a renewal
process(9).
Table 5A Calculation of Mean time between failure (m)
over the years
Table 5B Calculation of Mean time between failure (m)
over the years

Asis Sarkar et al International Journal of Current Engineering and Technology, Vol.2, No.1 (March 2012)
188
This is in contrast to the MTTF, which measures average
time to failures with the modeling assumption that the
failed system is not repaired (infinite repair rate). There
are many variations of MTBF, such as mean time between
system aborts (MTBSA) or mean time between critical
failures (MTBCF) or mean time between unit replacement
(MTBUR). Such nomenclature is used when it is desirable
to differentiate among types of failures, such as critical
and non-critical failures. In the opening sentence, MTBF
is the mean (average) time between failures of a system,
the reciprocal of the failure rate, while in the formal
definition of MTBF is the sum of the MTTF and MTTR ).
The MTTF is simply the reciprocal of the failure rate.
Table 5A and 5B shows the MTBFs of the GTPP for the
period 2005 to 2010 for 8 units
Table 6A Calculation of Mean time to repair over the
years
Table 6B Calculation of Mean time to repair over the
years
Table 6A and 6B shows the calculation of the mean time
to repair of the system over the years from 2005 t0 2010
for all the 8 units.
4. Estimation of availability and repair rate
Availability (ψ) Ψ =
-----------(10)
Table 7A Calculation of expected repair rate over the
years
Table 7B Calculation of expected repair rate over the
years
or ψ =
---------- (11)
m = 1/λ ---------- (12)
Asis Sarkar et al International Journal of Current Engineering and Technology, Vol.2, No.1 (March 2012)
189
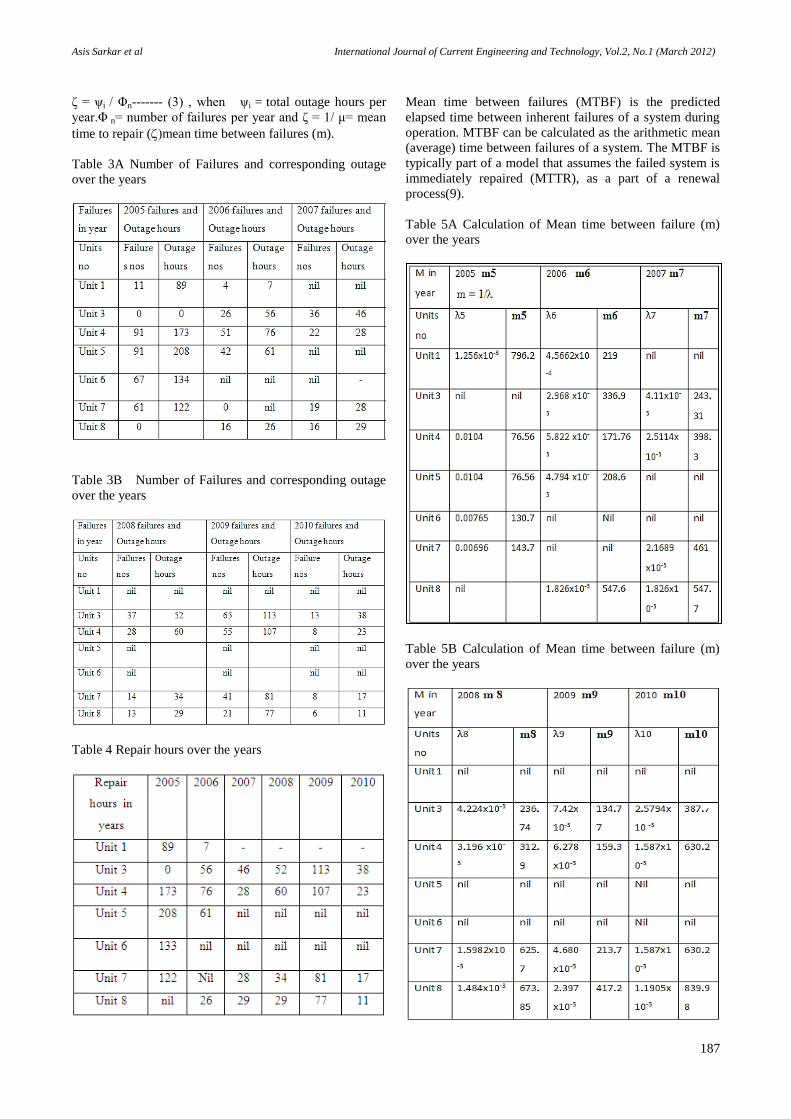
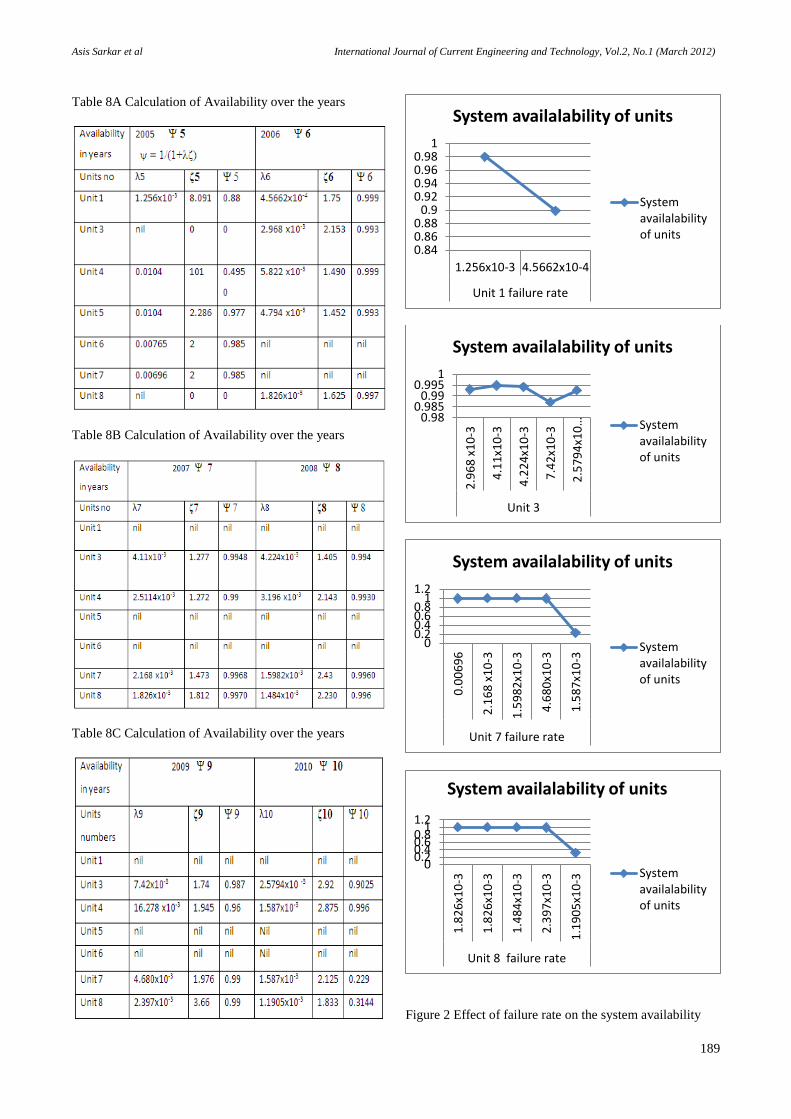
Table 8A Calculation of Availability over the years
Table 8B Calculation of Availability over the years
Table 8C Calculation of Availability over the years
Figure 2 Effect of failure rate on the system availability
0.840.860.88
0.90.920.940.960.98
1
1.256x10⁻³ 4.5662x10⁻⁴
Unit 1 failure rate
System availalability of units
Systemavailalabilityof units
0.980.985
0.990.995
1
2.9
68
x1
0-3
4.1
1x1
0-3
4.2
24
x10
-3
7.4
2x1
0-3
2.5794x10…
Unit 3
System availalability of units
Systemavailalabilityof units
00.20.40.60.8
11.2
0.0
06
96
2.1
68
x1
0-3
1.5
98
2x1
0-3
4.6
80
x10
-3
1.5
87
x10
-3
Unit 7 failure rate
System availalability of units
Systemavailalabilityof units
00.20.40.60.8
11.2
1.8
26
x10
-3
1.8
26
x10
-3
1.4
84
x10
-3
2.3
97
x10
-3
1.1
90
5x1
0-3
Unit 8 failure rate
System availalability of units
Systemavailalabilityof units

Asis Sarkar et al International Journal of Current Engineering and Technology, Vol.2, No.1 (March 2012)
190
Fig. 3 Effect of repair rate on system availability
0
0.5
1
1.5
2
Series2
Series1
0
0.5
1
1.5
2
1 2 3 4 5
Systemavailalabilityof units
Repair rate
Unit no
0
0.5
1
1.5
2
1 2 3 4 5 6
Systemavailalabilityof units
Repair rate
Unit no
0
0.5
1
1.5
2
2.5
Series2
Series1
0
0.5
1
1.5
2
1 2 3 4 5
Systemavailalabilityof units
Repair rate
Unit no 7
0
0.5
1
1.5
2
1 2 3 4 5
Systemavailalabilityof units
Repair rate
Unit no 8
02468
1012
Series2
Series1
0
0.5
1
1.5
2
2.5
3
3.5
4
4.5
1 2 3 4 5
Systemavailalabilityof units
Mean timeto Repair
Unit no 3
Asis Sarkar et al International Journal of Current Engineering and Technology, Vol.2, No.1 (March 2012)
191
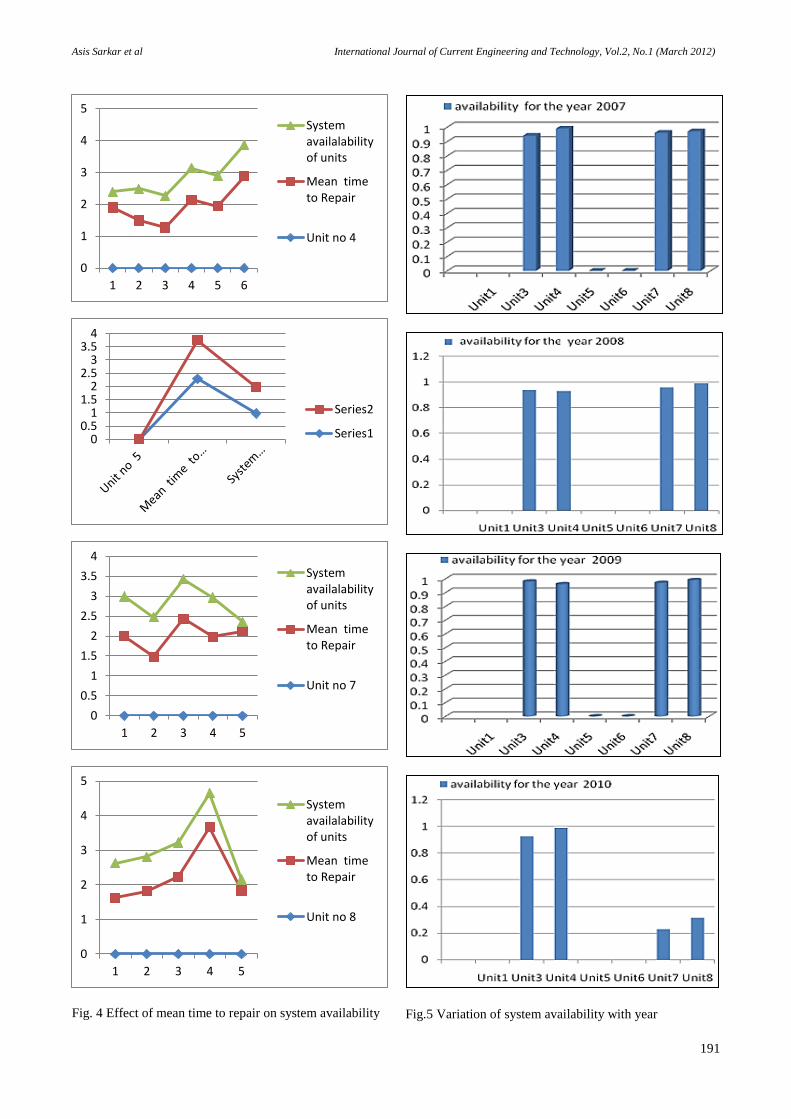
Fig. 4 Effect of mean time to repair on system availability
Fig.5 Variation of system availability with year
0
1
2
3
4
5
1 2 3 4 5 6
Systemavailalabilityof units
Mean timeto Repair
Unit no 4
00.5
11.5
22.5
33.5
4
Series2
Series1
0
0.5
1
1.5
2
2.5
3
3.5
4
1 2 3 4 5
Systemavailalabilityof units
Mean timeto Repair
Unit no 7
0
1
2
3
4
5
1 2 3 4 5
Systemavailalabilityof units
Mean timeto Repair
Unit no 8
Asis Sarkar et al International Journal of Current Engineering and Technology, Vol.2, No.1 (March 2012)
192
5. Evaluation of reliability
Reliability is defined as the probability that a device will
perform its intended function during a specified period of
time under stated conditions. Reliability may be improved
by clarity of expression, lengthening the measure, and
other informal means. However, formal psychometric
analysis, called item analysis, is considered the most
effective way to increase reliability.
Table 9A Calculation of Reliability over the years
This analysis consists of computation of item difficulties
and item discrimination indices, the latter index involving
computation of correlations between the items and sum of
the item scores of the entire test.
Table 9B Calculation of Reliability over the years
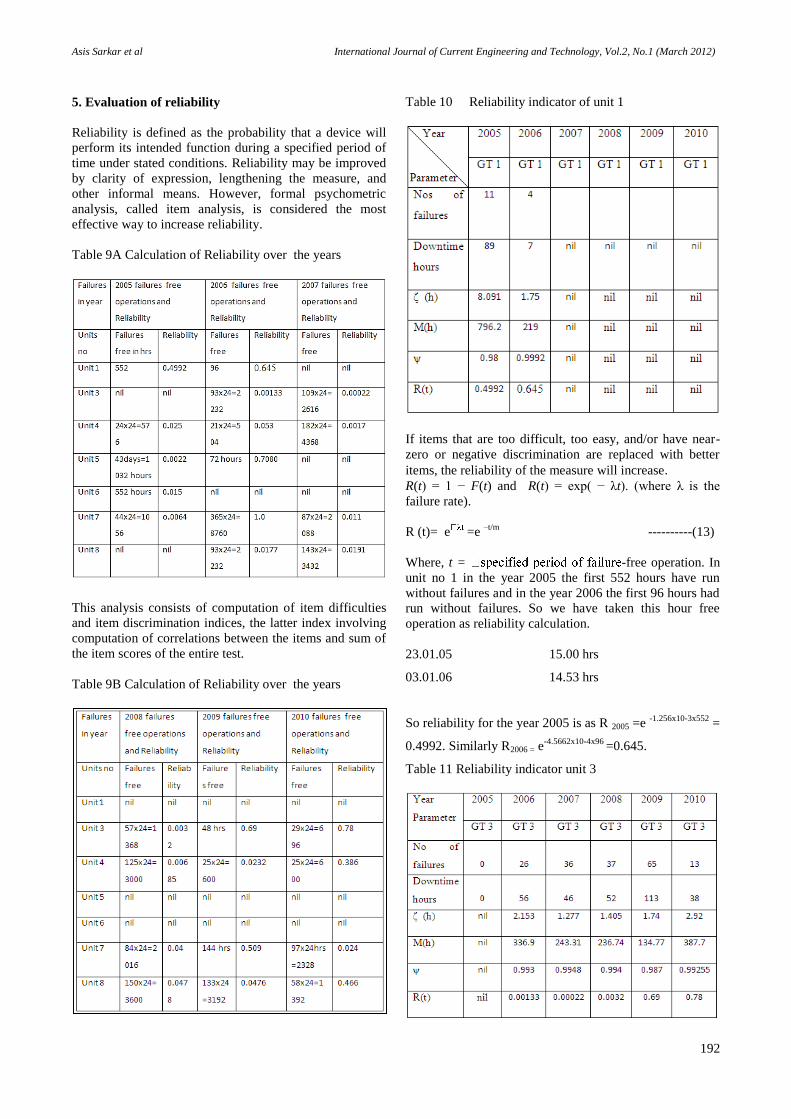
Table 10 Reliability indicator of unit 1
If items that are too difficult, too easy, and/or have near-
zero or negative discrimination are replaced with better
items, the reliability of the measure will increase. R(t) = 1 − F(t) and R(t) = exp( − λt). (where λ is the
failure rate).
R (t)= e =e –t/m
----------(13)
Where, t = -free operation. In
unit no 1 in the year 2005 the first 552 hours have run
without failures and in the year 2006 the first 96 hours had
run without failures. So we have taken this hour free
operation as reliability calculation.
23.01.05 15.00 hrs
03.01.06 14.53 hrs
So reliability for the year 2005 is as R 2005 =e -1.256x10-3x552
=
0.4992. Similarly R2006 = e-4.5662x10-4x96
=0.645.
Table 11 Reliability indicator unit 3
Asis Sarkar et al International Journal of Current Engineering and Technology, Vol.2, No.1 (March 2012)
193
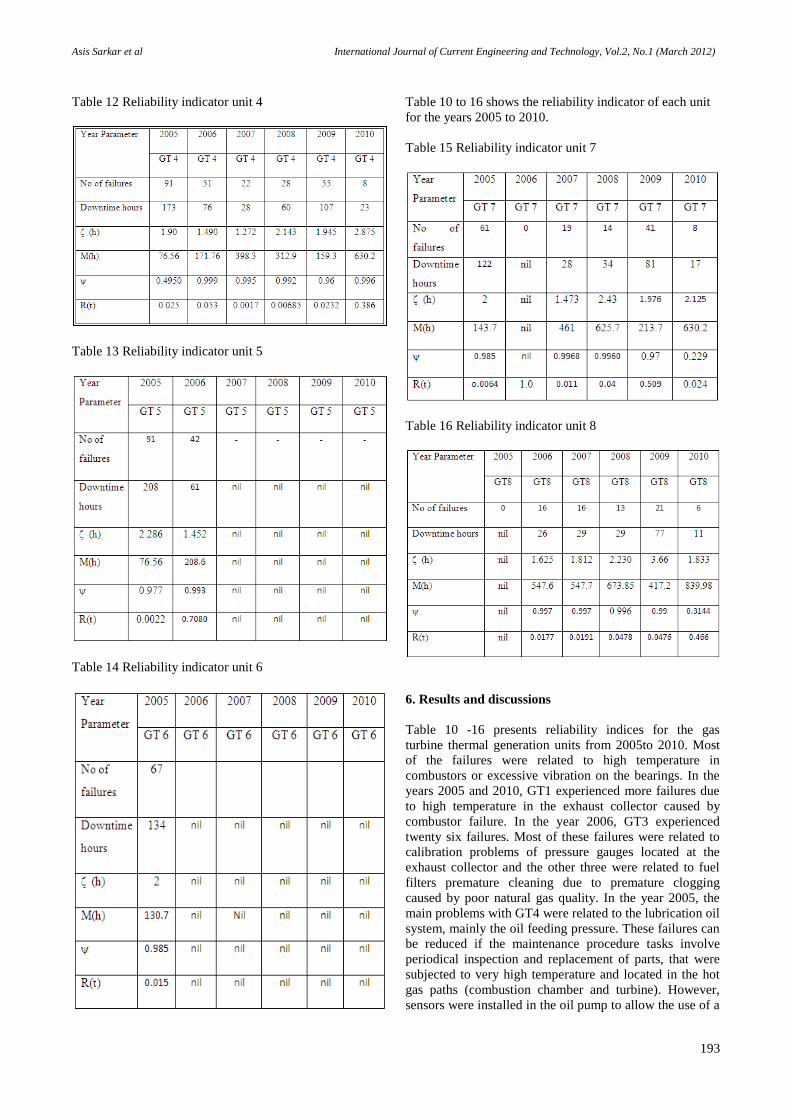
Table 12 Reliability indicator unit 4
Table 13 Reliability indicator unit 5
Table 14 Reliability indicator unit 6
Table 10 to 16 shows the reliability indicator of each unit
for the years 2005 to 2010.
Table 15 Reliability indicator unit 7
Table 16 Reliability indicator unit 8
6. Results and discussions
Table 10 -16 presents reliability indices for the gas
turbine thermal generation units from 2005to 2010. Most
of the failures were related to high temperature in
combustors or excessive vibration on the bearings. In the
years 2005 and 2010, GT1 experienced more failures due
to high temperature in the exhaust collector caused by
combustor failure. In the year 2006, GT3 experienced
twenty six failures. Most of these failures were related to
calibration problems of pressure gauges located at the
exhaust collector and the other three were related to fuel
filters premature cleaning due to premature clogging
caused by poor natural gas quality. In the year 2005, the
main problems with GT4 were related to the lubrication oil
system, mainly the oil feeding pressure. These failures can
be reduced if the maintenance procedure tasks involve
periodical inspection and replacement of parts, that were
subjected to very high temperature and located in the hot
gas paths (combustion chamber and turbine). However,
sensors were installed in the oil pump to allow the use of a
Asis Sarkar et al International Journal of Current Engineering and Technology, Vol.2, No.1 (March 2012)
194
monitoring system. to check oil pump vibration and oil
temperature and flow. But a bi-monthly oil analysis should
be implemented in order to check for the presence of
metallic particles in the fluid that could be an indication of
possible bearings parts wear. The failure rate is a
reasonable measure for durability of generating devices
and indication for economical effectiveness of repairs.
Effect of failure rate on the system availability is revealed
in Figure 1. Failure rate of GT1 peaked at 1.256x10⁻³
(once in 1000 h) in 2005 with system availability (Y ) of 0.
98 and its lowest value of 4.566 (four in 1000 h) was
attained in 2005 with Y of 0.899 . While for GT3,
maximum value of 7.42x10⁻³
was obtained in 2007 with Y
of 0.987 and minimum value of 2.5794x10 -3
in 2010 with
Y of 0.992. The forth going observations show that
increase in failure rate results in decrease in Y . However,
effective maintenance management is essential in reducing
the adverse effect of equipment failure.
This can be accomplished by accurately predicting the
equipment failure such that appropriate actions can be
planned and taken in order to minimize the impact of
equipment failure to operation. Also continuous use of
operating unit exhibiting partial failure should be
discouraged so as to avoid degradation or catastrophic
failure. The effect of repair rate (μ ) on Y is depicted in
Figure 2. It showed that GT1 has a maximum repair rate
(max μ) of (0.57143) in 2006 with Y of 0.999 and
minimum repair rate ( min μ ) of 0.1236 in 2005 with Y
of 0.88. In the other hand, GT 3 has max μ of 0.7831 in
2007 with Y of 0.9948 and min μ of 0.3425 in 2010with Y
of 0.9052. The aforementioned analysis show that Y
increases with increase in μ . Figure 3 represents variation
of mean time to repair (z )with year. GT1 has maximum
mean time to repair ( max z ) of 8.091 h in 2006 with Y of
0.98 and minimum mean time to repair ( min z ) of 1.75 h
in 2005 with Y of 0.9992. Similarly, GT2 has max z of
2.92 h in 2010 with Y of 0.925 and min z of 1.277 h in
2007 with Y of 0.9948.. From the forth going, it can be
deduce that Y decreases with increase in z . The
operational consequences of failure can be reduced by
taking steps to shorten the downtime, most often by
reducing the time to get hold of spare parts. The Y over
the period of study is shown in Figure 4. GT4 has min Y
in the year 2005.and unit 7 has minimum availability in
the year 2010 of 0.0.229 in the year 2010 and max Y of
0.9968 in 2007 while GT3 has min Y of 0.9255 2010 and
max Y of 0.9948 in 2007. From the analyses thus far, it is
glaring that the measure of reliability R(t) by extension Y
of the power plant is determined by indices such as failure
rate, μ and z . The Y values of some units for the gas
turbine station are lower than the IEEE recommended
standard of ASAI which is 0.999 (Bertling and Eriksson,
2005). Availability can be improved significantly by
reviewing maintenance practices. Planned maintenance is
still essential but more and more, predictive maintenance
is becoming the driver for planned outages. It has been
reported that plant with availability of 50 to 60% gave
85% and above after it has been refurbished and
maintained (Hooshmand et al., 2009).
Conclusion
The analyses revealed that gas turbine 4 and 5 (GT4, GT5)
has maximum failure rate ( max l ) of once in 100 h in
2005 with system availability (Y ) of 0.495 and ,977 and
minimum failure (Obodeh and Esabunor 291) rate
(1.1905x10⁻³
) of once in 1000 h in 2010 with Y of
0.3144.for gas turbine unit no 8 GT8. While for gas
turbine 3 (GT 3), max 7.42x10⁻³
of seven in 1000 h was
obtained in 2009 with Y of 0.987 and min of twice in
1000 h( 2.5794x10 -3
) in 2010 with Y of 0.9025. Increase
in failure rate results in decrease in Y. Effective
maintenance management is essential in reducing the
adverse effect of equipment failure to operation. It was
shown that GT1 has a maximum repair rate ( max μ ) of
once in 0.57143 h in 2006 with Y of 0.999 and minimum
repair rate ( min μ ) of once in 0.1236 h in 2005 with Y of
0.1236. On the other hand, GT3 has max μ of once in
0.7831 h in 2007 with Y of 0.9948. and min μ of once in
0.465 h in 2006 with Y of 0.93. Y increases with increase
in μ . GT1 has maximum mean time to repair ( max z ) of
8.091 h in 2005 with Y of 0.88 and minimum mean time
to repair ( min z ) of 1.75 h in 2006 with Y of 0.993 .
Similarly, GT3 has max z of 2.92 h in 2010 with Y of
0.9025.and min z of 1.277 h in 2007 with Y of 0.9948. It
is possible to reduce the operational consequences of
failure by taking steps to shorten the downtime by
reducing the time to get hold of spare parts. For the period
under study, GT1 has min Y of 0.88 in the year 2005 and
max Y of 0.99 in 2006 while GT3 has min Y of 0.9025 in
2010 and max Y of 0.9948 in 2007.The measure of (R(t)
of gas turbine station is determined by such indices as
failure rate ,and availability can be improved significantly
by reviewing maintenance practices. Planned or scheduled
maintenance must be given more attention as directed by
the unit manufacturer’s operation and maintenance manual
package, if the unit have to perform properly. In other
words, routine preventive maintenance must be well
planned and more regular. Measures to improve the (R(t))
indices of the plant have been suggested such as training
and retraining of technical personnel on the major
equipment being used. This will improve their skill and
knowledge on the current information and communication
technology (ICT) as well as improve their manpower
quality.
References
Adegboye BA, Ekundayo KR (2010), Relaibility
Assessment of 4.2MW Single Shaft Typhoon Gas Fired Turbine
Power Generation Station (2003 - 2008), Proceedings of 3rd
International Conference on Engineering Research and
Development: Advances in Engineering Science and Technology
(7th – 9th September, 2010), Benin, Nigeria, pp. 1388 – 1406.
Barabady J, Kumar U (2007), Availability Allocation
through importance Measures, Int. J. Qual. Reliab. Manag., 24
(6): 643 – 657.
Bertling L, Eriksson R (2005), A Reliability- Centered
Asset Maintenance Method for Assessing the Impact of
Maintenance in Power Distribution Systems, IEEE Transactions
on Power Systems, 20(1): 23- 46.

Asis Sarkar et al International Journal of Current Engineering and Technology, Vol.2, No.1 (March 2012)
195
Billinton R, Allen R (1992), Power System Reliability
and its Assessment Part 1: Background and Generating Capacity,
Power Eng. J., 6(4): 191-196.
Caraza FT, Martha de SF (2009), Availability Analysis
of Gas Turbine used in Power Plants, Int. J. Thermodyn., 12(1):
28 – 37.
Eti MC, Ogaji SOT, Probert SD (2007). Integrating
Relaibility,Availability, Maintainability and Supportability with
Risk Analysis for Improved Operation of Afam Thermal Power
Station, Appl. Energy,84: 202 – 221.
Gupta SA, Tewari CPC (2009),Simulation Model for
Coal Crushing System of a Typical Thermal Power Plant. Int. J.
Eng. Technol., 1(2): 156 – 163.
Gupta SA, Tewari CPC (2009),Simulation Modelling
and Analysis of a Complex System of a Thermal Power Plant. J.
Ind. Eng. Manag.,2(2): 387 – 406.
Hooshmand RA, Moazzami M, Nasiri AA
(2009),Power System Reliability Enhancement by using
PowerformersTM, Serbian J.Electrical Eng., 6(2): 315 – 331
Ireson WG, Coombs CF, Moss RY (1996), Handbook
of Reliability Engineering and Management, Mcgraw-Hall
Professional, New York,Chap. 16, p. 8.
Kucherov YN, Kitushin VG (2005), Restructuring and
Relaibility of Power Supply, Energorynok, 14(1): 40 – 47.
Kuo W, Zuo MJ (2003), Optimal Reliability
Modelling: Principles and applications, Wiley and Sons, New
York, USA. p. 102.
Lakhoua MN (2009).,Application of Functional
Analysis on a SCADA System of a Thermal Power Plant,
Advances in Electrical and Computer Engineering, 9(2): 90 – 98.
Obodeh O, Isaac FO (2011), Performance Analysis for
Sapele Thermal Power Station: Case Study of Nigeria, J. Emerg.
Trends Eng. Appl.Sci., 2(1): 166 – 171
Prisyazhniuk VA (2008), Altrenative Trends in
Development of Thermal Power Plants. Applied Thermal
Engineering, 28: 190 – 194.
Sikos L, Klemeš J (2010), Evaluation and Assessment
of Reliability and Availability Software for Securing an
Uninterrupted Energy Supply, Clean Technology and
Environmental Policy, 12: 137 – 146.
Smith A, Hinchcliffe G. (2004), Reliability-Centered
Maintenance: A Gateway to World Class Maintenance, Elsevier
Butterworth-Heinemann, New York, pp. 67-89.
Sukhwinder SJ, Wadhwa SS (2004),Reliability,
Availability and Maintainability Study of High Precision Special
Purpose Manufacturing Machines. J. Sci. Ind. Res., 63: 512 –
517.
Valdma M, Keel M, Tammoja H, Kilk K
(2007).,Reliability of Electric Power Generation in Power
Systems with Thermal and Wind Plants,Oil Shale, 24(2): 197-
208.
Wang P, Billinton R (2003), Reliability Assessment of
a RestructuredPower System using Reliability Network
Equivalent Techniques, IEEE Proc. Gener. Transm. Distrib.,
150(5): 555 – 560.
Wang P, Billinton R, Goel L (2002), Unreliability Cost
Assessment of an Electric Power System using Reliability
Network Equivalent Approaches, IEEE Trans. on Power
Systems, 17(3): 549 – 556