reliability and validity of match performance analysis in
TRANSCRIPT

Albin P. C. Tenga Reliability and Validity of Match Performance Analysis in Soccer A multidimensional qualitative evaluation of opponent interaction DISSERTATION FROM THE NORWEGIAN SCHOOL OF SPORT SCIENCES

i
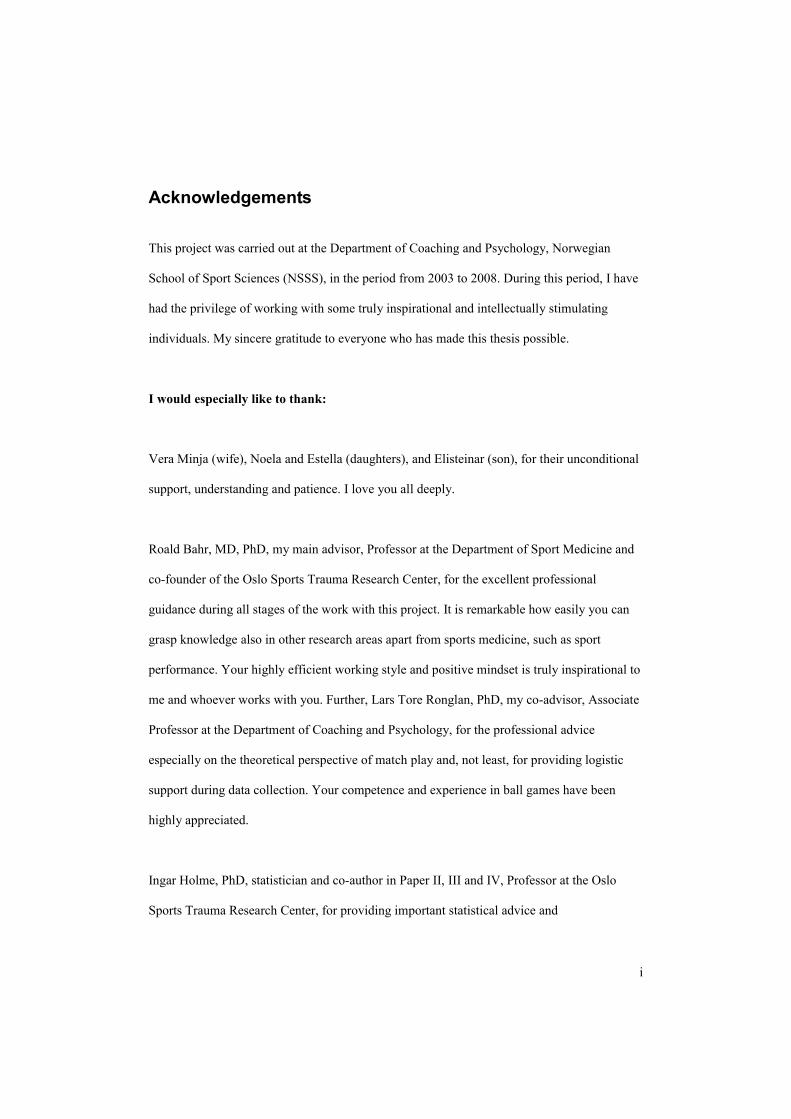
Acknowledgements
This project was carried out at the Department of Coaching and Psychology, Norwegian
School of Sport Sciences (NSSS), in the period from 2003 to 2008. During this period, I have
had the privilege of working with some truly inspirational and intellectually stimulating
individuals. My sincere gratitude to everyone who has made this thesis possible.
I would especially like to thank:
Vera Minja (wife), Noela and Estella (daughters), and Elisteinar (son), for their unconditional
support, understanding and patience. I love you all deeply.
Roald Bahr, MD, PhD, my main advisor, Professor at the Department of Sport Medicine and
co-founder of the Oslo Sports Trauma Research Center, for the excellent professional
guidance during all stages of the work with this project. It is remarkable how easily you can
grasp knowledge also in other research areas apart from sports medicine, such as sport
performance. Your highly efficient working style and positive mindset is truly inspirational to
me and whoever works with you. Further, Lars Tore Ronglan, PhD, my co-advisor, Associate
Professor at the Department of Coaching and Psychology, for the professional advice
especially on the theoretical perspective of match play and, not least, for providing logistic
support during data collection. Your competence and experience in ball games have been
highly appreciated.
Ingar Holme, PhD, statistician and co-author in Paper II, III and IV, Professor at the Oslo
Sports Trauma Research Center, for providing important statistical advice and

ii
encouragement. Also, Daniel Kanstad, co-author in paper I, master student at the Department
of Coaching and Psychology, for the assistance with the analysis of the video-recordings.
Egil R. Olsen, successful Norwegian male national team coach in soccer and retired Associate
Professor at the Department of Coaching and Psychology, for the professional advice on
initial ideas behind this project. Further, Øyvind Larsen, coordinator of education at the
Norwegian Football Association (NFF), for the valuable input on the development of analysis
variables. I appreciate our friendship, personal support and the willingness to share your
knowledge and experience of soccer match analysis.
My fellow PhD students, past and present, for the social interaction and stimulating
conversations about science and life in general. Some of you have had a more direct influence
to this work: Geir Jordet and Marc Noethlichs, for the inspiration and willingness to exchange
and discuss ideas. In addition, Børgesen, A., Fosnæs, O., and Sigmundstad, E., from the ‘ball
games’ group, for the political support in the process of establishing my PhD project.
Lasse Nettum & Co., audiovisual engineer, for introducing me to the high-tech video editing.
And the Norwegian Broadcasting Corporation (NRK), for generously providing videotapes.
And finally, to the librarians at the Norwegian School of Sport Sciences, for the highly
valuable help and service-minded attitude.
Oslo, December, 2009
Albin Tenga

iii
List of papers
This thesis is based on the following original research papers, which are referred to in the text
by their Roman numerals:
I. A. Tenga, D. Kanstad, L. T. Ronglan, R. Bahr. (2009). Developing a new method for
team match performance analysis in professional soccer and testing its reliability.
International Journal of Performance Analysis in Sport, 9 (1), 8-25.
II. Tenga A, Holme I, Ronglan LT, Bahr R. Effect of playing tactics on achieving score-
box possessions in a random series of team possessions from Norwegian professional
soccer matches. Journal of Sports Sciences. In press
III. Tenga A, Holme I, Ronglan LT, Bahr R. Effect of playing tactics on goal scoring in
Norwegian professional soccer. Journal of Sports Sciences. In press
IV. Tenga A, Holme I, Ronglan LT, Bahr R. Effects of match location on playing tactics
for goal scoring in Norwegian professional soccer. Journal of Sport Behavior. In press
V. Tenga A, Ronglan LT, Bahr R. Measuring effectiveness of offensive match play in
professional soccer. European Journal of Sports Science. In press

iv
Summary
Match performance analysis is widely used as a method for studying technical, tactical and
physical aspects of player and team performance in a soccer match. Therefore, ensuring the
validity and reliability of the collected data is important for match performance analysis to
meet its intents and purposes effectively. However, most studies on soccer match performance
use unidimensional frequency data based on analyses done in isolation from the match
context. In addition, reliability studies reported previously are generally small and with
significant methodological limitations. Therefore, the main aim of this thesis was to develop,
test the reliability of, and apply a new method for team match performance analysis in soccer
which includes an assessment of opponent interaction by using categorical data based on
multidimensional qualitative evaluation.
Paper I: A new method was developed by using 22 multidimensional categorical variables,
each with three to seven ordered and non-ordered categories. To test inter- and intraobserver
reliability, a random sample of 200 team possessions was analysed. Kappa values were
considerably better for the intraobserver test than the interobserver test. To improve
interobserver agreement, categories were collapsed into two or three ordered categories.
Considering that we used videotapes recorded from a conventional TV coverage, the
reproducibility achieved for most variables used was rather high. A new method, representing
a potentially valuable tool for more valid assessment of team match performance, has been
developed as a reliable method for most variables used.
Paper II: Paper II was an attempt at applying the method developed in paper I to study
effectiveness of playing tactics by using a cohort design which rarely has been used in
previous research in this field. This necessitates the use of commonly occurring outcomes, i.e.

v
score box possessions, as outcome variable in order to have sufficient statistical power. To
conduct a more appropriate assessment of opponent interaction, one has to include an
adequate sample size of randomly selected events. Thus, a cohort study using a random series
of 1703 team possessions was conducted to examine the effect of playing tactics on the
probability for achieving a score box possession (shooting opportunity). Offensive tactics
were more effective in producing score box possessions when playing against an imbalanced
defence (28.5%) than against a balanced defence (6.5%). Multiple logistic regression found
that, for the main variable “team possession type”, counter attack was more effective than
elaborate attack when playing against an imbalanced defence (OR=2.69, P<0.001), but not
against a balanced defence (OR=1.14, P=0.78).
Paper III: A The cohort design used in paper II is generally considered superior to a case-
control design in terms of generalizability, but a score box possession is obviously a less
relevant outcome variable in soccer compared to a goal scored. However, because goals are
more infrequent counts, this requires a case-control design, where team possessions leading to
a goal scored are compared to randomly selected team possessions to examine the effect of
playing tactics on the probability for goal scoring. Hence, we studied a sample including 203
goals (“cases”) and 1688 random team possessions (“controls”). Multiple logistic regression
analyses showed that, for the main variable “team possession type”, counter attack was more
effective than elaborate attack when playing against an imbalanced defence (OR=1.64,
P=0.038).
Paper IV: The mean home winning percentages of up to over 60% have been reported to exist
in international soccer. So far, the causes of home advantage in soccer are far from fully
understood. Despite the recognition that critical behaviours such as strategic and tactical

vi
decisions have to be influenced for home advantage to exist (Carron, Loughhead & Bray,
2005), it is surprising that very few studies have directly examined the effects of match
location on playing tactics. Besides, the inclusion of assessment of opponent interaction
seems to have potential for informative additions to the literature on home advantage.
Therefore, a case-control study was conducted to examine the effect of match location on
playing tactics for goal scoring. The sample included the same 203 goals and 1688 random
team possessions as in paper III. Multiple logistic regression analyses showed differences in
the odds ratio for goal scoring in the interaction between playing tactics and match locations.
For the main variable “team possession type” (χ2=5.05, P=0.025), counter attack and
elaborate attack produced goals in higher percentages of attempts at home (24.5% and 21.8%,
respectively) than away (19.8% and 20.5%, respectively), with counter attack being more
effective than elaborate attack when playing against an imbalanced defence at home, but not
away.
Paper V: Since scoring probability in a soccer match play is low (about 1%), the use of the
broader measures of offensive effectiveness, like scoring opportunity, shot at goal, and entry
into final third, is necessary. Compared to goal scored (about 1% scoring probability), broader
measures require smaller match samples for meaningful analyses and may as well enable
soccer practitioners to objectively see behind single match results, which are often influenced
by chance. However, the relative ability of such broader measures to explain goal scoring
over a series of matches has not been examined. Thus, a case-control study was conducted to
investigate the association between broader measures (scoring opportunity and score box
possession) and the ultimate measure (goal scored) of offensive effectiveness. Areas under the
ROC curve (AUC) showed that the 95% CI of the AUC for both the scoring opportunity
(0.74-0.84) and the score box possession (0.68–0.76) includes the AUC for goal scoring

vii
(0.74). Thus, the results are very similar regardless of which outcome measure for offensive
effectiveness was used, and therefore the use of these broader measures may be more feasible.
In sum, the findings of the papers II-IV suggest that an assessment of opponent interaction is
critical to evaluate the effectiveness of playing tactics, and hence improves the validity of
team match performance analysis.
Keywords: Reliability, validity, multidimensional categorical data, opponent interaction,
soccer, match performance analysis, logistic regression, soccer playing effectiveness, goal
scoring, home advantage, ROC curve, scoring opportunity, score-box possession.
viii
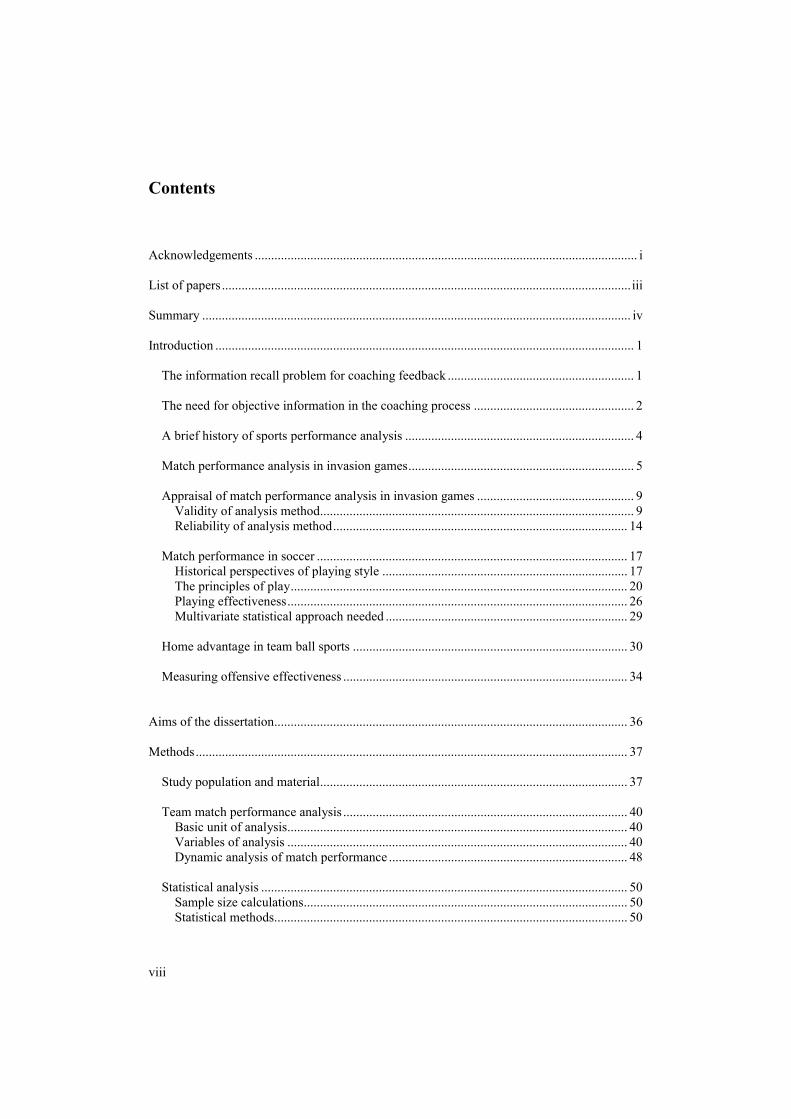
Contents
Acknowledgements ..................................................................................................................... i
List of papers ............................................................................................................................. iii
Summary ................................................................................................................................... iv
Introduction ................................................................................................................................ 1
The information recall problem for coaching feedback ......................................................... 1 The need for objective information in the coaching process ................................................. 2 A brief history of sports performance analysis ...................................................................... 4 Match performance analysis in invasion games..................................................................... 5 Appraisal of match performance analysis in invasion games ................................................ 9
Validity of analysis method................................................................................................ 9 Reliability of analysis method.......................................................................................... 14
Match performance in soccer ............................................................................................... 17
Historical perspectives of playing style ........................................................................... 17 The principles of play....................................................................................................... 20 Playing effectiveness........................................................................................................ 26 Multivariate statistical approach needed .......................................................................... 29
Home advantage in team ball sports .................................................................................... 30 Measuring offensive effectiveness ....................................................................................... 34
Aims of the dissertation............................................................................................................ 36
Methods.................................................................................................................................... 37
Study population and material.............................................................................................. 37 Team match performance analysis ....................................................................................... 40
Basic unit of analysis........................................................................................................ 40 Variables of analysis ........................................................................................................ 40 Dynamic analysis of match performance ......................................................................... 48
Statistical analysis ................................................................................................................ 50
Sample size calculations................................................................................................... 50 Statistical methods............................................................................................................ 50

ix
Ethics.................................................................................................................................... 51
Results and discussion.............................................................................................................. 52
Reliability of the method (Paper I)....................................................................................... 52 Effectiveness of playing tactics (Papers II & III)................................................................. 54 Effectiveness of playing tactics at home vs. away (Paper IV) ............................................. 57 Measuring offensive effectiveness (Paper V) ...................................................................... 58
Overall discussion and conclusions.......................................................................................... 60
Methodological considerations ............................................................................................ 60 Balanced defence vs. imbalanced defence ........................................................................... 62 Complementary study designs ............................................................................................. 63 Style and level of play.......................................................................................................... 64 Conclusions .......................................................................................................................... 65
Implications for practice........................................................................................................... 67
Implications for match performance analysis ...................................................................... 67 Implications for match performance .................................................................................... 68
References ................................................................................................................................ 70
Papers I-V................................................................................................................................. 77
Paper I .................................................................................................................................. 77 Paper II ................................................................................................................................. 97 Paper III.............................................................................................................................. 129 Paper IV.............................................................................................................................. 155 Paper V............................................................................................................................... 183


Introduction
1
Introduction
“...in reality, each and every person involved within sport will subconsciously process
information to predict sports performance, i.e. to draw conclusions upon the outcome of
future performance based upon the combined interaction of previously gathered information,
knowledge or data.” (Hughes, 2004, p. 119).
The information recall problem for coaching feedback The ability of humans, including experienced coaches, to recall recent observed events of
sports performance is not only unreliable but also inaccurate (Franks, 1993; Franks & Miller,
1986, 1991; Laird & Waters, 2008). Franks and Miller (1986) showed that novice observers
(physical education students), with no previous soccer coaching experience, had an
observational accuracy of only 42% when recalling the critical events for successful
performance during one-half of a videotaped international soccer match. Using the same
method as in Franks and Miller (1986) to test qualified soccer coaches, Laird and Waters
(2008) reported a better recall ability of 59% than for novice observers (42%). However,
coaches who had less experience had a better recall accuracy than those with more
experience. Laird and Waters (2008) argue that, gaining their qualifications recently, less
experienced coaches would have been made aware of the elements that comprised critical
events in soccer and this may have helped them in recalling events better. In contrast, in their
long coaching career more experienced coaches may have developed patterns and ways in
which they coach and this may influence how they observe performance. In another study,
qualified soccer coaches (with between 2 and 20 years of coaching experience) were reported
to be incapable of remembering more than 40% of information about goals, shots and missed
shooting opportunities from a 30 min videotaped soccer match (Franks & Miller, 1991).
Elsewhere, no difference was recorded between experienced and novice gymnastic coaches in

Introduction
2
detecting differences in two performances of a specific event (Franks, 1993). Interestingly,
this same study reports that experienced coaches produced many more false positives
(reporting a difference where none existed) than novice coaches, and they also made decisions
very confidently even when wrong.
Such findings, which basically indicate that coach’s recall ability may be no better than
chance, provide evidence to conclude that the human process of recalling visual information
is problematic. The challenges, including distortions from highlighted features of
performance, limitations of human memory systems, and observational difficulties, appear to
present any single individual attempting to analyse and remember objectively the events
occurring in sports performance with a virtually impossible task (Franks, 2004). Hence,
problems associated with subjective assessment of sport performance result in the accuracy of
coaching feedback being very limited.
The need for objective information in the coaching process The essence of the coaching process is to induce observable improvement in athletic
performance. Figure 1 outlines a simple flowchart of the coaching process in its observational,
analytical and planning phases. According to Franks, Goodman and Miller (1983), sports
performance is watched (observational phase) and an idea is formed about positive and
negative aspects of that particular performance (analytical phase). Often the results of
previous performances, as well as performances in practice, are considered in the analytical
phase before planning and preparing (planning phase) for future performances. This process
repeats itself each time after a new athletic event. Note that this process of information
renewal may occur as a performance unfolds, as well as after performance has taken place.
The coaching process therefore depends heavily on performance analysis in order to effect a

Introduction
3
positive change in athletic performance. Performance analysis provides the coach and player
with information about past match performances (i.e. descriptive function) and may be useful
also in generating data for predictive model development (i.e. prescriptive function) (Franks
& McGarry, 1996).
Figure 1. From Franks (2004, p. 12). A simple schematic diagram representing the coaching process. Reproduced with permission from the publisher.
Consequently, informed and accurate measures are necessary for effective feedback and
hence the improvement of performance. This is especially so due to the fact that, in most
athletic events, performance analysis is more or less based on series of qualitative evaluations
(Franks & Goodman, 1986; Hughes & Bartlett, 2002).
The information about skill performance, presented in the form of feedback, is among critical
factors affecting the learning and hence the proficiency of a motor skill (Franks, 2004;
McGarry & Franks, 2003). Lack of such information or the provision of incorrect (or
irrelevant) feedback may even prevent learning from taking place in certain circumstances.
Further, Franks (2004) reports that the quality as well as the timing of the feedback has been
shown to have varying effects on the learning of motor skills, e.g. the precise information
feedback at the correct time is known to maximize the learning process. Thus, the accurate
Athletes perform
Coach observes
Performance analysed
Past results accounted for
Coach plans practice
Coach conducts practice

Introduction
4
analysis of a sports contest is fundamental to the entire coaching process and underlies
improvement in sports performance. To achieve this, the use of objective methods of sports
performance analysis is necessary (Franks & Goodman, 1986).
A brief history of sports performance analysis The beginning of sports performance analysis can be traced back to the dance notation which
is constituted the ‘starting base’ for the development of a general movement notation system
(Thornton, 1971). Historical texts show the emergence of a crude form of dance notation in
about the fifteenth century and for at least five centuries attempts had been made to devise
and develop a system for notation movement. Hughes and Franks (1997) reported further that
movement notation systems, developed primarily in the field of expressive movement,
gradually diversified into sports and games analysis. The study combining baseball players
batting, pitching and fielding and the probability for success published in May, 1910 is the
earliest publication recorded (Fullerton, 1910). But in 1939, Messersmith and Bucher
probably did the first attempt to devise a notation system specifically for sport analysis when
they notated distance covered by specific basketball players during match play (Messersmith
& Bucher, 1939). Together with his research group at Indiana State University, Messersmith
went on to analyse American football and field hockey in addition to exploring movement in
basketball (Lyons, 1996). As early as 1966, notation systems for analysing game play in
American football were commercially available and the Washington Redskins were among
the first to use them in 1968 (Hughes & Franks, 2004).
In another development, a comprehensive shorthand system for recording the action of a
soccer game has been in existence since 1950, pioneered by the Englishman Charles Reep
(Hughes, 1990; Larsen, 1992; Pollard, Reep & Hartley, 1988). The use of the ‘Reep system’
Introduction
5
of performance analysis has had a big influence in the development of both objective match
analysis and soccer research in general in Europe and North America (Larsen, 1992). For
motion analysis in soccer, Reilly and Thomas (1976) were first to devise and use a hand
notation system combined with an audio tape recorder. They were able to specify in detail the
work rates of players in different positions, distances covered in a game and the percentage of
time in different categories of activity, classified in terms of intensity, duration (or distance)
and frequency.
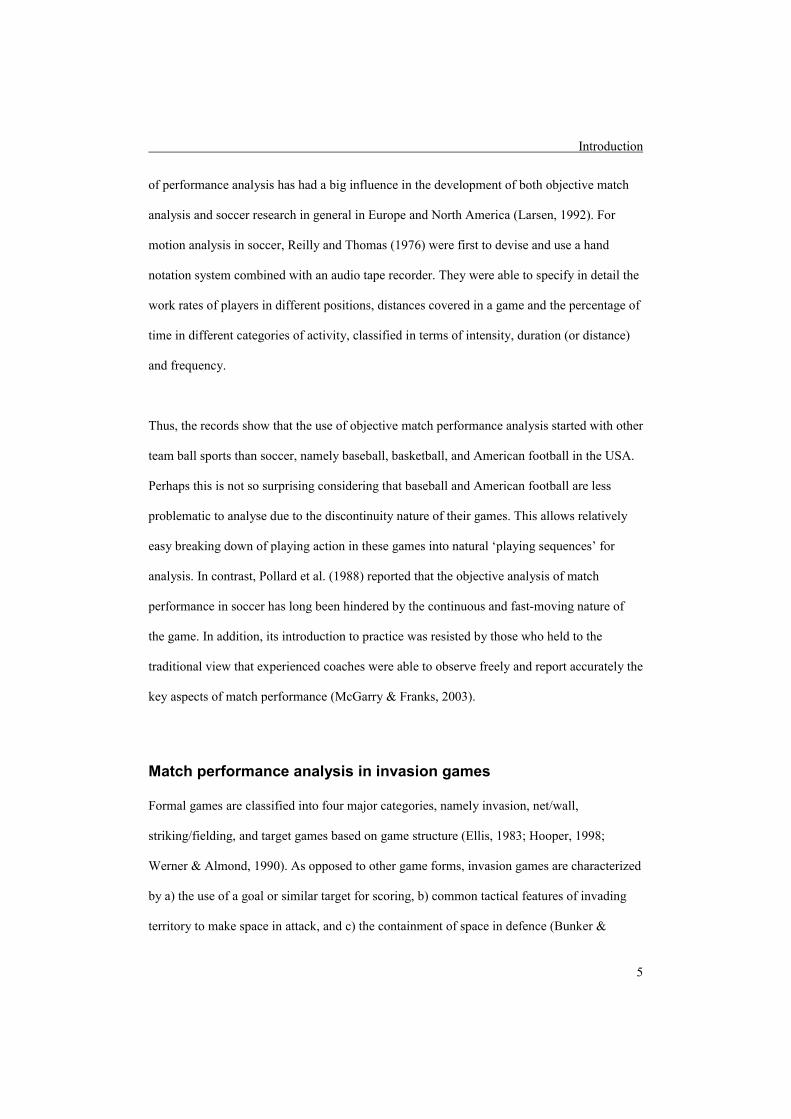
Thus, the records show that the use of objective match performance analysis started with other
team ball sports than soccer, namely baseball, basketball, and American football in the USA.
Perhaps this is not so surprising considering that baseball and American football are less
problematic to analyse due to the discontinuity nature of their games. This allows relatively
easy breaking down of playing action in these games into natural ‘playing sequences’ for
analysis. In contrast, Pollard et al. (1988) reported that the objective analysis of match
performance in soccer has long been hindered by the continuous and fast-moving nature of
the game. In addition, its introduction to practice was resisted by those who held to the
traditional view that experienced coaches were able to observe freely and report accurately the
key aspects of match performance (McGarry & Franks, 2003).
Match performance analysis in invasion games Formal games are classified into four major categories, namely invasion, net/wall,
striking/fielding, and target games based on game structure (Ellis, 1983; Hooper, 1998;
Werner & Almond, 1990). As opposed to other game forms, invasion games are characterized
by a) the use of a goal or similar target for scoring, b) common tactical features of invading
territory to make space in attack, and c) the containment of space in defence (Bunker &
Introduction
6
Thorpe, 1982). The continuous opposition and dynamic structure make invasion games more
complex than other game forms, and thus more difficult to analyze adequately. Any
performance analysis in invasion games should therefore be structured by the help of a
notational analysis system – either simple hand notation or sophisticated computerized
notational systems.
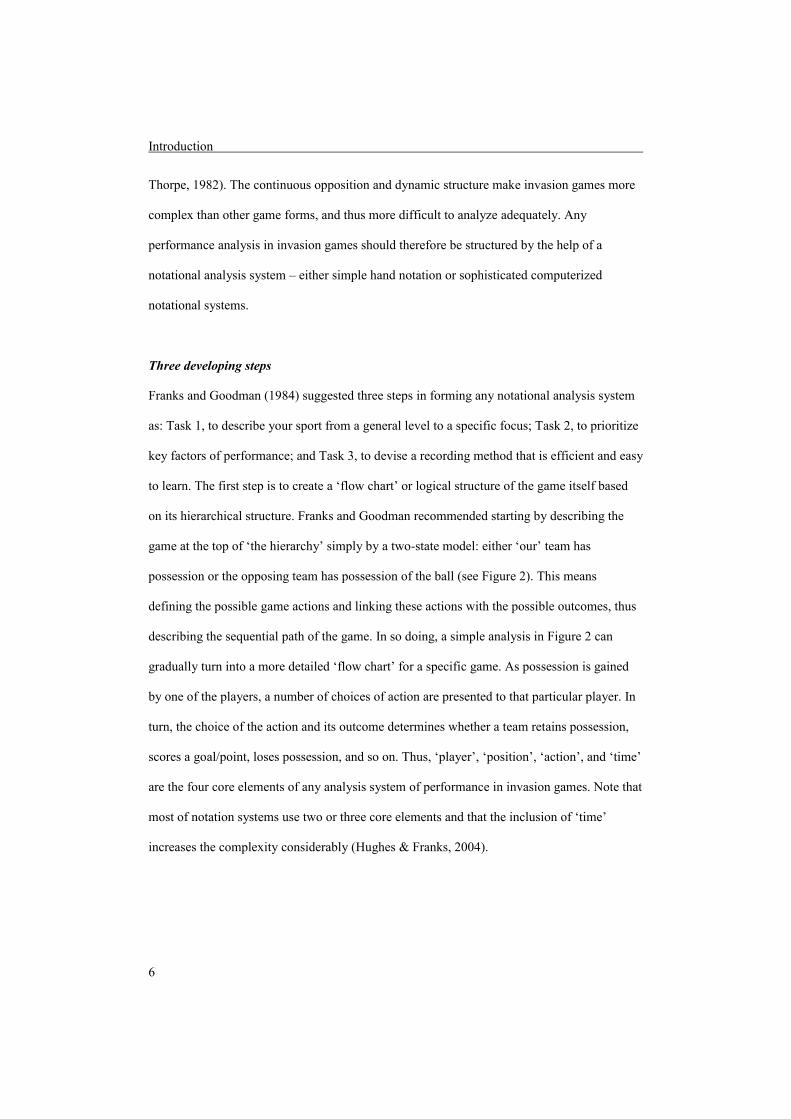
Three developing steps
Franks and Goodman (1984) suggested three steps in forming any notational analysis system
as: Task 1, to describe your sport from a general level to a specific focus; Task 2, to prioritize
key factors of performance; and Task 3, to devise a recording method that is efficient and easy
to learn. The first step is to create a ‘flow chart’ or logical structure of the game itself based
on its hierarchical structure. Franks and Goodman recommended starting by describing the
game at the top of ‘the hierarchy’ simply by a two-state model: either ‘our’ team has
possession or the opposing team has possession of the ball (see Figure 2). This means
defining the possible game actions and linking these actions with the possible outcomes, thus
describing the sequential path of the game. In so doing, a simple analysis in Figure 2 can
gradually turn into a more detailed ‘flow chart’ for a specific game. As possession is gained
by one of the players, a number of choices of action are presented to that particular player. In
turn, the choice of the action and its outcome determines whether a team retains possession,
scores a goal/point, loses possession, and so on. Thus, ‘player’, ‘position’, ‘action’, and ‘time’
are the four core elements of any analysis system of performance in invasion games. Note that
most of notation systems use two or three core elements and that the inclusion of ‘time’
increases the complexity considerably (Hughes & Franks, 2004).

Introduction
7
The second step is to identify a limited set of the priority elements useful in improving
performance. Franks et al. (1983) suggested that three elements, namely coaching philosophy,
primary objectives of the game, and database of past games should be considered when
deciding which information is useful. Of them, Franks et al. argued that a database of past
games is the most important element as it facilitates predictive model development.
BALL POSSESSION
GAINED LOST
Where was it gained/lost?
Specify position.
Who was involved in
gaining/losing possession?
Specify player.
How was it gained/lost?
Specify action.
Figure 2. From Hughes & Franks (2004, p. 109). Hierarchical structure of a model for representing events that take place in a team game such as field hockey, soccer, basketball, water polo. Reproduced with permission from the publisher.
The information about for example when, where and how the defensive pressure was exerted
during decisive periods of match play would seem to be useful when focusing on a defensive
play based on a particular philosophy. On the other hand, the information related to total

Introduction
8
number of team possessions, where possession was lost and won, and by which player, should
be useful if one considers for example ‘keeping possession’ as a primary objective in attack.
The third and final step is to prepare either a manual or a computerized recording method.
Hughes and Franks (1997, 2004) divided different types of data collection system into three
categories as scatter diagrams, frequency tables, and sequential systems. A scatter diagram
usually involves drawing a schematic representation of the playing surface of the analysed
sport and then notating on this the actions of interest at the position in which they took place.
Frequency tables are commonly used to record the frequency of each of the actions by the
players, while sequential systems record the sequence of actions that led up to a critical
performance or event like a penetrative pass or shot at goal.
According to Hughes and Franks (2004), compared to sequential systems, scatter diagrams
and frequency tables are usually relatively simpler and quicker and are most often used for the
analysis of match performance in real time. In contrast, sequential system enables the analyst
to go to far greater depths in interpreting a performance by examining repetitions of patterns.
However, such systems demand as a first step to have a clear idea of what is wanted from
them, i.e. output, in order to simplify the task of defining input and making sense of the mass
of data collected.
Levels of analysis
It is necessary to decide which level of analysis is required since invasion games can be
analysed in different levels (i.e. players, team sub-units, and the whole team). According to
Franks et al. (1983), the primary level ‘team’ analysis incorporates four areas for information
gathering: possession, passing, shooting, and set pieces, where as the ‘player’ analysis can be
Introduction
9
accomplished based on the evaluation of on-the-ball and off-the-ball actions. The
combinations of players within team’s tactical sub-groupings, i.e. team units such as last line
of defenders, midfielders, and strikers in soccer, can be assessed by applying a ‘player’
analysis of individuals making up team units. Moreover, the level of detail in analysis vary
from very simple to more detailed analyses including techniques and tactics used during
match play or even physiological and psychological parameters along side match performance
(for examples of notation systems, see Hughes & Franks, 1997, 2004).
Appraisal of match performance analysis in invasion games
Research on match performance analysis has raised our level of knowledge about technical,
tactical and physical aspects of player and team performance in invasion games. The
methodological approach described above, which has dominated this line of research, has
produced substantial knowledge for coaching feedback (past performance) as well as for
outcome projection and performance optimization (performance profile). This has led
researchers to offer advice to practitioners about different topics of interest such as the
positional demands technically (Taylor, Mellalieu & James, 2004), how to play effectively
(e.g. Reep & Benjamin, 1968; Hughes, 1990; Olsen, Larsen & Semb, 1994; Hughes &
Churchill, 2004) and even how technique and tactical skills can be analysed and trained
(Carling, Williams & Reilly, 2005). However, given the demand of the practical relevance
from this research type, the critical issues of validity and reliability related to conceptual and
methodological shortcomings of the method used need to be addressed.
Validity of analysis method Studies on match performance analysis in invasion games are predominantly based on the
analysis of a team or a player done separately without considering the relationship to the
opposition. Consequently, the validity of data generated from such studies can be questioned.

Introduction
10
This is in line with the analytical framework based on ‘dynamic configurations of play’,
which states: “In a soccer match, structures and configurations of play should be considered
as a whole, rather than examined piece by piece. Systems with many dynamically interacting
elements are capable of rich and varied patterns of behaviour, which are clearly different from
the behaviour of each component considered separately.” (Grehaigne, Bouthier, & David,
1997, p. 140). Indeed, the opposition creates the unexpected in a match, necessitating constant
adaptation to constraints caused by the confrontation between two teams (Elias & Dunning,
1966; Grehaigne et al., 1997). Hence, to be more valid, match performance analysis must
consider the interaction between the two opposing teams (or players).
As the invasion game is played, teams (or players) intermingle and attempt to outscore the
opponent by invading the opponent’s territory. As a result, the four elements: 1) opposition to
opponents, 2) cooperation with partners, 3) attack on the adverse camp, and 4) defense on
one’s own camp are at play at the same time in invasion games (Gréhaigne, Godbout &
Bouthier, 1999). The idea for each player is to ‘cooperate with partners in order to better
oppose the opponents either while attacking (keeping one’s defense in mind) or while
defending (getting ready to attack) (ibid; p. 163). A contextual approach to performance
analysis is therefore necessary in order to understand team’s (or player’s) actions in an
invasion game like soccer. Because a match play situation emerges from the interplay of play
and counter play produced by both teams (Grehaigne et al., 1999; Grehaigne & Godbout,
1995), it enables breaking down of a match play action without losing its confrontational
nature. Consequently, the use a match play situation, a team possession, as the basic unit of
analysis rather than a team isolated from the match context makes it possible to conduct an
assessment of opponent interaction.
Introduction
11
Some researchers argue further that it is difficult if not impossible to have valid data unless
sports performance is considered as a complex dynamic process with self-organising
properties (e.g. McGarry et al., 2002; Perl, 2001, 2002). McGarry and Perl (2004) and Hughes
(2004) present a good overview of such alternative system descriptions for sports contests.
However, so far these potentially useful analysis approaches are mainly either incomplete or
incapable of yielding practical results (Hughes, 2004). As a rare exception, Boronico and
Newbert (2001) managed to employ a methodological approach based on two-party game
theoretic nature and a stochastic dynamic programming to analyse touchdown scoring
probabilities in American football. In addition, studies on perturbations in sports competitions
reported the use of dynamic concepts to identify some aspects of skills that disrupted the
rhythmic flow of match play (McGarry et al., 2002). The identified skills aspects appeared to
be key factors in determining the outcome of a rally in squash (McGarry, Khan, & Franks,
1999) and the creation of a shooting opportunity in soccer (Hughes, Dawkins, Reed & Mills,
1998; Hughes, Langridge, & Dawkins, 2001).
Opponent interaction
Nine studies on match performance analysis in soccer that directly or indirectly consider
opposition relationship in their analyses are available in the literature. A search in
SPORTDiscus for soccer AND quality of opposition OR match status OR score-line yielded
three relevant references. In addition, a survey of papers presented at the first three world
conferences on Science and Football (Reilly, Lees, Davids & Murphy, 1988; Reilly, Clarys &
Stibbe, 1995; Reilly, Bangsbo & Hughes, 1997) (two studies) and published in the
International Journal of Performance analysis in Sport (July 2001 up to November 2008) (2
studies) produced four studies. Also, two studies were found in the reference lists of relevant
articles. For the direct analysis of opposition relationship (opponent interaction), research is

Introduction
12
so far limited to four studies (Grehaigne, 1991; Harris & Reilly, 1988; Seabra & Dantas,
2006; Suzuki & Nishijima, 2004) (Table 1).
Table 1. Studies on match performance analysis in soccer that consider opposition relationship. Reference Sample size Opposition relationship
Taylor et al., 2008 40 matches (20 strong; 20 weak
opposition)
Opposition qualitya; Match statusb
Lago & Martin, 2007 340 observations from 170 matches between league teams of different quality
Opposition quality; Match status
Seabra & Dantas, 2006 112 shot situations from 7 matches
Opponent interactionc
Bloomfield et al., 2005 22 team performances (7 Arsenal; 8 Chelsea; 7 Man. United)
Match status
Jones et al., 2004 3544 team possessions from 24 matches (12 successful; 12 unsuccessful teams)
Opposition quality; Match status
Suzuki & Nishijima, 2004 439 defending performances from one match
Opponent interaction
Olsen & Larsen, 1997 28 counter attacks (25 scoring chances; 3 goals) from 14 matches
Indirect opponent interactiond
Grehaigne, 1991 36 goals from 14 matches Opponent interaction
Harris & Reilly, 1988 180 randomly selected shot and non-shot attacks from 24 matches
Opponent interaction
aAnalysis of team’s performance according to the quality of opposing team (i.e. strong and weak). bAnalysis of team’s performance according to ongoing status of the match (i.e. winning, drawing and losing). cSimultaneous analysis of offensive and defensive performances (i.e. in relation to each other) within a match play situation. dAnalysis of offensive performance in relation to defensive performance analysed indirectly (i.e. by observing opponent’s degree of control over the ball prior to ball winning). Harris and Reilly (1988) showed that defence against attacks with a shot on target, compared
to the ones without a shot, tended to involve higher attacker to defender ratios and greater
average distances between the attacker in possession and the nearest defender throughout the
attack. According to Grehaigne (1991), the overall attacking configuration with adequate
space and time against an opponent’s defence which is out of balance had a positive effect on
goal-scoring in 10 out of 33 goals. Elsewhere, it was reported that the defending
Introduction
13
performances, directly measured through distances and angles between attackers and
defenders and the number of players, were related to delaying and diverting attacks, and
covering attacking space (Suzuki & Nishijima, 2004). Seabra and Dantas (2006) reported a
higher proportion of successful shooting attempts for ball receptions and shots originating
from zones of low defensive confrontation than high defensive confrontation.
Moreover, though indirectly, Olsen and Larsen (1997) showed more scoring opportunities and
goals in counter attacks started when the opponent defence was imbalanced rather than
balanced. Similarly, Bloomfield, Polman and O’Donoghue (2005), Jones, James and
Mellalieu (2004), Lago and Martin (2007) and Taylor et al. (2008) reported the influence of
match status and opposition quality on ball possession and frequency of technical behaviours.
In sum, these studies report promising effects of considering opposition relationship to better
understand match performance in soccer. However, only one opponent interaction study
(Suzuki & Nishijima, 2004) has used a multivariate analysis approach. Three studies did not
use any statistical method to compare sets of data (Bloomfield et al., 2005; Grehaigne, 1991;
Olsen & Larsen, 1997), while the remaining studies employed univariate data analyses. In
addition, most of these studies have small sample sizes, making the study power too low to
obtain significant results. Thus, the research on opposition relationship for match performance
analysis in soccer is limited, both in terms of methodological quality and the number of
studies available.
Multidimensional qualitative evaluation
The vast majority of studies on match performance analysis in soccer use unidimensional
quantitative data (frequency or counts of match play events) (e.g. Hughes & Churchill, 2004;

Introduction
14
Hughes & Snook, 2006; James, Mellalieu, & Hollely, 2002; Jones et al., 2004; Konstadinidou
& Tsigilis, 2005; Taylor, Mellalieu, & James, 2004, 2005; Tucker, Mellalieu, James &
Taylor, 2005). However, match performance analysis should include dimensions of
performance involved in the opponent interaction to be more valid. These include temporal
and spatial dimensions of match performance, whose direct measurements are difficult to
obtain. It is not easy to quantify all analysis variables of match performance in soccer,
especially the important ones (Olsen & Larsen, 1997). As categorical data based on
multidimensional qualitative evaluation permit the inclusion of data from the qualitative
evaluation of different dimensions of match performance, their use instead of unidimensional
frequency data may improve our ability to describe a soccer match play action (Grehaigne et
al., 2001; Hughes & Bartlett, 2002; Suzuki & Nishijima, 2004).
For example, a variable such as “team possession type” could be used in an attempt to
describe the two traditionally opposing offensive strategies, namely counter attack (“direct
play”) and elaborate attack (“possession play”) by using categories indicating the degree of
offensive directness. Similarly, a variable “defensive pressure”, could be used to describe
degrees of loose pressure to tight pressure in defensive balance, possibly through ordered
categories of estimated pressing distances. Likewise, ordered categories indicating the number
of touches per ball involvement could be used to describe degrees of high tempo to low tempo
of play.
Reliability of analysis method The fact that data variability limits the ability to detect a true difference between
performances (Atkinson & Nevill, 1998; Hughes, Cooper, & Nevill, 2004; O’Donoghue,
2007) makes adequate reliability vital for match performance analysis to be a valid method.

Introduction
15
Hughes and Franks (1997, 2004) maintain that it is very important to test any new analysis
system and ensure adequate reliability (objectivity and accuracy) of the collected data.
However, reliability studies reported previously on match performance analysis in soccer are
mainly small with significant methodological limitations. An appropriate demonstration of the
reliability must therefore consider relevant testing factors and include adequate data.
Reliability testing factors
Many previous studies on soccer match performance provide inadequate and unclear
information concerning the reliability testing procedures, e.g. use of only intraobserver tests
(e.g. Hughes & Snook, 2006) or not specifying whether intraobserver or interobserver tests
was used (Hughes & Churchill, 2004). Also, the type of statistical method used (e.g.
Konstadinidou & Tsigilis, 2005) or whether all variables were tested as used in the subsequent
analysis (e.g. Seabra & Dantas, 2006) is not always reported. In support, Hughes et al.
(2004a) found earlier that 70% of 67 studies on performance analysis in sports generally did
not report any reliability study and a large proportion of the remaining used questionable
statistical tests. The fact that all these studies include reliability tests only as a part of the main
study may also contribute to the lack of important details evident in the reported reliability.
Other factors that may affect reliability test results include inadequate analysis training,
inaccurate operational definitions and nature of analysis variables used. This is more so in
cases of the complex analysis systems with many and diverse multidimensional categorical
variables. In agreement, James, Taylor and Stanley (2007) argue that the disparity between
two observers is to be expected, especially when the analysis system involves considerable
skill and experience.
Introduction
16
The extent of difference in interobserver data may reflect the considerable experience
difference between the two observers. James, Mellalieu and Hollely (2002) suggest that the
variation between experienced and inexperienced observers found in their study was due to
the relative lack of analysis training rather than inaccurate operational definitions. In their
study, the experienced observer exhibited a 99% agreement for intra-observer reliability. For
inter-observer reliability the two inexperienced observers registered relatively low (3%) and
high (8%) levels of definition errors and observational errors, respectively. This suggests that
the time they used to train observers was inadequate, while the applied operational definitions
were clear and easy to use.
In support, O’Donoghue (2007) argues that precise operational definitions do not guarantee
good reliability and that good knowledge of the behaviours being analysed is more important
than agreement of the wording of operational definitions. However, for variables involving
temporal and spatial dimensions of match performance without direct measurements,
achieving precise operational definitions must be difficult.
Some observations seem to be naturally more difficult to make without errors than others
(James et al., 2007) and it is then logical to have different levels of reproducibility for
different variables (Hughes et al., 2004a). The lower reliability for variables involving more
qualitative evaluation than those involving less or no qualitative evaluation is to be expected
due to more observational difficulties experienced in their analysis. Indeed, variables
involving identification of pitch areas (pitch-area variables) were found to have lower
reliability compared to variables of on-the-ball events (technical variables). Tucker et al.
(2005) and Taylor et al. (2005) report errors of <5% for technical variables, whereas the more
qualitatively evaluated pitch-area variables recorded acceptable larger errors of <10% due to
Introduction
17
the identification difficulties. Similarly, Hughes and Snook (2006) report that effort was
needed to upgrade the reliability of pitch-area variables to <10% error limit.
Sample size estimation needed
The sizes of sample used in 15 studies that report reliability results on match performance
analysis in soccer found in the literature vary considerably: from not reported at all (6 studies)
to between a 15-minute period and six full matches (nine studies). Further, all these studies
fail to account for how they estimated sample size for their reliability studies (e.g. Bloomfield
et al., 2005; Hughes et al., 1998; Hughes & Reed, 2005; Luhtanen, Belinskij, Hayrinen &
Vanttinen, 2001; Scoulding, James & Taylor, 2004; Seabra & Dantas, 2006; Suzuki &
Nishijima, 2004). This is important, because during a match play action some events naturally
occur either more or less frequently than others and, therefore, different analysis variables
often demand different sizes to make an adequate sample (Cooper, Hughes, O’Donoghue &
Nevill, 2007).
Based on this, in paper I we attempted to develop a more valid method for team match
performance analysis in soccer by assessing opponent interaction using categorical data based
on multidimensional qualitative evaluation and test its reliability from videotapes.
Match performance in soccer
Historical perspectives of playing style The game of soccer has developed gradually from a game of running with the ball and
dribbling without clear playing positions and roles to the game we know today. To a certain
extent, this is connected to changes in the rules of the game, in particular the off-side rule. But
Introduction
18
mainly it is the result of a dialectic process where the need to win has driven the development
forward (Holm, Olsen, Larsen & Natvig, 1998).
Attempts to identify and describe different playing styles and the reported styles are many and
diverse. Considering the different ways in which soccer has developed throughout the world,
the range of climates in which it is played and the varying temperaments associated with
individual nations (Yamanaka, Hughes, & Lott, 1993), this diversity is not so surprising. It
appears that styles of play are unique to areas of the globe and therefore represent particular
groups of nations. Bangsbo and Peitersen (1997), for example, identified five different styles,
namely Latin (or continental), British, Norwegian, South-American, and African.
However, many of these descriptions of different playing styles are based on subjective
assessment, the basic approach being to give general statements of how individual players and
teams perform without objective data and even using alleged national stereotypes. Stereotypes
such as Brazilian samba-football, Dutch total-football, English energy-football, German
machine-football, and Norwegian computer-football are more or less used, not only by soccer
fans but also in the media and football literature world-wide (Goksøyr, Larsen, & Peterson,
1997). As seen here, specific soccer nations, especially those that once dominated the world
of soccer at some point in history, are used in characterizing different styles of play. In
addition, far more attention was paid to the attacking aspect of the game to the extent of
treating attacking styles as if they were interchangeable with playing styles. Hence, these
subjective and biased descriptions only give general impression of the styles of play used and
are clearly less informative.

Introduction
19
Using a scientific approach to match performance analysis, Olsen et al. (1994) described
different styles of play in attack and defence based on the different emphasis given to the
quality of ‘ball possession’ and ‘defensive organisation’, respectively. Specifically, they
identified two opposing styles in attack, namely penetrative approach (direct play), in which
teams emphasize playing forward and therefore risking losing the ball, versus elaborate
approach (possession play), in which often teams prefer to retain the ball within the team. In
defence, two opposing defensive organisations were reported: players positioning in relation
to the opponent players (man-oriented) or in relation to their team mates (zone-oriented).
Two models describing a continuum between ‘direct play’ and ‘possession play’ for styles of
play in attack and between ‘man-oriented’ and ‘zone-oriented’ for styles of play in defence
were proposed (Olsen et al., 1994). According to these models, most styles of play often
consist of a variant in the combination of both zone- and man-oriented in defence or direct
and possession play in attack and that only few teams employ the extreme forms of these
styles. For example, traditionally, teams in Germany use an extreme form of ‘man oriented’
defence, while ‘zone oriented’ defence with very limited marking is practiced in Norwegian
soccer. Similarly, teams from South America are known for their extreme form of ‘possession
play’, while British teams traditionally are more direct.
Interestingly, however, some striking similarities have been observed in the development of
styles of play in modern soccer. Goksøyr et al. (1997) wrote that: “The closer one gets to
today, the more similar are the playing styles or patterns of play utilized by the footballing
nations”. Based on the observation of the 1994 World Cup final matches, Mason (1995)
supported this view by reporting that the footballing dichotomy of styles, South American
versus European, no longer existed and that all teams played in a similar fashion with

Introduction
20
teamwork and organisation being paramount. It looks like the styles of play used by the
successful soccer nations and teams over long periods of time have set trends to be followed
by others. This may indicate that over the years modern coaching became increasingly
influential than inherited soccer traditions.
In this thesis, the terms ‘counter attack’ and ‘elaborate attack’, indicated by different degrees
of offensive directness are used to describe styles of attack in Norwegian elite soccer. For
describing styles of defence, ‘balanced defence’ and ‘imbalanced defence’ indicating different
degrees of defensive balance for zone-oriented defence are used.
The principles of play Two closely related theoretical frameworks (principles of play) have been used to systematize
the knowledge of the soccer game as a relationship between space and time. These are
Worthington’s (1980) and Olsen’s (1981) model for the principles of play. These models
resulted from the revision of the original model for the principles of play constructed by Wade
in 1967.
Worthington’s model for the principles of play
Figure 3 presents a model, first presented by Worthington in 1975, explaining soccer players’
functional roles (Worthington, 1980). The lack of practical appeal from the original model
developed by Wade (1967) is thought to be the reason behind the development of this model.
The practical strength of this model lies in the simple idea of using only six playing roles, i.e.
three each in attack (first, second and third attacker) and defence (first, second and third
defender), to provide a practical understanding of the principles of play. In this model, the
roles of first attacker, second attacker, and third attacker are linked with respective principles
of penetration, offensive depth, and mobility (movement). On the other hand, the roles of first
Introduction
21
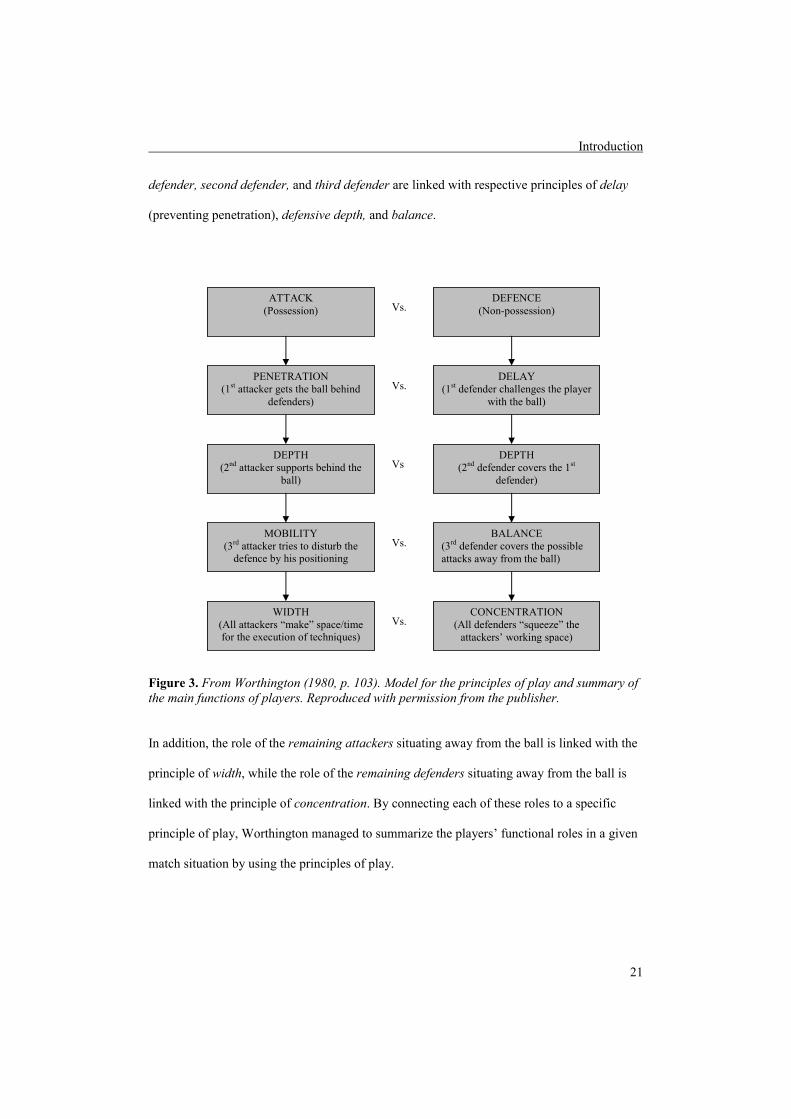
defender, second defender, and third defender are linked with respective principles of delay
(preventing penetration), defensive depth, and balance.
Figure 3. From Worthington (1980, p. 103). Model for the principles of play and summary of the main functions of players. Reproduced with permission from the publisher.
In addition, the role of the remaining attackers situating away from the ball is linked with the
principle of width, while the role of the remaining defenders situating away from the ball is
linked with the principle of concentration. By connecting each of these roles to a specific
principle of play, Worthington managed to summarize the players’ functional roles in a given
match situation by using the principles of play.
ATTACK (Possession)
PENETRATION (1st attacker gets the ball behind
defenders)
DEPTH (2nd attacker supports behind the
ball)
MOBILITY (3rd attacker tries to disturb the
defence by his positioning
WIDTH (All attackers “make” space/time for the execution of techniques)
DEFENCE (Non-possession)
DELAY (1st defender challenges the player
with the ball)
DEPTH (2nd defender covers the 1st
defender)
BALANCE (3rd defender covers the possible attacks away from the ball)
CONCENTRATION (All defenders “squeeze” the
attackers’ working space)
Vs.
Vs.
Vs
Vs.
Vs.

Introduction
22
Olsen’s model for the principles of play
In contrast to Worthington’s model presented above, a model explaining the structure of the
soccer game was revised by Olsen in 1981 (Figure 4).
Figure 4. From Olsen et al. (1994, p. 10). Model for the principles of play. Reproduced and translated with permission from the publisher.
The Olsen model divides the game into two: attack and defence. A team with possession of
the ball is considered attacking, and the one without possession of the ball is defending.
However, the reality of the game also produces many situations where one cannot tell with
certainty whether a team is in attack or defence. Such situations, for example when the ball is
high up in the air or in tight duels, are represented in the model by the continuum of different
degrees of ball possession from attack (total ball possession) to defence (no ball possession).
Moreover, the model accommodates both objectives of the game and four complementary
principles of attack and defence. This means that for each principle of attack there is a
corresponding principle of defence.
GOAL SCORING WINNING THE BALL
PREVENTING GOAL SCORING
ATTACK DEFENCE
PENETRATION PREVENTING PENETRATION
DEPTH WIDTH MOVEMENT
DEPTH CONCENTRATION BALANCE
Create/ utilize space
Prevent space
Introduction
23
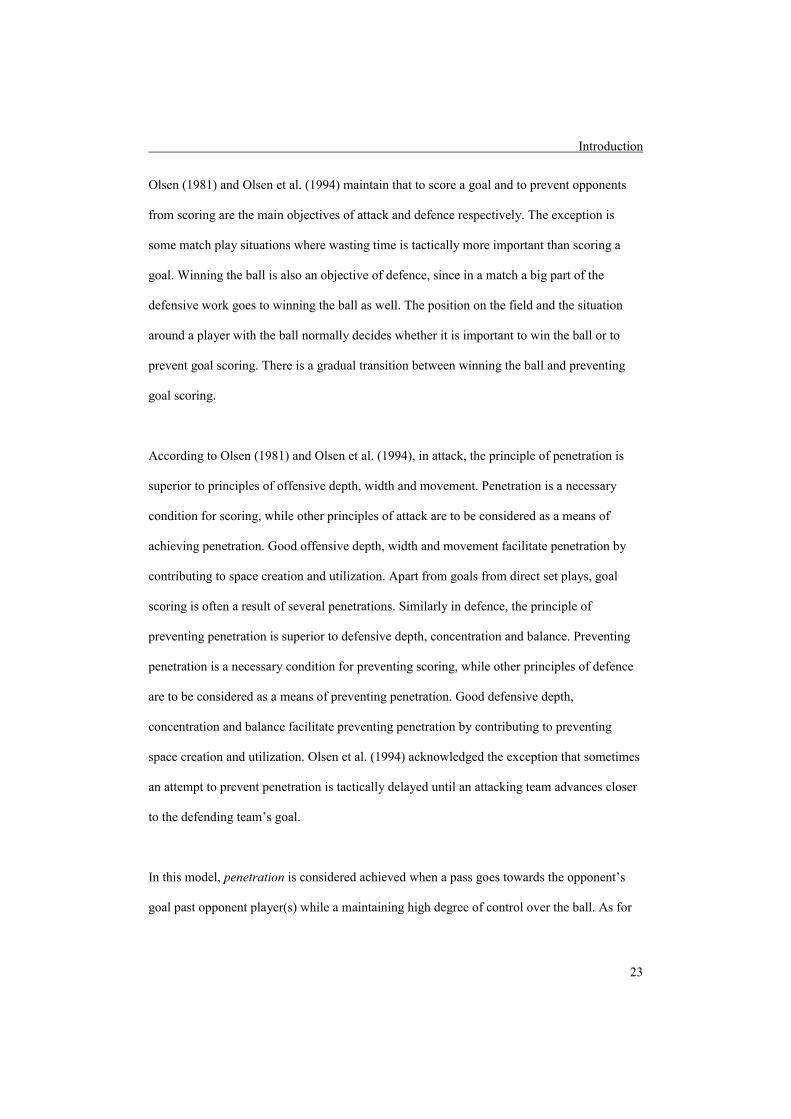
Olsen (1981) and Olsen et al. (1994) maintain that to score a goal and to prevent opponents
from scoring are the main objectives of attack and defence respectively. The exception is
some match play situations where wasting time is tactically more important than scoring a
goal. Winning the ball is also an objective of defence, since in a match a big part of the
defensive work goes to winning the ball as well. The position on the field and the situation
around a player with the ball normally decides whether it is important to win the ball or to
prevent goal scoring. There is a gradual transition between winning the ball and preventing
goal scoring.
According to Olsen (1981) and Olsen et al. (1994), in attack, the principle of penetration is
superior to principles of offensive depth, width and movement. Penetration is a necessary
condition for scoring, while other principles of attack are to be considered as a means of
achieving penetration. Good offensive depth, width and movement facilitate penetration by
contributing to space creation and utilization. Apart from goals from direct set plays, goal
scoring is often a result of several penetrations. Similarly in defence, the principle of
preventing penetration is superior to defensive depth, concentration and balance. Preventing
penetration is a necessary condition for preventing scoring, while other principles of defence
are to be considered as a means of preventing penetration. Good defensive depth,
concentration and balance facilitate preventing penetration by contributing to preventing
space creation and utilization. Olsen et al. (1994) acknowledged the exception that sometimes
an attempt to prevent penetration is tactically delayed until an attacking team advances closer
to the defending team’s goal.
In this model, penetration is considered achieved when a pass goes towards the opponent’s
goal past opponent player(s) while a maintaining high degree of control over the ball. As for

Introduction
24
the principles of offensive depth and defensive depth, the relationship to space along the
playing field is an essential element in their interpretation. Practically, this means offensive
and defensive organization of other team players in relation to a player with the ball. Further,
Olsen et al. (1994) explain that good offensive depth is achieved when players in the attacking
team place themselves in positions such that a player with the ball has as many passing
alternatives as possible. Whether or not to prioritize the space in front, on the side or behind a
player with the ball, depends first and foremost on the environment around a player with the
ball, i.e. how closely a player with the ball is pressured by the nearest opponent(s). In defence,
depth involves the distance between team components (defenders, midfielders and strikers), as
well as the distance between the pressing player (first defender) and the backup player
(second defender). Good defensive depth is achieved when those distances are neither too big
nor too small to accomplish the defensive duties successfully.
Likewise, the principles of width and concentration are interpreted as the relationship to space
but this time across rather than along the playing field. Olsen (1981) and Olsen et al. (1994)
further write that good width is achieved when players in the attacking team make defending
players assume positions which leave big distances between each other. This creates space for
the attacking players to exploit. Practically, width can be utilized by long cross passes towards
players on the flanks or by simply overlapping technique, which often involves players from
side back or midfield positions. Good concentration, on the other hand, is achieved when
players of the defending team move more towards a player with the ball. This creates
compactness at the point of attack – a condition which guarantees defensive support to a
pressing defending player. The level of concentration depends first and foremost on whether
man-oriented or zone-oriented style of defence is used. Extreme forms of man-oriented

Introduction
25
defence often, but not always, allow little concentration, while concentration is a central part
of zone oriented defensive operations.
Finally, the principles of movement and balance refer to the collective organization of all
players in respective attacking and defending teams. Olsen et al. (1994) explain that good
movement is considered as a precondition for good offensive play, while good balance is a
precondition for good defensive play. Good movement includes qualities of movement
‘when’ and ‘how’ in addition to movement ‘where’ presented above in connection with the
principles of offensive depth (movement along the playing field) and width (movement across
the playing field). Movement ‘where’ and ‘when’ are the aspects of the principle of
movement most focused upon in the direct play style of attack, while possession play put
more emphasis on movement ‘how’. This is due to the fact that speed and strength elements
of play (direct play) demands timing of forward movements, while technique and refinement
(possession play) call for a constant need to create space. On the other side, good balance is
achieved when the three defensive tasks (pressure by 1st defender, backup by 2nd defender,
and cover by 3rd defender) are well attended (for players’ functional roles, see Worthington’s
model for the principles of play above). This requires a sufficient number of defending
players on the right side of the ball, i.e. numerical balance. Often this means the same number
of defending as attacking players in a given situation. However, numerical balance alone is
not enough if defending players are positioned incorrectly. Numerical balance must therefore
be supplemented with positional balance. Olsen et al. (1994) noted that it is more about a
gradual change from poor to good balance rather than a distinct difference between imbalance
and balance. The actual players positioning for good balance differ according to whether man-
oriented or zone-oriented style of defence is employed. According to Olsen et al. (1994), in
zone-oriented defence, useful balance can still be achieved even when defenders are
Introduction
26
outnumbered provided that all positions in the last line of defence, i.e. the four rearmost
players, are intact.
Hence, the fact that Worthington’s and Olsen’s models use the same principles of play makes
them natural supplements to each other. The structural and functional understanding of the
soccer game provided by these models enable the description of match play in this thesis to
involve multidimensional categorical variables with different dimensions of match
performance. These include temporal and spatial dimensions, whose direct measurements are
normally difficult to obtain.
Playing effectiveness Research on playing effectiveness concentrates mainly on how goals are scored and
comparisons between successful and unsuccessful teams. The question whether ‘possession
play’ or ‘direct play’ is more effective in goal scoring has long been disputed in the soccer
community, including among match performance researchers (e.g. Bate, 1988; Hughes &
Franks, 2005; Hughes, Robertson, & Nicholson, 1988; Olsen & Larsen, 1997; Reep &
Benjamin, 1968).
Literature shows mixed findings, with studies supporting either ‘possession play’ (e.g.
Hughes et al., 1988; Hughes & Churchill, 2004; Hughes & Franks, 2005; Hughes & Snook,
2006) or ‘direct play’ (e.g. Bate, 1988; Hughes, 1990; Olsen & Larsen, 1997; Reep &
Benjamin, 1968) as a more effective playing style.
The original work of Reep and Benjamin (1968) is considered to be a landmark in match
performance analysis in soccer (Hughes & Franks, 1997, 2004). This research was based on

Introduction
27
the analysis of data collected from 3213 matches played between 1953 and 1968. These data
on goal scoring and the length of passing sequences were analysed statistically and appeared
to follow a probability structure. Two main findings from this research include: first,
approximately 80% of goals resulted from a sequence of three passes or less and second, a
goal is scored in every 10 shots. These findings have been reconfirmed by several different
studies (e.g. Bate, 1988; Franks, 1988; Hughes, 1990).
In short, Reep and his colleague showed that a successful style of play can be built by
maximizing the “chance” elements of the game (Reep & Benjamin, 1968). For example, Bate
(1988) concluded that to increase the number of scoring opportunities a team should play the
ball forward as often as possible, reduce square and back passes to a minimum, increase the
number of long passes forward and forward runs with the ball, and play the ball into forward
space as often as possible. Indeed, the adoption of these recommendations by some soccer
managers in England has been responsible for what has come to be known as the ‘direct play’
style of attack (Franks & McGarry, 1996). However, McGarry and Franks (2003) maintain
that the nature of the good association between successful match performance and the direct
style of play is still not well understood.
Furthermore, team possessions originating from the final third of the playing field were found
to be effective in goal scoring (Bate, 1988; Hughes, 1990; Hughes & Snook, 2006). Bate
(1988), for example, reported 50 to 60 per cent of all possessions leading to shot on goal
originated in the attacking third. This finding favoured the approach of direct play as this
tactic is expected to decrease the likelihood of a team losing possession in the defending third
of the field.
Introduction
28
In contrast, Hughes et al. (1988) found that successful teams used more touches per
possession than unsuccessful teams in the 1986 World Cup finals. Similarly, the analysis of
playing patterns in the 2001 Copa America showed that successful teams kept the ball for
longer durations and created shots after possessions lasting more than 20 seconds frequently
than unsuccessful teams (Hughes & Churchill, 2004). In support, more recent studies by
Hughes and Franks (2005) and Hughes and Hook (2006) found more goals scored from
longer passing sequences than from shorter passing sequences. But, interestingly, the same
analyses yielded results in favour of the short passing sequences when analyses were done
without considering total frequency of the respective lengths of passing sequences. These
researchers demonstrated that the longer the passing sequences the lower the frequency of
their occurrence. Therefore, they argued that studies supporting ‘direct play’ incorrectly found
more shots produced by shorter passing sequences than by longer passing sequences.
However, apart from Olsen and Larsen (1997), all remaining previous studies use frequency
or counts of passes (unidimensional quantitative data) to describe ‘possession play’ and
‘direct play’. As a result, in their analyses, short possession (few passes) and long possession
(many passes) were treated interchangeably with direct play and possession play,
respectively. This may be inappropriate because counting the number of passes excludes other
essential features in the analysis of these styles of attack (Franks, 1988; Olsen et al., 1994).
We think that differences between these two opposing styles of play in attack can be better
described as differences in emphasis given to the four principles of play in attack, namely
penetration, movement, offensive depth, and width (Figure 3 & 4). In other words, our
description involves different dimensions of match performance.

Introduction
29
According to Olsen (1981) and Olsen et al. (1994), ‘direct play’ uses a penetrative approach,
which tends to attack the opponent’s goal directly by using forward passes and dribbles once
possession of the ball has been won. In contrast, ‘possession play’ uses an elaborate approach,
often prefering safe passes and dribbles either backwards or sideways. From the principle of
movement, ‘direct play’, compared to ‘possession play’, encourages more initiative runs
forwards at top speed when attacking. Consequently, playing directly implies a relatively high
defensive risk of losing the ball when many team mates are on the way forwards.
Based on the principle of depth, ‘direct play’ often emphasizes long passes towards the
forward space available, preferably behind the last line of defence. In contrast, ‘possession
play’ often concentrates on spaces in the vicinity of the ball and therefore builds most of their
attacks by using short passes. Lastly, the principle of width is often prioritized in ‘possession
play’ but not in ‘direct play’. This is because the primary objective of playing directly is to
utilize the degree of imbalance in the opponent’s defence. Consequently, utilizing width may
delay the attacking momentum and hence lead to losing opportunity to penetrate.
Hence, the analysis of playing tactics’ effectiveness that include assessment of the interaction
between the two opposing teams using multidimensional qualitative evaluation represent a
different approach which has not been used previously. In papers II, III & IV the effects of
playing tactics on playing effectiveness were examined by assessing opponent interaction
using multidimensional categorical data.
Multivariate statistical approach needed Studies indicate that playing tactics such as team possession type, starting zone, pass length,
space utilization and defensive pressure may influence match performance in soccer.
Introduction
30
However, there is little scientific evidence from well-performed studies to determine which of
these tactical factors, and even less on which combination of factors, can explain match
performance in soccer. Most studies have used a univariate approach to compare a single
tactical factor between successful and unsuccessful groups of performances. Because of the
complexity of soccer match performance analysis and possible interaction of multiple tactical
factors, a multivariate statistical approach needs to be used to study potential tactical factors
and their interaction. In addition, it is essential to have adequate sample size for a meaningful
analysis of match performance to be possible. Yet there has been little statistical basis to
quantify the number of performances needed for meaningful analyses in previous match
performance research (Hughes, Evans, & Wells, 2004), and most studies seem to be too small
to detect small associations. This includes studies that assess opponent interaction in their
analyses (see Table 1). Consequently, the conclusions drawn from such studies may be
questioned.
Home advantage in team ball sports ‘Home advantage’ is a consistent finding. Sports teams in balanced competitions achieve
better results when playing at home than away from home (Carron et al., 2005; Nevill &
Holder, 1999). This phenomenon is well documented and exists in all professional team ball
sports, but is most pronounced in soccer (Pollard, 1986, 2006). According to literature review
by Nevill and Holder (1999), the mean home winning percentages (HWP) for decided games
(i.e. drawn games excluded) prior to 1999 were: baseball, 54.3%; American football, 57.3%;
ice hockey, 61.2%; basketball, 64.4%; and soccer, 68.3%. However, while there is consensus
about the facts of its existence, the causes of home advantage are far from fully understood.
Introduction
31
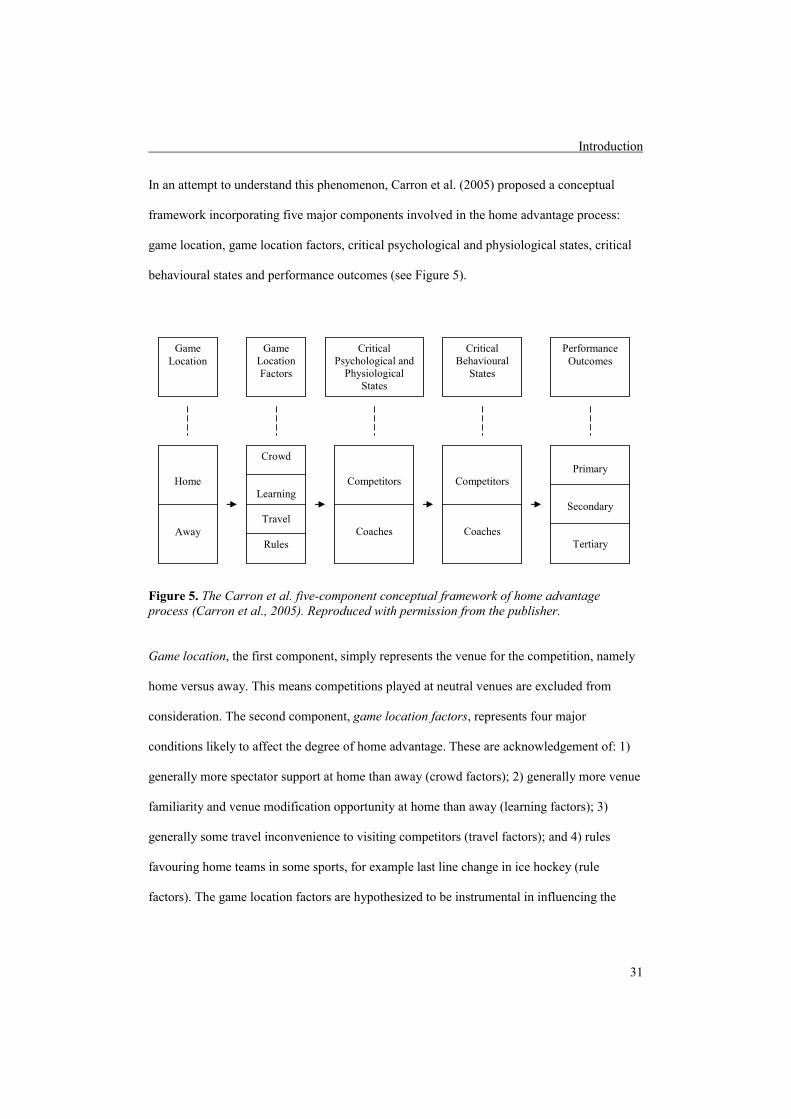
In an attempt to understand this phenomenon, Carron et al. (2005) proposed a conceptual
framework incorporating five major components involved in the home advantage process:
game location, game location factors, critical psychological and physiological states, critical
behavioural states and performance outcomes (see Figure 5).
Figure 5. The Carron et al. five-component conceptual framework of home advantage process (Carron et al., 2005). Reproduced with permission from the publisher.
Game location, the first component, simply represents the venue for the competition, namely
home versus away. This means competitions played at neutral venues are excluded from
consideration. The second component, game location factors, represents four major
conditions likely to affect the degree of home advantage. These are acknowledgement of: 1)
generally more spectator support at home than away (crowd factors); 2) generally more venue
familiarity and venue modification opportunity at home than away (learning factors); 3)
generally some travel inconvenience to visiting competitors (travel factors); and 4) rules
favouring home teams in some sports, for example last line change in ice hockey (rule
factors). The game location factors are hypothesized to be instrumental in influencing the
Game Location
Game Location Factors
Critical Psychological and
Physiological States
Critical Behavioural
States
Performance Outcomes
Home
Away
Crowd
Learning
Travel
Rules
Competitors
Coaches
Competitors
Coaches
Primary
Secondary
Tertiary

Introduction
32
psychological as well as physiological variations (critical psychological and physiological
states) in competitors and coaches.
On the other hand, behavioural variations (critical behavioural states) in competitors and
coaches are assumed to be influenced, first by the game location factors and then by the
psychological and physiological states. Finally, in the fifth component, the model suggests
that game location can influence performance outcomes at three levels: 1) the fundamental
skill execution such as free throw percentage in basketball (primary level); 2) the scoring
aspect of performance, for example goal scoring in soccer (secondary level); and 3) the
traditional outcome measure like win, lose or draw (tertiary level). Specifically, in this
conceptual model, game location (home vs. away) is assumed to be directly related to a
number of game location factors, which, in turn, are hypothesized to differentially affect the
psychological and physiological states, behaviours and, ultimately, performance of
competitors and coaches.
Most of the research based on this model has been devoted to gathering evidence relevant to
one or more of the proposed game location factors and critical states (Carron et al., 2005).
However, the static linear relationships suggested by this model do not seem capable of
adequately capturing the complexity of what is likely to be a dynamic construct. Indeed,
research continues to illustrate the complexity of the phenomenon home advantage. For
example, studies indicating several possible moderators of the extent of the home advantage
in sport have been reported. Balmer, Nevill and Williams (2001) reported method-related
moderating effect when measuring performance for different events in the Winter Olympic
Games (1908-1998). Balmer et al. found a greater home advantage in judged events (e.g.
figure skating) than in more objectively determined events (e.g. short-track speed skating).
Introduction
33
Further, a first game in a season (event characterized by ritual and festivity) was reported to
moderate home advantage upwards in major league baseball (Ward, Jr., 1998). Also, the
moderating effect due to variation in team-specific home advantage was reported in the
National Hockey League (Bray, 1999) and in English soccer (Clarke & Norman, 1995).
According to these studies, 37.7% of the hockey teams won fewer than 50% of their home
matches (i.e. showed no home advantage) in the period 1974 to 1993, while 14% of soccer
teams in any given year in any one division had a negative home advantage. From an overall
perspective, the home advantage appears to be universal across all types of sports. However,
these examples indicate that home advantage is not universal across all teams in those sports
and that its causes are likely to vary from sport to sport and even team to team.
In soccer, despite much research on factors such as crowd effect and referee bias (e.g.
Downward & Jones, 2007; Nevill, Balmer, & Williams, 2002; Nevill, Newell, & Gale, 1996;
R. H. Boyko, A. R. Boyko & M. G. Boyko, 2007; Sutter & Kocher, 2004), and familiarity and
travel fatigue (e.g. Brown et al., 2002; Clarke & Norman, 1995; Pollard, 1986; R. Pollard &
G. Pollard, 2005), results have so far failed to isolate a dominant factor explaining the home
advantage.
In their theoretical framework (Figure 5), Carron et al. proposed that critical behaviours such
as strategic and tactical decisions have to be influenced for game location to have impact on
performance. Also, special playing tactics have been recognized by Pollard (1986, 2006) as
one of many inter-related factors associated with home advantage in soccer. Nevertheless,
very few studies of sport in general (e.g. Dennis & Carron, 1999) and soccer in particular (e.g.
Lago & Martin, 2007; Tucker et al., 2005) have considered how playing at home versus away

Introduction
34
influences the tactical aspects of match performance. In addition, none of them has considered
an assessment of opponent interaction in their analyses. In paper IV we have therefore
attempted to examine the effect of match location on playing tactics for goal scoring by
assessing opponent interaction.
Measuring offensive effectiveness Goal scoring is the ultimate objective measure of offensive effectiveness in soccer match play
and has been extensively used in match performance research (e.g. Bate, 1988; Grehaigne,
1991; Hughes, 1990; Hughes & Franks, 2005; Pollard & Reep, 1997; Reep & Benjamin,
1968). However, goals naturally provide few data points per match and, consequently, large
samples of matches/team possessions are needed for meaningful analyses. Pollard and Reep
(1997) registered a 0.8% scoring probability as they observed only 47 goals out of about 6000
team possessions recorded from the international matches in the 1986 World Cup finals. Also,
it has been reported earlier that each team performs approximately 200 team possessions on
average in a single match and that successful teams (league champions) normally scored an
average of two to three goals per match (Franks, 1988), producing a scoring probability value
of about 1%.
This fact of low scoring probability makes it less feasible to use appropriate study designs
which include an adequate sample size of randomly selected team possessions leading to
goals. Alternatively, the broader measures of offensive effectiveness such as scoring
opportunity (e.g. Olsen & Larsen, 1997), shot at goal (e.g. Harris & Reilly, 1988; Hughes &
Snook, 2006; Pollard, 1986), and entry into final third (e.g. Bate, 1988) have been proposed
and used. These broader measures have the potential to generate useful variables for real-time
match analysis. Moreover, the use of such broader measures may enable soccer practitioners

Introduction
35
to objectively see behind single match results, which are often influenced by chance.
However, the relative ability of these broader measures to explain goal scoring over a series
of matches has not been examined. In paper V we have attempted to investigate the
association between broader measures (scoring opportunity and score box possession) and the
ultimate measure (goal scored) of offensive effectiveness.

Aims of the dissertation
36
Aims of the dissertation
”Every match is a contradiction, being at once both highly predictable and highly
unpredictable.” (Morris, 1981). “How indeed do we measure and mathematically foresee
what has been referred to by Merleau-Ponty as a speaking body?” (Dufour, 1993, p. 166).
The general aim of this dissertation was to develop, test reliability, and apply a new and more
valid method for team match performance analysis in soccer, which includes an assessment of
opponent interaction by using multidimensional categorical data.
Five specific main research questions were asked:
1. How reliable is the new method? (Paper I).
2. How does opponent interaction affect the probability for achieving score box
possession (shooting opportunity) by counter attacks compared to elaborate
attacks? (Paper II).
3. How does opponent interaction affect the probability for goal scoring by counter
attacks compared to elaborate attacks? (Paper III).
4. How does match location (home vs. away) affect the probability for goal scoring
by counter attacks compared to elaborate attacks when assessing opponent
interaction? (Paper IV).
5. How do broader measures (scoring opportunity and score box possession)
associate with the ultimate measure (goal scored) of offensive effectiveness?
(Paper V).

Methods
37
Methods
“The modelling of competitive sport is an informative analytic technique because it directs
the attention of the modeller to the critical aspects of data which delineate successful
performance. The modeller searches for an underlying signature of sport performance which
is a reliable predictor of future sport behaviour.” (Franks & McGarry, 1996, p. 372).
Study population and material
This dissertation is based on a random series of team possessions from matches played in the
Norwegian top professional league during the 2004 season, as well as all team possessions
leading to a goal being scored during the same season. The two data sets, 3260 random team
possessions and 476 goals, were collected from videotapes available from 163 out of 182
(90%) matches played in the Norwegian professional league in 2004. The regular league
involves 14 teams and follows a double round robin competition format, which means that
each team played 26 matches, 13 home and 13 away (182 matches in total). The Norwegian
Broadcasting Corporation (NRK) secured a delivery of videotapes in digital BetaCam video
format from the regular TV production.
To obtain 3260 random team possessions, each of 163 matches was assigned a computer-
generated random decimal number between 0 and 1, which was multiplied by 86 to indicate
the beginning (in minutes) of a match period from which a total of 20 consecutive team
possessions would be extracted. This was based on the assumption that 20 consecutive team
possessions lasts 6.5 minutes on average, and that there is 2-3 minutes of extra time added to
every match. In addition, all team possessions ending up with a goal (n=476) were extracted

Methods
38
from the 163 matches available. These two data sets were analysed further according to the
questions addressed in papers I-V (Figure 6).
Figure 6. Illustration of the materials in Papers I – V. IP-started=Started by winning the ball in play, SP-started=Started by a set play.
In paper I, 200 team possessions from ten matches out of the 3260 random series of team
possessions were used. The ten matches were selected from the 163 available on video by
choosing every 16th match on the original list (Figure 6).
3260 random series of
team possessions:
1703 IP-started
1373 SP-started
184 Other
476 goal-producing team
possessions:
203 IP-started
266 SP-started
7 Other
PAPER I
(Reliability)
200 random series
of team
possessions
PAPER II
(Tactic effectiveness)
Cohort of 1703
random IP-started
team possessions
PAPER III, IV & V
(Tactic effectiveness; Match location &
Measuring offensive effectiveness)
Cases: 203 IP-started goal-producing team
possessions
Controls: 1688* IP-started team possessions
(*excluding 15 goals from the 1703 random
possessions)
MATERIAL
Top Norwegian male
professional league season
2004:
14 teams; 163 of 182 (90%)
total matches

Methods
39
In paper II, the 3260 random series of team possessions were further analysed for team
possession type, namely counter attack, elaborate attack, and set play. Based on this, set plays
were excluded, and a total of 1703 random team possessions started by winning the ball in
play (695 counter attacks [41%] and 1008 elaborate attacks [59%]) were included (Figure 6).
In paper III and IV, the 476 team possessions ending up with a goal were further analysed for
team possession type, namely counter attack, elaborate attack, and set play. Set plays were
excluded, and 203 goals started by winning the ball in play (106 counter attacks [52%] and 97
elaborate attacks [48%]) were included. In addition, the 1688 team possessions (686 counter
attacks [41%] and 1002 elaborate attacks [59%]) were used as random controls, after also
excluding 15 goals which happened to be included among the 1703 random team possessions
collected for paper II (Figure 6).
In paper V, the 203 goals and 1688 random team possessions started by winning the ball in
play, which were collected for papers III and IV were used. The 1688 random team
possessions were further analysed for team possession outcome, including scoring
opportunity, score box possession, not score box possession, final third, middle third, and first
third. Based on this, team possessions leading to scoring opportunities (n=80, 4.7%), to score
box possessions (n=167, 9.9%), and to other team possession outcomes (n=1441, 85.4%)
were included. Finally, a sample could be analysed in three ways: 203 goals and 1688 random
controls; 80 scoring opportunities and remaining 1608 random controls; and 167 score box
possessions and remaining 1521 random controls.
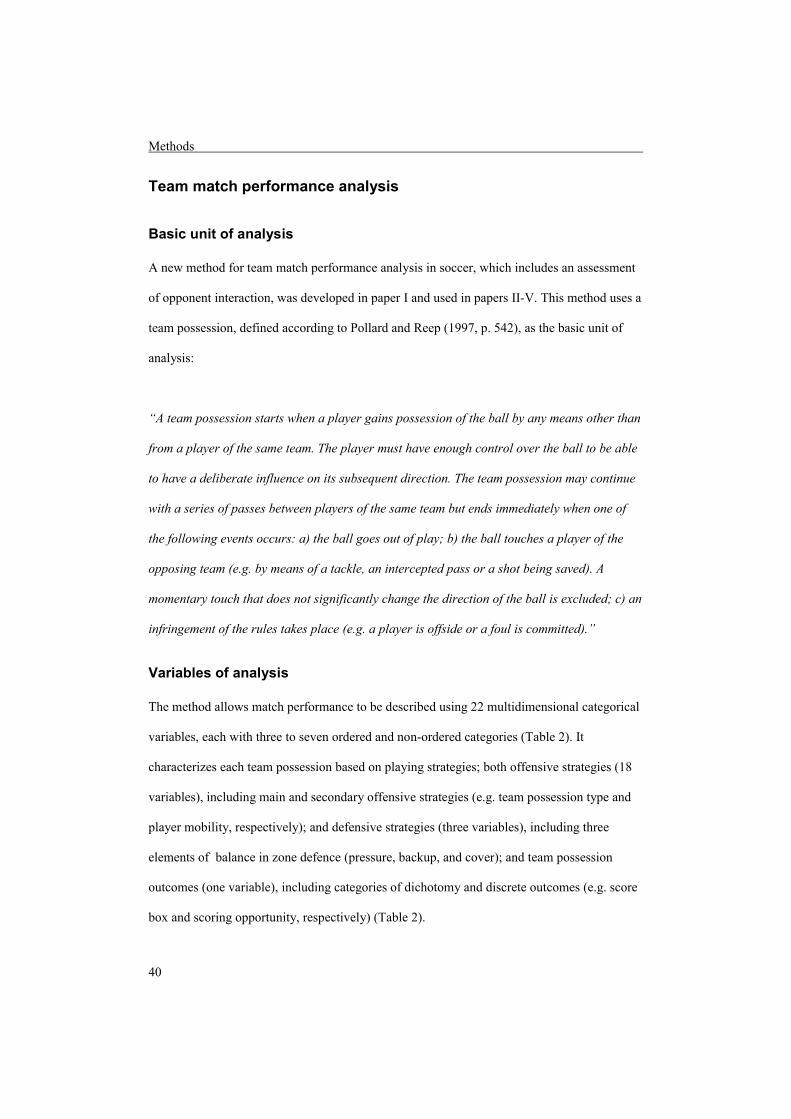
Methods
40
Team match performance analysis
Basic unit of analysis A new method for team match performance analysis in soccer, which includes an assessment
of opponent interaction, was developed in paper I and used in papers II-V. This method uses a
team possession, defined according to Pollard and Reep (1997, p. 542), as the basic unit of
analysis:
“A team possession starts when a player gains possession of the ball by any means other than
from a player of the same team. The player must have enough control over the ball to be able
to have a deliberate influence on its subsequent direction. The team possession may continue
with a series of passes between players of the same team but ends immediately when one of
the following events occurs: a) the ball goes out of play; b) the ball touches a player of the
opposing team (e.g. by means of a tackle, an intercepted pass or a shot being saved). A
momentary touch that does not significantly change the direction of the ball is excluded; c) an
infringement of the rules takes place (e.g. a player is offside or a foul is committed).”
Variables of analysis The method allows match performance to be described using 22 multidimensional categorical
variables, each with three to seven ordered and non-ordered categories (Table 2). It
characterizes each team possession based on playing strategies; both offensive strategies (18
variables), including main and secondary offensive strategies (e.g. team possession type and
player mobility, respectively); and defensive strategies (three variables), including three
elements of balance in zone defence (pressure, backup, and cover); and team possession
outcomes (one variable), including categories of dichotomy and discrete outcomes (e.g. score
box and scoring opportunity, respectively) (Table 2).

Methods
41
Table 2. Variable descriptions and category definitions used in the team match performance analysis. Variables and categories
1. Team possession type (four categories, two ordered)
Def. Degree of offensive directness by levels of utilization or creation of imbalance in the opponent’s defence to achieve
penetration (i.e. how quick penetration is attempted after ball winning). Penetration is achieved when a pass goes towards the
opponent’s goal past opponent player(s) while maintaining high degree of control over the ball. High degree of control over the
ball means enough space and time that makes it easier to perform intended actions on the ball.
A. Counter attack (“direct play”): starts by winning the ball in play and progresses by either a) utilizing or attempting to utilize a
degree of imbalance from start to the end, or b) creating or attempting to create a degree of imbalance from start to the end
by using early (i.e. 1st or 2nd, evaluated qualitatively) penetrative pass or dribble. Utilizing degree of imbalance means seeking
penetration in such a way that a defending team fails to regain high degree of balance from start to the end of team
possession. Counter attacks progress relatively fast.
B. Set play: starts by a set play and finishes while players still are more in original set play grouping. In case team possession
takes longer time and finishes while players’ positions are no longer influenced by original set play grouping, a set play becomes
elaborate attack with a set play-start. Set plays often take relatively short time.
C. Elaborate attack (“possession play”): starts by either winning the ball in play or a set play and progresses either a) without
utilizing or attempting to utilize a degree of imbalance, or b) by creating or attempting to create a degree of imbalance by using
late (3rd or later, evaluated qualitatively) penetrative pass or dribble. Not utilizing a degree of imbalance means seeking
penetration in such a way that a defending team manages to regain high degree of balance before the end of team possession.
Elaborate attacks often progress relatively slow.
D. Other: team possession that fails to be registered as counter attack or elaborate attack or set play. In addition, team
possession that starts by winning the ball in play, but (i) finishes too fast to show a clear attempt to seek penetration or (ii) with
no intention to seek penetration, for example during ball clearances, time-wasting tactics and fair play gesture or (iii) shows no
entire action due to filming error.
2. Elaborate attack start-type (four non-ordered categories)
Def. Type of starting elaborate attack team possession.
A. Counter attack-start: elaborate attack team possession starts by winning the ball in play.
B. Set play-start: elaborate attack team possession starts by a set play.
C. Not applicable: team possession registered as counter attack, set play, or other.
D. Other
3. Set play start-type (four non-ordered categories)
Def. Quickness of starting set play team possession.
A. Delayed: delay start that allows a defending team to have enough time to establish a balanced defence.
B. Fast: fast start that denies a defending team enough time to establish a balanced defence.
C. Not applicable: team possession starts by winning the ball in play.
D. Other
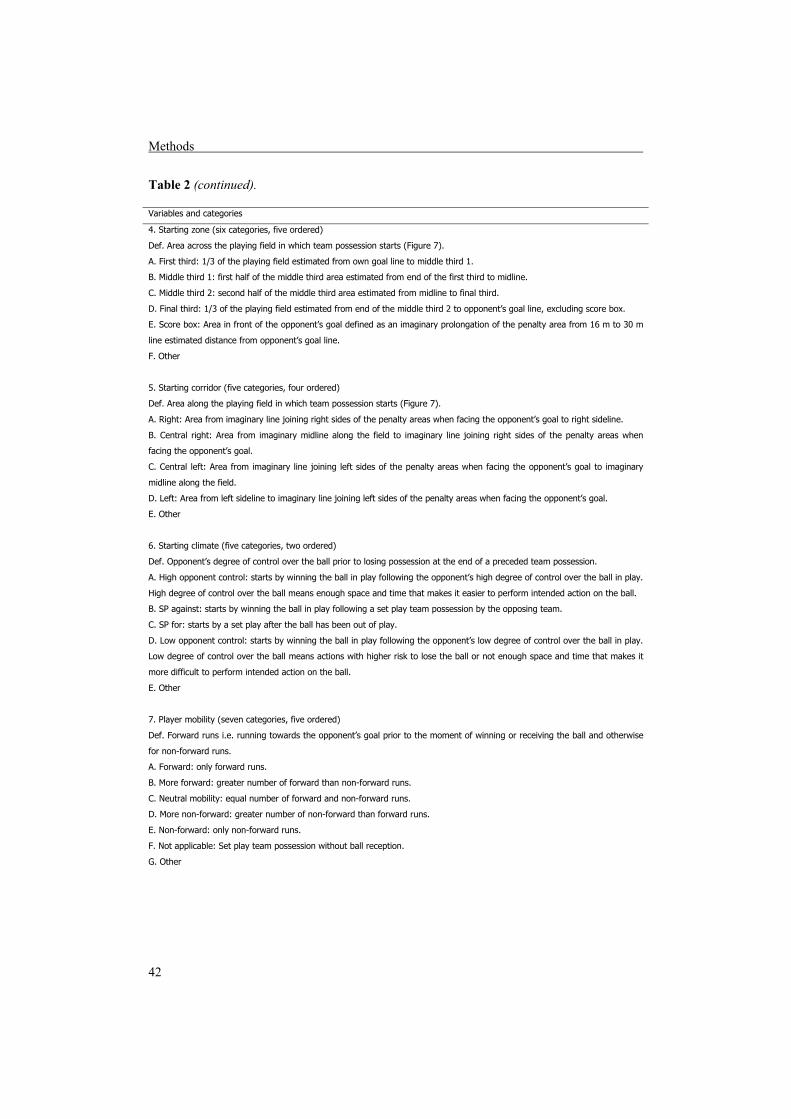
Methods
42
Table 2 (continued). Variables and categories
4. Starting zone (six categories, five ordered)
Def. Area across the playing field in which team possession starts (Figure 7).
A. First third: 1/3 of the playing field estimated from own goal line to middle third 1.
B. Middle third 1: first half of the middle third area estimated from end of the first third to midline.
C. Middle third 2: second half of the middle third area estimated from midline to final third.
D. Final third: 1/3 of the playing field estimated from end of the middle third 2 to opponent’s goal line, excluding score box.
E. Score box: Area in front of the opponent’s goal defined as an imaginary prolongation of the penalty area from 16 m to 30 m
line estimated distance from opponent’s goal line.
F. Other
5. Starting corridor (five categories, four ordered)
Def. Area along the playing field in which team possession starts (Figure 7).
A. Right: Area from imaginary line joining right sides of the penalty areas when facing the opponent’s goal to right sideline.
B. Central right: Area from imaginary midline along the field to imaginary line joining right sides of the penalty areas when
facing the opponent’s goal.
C. Central left: Area from imaginary line joining left sides of the penalty areas when facing the opponent’s goal to imaginary
midline along the field.
D. Left: Area from left sideline to imaginary line joining left sides of the penalty areas when facing the opponent’s goal.
E. Other
6. Starting climate (five categories, two ordered)
Def. Opponent’s degree of control over the ball prior to losing possession at the end of a preceded team possession.
A. High opponent control: starts by winning the ball in play following the opponent’s high degree of control over the ball in play.
High degree of control over the ball means enough space and time that makes it easier to perform intended action on the ball.
B. SP against: starts by winning the ball in play following a set play team possession by the opposing team.
C. SP for: starts by a set play after the ball has been out of play.
D. Low opponent control: starts by winning the ball in play following the opponent’s low degree of control over the ball in play.
Low degree of control over the ball means actions with higher risk to lose the ball or not enough space and time that makes it
more difficult to perform intended action on the ball.
E. Other
7. Player mobility (seven categories, five ordered)
Def. Forward runs i.e. running towards the opponent’s goal prior to the moment of winning or receiving the ball and otherwise
for non-forward runs.
A. Forward: only forward runs.
B. More forward: greater number of forward than non-forward runs.
C. Neutral mobility: equal number of forward and non-forward runs.
D. More non-forward: greater number of non-forward than forward runs.
E. Non-forward: only non-forward runs.
F. Not applicable: Set play team possession without ball reception.
G. Other

Methods
43
Table 2 (continued). Variables and categories
8. Pass number (six categories, four ordered)
Def. Series of passes between players of the attacking team.
A. Very low: 1 or 2 passes per team possession.
B. Low: 3 passes per team possession.
C. High: 4 passes per team possession.
D. Very high: 5 or more passes per team possession.
E. Not applicable: team possession without a pass.
F. Other
9. Playing tempo (six categories, five ordered)
Def. Number of touches per ball involvement including set play starting and ball winning at the beginning of team possession.
A. High: 1 or 2 touches.
B. More high: greater number of high than low tempo involvements.
C. Neutral tempo: equal number of low and high tempo involvements.
D. More low: greater number of low than high tempo involvements.
E. Low: 3 or more touches.
F. Other
10. Pass length (seven categories, five ordered)
Def. Long passes i.e. 30 m or more estimated distance and shorter estimated distances for short passes.
A. Long: only long pass.
B. More long: greater number of long than short passes.
C. Neutral pass length: equal number of long and short passes.
D. More short: greater number of short than long passes.
E. Short: only short pass.
F. Not applicable: team possession without a pass.
G. Other
11. Pass penetration (seven categories, five ordered)
Def. Penetrative passes i.e. passes towards the opponent’s goal past opponent player(s) while maintaining control over the ball
and otherwise for non-penetrative passes.
A. Penetrative: only penetrative pass.
B. More penetrative: greater number of penetrative than non-penetrative passes.
C. Neutral pass penetration: equal number of penetrative and non-penetrative passes.
D. More non-penetrative: greater number of non-penetrative than penetrative passes.
E. Non-penetrative: only non-penetrative pass.
F. Not applicable: team possession without a pass.
G. Other

Methods
44
Table 2 (continued). Variables and categories
12. Dribble penetration (seven categories, five ordered)
Def. Penetrative dribbles (including run with the ball), i.e. dribbles towards the opponent’s goal past opponent player(s) while
maintaining control over the ball and otherwise for non-penetrative dribbles.
A. Penetrative: only penetrative dribble.
B. More penetrative: greater number of penetrative than non-penetrative dribbles.
C. Neutral dribble penetration: equal number of penetrative and non-penetrative dribbles.
D. More non-penetrative: greater number of non-penetrative than penetrative dribbles.
E. Non-penetrative: only non-penetrative dribble.
F. Not applicable: team possession without dribbling.
G. Other
13. Skill level (seven categories, five ordered)
Def. Advanced skills i.e. successful dribble (including penetrative run with the ball), wall pass, and overlap) and non-advanced
skills i.e. ordinary pass and unsuccessful advanced skill.
A. Advanced: only successful advanced skill.
B. More advanced: greater number of successful advanced than non-advanced skills.
C. Neutral skill level: equal number of successful advanced and non-advanced skills.
D. More non-advanced: greater number of non-advanced than successful advanced skills.
E. Non-advanced: only non-advanced skill.
F. Not applicable: team possession without a pass or dribbling.
G. Other
14. Space utilization (seven categories, five ordered)
Def. Space passes i.e. passes towards a space further than receiver’s immediate reach and foot passes i.e. passes towards a
player, evaluated from the moment of making the pass.
A. Space pass: only space pass.
B. More space pass: greater number of space- than foot passes.
C. Neutral utilization: equal number of space- and foot passes.
D. More foot pass: greater number of foot- than space passes.
E. Foot pass: only foot pass.
F. Not applicable: team possession without a pass.
G. Other
15. Ball possessing (seven categories, five ordered)
Def. Forward possessing i.e. player faces towards opponent’s goal either prior to or immediately after his 1st touch at the
moment of winning or receiving the ball and otherwise for non-forward possessing.
A. Forward: only forward possessing.
B. More forward: greater number of forward than non-forward possessing.
C. Neutral possessing: equal number forward than non-forward possessing.
D. More non-forward: greater number of non-forward than forward possessing.
E. Non-forward: only non-forward possessing.
F. Not applicable: Set play team possession without ball reception.
G. Other
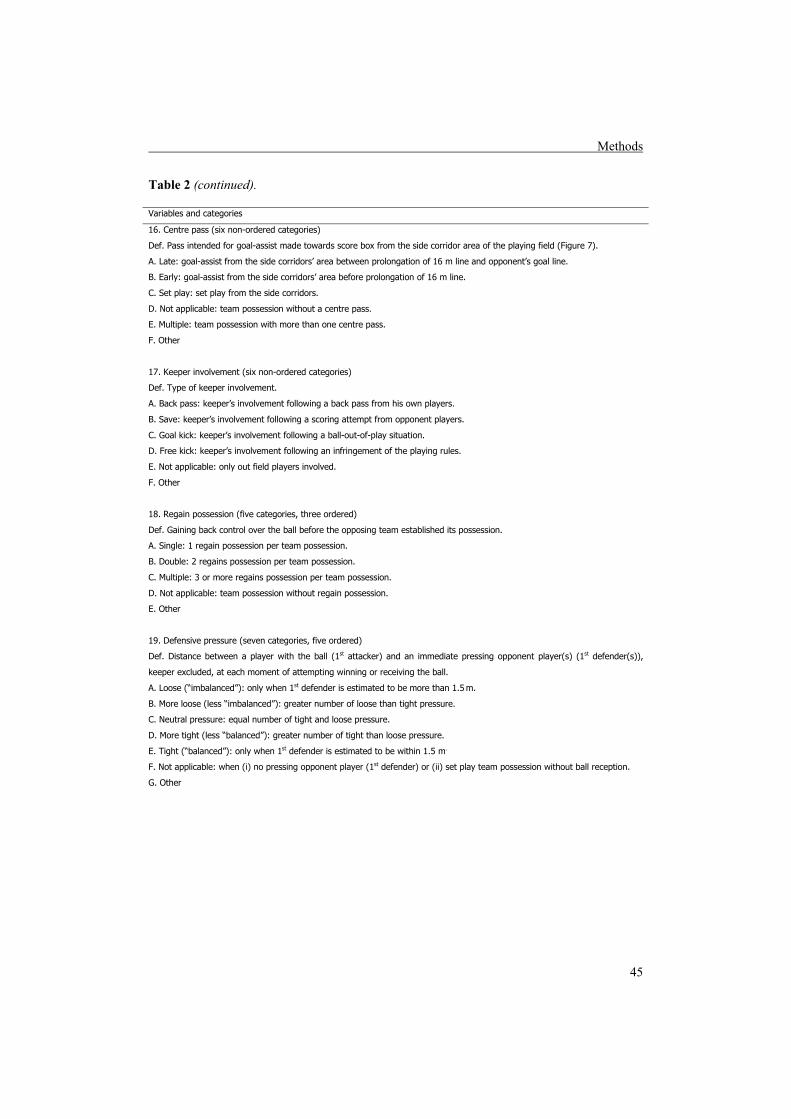
Methods
45
Table 2 (continued). Variables and categories
16. Centre pass (six non-ordered categories)
Def. Pass intended for goal-assist made towards score box from the side corridor area of the playing field (Figure 7).
A. Late: goal-assist from the side corridors’ area between prolongation of 16 m line and opponent’s goal line.
B. Early: goal-assist from the side corridors’ area before prolongation of 16 m line.
C. Set play: set play from the side corridors.
D. Not applicable: team possession without a centre pass.
E. Multiple: team possession with more than one centre pass.
F. Other
17. Keeper involvement (six non-ordered categories)
Def. Type of keeper involvement.
A. Back pass: keeper’s involvement following a back pass from his own players.
B. Save: keeper’s involvement following a scoring attempt from opponent players.
C. Goal kick: keeper’s involvement following a ball-out-of-play situation.
D. Free kick: keeper’s involvement following an infringement of the playing rules.
E. Not applicable: only out field players involved.
F. Other
18. Regain possession (five categories, three ordered)
Def. Gaining back control over the ball before the opposing team established its possession.
A. Single: 1 regain possession per team possession.
B. Double: 2 regains possession per team possession.
C. Multiple: 3 or more regains possession per team possession.
D. Not applicable: team possession without regain possession.
E. Other
19. Defensive pressure (seven categories, five ordered)
Def. Distance between a player with the ball (1st attacker) and an immediate pressing opponent player(s) (1st defender(s)),
keeper excluded, at each moment of attempting winning or receiving the ball.
A. Loose (“imbalanced”): only when 1st defender is estimated to be more than 1.5 m.
B. More loose (less “imbalanced”): greater number of loose than tight pressure.
C. Neutral pressure: equal number of tight and loose pressure.
D. More tight (less “balanced”): greater number of tight than loose pressure.
E. Tight (“balanced”): only when 1st defender is estimated to be within 1.5 m.
F. Not applicable: when (i) no pressing opponent player (1st defender) or (ii) set play team possession without ball reception.
G. Other

Methods
46
Table 2 (continued). Variables and categories
20. Defensive backup (seven categories, five ordered)
Def. Immediate opponent player(s) supporting 1st defender often from behind (2nd defender(s)), keeper excluded, at each
moment of attempting winning or receiving the ball except in ‘war’ zone. ‘War’ zone means group duel in front of the goal
typically following a pass made towards the score box (Figure 7).
A. Absent (“imbalanced”): only without 2nd defender within 5 m estimated distance from 1st defender.
B. More absent (less “imbalanced”): greater number of without than with 2nd defender.
C. Neutral backup: equal number of with and without 2nd defender.
D. More present (less “balanced”): greater number of with than without 2nd defender.
E. Present (“balanced”): only with 2nd defender within 5 m estimated distance from 1st defender.
F. Not applicable: when (i) no 1st defender or (ii) backup in ‘war’ zone or (iii) set play team possession without ball reception.
G. Other
21. Defensive cover (seven categories, five ordered)
Def. Opponent player(s) guarding space away from the ball often behind 1st defender(s) and/or 2nd defender(s) (3rd
defender(s)), keeper excluded, at each moment of attempting winning or receiving the ball.
A. Absent (“imbalanced”): only without 3rd defender(s) behind 1st and/or 2nd defender(s).
B. More absent (less “imbalanced”): greater number of without than with 3rd defender(s).
C. Neutral cover: equal number of with and without 3rd defender(s).
D. More present (less “balanced”): greater number of with than without 3rd defender(s).
E. Present (“balanced”): only with 3rd defender(s) behind 1st and/or 2nd defender(s).
F. Not applicable: when (i) no 1st and 2nd defender or (ii) set play team possession without ball reception.
G. Other
22. Team possession outcome (seven ordered categories)
Def. Degree of offensive success by dichotomy and discrete levels of effectiveness.
I. Score box: Levels of offensive effectiveness within the score box (Figure 7).
A. Goal scoring: scoring attempt ending with a goal approved by a referee.
B. Scoring opportunity: scoring attempt with relatively high scoring probability (e.g. from shorter distances, from wider angles,
with poor keeper positioning) as well as with near-scoring situations such as corner kick direct on crossbar.
C. Score box possession: entry into score box with high degree of control over the ball or set play given to the attacking team
as a result of entry into score box. High degree of control over the ball means enough space and time that makes it easier to
perform intended action on the ball.
II. Not score box: Levels of offensive effectiveness outside the score box (Figure 7).
D. No score box possession: entry into score box with low degree of control over the ball. Low degree of control over the ball
means not enough space and time that makes it more difficult to perform intended action on the ball.
E. Final third: ending up in the final third area of the playing field.
F. Middle third: ending up in the middle third area of the playing field.
G. First third: ending up in the first third area of the playing field.

Methods
47
Figure 7. Zones and corridors of the playing field. Zones include first third, middle third 1, midfield 2, final third, and score box, while corridors include right, central right, central left, and left corridor. Note that the playing formation was not included in our analyses because we could not
analyse it precisely enough due to observational limitations associated with the quality of TV
production. Since soccer teams are known to often change the playing formation during a
match play due to for example tactical reasons, a continuous analysis of playing formation
would have been necessary.
A soccer coach and researcher (AT) experienced in match performance analysis and a soccer
coach and master student (DK) performed the analyses in paper I. The student underwent a
four-week intensive training period in match performance analysis during pilot testing. The
results of these two were compared using kappa analysis to determine interobserver reliability
(Altman, 1991). One of them (AT) repeated the analysis after three weeks to test intraobserver
reliability.
Direction of play
Midfield 1 Midfield 2 First third Final third
Score box Central left
Central right
Right
Left

Methods
48
To improve interobserver agreement, categories (all) from variables in Table 2 were
collapsed, without losing practical meaning, into two or three ordered categories (ordered)
(see Table 3). In addition, the 10 most relevant variables according to the questions addressed
in papers II-V were selected out of 22 original variables. These 10 variables, each having only
two or three ordered categories, were used in the subsequent analyses (papers II-V).
Dynamic analysis of match performance The dynamic aspect of match performance was captured by a continuous analysis, offensively
and defensively, of each attempt to win or receive the ball in all ball involvements from the
start to the end of a team possession. The frequencies of each category within a team
possession were then summed up and used to characterize each team possession according to
offensive and defensive variables. For example, for the variable team possession type, a team
possession was characterized as ‘counter attack’ when the attempt(s) to quickly utilize or
create imbalance in the opponent’s defence was observed in all ball involvements throughout
the entire team possession. In contrast, an ‘elaborate attack’ characterizes team possession
when the attempt(s) to quickly utilize or create imbalance in the opponent’s defence was not
observed throughout the entire team possession. A team possession that failed to be clearly
characterized as ‘counter attack’ or ‘elaborate attack’ was not included in the analysis (for
details of such team possessions, see description of category ‘other’ for the variable team
possession type in Table 2).
Likewise, for the variable defensive pressure, a team possession was characterized as ‘tight
pressure’ when an estimated pressing distance(s) of not more than 1.5 m was observed in all
ball involvements throughout the entire team possession. In contrast, a ‘loose pressure’
characterizes team possession when an estimated pressing distance(s) of more than 1.5 m was

Methods
49
observed throughout the entire team possession. The category ‘mixed’, used in the subsequent
analyses, characterizes team possessions when both ‘tight pressure’ and ‘loose pressure’ were
observed in ball involvements within team possessions. For the variable defensive backup, the
categories ‘present backup’ and ‘absent backup’ include team possessions completely with or
without a second defender within 5 m estimated distance from the first defender throughout
the entire team possession, respectively. And, for the variable defensive cover, the categories
‘present cover’ and ‘absent cover’ include team possessions completely with or without third
defender(s) throughout the entire team possession, respectively. The categories ‘mixed’, used
in the subsequent analyses, characterize team possessions when both ‘present backup’ and
‘absent backup’ for defensive backup or ‘present cover’ and ‘absent cover’ for defensive cover
were observed in ball involvements within a team possession.
The combined probability scores of defensive categories ‘tight pressure’, ‘present backup’
and ‘present cover’ were used to form the overall defensive category ‘balanced defence’,
while categories ‘loose pressure’, ‘absent backup’ and ‘absent cover’ were used to form the
overall defensive category ‘imbalanced defence’. The overall defensive category ‘mixed’
reflects the combined probability scores of the category ‘mixed’ for the variables defensive
pressure, defensive backup and defensive cover. Consequently, the three categories of the
overall defensive variable used in the subsequent analyses characterize team possessions as
playing against only balanced defence (balanced defence), against both balanced and
imbalanced defence (mixed), and as playing against only imbalanced defence (imbalanced
defence) throughout the team possession. This dynamic analysis of team possessions applies
to all variables used (for details of other variables, see category description in Table 2).
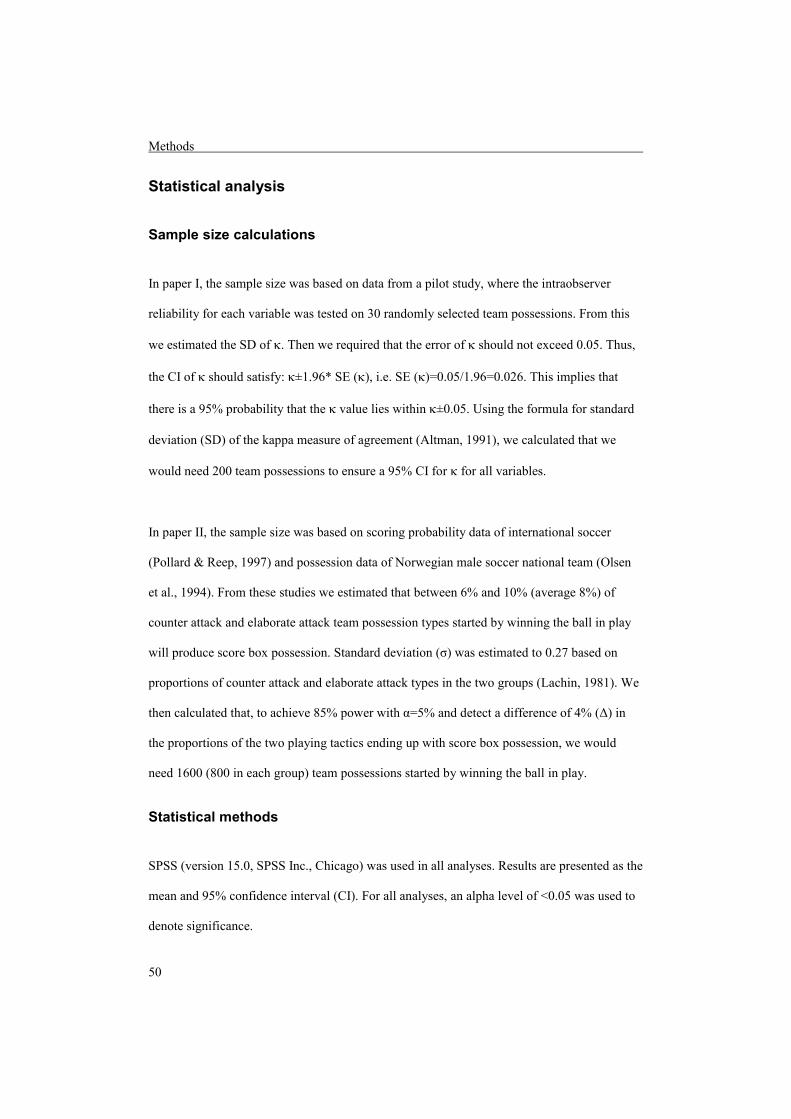
Methods
50
Statistical analysis
Sample size calculations
In paper I, the sample size was based on data from a pilot study, where the intraobserver
reliability for each variable was tested on 30 randomly selected team possessions. From this
we estimated the SD of κ. Then we required that the error of κ should not exceed 0.05. Thus,
the CI of κ should satisfy: κ±1.96* SE (κ), i.e. SE (κ)=0.05/1.96=0.026. This implies that
there is a 95% probability that the κ value lies within κ±0.05. Using the formula for standard
deviation (SD) of the kappa measure of agreement (Altman, 1991), we calculated that we
would need 200 team possessions to ensure a 95% CI for κ for all variables.
In paper II, the sample size was based on scoring probability data of international soccer
(Pollard & Reep, 1997) and possession data of Norwegian male soccer national team (Olsen
et al., 1994). From these studies we estimated that between 6% and 10% (average 8%) of
counter attack and elaborate attack team possession types started by winning the ball in play
will produce score box possession. Standard deviation (σ) was estimated to 0.27 based on
proportions of counter attack and elaborate attack types in the two groups (Lachin, 1981). We
then calculated that, to achieve 85% power with α=5% and detect a difference of 4% (Δ) in
the proportions of the two playing tactics ending up with score box possession, we would
need 1600 (800 in each group) team possessions started by winning the ball in play.
Statistical methods
SPSS (version 15.0, SPSS Inc., Chicago) was used in all analyses. Results are presented as the
mean and 95% confidence interval (CI). For all analyses, an alpha level of <0.05 was used to
denote significance.
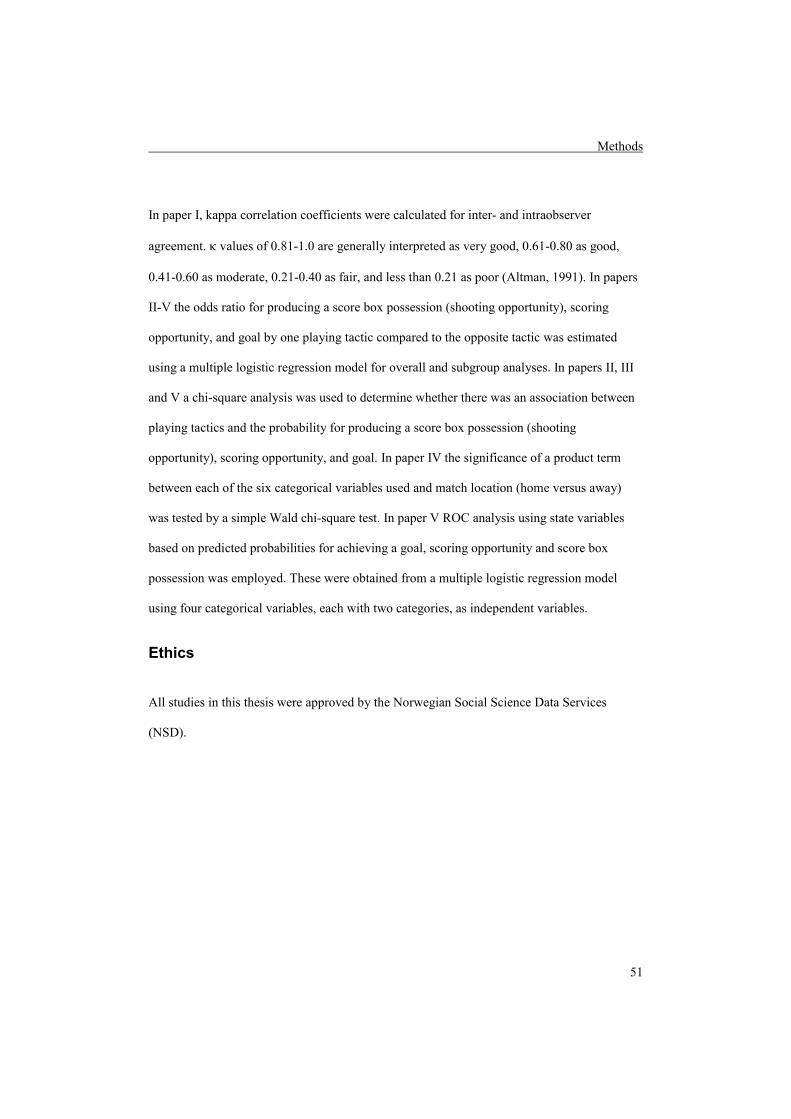
Methods
51
In paper I, kappa correlation coefficients were calculated for inter- and intraobserver
agreement. κ values of 0.81-1.0 are generally interpreted as very good, 0.61-0.80 as good,
0.41-0.60 as moderate, 0.21-0.40 as fair, and less than 0.21 as poor (Altman, 1991). In papers
II-V the odds ratio for producing a score box possession (shooting opportunity), scoring
opportunity, and goal by one playing tactic compared to the opposite tactic was estimated
using a multiple logistic regression model for overall and subgroup analyses. In papers II, III
and V a chi-square analysis was used to determine whether there was an association between
playing tactics and the probability for producing a score box possession (shooting
opportunity), scoring opportunity, and goal. In paper IV the significance of a product term
between each of the six categorical variables used and match location (home versus away)
was tested by a simple Wald chi-square test. In paper V ROC analysis using state variables
based on predicted probabilities for achieving a goal, scoring opportunity and score box
possession was employed. These were obtained from a multiple logistic regression model
using four categorical variables, each with two categories, as independent variables.
Ethics
All studies in this thesis were approved by the Norwegian Social Science Data Services
(NSD).

Results and discussion
52
Results and discussion
“Modelling human behaviour is implicitly a very complex mathematical exercise, which is
multi-dimensional, and these dimensions will depend upon 2 or 3 spatial dimensions together
with time. But the outcomes of successful analyses offer huge rewards.” (Hughes, 2004, p.
113).
Reliability of the method (Paper I) The κ values were considerably better for the intraobserver than the interobserver tests when
all categories were included. For intraobserver tests, κ values were very good for 16 (73%),
good for 5 (23%) and moderate for 1 (4%) of 22 variables. For the interobserver tests, κ
values were very good for 7 (32%), good for 5 (23%), moderate for 7 (32%), fair for 2 (9%)
and poor for 1 of 22 (4%) variables (Table 3). There was similar distribution of κ values for
both intraobserver agreement and interobserver agreement, but with improved interobserver
agreement for most variables, when only two or three collapsed ordered categories were
included. For the intraobserver tests on ordered categories, κ values were very good for 12
(67%), good for 5 (28%), moderate for 1 (5%), while for the interobserver tests κ values were
very good for 6 (33%), good for 6 (33%), moderate for 2 (11%) and fair for 4 (22%) of 18
variables (Table 3). The variables which were evaluated qualitatively only recorded
considerably poorer κ values than those involving quantitative methods (see paper I for
details).
Considering the challenges in describing different dimensions of soccer match performance
by using videotapes recorded from a conventional TV coverage, the achieved reproducibility

Results and discussion
53
for most variables used was rather high. The results showing greater differences in
interobserver than intraobserver data were as expected.
Table 3. Kappa correlation coefficients (κ) values for inter- and intraobserver agreement for all categories (all) and for only collapsed ordered categories (ordered). κ for inter (n) κ for intra (n)
Variables and categories All Ordered All Ordered
Team possession type† 0.59 (191) 0.63 (126) 0.94 (200) 0.92 (160)
Elaborate attack start-type 0.41 (193) * 0.93 (197) *
Set play start-type 0.82 (196) * 0.90 (200) *
Starting zone† 0.85 (200) 0.85 (200) 0.92 (200) 0.94 (200)
Starting corridor 0.85 (200) 0.86 (200) 0.90 (200) 0.93 (200)
Starting climate 0.73 (198) 0.48 (100) 0.92 (200) 0.83 (104)
Player mobility 0.42 (199) 0.44 (182) 0.65 (200) 0.67 (182)
Pass number† 0.84 (200) 0.87 (195) 0.94 (200) 0.97 (197)
Playing tempo 0.90 (200) 0.95 (198) 0.92 (199) 0.95 (199)
Pass length† 0.79 (200) 0.84 (195) 0.92 (200 0.92 (197)
Pass penetration† 0.73 (199) 0.81 (195) 0.84 (200) 0.88 (197)
Dribble penetration 0.57 (197) 0.22 (57) 0.78 (199) 0.74 (60)
Skill level 0.25 (187) 0.26 (191) 0.81 (199) 0.81 (199)
Space utilization† 0.49 (199) 0.64 (195) 0.82 (199) 0.87 (196)
Ball possessing 0.54 (200) 0.65 (182) 0.69 (200) 0.77 (182)
Centre pass 0.83 (200) * 0.94 (200) *
Keeper involvement 0.88 (199) * 0.89 (199) *
Regain possession 0.75 (200) 0.69 (38) 0.88 (200) 0.74 (46)
Defensive pressure† 0.57 (200) 0.68 (175) 0.72 (200) 0.82 (174)
Defensive backup† 0.19 (199) 0.24 (174) 0.59 (200) 0.57 (173)
Defensive cover† 0.35 (200) 0.27 (175) 0.71 (199) 0.67 (173)
Team possession outcome† 0.77 (200) 0.75 (200) 0.91 (200) 0.94 (200)
*Kappa values could not be computed because these variables include only non-ordered categories.
†The 10 variables used in the subsequent analyses (papers II-V).
Grouping the data into fewer categories changed κ values for interobserver reproducibility
without losing practical meaning. For example, κ improved from 0.19 to 0.24 for the variable

Results and discussion
54
with the lowest interobserver reproducibility (“defensive backup”) (Table 3). This means that,
with fewer and more reliable categories, this variable can also be utilised in further analyses
provided that care is taken when interpreting the data.
Effectiveness of playing tactics (Papers II & III)
There were differences in the probability for producing score box possessions between the
different playing tactics for all variables except “team possession type” (Table 4).
Table 4. Number (n=262) and percentage of attempts for producing score box possessions (N=1703), and number of goals (n=203) and controls (n=1688) and percentage of produced goals (N=1891) by playing tactics according to offensive and defensive variables. Variable Score box
possession
n (%)
P*
Goal
(n)
Control
(n)
Goal scoring
(%)
P*
Offensive variable
Team possession type
Counter attack (“direct play”)
Elaborate attack (“possession play”)
117 (16.8)
145 (14.4)
0.17
106
97
686
1002
13.4
8.8
0.002
Zone defensive variables
Defensive pressure
Loose (“imbalanced”)
mixed
Tight (“balanced”)
43 (9.5)
200 (19.8)
18 (19.0)
<0.001
36
153
13
451
999
197
7.4
13.3
6.2
<0.001
Defensive backup
Absent (“imbalanced”)
mixed
Present (“balanced”)
136 (13.5)
121 (20.3)
4 (7.1)
<0.001
134
67
1
1000
590
56
11.8
10.2
1.8
0.045
Defensive cover
Absent (“imbalanced”)
mixed
Present (“balanced”)
5 (55.6)
120 (51.1)
137 (9.7)
<0.001
7
169
26
8
224
1416
46.7
43.0
1.8
<0.001
Overall defensive score
Imbalanced defence
mixed
Balanced defence
172 (28.5)
49 (11.2)
40 (6.5)
<0.001
191
6
5
687
437
522
21.8
1.4
0.9
<0.001
Note: The variable “overall defensive score” reflects the combined probability scores of the three zone defensive variables. In contrast to goals, score box possessions were selected randomly. *Pearson Chi-square.

Results and discussion
55
For the three zone defensive variables combined (“overall defensive score”), playing against a
balanced defence produced a lower percentage of score box possessions (6.5%) than against
an imbalanced defence (28.5%) (Table 4). Furthermore, differences were observed in the
probability for producing score box possessions between the offensive tactics when subgroup
analyses were done. Counter attacks and elaborate attacks differed significantly when playing
against an imbalanced defence, but not against a balanced defence (Table 5). As for produced
goals, there were differences in the probability for goal scoring between the playing tactics for
all variables (Table 4). For the three zone defensive variables combined (“overall defensive
score”), playing against a balanced defence produced a lower proportion of goals (2.5%) than
controls (31%). In contrast, playing against an imbalanced defence produced a higher
proportion of goals (94%) than controls (41%) (Table 4).
Table 5. Produced score box possessions for counter attack and elaborate attack when controlling for the effects of the degree of defensive balance (N=1224). Imbalanced
defence Balanced
defence
Variable N Score box (%) P* N Score box (%) P*
Team possession type
Counter attack (“direct play”)
Elaborate attack (“possession play”)
206
398
75 (36.4)
97 (24.4)
0.002
320
300
21 (6.6)
19 (6.3)
0.91
Note: Results of produced goals are not included due to few goals were scored when played against a balanced defence. *Pearson Chi-square.
There were differences in the odds ratio for producing a score box possession and a goal
between the two opposite offensive tactics in multivariate analysis when subgroup analyses
were done. In paper II, counter attacks were associated with a higher odds ratio for producing
a score box possession than elaborate attacks when playing against an imbalanced defence,
but not against a balanced defence (Table 6). Similarly, counter attacks were associated with
a higher odds ratio for producing a goal than elaborate attacks when playing against an
imbalanced defence (Paper III) (Table 6). However, the odds ratio for goal scoring when

Results and discussion
56
playing against a balanced defence could not be reported because its value could not be
estimated precisely enough due to few team possessions.
Table 6. Odds ratio (OR) from multivariate analysis for score box possession (n=262) and goal scoring (n=203) by counter attack vs. elaborate attack when controlling for the effects of the degree of defensive balance. Score box possession Goal scoring Variable OR (95% CI) P OR (95% CI) P
Team possession type
Counter attack vs.
Elaborate attacka against balanced defence
Counter attack vs.
Elaborate attacka against imbalanced defence
1.14 (0.47-2.76)
1
2.69 (1.64-4.43)
1
0.78
<0.001*
nrb
1.64 (1.03-2.61)
1
0.038*
Note: The odds ratio (OR) reflects the chance of goal scoring and score box possession compared with the reference categorya. In contrast to goals, score box possessions were selected randomly. bNot reported because the odds ratio (OR) could not be estimated precisely enough due to few team possessions. *Offensive tactics included in the model.
Our univariate analyses showed that counter attacks were more effective in goal scoring than
elaborate attacks, while no overall difference was found in the probability for producing a
score box possession. Similar results, showing breakdown attacks (counter attacks) producing
more scoring opportunities and goals than longer attacks (elaborate attacks), were reported by
Olsen and Larsen (1997). However, the current studies (papers II and III) also revealed that
counter attacks were more effective in producing a score box possession than elaborate
attacks when playing against an imbalanced defence, while there was no difference between
attack styles when playing against a balanced defence. In addition, the probability for
producing a score box possession and a goal was higher when playing against an imbalanced
defence than against a balanced defence. Conversely, the tactics of balanced defence (tight
pressure, present backup, and present cover) were more effective in preventing score box
possessions and goals than the opposite tactics of imbalanced defence (loose pressure, absent
backup, and absent cover).

Results and discussion
57
Our multivariate analyses show counter attacks to be more effective than elaborate attacks in
producing both score box possessions (shooting opportunities) and goals when playing
against an imbalanced defence. In contrast, no difference was observed in effectiveness to
produce score box possessions (shooting opportunities) between these two opposite offensive
tactics when playing against a balanced defence. The failure to estimate odds ratios for goal
scoring when playing against a balanced defence in paper III illustrates the main limitation
with using “goals scored” as outcome; they are infrequent events. On the other hand, paper II
demonstrates that using intermediate outcome variable “score box possession” can
complement the use of “goals scored” as outcome variable. Thus, considered together, the
findings from these two studies clearly show that the assessment of opponent interaction is
critical to evaluate the effectiveness of offensive tactics and hence improves the validity of
team match performance analysis.
Effectiveness of playing tactics at home vs. away (Paper IV)
The two playing tactics produced higher percentages of goals at home than away (Table 7).
Differences were observed in the odds ratio for goal scoring in the interaction between the
two opposite offensive tactics and match location (home vs. away) for the variable “team
possession type” when playing against an imbalanced defence (Table 8). This means that
counter attacks and elaborate attacks produced goals in a higher percentage of attempts at
home than away, with counter attacks being more effective than elaborate attacks at home, but
not away (Table 7).

Results and discussion
58
Table 7. Number and percentage of goals scored at home (n=108) and away (n=83) and controls (n=687) produced by counter attack vs. elaborate attack when controlling for the effects of imbalanced defence. Goal Control
Variable N (%) Home (%) Away (%) Total
Team possession type
Counter attack (“direct play”)
Elaborate attack (“possession play”)
454 (51.7)
424 (48.3)
58 (24.5)
50 (21.8)
43 (19.8)
40 (20.5)
101
90
353
334
Table 8. Odds ratio (OR) and Wald chi-square (χ2) for goal scoring by counter attack vs. elaborate attack when interacting with home and away match locations and controlling for the effects of imbalanced defence. Multivariate analysis
Variable OR (95% CI) χ2 P
Team possession type
Counter attack x home
Elaborate attack x awaya against imbalanced defence
1.71 (1.07-2.72)
1
5.05
0.025*
Note: The odds ratio (OR) reflects the chance of goal scoring, compared with the reference categorya. *Offensive tactics included in the model.
However, the odds ratio could not be estimated when playing against a balanced defence due
to few team possessions (too few goals scored against a balanced defence). Thus, these results
show that the assessment of opponent interaction is necessary to evaluate the effectiveness of
offensive tactics to score goals according to match location and hence improves the validity of
analysis of home advantage in soccer match performance.
Measuring offensive effectiveness (Paper V)
Differences between the same offensive tactics were observed in the odds ratio for producing
each of the three outcome measures for offensive effectiveness. Compared to elaborate
attacks, counter attacks registered a higher odds ratio for producing a goal, a scoring
opportunity and a score box possession (Table 9).
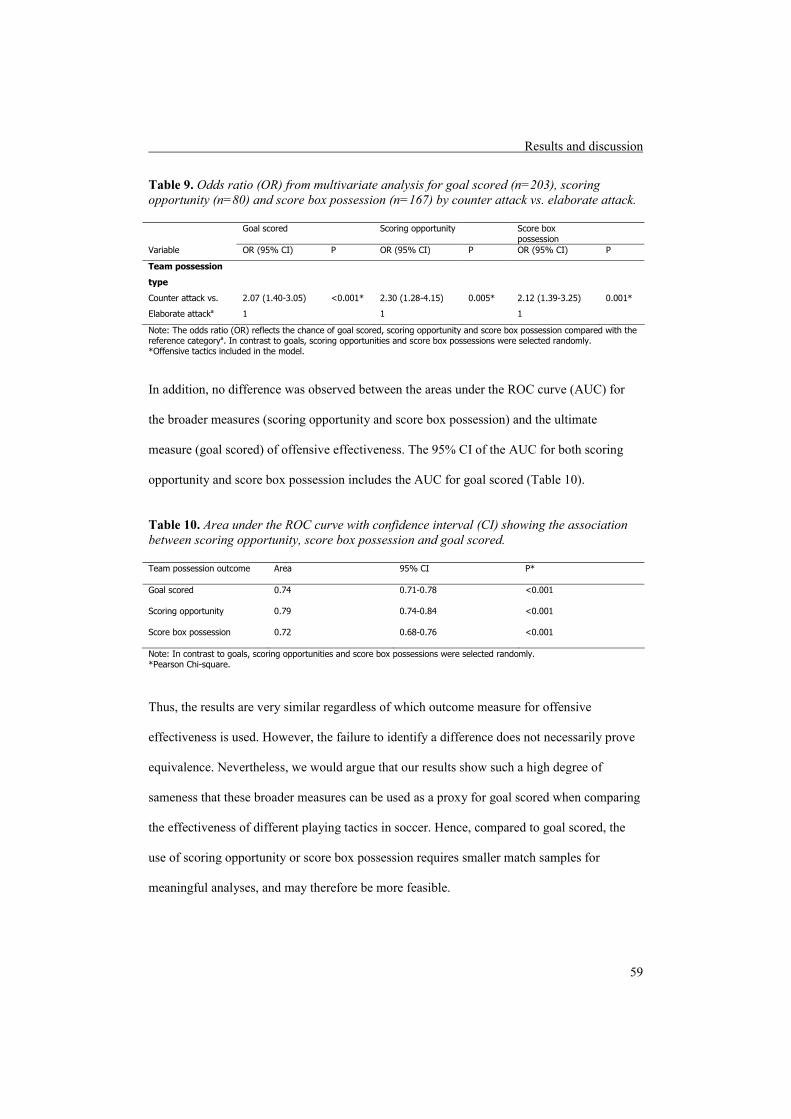
Results and discussion
59
Table 9. Odds ratio (OR) from multivariate analysis for goal scored (n=203), scoring opportunity (n=80) and score box possession (n=167) by counter attack vs. elaborate attack. Goal scored Scoring opportunity Score box
possession
Variable OR (95% CI) P OR (95% CI) P OR (95% CI) P
Team possession
type
Counter attack vs.
Elaborate attacka
2.07 (1.40-3.05)
1
<0.001*
2.30 (1.28-4.15)
1
0.005*
2.12 (1.39-3.25)
1
0.001*
Note: The odds ratio (OR) reflects the chance of goal scored, scoring opportunity and score box possession compared with the reference categorya. In contrast to goals, scoring opportunities and score box possessions were selected randomly. *Offensive tactics included in the model.
In addition, no difference was observed between the areas under the ROC curve (AUC) for
the broader measures (scoring opportunity and score box possession) and the ultimate
measure (goal scored) of offensive effectiveness. The 95% CI of the AUC for both scoring
opportunity and score box possession includes the AUC for goal scored (Table 10).
Table 10. Area under the ROC curve with confidence interval (CI) showing the association between scoring opportunity, score box possession and goal scored. Team possession outcome Area 95% CI P*
Goal scored 0.74 0.71-0.78 <0.001
Scoring opportunity 0.79 0.74-0.84 <0.001
Score box possession 0.72 0.68-0.76 <0.001
Note: In contrast to goals, scoring opportunities and score box possessions were selected randomly. *Pearson Chi-square.
Thus, the results are very similar regardless of which outcome measure for offensive
effectiveness is used. However, the failure to identify a difference does not necessarily prove
equivalence. Nevertheless, we would argue that our results show such a high degree of
sameness that these broader measures can be used as a proxy for goal scored when comparing
the effectiveness of different playing tactics in soccer. Hence, compared to goal scored, the
use of scoring opportunity or score box possession requires smaller match samples for
meaningful analyses, and may therefore be more feasible.

Overall discussion and conclusions
60
Overall discussion and conclusions
Methodological considerations
The observational limitations due to the quality of the TV production, e.g. the number of
cameras and camera angles used, must be taken into account when interpreting the results of
the studies in this thesis (papers I-V). Typical observational limitations experienced include
difficulties in evaluation of players’ positions and distances, and in determination of areas on
the pitch. We used a TV production which constantly varies camera angles and image sizes
and often there were no demarcation boundaries to show the area of the pitch in which an
event took place. Therefore, errors were likely to happen even with well-prepared operational
definitions and adopted practical measures (Hughes & Snook, 2006; Taylor et al., 2005;
Tucker et al., 2005). It is therefore not surprising that some variables, especially those
involving evaluation of players’ positional characteristics like defensive backup, registered
relatively poor reproducibility.
In paper I, the relatively low reproducibility reported especially for interobserver reliability is
most probably due to the complexity of its analysis system, with many analysis variables
involving qualitative evaluation using three to seven categories. James et al. (2007) argue that
the disparity between two observers is to be expected, especially when the analysis system
involves considerable skill and experience like the one used in this study (see paper I for
details). Consequently, factors such as inadequate analysis training, inaccurate operational
definitions and nature of analysis variables must be taken into account in the interpretation of
its results.

Overall discussion and conclusions
61
The four-week period used by the less experienced observer to train team match performance
analysis in paper I may have been insufficient. The extent of difference in interobserver data
may reflect the considerable experience difference between the two observers. James et al.
(2002) suggest that the variation between experienced and inexperienced observers found in
their study was due to the relative lack of analysis training rather than inaccurate operational
definitions. However, observation in 15 of 22 (68%) variables was done as a purely
qualitative evaluation and achieving precise operational definitions for all variables used in
paper I is difficult. But O’Donoghue (2007) argues that precise operational definitions do not
guarantee good reliability and that good knowledge of the behaviours being analysed is more
important than agreement of the wording of operational definitions. The results in paper I also
show that all 10 variables with moderate or poor κ values for the interobserver agreement
were analysed by qualitative evaluation alone. This finding is consistent with the view that
some observations seem to be naturally more difficult to make without errors than others
(James et al., 2007) and it is then logical to have different levels of reproducibility for
different variables (Hughes et al., 2004a).
In papers II, III and IV, the interpretation of results must bear in mind that the use of variables
defensive backup and defensive cover with fair interobserver reproducibility may cause a
reduced objectivity. However, the combined variable overall defensive score, the one actually
used in the subsequent analyses, was still useful. In fact, these variables’ relatively poor
interobserver reproducibility most probably stems from the observational limitations
experienced when evaluating positions, distances and angles between dynamically interacting
players by using videotapes recorded from a conventional TV coverage.

Overall discussion and conclusions
62
The interpretation of the results in papers III and IV must consider the limitation that the
number of team possessions ending up with a goal when playing against a balanced defence is
small. Therefore we have not presented probability results for all offensive tactics when
playing against a balanced defence.
Balanced defence vs. imbalanced defence
The overall defensive variable overall defensive score used three categories to characterize
team possessions as playing against only balanced defence (balanced defence), against both
balanced and imbalanced defence (mixed) and as playing against only imbalanced defence
(imbalanced defence) throughout the entire team possession. Only categories ‘balanced
defence’ and ‘imbalanced defence’ were included in the assessment of opponent interaction in
papers II-IV. However, the defensive condition constantly changes between ‘balanced
defence’ and ‘imbalanced defence’ and the category ‘mixed’, indicating different degrees of
defensive balance, is well represented in the material. Therefore, it may be more important to
integrate the defensive category ‘mixed’ in the assessment of opponent interaction, especially
when playing possession style of attack. This is because the ability to use elaborate attacks to
create imbalance against a balanced defence within the same team possession is an important
strategy for possession play style of attack to be effective. In other words, elaborate attacks
might be more effective in creating space by dislocating defenders in a balanced defence than
in exploiting imbalances in the opponent’s defence directly. Given that counter attack seeks
to exploit imbalances in the opponent’s defence to achieve penetration, it is logical that
counter attack was found to be more effective than elaborate attack when playing against an
imbalanced rather than a balanced defence. But, it could also be that elaborate attacks were
found to be less effective than counter attacks simply because the assessment of opponent
interaction did consider degree of defensive balance as a distinct difference between balanced

Overall discussion and conclusions
63
and imbalanced defence and not as a change from balanced to imbalanced defence or vice
versa.
The variable overall defensive score reflects the combined probability scores of the defensive
variables defensive pressure, defensive backup and defensive cover. A balanced defence is
achieved when the three defensive tasks (pressure by 1st defender on the opponent player with
the ball, backup by 2nd defender to support 1st defender, and cover by 3rd defender to guide the
important space) are well attended (Worthington, 1980). The 1st defender’s task, i.e. defensive
pressure, is the most important aspect of the balanced/imbalanced defence in zone-oriented
defence. As opposed to defensive backup and defensive cover, the variable defensive pressure
has good interobserver reproducibility (kappa coefficients of 0.68). Thus, further research
should refine degree of defensive balance (including balanced and imbalanced defence) by
studying the different aspects significant in preventing penetration (e.g. defensive pressure)
separately rather than using the combined variable overall defensive score alone.
Complementary study designs
Paper II and III address similar issues related to the effectiveness of different offensive tactics
when taking opponent interaction into account. Paper II employed a cohort design, while a
case-control design was used in paper III. A case-control approach is often used when the
outcome variable of interest (in this case, a team possession resulting in a goal scored) is a
rare event, estimated to apx. 1% of team possessions. In other words, these two papers are
based on different research approaches. A cohort design is generally considered superior to a
case-control design in terms of generalizability. However, the outcome variable of primary
interest is of course goals scored, and it would simply not be feasible to do a cohort-like study
using this outcome variable. In stead, it was possible to use an intermediate outcome variable,
score box possession. This means both approaches have limitations. Interestingly, the results
Overall discussion and conclusions
64
are very similar regardless of design and outcome variable used. Thus, paper II (cohort
design) and paper III (case-control design) complement each other and, considered together,
their findings clearly show that the assessment of opponent interaction is critical to evaluate
the effectiveness of offensive tactics, and hence improves the validity of team match
performance analysis.
Style and level of play
All the samples used in five studies (papers I-V) included in this dissertation were taken from
the Norwegian top professional soccer league matches, which clearly represent a lower level
of play than the top leagues in Europe. Consequently, the results obtained may be a reflection
of the playing level or style in this particular league. Even if the teams in the league varied in
their playing styles and were included with a similar number of team possessions, care should
be taken when extrapolating these results to other soccer leagues or playing levels. For
example, one might expect that the ability to play effectively elaborate attacks is higher in
soccer leagues with a playing tradition more dominated by possession play than the
Norwegian league. Thus, elaborate attacks might be more effective in other soccer leagues
due to different and/or better tactical and technical proficiency.
It is obvious that different styles of play put emphasis on different playing skills for individual
players. For example speed, strength and timing of forward movements and passes are the
aspects of play most focused upon in the direct play style of attack, while possession play put
more emphasis on technique and refinement in order to constantly create space (Olsen et al,
1994). Elsewhere, it was reported that successful teams use more touches per possession
(Hughes et al., 1988) and kept the ball for longer durations (Hughes & Churchill, 2004)
compared to unsuccessful teams. Probably, successful teams have players who possess the
necessary technical skills to sustain longer passing sequences. Hence, as the players at the

Overall discussion and conclusions
65
higher levels of play seem to be more technically skilful, elaborate attacks may be more
effective at the higher level of play than the Norwegian league.
Conclusions
Keeping in mind the methodological limitations narrated above, the findings from the five
studies undertaken in this thesis can be concluded as follows:
1. A new method for team match performance analysis, which includes an assessment of
opponent interaction by using multidimensional categorical data, has been developed
as a reliable method for most variables used.
2. Counter attack had a higher probability for achieving a score box possession (shooting
opportunity) than elaborate attack when playing against an imbalanced defence but not
against a balanced defence.
3. Counter attack had a higher probability for scoring a goal than elaborate attack when
playing against an imbalanced defence.
4. Counter attack had a higher probability for scoring a goal than elaborate attack when
playing against an imbalanced defence at home, but not away.
5. Broader measures (scoring opportunity and score box possession) have very similar
association as the ultimate measure (goal scored) of offensive effectiveness when
comparing the effectiveness of different playing tactics.
In other words, this dissertation has demonstrated that assessment of opponent interaction is
critical to evaluate the effectiveness of playing tactics on the probability for producing a score
box possession (shooting opportunity), a goal, and for producing a goal when playing at home
compared to away. Hence, it improves the validity of team match performance analysis. This
was accomplished by carefully considering methodological aspects rarely used in previous

Overall discussion and conclusions
66
research, including different study designs, appropriate procedures for the random selection of
events, appropriate sample sizes, and the use of a multivariate logistic regression model.
The contextual approach to performance analysis was originally applied in this dissertation to
advance knowledge that would have substantial applied relevance. An explicit goal has
thereby been to inspire and inform the reader to apply some of the information from its
findings to practice in the real world. This may not only apply to those interested in soccer,
but also in other sports within the category ‘invasion games’. In the next section I provide a
tentative start targeting soccer practitioners as well as researchers.
Implications for practice
67
Implications for practice
Implications for match performance analysis The analysis of match performance in most contemporary studies is done in isolation from the
match context by using unidimensional frequency data. In our opinion, the analysis of match
performance must include an assessment of opponent interaction to be more valid. Team
match performance analysis introduced in this thesis (Paper I) has been developed with this in
mind - to analyse opposition relationship by using multidimensional qualitative evaluation
through categorical variables representing offensive and defensive playing strategies, and
their outcomes. Thus, this new analysis system represents a potentially valuable tool for more
valid assessment of team match performance.
In addition, based on the results of paper V, the possibility to conduct feasible and meaningful
analyses by using scoring opportunity or score box possession (shooting opportunity) as a
measure of offensive effectiveness instead of goal scoring should encourage researchers to
employ more appropriate study designs which include an adequate sample size of randomly
selected events.
The selection of variables and categories was based on the two closely related theoretical
frameworks (principles of play) explaining players’ functional roles (Worthington, 1980) and
structure of the game (Olsen, 1981; Olsen et al., 1994) as a relationship between space and
time in soccer. Hence, these categorical variables cover different dimensions of match
performance including temporal and spatial dimensions. Certainly, there may be other
relevant variables and categories or other perspectives describing team match performance not
covered by this method, and others may choose to develop the method further.

Implications for practice
68
Implications for match performance
The current studies (Papers II and III) revealed that information about the relative
effectiveness of offensive playing tactics according to the degree of defensive balance can be
used to improve team’s ability to produce and prevent a score box possession (a shooting
opportunity) and goal scoring effectively. In specific, counter attacks are more effective in
producing score box possession (shooting opportunity) and goals than elaborate attacks when
playing against an imbalanced defence. This information can be used when coaches and
players plan and practice how to take advantage of opponent’s choice of playing tactics in a
match play both offensively and defensively. It is important to realize that ‘balanced defence’
and ‘imbalanced defence’ are dynamic rather than static defensive conditions. This means that
during a single team possession the opponent’s defence might shift from balanced to
imbalanced at a specific point of time, as a result of for example a successful dribble or cross
pass by the attacking team. Hence, the attacking team’s ability to utilize these moments of
emerging imbalance may be decisive in producing more effective attacks.
The findings of this thesis (Paper IV) may as well have some practical implications for soccer
players and coaches as they prepare to play away from home. They may reasonably be
expected to face a home team that more frequently takes advantage of imbalances in the
opponent’s defence, wins the ball in play at the final third area and uses penetrative passes.
This information can be used to plan and practice effective counteracting defensive tactics
(e.g. defensive drills against these offensive tactics), while offensively employing the tactics
of counter attack, ball winning in the final third and penetrative passes. Also, the current
findings may suggest that teams should adopt offensive-oriented playing style also when
playing away. However, whether the benefit of such an approach outweighs the consequence
of risk involved defensively remains unknown.
Implications for practice
69
Moreover, based on the results of paper V, measuring offensive effectiveness by using either
scoring opportunity or score box possession (shooting opportunity) may enable soccer
practitioners to objectively see behind single match results, which are often influenced by
chance. Moreover, the use of these broader measures may provide useful additional process
information linked to their outcome.

References
70
References
Altman, D. G. (1991). Some common problems in medical research. In D.G.Altman (Ed.), Practical statistics for medical research (pp. 403-409). London: Chapman & Hall.
Atkinson, G. & Nevill, A. M. (1998). Statistical methods for assessing measurement error (reliability) in variables relevant to sports Medicine. Sports Med, 26, 217-238.
Balmer, N. J., Nevill, A. M., & Williams, M. (2001). Home advantage in the Winter Olympics (1908-1998). Journal of sports sciences, 19, 129-139.
Bangsbo, J. & Peitersen, B. (1997). Det gode hold. Fodboldspillets taktik 2. DHL Hovedland.
Bate, R. (1988). Football chance: tactics and strategy. In T. Reilly, A. Lees, K. Davids, & W. J. Murphy (Eds.), Science and Football (pp. 293-301). London: E & FN SPON.
Bloomfield, J. R., Polman, R. C. J., & O'Donoghue, P. G. (2005). Effects of score-line on team strategies in FA premier league soccer. Journal of sports sciences, 23, 192-193.
Boronico, J. S. & Newbert, S. L. (2001). An empirically driven mathematical modelling analysis for play calling strategy in American Football. European Sport Management Quarterly, 1, 21-38.
Boyko, R. H., Boyko, A. R., & Boyko, M. G. (2007). Referee bias contributes to home advantage in English Premiership football. Journal of sports sciences, 25, 1185-1194.
Bray, S. R. (1999). The home advantage from an individual team perspective. Jounal of Applied Sport Psychology, 11, 116-125.
Brown, T. D., Van Raalte, J. L., Brewer, B. W., Winter, C. R., Cornelius, A. E., & Andersen, M. B. (2002). World Cup soccer home advantage. Journal of sport behavior, 25, 134-144.
Bunker, D. & Thorpe, R. (1982). A model for teaching games in the secondary school. Bulletin of Physical Education, 18(1), 5-8
Carling, C., Williams, A. M., & Reilly, T. (2005). Handbook of soccer match analysis. A systematic approach to improving performance. (First ed.) London & New York: Routledge Taylor & Francis Group.
Carron, A. V., Loughhead, T. M., & Bray, S. R. (2005). The home advantage in sport competitions: Courneya and Carron's (1992) conceptual framework a decade later. Journal of sports sciences, 23, 395-407.
Clarke, S. R. & Norman, J. M. (1995). Home advantage of individual clubs in English soccer. The Statistician, 44, 509-521.
Cooper, S. M., Hughes, M., O'Donoghue, P., & Nevill, A. M. (2007). A simple statistical method for assessing the reliability of data entered into sport performance analysis systems. International Journal of Performance Analysis in Sport, 7, 87-109.

References
71
Dennis, P. W. & Carron, A. V. (1999). Strategic decisions of ice hockey coaches as a function of game location. Journal of sports sciences, 17, 263-268.
Downward, P. & Jones, M. (2007). Effects of crowd size on referee decisions: Analysis of the FA Cup. Journal of sports sciences, 25, 1541-1545.
Dufour, W. (1993). Computer-assisted scouting in soccer. In T. Reilly, J. Clarys, & A. Stibbe (Eds.), Science and Football II (pp. 160-166). London: E & FN SPON.
Elias, N. & Dunning, E. (1966). Dynamics of group sports with special references to football. British Journal of Sociology, 17, 388-402.
Ellis, M. (1983). Similarities and differences in games: a system for classification. In AEISEP.
Franks, I. (1988). Analysis of association football. Soccer Journal, 33, 35-43.
Franks, I. M. (1993). The effects of experience on the detection and location of performance differences in a gymnastic technique. Research Quarterly for Exercise and Sport, 64, 227-231.
Franks, I. M. (2004). The need for feedback. In M.Hughes & I. M. Franks (Eds.), Notational analysis of sport ( London & New York: Routledge Taylor & Francis Group.
Franks, I. M. & Goodman, D. (1986). A systematic approach to analyzing sports performance. Journal of sports sciences, 4, 49-59.
Franks, I. M. & Goodman, D. (1984). A hierarchial approach to performance analysis. Science Periodical on Research and Technology in Sport, June.
Franks, I. M., Goodman, D., & Miller, G. (1983). Analysis of performance: qualitative or quantitative. Science Periodical on Research and Technology in Sport, March.
Franks, I. M. & McGarry, T. (1996). The science of match analysis. In T.Reilly (Ed.), Science and soccer (First ed., pp. 363-375). London: E & FN Spon.
Franks, I. M. & Miller, G. (1986). Eyewitness testimony in sport. Journal of sport behavior, 9, 38-45.
Franks, I. M. & Miller, G. (1991). Training coaches to observe and remember. Journal of sports sciences, 9, 285-297.
Fullerton, H. S. (1910). The inside game: the science of baseball. The American Magazine, LXX, 2-13. Retrieved November 15, 2008, from http://www.thediamondangle.com/archive/dec02/insidegame.html
Goksøyr, M., Larsen, Ø., & Peterson, T. (1997). The development of playing styles in soccer - from diffusion to contraction?
Grehaigne, J. F. (1991). A new method of goal analysis. Science and Football, 5, 10-16.
Grehaigne, J. F., Bouthier, D., & David, B. (1997). Dynamic-system analysis of opponent relationships in collective actions in soccer. Journal of sports sciences, 15, 137-149.

References
72
Grehaigne, J. F., Bouthier, D., & Godbout, P. (1999). The foundations of tactics and strategy in team sports. Journal of Teaching in Physical Education, 18, 159-174.
Grehaigne, J. F. & Godbout, P. (1995). Tactical knowledge in team sports from a constructivist and cognitivist perspective. Quest, 47, 490-505.
Grehaigne, J. F., Mahut, B., & Fernandez, A. (2001). Qualitative evaluation tools to analyse soccer. International Journal of Performance Analysis in Sport, 1, 52-61.
Harris, S. & Reilly, T. (1988). Space, team work and attacking success in soccer. In T. Reilly, A. Lees, K. Davids, & W. J. Murphy (Eds.), Science and Football (pp. 322-328). London: E & FN SPON.
Holm, J., Olsen, E., Larsen, O., & Natvig, S. (1998). Eventyret Drillos. Norway: Schibsted Forlag.
Hooper, T. (1998). Teaching games for understanding using progressive principles of play. CAHPERD, 64, 4-7.
Hughes, C. (1990). The winning formula. London: William Collins Sons & Co Ltd.
Hughes, M. (2004). Notational analysis - a mathematical perspective. International Journal of Performance Analysis in Sport, 4, 97-139.
Hughes, M. D. & Bartlett, R. M. (2002). The use of performance indicators in performance analysis. Journal of Sports Sciences, 20, 739-754.
Hughes, M. & Churchill, S. (2004). Attacking profiles of successful and unsuccessful teams in Copa America 2001. Journal of sports sciences, 22, 505.
Hughes, M., Cooper, S. M., & Nevill, A. (2004a). Analysis of notation data: reliability. In M.Hughes & I. M. Franks (Eds.), Notational analysis of sport (Second ed., pp. 189-204). London & New York: Routledge Taylor & Francis Group.
Hughes, M., Dawkins, N., Reed, D., & Mills, J. (1998). The perturbation effect and goal opportunities in soccer. Journal of sports sciences, 16, 20.
Hughes, M., Evans, S., & Wells, J. (2004b). Establishing normative profiles in performance analysis. In M.Hughes & I. M. Franks (Eds.), Notational analysis of sport (Second ed., London & New York: Routledge Taylor & Francis Group.
Hughes, M. & Franks, I. (2005). Analysis of passing sequences, shots and goals in soccer. Journal of sports sciences, 23, 509-514.
Hughes, M. & Franks, I. M. (1997). Notational analysis of sport. (First ed.) London: E & FN Spon.
Hughes, M. & Franks, I. M. (2004). Notational analysis of sport. (Second ed.) London & New York: Routledge Taylor & Francis Group.

References
73
Hughes, M., Langridge, C., & Dawkins, N. (2001). Pertubation actions not leading to shots on goal in soccer. In M. Hughes (Ed.), Notational Analysis of Sport IV (pp. 23-32). Cardiff: UWIC.
Hughes, M. & Reed, D. (2005). Creating a performance profile using perturbations in soccer. In D. Milanovic & F. Prot (Eds.), 4th International Scientific Conference on Kinesiology (pp. 34-53). Zagreb: University of Zagreb.
Hughes, M., Robertson, K., & Nicholson, A. (1988). Comparison of patterns of play of successful and unsuccessful teams in the 1986 World Cup for soccer. In T. Reilly, A. Lees, K. Davids, & W. J. Murphy (Eds.), Science and Football (pp. 363-367). London: E & FN SPON.
Hughes, M. & Snook, N. (2006). Effectiveness of attacking play in the 2004 European Championships. In H. Dancs, M. Hughes, & P. G. O'Donoghue (Eds.), World Congress of Performance Analysis of Sport 7 (pp. 46-62). Cardiff: CPA UWIC Press.
Hughes, M. D. & Bartlett, R. M. (2002). The use of performance indicators in performance analysis. Journal of sports sciences, 20, 739-754.
International Journal of Performance Analysis in Sport (July 2001 up to November 2008). Retrieved November 30, 2008, from http://www.ingentaconnect.com/content/uwic/ujpa
James, N., Mellalieu, S. D., & Hollely, C. (2002). Analysis of strategies in soccer as a function of European and domestic competition. International Journal of Performance Analysis in Sport, 2, 85-103.
James, N., Taylor, J., & Stanley, S. (2007). Reliability procedures for categorical data in performance analysis. International Journal of Performance Analysis in Sport, 7, 1-11.
Jones, P. D., James, N., & Mellalieu, S. D. (2004). Possession as a performance indicator in soccer. International Journal of Performance Analysis in Sport, 4, 98-102.
Konstadinidou, X. & Tsigilis, N. (2005). Offensive playing profiles of football teams from the 1999 Women's World Cup Finals. International Journal of Performance Analysis in Sport, 5, 61-71.
Lachin, J. M. (1981). Introduction to sample size determination and power analysis for clinical trials. Controlled Clinical Trials, 2, 93-113.
Lago, C. & Martin, R. (2007). Determinants of possession of the ball in soccer. Journal of sports sciences, 25, 969-974.
Laird, P. & Waters, L. (2008). Eyewitness recollection of sport coaches. International Journal of Performance Analysis in Sport, 8, 76-84.
Larsen, O. (1992). Angrep of effektivitet. Master. Norwegian University of Sport and Physical Education.
Luhtanen, P., Belinskij, A., Hayrinen, M., & Vanttinen, T. (2001). A comparative tournament analysis between the EURO 1996 and 2000 in soccer. International Journal of Performance Analysis in Sport, 1, 74-82.

References
74
Lyons, K. (1996). Lloyd Messersmith. In M. Hughes (Ed.), Notational Analysis of Sport - I & II (pp. 49-59). Cardiff: UWIC.
Mason, T. (1995). Passion of the People. Football in South America. London: Verso.
McGarry, T., Anderson, D. I., Wallace, S. A., Hughes, M. D., & Franks, I. M. (2002). Sport competition as a dynamical self-organizing system. Journal of sports sciences, 20, 771-781.
McGarry, T. & Franks, I. M. (2003). The science of match analysis. In T.Reilly & A. M. Williams (Eds.), Science and socccer (pp. 265-275). London & New York: Routledge Taylor & Francis Group.
McGarry, T., Khan, M. A., & Franks, I. M. (1999). On the presence and absence of behavioural traits in sport: An example from championship squash match-play. Journal of sports sciences, 17, 297-311.
McGarry, T. & Perl, J. (2004). Models of sports contests: Markov processes, dynamical systems and neural networks. In M.Hughes & I. M. Franks (Eds.), Notational analysis of sport (pp. 227-242). London & New York: Routledge Taylor & Francis Group.
Messersmith, L. L. & Bucher, C. C. (1939). The distance traversed by big ten basketball players. Research Quarterly, 10, 61-62.
Morris, D. (1981). The soccer tribe. London: Jonathan Cape Ltd.
Nevill, A. M., Balmer, N., & Williams, A. M. (2002). The influence of crowd noise and experience upon refereeing decisions in football. Psychology of Sport and Exercise, 3, 261-272.
Nevill, A. M. & Holder, R. L. (1999). Home advantage in sport - An overview of studies on the advantage of playing at home. Sports Med, 28, 221-236.
Nevill, A. M., Newell, S. M., & Gale, S. (1996). Factors associated with home advantage in English and Scottish soccer matches. Journal of sports sciences, 14, 181-186.
O'Donoghue, P. (2007). Reliability issues in performance analysis. InternationalJournal of Performance Analysis in Sport, 7, 35-48.
Olsen, E (1981). Fotball taktikk [Unpublished work]. Norway: Norwegian School of Sport Sciences.
Olsen, E. & Larsen, O. (1997). Use of match analysis by coaches. In T. Reilly, J. Bangsbo, & M. Hughes (Eds.), Science and Football III (pp. 209-220). London: E & FN SPON.
Olsen, E., Larsen, O., & Semb, N. J. (1994). Effektiv fotball. Norway: Gyldendal Norsk Forlag A/S.
Perl, J. (2002). Game analysis and control by means of continuously learning networks. International Journal of Performance Analysis in Sport, 2, 21-35.
Perl, J. (2001). Artificial neural networks in sports: New concepts and approaches. International Journal of Performance Analysis in Sport, 1, 106-121.

References
75
Pollard, R. (2006). Home advantage in soccer: Variations in its magnitude and a literature review of the inter-related factors associated with its existence. Journal of sport behavior, 29, 169-189.
Pollard, R. (1986). Home advantage in soccer: a retrospective analysis. Journal of sports sciences, 4, 237-248.
Pollard, R. & Pollard, G. (2005). Long-term trends in home advantage in professional team sports in North America and England (1876-2003). Journal of sports sciences, 23, 337-350.
Pollard, R. & Reep, C. (1997). Measuring the effectiveness of playing strategies at soccer. The Statistician, 46, 541-550.
Pollard, R., Reep, C., & Hartley, S. (1988). The quantitative comparison of playing styles in soccer. In T. Reilly, A. Lees, K. Davids, & W. J. Murphy (Eds.), Science and Football (pp. 309-315). London: E & FN SPON.
Reep, C. & Benjamin, B. (1968). Skill and chance in association football. Journal of Royal Statistical Society, Series A, 131, 581-585.
Reilly, T., Bangsbo, J., & Hughes, M. (1997). Science and Football III. London: E & FN SPON.
Reilly, T., Clarys, J., & Stibbe, S. (1995). Science and Football II. London: E & FN SPON.
Reilly, T., Lees, A., Davids, K., & Murphy, W. J. (1988). Science and Football. London: E & FN SPON.
Reilly, T. & Thomas, V. (1976). Motion analysis of work-rate in different positional roles in professional football match-play. Journal of human movement studies, 2, 87-97.
Scoulding, A., James, N., & Taylor, J. (2004). Passing in the soccer World Cup 2002. International Journal of Performance Analysis in Sport, 4, 36-41.
Seabra, F. & Dantas, L. (2006). Space definition for match analysis in soccer. International Journal of Performance Analysis in Sport, 6, 97-113.
Sutter, M. & Kocher, M. G. (2004). Favoritism of agents - The case of referees' home bias. Journal of Economic Psychology, 25, 461-469.
Suzuki, K. & Nishijima, T. (2004). Validity of a soccer defending skill scale (SDSS) using game performances. International Journal of Sport and Health Science, 2, 34-49.
Taylor, J., Mellalieu, S. D., & James, N. (2004). Behavioural comparisons of positional demands in professional soccer. International Journal of Performance Analysis in Sport, 4, 81-97.
Taylor, J. B., Mellalieu, S. D., & James, N. (2005). A comparison of individual and unit tactical behaviour and team strategy in professional soccer. International Journal of Performance Analysis in Sport, 5, 87-101.

References
76
Taylor, J. B., Mellalieu, S. D., James, N., & Shearer, D. A. (2008). The influence of match location, quality of opposition, and match status on technical performance in professional association football. Journal of sports sciences, 26, 885-895.
Thornton, S. (1971). A movement perspective of Rudolph Laban. London: McDonald & Evans.
Tucker, W., Mellalieu, S. D., James, N., & Taylor, J. B. (2005). Game location effects in professional soccer: A case study. International Journal of Performance Analysis in Sport, 5, 23-35.
Wade, A. (1967). The F. A. Guide to training and coaching. London: Heinemann.
Ward, R. E., Jr. (1998). Rituals, first impressions, and the opening day home advantage. Sociology of Sport Journal, 15, 279-293.
Werner, P. & Almond, L. (1990). Models of games education. JOPERD, 23-27.
Worthington, E. (1980). Teaching soccer skills. (Second ed.) London: Henry Kimpton (Publishers) Ltd.
Yamanaka, K., Hughes, M., & Lott, M. (1993). An analysis of playing patterns in the 1990 World Cup for association football. In T. Reilly, J. Clarys, & A. Stibbe (Eds.), Science and Football II (pp. 206-214). London: E & FN Spon.

Paper I
77
Papers I-V
Paper I

Paper II
97
Paper II

Paper III
129
Paper III

Paper IV
155
Paper IV

Paper IV
156

Paper IV
157
Running head: EFFECTS OF MATCH LOCATION ON TACTICS IN SOCCER
Effects of Match Location on Playing Tactics for Goal Scoring in Norwegian
Professional Soccer
A. P. C. Tenga, I. Holme, L. T. Ronglan and R. Bahr
Norwegian School of Sport Sciences
Author Note
We are indebted to Daniel Kanstad for video analysis.
Correspondence concerning this article should be addressed to Albin P. C.
Tenga, Norwegian School of Sport Sciences, P. O. Box 4014 Ullevaal Stadion, N-0806
OSLO, NORWAY. E-mail: [email protected]

Paper IV
158
Abstract
The purpose of this retrospective study was to examine the effect of match location on
soccer playing tactics by assessing opponent interaction. The sample included 203 goals
and 1688 random team possessions (“controls”). Multiple logistic regression analyses
showed significant differences in the odds ratio for goal scoring in the interaction
between playing tactics and match locations. For the variable “team possession type”
(χ2=5.05, P=0.025), counter attack (24.5%) and elaborate attack (21.8%) produced
goals in higher percentages of attempts at home than away (19.8% and 20.5%), with
counter attack being more effective than elaborate attack when playing against an
imbalanced defence at home, but not away. Assessment of opponent interaction is
critical to evaluate the effectiveness of playing tactics on the probability for scoring
goals according to match location.

Paper IV
159
Effects of Match Location on Playing Tactics for Goal Scoring in Norwegian
Professional Soccer
That sports teams in balanced competitions achieve better results when playing
at home than away from home, is a consistent finding (Carron, Loughhead, & Bray,
2005; Nevill & Holder, 1999). This phenomenon, known as ‘home advantage’, exists in
all professional team sports, but is most pronounced in soccer (Pollard, 1986, 2006a).
However, despite much research (e.g. Downward & Jones, 2007; L. Page & K. Page,
2007; Nevill, Balmer, & Williams, 2002; Nevill, Newell, & Gale, 1996; Pollard, 2006b;
R. H. Boyko, A. R. Boyko, & M. G. Boyko, 2007; R. Pollard & G. Pollard, 2005; Sutter
& Kocher, 2007), results have so far failed to isolate a dominant factor explaining the
home advantage in soccer. In an attempt to understand this phenomenon, Carron et al.
(2005) and Courneya and Carron (1992) proposed that critical behaviours such as
strategic and tactical decisions have to be influenced. Similarly, special playing tactics
have been recognized by Pollard (1986, 2006a) as one of many inter-related factors
associated with home advantage in soccer.
Few studies have directly examined whether the primary/fundamental measures
of match performance (i.e. technical and tactical aspects) differ as a function of match
location in soccer (e.g. Lago & Martin, 2007; Sasaki, Nevill, & Reilly, 1999; Taylor,
Mellalieu, James, & Shearer, 2008; Tucker et al., 2005). Two of these studies have
considered how playing at home versus away influences the tactical aspects of match
performance (Lago & Martin, 2007; Tucker et al., 2005). However, none of these
previous studies has considered a direct assessment of opponent interaction in their
analyses. Since the opposition creates the unexpected in a match, necessitating constant
adaptation to constraints caused by the confrontation between two teams (Elias &
Dunning, 1966; Grehaigne, Bouthier, & David, 1997), any analysis of the effect of

Paper IV
160
match location on technical and tactical aspects of match performance must consider the
interaction between the two opposing teams.
An assessment of opponent interaction for the analysis of the effect of match
location on playing tactics for goal scoring is possible by using a case-control design. It
necessitates the use of a control group with an adequate sample size of randomly
selected events and logistic regression analysis to allow a more complex comparison of
binary response variables (Nevill et al., 2002). This type of statistical analysis has been
rarely used in the analysis of match performance in soccer (e.g. Ensum, Pollard, &
Taylor, 2004; Pollard & Reep, 1997). Further, to consider opponent interaction in the
analysis, one has to analyse opposing relationship between two teams (or players),
rather than two opposing teams (or players) individually in isolation from the match
context. It is possible to analyse opposing relationship when using a match play
situation as the basic unit of analysis rather than a team (or a player), and therefore a
team possession was used as the unit of analysis in this study. Since match play
situations emerge from the dialectical interplay of play and counter-play produced by
both teams (Grehaigne, Bouthier, & Godbout, 1999; Grehaigne & Godbout, 1995), it
enables breaking down of a match play action without losing its confrontational nature.
Moreover, the use of categorical data based on multidimensional qualitative
evaluation instead of unidimensional frequency data may improve our ability to
describe a soccer match play action (Grehaigne, Mahut, & Fernandez, 2001; Hughes &
Bartlett, 2002; Suzuki & Nishijima, 2004). This is because multidimensional qualitative
evaluation permits the inclusion of data from the qualitative evaluation of different
dimensions of performance involved in the opponent interaction.
Thus, the main aim of this study was to examine the effect of match location on
playing tactics for goal scoring, counter attack (“direct play”) vs. elaborate attack

Paper IV
161
(“possession play”) (see Table 1 for definitions), by assessing opponent interaction in
Norwegian elite soccer.
Methods
Material
All available videotapes from 163 out of 182 (90%) matches played in the
Norwegian professional male league during the 2004 season were used. The league
involves 14 teams and follows a double round robin competition format, which means
that each team played 26 matches, 13 home and 13 away.
First, a sample (“cases”) of all goals scored by counter attack and elaborate
attack types of team possession were identified on the tapes, including 203 (43%) out of
a total of 476 goals scored, 117 at home (58%) and 86 away (42%). Goals scored by
team possessions started by a set play (n=273, 57% of all goals) were excluded.
Second, to obtain a random sample of 3260 control team possessions (see
power calculations below), we assigned each match a computer-generated random
decimal number between 0 and 1, which was multiplied by 86 to indicate the beginning
(in minutes) of a match period from which a total of 20 consecutive team possessions
would be extracted. This was based on the assumption that 20 consecutive team
possessions lasts 6.5 minutes on average, and that there is 2-3 minutes of extra time
added to every match.
This random sample of 3260 team possessions was then analysed for team
possession type, namely counter attack, elaborate attack, and set play, identifying a final
control sample of 1688 team possessions of the counter attack and elaborate attack types
that started by winning the ball in play, 847 at home (50%) and 841 away (50%). Team
possessions started by set plays were excluded (N=1572).
Quantifying home advantage
Paper IV
162
Home advantage may be expressed either as home win percentage using points
or matches won, or home goal percentage using goals scored (Pollard, 1986, 2006b).
However, since the current study examines the effect of match location on playing
tactics for goal scoring, home advantage was calculated using goals scored rather than
points or matches. Home advantage was therefore defined as the proportion of team
possessions at home ending up with a goal scored compared to the proportion of team
possessions away ending up with a goal.
Team match performance analysis
A team possession was used as the basic unit of analysis and was defined
according to Pollard and Reep (1997): “A team possession starts when a player gains
possession of the ball by any means other than from a player of the same team. The
player must have enough control over the ball to be able to have a deliberate influence
on its subsequent direction. The team possession may continue with a series of passes
between players of the same team but ends immediately when one of the following
events occurs: a) the ball goes out of play; b) the ball touches a player of the opposing
team (e.g. by means of a tackle, an intercepted pass or a shot being saved). A
momentary touch that does not significantly change the direction of the ball is excluded;
c) an infringement of the rules takes place (e.g. a player is offside or a foul is
committed).” (p. 542).
Table 1 presents the definitions of ten ordered categorical variables used in this
study. These include: possession outcome (one dependent variable); team possession
type, starting zone, pass number, pass length, pass penetration and space utilization (six
offensive independent variables) and zone defence tactics of defensive pressure,
defensive backup and defensive cover (three defensive independent variables). The

Paper IV
163
dependent variable, possession outcome, had two primary values – goal scoring or no
goal scoring.
****Table 1 near here****
Video analysis
The video material in DigiBeta video format was reviewed by using a
computer-controlled Sony DigiBeta video machine. All goals and twenty consecutive
team possessions were extracted from each of the 163 matches by the help of a G4 Mac
machine with software program FinalCut Pro version 9.0. A total of 476 goals and 3260
random team possessions in Mac format were stored, and then converted from Mac
format to WMV PC format to enable further analysis by the help of Windows Media
Player. A soccer coach/researcher (AT) experienced in match performance analysis and
a soccer coach/master student (DK) each analysed about half of the goals and control
team possessions. Earlier these two analysts recorded reliability within acceptable limits
in all variables used, with the kappa values from the interobserver test showing 4 (40%)
very good, 4 (40%) good and 2 (20%) fair of 10 variables according to Altman (1991).
The video analysis data were registered directly in SPSS (version 15.0, SPSS Inc.,
Chicago). The study was approved by the Norwegian Social Science Data Services
(NSD).
Statistical analysis
The available 203 goals and 1688 controls from either counter attack or
elaborate attack team possession types that started by winning the ball in play were
used. The null hypothesis, that there would be no difference in effectiveness between
the two main playing tactics (counter attack vs. elaborate attack) for goal scoring at

Paper IV
164
home versus away, was tested by a multiple logistic regression analysis. The odds ratio
for goal scoring by one playing tactic compared to the opposite tactic at home versus
away was estimated by an interaction between match locations and playing tactics. As
independent variables we used six offensive tactics, each of which had two categories:
counter attack versus elaborate attack, final third versus first third, long possession
versus short possession, long pass versus short pass, penetrative pass versus non-
penetrative pass, and space pass versus foot pass, and for each variable a product term
between that variable and match location was also added. The significance of the
interaction term was tested by a simple Wald chi-square test. To control for the effects
of the degree of defensive balance, subgroup analyses were done. The odds ratio for
goal scoring by one playing tactic compared to the opposite tactic at home versus away
when playing against a balanced defence and against an imbalanced defence separately,
deleting the rest of the situations, was estimated. We used a significance level of P<0.05
in all tests.
Results
Descriptive analysis
A total of 1891 team possessions (203 goals and 1688 random controls) using
counter attack and elaborate attack types were included in the final sample. The 14
teams included scored an average of 8 goals at home (ranging from 2 to 15 goals) and 6
goals away (ranging from 2 to 11 goals). As controls, these teams performed an average
of 61 team possessions at home (ranging from 46 to 72 team possessions) and 60 team
possessions away (ranging from 48 to 77 team possessions). The proportion of goals
scored at home (58%) was higher than away (42%), while no difference was registered
between proportions of randomly selected controls performed at home and away (i.e.
50% each). Table 2 and 3 show number and percentage of goals scored at home and

Paper IV
165
away for overall and subgroup analyses, respectively. Higher percentages of goals were
produced by the playing tactics at home than away for all variables except the defensive
tactics tight pressure, present backup and balanced defence (Table 2 & 3). In addition,
offensive playing tactics produced higher percentages of goals after controlling for the
effects of imbalanced defence (Table 3) than when unadjusted overall analyses were
done (Table 2).
****Table 2 near here****
****Table 3 near here****
Logistic regression analyses
Table 4 shows odds ratio and Wald chi-square for goal scoring in the
interaction term for the overall analysis. There were significant differences in the odds
ratio for goal scoring in the interaction between the two opposite offensive tactics and
match locations (home vs. away) for the variables “team possession type” (χ2=12.17,
P<0.001), “starting zone” (χ2=11.67, P=0.003) and “pass penetration” (χ2=49.43,
P<0.001) (Table 4). For the main variable “team possession type”, counter attack
(15.3%) and elaborate attack (9.9%) produced goals in higher percentages of attempts
at home than away (11.4% and 7.8%), with counter attack being more effective than
elaborate attack both at home and away (Table 2). Note that the interactions with
significant differences for the variables “pass length” and “space utilization” involved
the offensive tactic “both” and therefore were not considered (Table 4).
Table 5 shows odds ratio and Wald chi-square for goal scoring in the
interaction term for the subgroup analysis. Significant differences were observed in the

Paper IV
166
odds ratio for goal scoring in the interaction between the two opposite offensive tactics
and match locations (home vs. away) for the variables “team possession type” (χ2=5.05,
P=0.025) and “pass penetration” (χ2=34.32, P<0.001) when playing against an
imbalanced defence (Table 5). For the main variable “team possession type”, counter
attack (24.5%) and elaborate attack (21.8%) produced goals in higher percentages of
attempts at home than away (19.8% and 20.5%), with counter attack being more
effective than elaborate attack at home, but not away (Table 3). However, most odds
ratios could not be estimated when playing against a balanced defence due to few team
possessions (too few goals scored against a balanced defence) and therefore they were
not reported.
****Table 4 near here****
****Table 5 near here****
Discussion
The main outcome of this study was that the assessment of opponent
interaction in goals and random control team possessions revealed significant
differences in the probability of goal scoring between offensive tactics when playing
against an imbalanced defence at home versus away. However, the probability results
for offensive tactics when playing against a balanced defence were not reported because
their values could not be estimated precisely enough. For the main variable “team
possession type”, counter attack and elaborate attack produced more goals at home
than away when playing against an imbalanced defence, with counter attack being more
effective than elaborate attack at home, but not away. Thus, these findings show that
Paper IV
167
the assessment of opponent interaction is critical to evaluate the effectiveness of
offensive tactics according to match location, and improves the validity of analysis of
home advantage in soccer match performance.
It should be noted that this study has some limitations, which must be taken
into account when interpreting its results. It is a retrospective study, and the number of
team possessions ending up with a goal when playing against a balanced defence is
small. Therefore we have not presented probability results for all offensive tactics when
playing against a balanced defence. Also, the use of variables “defensive backup” and
“defensive cover” with fair interobserver reproducibility may cause a reduced
objectivity. However, the combined variable “overall defensive score”, the one actually
used in the subsequent analysis, was still useful. In fact, these variables’ relatively poor
interobserver reproducibility most probably stems from the observational limitations
experienced when evaluating positions, distances and angles between dynamically
interacting players by using videotapes recorded from a conventional TV coverage.
This study has strengths worthy to be considered as well. It is a case-controlled
study using a large sample size of controls randomly extracted from matches played in
the Norwegian professional league. Moreover, logistic regression analysis, the
appropriate statistical method for comparisons of categorical differences associated with
binary response variables (Nevill et al., 2002), was used. The use of multidimensional
qualitative data enables the current study to analyse different factors of match
performance which usually are difficult to measure directly, as well as their
interdependency.
The differences in methods for quantifying home advantage, study design and
variable types and their definitions make a direct comparison between studies difficult.
Despite this, the magnitude of home advantage and the effect of match location on

Paper IV
168
playing tactics found in our study correspond well with findings in previous studies on
league play. Pollard (2006b) reported the same magnitude of home advantage as the
current study (58%), but he used points gained expressed as home win percentage
(HWP) for the six seasons (1998 to 2003) of the professional soccer league in Norway.
Using the method of home goal percentage (HGP) as in this study, R. H. Boyko et al.
(2007) registered the average of 51% (ranging from 44% to 67%) home advantage for
the 1992-2005 seasons in the English Premier League. Similarly, the HGP of 62% was
reported by Sutter and Kocher (2004) in the German Bundesliga for the season 2000-
2001. Note that, compared to these studies, the current study is based on only goals
scored by team possessions started by winning the ball in play for only one season of
Norwegian soccer. At the same time, soccer’s home advantage is known to differ
according to long-term trends (R. Pollard & G. Pollard, 2005) and geographical
variation, with German (63%) and England (61%) registered a higher value of HWP
than Norway (58%) (Pollard, 2006b).
In agreement with earlier studies (e.g. Lago & Martin, 2007; Tucker et al.,
2005), the trends in our data show that teams were more offensive-oriented when
playing at home compared to away and more defensive-oriented when playing away
than at home. Tucker et al. (2005) found that an individual team performed more
behaviours indicative of offensive tactics (e.g. shots and dribbles) in the attacking third
of the pitch at home and more defensive tactics-related behaviours (e.g. interceptions
and clearances) in the defensive third when playing away. Lago and Martin (2007)
reported that playing at home increased teams’ possession by up to 6% compared with
playing away in the top Spanish Soccer League. Significant differences in the frequency
of goal attempts, shots on target, shots blocked, shots wide and successful crosses in
favour of the home team found by Sasaki et al. (1999) may also indicate more offensive

Paper IV
169
tactics used when playing at home than away. Elsewhere, in the study of ice-hockey,
teams were found to use more assertive fore-checking tactics at home compared to away
(Dennis & Carron, 1999).
The adoption of more defensive and cautious playing tactics by teams playing
away compared to home has been hypothesized earlier as one of the possible causes of
home advantage in soccer (Pollard, 1986). Data from the current study support this
assertion. Our unadjusted overall multivariate analyses show counter attack, final third
starting zone and penetrative pass were most effective in goal scoring at home, while
their respective opposite tactics of elaborate attack, first third starting zone, and non-
penetrative pass were least effective in goal scoring away from home. Hence, quick
exploitation of imbalances in the opponent’s defence, winning the ball in play closer to
the opponent’s goal and passing the ball past at least one opponent player in the
direction of the opponent’s goal while maintaining ball possession appear to explain
home advantage at least partially.
However, further multivariate analyses also reveal that no difference in
effectiveness between team possessions started at final third and first third when
playing against an imbalanced defence at home versus away, whereas counter attack
was more effective than elaborate attack when playing against an imbalanced defence
at home, but not away. The tactic penetrative pass was still more effective than non-
penetrative pass also when playing against an imbalanced defence both at home and
away.
That counter attack is more effective than elaborate attack only at home but
not away when playing against an imbalanced defence was rather unexpected. As one
would expect the same effect of counter attack when playing against an imbalanced
defence regardless whether at home or away, it seems that there are differences in the

Paper IV
170
quality of either these two offensive tactics or degrees of defensive balance performed
at home versus away uncovered by our variables. For example, in practice, teams are
known to risk more players forward to support a counter attack when playing at home
compared to away.
On the other hand, our overall and subgroup multivariate analyses show
penetrative pass was more effective than non-penetrative pass in spite of match location
type. In addition, no significant differences were found between tactics short possession
and long possession, between short pass and long pass, and between space pass and
foot pass when playing at home versus away. The clearly higher effectiveness of
penetrative pass compared to non-penetrative pass indicates that penetration versus
preventing penetration is truly the superior principle of play governing the game of
soccer (Franks, 1988; Olsen, Larsen, & Semb, 1994).
It is important to realise that many other factors such as psychological,
territoriality and crowd support are associated with home advantage in soccer and some
of them interact with each other (Carron et al., 2005; Pollard, 2006b). Nevertheless, the
present study shows some evidence of home advantage based on playing tactics for goal
scoring and hence its attempt to examine underlying mechanisms (i.e. opponent
interaction) should be explored further. Having incorporated theoretical approaches of
offensive and defensive play, a more direct follow up of this study would be to
investigate the home advantage effect when playing against a balanced defence.
Methods from the current study could be employed to a larger scale study with adequate
sample size of team possessions leading to goals. Another aspect worthy exploring is
expanding even further the scope of analysis variables. It should be possible to apply
multidimensional qualitative evaluation in the analysis of off-the-ball movements

Paper IV
171
involving one or more players. In so doing, effective offensive movement tactics for
creating and utilizing space according to match location may be revealed.
The findings of this study may have some practical implications for soccer
players and coaches as they prepare to play away from home. They may reasonably be
expected to face a home team that more frequently takes advantage of imbalances in the
opponent’s defence, wins the ball in play at the final third area and uses penetrative
passes. This information can be used to plan and practice effective counteracting
defensive tactics (e.g. defensive drills against these offensive tactics), while offensively
employing the tactics of counter attack, ball winning at the final third and penetrative
passes. Also, the current findings may suggest that teams should adopt offensive-
oriented playing style also when playing away. However, whether the benefit of such an
approach outweighs the consequence of risk involved defensively remains unknown.
Conclusions
This study shows that counter attack (“direct play”) had a higher probability for
scoring goals than elaborate attack (“possession play”) when playing against an
imbalanced defence at home, but not away. Thus, the assessment of opponent
interaction is necessary to evaluate differences in the probability of goal scoring
between different offensive playing tactics according to match location and hence
improves the validity of analysis of home advantage in soccer match performance.

Paper IV
172
References
Altman, D. G. (1991). Some common problems in medical research. In Altman,
D. G., (Ed.), Practical statistics for medical research, pp. 403-409. London:
Chapman & Hall.
Boyko, R. H., Boyko, A. R., & Boyko, M. G. (2007). Referee bias contributes to home
advantage in English Premiership football. Journal of Sports Sciences, 25,
1185-1194.
Carron, A. V., Loughhead, T. M., & Bray, S. R. (2005). The home advantage in sport
competitions: Courneya and Carron’s (1992) conceptual framework a decade
later. Journal of Sports Sciences, 23, 395-407.
Courneya, K. S., & Carron, A. V. (1992). The home advantage in sport competitions: A
literature review. Journal of Sport & Exercise Psychology, 14, 13-27.
Dennis, P. W., & Carron, A. V. (1999). Strategic decisions of ice hockey coaches as a
function of game location. Journal of Sports Sciences, 17, 263-268.
Downward, P., & Jones, M. (2007). Effects of crowd size on referee decisions: Analysis
of the FA Cup. Journal of Sports Sciences, 25, 1541-1545.
Elias, N., & Dunning, E. (1966). Dynamics of group sports with special references to
football. British Journal of Sociology, 17, 388-402.
Ensum, J., Pollard, R., & Taylor, S. (2004). Applications of logistic regression to shots
at goal in association football: calculation of shot probabilities, quantification
of factors and player/team. Journal of Sports Sciences, 22, 504.
Franks, I. (1988). Analysis of association football. Soccer Journal, 33(5), 35-43.
Grehaigne, J. F., & Godbout, P. (1995). Tactical knowledge in team sports from a
constructivist and cognitivist perspective. Quest, 47 (4), 490-505.
Grehaigne, J. F., Bouthier, D., & David, B. (1997). Dynamic-system analysis of
Paper IV
173
opponent relationships in collective actions in soccer. Journal of Sport
Sciences, 15, 137-149.
Grehaigne, J. F., Bouthier, D., & Godbout, P. (1999). The foundations of tactics and
strategy in team sports. Journal of Teaching in Physical Education, 18 (2),
159-174.
Grehaigne, J. F., Mahut, B., & Fernandez, A. (2001). Qualitative observation tools to
analyse soccer. International Journal of Performance Analysis in Sport, 1(1),
52-61.
Hughes, M. D., & Bartlett, R. M. (2002). The use of performance indicators in
performance analysis. Journal of Sports Sciences, 20, 739-754.
Lago, C., & Martin, R. (2007). Determinants of possession of the ball in soccer. Journal
of Sports Sciences, 25, 969-974.
Nevill, A. M., Atkinson, G., Hughes, M. D., & Cooper, S-M. (2002). Statistical methods
for analysing discrete and categorical data recorded in performance analysis.
Journal of Sports Sciences, 20, 829-844.
Nevill, A. M., Balmer, N., & Williams, A. M. (2002). The influence of crowd noise and
experience upon refereeing decisions in football. Psychology of Sport and
Exercise, 3, 261-272.
Nevill, A. M., & Holder, R. L. (1999). Home advantage in sport - An overview of
studies on the advantage of playing at home. Sports Med, 28, 221-236.
Nevill, A. M., Newell, S. M., & Gale, S. (1996). Factors associated with home
advantage in English and Scottish soccer matches. Journal of Sports Sciences,
14, 181-186.
Olsen, E., Larsen, O., & Semb, N. J. (1994). Effektiv fotball. Norway: Gyldendal Norsk
Forlag A/S.
Paper IV
174
Page, L., & Page, K. (2007). The second leg home advantage: Evidence from European
football cup competitions. Journal of Sports Sciences, 25, 1547-1556.
Pollard, R. (1986). Home advantage in soccer: a retrospective analysis. Journal of
Sports Sciences, 4, 237-248.
Pollard, R. (2006a). Home advantage in soccer: Variations in its magnitude and a
literature review of the inter-related factors associated with its existence.
Journal of Sport Behavior, 29, 169-189.
Pollard, R. (2006b). Worldwide regional variations in home advantage in association
football. Journal of Sports Sciences, 24, 231-240.
Pollard, R., & Pollard, G. (2005). Long-term trends in home advantage in professional
team sports in North America and England (1876-2003). Journal of Sports
Sciences, 23, 337-350.
Pollard, R., & Reep, C. (1997). Measuring the effectiveness of playing strategies at
soccer. The Statistician, 46, 541-550.
Sasaki, Y., Nevill, A., & Reilly, T. (1999). Home advantage – A case study of Ipswich
Town football club during the 1996-97 season. Journal of Sports Sciences, 17,
831.
Sutter, M., & Kocher, M. G. (2004). Favoritism of agents – The case of referees’ home
bias. Journal of Economic Psychology, 25, 461-469.
Suzuki, K., & Nishijima, T. (2004). Validity of a soccer defending skill scale (SDSS)
using game performances. International Journal of Sport and Health Science,
2, 34-49.
Taylor, J. B., Mellalieu, S. D., James, N., & Shearer, D. A. (2008). The influence of

Paper IV
175
match location, quality of opposition, and match status on technical
performance in professional association football. Journal of Sports Sciences,
26, 885-895.
Tucker, W., Mellalieu, S. D., James, N., & Taylor, J. B. (2005). Game location effects
in professional soccer: A case study. International Journal of Performance
Analysis in Sport, 5(2), 23-35.

Paper IV
176
Table 1. Variable descriptions and category definitions used in the team match performance
analysis.
Variables and categories
1. Team possession type
Def. Degree of offensive directness by levels of utilization or creation of imbalance in the opponent’s defence to achieve
penetration (i.e. how quick penetration is attempted after ball winning). Penetration is achieved when a pass goes towards the
opponent’s goal past opponent player(s) while maintaining high degree of control over the ball. High degree of control over
the ball means enough space and time that makes it easier to perform intended actions on the ball.
A. Counter attack (“direct play”): starts by winning the ball in play and progresses by either a) utilizing or attempting to utilize
a degree of imbalance from start to the end, or b) creating or attempting to create a degree of imbalance from start to the
end by using early (i.e. 1st or 2nd, evaluated qualitatively) penetrative pass or dribble. Utilizing degree of imbalance means
seeking penetration in such a way that a defending team fails to regain high degree of balance from start to the end of team
possession. Counter attacks progress relatively fast.
B. Elaborate attack (“possession play”): starts by winning the ball in play and progresses either a) without utilizing or
attempting to utilize a degree of imbalance, or b) by creating or attempting to create a degree of imbalance by using late (3rd
or later, evaluated qualitatively) penetrative pass or dribble. Not utilizing a degree of imbalance means seeking penetration in
such a way that a defending team manages to regain high degree of balance before the end of team possession. Elaborate
attacks often progress relatively slow.
2. Starting zone
Def. Area across the playing field in which team possession starts.
A. First third: 1/3 of the playing field estimated from own goal line to middle third 1.
B. Middle third: 1/3 of the playing field estimated from end of the first third to final third.
C. Final third: 1/3 of the playing field estimated from end of the middle third to opponent’s goal line, excluding score box.
E. Score box: Prime scoring area in front of the opponent’s goal defined as an imaginary prolongation of the penalty area from
16 m to 30 m line estimated distance from opponent’s goal line.
3. Pass number
Def. Series of passes between players of the attacking team.
A. Short possession: 1 or 2 passes per team possession.
B. Medium possession: 3 or 4 passes per team possession.
C. Long possession: 5 or more passes per team possession.
4. Pass length
Def. Long passes i.e. 30 m or more estimated distance and shorter estimated distances for short passes.
A. Long: only long pass.
B. Both: combination of long and short passes.
C. Short: only short pass.
5. Pass penetration
Def. Penetrative passes i.e. passes towards the opponent’s goal through opponent player(s) while maintaining control over the
ball and otherwise for non-penetrative passes.
A. Penetrative: only penetrative pass.
B. Both: combination of penetrative and non-penetrative passes.
C. Non-penetrative: only non-penetrative pass.
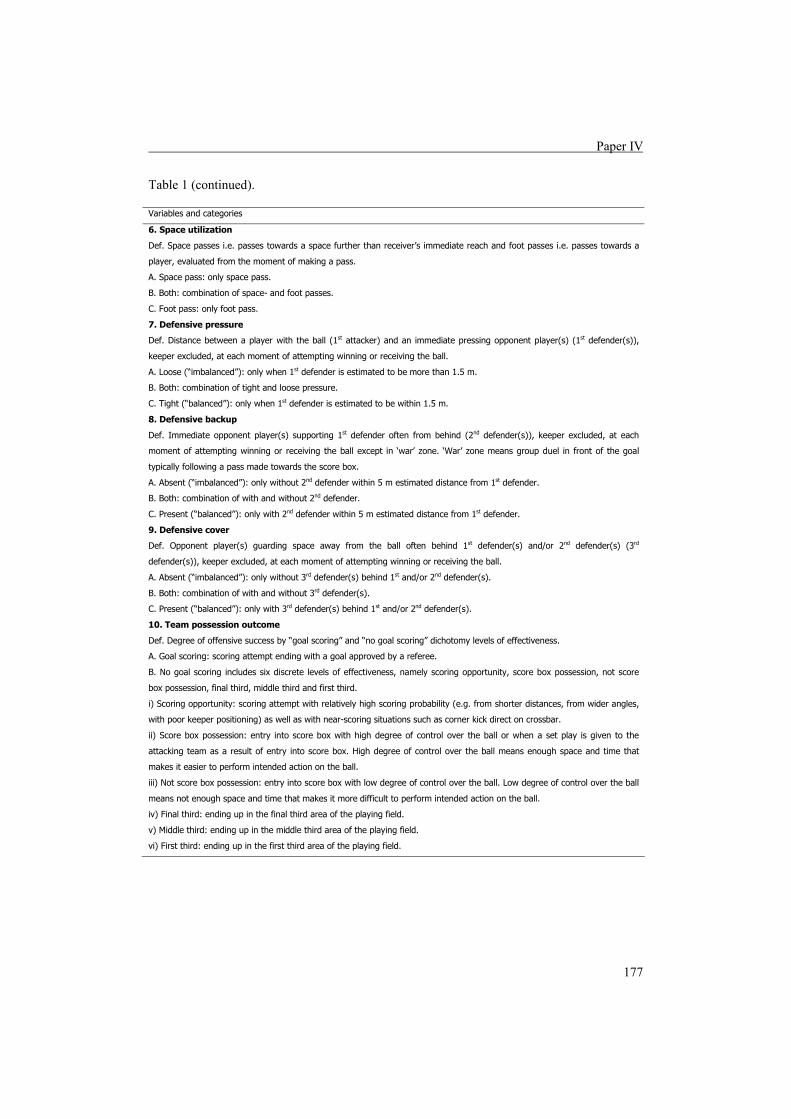
Paper IV
177
Table 1 (continued).
Variables and categories
6. Space utilization
Def. Space passes i.e. passes towards a space further than receiver’s immediate reach and foot passes i.e. passes towards a
player, evaluated from the moment of making a pass.
A. Space pass: only space pass.
B. Both: combination of space- and foot passes.
C. Foot pass: only foot pass.
7. Defensive pressure
Def. Distance between a player with the ball (1st attacker) and an immediate pressing opponent player(s) (1st defender(s)),
keeper excluded, at each moment of attempting winning or receiving the ball.
A. Loose (“imbalanced”): only when 1st defender is estimated to be more than 1.5 m.
B. Both: combination of tight and loose pressure.
C. Tight (“balanced”): only when 1st defender is estimated to be within 1.5 m.
8. Defensive backup
Def. Immediate opponent player(s) supporting 1st defender often from behind (2nd defender(s)), keeper excluded, at each
moment of attempting winning or receiving the ball except in ‘war’ zone. ‘War’ zone means group duel in front of the goal
typically following a pass made towards the score box.
A. Absent (“imbalanced”): only without 2nd defender within 5 m estimated distance from 1st defender.
B. Both: combination of with and without 2nd defender.
C. Present (“balanced”): only with 2nd defender within 5 m estimated distance from 1st defender.
9. Defensive cover
Def. Opponent player(s) guarding space away from the ball often behind 1st defender(s) and/or 2nd defender(s) (3rd
defender(s)), keeper excluded, at each moment of attempting winning or receiving the ball.
A. Absent (“imbalanced”): only without 3rd defender(s) behind 1st and/or 2nd defender(s).
B. Both: combination of with and without 3rd defender(s).
C. Present (“balanced”): only with 3rd defender(s) behind 1st and/or 2nd defender(s).
10. Team possession outcome
Def. Degree of offensive success by “goal scoring” and “no goal scoring” dichotomy levels of effectiveness.
A. Goal scoring: scoring attempt ending with a goal approved by a referee.
B. No goal scoring includes six discrete levels of effectiveness, namely scoring opportunity, score box possession, not score
box possession, final third, middle third and first third.
i) Scoring opportunity: scoring attempt with relatively high scoring probability (e.g. from shorter distances, from wider angles,
with poor keeper positioning) as well as with near-scoring situations such as corner kick direct on crossbar.
ii) Score box possession: entry into score box with high degree of control over the ball or when a set play is given to the
attacking team as a result of entry into score box. High degree of control over the ball means enough space and time that
makes it easier to perform intended action on the ball.
iii) Not score box possession: entry into score box with low degree of control over the ball. Low degree of control over the ball
means not enough space and time that makes it more difficult to perform intended action on the ball.
iv) Final third: ending up in the final third area of the playing field.
v) Middle third: ending up in the middle third area of the playing field.
vi) First third: ending up in the first third area of the playing field.
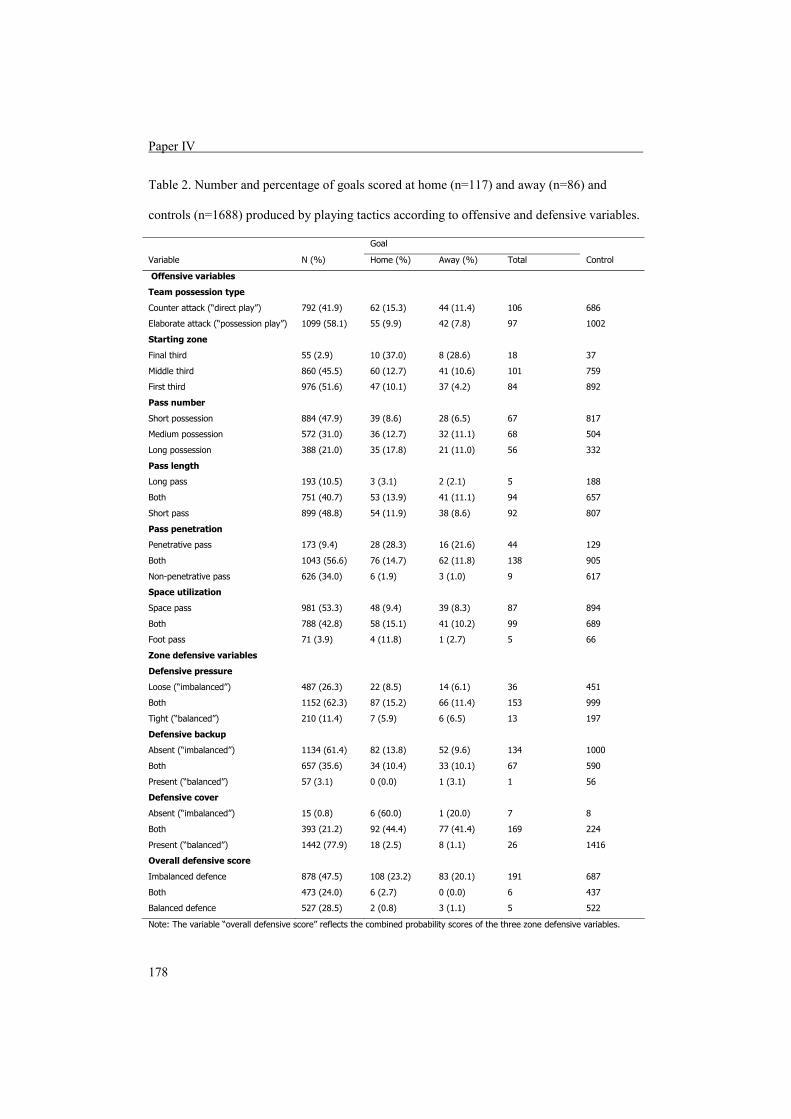
Paper IV
178
Table 2. Number and percentage of goals scored at home (n=117) and away (n=86) and
controls (n=1688) produced by playing tactics according to offensive and defensive variables.
Goal
Variable N (%) Home (%) Away (%) Total Control
Offensive variables
Team possession type
Counter attack (“direct play”)
Elaborate attack (“possession play”)
792 (41.9)
1099 (58.1)
62 (15.3)
55 (9.9)
44 (11.4)
42 (7.8)
106
97
686
1002
Starting zone
Final third
Middle third
First third
55 (2.9)
860 (45.5)
976 (51.6)
10 (37.0)
60 (12.7)
47 (10.1)
8 (28.6)
41 (10.6)
37 (4.2)
18
101
84
37
759
892
Pass number
Short possession
Medium possession
Long possession
884 (47.9)
572 (31.0)
388 (21.0)
39 (8.6)
36 (12.7)
35 (17.8)
28 (6.5)
32 (11.1)
21 (11.0)
67
68
56
817
504
332
Pass length
Long pass
Both
Short pass
193 (10.5)
751 (40.7)
899 (48.8)
3 (3.1)
53 (13.9)
54 (11.9)
2 (2.1)
41 (11.1)
38 (8.6)
5
94
92
188
657
807
Pass penetration
Penetrative pass
Both
Non-penetrative pass
173 (9.4)
1043 (56.6)
626 (34.0)
28 (28.3)
76 (14.7)
6 (1.9)
16 (21.6)
62 (11.8)
3 (1.0)
44
138
9
129
905
617
Space utilization
Space pass
Both
Foot pass
Zone defensive variables
981 (53.3)
788 (42.8)
71 (3.9)
48 (9.4)
58 (15.1)
4 (11.8)
39 (8.3)
41 (10.2)
1 (2.7)
87
99
5
894
689
66
Defensive pressure
Loose (“imbalanced”)
Both
Tight (“balanced”)
487 (26.3)
1152 (62.3)
210 (11.4)
22 (8.5)
87 (15.2)
7 (5.9)
14 (6.1)
66 (11.4)
6 (6.5)
36
153
13
451
999
197
Defensive backup
Absent (“imbalanced”)
Both
Present (“balanced”)
1134 (61.4)
657 (35.6)
57 (3.1)
82 (13.8)
34 (10.4)
0 (0.0)
52 (9.6)
33 (10.1)
1 (3.1)
134
67
1
1000
590
56
Defensive cover
Absent (“imbalanced”)
Both
Present (“balanced”)
15 (0.8)
393 (21.2)
1442 (77.9)
6 (60.0)
92 (44.4)
18 (2.5)
1 (20.0)
77 (41.4)
8 (1.1)
7
169
26
8
224
1416
Overall defensive score
Imbalanced defence
Both
Balanced defence
878 (47.5)
473 (24.0)
527 (28.5)
108 (23.2)
6 (2.7)
2 (0.8)
83 (20.1)
0 (0.0)
3 (1.1)
191
6
5
687
437
522
Note: The variable “overall defensive score” reflects the combined probability scores of the three zone defensive variables.

Paper IV
179
Table 3. Number and percentage of goals scored at home (n=108) and away (n=83) and
controls (n=687) produced by playing tactics according to offensive variables when
controlling for the effects of imbalanced defence.
Goal
Variable N (%) Home (%) Away (%) Total Control
Team possession type
Counter attack (“direct play”)
Elaborate attack (“possession play”)
454 (51.7)
424 (48.3)
58 (24.5)
50 (21.8)
43 (19.8)
40 (20.5)
101
90
353
334
Starting zone
Final third
Middle third
First third
29 (3.3)
418 (47.6)
431 (49.1)
9 (56.3)
56 (23.1)
43 (20.7)
7 (53.8)
40 (22.7)
36 (16.1)
16
96
79
13
322
352
Pass number
Short possession
Medium possession
Long possession
464 (55.0)
224 (26.6)
155 (18.4)
36 (14.3)
33 (30.8)
33 (38.8)
27 (12.7)
31 (26.5)
21 (30.0)
63
64
54
401
160
101
Pass length
Long pass
Both
Short pass
124 (14.7)
323 (38.4)
395 (46.9)
3 (4.5)
49 (29.5)
50 (23.8)
2 (3.4)
41 (26.1)
36 (19.5)
5
90
86
119
233
309
Pass penetration
Penetrative pass
Both
Non-penetrative pass
93 (11.0)
428 (50.8)
321 (38.1)
26 (46.4)
71 (33.0)
5 (2.9)
16 (43.2)
60 (28.2)
3 (2.0)
42
131
8
51
297
313
Space utilization
Space pass
Both
Foot pass
489 (58.1)
323 (38.4)
30 (3.6)
46 (17.6)
53 (32.1)
3 (18.8)
38 (16.7)
40 (25.3)
1 (7.1)
84
93
4
405
230
26

Paper IV
180
Table 4. Odds ratio (OR) and Wald chi-square (χ2) for goal scoring by offensive variables and
their corresponding playing tactics when interacting with home and away match locations.
Multivariate analysis
Variable OR (95% CI) χ2 P
Team possession type
Counter attack x home
Elaborate attack x awaya
2.04 (1.37-3.05)
1
12.17
<0.001*
Starting zone
Final third x home
Middle third x home
First third x awaya
5.64 (1.83-17.33)
1.40 (0.99-1.99)
1
11.67
9.11
3.65
0.003*
0.003*
0.06
Pass number
Long possession x home
Medium possession x home
Short possession x awaya
1.09 (0.69-1.72)
0.82 (0.54-1.24)
1
1.21
0.13
0.92
0.55
0.72
0.34
Pass length
Short pass x home
Both x home
Long pass x awaya
1.87 (0.53-6.58)
0.59 (0.41-0.86)
1
8.88
0.95
7.68
0.012*
0.33
0.006*
Pass penetration
Penetrative pass x home
Both x home
Non-penetrative pass x awaya
6.86 (3.9-12.01)
1.72 (1.22-2.44)
1
49.43
45.58
9.43
<0.001*
<0.001*
0.002*
Space utilization
Space pass x home
Both x home
Foot pass x awaya
1.18 (0.78-1.77)
1.61 (1.09-2.37)
1
5.79
0.62
5.78
0.06
0.43
0.016*
Note: The odds ratio (OR) reflects the chance of goal scoring, compared with the reference categorya. *Offensive tactics included in the model.

Paper IV
181
Table 5. Odds ratio (OR) and Wald chi-square (χ2) for goal scoring by offensive variables and
their corresponding playing tactics when interacting with home and away match locations and
controlling for the effects of imbalanced defence.
Multivariate analysis
Variable OR (95% CI) χ2 P
Team possession type
Counter attack x home
Elaborate attack x awaya against imbalanced defence
1.71 (1.07-2.72)
1
5.05
0.025*
Starting zone
Final third x home
Middle third x home
First third x awaya against imbalanced defence
2.47 (0.65-9.38)
1.21 (0.81-1.80)
1
2.37
1.77
0.83
0.31
0.18
0.36
Pass number
Long possession x home
Medium possession x home
Short possession x awaya against imbalanced defence
1.21 (0.71-2.07)
1.18 (0.72-1.92)
1
1.17
0.51
0.44
0.56
0.48
0.51
Pass length
Short pass x home
Both x home
Long pass x awaya against imbalanced defence
2.58 (0.69-9.62)
1.32 (0.86-2.02)
1
3.74
1.98
1.61
0.15
0.16
0.21
Pass penetration
Penetrative pass x home
Both x home
Non-penetrative pass x awaya against imbalanced defence
6.38 (3.31-12.31)
1.73 (1.16-2.58)
1
34.32
30.53
7.19
<0.001*
<0.001*
0.007*
Space utilization
Space pass x home
Both x home
Foot pass x awaya against imbalanced defence
1.18 (0.74-1.88)
1.37 (0.87-2.16)
1
1.97
0.47
1.86
0.37
0.49
0.17
Note: The odds ratio (OR) reflects the chance of goal scoring, compared with the reference categorya. *Offensive tactics included in the model.

Paper IV
182

Paper V
183
Paper V
