reliability and technical error of calf circumference and...
TRANSCRIPT

Mal J Nutr 14(2): 137 - 150, 2008
Reliability and Technical Error of Calf Circumference andMid-half Arm Span Measurements for Nutritional StatusAssessment of Elderly Persons in Malaysia
Jamaiyah H 1, Geeta A 1, Safiza MN 2, Wong NF 2, Kee CC 3, Ahmad AZ 2, Suzana S 4 ,Rahmah R 5 , Khor GL 6 , Ruzita AT 4, Chen WS 1, Rajaah M 1 & Faudzi A 2
1 Clinical Research Centre, Hospital Kuala Lumpur, Malaysia2 Institute for Public Health, Kuala Lumpur, Malaysia3 Institute for Medical Research, Kuala Lumpur, Malaysia4 Universiti Kebangsaan Malaysia, Kuala Lumpur, Malaysia5 Hospital Universiti Kebangsaan Malaysia, Kuala Lumpur, Malaysia6 Universiti Putra Malaysia, Serdang, Selangor, Malaysia
ABSTRACT
This study sought to examine the reliability of two measurements; Calf Circumference(CC) and Mid-half Arm Span (MHAS). A sample of 130 elderly persons aged 60 yearsand above seen consecutively in the Kuala Lumpur Hospital outpatient clinic duringthe period of December 2005 to January 2006, upon consent, were recruited to thestudy. There was a high degree of reliability for both inter- and intra-examiner (r closeto 1). For inter-examiner, on average the CC measurements taken by the first examinerwere 0.3 cm lower than that of the second examiner. The upper and lower limit of thedifferences were +0.4 to –0.9 cm respectively. Inter-examiner MHAS measurementson average by the first examiner were 0.2 cm lower than that of the second examiner.The limits were +1.7 to –2.1 cm. By comparison, the inter-examiner CC measurementswere more reliable than the MHAS measurements. For intra-examiner, on average theCC measurements at Time 1 were consistent with Time 2 (mean difference=0) withlimits of the difference at + 0.5 cm. MHAS measurements at Time 1 were on average0.1 cm less than at Time 2 with limits at +1.7 and –1.8 cm. The technical error ofmeasurement (TEM) and coefficient of variation of CC and MHAS for both inter-examiner and intra-examiner measurements were within acceptable limits with theexception of MHAS TEM. This study suggests that CC and MHAS measured in elderlypersons 60 years and above, using Seca Circumference Tape ® 206, Germany (0.05 cm)are reliable and can be used in a community survey.
INTRODUCTION
Anthropometry has a very important role innutritional screening, surveillance andmonitoring (Ulijaszek & Kerr, 1999). Bodyweight, height, various skin-fold thicknessesand circumferences and other linear
dimensions characterise the nutritionalstatus of an individual. Anthropometry is arelatively simple, quick, inexpensive meansof nutritional assessment that can be usedin the laboratory, clinical and communitysettings.
Correspondence author: Dr Jamaiyah Haniff; Email: [email protected]

Jamaiyah H, Geeta A, Safiza MN, Wong NF, etc.138
In assessing the nutritional status of theelderly, since direct measurement of bodycomposition is not possible in a large numberof patients, calf circumference is a pertinentmarker of the nutritional status in the elderly(Bonnefoy et al., 2002).
However, anthropometry methods havetheir inherent limitations; the need fortrained examiners, relatively high between-measurement technical errors andmechanical limitations (NYORC, 2006).Among various measurement methods,anthropometry techniques usuallydemonstrate the largest standard error andlowest correlation coefficients whencompared against other techniques. Variousterms are used to describe anthropometricmeasurement errors that include reliabilityand validity (Ulijaszek & Kerr, 1999).Reliability is the degree to which within-subject variability is present and is due tofactors other than variance of measurementerror or physiological variation. The secondtype of measurement error, validity, is theextent to which the ‘true’ value of ameasurement is attained. Measurementquality and control dimension arecommonly expressed using an accuracyindex of technical error of measurement(TEM). TEM allows examiners to verify thedegree of accuracy while performing andrepeating the measurements (intra-examiner) and when it is compared withmeasurements from other examiners (inter-examiner) (Talita et al., 2005).
While much has been written onanthropometric assessment methods andinterpretation, relatively few articles havediscussed reliability and TEM issues andthe extent of these factors which influenceboth measurement and interpretation ofnutritional status (Ulijaszek & Kerr 1999).
In assessing the nutritional status of theelderly, choice of mid-half arm span (MHAS)is the best practical alternative where theheight measurement cannot be obtained dueto spinal curvature or poor muscle tone(Pieterse, Manandhar & Suraiya, 1998).Height and demi-span (sternal notch to
finger roots with arm out-stretched laterally)have been found to have significantcorrelations (r = 0·74) in 125 normal youngto middle-aged European subjects (Bassey,1986). The authors also deduced that demi-span is therefore a practical alternativemeasurement of skeletal size. Calfcircumference (CC) measurement iscommonly used to determine the nutritionalstate of elderly persons.
Since there are a few articles on thereliability of calf circumference and mid-halfarm span, this paper aims to assess thereliability of these measurements which areused for nutritional status assessments forpersons 60 years and above in the NationalHealth and Morbidity Survey III (NHMS III).
METHODS
This was a cross-sectional study. Aconvenient sample of elderly persons, seenconsecutively in the Kuala Lumpur Hospitaloutpatient clinic during the period ofDecember 2005 to January 2006, werechosen. The sample criteria were those aged60 years and above and who gave consentto participate. The exclusion criteria wereelderly persons with obvious physicaldisabilities and body deformation thatinhibits ability to stand upright, includingkyphosis. The sample size was determined(Walter, Eliasziw & Donner, 1998), with tworeplicates per subject, the expected reliabilitycoefficient (r) of at least 0.8 (H1: ρ1=0.8), thereliability of 0.7 (H0: ρ0=0.7) or higher to beminimally acceptable, α=0.05 and β=0.2(corresponds to 80% power); this wouldrequire a total number of 117.1 subjects.Using a 10% over-estimate to account forpoor response, the final sample size was 130.
Two students from a local universityundergoing a Dietetics Masters programme,conducted the measurements of CC andMHAS. There were no special reasons forchoosing only two examiners instead ofmore. A pair was the minimum number ofexaminers needed for inter-examinerreliability. The decision was made entirely

Reliability of CC & MHAS for Nutritional Status Assessment of Elderly Persons 139
based on logistics convenience. To avoidmany measurements on the same subjects,the decision to assess intra-examinerreliability in only one of the two examiners,was deliberately made. Selection of one ofthe examiners for intra-examiner reliabilitytesting was also not influenced in any way.
Each subject was examined thrice for thesame measurements; 3 times for CC and 3times for MHAS. The order was as follows:examiner #1 measures the subject for CC andMHAS, then the subject goes to examiner #2who would measure the subject again forCC and MHAS. The subject would thenreturn to examiner #1 for the last CC andMHAS measurements. Both examiners werenot part of the research team and weretherefore blind as to the exact aim of thestudy. They were requested not to recall theirprevious readings. The data capture formwas designed in such a way that recordingsof previous readings were obscuredimmediately after each recording was madeto minimise recall bias.
Study specific procedure
Both the examiners were trained to adhereto the standard procedure as in the TechnicalManual of NHMS III (NHMS III, 2006). Calfcircumference was measured to 0.05 cmaccuracy (WHO, 1995). Mid-half Arm Spanwas measured to 0.05 cm accuracy (WHO,1995). Both these measurements were made
using the Seca Circumference Tape ® model206 ® Germany. The examiners were givena tape each.
Statistical analysis
For reliability, findings of statisticalanalyses are reported using absolutemean difference, correlation coefficient (r)and Bland and Altman plot (Bland &Altman, 1986). Absolute mean difference isa crude way of checking for difference oragreement between two readings. We alsotested the difference for significance usingindependent t-test and paired t-test forabsolute means. Correlation coefficient (r)was used as a more objective way ofassessing reliability. Correlation coefficientwas computed using intra-class correlationto demonstrate the strength of therelationship (similarities) between twomeasurements. The values for reliabilitycoefficient range from 0 to 1. A coefficient of0 indicates ‘no reliability’ and 1 indicates‘perfect reliability’ (Table 1).
A Bland and Altman plot was used toprovide an illustration of the spread ofdifferences in readings, the mean differenceand the upper and lower limit of agreementboth for inter- as well as intra-examinerreliability. There is no ‘acceptable’ range forBland and Altman plots.
The technical error of measurement(TEM) is an accuracy index and represents
Table 1. Qualitative classification of intra-class correlation (ICC)values as degrees of agreement beyond chance
ICC value Degree of agreement (reliability)beyond chance
< 0 None> 0 - < 0.2 Slight0.2 - < 0.4 Fair0.4 - < 0.6 Moderate0.6 - < 0.8 Substantial0.8 - 1.0 Almost Perfect
(Source: MUSC, 2006)

Jamaiyah H, Geeta A, Safiza MN, Wong NF, etc.140
the measurement quality and controldimension. It is the most common way toexpress the margin of error in anthropometryand has been adopted by the InternationalSociety for Standardization Advancement inKinanthropometry (ISAK). It is being usedby anthropometrists in Australia (Talita etal., 2005). It is essentially the standarddeviation between repeated measures. TheTEM index allows anthropometrists toverify the degree of accuracy whenperforming and repeating anthropometricmeasurements (intra-examiner) and whencomparing their measurement withmeasurements from other anthropometrists(inter-examiner). The acceptable ranges forRelative TEM are as shown in Table 2.
Inter-examiner reliability refers to howconsistently readings from the twoexaminers on the same subjects are inagreement. Intra-examiner reliability refersto how consistently readings from the sameexaminer on the same subjects, but at twodifferent time points, are in agreement.
In addition to these, the coefficient ofvariation (CV) is calculated to furtherdetermine the precision of methods ofmeasurements. The CV provides a general‘feeling’ about the performance of a method.CVs of 5% or less generally give us a feelingof good method performance, whereas CVsof 10% and higher are bad (Zady, 1999).
In order to compare the variability of thetwo methods, CC and MHAS, the percentageof coefficient of variation (% CV) was
calculated using the data from both intre- aswell as the intra-examiner. Percentage ofcoefficient of variation is therefore a goodindicator to use when comparing methods(Martin, 2006).
RESULTS
Sample characteristics
The mean age of 130 elderly personsinvolved in this study is 66 (+ 5.41) years.The median is also 66 years and the range is60 to 85 years old (see Table 3). Two-thirdswere male. Almost half (48%) belonged tothe Chinese ethnic group followed byMalays (31%) and Indians 20%. From Figure1, it is noted that a small p-value (<0.01) isobtained from the Shapiro-Wilk test, whichindicates that the age distribution is notnormally distributed. Generally there aremore ‘younger-old’ compared to ‘older-old’in the sample.
Reliability
1. Inter-examiner reliability
• Absolute mean differenceThe mean, median, range of measurementsand absolute mean difference for examiner#1 and examiner #2 are illustrated in TableIII. The absolute difference in mean wasfound to be very small; 0.3 for CC and 0.1 forMHAS. This indicates good agreementbetween the two examiners.
Table 2. Relative TEM values considered as acceptable
Type of analysis Beginner Skilfulanthropometrist (<) anthropometrist (<)
Intra-examiner Skin folds 7.5% 5.0%Other measures 1.5% 1.0%
Inter-examiner Skin folds 10% 7.5%Other measures 2.0% 1.5%
Norton K & Olds T (eds)(2000). Antropometrica Argentina Biosystem. In Talita AP et al. (2005).

Reliability of CC & MHAS for Nutritional Status Assessment of Elderly Persons 141
Table 3. Characteristics of sample
Characteristics Total=130
Age (year)Mean (SD) 66 (5.41)Median (Min ,Max) 66 (60, 85)
No %
GenderMale 88 67.69Female 42 32.31
Ethnic groupMalay 40 30.77Chinese 62 47.69Indian 26 20.00Others 2 1.54
Education levelNo education 12 9.23Primary 73 56.15Secondary 41 31.54Tertiary 4 3.08
• Correlation coefficientFigures 1 and Figure 2 illustrate graphicallythe strong correlation between the readingsfrom the two examiners for CC and MHASrespectively. For both CC and MHAS, theresults indicate a high degree of reliabilitybetween the two examiners as the r is veryclose to 1.
• Bland and Altman plotFigure 3 shows that on average, the CCmeasurement taken by the 2nd examiner is0.3 cm lower than that for the 1st examinerwith the limits of agreement ranging from –0.9 cm to +0.4 cm.
Figure 4 shows that on average, theMHAS measurement taken by the 2nd
examiner is 0.2 cm lower than that for the 1st
examiner and the upper limit of theagreement is about 2.1 cm while the lowerlimit agreement is 1.7 cm.
2. Intra-examiner reliability
• Absolute mean differenceFor within examiner analysis, the mean (SD),median and absolute mean differences are
as shown in Table 5. For MHAS thedifference in the mean is very small and forCC there is no difference at all.
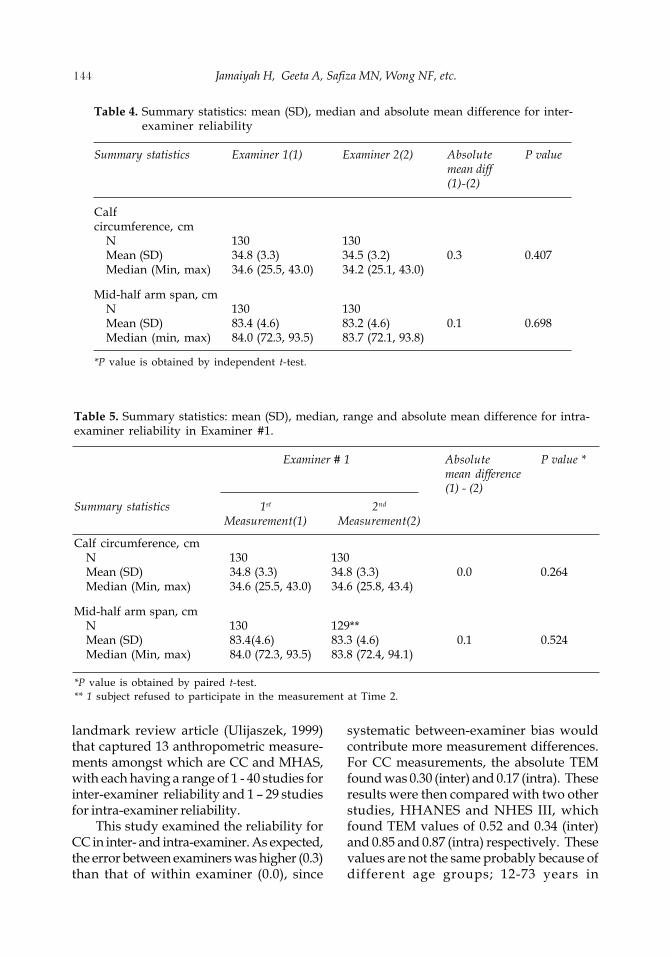
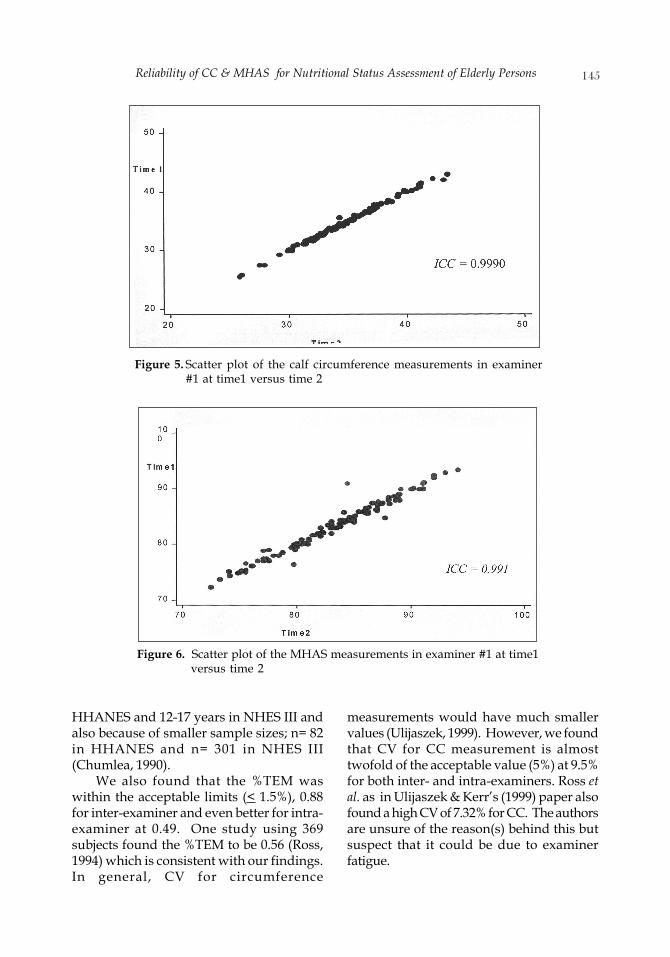
• Correlation coefficientFigures 5 and Figure 6 illustrate the strongcorrelation between the readings from time1 and time 2 by an examiner for CC andMHAS respectively. For both CC and MHAS,the results indicate a high degree ofreliability within examiner with the r beingvery close to 1.
• Bland and Altman plotFigure 7 shows that on average, there is nomean difference in the CC measurementtaken at time 1 and time 2; they are withinthe limits of agreement ranging from –0.4cm to +0.5 cm.
Figure 8 shows that on average, theMHAS measurement taken from time 2 is0.1 cm lower than that for time 1. The upperlimit of the agreement is –1.8 cm while thelower limit agreement is 1.7 cm.

Jamaiyah H, Geeta A, Safiza MN, Wong NF, etc.142
Technical Error of Measurement (TEM)
The results for the TEM are tabulated inTable 6. The relative TEMs for inter- andintra-examiner for CC were 0.88% and 0.49%respectively. The relative TEMs for inter- andintra-examiner for MHAS were 0.83% and6.35%.
Measurement comparison
Measurement comparison results aredisplayed in Table 7. We found that the CVsof MHAS are close to 5%, which is favourable,while that of CC are close to 10%, which isnot favourable. However, it is to be notedthat there is no difference in the CV in termsof inter- and intra-examiner.
Figure 1. Scatter plot of the calf circumference measurements of examiner#1 versus examiner #2
Figure 2. Scatter plot of the mid-half arm span measurements ofexaminer #1 versus examiner #2

Reliability of CC & MHAS for Nutritional Status Assessment of Elderly Persons 143
Figure 3. Bland Altman plot of the calf circumference measurements betweenexaminers
Figure 4. Bland Altman plot for the mid-half arm span measurements betweenexaminers
DISCUSSION
Anthropometric measurements havedifferent types of errors. This study inparticular looks at imprecision as one of thecomponents of reliability. Imprecision is thevariability of repeated measurements anddue to intra- and inter-examiner measure-ment differences (Ulijaszek, 1999). There area few indices which are often used to assess
the intra- and inter- examiner variability.These include technical error ofmeasurement (TEM), coefficient variation(CV), coefficient of reliability (R), intra-classcorrelation coefficient (ICC) and Bland &Altman plot. In this study we report on allthe above except for coefficient of reliability(R).
There are only a handful of publishedarticles on measurement errors. There is one
Jamaiyah H, Geeta A, Safiza MN, Wong NF, etc.144
landmark review article (Ulijaszek, 1999)that captured 13 anthropometric measure-ments amongst which are CC and MHAS,with each having a range of 1 - 40 studies forinter-examiner reliability and 1 – 29 studiesfor intra-examiner reliability.
This study examined the reliability forCC in inter- and intra-examiner. As expected,the error between examiners was higher (0.3)than that of within examiner (0.0), since
systematic between-examiner bias wouldcontribute more measurement differences.For CC measurements, the absolute TEMfound was 0.30 (inter) and 0.17 (intra). Theseresults were then compared with two otherstudies, HHANES and NHES III, whichfound TEM values of 0.52 and 0.34 (inter)and 0.85 and 0.87 (intra) respectively. Thesevalues are not the same probably because ofdifferent age groups; 12-73 years in
Table 4. Summary statistics: mean (SD), median and absolute mean difference for inter-examiner reliability
Summary statistics Examiner 1(1) Examiner 2(2) Absolute P valuemean diff(1)-(2)
Calfcircumference, cm
N 130 130Mean (SD) 34.8 (3.3) 34.5 (3.2) 0.3 0.407Median (Min, max) 34.6 (25.5, 43.0) 34.2 (25.1, 43.0)
Mid-half arm span, cmN 130 130Mean (SD) 83.4 (4.6) 83.2 (4.6) 0.1 0.698Median (min, max) 84.0 (72.3, 93.5) 83.7 (72.1, 93.8)
*P value is obtained by independent t-test.
Table 5. Summary statistics: mean (SD), median, range and absolute mean difference for intra-examiner reliability in Examiner #1.
Examiner # 1 Absolute P value *mean difference(1) - (2)
Summary statistics 1st 2nd
Measurement(1) Measurement(2)
Calf circumference, cmN 130 130Mean (SD) 34.8 (3.3) 34.8 (3.3) 0.0 0.264Median (Min, max) 34.6 (25.5, 43.0) 34.6 (25.8, 43.4)
Mid-half arm span, cmN 130 129**Mean (SD) 83.4(4.6) 83.3 (4.6) 0.1 0.524Median (Min, max) 84.0 (72.3, 93.5) 83.8 (72.4, 94.1)
*P value is obtained by paired t-test.** 1 subject refused to participate in the measurement at Time 2.
Reliability of CC & MHAS for Nutritional Status Assessment of Elderly Persons 145
Figure 5. Scatter plot of the calf circumference measurements in examiner#1 at time1 versus time 2
Figure 6. Scatter plot of the MHAS measurements in examiner #1 at time1versus time 2
HHANES and 12-17 years in NHES III andalso because of smaller sample sizes; n= 82in HHANES and n= 301 in NHES III(Chumlea, 1990).
We also found that the %TEM waswithin the acceptable limits (< 1.5%), 0.88for inter-examiner and even better for intra-examiner at 0.49. One study using 369subjects found the %TEM to be 0.56 (Ross,1994) which is consistent with our findings.In general, CV for circumference
measurements would have much smallervalues (Ulijaszek, 1999). However, we foundthat CV for CC measurement is almosttwofold of the acceptable value (5%) at 9.5%for both inter- and intra-examiners. Ross etal. as in Ulijaszek & Kerr’s (1999) paper alsofound a high CV of 7.32% for CC. The authorsare unsure of the reason(s) behind this butsuspect that it could be due to examinerfatigue.

Jamaiyah H, Geeta A, Safiza MN, Wong NF, etc.146
Note: On average, the measurement taken from the 1st observer is consistent attwo different time points, the 95% limits of agreement ranges from –0.4 cm to0.5 cm.Figure 7. Bland Altman plot on the calf circumference measurements within
examiner 1
Figure 8. Bland Altman plot on the mid-half arm span measurements withinexaminer 1
0.5 cm
0.0 cm
-0.4 cm
1.7 cm
-0.1 cm
-1.8 cm

Reliability of CC & MHAS for Nutritional Status Assessment of Elderly Persons 147
The ICC is an estimate of the proportionof the combined variance for the truebiological value for any anthropometricmeasure and for the measurement errorsassociated with it. We found ICC valuesclose to 1; 0.9980 for inter-examiner and0.9990 for intra-examiner, indicating a lowvariability between repeated measures on thesame subject, which is good. In the inter-examiner Bland & Altman plot for CC, themean differences across all the range ofreadings was -0.3 cm which indicates someevidence of systematic bias between
examiners. At 1SD, examiner 1 can under-estimate up to almost 1 cm compared toexaminer 2 or vice versa; examiner 2 canover-estimate up to almost 1 cm. There is alsosome ‘funneling effect’ found (Figure 3) ininter-examiner CC measurement, as the largerthe calf circumference, the more dispersedthe measurements are from the mean.
We also examined reliability for MHASin inter- and intra-examiner results. Theerrors between examiners and withinexaminer were the same with a value of 0.1while the absolute TEM found was 0.69
Table 6. Inter- and intra-examiner TEM∞ for CC and MHAS measurements
Indices CC MHAS
Inter- Intra Inter Intraexaminer examiner examiner examiner
Absolute TEM* (m) 0.0030 0.0017 0.0069 0.0528VAV �” 34.63 34.79 83.28 83.03Relative TEM(%) ** 0.88 0.49 0.83 6.35
∞TEM : Technical error of measurement; ∞ ∞ VAV : Variable average value
** Absolute TEM = ndi
2
2∑
where
∑di2 = summation of deviations raised to the second power; n= number of volunteers measured, i= thenumber of deviations;
** VAV =∑ measurements, where ∑ measurements= summation of measurements
*** Relative TEM = 100×VAVTEM
, where TEM= Technical error of measurement expressed in %
VAV= Variable average value
Table 7. Coefficient of variation of CC and MHAS using data from inter-examinerand intra-examiner
Variables N Mean (SD) Coefficient of variation(%) *
Inter Intra Inter Intraexaminer examiner examiner examiner
Calf circumference, cm 130 34.6(3.3) 34.8(3.3) 9.5 9.5Mid half arm span, cm 130 83.3(4.6) 83.4(4.6) 5.5 5.5
* CV% = (SD/mean)100. Source: Zady MF (1999).

Jamaiyah H, Geeta A, Safiza MN, Wong NF, etc.148
(inter) and 5.28 (intra). This was comparedwith a study by Kaur & Singh (1994), as inUlijaszek & Kerr’s (1999) paper, found TEMvalues of 0.1 and 0.5 (inter) and 0.3 (intra)respectively. These values are not the sameprobably because of different age groups andsample sizes. It was found that the TEMvalue in this study was much higher thanthe acceptable range (Table 2) for intra-examiner. This could be due to lack oftraining in the technique of measuringMHAS by that particular examiner. Thoughobtaining accurate MHAS in older peoplecan be troublesome, this problem can becontrolled with good training (Ulijaszek,1999). We also found that the %TEM waswithin the acceptable limits (< 1.5%), 0.69for inter-examiner.
In our study, we found that CV forMHAS measurement is almost at theacceptable value (5%) of 5.5% for both inter-and intra-examiners. We also found ICCvalues close to 1; 0.9890 for inter-examinerand 0.9910 for intra-examiner, indicatingthat there is low variability between repeatedmeasurements on the same subject, which isgood. In the inter- examiner Bland & Altmanplot for CC, the mean differences across therange of readings was -0.2 cm whichindicates some evidence of systematic biasbetween examiners. At 1SD, examiner 1 canunder-estimate up to almost 2 cm comparedto examiner 2 or vice versa.
Although the inter-examiner correlationcoefficient showed a high degree of reliability(r= 0.9890), the Bland and Altman Plot(Figure 5), however, suggests that there issome evidence of random error between theexaminers in their MHAS measurements, infact by almost + 2 cm, a bigger range thanthat for CC. This problem could be due tothe difficulty in ascertaining the mid-point.Hence, thorough training before and duringthe conduct of data collection itself becomescritical. The smaller number of examinersseems to be the better option especially forMHAS.
Intra-examiner reliability was onlyassessed in examiner #1. Figure 6 and Figure
7 depict the strong correlation between thereadings at time 1 and time 2 of examiner #1for CC and MHAS respectively. Validity ofthe two methods cannot be tested becausepresently there are no reference/goldstandard tests.
Study limitations
One of the reasons why differences areobserved in this study could probably beexplained by the fact that there were no targettraining values imposed upon the examinersprior to the conduct of the study. Training initself is essential as it influences the degreeof measurement error and interpretationespecially if there is a high inter-examinervariation. Besides training, some targetsneed to be set a priori and failure to achievethat would disqualify a person from beingan examiner. This study also did not havethe benefit of a trained anthropometrist, first,to test reliability of measurements andsecond, to take charge of the training. Thefact that only two examiners were employedfor this study and who were, not actualNHMS III examiners, was also anotherlimiting factor. However, this limitation wasdue to the fact that the field team for the actualNHMS III study had not been assembled atthe time of this study.
CONCLUSION
Anthropometric measurement errors areunavoidable and should be minimised bygiving close attention to every aspect of thedata collection process including selectionof examiners. The intra-examiner correlationcoefficient for CC and MHAS were almostperfect at 0.9990 and 0.991 respectively.Similarly the inter-examiner correlationcoefficient both for CC and MHAS were alsoalmost perfect at 0.9960 and 0.9890respectively.
This study found that, although bothmethods had a high degrees of reliability, atboth the intra- and inter-examiner level, thereliability was higher for CC than for MHAS.

Reliability of CC & MHAS for Nutritional Status Assessment of Elderly Persons 149
The CV was also reassuring for both methodsas it was found to be consistently below 5%.The same trend was found in the technicalerror of measurement findings in which theintra-examiner result was more acceptablefor CC compared to MHAS.
Calf circumference measurements seemto have higher intra-examiner reliability bothas evidenced by the lower absolute meandifferences, higher correlation coefficientand smaller range of limits of agreement.
The findings of this study suggest thatcalf circumference and mid-half arm spanmeasurement in the elderly aged 60 yearsand above were reliable in this pair ofexaminers. However, to be used in acommunity survey, the reliability of theactual examiners has to be re-assessed.
RECOMMENDATIONS
For NMHS III, which uses CC measurement,we would like to suggest that theselimitations be acknowledged. We alsorecommend that a liberal correction factor of+1 cm be used for the actual study on thecircumference measurements.
We would like to stress upon the criticalimportance of (a) training both before andduring the course of data collection insurveys, especially for MHAS measurementsin the elderly, and (b) to minimise potentialerrors by limiting to a single/minimumnumber of examiners where possible, toreduce inter-examiner differences (Ulijaszek,1999).
Since anthropometry is usually regardedas less troublesome compared to othernutritional studies, measurement is oftendelegated to lower qualified staff. Thus, torectify this, examiner(s) would preferably betrained and later be assessed by qualifiedanthropometrists against some predeter-mined target training values. Even duringthe course of the data collection, it isrecommended that to maintain quality ofmeasurement, some on-site assessment bedone on a random basis.
The working environment for datacollection should also be arranged so that itis adequate for measurement purposes. Toocramped or poorly lit stations may causeadditional error as a consequence ofcrowding and misreporting.
In addition, this study recommendssimilar studies be conducted for otheranthropometry measurements (exampleheight and weight in elderly persons).Besides, we also recommend that a study bedone in the field while the actual study isongoing, just like in HHANES and NHES II.It is important to carry out a pilot study beforeengaging in studies involving nutritionalanthropometry.
ACKNOWLEDGMENTS
We would like to thank the Director ofInstitute of Public Health, Dr Nirmal Singhfor his permission to deploy the Institute’sstaff for the conduct of the study, Director ofClinical Research Centre, Dr Lim Teck Onnfor guidance, Dr Yusof bin Ahmad and theteam from the Outpatient Department KualaLumpur Hospital, for assisting us inconducting our study at their site. Specialappreciation goes to Ms Siti NurasyuraMohd Adzman, Ms Siti Junara Mohd Halim,Ms Nurul Naquiyah Kamaruzzaman andMs Noor Akma Hassim for their assistancein data collection and manuscript editing.We also thank all those whose names arenot mentioned here for services renderedduring data collection and data entry.
REFERENCES
Bassey EJ (1986). Demi-span as a measure ofskeletal size. Ann Hum Biol 13 : 499-502. <http://www.informaworld.com/smpp/title~content=t713723502~db=all~tab=issueslist~branches=13 - v13>Accessed on 7 Oct2006.

Jamaiyah H, Geeta A, Safiza MN, Wong NF, etc.150
Bland MJ & Altman DG (1986). Statisticalmethods for assessing agreementbetween two methods of clinicalmeasurement. Lancet i : 307-310.
Bonnefoy M, Jauffret M, Kostka T & Jusot JF(2002). Usefulness of calf circumferencemeasurement in assessing thenutritional state of hospitalized elderlypeople. Gerontology 48: 162-169.
Chumlea WC, Guo S, Kuczmarski RJ,Johnson CL & Leahy CK (1990).Reliability for anthropometricmeasurements in the Hispanic Healthand Nutrition Examination Survey(HHANES 1982-1984). Am J Clin Nut 51:902S-907S
Bland, Martin (2006). How could I calculatea within-subject coefficient of variation?<http://www-users.york.ac.uk/~mb55/meas/cv.htm> Accessed on 7 October 2006.
Medical University of South Carolina(MUSC)(2006). <http://www.musc.edu/dc/icrebm/index.html>. Accessed on 20 Sept2006.
National of Health and Morbidity Survey III(NHMS III) (2006). Technical Manual ofMeasurements. Institute of PublicHealth, Malaysia.
Pieterse S, Manandhar M & Suraiya I (1998).The nutritional status of older Rwandanrefugees. Public Health Nutr 1 (4) : 259-164.
Talita AP, Glauber LO, Juliana SO & FatimaPO (2005). Technical error ofmeasurement in anthropometry. RevBras Med Esporte 11 : 86-90.
The New York Obesity Research Centre.Body Composition Unit. (2006).<www.nyorc.org/bcu/labs /anthropometry.html> Accessed on 16 Sept 2006.
Ulijaszek S & Kerr D (1999). Anthropometricmeasurement error and the assessmentof nutritional status. Br J Nutr 82: 165-177.
Walter SD, Eliasziw M & Donner A (1998).Sample size and optimal designs forreliability studies. Statistics in Medicine17: 101-110.
WHO (1995). Physical status: The use andinterpretation of anthropometry.Technical Report Series, Geneva,Switzerland.
Zady MF (1999). Z-stats 4: mean, standarddeviation, and coefficient of variation.<http://www.westgard.com/lesson34.htm#coefficient> Accessed on 7 October 2006.