reliability- and risk- based design of coastal … faculteit/afdelingen... · reliability- and...
TRANSCRIPT

RELIABILITY- AND RISK- BASED DESIGN OF COASTAL FLOOD DEFENCES
Cong V. Mai1'2, Pieter van Gelder1, Han Vrijling1 and Marcel Stive1
In the low-lying coastal regions coastal flood defence systems (CFDS) are important to protect the low-lying hinterland from sea flood. The appropriate characterisation of failure mechanisms of CFDS, determination of failure probability and determination of failure consequences are key components in effective reliability analysis and flood risk assessment. Having a CFDS, three questions often rise: (i) what the actual safety of the hinter lands is? (ii) how safe is safe enough? and (iii) given a pre-defined level of protection what the "best design" of the system would be? This study focuses on the application of the probabilistic design method to develop reliability and risk based models in order to answer these above questions with an application to a CFDS in Vietnam.
INTRODUCTION In the low-lying coastal countries such as of the Netherlands, Japan,
Vietnam, and Bangladesh, the coastal flood defence system (CFDS) is very important to protect the low-lying hinterland (polders) from sea flood. This system contains typically water defence structures i.e sea dikes, dunes, estuarine river levees, dams, and water discharging structures such as sluices, pumping stations, etc.
Main interests for any coastal flood defence system typically are: What the actual safety of the protected hinter lands/polders is? How safe is safe enough? If safe is not safe enough, to which level of safety the system needs to be applied or in other words, to which level of protection the "best choice" is (e.g 1/100, 1/250, 1/250 or 1/10000)? And having a pre-defined level of protection, what would be the best design of the system?
The first question can be answered by implementing a reliability safety assessment of the considered system. This can be done by probabilistic reliability assessments of all system elements which consider all possible failure mechanisms of these elements, by comparing the total strength of the elements and the joint loads acting on it. The safety level of the whole system can be easily determined by combination of failure probabilities of these considered system elements. This will be called in this study as reliability safety assessment model.
The second question is possible to solve by doing a risk analysis of the whole system. For various protection levels the cost of protection and the consequence of system failures need to be quantified. In general the first term is
1 Delft University of Technology, Stevinweg 1, 2628 CN Delft, The Netherlands 2 Water Resources University, 175 Tayson, Dong Da, Hanoi, Vietnam
4276

COASTAL ENGINEERING 2008 4277
increased when the level of protection is higher while the second term is inversed. It is possible to search for the point which provides the minimum total of these two components. This leads to a concept of risk-based optimization. The result from this risk analysis will be used as an input condition for answering the next question.
In order to answer the last question, various geometry alternatives of the coastal flood defences can be generated given a pre-defined failure probability. Total cost of construction here includes initial investment cost and the maintenance-repair cost during the total service lifetime of the structures. The investment cost can be estimated based on given geometry while the later term can be expressed through the failure probability of the each consider alternative. The minimum point of total construction cost in space of failure probability is looked for. This algorithm and procedure is, in this study, named reliability-based optimization model
Important input for these previous models is load and strength boundaries. Loads are mainly defined by hydraulic loads (water levels, wave conditions). Both waves and water levels at the sea are random and can be best described by statistic distributions, which are physically relevant. The strength of structures can be determined based on design geometry and materials used. Other important issues are inventory and investigation of all possible failure mechanisms of the system and quantifying the consequences of the system failure.
Combining all these above study components leads to an overall probabilistic safety, reliability and risk based approach for CFDS, see Fig.l, which aims at answering these above questions.
F M a n d L S F . / ^ «^\ f __ '' Cooiponent/system reliability analysis;
\ Safety assessment (P/j P,*?*} /
Damage*' consequences:
inventory/model
' PJ>F «& C D F of sea loads *u&JX>¥ (His, WL)
" - Input model
Strength boundary? alternative geometries
Strength vrs.jijne__. 3... Reliability based design model:
optimal geometry given [PfJ {from component to system level}
Risk-based design model: optimal level of protection {Pjj
{system level}
r Output
Optima! CFDS
Figure 1. Overview of study approach
In this paper three main components of the overall study approach are discussed, further developed and applied for coastal flood defence systems.

4278 COASTAL ENGINEERING 2008
These include probabilistic safety and reliability assessments, reliability based optimisation and risk analysis and risk based determination of optimal safety of the system. Study on probabilistic load boundary condition and uncertainty of the strength parameters will be treated separately and outside scope of this paper.
Application of the study approach is done for a case of coastal flood defences in Vietnam, a developing country with limited initial investment, fast economic growth and cheap labors, and therefore, all the new design works should be under careful considerations in terms of reliability and optimization.
SEA FLOOD DEFENCES IN VIETNAM Vietnam lies in a tropical monsoon climate region that has a long coastline
along the South China Sea that is regularly substantial suffering due to floods and typhoons. Typhoons arrive on average 4 to 6 times per year at the Vietnam coast. The deltaic coastal areas to a distance of about 20 km behind, which are protected by the 2000 km of sea dikes, is threatened by storm surges and high tides from the sea and high water level from the rivers. Thus, water defences are crucially important to protect the country from flooding.
The applied design safety levels of sea dikes are relatively low. This was also noticed in 1996 after the visit of Dutch expertise missions (DWW/RWS, 1996). Most designs of the sea dikes in Vietnam are based on the sea loads with return period 20 years. Besides this fact the Dutch mission marked that most Vietnamese dikes were in poor and disputable conditions (DWW/RWS, 1996). Consequently, the true probability of failure of the Vietnamese sea flood defense system exceeds by far the design frequency (Mai et al., 2006, 2007). Although designed to fail once in 20 years the sea defense system might well fail almost every year. The experiences in the past years support this statement.
Since 1953, Vietnam was affected by numbers of flood disasters, each disaster responsible for the loss of hundreds of lives and considerable damage to infrastructure, crops, rice paddy, fishing boats and trawlers, houses, schools, hospitals, etc... The total material damage of the flood disasters over last 60 years exceeded $US 7.5 billion. Additionally, floods and storms caused the loss of more than 20,000 lives (ADRC, 2006 & DDMFC, 2007).
Currently, the design guidelines for sea dikes, named 14TCN-130-2002, are used for all sea dike design in Vietnam. In this guidelines the design water level comprises of two components of i) sea water level of 5% exceedence frequency (1/20 year return period) of occurrence of tidal levels, and ii) storm surge heights cause by the design storm which corresponds to the wind speeds at the Beauford scale 9 to 10. The storm surge heights in dike design were fixed in the code by specific values. Arbitrary selection of 5% tidal level and artificial treating storm surge level and tidal level as two independent components does not reflect well the physic of total water level due to typhoon occurrence. In addition, selection of the design storms does not properly reflect statistical sense with no associating by any frequency of occurrence. Therefore, the safety level in the design
COASTAL ENGINEERING 2008 4279
guidelines only explicitly refers to a 1/20 year return period of the tidal level; it does not statistically count for extreme events i.e. typhoons.
The improvement of this situation calls for the use of present available knowledge on all levels. Vietnam has profound practical experience in the field of flood protection, however, the theoretical knowledge in the fields of dike design, reliability and safety approach, risk analysis, policy analysis, statistics in relation to boundary conditions and mathematical modeling is not up to date. Therefore, the transfer of this knowledge was strongly recommended (DWW/RWS, 1996; Vrijling et al., 2000; Mai et aL, 2006).
DESCRIPTION OF CASE STUDY Coastal flood defence system of Nam Dinh province in Vietnam is selected
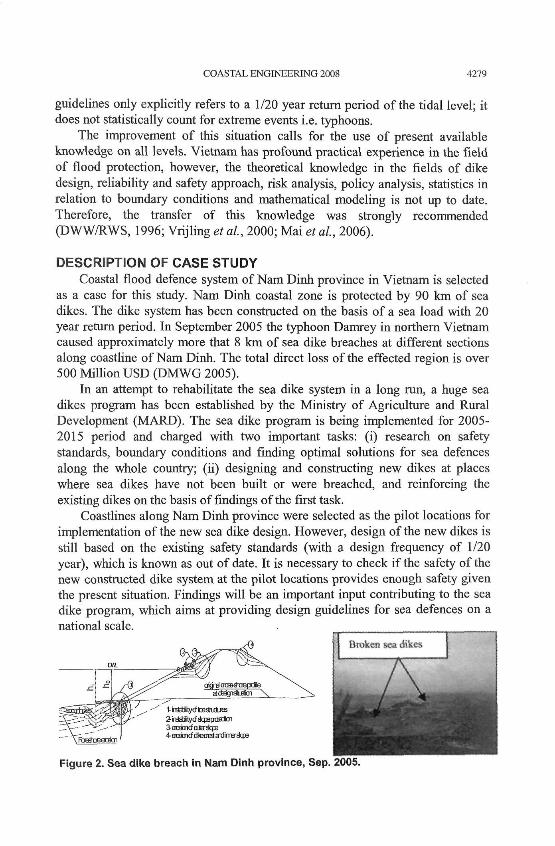
as a case for this study. Nam Dinh coastal zone is protected by 90 km of sea dikes. The dike system has been constructed on the basis of a sea load with 20 year return period. In September 2005 the typhoon Damrey in northern Vietnam caused approximately more that 8 km of sea dike breaches at different sections along coastline of Nam Dinh. The total direct loss of the effected region is over 500 Million USD (DMWG 2005).
In an attempt to rehabilitate the sea dike system in a long run, a huge sea dikes program has been established by the Ministry of Agriculture and Rural Development (MARD). The sea dike program is being implemented for 2005-2015 period and charged with two important tasks: (i) research on safety standards, boundary conditions and finding optimal solutions for sea defences along the whole country; (ii) designing and constructing new dikes at places where sea dikes have not been built or were breached, and reinforcing the existing dikes on the basis of findings of the first task.
Coastlines along Nam Dinh province were selected as the pilot locations for implementation of the new sea dike design. However, design of the new dikes is still based on the existing safety standards (with a design frequency of 1/20 year), which is known as out of date. It is necessary to check if the safety of the new constructed dike system at the pilot locations provides enough safety given the present situation. Findings will be an important input contributing to the sea dike program, which aims at providing design guidelines for sea defences on a national scale. . „ _ _ _ „ _ _ _ _ _ _ _ _
Figure 2. Sea dike breach in Nam Dinh province, Sep. 2005.

4280 COASTAL ENGINEERING 2008
PROBABILISTIC DESIGN OF COASTAL FLOOD DEFENCES
Safety assessment and reliability analysis Presently, there is an increasing interest to quantify the reliability of water
defence system using probabilistic approach (see e.g. the concept, method and application in Bakker & Vrijling 1980; Oumeraci et al. 2001 and Voortman 2002). In this approach every mechanism is described by a mathematical expression by the so-called reliability limit state function, Z=Strength-Load. The failure condition is defined as the boundary between the area that associates with failure (negative values of Z) and non-failure (positive values of Z), Z=0. The probability of failure can be expressed by P{Z<0}.
Quantification of the probability of system failure starts with the definition of reliability functions for all potential failure modes of all system elements. As from literatures, the general form of reliability function can be written by:
g(z,X)=R(z,X)-S(z,X) ( 1 )
where R is the resistance of the component, S is the load acting on the component, z is a vector of design variables describing among others the structural geometry of the component and X is a vector of load of random variables.
If the joint probability density function f&s(R, S) of R and S is known, the probability of failure can be calculated by means of integration:
Pf=P{Z<0}= HfRS(R,S)dRdS (2) Z<0
The solution can be calculated with numerical methods (level III) or approximated the first order reliability methods and/or second order reliability methods (level II), see CUR 141 (1990).
The overall failure probability of a system component is then given by combination of failure probability of all considered failure modes:
PfaiiuxeComp =P (Z,<0; Z2<0;... Zi<0;... Zm<0) (3)
where (Z/<0; Z2<0; ... Zt<0;... Zm<0) denotes at least one of m failure mechanisms occurs;
Consider a dike system with a uniform cross-sectional system which comprises number of independent sections. This can be described as a series system in probabilistic design. The maximum failure probability of this series system with n element can be calculated (Vrijling et al. 2000):
r f,system — •* ~" \* r /.section) / A \
On the above basis, if the geometry of CFDS is known and the joint probability distribution of load and strength variables is quantified, the

COASTAL ENGINEERING 2008 4281
probability of failure of the system of flood defences can be found. This can be applied for technical management purpose to determination of safety levels of an existing system and to find out the weak points of the system.
On the other hand, for a pre-defined failure probability (e.g. given an acceptable level of probability of flooding for a certain location) vector of acceptable design geometrical alternatives can be given by Eq. 5a. In order to find the solution a cost optimization can be done by Eq. 5b.
\D = {z\Pf(z)<Pf^} (a)
[Min.{l(z | Pf(z) < P/>max) + PF[i? r(z | Pf(z) < P/>max)]} (b) (5)
where Pf,max denotes the maximum acceptable probability of system failure; / is the initial investment cost and RT is the maintenance/repair cost during the total service lifetime of the structures, T. The investment cost can be estimated based on given geometry while the later term can be expressed through the failure probability of the each consider alternative. The reliability-based optimisation algorithms can be illustrated as in Fig. 3 (Mai et al. 2006, after Voortman 2002).
Figure 3. Reliability-based design of coastal defences
RISK ANALYSIS AND RISK BASED DESIGN Risk can be defined as the probability of a disaster, e.g. a flood, related to
the consequences (usually the multiplication of both variables), see CUR/TAW 1990. The idea of acceptable risk for different regions/ countries may be influenced by a single spectacular accident or incident like 1953 flood disaster in the Netherlands; tsunami disaster 2004 in Asia; Katrina in New Orleans, USA 2005; Typhoon Damrey in Vietnam 2005; and large flooding in Bangladesh 2007. These unwanted events could be starting/ turning points of any new safety policy establishment for the countries.
From literature, the acceptance of risk in a public view should be studied from two different points of view in relation to the estimation of the consequences. The first point of view concerns the risk assessment by society on a national level related to the number of casualties due to a certain hazardous

4282 COASTAL ENGINEERING 2008
event (Vrijling et al, 1998). The societal risk can be modelled by the frequency of exceedance curve of the number of deaths, called the FN-curve. Secondly, acceptable level of risk can be formulated in terms of economic cost benefit. Basically, the total costs in a system are determined by the sum of the expenditure for a safer system and the expected value of the economic damage. The acceptable risk measure can be estimated by comparing the cost of protection to a characteristic value of the consequences of flooding (DMWG, 2005). The optimal level of economically acceptable risk relating to an optimal level of safety will correspond to the point of minimal total costs. The total potential economic damage that will be caused by a flood can be presented by an exceedance frequency curve for damage, the so-called FD-curve.
Societal risk The basis of the calculation of societal risk is formed by the probability
density function (pdf) of the yearly number of fatalities. From the pdf an FN curve can be derived, which shows the probability of exceedance as a function of the number of fatalities, on a double logarithmic scale (Jonkman, 2007).
l-Flf(x) = P(N>x) = ]flf(x)-dx (6) X
Where: f„(x)the probability density function (pdf) of the number of fatalities per year; FN(x) probability distribution function of the number of fatalities per year, signifying the probability of fewer than x fatalities per year.
Vrijling et al. (1998) notes that the societal risk should be judged on a national level by limiting the total number of casualties in a given year. The total number of casualties is tested against the norm of ft*MF by the following form:
E(Ndi) + k * a(Ndi) < Pt * MF (7)
The multiplication factor MF is country-specific and based on: the value of the minimum death rate of the population, the ratio of the involuntary accident death rate (exclusive diseases) with the minimum death rate, the number of hazardous activities in a country (on average about 20 sectors) and the size of population. In Mai Van et al. (2008) the multiple factor was determined, MF=550, for the Vietnam situation. This value is reasonable while comparing to that of Netherlands (MF^lOO), and of South Africa (MFSA=750) by van Gelder et al. (2004). Therefore, the norm for Vietnam situation can be set at (3*550 and used for all successive calculations.
Economic approach in determination of acceptable risk In this approach the total costs of a system (Clot) are determined by the sum
of the investments (/A//) f° r a safer system; the expected value of the maintenance

COASTAL ENGINEERING 2008 4283
cost M and the expected economic damage D (van Dantzig, 1956). The total cost of the system with dike heightening AH is:
Clot(H0,AHPr,Pf) V,„ + W (Aff,, ) + PV(M + P*D) /o pf
(8)
The optimal level of safety indicated by Pf.opt corresponds to the point of minimal cost. The present value of the expected maintenance and damage costs are estimated by:
i=T
PV(M) = E(M)*Y; 1
U{l + r)1
PV(Pf*D) = Pf*E(DrJ—±—i ,-=o(7 + r)
(9)
(10)
Where: Pf is probability of failure per year; E(M) is yearly expected maintenance cost; E(D) is expected damage in case of flood, this can be determined from FD-curve, an exceedance frequency of the economic damage; r is real effective rate of interest; Tis planning period, in years.
APPLICATIONS
Safety assessment By the probabilistic safety and reliability assessment models, the safety of
the Nam Dinh sea dike system is determined. All possible failure mechanisms of the sea dike sections are taken into account. The safety assessment of the present dike system and of different scenarios of dike improvement has been made. By using level III method with Monte Carlo simulation the failure probability of possible failure modes and of the whole dike system is analysed. In addition contribution of failure modes to the total system failure probability can be determined by fault tree analysis. Analysis result is summarized in Fig. 4. More details on all calculations methods and extensive calculation steps, see Mai Van et al 2006).
Dike crest level (m)
Figure 4. Reliability of the Nam Dinh sea dikes

4284 COASTAL ENGINEERING 2008
Study found that the failure of the Nam Dinh sea dikes is mainly due to wave overtopping. The existing sea dike system has a total failure probability of 0.78 per year (1/1.3 year) when taking into account the length effects, although the dike system was designed to withstand a one in 20 year sea load. From Fig.4, in order to come up with the current existing standard of 1/20 year, the dikes should be heightened up to around 6.8m. Findings of this study are a good agreement with results of deterministic safety assessments and what have happened at the case study area during the last few decades (DWW/RWS 1996).
Reliability based optimisation By applying the reliability-based model the design parameter can be
determined. Maximum failure probability of the Nam Dinh sea dike system is 5% (1/20 year safety standard) as from the current safety standard (14TCN-130-2002). Taking into account the length effects the acceptable failure probability of a dike section approximates 0.0171. By implementing a fault tree analysis, based on the failure probability of the dike section the failure probability of every failure mode can be reallocated. Design values of the interested geometries for the dike section are obtained as in Tab. 1, column e.
Table 1. Failure probability vs. failure mode and the design values of Interested parameters per mechanism
Failure modes
(a) Overflowing
Excessive wave overtopping
Instability of armour unit
Instability of outer slope
instability of inner slope
Instability of toe protect
Excessive toe erosion
Instab. of toe structure
Piping condition 1
Piping condition 2
Section failure probability
System failure probability
Safety assessment
Pf [year"1]
(b) 3.81 E-03
1.30E-02
6.25E-03
3.10E-05
5.70E-03
1.10E-03
1.89E-04
1.00E-02
6.57E-04
9.00E-12
0.0492
0.78
important
(c) 12.80%
43.69%
21.00%
0.10%
19.15%
3.70%
0.64%
0.64%
0.00%
0.00%
0.0171
0.05
Reliability based design
Pf [year"1]
(d)
0,00022
0,00075
0,00036
0,000002
0,000327
0,000063
0,000011
0,000011
design value
(e)
Zcrest =6.80
Dn50=0.61
m!=3.25
m2=2.75
dp=2.90m
hscour =1.34
Determination of acceptable risk levels for flood in Vietnam From the Department of Dike Management and Flood Control (DDMFC,
2007) of Vietnam yearly fatalities and economic loss data due to floods and storms are collected. The data set is available from 1970 up to 2007. In addition, from the Asian Disaster Reduction Centre (ADRC, 2006) the top 25

COASTAL ENGINEERING 2008 4285
flood disasters of Vietnam in the 20th century are available. In which, there are twenty events that were due to floods and storms. These events are considered as historical events and included in analysis. The FN and FD curves due to flooding for the whole country, including historical events are presented in Fig. 5 and 6. Inspection of the FN data a lognormal frequency curve with //=541 and sigma=l 169 are found as the best-fit to the yearly fatality dataset.
Figure 5. Flooding FN-curve in Vietnam Figure 6. Flood FD-curve of Vietnam
In order to satisfy criteria by Eq. 7, different choices for k give different policy factors p approximately ranging from 3 to 7.5 (see Tab. 2). Comparing to the situation in the Netherlands, this factor is in range of 0.01 to 1.0 and associated with a safety standard of 1/10000 years, hence a different factors of 10 to 100 are found. Therefore, the safety standards for flood in Vietnam may be set at a design frequency of 1/100 per year or less.
Table 2. Policy factor tested for Vietnam situation
k
1
2
3
Total risk
1710.7
2880.4
4050.1
P 3.1
5.2
7.4
Economic opt imizat ion of protect ion level fo r the Nam Dinh d ike r ing
The 55 year damage data (includes historical events) is best fitted to lognormal distribution with E(D)= 181.3 and CF=309.5 (*106 US$). This means average flood damage of 181 * 106 US$ with an uncertainty of one to three times 0=309.5* 106 US$ is acceptable per year. This is comparable with the reported actual flood situation during the last 10 years with the annual flood damage is of around 1.5% of Vietnam GDP during the last 10 years, [sources:
4286 COASTAL ENGINEERING 2008
http://www.vnexpress.net/Vietnam/Xa-hoi/2007/10/3B9FB183A accessed on 25 April 2008]).
Based on design documents of existing Nam Dinh sea dikes by DDMFC/MARD 2005, taking into account the actual inflation rates of Vietnam the costs of dike heightening are presented in Fig. 7.
Figure 7. Expenditure as a function of dike heightening (per km)
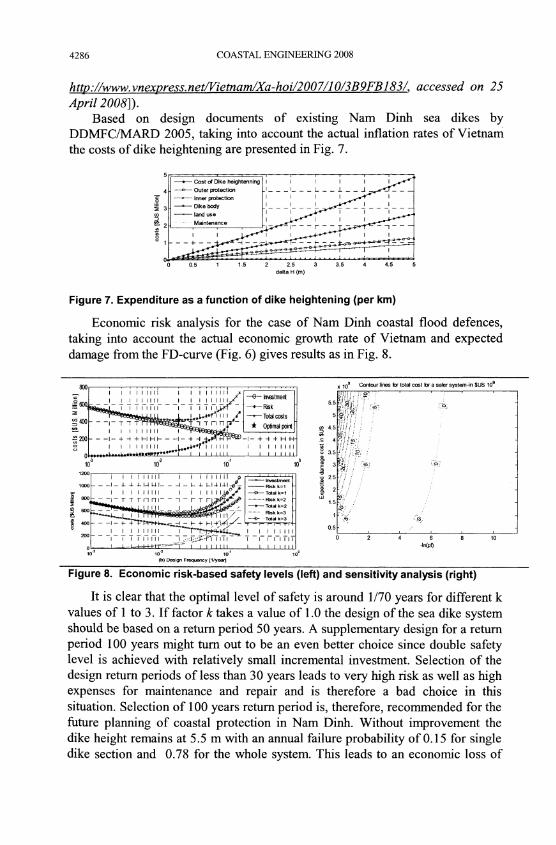
Economic risk analysis for the case of Nam Dinh coastal flood defences, taking into account the actual economic growth rate of Vietnam and expected damage from the FD-curve (Fig. 6) gives results as in Fig. 8.
x -|Q9 Contour lines for total cost for a safer system-in $US 109
Figure 8. Economic risk-based safety levels (left) and sensitivity analysis (right)
It is clear that the optimal level of safety is around 1/70 years for different k values of 1 to 3. If factor k takes a value of 1.0 the design of the sea dike system should be based on a return period 50 years. A supplementary design for a return period 100 years might turn out to be an even better choice since double safety level is achieved with relatively small incremental investment. Selection of the design return periods of less than 30 years leads to very high risk as well as high expenses for maintenance and repair and is therefore a bad choice in this situation. Selection of 100 years return period is, therefore, recommended for the future planning of coastal protection in Nam Dinh. Without improvement the dike height remains at 5.5 m with an annual failure probability of 0.15 for single dike section and 0.78 for the whole system. This leads to an economic loss of
io'3 io'2 io'1 io°
rjt - I 1- U 4 4 - H T * ! M a f I I M I N I | I I I I I 111 103 10"2 10"' 10°
(b) Design Frequency [1/year]

COASTAL ENGINEERING 2008 4287
over $US million 500, which is in the same order of magnitude to the total direct loss caused by the typhoon Damrey in 2005. Sensitivity analysis for a range of expected damages gives results as shown in Fig. 8 (right). Contour lines show the total costs of the system, line zero means the lowest total cost, and therefore, is the optimal set.
CONCLUSIONS This study presents the methods of reliability- and risk- based approaches
with an application to the field of coastal flood defences. It clearly shows that the proposed methods and models are powerful to answering these three given research questions in terms of safety assessments, optimal safety and optimal design.
Application of the methods for the case study of the sea defence system in Vietnam give us interesting results and allows the following remarks:
The existing sea defence system needs improvement in view of current safety standards and as well as according to acceptable risk philosophies, which counts for the recent development of Vietnam. Excessive overtopping was found as the most dominant mode which leads to sea dike failure. Beside, instability of slope and toe protected elements are considerable contributors to the failure probability.
Application of the reliability-based design geometry of the dikes provided in this study fulfills the current safety standard of 1/20 year.
Flood risk analysis with the societal risk criteria results in the policy factor fJ for Vietnam are in the range of 3 to 7.5. The safety level for sea flood defences of the case study area should be set at 1/100 per year or less;
Economic risk analysis showed that the actual safety standards in design of coastal flood defences of the Vietnamese case study (1/20 years) are not safe enough in views of the current Vietnam development with fast economic growth. An optimal choice of the acceptable safety level is suggested to set at 1/100 years. This is in good agreement with the upper bound of the societal acceptable risk.
ACKNOWLEDGEMENT This work has been carried out under the framework of Vietnam safety
aspects PhD research project, No. C71S15, supported by The Water Research Center, Delft University of Technology, The Netherlands. Additional support is from Delft Cluster research program in the Netherlands.
REFERENCES 14TCN-130-2002. 2002. Design Guidelines for sea dikes in Vietnam. Ministry
of Agriculture and Rural Developments, Hanoi, Vietnam. ADRC-Asian Disaster Reduction Centre. 2006. Top 25th natural disasters of
Vietnam in 20th Century. Report. 2006.

4288 COASTAL ENGINEERING 2008
Bakker, W.T and J.K. Vrijling. 1980. Probabilistic design of sea defences. In: Proceedings International Conference on Coastal Engineering 1980.
CUR/TAW. 1990. Probabilistic design of flood defences. Report No. 141, Gouda, Netherlands.
DDMFC-Department of Dikes Management and Flood Control of Vietnam. 2007. Flood damage reports.
Disaster Management Working Group (DMWG). 2005. Joint Assessment of Disaster and Needs 2005. Rapid Needs Assessment of Typhoon Damrey.
DWW/RWS. 1996. Sea dikes northern part of Viet Nam (Red River Delta). Ministry of transport, public works and water management, Rijkswaterstaat. Review report. May 1996.
Jonkman, S.N., 2007. Loss of Life estimation in flood risk assessment: Theory and applications. PhD-thesis. Delft University of Technology.
Mai Van, C, van Gelder, P.H.A.J.M. and J.K. Vrijling. 2006. Safety of coastal defences and flood risk analysis. Safety and Reliability for Managing Risk, 1355-1366. Taylor & Francis/Balkema, Leiden, The Netherlands.
Mai Van, C, van Gelder, P.H.A.J.M. and J.K.Vrijling. 2007. Failure Mechanisms of Sea dikes: inventory and sensitivity analysis. In: Proceedings of the Coastal Structures 2007. Venice, Italy. In press.
Mai Van, C , van Gelder, P.H.A.J.M., Mai Cao, T. and J.K.Vrijling. 2008. Risk analysis of coastal flood defences- A Vietnam case. In: SP Simonovic, PG Bourget, & SF Blanchard (Eds.), Proceedings of the 4th international symposium on flood defence. Toronto, Canada.
Oumerarci, H., Allsop, N.W.H., Groot, M.B. de, Crouch, R., Vrijling, J.K., Kortenhaus, A., and H.G. Voortman. 2001. Probabilistic design tools for vertical breakwaters. Balkema, Rotterdam, 2001.
Van Dantzig, V.D. 1956. Economic decision problems for flood prevention. Econometrica 24.
Van Gelder, P.H.A.J.M. and S.J. Ouwerkerk. Risk acceptance and perception. In: New model in survival analaysis related to AIDS. Project report, 2004.
Voortman, H.G. 2002. Risk-based design of large-scale flood defence systems. PhD thesis. Delft University of Technology.
Vrijling, J.K., van Hengel, W. and R.J. Houben. 1998. Acceptable risk as a basic for design. Journal of Reliability Engineering and System Safety, 141-150. Elsevier.
Vrijling, J.K. 2001. Probabilistic design of water defense systems in The Netherlands. Journal of Reliability Engineering & System Safety, Volume 74, Issue 3.