reliability and quality of supply forecast expenditure summary · reliability and quality of supply...
TRANSCRIPT

Forecast Expenditure Summary – Reliability and Quality of Supply 1

Forecast Expenditure Summary – Reliability and Quality of Supply ii
Contents 1. About this summary document ................................................................................................. 3
1.1 Purpose ........................................................................................................................... 3
1.2 Structure ......................................................................................................................... 3
2. Expenditure profile ................................................................................................................... 5
2.1 Direct costs ..................................................................................................................... 5
2.2 Total costs ....................................................................................................................... 8
3. Nature of expenditure ............................................................................................................. 10
3.1 Reliability ....................................................................................................................... 10
3.2 Quality of Supply ........................................................................................................... 11
4. Current period outcomes ........................................................................................................ 12
4.1 Ergon Energy’s regulatory proposal and AER’s distribution determination .................... 12
4.2 Reliability ....................................................................................................................... 13
4.3 Quality of Supply ........................................................................................................... 19
5. Expenditure forecasting method ............................................................................................. 20
5.1 Reliability ....................................................................................................................... 20
5.2 Quality of Supply ........................................................................................................... 21
6. Expenditure forecasts and outcomes for next period .............................................................. 24
6.1 Reliability ....................................................................................................................... 24
6.2 Quality of Supply ........................................................................................................... 25
7. Meeting Rules’ requirements .................................................................................................. 27
7.1 The capital expenditure objectives ................................................................................ 27
7.2 The capital expenditure criteria...................................................................................... 29
8. Appendices ............................................................................................................................ 34
Appendix A. Sampled Feeder Improvement project costs...................................................... 34
Appendix B. Definitions, acronyms and abbreviations ........................................................... 36
Appendix C. References ........................................................................................................ 37
Forecast Expenditure Summary – Reliability and Quality of Supply 3
1. About this summary document This section explains the purpose and structure of this summary document.
1.1 Purpose
The purpose of this summary document is to explain and justify Ergon Energy’s Reliability and Quality of Supply capital expenditure for its standard control services for the next regulatory control period, 1 July 2015 to 30 June 2020. It aims to provide the reader with a full understanding of Ergon Energy’s Reliability and Quality of Supply capital expenditure forecasts. However, because it is a summary document, it necessarily addresses some matters at a relatively high level and refers out to other documents for further detail. This summary document provides details of actual, estimated and forecast Reliability and Quality of Supply capital expenditure for the previous (1 July 2005 to 20 June 2010), current (1 July 2010 to 30 June 2015) and next regulatory control periods. All capital expenditure presented in this document is in real 2014-15 dollars.
Importantly, this summary document only explains and justifies Ergon Energy’s direct costs for its Reliability and Quality of Supply capital expenditure. Ergon Energy applies real cost escalations and shared costs (overheads) to these direct costs to determine its total Reliability and Quality of Supply capital expenditure. Ergon Energy has prepared, and provided to the AER (Australian Energy Regulator), separate documents that explain and justify – for all of its capital expenditure categories – how it applies these real cost escalations and shared costs (overheads). Readers should take care in examining the (unescalated) direct costs in this summary document to ensure that they do not confuse them with Ergon Energy’s: • Direct costs, inclusive of real cost escalations • Total costs, inclusive of direct costs, real cost escalations and shared costs (overheads).
1.2 Structure
The remainder of this summary document is structured as follows: • Section 2 details Ergon Energy’s Reliability and Quality of Supply capital expenditure for the
previous, current and next regulatory control periods. This is intended to provide the reader, at the outset, with a clear view of the profile of Ergon Energy’s actual, estimated and forecast Reliability and Quality of Supply capital expenditure that will be explained and justified in the remainder of this summary document.
• Section 3 describes the conceptual nature of Ergon Energy’s Reliability and Quality of Supply capital expenditure. It explains why it is necessary, including having regard for customer expectations, as well as Ergon Energy’s legislative and regulatory obligations.
• Section 4 examines why Ergon Energy’s Reliability and Quality of Supply capital expenditure in the current regulatory control period differed from the forecasts that it presented to the AER in its regulatory proposal (and revised regulatory proposal) as well as the AER’s own capital expenditure allowance in its Distribution Determination. It also explains how Ergon Energy has incorporated learnings about these differences into its capital expenditure forecasts for the next period.
• Section 5 explains Ergon Energy’s expenditure forecasting methodology for its Reliability and Quality of Supply capital expenditure for the next regulatory control period.

Forecast Expenditure Summary – Reliability and Quality of Supply 4
• Section 6 details Ergon Energy’s forecasts for its Reliability and Quality of Supply capital expenditure for the next regulatory control period that it is proposing that the AER approve.
• Section 7 draws on the material in the previous sections to explain and justify Ergon Energy’s forecast Reliability and Quality of Supply capital expenditure against the capital expenditure objectives and criteria in clause 6.5.7 of the National Electricity Rules (NER). It therefore outlines why the AER should approve this capital expenditure forecast as part of its Distribution Determination for Ergon Energy’s next regulatory control period.

Forecast Expenditure Summary – Reliability and Quality of Supply 5
2. Expenditure profile This section details Ergon Energy’s Reliability and Quality of Supply capital expenditure for the previous, current and next regulatory control periods. This is intended to provide the reader with a clear view of the profile of Ergon Energy’s actual, estimated and forecast combined Reliability and Quality of Supply capital expenditure that is then explained and justified in the remainder of this summary document. Note that this table shows expenditure on Standard Control Services only. Consistent with the ‘AER’s Framework and Approach – Ergon Energy and Energex 2015–2020’1, all capital expenditure associated with Reliability and Quality of Supply is recovered by Ergon Energy through Standard Control Services. This is because the need to augment the network for Reliability and Quality of Supply purposes cannot be attributed to any one identifiable customer or group of customers. Additionally the purpose of the works is to augment the existing shared network as opposed to extending the network to accommodate new customers, and the works typically benefit a group of customers as a result. For these reasons, Reliability and Quality of Supply services are classified as Standard Control Services rather than Alternative Control Services.
2.1 Direct costs
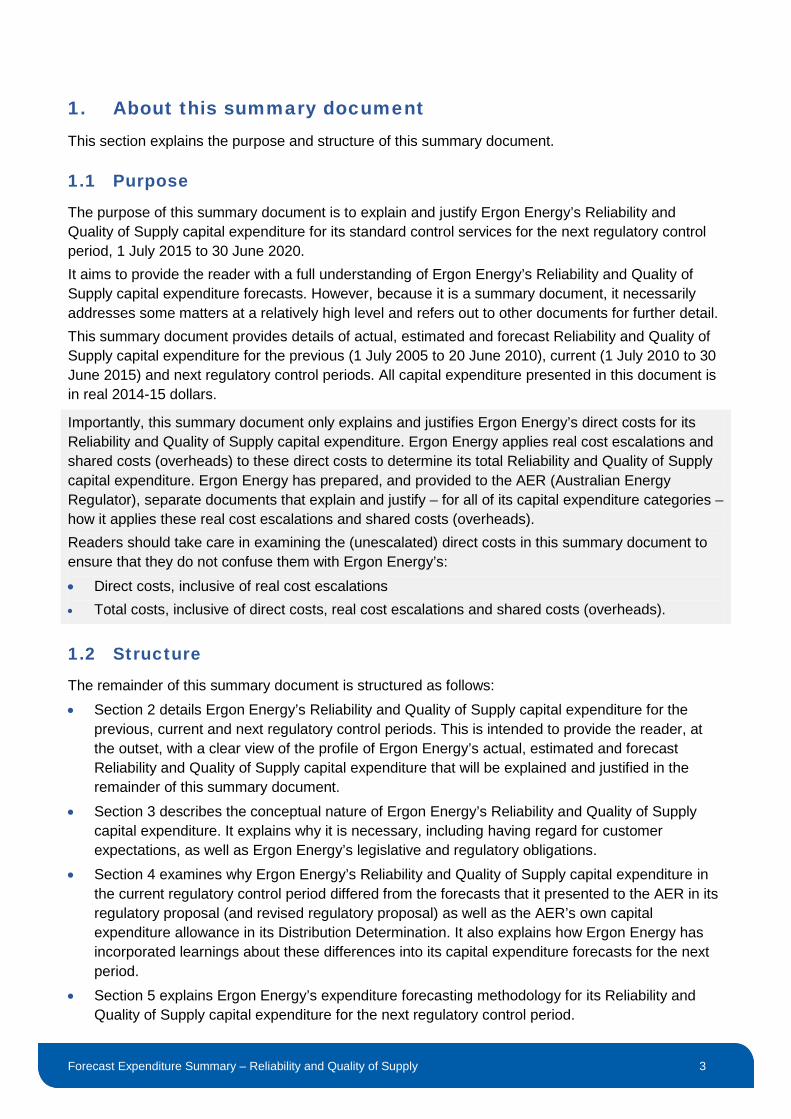
Table 1 details the following information about Ergon Energy’s Reliability and Quality of Supply capital expenditure, in direct costs, for the previous, current and next regulatory control periods: • the Reliability and Quality of Supply capital expenditure forecast that Ergon Energy:
o presented in its regulatory proposals, and revised regulatory proposals, to the Queensland Competition Authority (QCA) for the previous regulatory control period and to the AER for the current regulatory control period
o is now presenting in its regulatory proposal to the AER for the next regulatory control period.
• the QCA’s and the AER’s Reliability and Quality of Supply capital expenditure allowance for the previous and current regulatory control periods respectively, as detailed in their distribution determinations
• Ergon Energy’s actual and estimated Reliability and Quality of Supply capital expenditure for the previous and current regulatory control periods.
1 AER, Framework and Approach – Ergon and Energex 2015-2020, April 2014
Forecast Expenditure Summary – Reliability and Quality of Supply 6
Table 1: Reliability and quality of supply capital expenditure2 (Direct costs, $ million real 2014-15)
2005 -06
2006 -07
2007 -08
2008 -09
2009-10
Total 2010 -11
2011 -12
2012 -13
2013 -14
2014 -15 Total 2015
-16 2016
-17 2017
-18 2018
-19 2019
-20 Total
Regulatory Proposal 1 1 1 1 1 7 15 17 20 24 26 1033 2 2 2 2 2 127
Revised Regulatory Proposal 29 49 49 58 26 210 15 18 21 25 27 1054 n/a n/a n/a n/a n/a n/a
QCA/AER Determination 37 40 44 44 44 209 14 15 16 17 18 805 n/a n/a n/a n/a n/a n/a
Actual/Estimate 6 10 11 6 7 40 156 196 176 216 367 107 n/a n/a n/a n/a n/a n/a
Variance – Actual v Determination -84% -75% -75% -86% -84% -81% 7% 27% 6% 24% 100% 34% n/a n/a n/a n/a n/a n/a
2Indexation based on Australian Bureau of Statistics Series 6401.0 Consumer Price Index Weighted Average of Eight Capital Cities, All Groups CPI 3Regulatory Proposal to AER – Distribution Services for period – 1st July 2010 to 30th June 2015 – 1st July 2009, Page 31, Table 6 (and converted into direct costs). 4Revised Regulatory Proposal to AER – Distribution Services for period – 1st July 2010 to 30th June 2015 – 14th Jan 2010, Page 11, Table 1-1 (and converted as above). 5.AER Final decision, Queensland distribution determination 2010-11 to 2014-15, Page xxxiii, Table 12 (allocated by Ergon Energy into the capex categories and converted as above). 62010-11 to 2013-14 Ergon Energy Annual Performance RINs, Table 2.4 (2010-11 to 2011-12), Table 1 (2012-13 to 2013-14) (and converted as above). 7Network Capital Expenditure Forecast Model (for Ergon Energy 2015-20 regulatory proposal), escalated for CPI only and excludes input price escalations and overhead as per the Cost Allocation Method
(CAM).

Forecast Expenditure Summary – Reliability and Quality of Supply 7
The previous regulatory control period (2005-10) was the introduction for Ergon Energy to the Minimum Service Standards (MSS) under the regulatory control of the Queensland Competition Authority (QCA) through the Queensland Electricity Industry Code (EIC). In this period the relationship between expenditure and reliability outcomes was not well defined and was understood to be based on the improvement required from the MSS and an estimated investment rate related to customer minutes of interrupted supply. The reliability benefit resulting from other expenditure types was not well considered, namely the defect remediation expenditure, which at the time of the proposal had not yet completed the first full cycle. During the previous regulatory control period the gains in reliability from defect remediation were able to achieve reliability improvement at a rate considered to be equivalent to the improvement rate driven by MSS with a lower rate of direct expenditure. As Ergon Energy’s history in reliability performance measurement was limited in this period, relatively good weather in long rural areas in particular, led to the belief that the proposed level of investment that was originally planned was not required and so expenditure in this area was deferred. This initial regulatory control period also coincided with a high demand for investment to provide infrastructure to support customer initiated growth from mining and real estate development. The level of demand for investment in the network augmentation category was significantly above the determination, driven not only by customer-initiated developments but also in order to progressively address the network security criteria compliance imposed by the Queensland Government. The security criteria was never able to be fully achieved across the network because the volume of work required and resource constraints that resulted from the boom in many industries. These resource constraints and good performance gains from defect remediation in the early cycles led to reduced investment in the targeted reliability specific improvement programs in the period. For the current regulatory control period from 1 July 2010 to 30 June 2015, the proposal was based on: • a large program of SCADA (Supervisory Control and Data Acquisition) installation at substations • small programs of automatic circuit recloser (ACR) installations • small volume HV Subtransmission switch installations to sectionalise the Subtransmission
network • a large volume, feeder improvement program (42 feeders at $1 million total cost) • the initial stages of the Quality of Supply monitoring program. This proposal was subsequently reduced by the AER in its final determination predominately resulting from the insufficient justification for the investment in the feeder improvement program. Ergon Energy had missed the MSS limits in the consecutive years leading into 2010. At the time, this was primarily attributed to a ban on live line working, which increased the contribution from planned interruptions to MSS performance. The non-compliance with MSS ultimately led to Ergon Energy being issued a formal warning notice from the QCA, which in turn led to the initiation of the revised Reliability Strategy and the Reliability Improvement program in order to achieve shareholder expectations. This increased reliability capital expenditure was offset by reduced investment in augmentation and to a lesser extent asset replacement in the same period. Early in the current regulatory control period, a revised reliability improvement strategy was developed with the assistance of Marchment Hill Consultants. In developing this strategy a model was developed to understand long term average trends and to assess the gap between the underlying reliability performance and the MSS limits and to identify the most effective investment opportunities to overcome this gap. The most significant outcome of the strategy development was a substantial volume increase in the ACR program and a reduction in investment to the feeder improvement program. Overall, the strategic direction change led to a higher expenditure than was
Forecast Expenditure Summary – Reliability and Quality of Supply 8
considered at the time of formulating the regulatory proposal in order to meet MSS compliance by 2015.
2.2 Total costs
Table 2 below provides the same information as is in Table 1 above but, instead of presenting the Reliability and Quality of Supply capital expenditure direct costs, it presents it in total costs, i.e. inclusive of real cost escalations and shared costs (overheads).
This total cost information is provided for comparative purposes only, should the reader be seeking to compare Ergon Energy’s total costs with those in other documents. As discussed in section 1, the remainder of this document explains and justifies Ergon Energy’s direct costs only, i.e. the costs in Table 1 above.

Forecast Expenditure Summary – Reliability and Quality of Supply 9
Table 2: Reliability and Quality of Supply capital expenditure 8(Total costs, $ million real 2014-15)
2005 -06
2006 -07
2007 -08
2008 -09
2009 -10
Total 2010 -11
2011 -12
2012 -13
2013 -14
2014 -15 Total 2015
-16 2016
-17 2017
-18 2018
-19 2019
-20 Total
Regulatory Proposal 2 2 2 2 2 10 21 24 28 32 34 1389 3 3 4 4 4 1813
Revised Regulatory Proposal 43 75 71 85 40 314 21 24 28 33 35 14110 n/a n/a n/a n/a n/a n/a
QCA/AER Determination 58 63 69 71 72 333 20 21 22 24 24 11211 n/a n/a n/a n/a n/a n/a
Actual/Estimate 9 13 17 9 10 58 2212 2812 2512 3312 5213 160 n/a n/a n/a n/a n/a n/a
Variance – Actual v Determination -84% -79% -75% -87% -86% -83% 10% 33% 14% 38% 117% 43% n/a n/a n/a n/a n/a n/a
.
8 Indexation based on Australian Bureau of Statistics Series 6401.0 Consumer Price Index Weighted Average of Eight Capital Cities, All Groups CPI. 9 Regulatory Proposal to AER – Distribution Services for period – 1st July 2010 to 30th June 2015 – 1st July 2009, Page 31, Table 6. 10 Revised Regulatory Proposal to AER – Distribution Services for period –1st July 2010 to 30th June 2015 – 14th Jan 2010, Page 11, Table 1-1. 11 AER Final decision Queensland distribution determination 2010-11 to 2014-15, Page xxxiii, Table 12 (allocated by Ergon Energy into the capex categories). 12 2010-11 to 2013-14 Ergon Energy Annual Performance RINs, Table 2.4 (2010-11 to 2011-12), Table 1 (2012-13 to 2013-14). 13 Network Capital Expenditure Forecast Model escalated for Ergon Energy 2015-20 regulatory proposal in accordance with Ergon Energy Forecasting Methodology- i.e. applying CPI indexation, input price
escalations, overhead as per Ergon Energy CAM

Forecast Expenditure Summary – Reliability and Quality of Supply 10
3. Nature of expenditure This section explains and justifies Ergon Energy’s Reliability and Quality of Supply capital expenditure.
3.1 Reliability
Reliability capital expenditure relates to works directly targeted at addressing reliability of supply issues across the distribution system. It aims to enable Ergon Energy to maintain recent improvements in power supply reliability overall, in line with customer expectations and mandated reliability obligations, and to improve the experience of customers supplied by a consistently poor performing feeder or feeder section.
3.1.1 Customer informed
Ergon Energy’s forecast reliability capital expenditure has regard for customer and shareholder expectations and willingness-to-pay for improvements. To ensure our Regulatory Proposal is aligned with the long-term interests of our customers and communities, we have undertaken an integrated twelve-month engagement program. As part of this activity, a sophisticated Service/Cost Trade-off Research study was undertaken to explore our customers’ willingness to pay for reliability performance. This program has been part of an ongoing conversation with our customers and the communities we serve. Through this engagement we know that reliability of supply remains an important factor in our customers’ value perceptions. However, overall our customers are satisfied with the current levels of reliability, and few see a strong need to pay for further improvement. Furthermore, the research found a customers’ reliance on electricity, their current reliability experience and their geographical location can impact willingness to pay for different reliability standards. This has informed our forecasts in this expenditure category, as well as expenditure across the whole Regulatory Proposal. Customer surveys have provided insight into the customer’s clear preference to maintain reliability performance at current levels while reducing the upward pressure on price. This is reflected in the lower investment in reliability performance improvement over the next regulatory control period than occurred in the current regulatory control period.
3.1.2 Legislative requirements
On 1 July 2014 Ergon Energy’s legislative obligations were amended in line with customers’ expectations. Acting as jurisdictional regulator, the Queensland Department of Energy and Water Supply (DEWS) amended Ergon Energy’s Distribution Authority issued under the Electricity Act 1994 to incorporate the reliability of supply MSS obligations, an Improvement Program obligation associated with the ‘Worst Performing’ distribution feeders and the revised network security of supply standards. The MSS obligations that had previously been prescribed within the Queensland Electricity Industry Code (EIC) are now part of the Distribution Authority. In transitioning to the Distribution Authority the MSS, limits applicable to Ergon Energy were reset to be equivalent to those that applied in 2010-11 and have been flat-lined until 30 June 2020. The Improvement Program introduced into the Distribution Authority now defines Ergon Energy’s jurisdictional obligation to monitor, report and where prudent to do so, invest to improve the reliability of supply afforded to customers supplied on consistently poor performing distribution feeders and

Forecast Expenditure Summary – Reliability and Quality of Supply 11
feeder sections. Ergon Energy through the EIC had previously been required to monitor and report on the identified worst performing distribution feeders and had taken from this monitor and report obligation, an implied obligation to improve. The amendment to the Distribution Authority formalises the implied obligation in this area. In addition, the Distribution Authority includes the security of supply criteria that replaces the previously applied, prescriptive network security standards with a risk and reliability outcomes based criteria. The amendments made to the security criteria are detailed in the ‘Forecast Expenditure Summary Corporation Initiated Augmentation 2015 to 2020’, supported by the ‘Security Criteria’ document. In consideration of these changes, Ergon Energy has reduced its Augmentation capital expenditure across the next regulatory control period. Ergon Energy expects that the transition to a risk and reliability outcomes based planning criteria will adversely impact network reliability performance in the latter part of the next regulatory control period as the elevated risk is realised as impacts on performance. Investment to counter the increased risk, and balance this negative impact, is not sought in this regulatory submission but will likely form part of future submissions as Ergon Energy comes to better understand the relationship between the increased risk and reliability performance outcomes.
3.2 Quality of Supply
Quality of Supply capital expenditure is primarily intended to allow Ergon Energy to identify and deliver works to comply with mandatory quality of supply obligations in accordance with existing statutory requirements and future regulatory performance standards and targets. The expectation that Ergon Energy will deliver to the standard has increased with the take up of sensitive electronics equipment and, most recently, solar energy systems. Our customers’ quality of supply concerns are monitored through customer complaints, and have been explored through our broader engagement program. The latter has shown the community expect us to operate the network in a way that supports greater customer choice and control in electricity supply solutions. The works program includes installing devices to actively monitor network power quality parameters, to understand steady state ranges of operation, identify emerging trends and boundary point excursions. The steady state ranges of operation and other quality of supply parameters are also monitored to assist in the validation of network models used to identify capacity constraints and network augmentation solutions and to monitor and address breaches in the statutory limits in this regard. Emerging trends are monitored to allow proactive remediation of emerging issues before the parameter is breached causing customer equipment and plant damage or otherwise adversely affecting the customer’s quality of supply. The boundary point excursions are also monitored to improve response and remediation times in order to minimise customer equipment damage and perceptibility concerns. Ergon Energy’s aim is eventually to be able to provide historical and current data to support future application of quality of supply performance parameters in Queensland and national regulatory frameworks.
Forecast Expenditure Summary – Reliability and Quality of Supply 12
4. Current period outcomes This section examines why the Reliability and Quality of Supply capital expenditure in the current regulatory control period differed from the forecasts that it presented to the AER in its regulatory proposal (and revised regulatory proposal), as well as the AER’s capital expenditure allowance in its Distribution Determination. It also explains how Ergon Energy has incorporated learnings about these differences into its capital expenditure forecasts for the next period.
4.1 Ergon Energy’s regulatory proposal and AER’s distribution determination
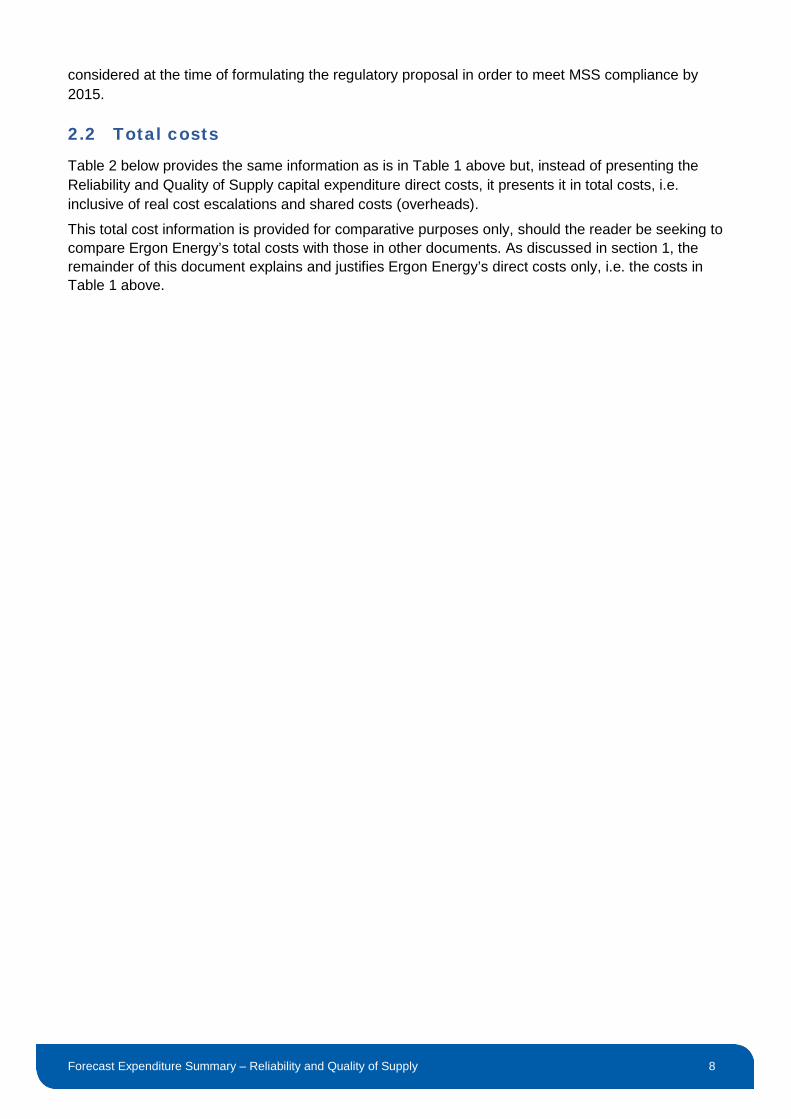
Table 3 (in direct costs) and Table 4 (in total costs) detail the Reliability and Quality of Supply forecast in its regulatory proposal and revised regulatory proposal and the AER’s allowance in its Distribution Determination for the current period. They also detail Ergon Energy’s actual and estimated expenditure and the variance against the allowance in the AER’s Distribution Determination.
Table 3: Current period Reliability and Quality of Supply capital expenditure (Direct costs, $ million real 2014-15)
2010-11 2011-12 2012-13 2013-14 2014-15 Total
Regulatory Proposal 15 17 20 24 26 103
Revised Regulatory Proposal 15 18 21 25 27 105
QCA/AER Determination 14 15 16 17 18 80
Actual/Estimate 15 19 17 21 36 107
Variance – Actual v Determination 7% 27% 6% 24% 100% 34%
Table 4: Current period Reliability and Quality of Supply capital expenditure (Total costs, $ million real 2014-15)
2010-11 2011-12 2012-13 2013-14 2014-15 Total
Regulatory Proposal 21 24 28 32 34 138
Revised Regulatory Proposal 21 24 28 33 35 141
QCA/AER Determination 20 21 22 24 24 112
Actual/Estimate 22 28 25 33 52 160
Variance – Actual v Determination 10% 33% 14% 38% 117% 43%
Ergon Energy’s current period regulatory submission and final determination in the Reliability and Quality of Supply sub category was heavily weighted to investment in the area of Reliability Improvement and it is the expenditure variation in this area that has driven the sub category level variation between the Distribution Determination and the Actual / Estimated level of investment. In response to consecutive years of non-compliance to the jurisdictional MSS limits, Ergon Energy reassessed and reprioritised its investment strategy in reliability improvement early in the current

Forecast Expenditure Summary – Reliability and Quality of Supply 13
regulatory control period. As a result, Ergon Energy has invested beyond the regulatory determination to achieve the performance levels required of it by its shareholders. However, the investment for the current regulatory control period in Quality of Supply has been consistent with the intended expenditure that was considered in Ergon Energy’s current period regulatory proposal, and provided for in the final Distribution Determination.
4.2 Reliability
This section explains and justifies Ergon Energy’s current period reliability of supply outcomes in relation to expenditure and performance.
4.2.1 Reliability of Supply capital expenditure outcomes
Early in the current regulatory control period, Ergon Energy increased the understanding of its underlying reliability performance and as a result became more aware of the marginal difference between the historical performance and the jurisdictionally mandated MSS limits. In formulating the current period regulatory proposal Ergon Energy had underestimated the statistical variability in network reliability performance and as such had underestimated the level of investment required in this category of expenditure. The regulatory proposal for the current regulatory control period was based on the level of investment considered by Ergon Energy as appropriate to achieve MSS compliance. The key investment items considered in the proposal were: • the SCADA program • limited volume ACR installations • small volume HV Subtransmission switch installations to sectionalise the Subtransmission
network • a large volume feeder improvement program The proposal was reduced by approximately $26 million by the AER in its final determination as a result of insufficient justification for the investment in the feeder improvement program. In the later years of the 2005-10 regulatory control period the MSS limits became significantly more onerous leading to Ergon Energy’s failure to achieve regulatory compliance for five of six MSS limits in 2008-09 and 2009-10. The repeated non-compliance with MSS resulted in Ergon Energy being issued a formal warning notice from QCA, which in turn led to the initiation of the revised Reliability Strategy and the Reliability Improvement program in order to achieve shareholder expectations. In 2011, Ergon Energy established the Reliability Strategy and associated Reliability Improvement Program following detailed modelling of the network reliability performance. This modelling provided baseline trends and statistical variations across the various performance categories that was not previously understood and triggered amendment to the investment strategy applied to reliability improvement. The modelling determined the gap between baseline performance trends and the MSS for a Probability of Exceedance of 20%, which represented Ergon Energy’s ‘best endeavours’ approach to MSS compliance and provided insurance against over investment given that some uncertainty in future modelling and performance gains existed. The modelling identified that Ergon Energy needed to significantly improve performance across all six performance indicators of the MSS, with a focus on urban and short rural category feeder interruption duration.
Forecast Expenditure Summary – Reliability and Quality of Supply 14
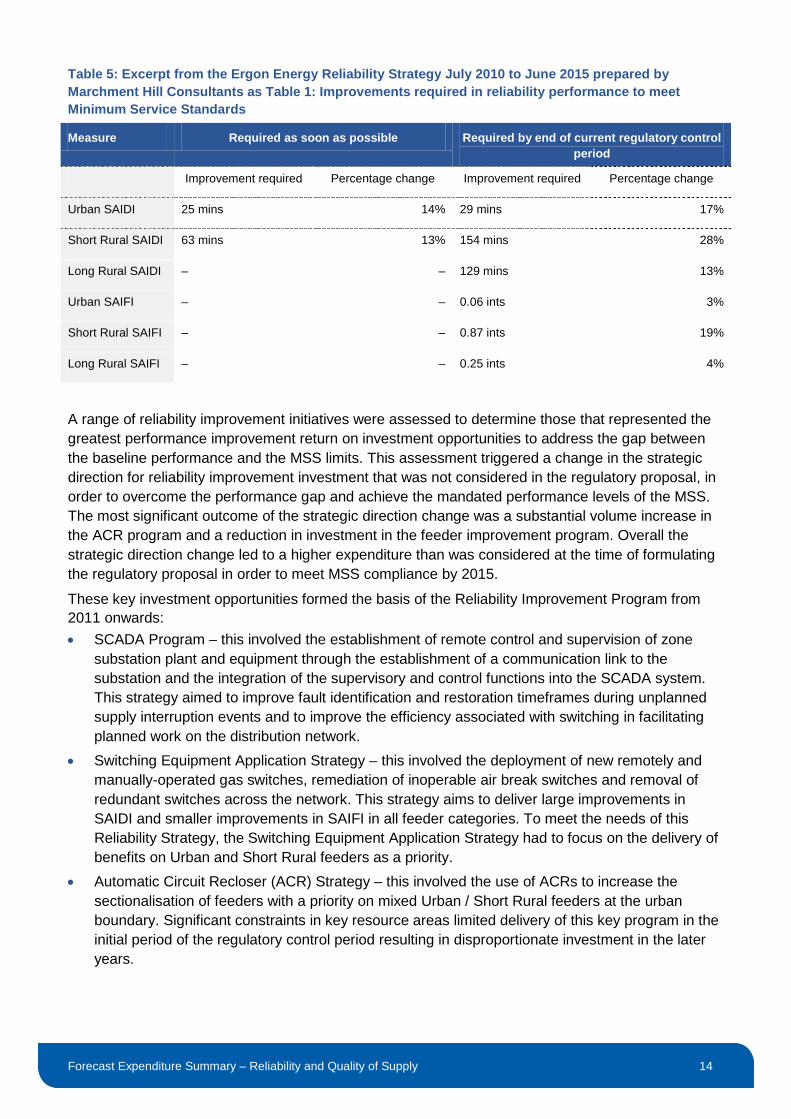
Table 5: Excerpt from the Ergon Energy Reliability Strategy July 2010 to June 2015 prepared by Marchment Hill Consultants as Table 1: Improvements required in reliability performance to meet Minimum Service Standards
Measure Required as soon as possible Required by end of current regulatory control period
Improvement required Percentage change Improvement required Percentage change
Urban SAIDI 25 mins 14% 29 mins 17%
Short Rural SAIDI 63 mins 13% 154 mins 28%
Long Rural SAIDI – – 129 mins 13%
Urban SAIFI – – 0.06 ints 3%
Short Rural SAIFI – – 0.87 ints 19%
Long Rural SAIFI – – 0.25 ints 4%
A range of reliability improvement initiatives were assessed to determine those that represented the greatest performance improvement return on investment opportunities to address the gap between the baseline performance and the MSS limits. This assessment triggered a change in the strategic direction for reliability improvement investment that was not considered in the regulatory proposal, in order to overcome the performance gap and achieve the mandated performance levels of the MSS. The most significant outcome of the strategic direction change was a substantial volume increase in the ACR program and a reduction in investment in the feeder improvement program. Overall the strategic direction change led to a higher expenditure than was considered at the time of formulating the regulatory proposal in order to meet MSS compliance by 2015.
These key investment opportunities formed the basis of the Reliability Improvement Program from 2011 onwards: • SCADA Program – this involved the establishment of remote control and supervision of zone
substation plant and equipment through the establishment of a communication link to the substation and the integration of the supervisory and control functions into the SCADA system. This strategy aimed to improve fault identification and restoration timeframes during unplanned supply interruption events and to improve the efficiency associated with switching in facilitating planned work on the distribution network.
• Switching Equipment Application Strategy – this involved the deployment of new remotely and manually-operated gas switches, remediation of inoperable air break switches and removal of redundant switches across the network. This strategy aims to deliver large improvements in SAIDI and smaller improvements in SAIFI in all feeder categories. To meet the needs of this Reliability Strategy, the Switching Equipment Application Strategy had to focus on the delivery of benefits on Urban and Short Rural feeders as a priority.
• Automatic Circuit Recloser (ACR) Strategy – this involved the use of ACRs to increase the sectionalisation of feeders with a priority on mixed Urban / Short Rural feeders at the urban boundary. Significant constraints in key resource areas limited delivery of this key program in the initial period of the regulatory control period resulting in disproportionate investment in the later years.

Forecast Expenditure Summary – Reliability and Quality of Supply 15
• Implementation of remote communications to ACRs – this involved the provision of remote supervision and control of existing, installed ACRs to facilitate reduced switching times and improved fault-finding and building on the success of the SCADA Acceleration Strategy. The initial stages of delivery focused on enabling communications to ACR devices that are communications-ready. Like the ACR Strategy, this key program suffered delayed delivery in the initial years of the regulatory control period due to significant constraints in key resource areas. As a result, a significant portion of the investment in this program occurs in the later years of the regulatory control period.
• Design and Construction of feeder ties – this involved creating alternative supply options to avoid and minimise customer impacts during planned or prolonged unplanned outage events. This program aimed to deliver benefits as early as possible to customers on Urban and Short Rural feeders.
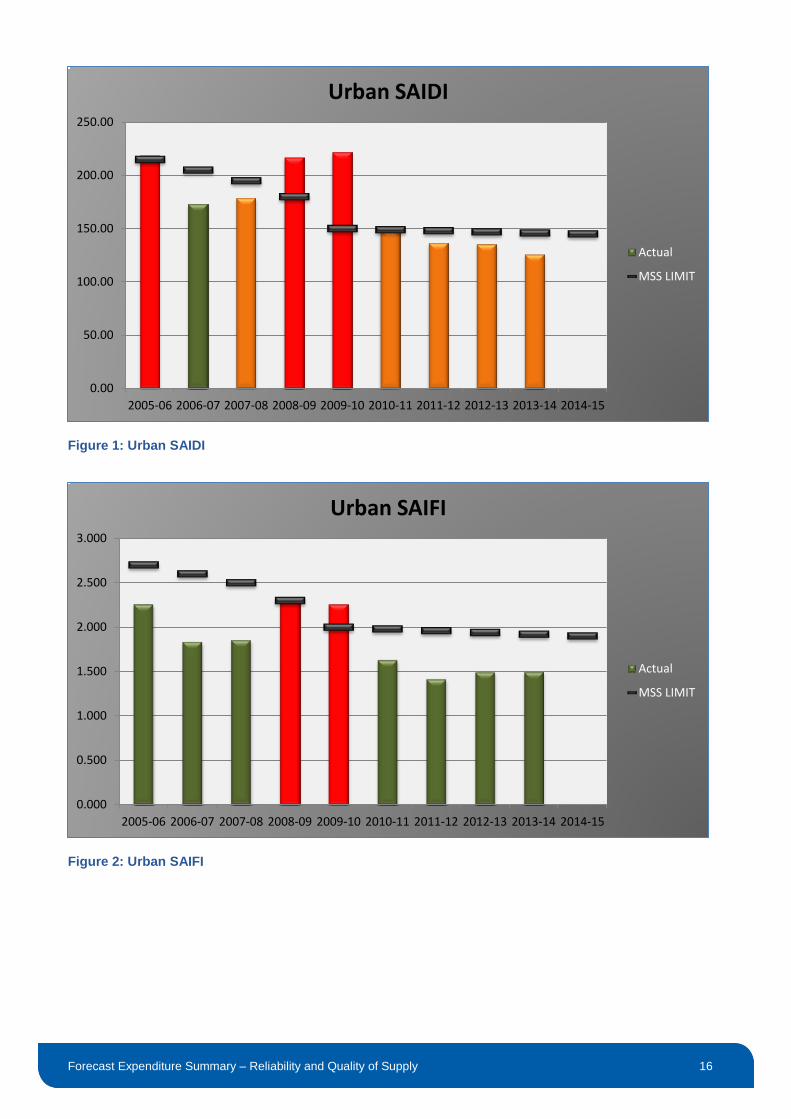
4.2.2 Reliability performance outcomes
Ergon Energy’s objective is to achieve and maintain its average reliability performance across all feeder types within the standards prescribed in the Distribution Authority and prior to that the Queensland Electricity Industry Code (EIC). In order to achieve this, Ergon Energy has a Reliability Improvement Program that provides focus on the targeted reliability improvement programs to address the assessed performance gaps across the three feeder categories. The priority and initial focus of the improvement program was to address the performance in the urban and short rural category feeders, with the long rural category feeders receiving limited improvement funding in the early years of the current regulatory control period. The graphs below demonstrate the performance improvement yielded through the investments in reliability improvement made over the current regulatory control period. The objective of the investment in this area has been achieved in the urban and short rural category feeders, with both feeder categories demonstrating improving performance that is consistently favourable to the MSS. The limited investment made to date in this regulatory control period in long rural feeder category is reflected by the small improvement in this area. Targeted investments in the final year of the current regulatory control period is aimed at establishing the margin required in this feeder category to consistently achieve MSS compliance for the next regulatory control period. Continuation of the existing and in-progress programs is forecast to result in a gap between inherent performance and the MSS limit that will accommodate future statistical performance variation and discharge Ergon Energy’s ‘reasonable endeavour’ obligations associated with the MSS under the Distribution Authority until at least 30 June 2020.
Forecast Expenditure Summary – Reliability and Quality of Supply 16
Figure 1: Urban SAIDI
Figure 2: Urban SAIFI
0.00
50.00
100.00
150.00
200.00
250.00
2005-06 2006-07 2007-08 2008-09 2009-10 2010-11 2011-12 2012-13 2013-14 2014-15
Urban SAIDI
Actual
MSS LIMIT
0.000
0.500
1.000
1.500
2.000
2.500
3.000
2005-06 2006-07 2007-08 2008-09 2009-10 2010-11 2011-12 2012-13 2013-14 2014-15
Urban SAIFI
Actual
MSS LIMIT

Forecast Expenditure Summary – Reliability and Quality of Supply 17
Figure 3: Short Rural SAIDI
Figure 4: Short Rural SAIFI
0.00
100.00
200.00
300.00
400.00
500.00
600.00
700.00
2005-06 2006-07 2007-08 2008-09 2009-10 2010-11 2011-12 2012-13 2013-14 2014-15
Short Rural SAIDI
Actual
MSS LIMIT
0.000
1.000
2.000
3.000
4.000
5.000
6.000
2005-06 2006-07 2007-08 2008-09 2009-10 2010-11 2011-12 2012-13 2013-14 2014-15
Short Rural SAIFI
Actual
MSS LIMIT

Forecast Expenditure Summary – Reliability and Quality of Supply 18
Figure 5: Long Rural SAIDI
Figure 6: Long Rural SAIFI
0.00
200.00
400.00
600.00
800.00
1000.00
1200.00
1400.00
2005-06 2006-07 2007-08 2008-09 2009-10 2010-11 2011-12 2012-13 2013-14 2014-15
Long Rural SAIDI
Actual
MSS LIMIT
0.000
2.000
4.000
6.000
8.000
10.000
12.000
2005-06 2006-07 2007-08 2008-09 2009-10 2010-11 2011-12 2012-13 2013-14 2014-15
Long Rural SAIFI
Actual
MSS LIMIT

Forecast Expenditure Summary – Reliability and Quality of Supply 19
4.3 Quality of Supply
This section explains and justifies Ergon Energy’s current period quality of supply outcomes in relation to expenditure and performance. Ergon Energy invests in the Quality of Supply to provide the monitoring capability to ensure timely identification and remediation of quality of supply excursions from Ergon Energy’s Quality of Supply standards and to build its capability to report on momentary supply interruption performance in the future. Ergon Energy has adopted the power quality standard as set by the International Electrical Committee (IEC) and Australian Standards (AS). The standards followed accord with the IEC/AS 61000.2 and 61000.3 series. These standards set the levels for harmonics, flicker and compatibility required to ensure compliance by all connected to the network. Additionally the Queensland Government legislates the mandatory voltage window to be provided at the customer terminals through the Queensland Electricity Act and the Queensland Electricity Regulations.
4.3.1 Quality of Supply capital expenditure outcomes
The current period regulatory proposal for expenditure in the sub category of Quality of Supply aimed to provide investment to extend the network monitoring of power quality parameters. In the previous regulatory control period (2005-10), Ergon Energy initiated a strategic program of power quality monitoring device installations across the distribution network. The investment in this program continued into the current regulatory control period and has to date resulted in the installation of 1,790 monitors across the network. The data that is being returned from these installations is being monitored and is reported internally to allow proactive remediation of emerging quality of supply issues and to support augmentation investment decisions. To complement the field installed power quality monitors, Ergon Energy is also investing to increase its capability to identify the sources of disturbing loads that contribute to quality of supply issues across the network. Ergon Energy has during the current regulatory control period installed 100 power quality analysers on distribution feeders that supply major customers and customers identified as having potentially disturbing loads.
4.3.2 Quality of Supply performance outcomes
Through investment in the current regulatory control period Ergon Energy has extended its Quality of Supply parameter monitoring capability. As a result 823 distribution feeders or approximately 67% of the network feeders are now monitored for Quality of Supply disturbances.
Ergon Energy has installed 1,790 power quality monitors over the current and previous regulatory control periods in rolling out the initial stages of the ‘Power Quality Monitoring Strategy’. Complementing the installation of the power quality monitors Ergon Energy is progressively installing 100 power quality analysers on targeted distribution feeders to enhance the identification of the source of quality of supply disturbances. The enhanced capability delivered through this investment has allowed Ergon Energy to become more proactive in addressing emerging Quality of Supply issues. The customer outcomes resulting from the improved awareness and response to emerging issues can be demonstrated by the reduction in customer initiated quality of supply complaints received by Ergon Energy since the inception of this strategic program. Table 6 below provides the annual network asset event records based on customer complaints that relate to quality of supply issues, and breaks this down to show the solar installation initiated complaints, and the non-solar installation related complaints received by Ergon Energy in the past five years. The early identification and proactive response provided to address emerging quality of

Forecast Expenditure Summary – Reliability and Quality of Supply 20
supply problems is considered to have been a significant contributor to the improvement across the five-year period.
Table 6: Quality of Supply complaints received between 2009-10 and 2013-14
Year Quality of Supply complaints Solar issue complaints Non-solar complaints
2009-10 1121 32 1089
2010-11 950 71 879
2011-12 975 147 828
2012-13 1398 592 806
2013-14 817 307 510
5. Expenditure forecasting method
5.1 Reliability
Ergon Energy’s Reliability capital expenditure will be funded through the AER’s funding with the revenue cap and through future revenue adjustments made through the Service Target Performance Incentive Scheme (STPIS). The regulated capital expenditure will be invested into areas to ensure that Ergon Energy discharges its jurisdictional obligations beyond the extent to which the STPIS provides incentive to invest and future revenues adjustments from STPIS will be used to deliver improvement where it is considered appropriate to do so. The Reliability capital expenditure investment is required to discharge the improvement obligations of Ergon Energy’s Distribution Authority through the continuation of the Worst Performing Feeder Program. Ergon Energy’s single reliability improvement capital expenditure item is in the area of Worst Performing Feeder Improvement. This program is a continuation of an ongoing program that aims to improve the performance experienced by the customers supplied by consistently poor performing feeders or feeder sections. This program doesn’t aim to achieve average performance improvement but rather improvement to small pockets of the worst served customers. Due to the relatively small customer numbers generally supplied by the worst performing feeders and feeder sections, any improvement delivered through this program will have minimal effect on the feeder category level average performance. Projects aimed at improving the feeder category level average performance will be funded separately by future revenue adjustments made under the STPIS rewards. The Worst Performing Feeder Improvement program aims to deliver targeted reliability improvements to the distribution feeders that supply customers who consistently receive poor supply reliability. The feeders included in the worst performing feeder program are identified through on an annual cyclic review of the historical average interruption duration. Feeders are included or excluded in the program based on the outcomes of a root cause analysis of the reliability drivers and an assessment of the cost effectiveness of the remediation options. The scope of works for each project within the program is based on the cost/benefit assessment of the remediation options considered and the net performance improvement achieved. Past results of the Worst Performing Feeder Program have demonstrated a noticeable improvement in these key drivers, although due to the localised nature of the issues and remediation actions undertaken, the benefits are not identical for all feeders. Ergon
Forecast Expenditure Summary – Reliability and Quality of Supply 21
Energy expects the feeders to be targeted in the regulatory control period 2015 to 2020 to achieve similar outcomes. Refer to the ‘Worst Performing Feeders Engineering Report’ for further details. The projects included in the worst performing feeders program are determined annually based on the feeders that, over a three-year period, have demonstrated consistently poor performance and an assessment of the key performance drivers for this network section. The estimated costs used to forecast the capital expenditure are based on average actual costs of projects previously delivered under this program. As the expenditure incurred in each project varies, depending on the issue being remedied, Ergon Energy believes this to be the most reasonable and prudent way of estimating the cost of similar projects in the future. Appendix A provides the actual costs associated with 30 recently delivered distribution feeder reliability improvement projects. This sample shows that the average actual direct cost of approximately $102,934 (2012-13 dollars) per improvement project and is the basis for the forecast investment per feeder in the Worst Performing Feeder program in the next regulatory control period. The volumes associated with this investment category have been determined to align to the omprovement program obligations of Ergon Energy’s Distribution Authority and is based on annual delivery of three feeder improvement projects in each of Ergon Energy’s supply regions. This will address 45 of the 50 current worst performing feeders over the regulatory control period. Ergon Energy expects that the remaining five identified worst performing feeders will have no identifiable, cost effective and prudent improvement opportunities. Ergon Energy believes that a target of three projects per supply region per year is a prudent and efficient way of achieving meaningful improvements in each of the three areas of Ergon Energy’s network. Smoothing this expenditure over the five years is aimed at providing a sustainable delivery model that will minimise any volume-related price escalation and optimise resource allocations to avoid resource stranding. Ergon Energy’s approach to identifying and rectifying poor performing feeders is the most prudent and reasonable way of addressing poor performing sections of the network. This was supported by an independent review of the program commissioned by Queensland Department of Mines and Energy and conducted by Evans and Peck in 2009. Ergon Energy intends to apply the same methodology to worst performing feeders in the regulatory control period 2015-20. This document reflects the fact that the MSS have been transferred from the Queensland Electricity Industry Code to Ergon Energy’s Distribution Authority and that the Distribution Authority now requires Ergon Energy deliver an improvement program to address poor performing feeders. In the transition of the MSS limits to the Distribution Authority, the Department of Energy and Water Supply (DEWS) also flat-lined the MSS limits at levels that are equivalent to the 2010-11 MSS limits until 30 June 2020. Ergon Energy also acknowledges the potential for performance decline across all three feeder categories as a result of the reduction in subtransmission network augmentation capital investments associated with the change to a risk based security criteria. Ergon Energy makes no submission in the 2015-20 period for funding to compensate for this potential based on an assumption that performance decline resulting from this change will have minimal impact in the 2015-20 regulatory control period but may become more pronounced beyond that period. Ergon Energy intends to formulate a robust methodology for the assessment of the performance decline to allow for a future regulated capital expenditure submission for funding in this area in future control periods.
5.2 Quality of Supply
Ergon Energy’s ‘Power Quality Monitoring Strategy 2012-20’ provides the strategic roadmap to achieve reasonable penetration and population of power quality monitoring devices. The primary aim of the strategy is to provide improved network monitoring and data warehousing to assist in achieving

Forecast Expenditure Summary – Reliability and Quality of Supply 22
performance within the tolerances of the Queensland Electricity Regulations and the National Electricity Rules. The Power Quality Monitoring Business Case considers and justifies this investment. Ergon Energy has installed approximately 1,790 power quality monitors in the earlier stages of the power quality monitoring strategy. The Quality of Supply capital expenditure being sought in the next period will provide power quality monitoring for the remaining network sections that were not covered in the earlier stage roll-outs. Fully covering all distribution network sections requires the installation of an additional 1,120 power quality monitors on the distribution network feeders. An additional 100 power quality analysers will also need to be installed at the zone substation level on distribution feeders that have significant point loads that have been assessed as potential power quality disturbance sources. Ergon Energy has also developed a strategy to manage voltage levels over time to guide the shift to a lower voltage regulation set point on the low voltage distribution network to within the allowable limits of the Australian Standard AS61000.3.100 and the Queensland Electricity Regulations. This lower set point will improve network accessibility for inverter energy system (IES) generation, extend the lifespan of customer equipment and reduce customer complaints resulting from high network voltages at their point of connection. Ergon Energy sampled the performance of the network in 2010-11, which indicated that approximately 40% of Ergon Energy’s assessed customers were exposed to voltages exceeding the upper voltage threshold of AS61000.3.100 at 253V. AS4777 is the Australian Standard that governs the parameters for the connection of energy systems through inverters to the grid. The upper controlled voltage limit for the inverters prescribed through this standard is 255V. When the grid voltage exceeds 255V, the IES inverter control system disconnects the IES from the grid. As Ergon Energy’s system is operated towards the upper limit of the AS61000.3.100 allowable voltage range (253V) it is expected that a large number of customers are being limited in their access to the grid to export generated energy. The shift to the extended voltage regulation bandwidth proposed by Ergon Energy will allow: • improved access to the grid to export IES generated energy by improving the grid’s ability to
absorb voltage rise associated with IES generation • extended equipment lifespans – the majority of customer equipment is designed to operate at the
lower voltage set point of 230V • reduced customer complaints associated with network access for IES generation and equipment
damage from sustained overvoltage. The ‘Power Quality Monitoring Strategy’ will guide distribution network augmentation capital investment, which is presented in the ’Forecast Expenditure Summary Corporation Initiated Augmentation 2015 to 2020’. Delivery of the device installations will assist the identification of voltage limit breaches and allow a prudent and efficient delivery of targeted augmentation works through the network augmentation capital expenditure. The forecast volumes for the installation of power quality monitors are measured in individual monitor units. Accordingly, the bottom-up unit costs are for individual units for these subprograms. The product estimate for the power quality monitor with Next G communications is based on costs incurred with monitors (similar to those proposed) installed under stage one of the strategy. These costs were recorded in Ellipse for the installation of 1,790 units, inclusive of travel, accommodation and direct overheads. The product estimate for the power quality monitor with satellite communications is built up from the Next G variant with inclusion of the additional procurement costs associated with the satellite

Forecast Expenditure Summary – Reliability and Quality of Supply 23
equipment. The cost increase for satellite equipment is built up from the actual cost of similar equipment being installed under the ACR program. The subprogram estimate is a product of the number of each unit defined within the strategy and the product cost estimate for each. The forecast volumes for the installation of power quality analysers are measured in individual analyser units. The bottom-up standard estimate is used for this subprogram. The standard estimate for the power quality analyser is built from the cost estimates provided through the expert knowledge of Ergon Energy subject matter experts and the costs associated with a similar project in the current regulatory control period. The subprogram estimate is a product of the number of each unit defined within the strategy and the product cost estimate for the power quality analyser.
Forecast Expenditure Summary – Reliability and Quality of Supply 24
6. Expenditure forecasts and outcomes for next period
6.1 Reliability
This sub-section details Ergon Energy’s Reliability capital expenditure forecasts and expected reliability performance outcomes for the next regulatory control period.
Proposed capital expenditure in reliability in the future regulatory control period is significantly lower than the corresponding amount in the past and current regulatory control periods. This is due to a significant focus on reliability investments in the current regulatory control period, which has and will when finalised, lead to a significant reduction in the average duration and frequency of interruptions across the network. Combined with the insights gained through our customer engagement program, we no longer believe further improvements of this scale are warranted. This is reflected in the significantly reduced level of capital expenditure in reliability in the regulatory control period 2015-20.
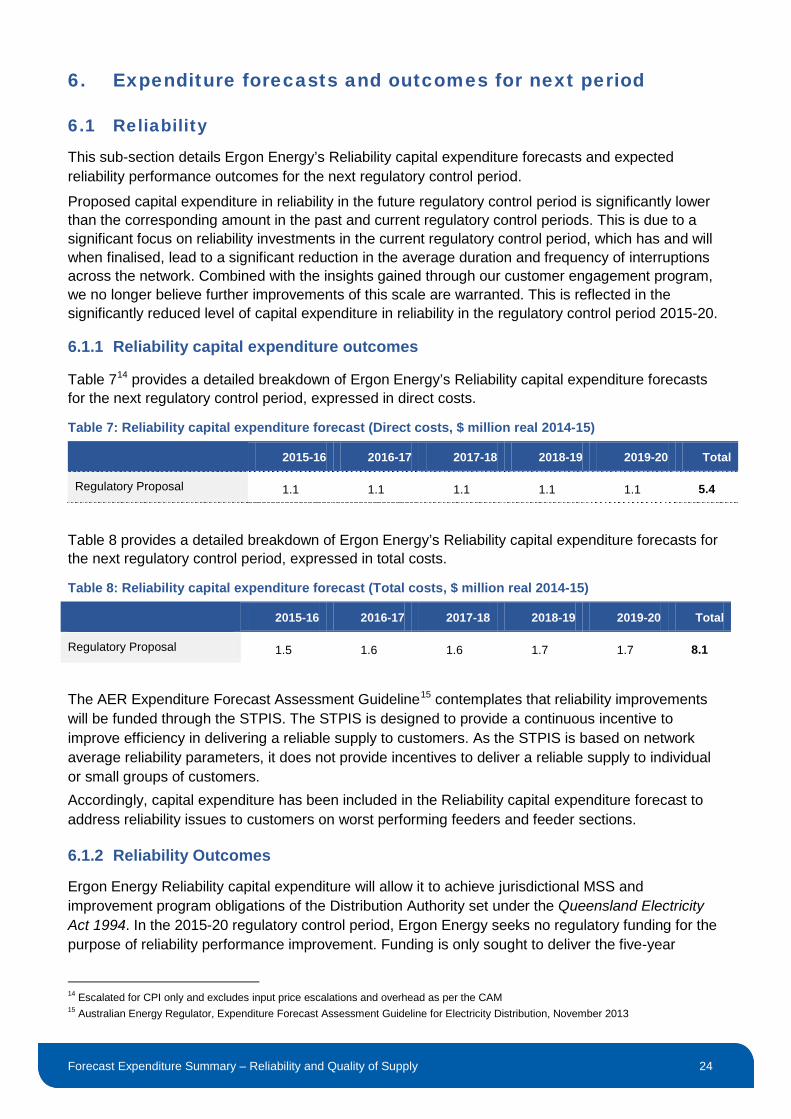
6.1.1 Reliability capital expenditure outcomes
Table 714 provides a detailed breakdown of Ergon Energy’s Reliability capital expenditure forecasts for the next regulatory control period, expressed in direct costs.
Table 7: Reliability capital expenditure forecast (Direct costs, $ million real 2014-15)
2015-16 2016-17 2017-18 2018-19 2019-20 Total
Regulatory Proposal 1.1 1.1 1.1 1.1 1.1 5.4
Table 8 provides a detailed breakdown of Ergon Energy’s Reliability capital expenditure forecasts for the next regulatory control period, expressed in total costs.
Table 8: Reliability capital expenditure forecast (Total costs, $ million real 2014-15)
2015-16 2016-17 2017-18 2018-19 2019-20 Total
Regulatory Proposal 1.5 1.6 1.6 1.7 1.7 8.1
The AER Expenditure Forecast Assessment Guideline15 contemplates that reliability improvements will be funded through the STPIS. The STPIS is designed to provide a continuous incentive to improve efficiency in delivering a reliable supply to customers. As the STPIS is based on network average reliability parameters, it does not provide incentives to deliver a reliable supply to individual or small groups of customers. Accordingly, capital expenditure has been included in the Reliability capital expenditure forecast to address reliability issues to customers on worst performing feeders and feeder sections.
6.1.2 Reliability Outcomes
Ergon Energy Reliability capital expenditure will allow it to achieve jurisdictional MSS and improvement program obligations of the Distribution Authority set under the Queensland Electricity Act 1994. In the 2015-20 regulatory control period, Ergon Energy seeks no regulatory funding for the purpose of reliability performance improvement. Funding is only sought to deliver the five-year
14 Escalated for CPI only and excludes input price escalations and overhead as per the CAM 15 Australian Energy Regulator, Expenditure Forecast Assessment Guideline for Electricity Distribution, November 2013

Forecast Expenditure Summary – Reliability and Quality of Supply 25
improvement program for the Worst Performing distribution feeders as it is prescribed within the Distribution Authority. The Worst Performing feeder Improvement Program is targeted to improve reliability performance outcomes for small pockets of customers and as such is considered to have negligible impact on the average performance indicators of the STPIS. The forecast therefore reflects Ergon Energy’s assessment of its underlying reliability performance against the service standards of the Distribution Authority. Beyond this, Ergon Energy will use future STPIS rewards to fund network investments to deliver network performance improvement projects where it is cost effective and efficient to do so.
Table 9: Reliability outcomes
Minimum Service Standards 2015-20
System Average Duration Index
Urban <149
Short Rural <424
Long Rural <964
System Average Frequency Index
Urban <1.98
Short Rural <3.95
Long Rural <7.40
6.2 Quality of Supply
This sub-section details Ergon Energy’s Quality of Supply capital expenditure forecasts and expected performance outcomes for the next regulatory control period.
6.2.1 Quality of Supply capital expenditure forecasts
Table 1016 provides a detailed breakdown of Ergon Energy’s Quality of Supply capital expenditure forecasts for the next regulatory control period, expressed in direct costs.
Table 10: Quality of Supply capital expenditure forecast (Direct costs, $ million real 2014-15)
2015-16 2016-17 2017-18 2018-19 2019-20 Total
Regulatory Proposal 1.3 1.3 1.3 1.3 1.3 6.3
Table 11 provides a detailed breakdown of Ergon Energy’s Quality of Supply capital expenditure forecasts for the next regulatory control period, expressed in total costs.
Table 11: Quality of Supply capital expenditure forecast (Total costs, $ million real 2014-15)
2015-16 2016-17 2017-18 2018-19 2019-20 Total
Regulatory Proposal 1.8 1.8 1.9 1.9 2.0 9.5
16 Escalated for CPI only and excludes input price escalations and overhead as per the CAM

Forecast Expenditure Summary – Reliability and Quality of Supply 26
Ergon Energy’s Quality of Supply capital expenditure for the next regulatory control period is based on continuing and completing existing in-progress device installations documented in its ‘Power Quality Monitoring Strategy’. The first stage of implementation resulted in power quality monitoring to cover 67% of Ergon Energy’s distribution network feeder sections. Delivering the second stage will result in coverage of all distribution feeder sections to allow recording and reporting of Momentary Average Interruption Frequency Index (MAIFI) data and improved service delivery efficiency in identifying and responding to evolving and existing power quality deviations. Ergon Energy considers providing 100% coverage of the distribution feeder sections will also provide reporting accuracy that achieves the 95% audit compliance requirements of the other reliability of supply indices under the MSS. During the next regulatory control period, Ergon Energy intends to install 1,120 power quality monitors across it three phase and SWER distribution feeders, and 100 power quality analysers at its zone substations to achieve the goals of the ‘Power Quality Monitoring Strategy’. Installation opportunities have been identified and prioritised according to the balance between the cost benefit analysis, and the most cost effective delivery model. The smoothed expenditure across the five years of the regulatory control period is aimed at providing a sustainable delivery model to achieve cost effective delivery. Spreading the delivery across the five year period allows a level resource plan that will minimise any volume-related price escalation and optimise resource allocations to avoid resource stranding.
Quality of Supply Outcomes
Ergon Energy aims to install increased monitoring of the Ergon Energy distribution network quality of supply parameters over the next regulatory control period in line with its ‘Power Quality Monitoring Strategy’. The delivery of this program will reduce the customer risk and exposure to quality of supply excursions by allowing Ergon Energy to proactively monitor and provide timely response to address conditions that present as quality of supply concerns for its customers. Active monitoring of the power system in this area will lead to reduced customer complaints and reduced damage to customer equipment resulting from sustained deviations from acceptable quality of supply thresholds. In addition, the increased population of power quality monitoring devices will improve Ergon Energy’s awareness related to capacity constraints of distribution feeders and monitoring of the emerging effects of increased photovoltaic (PV) penetrations. The additional granularity of real time and historical network performance data will lead to more prudent and effective investment decisions in network augmentation through improved network model accuracy and modelling outcomes. Delivering the Quality of Supply capital expenditure therefore aims to: • achieve quality of supply monitoring of all distribution feeders and feeder components • improve response time to identify and subsequently remediate sources of disturbances causing
quality of supply issues • achieve whole of network monitoring of momentary interruptions to identify and ultimately deliver
service quality improvement for Ergon Energy’s customers and to support any future regulatory reporting framework that includes MAIFI
• through the establishment of remote monitoring, provide the most cost effective means of collecting momentary interruption event data
• support the identification of emerging network capacity constraints to ensure optimal investment in distribution network augmentation
Forecast Expenditure Summary – Reliability and Quality of Supply 27
• proactively address quality of supply issues. Currently on feeder sections without or with limited quality of supply monitoring, Ergon Energy addresses quality of supply issues reactively in response to customer-based complaints.
7. Meeting Rules’ requirements This section draws on the material in the previous sections to explain and justify Ergon Energy’s forecast reliability and quality of supply capital expenditure against the capital expenditure objectives and criteria in clause 6.5.7 of the NER. It therefore outlines why the AER should approve this capital expenditure forecast as part of its distribution determination for Ergon Energy’s next regulatory control period.
7.1 The capital expenditure objectives
The NER sets out the objectives that Ergon Energy’s proposed capital expenditure must achieve for the next regulatory control period. Clause 6.5.7(a) states:
A building block proposal must include the total forecast capital expenditure for the relevant regulatory control period which the Distribution Network Service Provider considers is required in order to achieve each of the following (the capital expenditure objectives):
(1) meet or manage the expected demand for standard control services over that period; (2) comply with all applicable regulatory obligations or requirements associated with the provision of standard control services; (3) to the extent that there is no applicable regulatory obligation or requirement in relation to:
(i) the quality, reliability or security of supply of standard control services; or (ii) the reliability or security of the distribution system through the supply of standard control services, to the relevant extent: (iii) maintain the quality, reliability and security of supply of standard control services; and (iv) maintain the reliability and security of the distribution system through the supply of standard control services; and
(4) maintain the safety of the distribution system through the supply of standard control services.
Standard Control Services is the name given to those services that Ergon Energy provides by means of, or in connection with, its distribution system, and for which the costs incurred by Ergon Energy in doing so are generally recovered through distribution use of service tariffs paid by all, or most, customers. Standard Control Services are grouped into five categories: network services, connection services, metering services, ancillary network services and public lighting services The Standard Control Services that Ergon Energy provides to customers are set out in the ‘AER’s Framework and Approach – Ergon and Energex 2015-2020’.17 The proposed Reliability and Quality of Supply expenditure relates to network services. Ergon Energy believes that its proposed capital expenditure for Reliability and Quality of Supply in the next regulatory control period contributes to achieving the objectives of its total forecast capital expenditure as follows:
17 AER, Framework and Approach – Ergon and Energex 2015-2020, April 2014, p 51

Forecast Expenditure Summary – Reliability and Quality of Supply 28
• Meeting and managing expected demand for standard control services, as required by clause 6.5.7(a)(1), is one of the objective of Reliability and Quality of Supply capital expenditure, the nature of which is described in section 3 of this document. Ergon Energy’s proposed Reliability and Quality of Supply capital expenditure is largely necessary to comply with regulatory obligations in relation to existing standard control services, and to maintain the reliability and quality of those existing services. This is described by reference to sub clauses (2) and (3) below.
However, an ancillary objective of Ergon Energy’s proposed Quality of Supply expenditure is to improve the prudency and efficiency of future investment decisions in network augmentation. This is possible because the continued roll out of power quality monitoring devices will provide Ergon Energy with valuable information which enables Ergon Energy to better manage the expected demand for standard control services across the network in the future.
• The Reliability and Quality of Supply capital expenditure that Ergon Energy proposes is necessary to comply with all applicable regulatory obligations or requirements associated with the provision of standard control services, as required by clause 6.5.7(a)(2). As stated in Section 4.2, due to the improvement in reliability outcomes that Ergon Energy has achieved in the past and current regulatory control periods, current levels of reliability are expected to be maintained in the 2015-20 regulatory control period without the need to propose reliability improvement related expenditure. Expenditure to continue the Worst Performing Feeder program in the 2015-20 regulatory control period is a requirement of Ergon Energy’s Distribution Authority. Ergon Energy is also focused on improving reliability outcomes where it is prudent and efficient to do so and any such opportunities identified in the next period will be self-funded from STPIS revenue.
Expenditure is needed to continue the roll out of power quality monitoring devices in accordance with the Power Quality Monitoring Strategy. This will to identify deviations from statutory power quality limits (particularly voltage limits) and satisfy the 95% audit compliance requirements of the other reliability of supply indices under the MSS. Expenditure to address deviations identified is proposed in the ‘Forecast Expenditure Summary Corporation Initiated Augmentation 2015-2020’ document.
• Irrespective of the regulatory obligations described above, the Quality of Supply expenditure that Ergon Energy proposes is still necessary to maintain the quality of standard control services, and hence the reliability of the distribution system, as required by clause 6.5.7(a)(3). Proposed Quality of Supply expenditure is necessary to maintain quality to guard against excursions from power quality limits, which are largely caused by the uptake of solar photovoltaic systems. The continued roll out of power quality monitoring devices will enable Ergon Energy to proactively identify and propose solutions to power quality excursions to bring voltage and other power quality indicators to within statutory levels and hence maintain the quality of standard control services and the reliability of the distribution system.
• The Reliability and Quality of Supply expenditure that Ergon Energy proposes is not required to maintain the safety of the distribution system through the supply of standard control services, in accordance with clause 6.5.7(a)(4). Ergon Energy has obligations under the Electrical Safety Act 2002 (Qld) to ensure that its works are electrically safe and are operated in a way that is electrically safe. Under the Work Health and Safety Act 2011 (Qld), Ergon Energy must ensure, so far as is reasonably practicable, that the fixtures, fittings and plant are without risks to the health and safety of any person. Additionally, Ergon Energy is subject to enforceable orders issued by the Queensland Electrical Safety Office in response to identified safety risks. Ergon Energy proposed Reliability and Quality of Supply expenditure is not intended to meet these obligations.
Forecast Expenditure Summary – Reliability and Quality of Supply 29
7.2 The capital expenditure criteria
Clause 6.5.7(c) states: The AER must accept the forecast of required capital expenditure of a Distribution Network Service Provider that is included in a building block proposal if the AER is satisfied that the total of the forecast capital expenditure for the regulatory control period reasonably reflects each of the following (the capital expenditure criteria):
(1) the efficient costs of achieving the capital expenditure objectives; (2) the costs that a prudent operator would require to achieve the capital expenditure objectives; and (3) a realistic expectation of the demand forecast and cost inputs required to achieve the capital expenditure objectives.
Clause 6.5.7(e) goes on to state: In deciding whether or not the AER is satisfied as referred to in paragraph (c), the AER must have regard to the following (the capital expenditure factors): (1) – (3) [Deleted]
(4) the most recent annual benchmarking report that has been published under rule 6.27 and the benchmark capital expenditure that would be incurred by an efficient Distribution Network Service Provider over the relevant regulatory control period; (5) the actual and expected capital expenditure of the Distribution Network Service Provider during any preceding regulatory control periods; (5A) the extent to which the capital expenditure forecast includes expenditure to address the concerns of electricity consumers as identified by the Distribution Network Service Provider in the course of its engagement with electricity consumers; (6) the relative prices of operating and capital inputs; (7) the substitution possibilities between operating and capital expenditure; (8) whether the capital expenditure forecast is consistent with any incentive scheme or schemes that apply to the Distribution Network Service Provider under clauses 6.5.8A or 6.6.2 to 6.6.4; (9) the extent the capital expenditure forecast is referable to arrangements with a person other than the Distribution Network Service Provider that, in the opinion of the AER, do not reflect arm’s length terms; (9A) whether the capital expenditure forecast includes an amount relating to a project that should more appropriately be included as a contingent project under clause 6.6A.1(b); (10) the extent the Distribution Network Service Provider has considered, and made provision for, efficient and prudent non-network alternatives; and (11) any relevant final project assessment report (as defined in clause 5.10.2) published under clause 5.17.4(o), (p) or (s): (12) any other factor the AER considers relevant and which the AER has notified the Distribution Network Service Provider in writing, prior to the submission of its revised regulatory proposal under clause 6.10.3, is a capital expenditure factor.
Therefore, Ergon Energy must demonstrate that its proposed capital expenditure reasonably reflects the criteria in clause 6.5.7(c) by reference to the factors in clause 6.5.7(e).
Forecast Expenditure Summary – Reliability and Quality of Supply 30
7.2.2 How Ergon Energy’s capital expenditure reasonably reflects the criteria
The capital expenditure that Ergon Energy proposes to meet the objectives, in accordance with clause 6.5.7(a), reasonably reflects the criteria set out in clause 6.5.7(c) as follows.
The efficient and prudent costs of achieving the objectives
Ergon Energy has had regard for the AER’s interpretation of prudency and efficiency in assessing whether Ergon Energy’s capital expenditure reasonably reflects sub clauses (1) and (2) in this Summary. In the Explanatory Statement to the ‘AER Expenditure Forecast Assessment Guidelines’ the AER stated that:
“We consider that efficient costs complement the costs that a prudent operator would require to achieve the expenditure objectives. Prudent expenditure is that which reflects the best course of action, considering available alternatives. Efficient expenditure results in the lowest cost to consumers over the long term. That is, prudent and efficient expenditure reflects the lowest long term cost to consumers for the most appropriate investment or activity required to achieve the expenditure objectives.”18
As a distribution network service provider Ergon Energy has an obligation to operate within a statutory framework comprised of laws, regulations and other statutory instruments at both a federal and at a state level. The expenditure that Ergon Energy proposes for Reliability and Quality of Supply purposes is necessary to satisfy those obligations and therefore prudent. Reliability expenditure to continue the Worst Performing Feeder program is a requirement of Ergon Energy’s Distribution Authority. To this end, Ergon Energy has proposed three projects per region per year, totalling 45 projects over the 2015-20 regulatory control period, so that meaningful improvements can be achieved in each of the three areas of Ergon Energy’s network. Quality of Supply expenditure is necessary to satisfy the 95% audit compliance requirements of the other reliability of supply indices under the MSS. Additionally, Quality of Supply expenditure enables Ergon Energy to identify deviations from statutory power quality limits and propose works to ensure that all parts of the power system are being operated in accordance with its statutory requirements. Together these programs represent the actions of a prudent operator. To develop an efficient cost base Ergon Energy has adopted a robust methodology to estimate the unit costs of projects and programs of works, based on historic costs. These costs, and how they are developed, are described in the ‘Capital Expenditure Forecast Unit Cost Methodologies Summary 2015 to 2020’. For the Worst Performing Feeder program the costs that are used to forecast the capital expenditure are based on average actual costs of projects recently delivered under this program. As feeder performance will vary year to year so too does the expenditure required for each feeder as it depends on the issue being remedied. Ergon Energy believes using an average to be the most reasonable way of estimating the cost of similar projects in the future. For power quality monitoring devices Ergon Energy has developed unit costs based on the cost of procuring and installing devices that are similar to those recently installed under Stage 1 of the ‘Power Quality Monitoring Strategy 2012-2020’. The additional cost for power quality monitoring devices with satellite communications capability is based upon the actual cost of similar satellite equipment being installed under the ACR program. In both programs the estimation approach used results in an efficient cost base as the forecast unit costs are based upon the most recent and realistic cost of similar projects or devices delivered in the current regulatory control period.
18 Australian Energy Regulator, Expenditure Forecast Assessment Guideline for Electricity Distribution, November 2013, p 12.
Forecast Expenditure Summary – Reliability and Quality of Supply 31
Ergon Energy considers its capital expenditure to be prudent and efficient because not only are its unit costs efficient, Ergon Energy applies those efficient costs to the prudent actions it proposes to undertake so that its total Reliability and Quality of Supply expenditure is both prudent and efficient. Ergon Energy adopts a realistic expectation of the cost inputs required to achieve the objectives by developing unit costs that are based on a reasonable and robust estimation methodology. Unit costs are developed based on historical average costs of like-for-like projects (in the case of worst performing feeders) and historical costs of like-for-like devices (in the case of power quality monitoring devices) that Ergon Energy has delivered in the current regulatory control period. This methodology excludes inefficient costs when evident and includes only those costs to do the task in establishing direct costs. Mobilisation and contractor costs are assessed and applied on a per-program basis based on similar costs incurred by each program in the current period. For further details see the ‘Capital Expenditure Forecast Unit Cost Methodologies Summary 2015 to 2020’.
7.2.3 Having regard for the factors
Ergon Energy’s proposed capital expenditure reasonably reflects the prudent and efficient costs of achieving the objectives by having regard for the factors in clause 6.5.7(e) as follows: • In relation to sub clause (4), in September 2014 the AER decided to delay the release of its first
benchmarking report under clause 6.27 until late November 2014, one month after the submission of this Regulatory Proposal. As a result, Ergon Energy has not been able to use it to inform its capital expenditure forecasts. Nevertheless, using the same publicly available information that will be used to develop the AER’s benchmarking report19, Ergon Energy commissioned an independent report to enable it to compare its performance and other network service providers, having regard for the unique qualities of Ergon Energy’s network. This is prudent because Ergon Energy has quite unique cost drivers which should be considered when benchmarking performance. For further details refer to the ‘How Ergon Compares’ document.
• In relation to sub clause (5), Ergon Energy has set out, in Tables 1 and 2 of this Summary, its actual capital expenditure during the previous regulatory control period (2005-10) and actual and expected capital expenditure in the current regulatory control period (2010-15). To accompany this information, in Section 4, Ergon Energy has explained the actual and expected capital expenditure by reference to the allowance approved by the AER (and, for the 2005-10 regulatory control period, the QCA) and the endogenous and exogenous factors that have contributed to any variance from the AER’s allowance. Where its current period expenditure has deviated from the AER’s allowance, Ergon Energy has explained this by reference to drivers and circumstances that support the prudency and efficiency of the level of capital expenditure that was actually incurred. This demonstrates the robustness of Ergon Energy’s system of investment review controls, which ensures that Ergon Energy’s capital expenditure is continuously assessed for prudency and efficiency.
• In relation to sub clause (5A), Ergon Energy has conducted a comprehensive program of customer engagement to identify the concerns of its customers and ensure that its proposed capital expenditure addresses those concerns. The results of Ergon Energy’s engagement, and how they have informed its proposed capital expenditure, are set out in Section 3.1.1 of this Summary and in the document ‘Informing Our Plans, Our Engagement Program’. This process highlighted that Ergon Energy’s customers wish to maintain reliability performance at current levels to reduce upward pressures on retail electricity prices. This is reflected in the lower investment in reliability performance maintenance over the next regulatory control period
19 Australian Energy Regulator, Expenditure Forecast Assessment Guideline – Regulatory information notices for category analysis, http://www.aer.gov.au/node/21843, accessed 22 August 2014.

Forecast Expenditure Summary – Reliability and Quality of Supply 32
than occurred in the current regulatory control period. However as stated in Section 3.1 this is not expected to lead to adverse impacts on power system reliability in the next period that are sufficient to warrant higher investment in this regulatory submission. The process also demonstrated the community’s desire for Ergon Energy to operate the network in a way that supports greater customer choice and control in electricity supply solutions. A large part of this is to facilitate customers continued uptake of solar photovoltaic systems. Power quality monitoring devices are necessary to identify deviations from acceptable power quality limits (typically voltage) that can be caused by the increased penetration solar photovoltaic systems in the network. These deviations in turn prevent other customers from connecting solar photovoltaic systems until the power quality can be brought within acceptable levels. Additionally, poor power quality can damage customer equipment, and in particular sensitive electronic equipment. The continued roll out of power quality monitoring devices will enable Ergon Energy to resolve such issues in a proactive and timely manner, alleviate customer concerns and improve Ergon Energy’s ability to plan for and accommodate more solar photovoltaic systems and sensitive electronic equipment in the future.
• In relation to sub clauses (6) and (7), the nature of the proposed Reliability and Quality of Supply expenditure presents some opportunity to consider the relative prices and substitution possibilities of operating and capital expenditure. The Worst Performing Feeder program is intended to improve the performance of specific poor performing feeders. This will constrain any growth in forced maintenance expenditure that is needed to address the continuing deterioration of each feeder’s performance over time. Similarly, Quality of Supply expenditure is intended to minimise the amount of operating expenditure that Ergon Energy incurs reactively in response to power quality issues. Capital expenditure to implement power quality monitoring devices will provide Ergon Energy with comprehensive and timely information on network power quality. This information will enable Ergon Energy to manage future operating expenditure to address power quality issues in a more proactive and efficient manner. In both cases capital rather than operating expenditure has been determined the most prudent and cost effective means of addressing the identified need and meeting our customers’ expectations.
• In relation to sub clause (8), Ergon Energy notes that none of the schemes set out in clauses 6.5.8A or 6.6.2 to 6.6.4 of the Rules is applicable in the context of its proposed Reliability and Quality of Supply expenditure for the 2015-20 regulatory control period.
• In relation to sub clause (9), Ergon Energy has robust procurement governance processes in place to ensure that contractual arrangements at all times reflect arm’s length terms. These processes are described in detail in the ‘Network Deliverability Plan’. It is noted that Ergon Energy’s only subsidiary Sparq Solutions does not provide network services for Reliability and Quality of Supply that would constitute ‘direct’ costs and which would thus form part of the expenditure proposed in Sections 6.1 and 6.2.
• In relation to sub clause (10), clause 5.17.4 of the Rules is not applicable to Reliability and Quality of Supply capital expenditure.
• In relation to sub clause (11), Ergon Energy is required to develop a final project assessment report under 5.17.4(o), (p) or (s) as part of the Regulatory Investment Test for Distribution (RIT-D). The outcomes of such reports are not directly relevant to the expenditure Ergon Energy has proposed for Reliability and Quality of Supply and hence Ergon Energy has not had regard for them in developing this expenditure forecast. Nevertheless, Ergon Energy notes that no capital expenditure projects have been subjected to the RIT-D to date and as a result there are no relevant final project assessment reports for Ergon Energy to have regard to in proposing its Reliability and Quality of Supply expenditure for the 2015-20 period.

Forecast Expenditure Summary – Reliability and Quality of Supply 33
• In relation to sub clause (12), Ergon Energy has not been notified of any other factor that the AER considers relevant and that the AER has notified Ergon Energy is an additional capital expenditure factor.

Forecast Expenditure Summary – Reliability and Quality of Supply 34
8. Appendices
Appendix A. Sampled Feeder Improvement project costs
Investment Account Code
Investment Description J1 – Class J4 – Major Region
PoW Investment Type
Ellipse Actuals ITD
Project Status
492208 RPQ FN TL FIP MALA22 FIP Tie from 2MAL 5145006 to 2PEE 5143109
D-Reliability Improvement
Northern Specified Project
$271,465 Finalised
492238 RPQ FN TL FIP TARZ22 FIP Tie from 2TAR 2127513 to 2MAL 5166161
D-Reliability Improvement
Northern Specified Project
$110,485 Finalised
492246 RPQ FN TL FIP KATI22 FIP Tie from 2KAT 2147193 to 2CAR 21444468
D-Reliability Improvement
Northern Specified Project
$126,916 Finalised
492253 RPQ FN TL FIP PEER22 FIP Tie from 2PEE 6052044 to 2MAL 5088794
D-Reliability Improvement
Northern Specified Project
$402,833 Finalised
492260 RPQ FN TL FIP TUTO01 FIP Tie from 2TT1 5203633 to 2ELA E2.74
D-Reliability Improvement
Northern Specified Project
$7,369 Finalised
492269 RPQ FN TL FIP BILY22 FIP Tie from 2BIL 5017043 to 2BIL 5017335
D-Reliability Improvement
Northern Specified Project
$130,040 Finalised
492272 RPQ FN TL FIP BILY22 FIP Tie from 2BIL 5024681 to 2BIL 5017020
D-Reliability Improvement
Northern Specified Project
$207,234 Finalised
413360 RSW SW RA FIP ROMA Recl New Thorn Hill Replace AB18151 with NULEC on Thorn Hill Fdr
D-Reliability Improvement
Southern Specified Project
$81,822 Finalised
496230 FIP NQ BLUE-02 Reclosers Additional reclosers in feeders strategy
D-Reliability Improvement
Northern Specified Project
$267,108 Finalised
496255 FIP NQ BLUE-01 Reclosers Additional reclosers in feeders strategy
D-Reliability Improvement
Northern Specified Project
$227,448 Finalised
496219 FIP NQ DAGL-10 Recloser Additional reclosers in feeders strategy
D-Reliability Improvement
Northern Specified Project
$93,802 Finalised
496225 FIP NQ BOWE-10 Recloser Additional reclosers in feeders strategy
D-Reliability Improvement
Northern Specified Project
$93,484 Finalised
496235 FIP NQ BOWE-03 Recloser Additional reclosers in feeders strategy
D-Reliability Improvement
Northern Specified Project
$80,763 Finalised
496245 FIP NQ LUCI-02 Recloser Additional reclosers in feeders strategy
D-Reliability Improvement
Northern Specified Project
$95,584 Finalised
496404 FIP NQ CARI-01 Recloser Additional reclosers in feeders strategy
D-Reliability Improvement
Northern Specified Project
$50,323 Finalised
443629 FIP TV CF-02 New ACR Install 2 x ACR
D-Reliability Improvement
Northern Specified Project
$178,848 Finalised
443635 FIP BD GI-01 New ACR Install 1 x ACR & 1 x Sectionaliser
D-Reliability Improvement
Northern Specified Project
$194,180 Finalised
492198 RPQ FN TL FIP CARB22 FIP Tie from 2CAR 2145494 to 2CAR 2145286
D-Reliability Improvement
Northern Specified Project
$168,411 Finalised
500692 RFN FN CAI FIP LAPL22 UG New UG tie Gumburra Drive Redlynch Valley
D-Reliability Improvement
Northern Specified Project
$334,972 Finalised

Forecast Expenditure Summary – Reliability and Quality of Supply 35
Investment Account Code
Investment Description J1 – Class J4 – Major Region
PoW Investment Type
Ellipse Actuals ITD
Project Status
500736 RFN FN CAI FIP FOGA22 UG New UG Tie Idalia and Hardy Road Mount Sheridan
D-Reliability Improvement
Northern Specified Project
$168,943 Finalised
500747 RFN FN CAI FIP HARD22 UG New UG Tie Herald St Bentley Park
D-Reliability Improvement
Northern Specified Project
$272,488 Finalised
500773 RFN FN CAI FIP COOK No2 UG New Moore Road Trinity Beach
D-Reliability Improvement
Northern Specified Project
$41,222 Finalised
500755 RFN FN CAI FIP ELBE22 UG New UG Tie Deep Acres Drive Clifton Beach
D-Reliability Improvement
Northern Specified Project
$76,740 Finalised
492203 RPQ FN TL FIP PEER22 FIP Tie from 2PEE 5122819 to 2PEE 5142984
D-Reliability Improvement
Northern Specified Project
$94,507 Finalised
441021 CW - Isisford Feeder Improvement LR-210
D-Reliability Improvement
Central Specified Project
$133,514 Finalised
439055 CW - Tambo Feeder Improvement BK-206
D-Reliability Improvement
Central Specified Project
$346,892 Finalised
440970 RO Northern Line Feeder Improvement PD-203 Ogmore
D-Reliability Improvement
Central Specified Project
$348,375 Finalised
495093 MK Racecourse Feeder Improvement 312
D-Reliability Improvement
Central Specified Project
$360,718 Finalised
773341 RSW TO FIP PEAC St11 Switch New Gas Swit
D-Reliability Improvement
Southern Unspecified Project
$62,837 Finalised
427619 CH - Bingengang Rural Feeder Improvement
D-Reliability Improvement
Central Unspecified Project
$120,598 Finalised
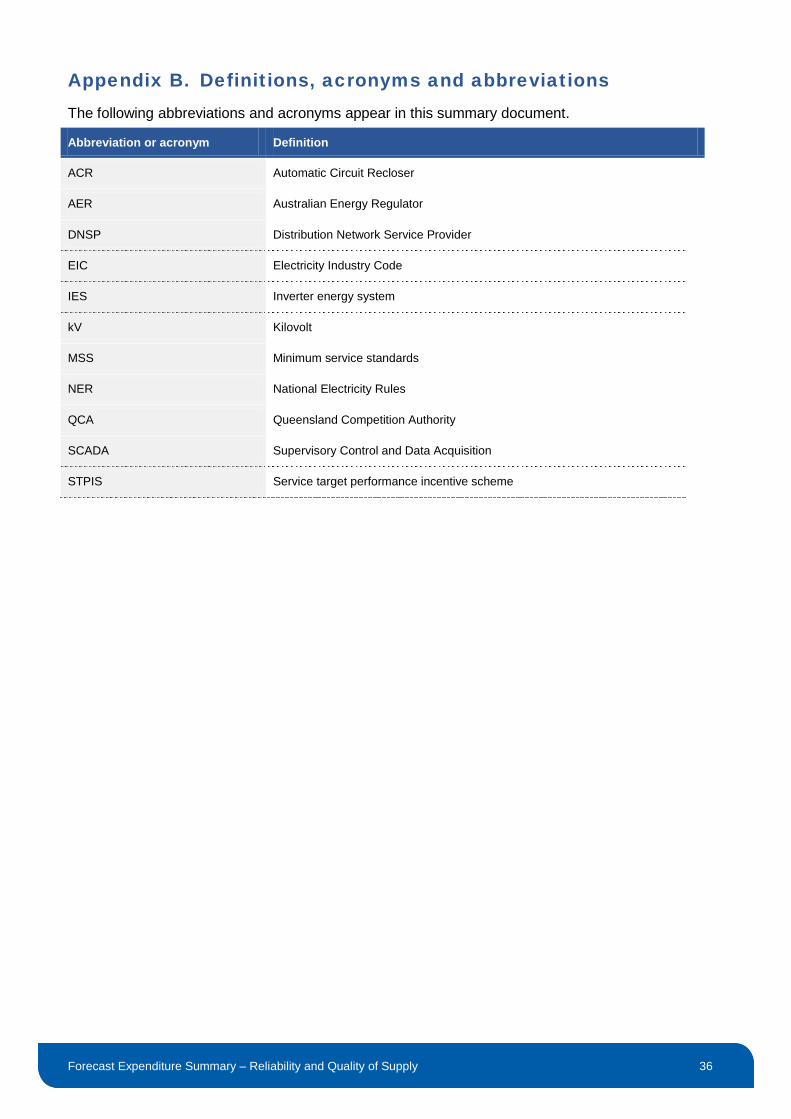
Forecast Expenditure Summary – Reliability and Quality of Supply 36
Appendix B. Definitions, acronyms and abbreviations The following abbreviations and acronyms appear in this summary document.
Abbreviation or acronym Definition
ACR Automatic Circuit Recloser
AER Australian Energy Regulator
DNSP Distribution Network Service Provider
EIC Electricity Industry Code
IES Inverter energy system
kV Kilovolt
MSS Minimum service standards
NER National Electricity Rules
QCA Queensland Competition Authority
SCADA Supervisory Control and Data Acquisition
STPIS Service target performance incentive scheme
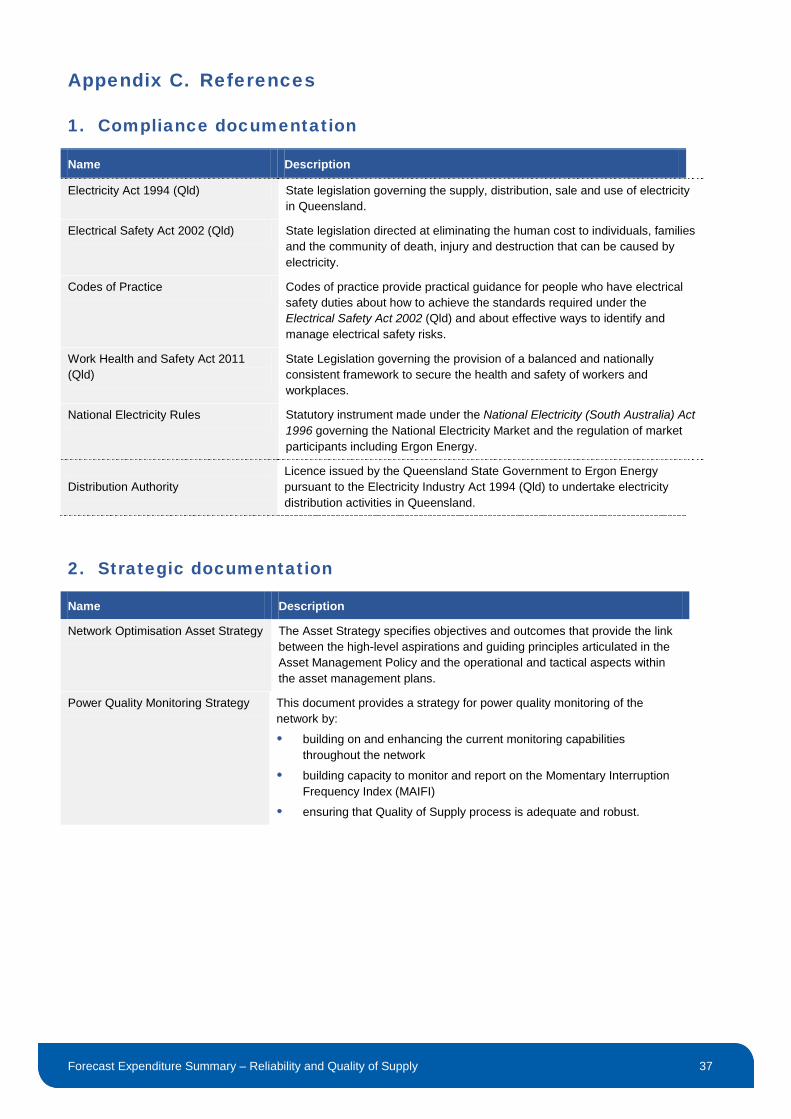
Forecast Expenditure Summary – Reliability and Quality of Supply 37
Appendix C. References
1. Compliance documentation
Name Description
Electricity Act 1994 (Qld) State legislation governing the supply, distribution, sale and use of electricity in Queensland.
Electrical Safety Act 2002 (Qld) State legislation directed at eliminating the human cost to individuals, families and the community of death, injury and destruction that can be caused by electricity.
Codes of Practice Codes of practice provide practical guidance for people who have electrical safety duties about how to achieve the standards required under the Electrical Safety Act 2002 (Qld) and about effective ways to identify and manage electrical safety risks.
Work Health and Safety Act 2011 (Qld)
State Legislation governing the provision of a balanced and nationally consistent framework to secure the health and safety of workers and workplaces.
National Electricity Rules Statutory instrument made under the National Electricity (South Australia) Act 1996 governing the National Electricity Market and the regulation of market participants including Ergon Energy.
Distribution Authority Licence issued by the Queensland State Government to Ergon Energy pursuant to the Electricity Industry Act 1994 (Qld) to undertake electricity distribution activities in Queensland.
2. Strategic documentation
Name Description
Network Optimisation Asset Strategy The Asset Strategy specifies objectives and outcomes that provide the link between the high-level aspirations and guiding principles articulated in the Asset Management Policy and the operational and tactical aspects within the asset management plans.
Power Quality Monitoring Strategy This document provides a strategy for power quality monitoring of the network by:
building on and enhancing the current monitoring capabilities throughout the network
building capacity to monitor and report on the Momentary Interruption Frequency Index (MAIFI)
ensuring that Quality of Supply process is adequate and robust.

Forecast Expenditure Summary – Reliability and Quality of Supply 38
3. Supporting documentation
Name Description
Worst Performing Feeders Engineering Report
This report provides the framework for the development and delivery of a strategic program of work to meet Ergon Energy’s Distribution Authority licence condition to report on and address poor performing feeders and feeder sections. Supporting business case:
• Network Reliability - Worst Performing Feeders
Forecast Expenditure Summary Corporation Initiated Augmentation 2015 to 2020
The purpose of this summary document is to explain and justify Ergon Energy’s Corporation Initiated Augmentation capital expenditure for the next regulatory control period, 1 July 2015 to 30 June 2020.
Capital Expenditure Forecast Unit Cost Methodologies Summary 2015 to 2020
The purpose of this summary document is to explain and justify the methodologies applied by Ergon Energy to develop unit cost estimates for its Standard Control Services (SCS) and Alternative Control Services (ACS) for the next regulatory control period, 1 July 2015 to 30 June 2020.
Security Criteria The purpose of this document is to define Ergon Energy’s Security of Supply/Network Planning Criteria. This criteria when combined with Minimum Service Standards (MSS) targets, will underpin prudent capital and operating costs to deliver the appropriate level of service to customers.
Informing Our Plans, Our Engagement Program
The document, Informing Our Plans, Our Engagement Program, details the engagement program and the customer insights used to inform our Regulatory Proposal. It supports the document, An Overview, Our Regulatory Proposal and the main Regulatory Proposal.
How Ergon Compares This document discusses benchmarking approaches across distribution networks and whether the cost to develop, operate and maintain the Ergon network can easily be compared and contrasted with the industry average and peers. The document provides an appreciation of the way that the design and operation of Ergon network has been shaped, over time, in direct response to both the needs of our customers and the challenges of our network area. Specifically, this documents seeks to highlight those significant drivers of cost that affect Ergon Energy more (or in a different way when compared to) other DNSPs.