relative effects of biotic and abiotic factors on the …...relative effects of biotic and abiotic...
TRANSCRIPT
www.elsevier.com/locate/apsoil
Applied Soil Ecology 29 (2005) 259–273
Relative effects of biotic and abiotic factors on the composition
of soil invertebrate communities in an Amazonian savanna
E. Franklin a,*, W.E. Magnusson b, F.J. Luizao b
a National Institute for Amazon Research (INPA), Department of Entomology (CPEN), CP 478, 69011-970 Manaus, AM, Brazilb Department of Ecology (CPEC), CP 478, 69011-970 Manaus, AM, Brazil
Received 13 July 2003; accepted 13 December 2004
Abstract
Using ordinations techniques, we investigated the effects of different types of plant cover on the relationship between soil
structure and invertebrate communities in an Amazonian savanna. Vegetation islands were chosen where four selected shrubs
species were present on sandy and clayey soils. For each sample under a selected shrub within the clump, another sample was
taken in the grass-tuft and extracted in Berlese-Tullgren. Classifying at higher taxonomic levels, we detected 27 zoological
categories. The mean number of individuals was generally higher on shrubs. Acari and Collembola were the dominant groups.
Non-Oribatid mites dominated in the savanna, in contrary with what occurs in most Amazonian ecosystems, where the
dominance of Oribatida is always higher than others Acari. The level of taxonomic resolution utilized was sufficient to show the
main differences of the spatial variation in community structure. We detected effects of soil type, vegetation structure and plant
specie identity on the composition of the communities. The mesofauna have a mosaic distribution in the savanna dependent on
the soil-food web structure of the vegetation. Shrubs and grass-tuft generate different ecosystems. Therefore, studies with better
taxonomic resolution will be necessary to assess the magnitude of the effect of biotic and abiotic factors.
# 2005 Elsevier B.V. All rights reserved.
Keywords: Amazonian savanna; Soil invertebrate; Habitat specificity; Edaphic factors; Vegetation structure
1. Introduction
In Amazonia, edaphic organisms such as inverte-
brates, roots, and microflora play an important, if not
predominant, role in soil structural organization, both
by forming and destroying aggregates and altering
* Corresponding author. Tel.: +55 92 6433196;
fax: +55 92 643 1838.
E-mail address: [email protected] (E. Franklin).
0929-1393/$ – see front matter # 2005 Elsevier B.V. All rights reserved
doi:10.1016/j.apsoil.2004.12.004
their assemblage in the profile (Barros et al., 2004). It
is to be expected that soils of different structure and
vegetational cover will harbor different communities
of soil invertebrates (Abbott et al., 1979; Majer, 1989).
However, it is time consuming and expensive to
identify these invertebrates to specie level. The
proportion of ‘morphospecies’ that cannot be assigned
to named species and the number of ‘scientist-hours’
required to process samples both increase dramatically
for smaller-bodied taxa (Lawton et al., 1998), that
.

E. Franklin et al. / Applied Soil Ecology 29 (2005) 259–273260
compose the majority of the soil mesofauna groups. In
a complex and poorly studied region, such as
Amazonia, even groups that are widely used in
environmental studies (e.g. Oligochaeta, ants and
termites) are far from being taxonomically well
known.
The concept of taxonomic sufficiency (TS; Ellis,
1985), involves the identification of organisms only to
a level of taxonomic resolution sufficient to satisfy the
objective of a study (Pik et al., 1999; Terlizzi et al.,
2003). Unfortunately, taxonomic sufficiency for
detecting habitat-related changes in invertebrate
communities in Amazonia is unknown. Most studies
have used classification at the level of class, order or
family (e.g.: Adis et al., 1987; Adis, 1988; Oliveira
and Franklin, 1993; Vohland and Schroth, 1999;
Franklin et al., 2001). Within pure taxonomic levels,
zoological components can be separated according to
stage of development (adult/immature) or the main
feeding habit of the individuals (Moore et al., 1988). In
Amazonian ecosystems, several studies have used
functional zoological groups (e.g. Franklin et al.,
2001; Hofer et al., 2001; Barros et al., 2002, 2004) to
investigate factors affecting the distribution of soil
invertebrates. In Western Amazonia, there is evidence
that soil macrofauna classified at higher taxonomic
level, and using principal components analysis, can
show effects of land-use (Barros et al., 2002).
We used the natural variation in soil and plant cover
in an Amazonian savanna to investigate the effects of
different types of plant cover on the relationship
between mineral soil structure and invertebrate
community composition. We also investigated
whether soil invertebrates at the savanna show
consistent pattern in distribution when analyzed at
high levels of taxonomic sufficiency. The Amazonian-
type savannas (Huber, 1982) of northern Brazil have
low floristic diversity (Miranda, 1993, 1995) and most
of them are burned frequently at the end of the dry
season (September–October). This affects the floristic
diversity and composition of the ecosystem, because
grasses and shrubs form functional groups that differ
in their responses to external factors such as fire
(Ginoux et al., 1996; Jeltsch et al., 1998). These
groups also differ in their effects on soil structures,
principally because of differences in inputs of organic
matter. Soil percent material may also affect vegeta-
tion structure. Sandy and clayey soils differ sharply in
structure, water relationship and nutrient retention and
availability (Brady, 1989). Two types of soil occur
within the savanna at Alter do Chao. The most
common is a loose sandy soil, with yellowish surface
that becomes darker with depth. However, nearby a
less sandy and darker soil can be found a more clayey
and compact soil. However, the vegetation cover is
broadly similar and many shrub species occur on both
types of soil. It is not clear to what extent the
vegetation cover can modify the effects of the mineral
fraction of the soil on invertebrate communities.
We initially investigate the effects of vegetation
type (shrubs or grass-tuft) and soil type (clayey and
sandy) on the structure of the invertebrate community.
We then test for differences among species of shrubs
for their effects on mesofauna communities under the
shrubs and in the surrounding grass-tuft matrix. For
biological reasons, and consideration of previous
studies, it is unlikely that any of the hypotheses we
present here are false. That is, soil type, vegetation
structure, and vegetation species composition almost
certainly affect the invertebrate community to some
extent. However, the relative magnitude of these
effects is unclear and it is not known to what extent the
biotic factors can compensate for variation in mineral
soil structure. Management of savanna areas usually
implies management of vegetation structure and
composition, but it is unclear whether management
practices designed to maintain the conservation value
of the vegetation would be of equal benefit to the
invertebrate community (Sanderson et al., 1995). If the
taxonomic resolution used in most studies in
Amazonia is not sufficient to detect natural variation
in soil invertebrate’s communities, it is unlikely to be
adequate to detect subtle effects caused by human
interventions.
We used ordination techniques to locate zoological
categories in multivariate space based on similarities in
their occupation of sites. If organisms in different
categories do not differ in spatial distribution, they will
be poor indicators of spatial variation in community
structure. We identified the invertebrates in taxonomi-
cal levels of class, sub-class, order, sub-order or family,
and then in zoological categories, according to their
main feeding habit and/or stage of development. We
divided the zoological categories in two groups: all-
invertebrate community and non-mite, non-collembo-
lan invertebrate community. We hypothesized that: (1)

E. Franklin et al. / Applied Soil Ecology 29 (2005) 259–273 261
the soil type affects the mesofauna communities; (2) the
mesofauna communities under shrubs are different
from those under grass-tuft; (3) the species of the shrub
affects the invertebrate communities, and this effect
could override differences due to mineral soil; (4)
taxonomic resolution in higher zoological categories is
sufficient to detect changes in soil invertebrates due to
natural variation in soil and vegetation structure.
2. Methods
The study was carried out in two savanna sites,
separated from each other by 1 km, one with sandy
soil and the other with clayey soil, situated on the right
margin of the Tapajos river, near the village of Alter do
Chao (28310S and 558000W), in the state of Para. The
climate is Ami (tropical wet) in the Koppen
classification, with a well-defined dry season, mean
annual rainfall of 1950 mm, with 75% of the rain
falling between December and June. The dry season
extends from June to December. The mean annual
temperature is 27.7 8C and the mean monthly
temperature varies less than 1.5 8C from the annual
mean (Miranda, 1993).
The vegetation in the areas surveyed is dominated
by an herbaceous stratum composed principally of the
tufts forming grasses Paspalum carinatum and
Trachypogon plumosus, interspersed with patches of
trees and shrubs. Regular semi-annual burning can
drastically reduce the area covered by the common
shrub species of the genera Miconia and Myrcia, and
the area made available by the loss of the shrubs may
be occupied mainly by the grass P. carinatum
(Sanaiotti and Magnusson, 1995). The stature of trees
is short, and many have tortuous trunks, thick cortex
and leathery leaves. Trees do not form a continuous
canopy and, in the area we studied, the vegetation is
grouped into well-defined clumps, consisting of trees,
shrubs or herbs. Tracts of grass, dominated by P.
carinatum mixed with sedges and other herbaceous
plants, occur between clumps of shrubs (Miranda,
1993).
Soil characteristics differed sharply under shrubs
and grass tufts in the clayey but not in the loose sandy
soil. Under clayey soil, the clay content under shrubs
(17.7 � 2.1, n = 3) was higher than under grass-tuft
(5.9 � 1.4, n = 5). A higher C concentration was
detected under shrubs (2.5 � 0.2, n = 3) in relation to
grass-tuft (1.6 � 0.7, n = 5). These difference were
significant at 5% two sample t-test ( p = 0.003 and
p = 0.042, respectively). Under loose sandy soil, the
clay percentage under shrubs (6.2 � 1.7, n = 4) did not
differ from the value obtained under grass-tuft
(4.3 � 1.2, n = 4). No difference was detected
comparing the value for C concentration (1.9 � 0.6,
n = 4 under shrubs; 1.8 � 0.4, n = 4 under grass-tuft).
The samples were taken between 28 and 30 August
1996, during the dry season. At each savanna site, on
sandy and clayey soils, we chose those vegetation
islands where four shrubs species [Myrcia sylvatica
(Meyer) DC, Miconia albicans (Sw.) Triana, Manihot
caerulenscens Pohl subsp. Paraensis (Mueller von
Argau) Rogers & App and Chomelia ribesioides
Benth. Ex M. Arg.] were present. Twelve shrubs on
each soil type were sampled, giving three repetitions
for each shrub species on each soil, totalizing 24
samples under shrubs. For each sample under a
selected shrub within the clump, another sample was
taken outside the clump, in the grass-tuft matrix,
totalizing 24 samples under grass-tuft. Samples were
taken using a 49 cm2 metal corer, introduced to a
depth of 5 cm into the soil. The sampled area covered
at each shrub and each grass-tuft was 0.0025 m2.
In the same day as collection, the samples were
prepared for extraction with Berlese-Tullgren extrac-
tor, in a local laboratory. We used 1% formaldehyde
solution as a collector liquid. The samples were
extracted during 6–7 days, during which time the
temperature of the extractor was raised slowly from 28
to 45 8C.
We identified the invertebrates in taxonomic levels
of class, sub-class, order, sub-order or family. Our
method was not efficient at catching Nematoda,
Enchytraeidae (microfauna) and invertebrates larger
than 2 mm (macrofauna), and these were not included
in analyses. Within taxonomic levels, we classified the
individuals in zoological groups, according to their
main feeding habit and/or stage of development (adult/
immature). Acari was separated into zoological
groups of Oribatida (80–85% detritivorous species),
and Acari Non-Oribatida, the majority being pre-
dators. Diptera, Coleoptera, Homoptera, Hemiptera
and Thysanoptera were separated into adults and
immatures, because of the great differences in feeding
habits. Hymenoptera were separated into ants and

E. Franklin et al. / Applied Soil Ecology 29 (2005) 259–273262
other groups. Twenty-seven faunal community vari-
ables (zoological categories) were found.
We used ordination to summarize the major pattern
in the data. Ordinations were undertaken in the non-
metric hybrid multidimensional scaling (SSH-MDS)
module of the PATN Program (Belbin, 1992). The
apriori decision was made to use two dimensions
(SSH1 and SSH2), to capture the major gradients.
Minor patterns may exist in other dimensions, but they
are difficult to interpret (Gauch, 1982), and we did not
have sufficient repetitions to justify such analysis.
The ordinations were undertaken for quantitative and
for qualitative (presence/absence) data. The quantitative
data were transformed by dividing taxonomic groups by
the sum of squares to balance the contribution of rare
and common taxa. Data in sites were divided by site
totals to give the same weight to each site. We made the
ordinations for two groupings: all-invertebrate commu-
nity and, the non-mite, non-collembolan invertebrate
community. The ordinations based on qualitative data
(presence/absence) give more weight to uncommon
species, as common species tended to occur in most
sites, and therefore contributed little to qualitative
differences among sites. The Bray Curtis Association
Index was used to indicate the dissimilarity between the
samples. When used on presence/absence data, this
association is called the Sorensen index. Ordination
with MDS and the Bray Curtis distance is generally
effective at detecting ecological gradients (Kenckel and
Orloci, 1986; Minchin, 1987). The MDS axes are linear
and approximately orthogonal and therefore conform to
the principal assumptions of multivariate analysis of
variance (Anderson and Legendre, 1999).
A measure of ‘stress’ and r2 statistic was calculated.
Stress is a mismatch between the rank order of distances
in the data, and the rank order of distances in the
ordination (the higher the value, closer are the implied
ultrametric-distances from the dendrogram to the input
association measure). The r2 statistic is descriptive of
the proportion of the variance in the original distances
captured by the ordination and is generally comparable
among analyses, though it may slightly underestimate
the effectiveness of the MDS, which does not require a
linear relationship between the input and output
distances.
Ordinations summarize the major pattern in the
data and may not capture patterns in subgroups well.
Therefore, we conducted ordinations of sites for
samples under shrubs and grasses together, and then
separately to investigate the effects of shrub type. We
used MANOVA to test for the effects of (1) soil type
(clayey or sandy), (2) structure of the vegetation (the
environment under shrubs clumps, or under grass-tuft)
and (3) shrub species (M. sylvatica, M. albicans, M.
caerulescens and C. ribesioides). It is probable that
any change will have some effect on some invertebrate
species. We investigated only the effects of the
independent variables on the major patterns of the
community, that is, those captured by the two
dimensions of the ordination.
3. Results
3.1. The invertebrate fauna of the savannas
Twenty-seven zoological categories were detected
in both savannas. Chilopoda, adults Homoptera, and
Phalangida were not found in the savanna on clayey
soil. Immatures and adults Diptera, immatures
Lepidoptera, Pauropoda, Symphyla, and immatures
Thysanoptera were not found in the savanna on sandy
soil. The mean number of individuals was generally
higher on shrubs (28.3–240.3 individuals) than on
grass-tufts (9.0–106.3 individuals).
The highest invertebrate density was detected
under M. sylvatica shrubs, caused by the high density
of Acari Oribatida, resulting from a great dominance
of Rostrozetes foveolatus Sellnick, 1925, in both soil
types. Acari Oribatida, Acari Non-Oribatida and
Collembola were dominant in all of the sites sampled,
representing more than 60% in relation to the total
invertebrate fauna. In the savanna, greatest dominance
of Acari Non-Oribatida was characteristic of the grass
cover and of the schrubs, with exception of C.
ribesioides on the clayey and sandy soil, and M.
silvatica on sandy soil. Collembola was more
dominant in the savanna on clayey soil
(Appendix A; Table 1). For simple comparison, the
results for a primary forest were included in Table 1.
3.2. All-invertebrate community—soil, shrub species
and vegetation structure
Multivariate multiple regression for quantitative
data indicated no statistically significant effect of soil
E. Franklin et al. / Applied Soil Ecology 29 (2005) 259–273 263
Table 1
Relative dominance of Acari Oribatida, Acari Non-Oribatida, Collembola, and non-mite, non-collembolan invertebrates in relation to the total
catch in the soil and litter layers of a primary forest and Amazonian-type savanna areas of Alter do Chao. Para. Brazil
Acari Collembola Non-mite, non-collembolan
invertebratesOribatida Non-Oribatida
Primary forest (clayey soil) 58 20 2.4 19.6
Savanna (clayey soil)
M. sylvatica S 26 63 3 8
G 27 61 0.3 11.7
M. albicans S 27 43 9 21
G 35 53 0 12
M. caerulenscens S 30 49 3 18
G 32 55 0.5 12.5
C. ribesioides S 45 44 1 10
G 14 82 0 4
Savanna (sandy soil)
M. sylvatica S 55 14 16 15
G 23 33 6 38
M. albicans S 30 51 10 9
G 17 59 0 24
M. caerulenscens S 29 34 15 22
G 17 69 2 12
C. ribesioides S 44 35 10 11
G 18 65 5 12
S = shrub; G = grass-tuft.
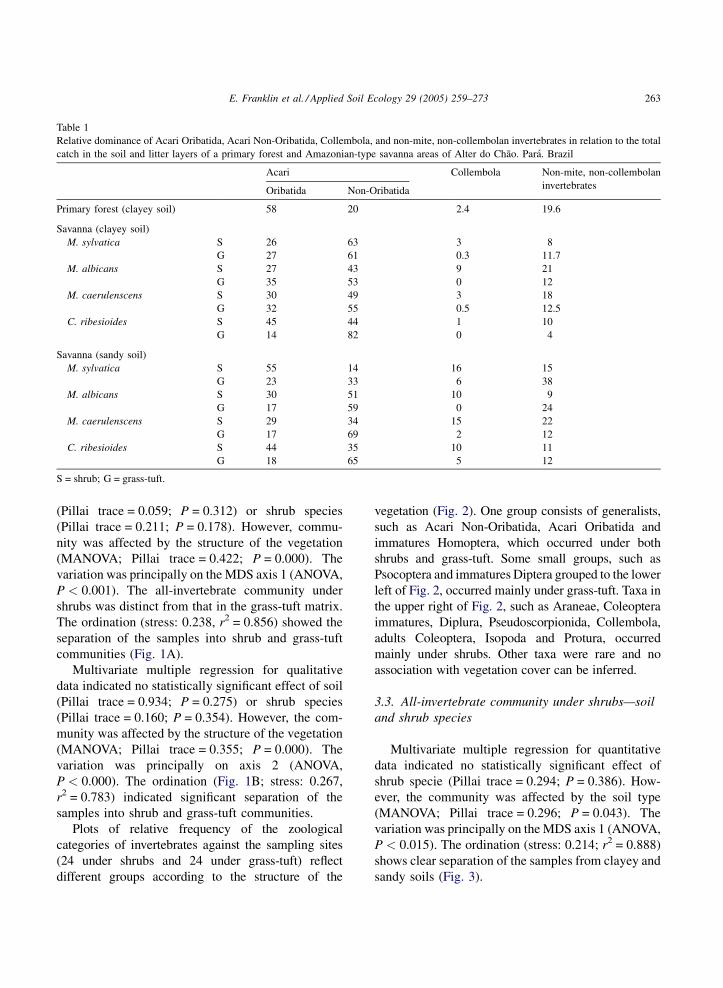
(Pillai trace = 0.059; P = 0.312) or shrub species
(Pillai trace = 0.211; P = 0.178). However, commu-
nity was affected by the structure of the vegetation
(MANOVA; Pillai trace = 0.422; P = 0.000). The
variation was principally on the MDS axis 1 (ANOVA,
P < 0.001). The all-invertebrate community under
shrubs was distinct from that in the grass-tuft matrix.
The ordination (stress: 0.238, r2 = 0.856) showed the
separation of the samples into shrub and grass-tuft
communities (Fig. 1A).
Multivariate multiple regression for qualitative
data indicated no statistically significant effect of soil
(Pillai trace = 0.934; P = 0.275) or shrub species
(Pillai trace = 0.160; P = 0.354). However, the com-
munity was affected by the structure of the vegetation
(MANOVA; Pillai trace = 0.355; P = 0.000). The
variation was principally on axis 2 (ANOVA,
P < 0.000). The ordination (Fig. 1B; stress: 0.267,
r2 = 0.783) indicated significant separation of the
samples into shrub and grass-tuft communities.
Plots of relative frequency of the zoological
categories of invertebrates against the sampling sites
(24 under shrubs and 24 under grass-tuft) reflect
different groups according to the structure of the
vegetation (Fig. 2). One group consists of generalists,
such as Acari Non-Oribatida, Acari Oribatida and
immatures Homoptera, which occurred under both
shrubs and grass-tuft. Some small groups, such as
Psocoptera and immatures Diptera grouped to the lower
left of Fig. 2, occurred mainly under grass-tuft. Taxa in
the upper right of Fig. 2, such as Araneae, Coleoptera
immatures, Diplura, Pseudoscorpionida, Collembola,
adults Coleoptera, Isopoda and Protura, occurred
mainly under shrubs. Other taxa were rare and no
association with vegetation cover can be inferred.
3.3. All-invertebrate community under shrubs—soil
and shrub species
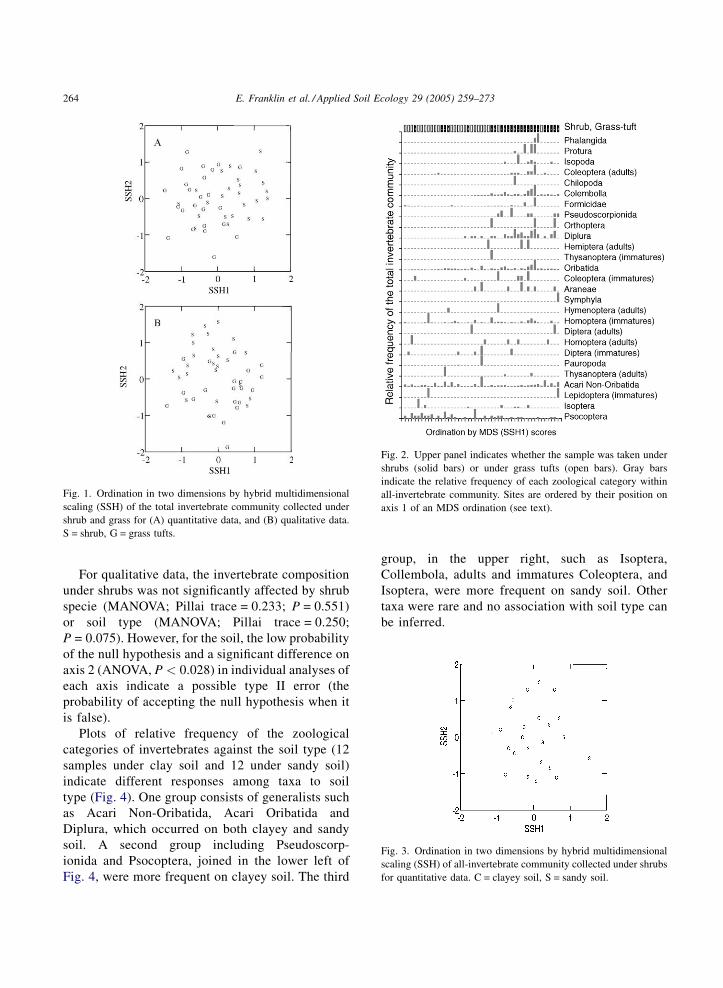
Multivariate multiple regression for quantitative
data indicated no statistically significant effect of
shrub specie (Pillai trace = 0.294; P = 0.386). How-
ever, the community was affected by the soil type
(MANOVA; Pillai trace = 0.296; P = 0.043). The
variation was principally on the MDS axis 1 (ANOVA,
P < 0.015). The ordination (stress: 0.214; r2 = 0.888)
shows clear separation of the samples from clayey and
sandy soils (Fig. 3).
E. Franklin et al. / Applied Soil Ecology 29 (2005) 259–273264
Fig. 1. Ordination in two dimensions by hybrid multidimensional
scaling (SSH) of the total invertebrate community collected under
shrub and grass for (A) quantitative data, and (B) qualitative data.
S = shrub, G = grass tufts.
Fig. 2. Upper panel indicates whether the sample was taken unde
shrubs (solid bars) or under grass tufts (open bars). Gray bars
indicate the relative frequency of each zoological category within
all-invertebrate community. Sites are ordered by their position on
axis 1 of an MDS ordination (see text).
Fig. 3. Ordination in two dimensions by hybrid multidimensional
scaling (SSH) of all-invertebrate community collected under shrubs
for quantitative data. C = clayey soil, S = sandy soil.
For qualitative data, the invertebrate composition
under shrubs was not significantly affected by shrub
specie (MANOVA; Pillai trace = 0.233; P = 0.551)
or soil type (MANOVA; Pillai trace = 0.250;
P = 0.075). However, for the soil, the low probability
of the null hypothesis and a significant difference on
axis 2 (ANOVA, P < 0.028) in individual analyses of
each axis indicate a possible type II error (the
probability of accepting the null hypothesis when it
is false).
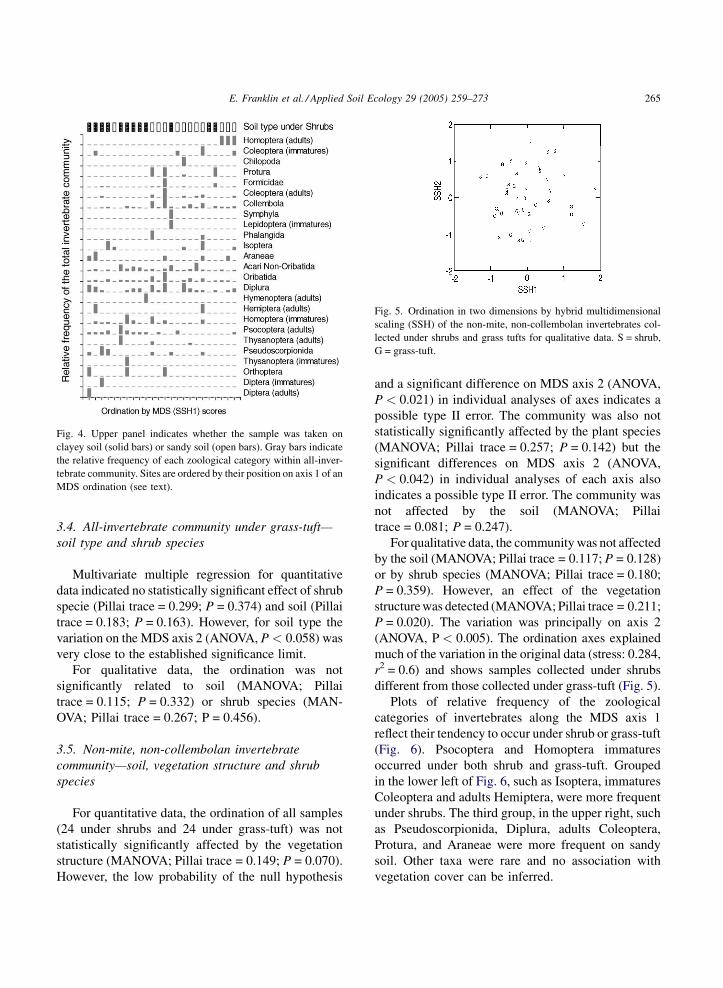
Plots of relative frequency of the zoological
categories of invertebrates against the soil type (12
samples under clay soil and 12 under sandy soil)
indicate different responses among taxa to soil
type (Fig. 4). One group consists of generalists such
as Acari Non-Oribatida, Acari Oribatida and
Diplura, which occurred on both clayey and sandy
soil. A second group including Pseudoscorp-
ionida and Psocoptera, joined in the lower left of
Fig. 4, were more frequent on clayey soil. The third
r
group, in the upper right, such as Isoptera,
Collembola, adults and immatures Coleoptera, and
Isoptera, were more frequent on sandy soil. Other
taxa were rare and no association with soil type can
be inferred.
E. Franklin et al. / Applied Soil Ecology 29 (2005) 259–273 265
Fig. 4. Upper panel indicates whether the sample was taken on
clayey soil (solid bars) or sandy soil (open bars). Gray bars indicate
the relative frequency of each zoological category within all-inver-
tebrate community. Sites are ordered by their position on axis 1 of an
MDS ordination (see text).
Fig. 5. Ordination in two dimensions by hybrid multidimensional
scaling (SSH) of the non-mite, non-collembolan invertebrates col-
lected under shrubs and grass tufts for qualitative data. S = shrub,
G = grass-tuft.
3.4. All-invertebrate community under grass-tuft—
soil type and shrub species
Multivariate multiple regression for quantitative
data indicated no statistically significant effect of shrub
specie (Pillai trace = 0.299; P = 0.374) and soil (Pillai
trace = 0.183; P = 0.163). However, for soil type the
variation on the MDS axis 2 (ANOVA, P < 0.058) was
very close to the established significance limit.
For qualitative data, the ordination was not
significantly related to soil (MANOVA; Pillai
trace = 0.115; P = 0.332) or shrub species (MAN-
OVA; Pillai trace = 0.267; P = 0.456).
3.5. Non-mite, non-collembolan invertebrate
community—soil, vegetation structure and shrub
species
For quantitative data, the ordination of all samples
(24 under shrubs and 24 under grass-tuft) was not
statistically significantly affected by the vegetation
structure (MANOVA; Pillai trace = 0.149; P = 0.070).
However, the low probability of the null hypothesis
and a significant difference on MDS axis 2 (ANOVA,
P < 0.021) in individual analyses of axes indicates a
possible type II error. The community was also not
statistically significantly affected by the plant species
(MANOVA; Pillai trace = 0.257; P = 0.142) but the
significant differences on MDS axis 2 (ANOVA,
P < 0.042) in individual analyses of each axis also
indicates a possible type II error. The community was
not affected by the soil (MANOVA; Pillai
trace = 0.081; P = 0.247).
For qualitative data, the community was not affected
by the soil (MANOVA; Pillai trace = 0.117; P = 0.128)
or by shrub species (MANOVA; Pillai trace = 0.180;
P = 0.359). However, an effect of the vegetation
structure was detected (MANOVA; Pillai trace = 0.211;
P = 0.020). The variation was principally on axis 2
(ANOVA, P < 0.005). The ordination axes explained
much of the variation in the original data (stress: 0.284,
r2 = 0.6) and shows samples collected under shrubs
different from those collected under grass-tuft (Fig. 5).
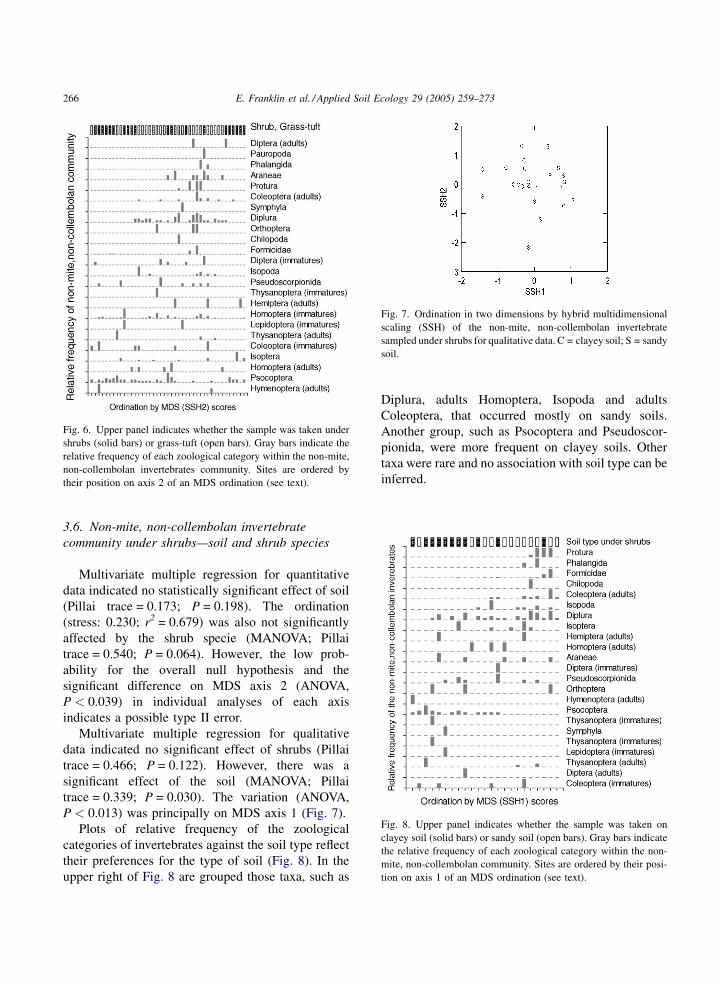
Plots of relative frequency of the zoological
categories of invertebrates along the MDS axis 1
reflect their tendency to occur under shrub or grass-tuft
(Fig. 6). Psocoptera and Homoptera immatures
occurred under both shrub and grass-tuft. Grouped
in the lower left of Fig. 6, such as Isoptera, immatures
Coleoptera and adults Hemiptera, were more frequent
under shrubs. The third group, in the upper right, such
as Pseudoscorpionida, Diplura, adults Coleoptera,
Protura, and Araneae were more frequent on sandy
soil. Other taxa were rare and no association with
vegetation cover can be inferred.
E. Franklin et al. / Applied Soil Ecology 29 (2005) 259–273266
Fig. 6. Upper panel indicates whether the sample was taken under
shrubs (solid bars) or grass-tuft (open bars). Gray bars indicate the
relative frequency of each zoological category within the non-mite,
non-collembolan invertebrates community. Sites are ordered by
their position on axis 2 of an MDS ordination (see text).
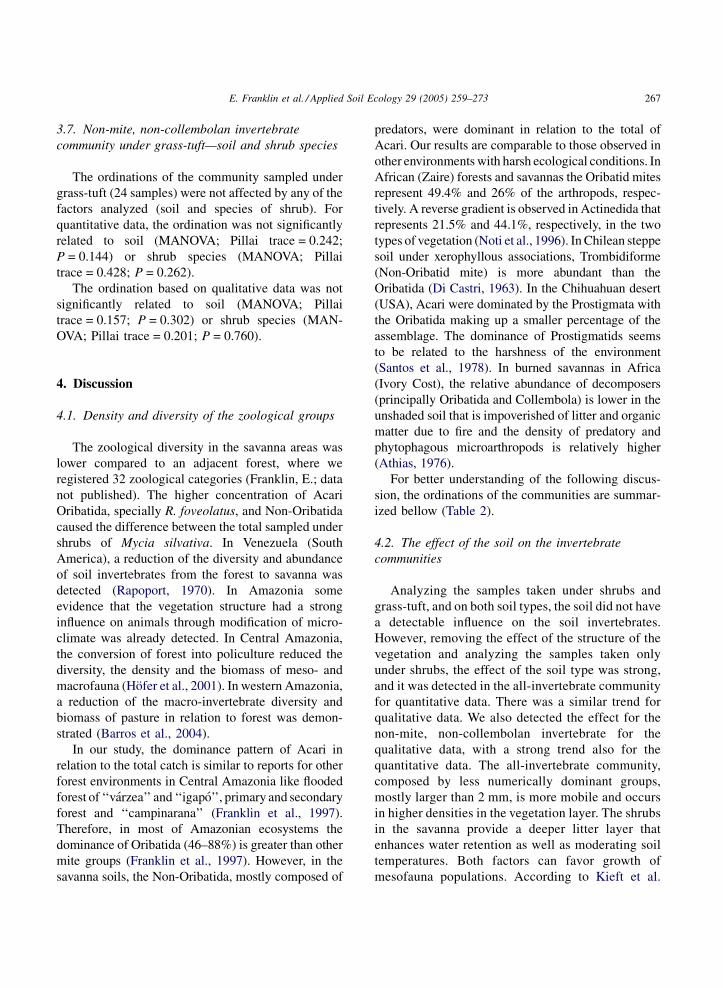
Fig. 7. Ordination in two dimensions by hybrid multidimensional
scaling (SSH) of the non-mite, non-collembolan invertebrate
sampled under shrubs for qualitative data. C = clayey soil; S = sandy
soil.
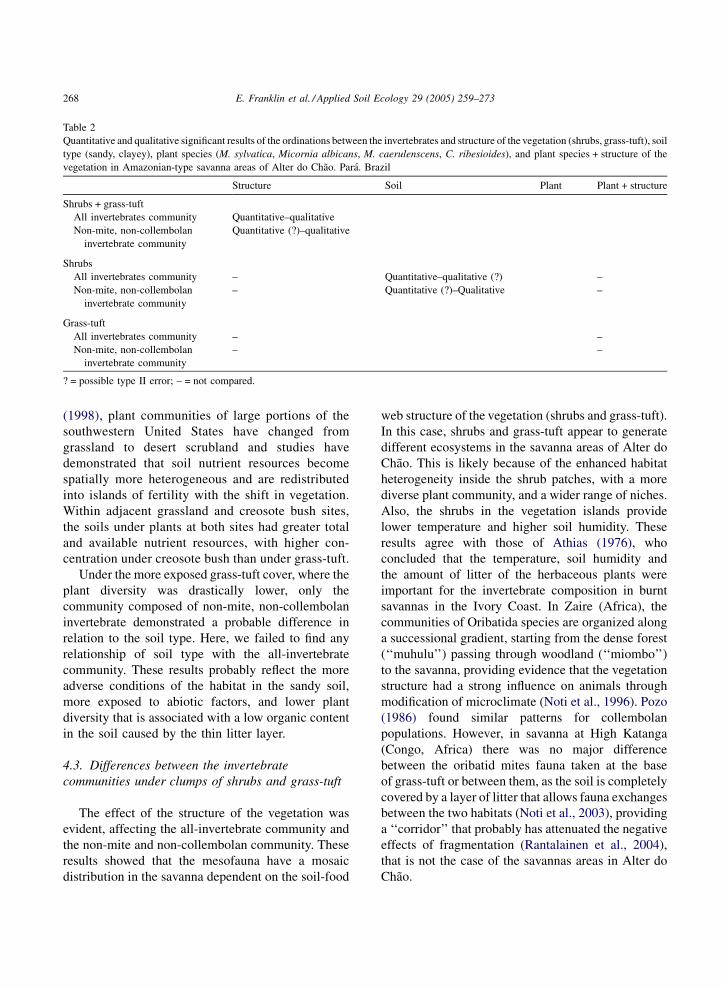
Fig. 8. Upper panel indicates whether the sample was taken on
clayey soil (solid bars) or sandy soil (open bars). Gray bars indicate
the relative frequency of each zoological category within the non-
mite, non-collembolan community. Sites are ordered by their posi-
tion on axis 1 of an MDS ordination (see text).
3.6. Non-mite, non-collembolan invertebrate
community under shrubs—soil and shrub species
Multivariate multiple regression for quantitative
data indicated no statistically significant effect of soil
(Pillai trace = 0.173; P = 0.198). The ordination
(stress: 0.230; r2 = 0.679) was also not significantly
affected by the shrub specie (MANOVA; Pillai
trace = 0.540; P = 0.064). However, the low prob-
ability for the overall null hypothesis and the
significant difference on MDS axis 2 (ANOVA,
P < 0.039) in individual analyses of each axis
indicates a possible type II error.
Multivariate multiple regression for qualitative
data indicated no significant effect of shrubs (Pillai
trace = 0.466; P = 0.122). However, there was a
significant effect of the soil (MANOVA; Pillai
trace = 0.339; P = 0.030). The variation (ANOVA,
P < 0.013) was principally on MDS axis 1 (Fig. 7).
Plots of relative frequency of the zoological
categories of invertebrates against the soil type reflect
their preferences for the type of soil (Fig. 8). In the
upper right of Fig. 8 are grouped those taxa, such as
Diplura, adults Homoptera, Isopoda and adults
Coleoptera, that occurred mostly on sandy soils.
Another group, such as Psocoptera and Pseudoscor-
pionida, were more frequent on clayey soils. Other
taxa were rare and no association with soil type can be
inferred.
E. Franklin et al. / Applied Soil Ecology 29 (2005) 259–273 267
3.7. Non-mite, non-collembolan invertebrate
community under grass-tuft—soil and shrub species
The ordinations of the community sampled under
grass-tuft (24 samples) were not affected by any of the
factors analyzed (soil and species of shrub). For
quantitative data, the ordination was not significantly
related to soil (MANOVA; Pillai trace = 0.242;
P = 0.144) or shrub species (MANOVA; Pillai
trace = 0.428; P = 0.262).
The ordination based on qualitative data was not
significantly related to soil (MANOVA; Pillai
trace = 0.157; P = 0.302) or shrub species (MAN-
OVA; Pillai trace = 0.201; P = 0.760).
4. Discussion
4.1. Density and diversity of the zoological groups
The zoological diversity in the savanna areas was
lower compared to an adjacent forest, where we
registered 32 zoological categories (Franklin, E.; data
not published). The higher concentration of Acari
Oribatida, specially R. foveolatus, and Non-Oribatida
caused the difference between the total sampled under
shrubs of Mycia silvativa. In Venezuela (South
America), a reduction of the diversity and abundance
of soil invertebrates from the forest to savanna was
detected (Rapoport, 1970). In Amazonia some
evidence that the vegetation structure had a strong
influence on animals through modification of micro-
climate was already detected. In Central Amazonia,
the conversion of forest into policulture reduced the
diversity, the density and the biomass of meso- and
macrofauna (Hofer et al., 2001). In western Amazonia,
a reduction of the macro-invertebrate diversity and
biomass of pasture in relation to forest was demon-
strated (Barros et al., 2004).
In our study, the dominance pattern of Acari in
relation to the total catch is similar to reports for other
forest environments in Central Amazonia like flooded
forest of ‘‘varzea’’ and ‘‘igapo’’, primary and secondary
forest and ‘‘campinarana’’ (Franklin et al., 1997).
Therefore, in most of Amazonian ecosystems the
dominance of Oribatida (46–88%) is greater than other
mite groups (Franklin et al., 1997). However, in the
savanna soils, the Non-Oribatida, mostly composed of
predators, were dominant in relation to the total of
Acari. Our results are comparable to those observed in
other environments with harsh ecological conditions. In
African (Zaire) forests and savannas the Oribatid mites
represent 49.4% and 26% of the arthropods, respec-
tively. A reverse gradient is observed in Actinedida that
represents 21.5% and 44.1%, respectively, in the two
types of vegetation (Noti et al., 1996). In Chilean steppe
soil under xerophyllous associations, Trombidiforme
(Non-Oribatid mite) is more abundant than the
Oribatida (Di Castri, 1963). In the Chihuahuan desert
(USA), Acari were dominated by the Prostigmata with
the Oribatida making up a smaller percentage of the
assemblage. The dominance of Prostigmatids seems
to be related to the harshness of the environment
(Santos et al., 1978). In burned savannas in Africa
(Ivory Cost), the relative abundance of decomposers
(principally Oribatida and Collembola) is lower in the
unshaded soil that is impoverished of litter and organic
matter due to fire and the density of predatory and
phytophagous microarthropods is relatively higher
(Athias, 1976).
For better understanding of the following discus-
sion, the ordinations of the communities are summar-
ized bellow (Table 2).
4.2. The effect of the soil on the invertebrate
communities
Analyzing the samples taken under shrubs and
grass-tuft, and on both soil types, the soil did not have
a detectable influence on the soil invertebrates.
However, removing the effect of the structure of the
vegetation and analyzing the samples taken only
under shrubs, the effect of the soil type was strong,
and it was detected in the all-invertebrate community
for quantitative data. There was a similar trend for
qualitative data. We also detected the effect for the
non-mite, non-collembolan invertebrate for the
qualitative data, with a strong trend also for the
quantitative data. The all-invertebrate community,
composed by less numerically dominant groups,
mostly larger than 2 mm, is more mobile and occurs
in higher densities in the vegetation layer. The shrubs
in the savanna provide a deeper litter layer that
enhances water retention as well as moderating soil
temperatures. Both factors can favor growth of
mesofauna populations. According to Kieft et al.
E. Franklin et al. / Applied Soil Ecology 29 (2005) 259–273268
Table 2
Quantitative and qualitative significant results of the ordinations between the invertebrates and structure of the vegetation (shrubs, grass-tuft), soil
type (sandy, clayey), plant species (M. sylvatica, Micornia albicans, M. caerulenscens, C. ribesioides), and plant species + structure of the
vegetation in Amazonian-type savanna areas of Alter do Chao. Para. Brazil
Structure Soil Plant Plant + structure
Shrubs + grass-tuft
All invertebrates community Quantitative–qualitative
Non-mite, non-collembolan
invertebrate community
Quantitative (?)–qualitative
Shrubs
All invertebrates community – Quantitative–qualitative (?) –
Non-mite, non-collembolan
invertebrate community
– Quantitative (?)–Qualitative –
Grass-tuft
All invertebrates community – –
Non-mite, non-collembolan
invertebrate community
– –
? = possible type II error; – = not compared.
(1998), plant communities of large portions of the
southwestern United States have changed from
grassland to desert scrubland and studies have
demonstrated that soil nutrient resources become
spatially more heterogeneous and are redistributed
into islands of fertility with the shift in vegetation.
Within adjacent grassland and creosote bush sites,
the soils under plants at both sites had greater total
and available nutrient resources, with higher con-
centration under creosote bush than under grass-tuft.
Under the more exposed grass-tuft cover, where the
plant diversity was drastically lower, only the
community composed of non-mite, non-collembolan
invertebrate demonstrated a probable difference in
relation to the soil type. Here, we failed to find any
relationship of soil type with the all-invertebrate
community. These results probably reflect the more
adverse conditions of the habitat in the sandy soil,
more exposed to abiotic factors, and lower plant
diversity that is associated with a low organic content
in the soil caused by the thin litter layer.
4.3. Differences between the invertebrate
communities under clumps of shrubs and grass-tuft
The effect of the structure of the vegetation was
evident, affecting the all-invertebrate community and
the non-mite and non-collembolan community. These
results showed that the mesofauna have a mosaic
distribution in the savanna dependent on the soil-food
web structure of the vegetation (shrubs and grass-tuft).
In this case, shrubs and grass-tuft appear to generate
different ecosystems in the savanna areas of Alter do
Chao. This is likely because of the enhanced habitat
heterogeneity inside the shrub patches, with a more
diverse plant community, and a wider range of niches.
Also, the shrubs in the vegetation islands provide
lower temperature and higher soil humidity. These
results agree with those of Athias (1976), who
concluded that the temperature, soil humidity and
the amount of litter of the herbaceous plants were
important for the invertebrate composition in burnt
savannas in the Ivory Coast. In Zaire (Africa), the
communities of Oribatida species are organized along
a successional gradient, starting from the dense forest
(‘‘muhulu’’) passing through woodland (‘‘miombo’’)
to the savanna, providing evidence that the vegetation
structure had a strong influence on animals through
modification of microclimate (Noti et al., 1996). Pozo
(1986) found similar patterns for collembolan
populations. However, in savanna at High Katanga
(Congo, Africa) there was no major difference
between the oribatid mites fauna taken at the base
of grass-tuft or between them, as the soil is completely
covered by a layer of litter that allows fauna exchanges
between the two habitats (Noti et al., 2003), providing
a ‘‘corridor’’ that probably has attenuated the negative
effects of fragmentation (Rantalainen et al., 2004),
that is not the case of the savannas areas in Alter do
Chao.

E. Franklin et al. / Applied Soil Ecology 29 (2005) 259–273 269
4.4. The effect of shrub species on the invertebrate
communities
The effect of the shrub species on the soil fauna was
less evident. Analyzing the samples collected under
shrubs together with those sampled under the grass-tuft,
we detected only a probable effect (type II error) of the
shrub specie on the non-mite, non-collembolan com-
munity. The same effect was detected for the non-mite,
non-collembolan community sampled under shrubs.
In spite of evidence of close association between
arthropods and plant species on poorer soils detected for
blanket bog (Blackith, 1974) and steppe (Stebaeva,
1963), we did not detect a strong effect of the shrub
species for the all-invertebrate community. In our study,
the zoological groups and the non-mite and non-
collembolan community demonstrated a probable
qualitative difference in relation to this factor. Probably,
we did not find influence of the shrub species on the total
invertebrate community because this community is
dominated by the great abundance of Oribatida and
Collembola. Franco et al. (1979) in the northern Mojave
desert (US) also found little if any effect of shrub species
on the number of arthropods beneath them. Further-
more, they concluded that the shrubs are similar not only
in average arthropod density but also in the manner in
which arthropod density is affected by depth and
distance from the plant.
However, there were probable differences caused by
plant species identity on the less dominant taxa (non-
mite, non-collembolan community). The higher den-
sities can be masking the effects when they are included
in the analysis. The Oribatida colonize a great variety of
habitats, have a great diversity of feeding and
reproductive strategies, complex and diverse life cycles,
and great morphological diversity (Lebrun et al., 1995).
Depending on what food resources are available,
collembolans and Oribatida may feed on fungi, algae,
amorphous detritus or even other soil animals, thereby
functioning as microherbivores, herbivores, detritivores
or even predators (Scheu, 2002).
4.5. Zoological groups of higher taxonomic ranks:
are they sufficient to show the differences among soil
invertebrates in an Amazonian savanna?
Aggregating the invertebrates to higher taxonomic
levels (zoological groups), we detected effects of soil
type, vegetation structure and plant species identity
on the composition of the savanna mesofauna
community. The results indicate that conservation
of invertebrate community in the savanna areas of
Alter do Chao will depend on the conservation of the
vegetation structure and plant diversity. We consider
that the level of taxonomic resolution of the
invertebrates utilized in our study was sufficient
only to show the main differences of the spatial
variation in community structure.
Soil macrofauna classified at higher taxonomic
level (class, order and family; 27 faunal community
variables) also showed effects of land-use in western
Brazilian Amazonia (Barros et al., 2002), as the
principal components analysis clearly separated
pasture from disturbed forest, fallow, annual crop,
and agroforestry system. In marine soft-bottom
communities, Olsgard et al. (2003) showed that
species richness was strongly correlated with species
richness of genera, families and orders, which
indicates that even after aggregation of data to
higher taxonomic levels, the richness of the sites
within the various investigated areas is retained. A
study comparing three approaches to TS (morphoe-
species, genera and seven functional groups) in
ground ants in an eucalypt plantation, woodland
regrowth patches and the surrounding grassland in
Australia, revealed that: (1) morphoespecies and
genus richness was highly correlated with species
richness; (2) ordination scatterplots using species,
morphoespecies and genus data revealed similar
patterns of site separation; (3) functional group
ordination separated all three habitats types for
untransformed data (Pik et al., 1999). Resources
spared by using TS could be allocated toward more
frequent sampling events rather than identification of
ant species (Schnell et al., 2003).
We must consider that TS for detecting habitat-
related changes in invertebrate communities in
Amazonia is unknown as most studies have used
classification at the level of class, order or family. In
some cases, TS represent a valid tool in routine
monitoring but poorly known systems or baseline
biodiversity and TS are simply incompatible, and it is
only acceptable to detect impacts (Terlizzi et al.,
2003). Among the soil invertebrates there is a
considerable variability in the interactions of the
different communities with their biotic and abiotic
E. Franklin et al. / Applied Soil Ecology 29 (2005) 259–273270
environment, principally in a complex region like
Amazonia. Communities are not well-integrated units
that move in masse. They are collection of organisms
and species that will respond individualistically to
temporal variation, as they do to spatial variation
(Levin, 1995). In this aspect, our analyses can be
obscuring much more complex habitat partitioning
occurring at the species level. Therefore, due to time
and money constraints and a lack of taxonomic
literature and expertise, mapping biodiversity of large
geographical areas is impracticable and often impos-
sible if the traditional measure of specie richness is to
be used (Olsgard et al., 2003).
Acknowledgements
Financial support came from PPD-G7 6400-0021-
00 ‘‘As interacoes entre savannas e florestas na
Amazonia Central e sua importancia para a biodi-
versidade’’ grant to Renato Cintra and a Auxılio a
Pesquisa Grant from CNPq to Elizabeth Franklin.
E.
Fra
nklin
eta
l./Ap
plied
So
ilE
colo
gy
29
(20
05
)2
59
–2
73
27
1
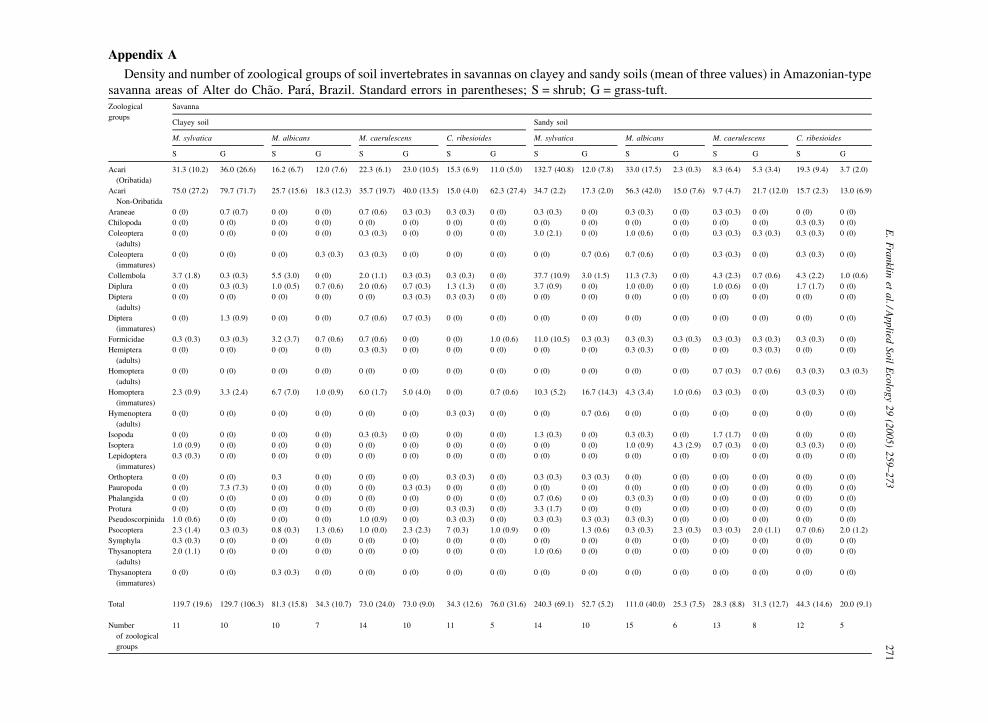
Appendix A
Density and number of zoological groups of soil invertebrates in savannas on clayey and sandy soils (mean of three values) in Amazonian-type
savanna areas of Alter do Chao. Para, Brazil. Standard errors in parentheses; S = shrub; G = grass-tuft.Zoological
groups
Savanna
Clayey soil Sandy soil
M. sylvatica M. albicans M. caerulescens C. ribesioides M. sylvatica M. albicans M. caerulescens C. ribesioides
S G S G S G S G S G S G S G S G
Acari
(Oribatida)
31.3 (10.2) 36.0 (26.6) 16.2 (6.7) 12.0 (7.6) 22.3 (6.1) 23.0 (10.5) 15.3 (6.9) 11.0 (5.0) 132.7 (40.8) 12.0 (7.8) 33.0 (17.5) 2.3 (0.3) 8.3 (6.4) 5.3 (3.4) 19.3 (9.4) 3.7 (2.0)
Acari
Non-Oribatida
75.0 (27.2) 79.7 (71.7) 25.7 (15.6) 18.3 (12.3) 35.7 (19.7) 40.0 (13.5) 15.0 (4.0) 62.3 (27.4) 34.7 (2.2) 17.3 (2.0) 56.3 (42.0) 15.0 (7.6) 9.7 (4.7) 21.7 (12.0) 15.7 (2.3) 13.0 (6.9)
Araneae 0 (0) 0.7 (0.7) 0 (0) 0 (0) 0.7 (0.6) 0.3 (0.3) 0.3 (0.3) 0 (0) 0.3 (0.3) 0 (0) 0.3 (0.3) 0 (0) 0.3 (0.3) 0 (0) 0 (0) 0 (0)
Chilopoda 0 (0) 0 (0) 0 (0) 0 (0) 0 (0) 0 (0) 0 (0) 0 (0) 0 (0) 0 (0) 0 (0) 0 (0) 0 (0) 0 (0) 0.3 (0.3) 0 (0)
Coleoptera
(adults)
0 (0) 0 (0) 0 (0) 0 (0) 0.3 (0.3) 0 (0) 0 (0) 0 (0) 3.0 (2.1) 0 (0) 1.0 (0.6) 0 (0) 0.3 (0.3) 0.3 (0.3) 0.3 (0.3) 0 (0)
Coleoptera
(immatures)
0 (0) 0 (0) 0 (0) 0.3 (0.3) 0.3 (0.3) 0 (0) 0 (0) 0 (0) 0 (0) 0.7 (0.6) 0.7 (0.6) 0 (0) 0.3 (0.3) 0 (0) 0.3 (0.3) 0 (0)
Collembola 3.7 (1.8) 0.3 (0.3) 5.5 (3.0) 0 (0) 2.0 (1.1) 0.3 (0.3) 0.3 (0.3) 0 (0) 37.7 (10.9) 3.0 (1.5) 11.3 (7.3) 0 (0) 4.3 (2.3) 0.7 (0.6) 4.3 (2.2) 1.0 (0.6)
Diplura 0 (0) 0.3 (0.3) 1.0 (0.5) 0.7 (0.6) 2.0 (0.6) 0.7 (0.3) 1.3 (1.3) 0 (0) 3.7 (0.9) 0 (0) 1.0 (0.0) 0 (0) 1.0 (0.6) 0 (0) 1.7 (1.7) 0 (0)
Diptera
(adults)
0 (0) 0 (0) 0 (0) 0 (0) 0 (0) 0.3 (0.3) 0.3 (0.3) 0 (0) 0 (0) 0 (0) 0 (0) 0 (0) 0 (0) 0 (0) 0 (0) 0 (0)
Diptera
(immatures)
0 (0) 1.3 (0.9) 0 (0) 0 (0) 0.7 (0.6) 0.7 (0.3) 0 (0) 0 (0) 0 (0) 0 (0) 0 (0) 0 (0) 0 (0) 0 (0) 0 (0) 0 (0)
Formicidae 0.3 (0.3) 0.3 (0.3) 3.2 (3.7) 0.7 (0.6) 0.7 (0.6) 0 (0) 0 (0) 1.0 (0.6) 11.0 (10.5) 0.3 (0.3) 0.3 (0.3) 0.3 (0.3) 0.3 (0.3) 0.3 (0.3) 0.3 (0.3) 0 (0)
Hemiptera
(adults)
0 (0) 0 (0) 0 (0) 0 (0) 0.3 (0.3) 0 (0) 0 (0) 0 (0) 0 (0) 0 (0) 0.3 (0.3) 0 (0) 0 (0) 0.3 (0.3) 0 (0) 0 (0)
Homoptera
(adults)
0 (0) 0 (0) 0 (0) 0 (0) 0 (0) 0 (0) 0 (0) 0 (0) 0 (0) 0 (0) 0 (0) 0 (0) 0.7 (0.3) 0.7 (0.6) 0.3 (0.3) 0.3 (0.3)
Homoptera
(immatures)
2.3 (0.9) 3.3 (2.4) 6.7 (7.0) 1.0 (0.9) 6.0 (1.7) 5.0 (4.0) 0 (0) 0.7 (0.6) 10.3 (5.2) 16.7 (14.3) 4.3 (3.4) 1.0 (0.6) 0.3 (0.3) 0 (0) 0.3 (0.3) 0 (0)
Hymenoptera
(adults)
0 (0) 0 (0) 0 (0) 0 (0) 0 (0) 0 (0) 0.3 (0.3) 0 (0) 0 (0) 0.7 (0.6) 0 (0) 0 (0) 0 (0) 0 (0) 0 (0) 0 (0)
Isopoda 0 (0) 0 (0) 0 (0) 0 (0) 0.3 (0.3) 0 (0) 0 (0) 0 (0) 1.3 (0.3) 0 (0) 0.3 (0.3) 0 (0) 1.7 (1.7) 0 (0) 0 (0) 0 (0)
Isoptera 1.0 (0.9) 0 (0) 0 (0) 0 (0) 0 (0) 0 (0) 0 (0) 0 (0) 0 (0) 0 (0) 1.0 (0.9) 4.3 (2.9) 0.7 (0.3) 0 (0) 0.3 (0.3) 0 (0)
Lepidoptera
(immatures)
0.3 (0.3) 0 (0) 0 (0) 0 (0) 0 (0) 0 (0) 0 (0) 0 (0) 0 (0) 0 (0) 0 (0) 0 (0) 0 (0) 0 (0) 0 (0) 0 (0)
Orthoptera 0 (0) 0 (0) 0.3 0 (0) 0 (0) 0 (0) 0.3 (0.3) 0 (0) 0.3 (0.3) 0.3 (0.3) 0 (0) 0 (0) 0 (0) 0 (0) 0 (0) 0 (0)
Pauropoda 0 (0) 7.3 (7.3) 0 (0) 0 (0) 0 (0) 0.3 (0.3) 0 (0) 0 (0) 0 (0) 0 (0) 0 (0) 0 (0) 0 (0) 0 (0) 0 (0) 0 (0)
Phalangida 0 (0) 0 (0) 0 (0) 0 (0) 0 (0) 0 (0) 0 (0) 0 (0) 0.7 (0.6) 0 (0) 0.3 (0.3) 0 (0) 0 (0) 0 (0) 0 (0) 0 (0)
Protura 0 (0) 0 (0) 0 (0) 0 (0) 0 (0) 0 (0) 0.3 (0.3) 0 (0) 3.3 (1.7) 0 (0) 0 (0) 0 (0) 0 (0) 0 (0) 0 (0) 0 (0)
Pseudoscorpinida 1.0 (0.6) 0 (0) 0 (0) 0 (0) 1.0 (0.9) 0 (0) 0.3 (0.3) 0 (0) 0.3 (0.3) 0.3 (0.3) 0.3 (0.3) 0 (0) 0 (0) 0 (0) 0 (0) 0 (0)
Psocoptera 2.3 (1.4) 0.3 (0.3) 0.8 (0.3) 1.3 (0.6) 1.0 (0.0) 2.3 (2.3) 7 (0.3) 1.0 (0.9) 0 (0) 1.3 (0.6) 0.3 (0.3) 2.3 (0.3) 0.3 (0.3) 2.0 (1.1) 0.7 (0.6) 2.0 (1.2)
Symphyla 0.3 (0.3) 0 (0) 0 (0) 0 (0) 0 (0) 0 (0) 0 (0) 0 (0) 0 (0) 0 (0) 0 (0) 0 (0) 0 (0) 0 (0) 0 (0) 0 (0)
Thysanoptera
(adults)
2.0 (1.1) 0 (0) 0 (0) 0 (0) 0 (0) 0 (0) 0 (0) 0 (0) 1.0 (0.6) 0 (0) 0 (0) 0 (0) 0 (0) 0 (0) 0 (0) 0 (0)
Thysanoptera
(immatures)
0 (0) 0 (0) 0.3 (0.3) 0 (0) 0 (0) 0 (0) 0 (0) 0 (0) 0 (0) 0 (0) 0 (0) 0 (0) 0 (0) 0 (0) 0 (0) 0 (0)
Total 119.7 (19.6) 129.7 (106.3) 81.3 (15.8) 34.3 (10.7) 73.0 (24.0) 73.0 (9.0) 34.3 (12.6) 76.0 (31.6) 240.3 (69.1) 52.7 (5.2) 111.0 (40.0) 25.3 (7.5) 28.3 (8.8) 31.3 (12.7) 44.3 (14.6) 20.0 (9.1)
Number
of zoological
groups
11 10 10 7 14 10 11 5 14 10 15 6 13 8 12 5

E. Franklin et al. / Applied Soil Ecology 29 (2005) 259–273272
References
Abbott, I., Parker, C.A., Sills, I.D., 1979. Changes in the abundance
of larger soil animals and physical properties of soil following
cultivation. Aust. J. Soil Res. 17, 343–353.
Adis, J., 1988. On the abundance and density of terrestrial arthro-
pods in Central Amazonian dryland forests. J. Trop. Ecol. 4, 19–
24.
Adis, J., Morais, J.W., Ribeiro, E.F., 1987. Vertical distribution and
abundance of Arthropods in the soil of a Neotropical Secondary
Forest during the dry season. Trop. Ecol. 28, 174–181.
Anderson, J.M., Legendre, P., 1999. An empirical comparison of
permutation methods for tests of partial regression coefficients
in a linear model. J. Statist. Comput. Simulat. 62, 2303–2712.
Athias, F., 1976. Recherche sur les microarthropodes du sol de la
savane de Lamto (Cote D’Ivoire). Ann. Univ. Abidjan, serie E
(Ecologie), IX, pp. 193–303.
Barros, E., Pashanasi, B., Constantino, R., Lavelle, P., 2002. Effects
of land-use system on the soil macrofauna in western Brazilian
Amazonia. Biol. Fert. Soils 35, 338–347.
Barros, E., Grimaldi, M., Sarrazin, M., Chauvel, A., Mitja, D.,
Desjardins, T., Lavelle, P., 2004. Soil physical degradation and
changes in macrofaunal communities in Central Amazon. Appl.
Soil Ecol. 26, 157–168.
Belbin, L., 1992. PATN: Pattern Analysis Package. CSIRO, Can-
berra, Australia.
Blackith, R.E., 1974. The ecology of collembola in Irish blanket
bog. Proc. R. Ir. Acad. 74, 203–226.
Brady, N.C., 1989. Natureza e propriedades dos solos, 7th ed.
Freitas Bastos, Rio de Janeiro, 878 pp.
Di Castri, L.F., 1963. Etat de nos connaissances sur les biocoenoses
adaphiques du Chile. In: Doeksen, J., vander Drift, J. (Eds.),
Soil Organisms. North-Holland Publishing Co., Amsterdam, pp.
375–385.
Ellis, D., 1985. Taxonomic sufficiency in pollution assessment.
Marine Pollut. Bull. 16, 459.
Franco, P.J., Edney, E.B., McBrayer, J.F., 1979. The distribution and
abundance of soil arthropods in the Northern Mojave Desert. J.
Arid Environ. 2, 137–149.
Franklin, E., Adis, J., Woas, S., 1997. The Oribatida. In: Junk, W.
(Ed.), The Central Amazon Floodplains. Ecology of a Pulsing
System. Springer-Verlag, Heildelberg, pp. 331–349.
Franklin, E., Morais, J.W., Santos, E.M.R., 2001. Density and
biomass of Acari and Collembola in primary forest, secondary
regrowth and polycultures in central Amazonia. Andrias 15 (1),
141–154.
Gauch, H.G., 1982. Multivariate Analysis in Community Ecology.
Cambridge University Press.
Ginoux, J., Menaut, J.C., Noble, I.R., Davies, I.D., 1996. A spatial
model of savanna function and dynamics: model description and
preliminary results. In: Newberry, D.M., Prins, H.H.T., Brown,
N.D. (Eds.), Dynamic of Tropical Communities. Blackwell
Science, Oxford, UK, pp. 361–383.
Hofer, H., Hanagarth, W., Garcia, M., Martius, C., Franklin, E.,
Rombke, J., Beck, L., 2001. Structure and function of soil fauna
communities in Amazonian anthropogenic and natural ecosys-
tems. Eur. J. Soil Biol. 37, 229–235.
Huber, O., 1982. Significance of savanna vegetation in the Amazon
territory of Venezuela. In: Prance, G.T. (Ed.), Biological Diver-
sification in the Tropics. Columbia University Press, New York,
pp. 221–224.
Jeltsch, F., Milton, S.J., Dean, N.J., Rooyen, N.V., Maloney, K.A.,
1998. Modeling the impact of small-scale heterogeneities in tree-
grass coexistence in semi-arid savanna. J. Ecol. 86, 780–793.
Kenckel, N.C., Orloci, L., 1986. Applying metric and non-metric
multidimensional scaling to ecological studies: some new
results. Ecology 67, 919–928.
Kieft, L.T., White, C.S., Loftin, R.S., Aguilar, R., Craig, J.A., Skaar,
D.A., 1998. Temporal dynamics in soil carbon and nitrogen
resources at a grassland-shrubland ecotone. Ecology 79 (2),
671–683.
Lawton, J.H., Bignell, D.E., Bolton, B., Bloemers, G.F., Eggleton,
P., Hammond, P.M., Hodda, M., Holt, R.D., Larsen, T.B.,
Mawdsley, N.A., Stork, N.E., Srivastava, D.S., Watt, A.D.,
1998. Biodiversity inventories, indicator taxa and effects of
habitat modification in tropical forest. Nature 39, 72–75.
Lebrun, Ph., van Straalen, N.M., 1995. Oribatida: prospects for their
use in ecotoxicology. Exp. Appl. Acarol. 19, 361–379.
Levin, S.A., 1995. The problem of Pattern and Scale in Ecology. In:
Powell, T.M., Steele, J.H. (Eds.), Ecological Time Series. Chap-
man & Hall, pp. 277–313.
Majer, J.D., 1989. Ants: bio-indication of minesite in rehabilitation,
land-use and land conservation. Environ. Manag. 7, 375–383.
Minchin, P.R., 1987. An evaluation of relative robustness of tech-
niques for ecological ordination. Vegetation 69, 89–107.
Miranda, I.S., 1993. Estrutura do estrato arboreo do cerrado ama-
zonico em Alter-do-Chao, Para, Brasil. Revta Brasil. Bot. 16,
143–150.
Miranda, I.S., 1995. Fenologia do estrato arboreo de uma comuni-
dade de cerrado em Alter-do-Chao, PA. Revta Brasil. Bot. 18 (2),
235–240.
Moore, J.C., Walter, D.E., Hunt, H.W., 1988. Arthropod regulation
of micro- and mesobiota in below-ground detrital food webs.
Annu. Rev. Entomol. 33, 419–439.
Noti, M.-I., Andre, H.M., Dufrene, M., 1996. Soil oribatid mite
communities (Acari: Oribatida) from high Shaba (Zaıre) in
relation to vegetation. Appl. Soil Ecol. 5, 81–96.
Noti, M.I., Andre, H.M., Ducarme, X., Lebrun, P., 2003. Diversity of
soil oribatid mites (Acari:Oribatida) from High Katanga (Demo-
cratic Republic of Congo): a multiscale and multifactor
approach. Biodiv. Conserv. 12, 767–785.
Oliveira, E.P., Franklin, E.N., 1993. Efeito do fogo sobre a meso-
fauna do solo: recomedacoes em areas queimadas. Pesq. Agro-
pec. Bras. 28 (3), 357–369.
Olsgard, F., Brattegard, T., Holthe, T., 2003. Polychaetes as surro-
gates for marine biodiversity: lower taxonomic resolution and
indicador groups. Biodiv. Conserv. 12, 1033–1049.
Pik, A.J., Oliver, I., Beattie, A.J., 1999. Taxonomic sufficiency in
ecological studies of terrestrial invertebrates. Aust. J. Ecol. 24,
555–562.
Pozo, J., 1986. Ecological factors affecting collembola populations.
Ordination of communities. Rev. Ecol. Biol. Sol. 23, 299–311.
Rantalainen, M.-L., Haimim, J., Setala, H., 2004. Testing the
usefulness of habitat corridors in mitigating the negative effects

E. Franklin et al. / Applied Soil Ecology 29 (2005) 259–273 273
of fragmentation: the soil fauna community as a model system.
Appl. Soil Ecol. 25, 267–274.
Rapoport, E.H., 1970. Fauna del suelo: Algunos datos sobre su
abundancia y distribuicion. La Ciencia en Venezuela. Instituto
de Zoologia Tropical, Facultad de Ciencias, U.C.V., pp. 469–
481.
Sanaiotti, T., Magnusson, W., 1995. Effects of annual fire on the
production of freshly fruits eaten by birds in a Brazilian Ama-
zonian savanna. J. Trop. Ecol. 11, 53–65.
Sanderson, R.A., Rushton, S.P., Cherrill, A.J., Byrne, J.P., 1995.
Soil, vegetation and space: an analysis of their effects on the
invertebrate communities of a moorland in north-east England. J.
Appl. Ecol. 32, 506–518.
Santos, P.F., DePree, E., Whitford, W.G., 1978. Spatial distribution
of litter and microarthropods in a Chihuahan desert ecosystem. J.
f Arid Environ. 1, 41–48.
Scheu, S., 2002. The soil web: structure and perspectives. Eur. J. Soil
Biol. 38, 11–20.
Schnell, M.R., Pik, A.J., Dangerfield, J.M., 2003. Ant community
succession within eucalypt plantations on used pasture and
implications for taxonomic sufficiency in biomonitoring. Aust.
Ecol. 28, 553–565.
Stebaeva, S.K., 1963. Ecological distribution of Collembola in the
forest and steppes of the Southern Tuva. Pedobiologia 3, 75–
85.
Terlizzi, A., Bevilacqua, S., Fraschetti, S., Boero, F.F., 2003. Taxo-
nomic sufficiency and the increasing insufficiency of taxonomic
expertise. Mar. Pollut. Bull. 46, 556–561.
Vohland, K., Schroth, G., 1999. Distribution pattern of the litter
macrofauna in agroforestry and monocutlture plantations in
central Amazonia as affects by plant species and management.
Appl. Soil Ecol. 13, 57–68.