relationships of mafic volcanic rocks and surrounding
TRANSCRIPT

University of Wollongong University of Wollongong
Research Online Research Online
Faculty of Science, Medicine & Health - Honours Theses University of Wollongong Thesis Collections
2013
Relationships of mafic volcanic rocks and surrounding rocks in the inferred Relationships of mafic volcanic rocks and surrounding rocks in the inferred
subduction complex, Batemans Bay District, Southeastern New South subduction complex, Batemans Bay District, Southeastern New South
Wales, Australia Wales, Australia
Natalie Stokes University of Wollongong Follow this and additional works at: https://ro.uow.edu.au/thsci
University of Wollongong University of Wollongong
Copyright Warning Copyright Warning
You may print or download ONE copy of this document for the purpose of your own research or study. The University
does not authorise you to copy, communicate or otherwise make available electronically to any other person any
copyright material contained on this site.
You are reminded of the following: This work is copyright. Apart from any use permitted under the Copyright Act
1968, no part of this work may be reproduced by any process, nor may any other exclusive right be exercised,
without the permission of the author. Copyright owners are entitled to take legal action against persons who infringe
their copyright. A reproduction of material that is protected by copyright may be a copyright infringement. A court
may impose penalties and award damages in relation to offences and infringements relating to copyright material.
Higher penalties may apply, and higher damages may be awarded, for offences and infringements involving the
conversion of material into digital or electronic form.
Unless otherwise indicated, the views expressed in this thesis are those of the author and do not necessarily Unless otherwise indicated, the views expressed in this thesis are those of the author and do not necessarily
represent the views of the University of Wollongong. represent the views of the University of Wollongong.
Recommended Citation Recommended Citation Stokes, Natalie, Relationships of mafic volcanic rocks and surrounding rocks in the inferred subduction complex, Batemans Bay District, Southeastern New South Wales, Australia, Bachelor of Science (Honours), School of Earth & Environmental Science, University of Wollongong, 2013. https://ro.uow.edu.au/thsci/60
Research Online is the open access institutional repository for the University of Wollongong. For further information contact the UOW Library: [email protected]

Relationships of mafic volcanic rocks and surrounding rocks in the inferred Relationships of mafic volcanic rocks and surrounding rocks in the inferred subduction complex, Batemans Bay District, Southeastern New South Wales, subduction complex, Batemans Bay District, Southeastern New South Wales, Australia Australia
Abstract Abstract The Cambro-Ordovican Wagonga Group rocks of the Narooma Accretionary Complex in the southeastern Lachlan Fold Belt, are well exposed at Melville Point and Barlings Head, 20 km south of Batemans Bay at Tomakin, on the New South Wales south coast. They are comprised of ocean floor turbidites and pelagic sedimentary rocks, and mafic volcanic rocks. Relationships between the volcanic rocks and the surrounding rocks are in need of more detailed examination. Detailed mapping, petrography (microscopy, XRD) and whole rock geochemistry (laboratory and hand-held XRF) of the rock units in the study area, have been used for detailed description of the lithologies. This study shows that the chaotic rocks at Barlings Head form a mélange that is not a stratigraphic sequence, like that at Melville Point. The overall assemblage at both localities is similar. An array of different facies occurs at Barlings Head, including a massive greenstone unit and several different types of mudstone, sandstone and chert units that are commonly mixed and highly deformed. The greenstone unit at Barlings Head is massive and highly altered (secondary clay minerals dominate the rock composition), and it injects along its contacts with adjacent chert and black mudstone units. At Melville Point, the greenstone occurs as a massive unit, pillow lavas and folded within the core of anticlines in the Narooma Chert. Geochemical findings indicate that greenstones at Barlings Head and Melville Point have different magmatic affinities. The Barlings Head greenstone has an ocean-island basalt affinity and is interpreted to be offscraped from a subducted seamount. The Melville Point greenstone has an island arc basalt affinity, derived from a depleted mantle source, and is interpreted to have erupted in a deep marine setting by its association with the Narooma Chert. At Barlings Head a mélange of black mudstone/sandstone is interpreted to have been diapirically injected along an early fault, with later injection of greenstone. The mélange in the centre of Barlings Head has been extensively faulted, contains out-of-sequence turbidite units and fragments of disrupted units. The mudstone may have been accreted unconsolidated sediment, diapirically injected along early faults/bedding. The mélange is interpreted to be the result of the complex interaction and superposition of tectonic processes such as progressive deformation in a thickening fault zone, and diapiric processes.
Degree Type Degree Type Thesis
Degree Name Degree Name Bachelor of Science (Honours)
Department Department School of Earth & Environmental Science
Advisor(s) Advisor(s) Chris Fergusson
Keywords Keywords Paleozoic, Lachlan Fold Belt, basalt, mudstone
This thesis is available at Research Online: https://ro.uow.edu.au/thsci/60
RELATIONSHIPS OF MAFIC VOLCANIC ROCKS AND
SURROUNDING ROCKS IN THE INFERRED SUBDUCTION
COMPLEX, BATEMANS BAY DISTRICT, SOUTHEASTERN NEW
SOUTH WALES, AUSTRALIA
By Natalie Stokes
A thesis submitted in part fulfilment of the requirements of the Honours degree of
Bachelor of Science in the School of Earth and Environmental Sciences, University
of Wollongong 2013

ii
The information provided in this thesis is entirely the result of investigations
conducted by the author, unless otherwise acknowledged, and has not been
submitted in part, or otherwise, for any other degree or qualification.
Natalie Stokes
16/10/2013

iii
ABSTRACT
The Cambro-Ordovican Wagonga Group rocks of the Narooma Accretionary
Complex in the southeastern Lachlan Fold Belt, are well exposed at Melville Point
and Barlings Head, 20 km south of Batemans Bay at Tomakin, on the New South
Wales south coast. They are comprised of ocean floor turbidites and pelagic
sedimentary rocks, and mafic volcanic rocks. Relationships between the volcanic
rocks and the surrounding rocks are in need of more detailed examination.
Detailed mapping, petrography (microscopy, XRD) and whole rock geochemistry
(laboratory and hand-held XRF) of the rock units in the study area, have been
used for detailed description of the lithologies. This study shows that the chaotic
rocks at Barlings Head form a mélange that is not a stratigraphic sequence, like
that at Melville Point. The overall assemblage at both localities is similar. An array
of different facies occurs at Barlings Head, including a massive greenstone unit
and several different types of mudstone, sandstone and chert units that are
commonly mixed and highly deformed. The greenstone unit at Barlings Head is
massive and highly altered (secondary clay minerals dominate the rock
composition), and it injects along its contacts with adjacent chert and black
mudstone units. At Melville Point, the greenstone occurs as a massive unit, pillow
lavas and folded within the core of anticlines in the Narooma Chert. Geochemical
findings indicate that greenstones at Barlings Head and Melville Point have
different magmatic affinities. The Barlings Head greenstone has an ocean-island
basalt affinity and is interpreted to be offscraped from a subducted seamount. The
Melville Point greenstone has an island arc basalt affinity, derived from a depleted
mantle source, and is interpreted to have erupted in a deep marine setting by its
association with the Narooma Chert. At Barlings Head a mélange of black
mudstone/sandstone is interpreted to have been diapirically injected along an
early fault, with later injection of greenstone. The mélange in the centre of
Barlings Head has been extensively faulted, contains out-of-sequence turbidite
units and fragments of disrupted units. The mudstone may have been accreted
unconsolidated sediment, diapirically injected along early faults/bedding. The
mélange is interpreted to be the result of the complex interaction and
superposition of tectonic processes such as progressive deformation in a
thickening fault zone, and diapiric processes.

iv
TABLE OF CONTENTS
INTRODUCTION ................................................................................................... 1
1.2 Aims .......................................................................................................... 3
1.3 Location .................................................................................................... 3
1.4 Methodology ............................................................................................ 4
REGIONAL SETTING ............................................................................................ 8
2.1 The Lachlan Fold Belt ............................................................................... 8
2.2 The Narooma Accretionary Complex ...................................................... 10
STRATIGRAPHIC SETTING ............................................................................... 13
3.1 Geology and geochronology ................................................................... 13
3.2 Structure ................................................................................................. 15
3.3 Tectonic origin and development of units ................................................ 16
STRATIGRAPHY, STRUCTURE AND FACIES ................................................... 20
4.1 Melville Point ........................................................................................... 21
4.2 Barlings Head ........................................................................................ 28
GEOCHEMISTRY ................................................................................................ 46
5.1 Volcanic Units ......................................................................................... 46
5.2 Sedimentary Units ................................................................................... 54
DISCUSSION ....................................................................................................... 67
6.1 Stratigraphic setting and mélange development ..................................... 67
6.2 Geochemical setting of basalts ............................................................... 75
CONCLUSION ..................................................................................................... 78
REFERENCES .................................................................................................... 80
APPENDIX A: SAMPLE LIST .............................................................................. 90
APPENDIX B: XRD RESULTS ............................................................................ 93
APPENDIX C: LABORATORY XRF RESULTS ................................................... 95

v
APPENDIX D: HAND-HELD XRF RESULTS (Laboratory) .................................. 98
APPENDIX E: HAND-HELD XRF RESULTS (Field) .......................................... 101
vi
LIST OF FIGURES
1.1 Location of the study area within the Narooma Accretionary Complex 2
1.2 Location of the study areas within the Tomakin area 4
2.1 Geology and subprovinces of the Lachlan Fold Belt; NSW and Victoria 9
4.1 Geological and structural map of Melville Point 22
4.2 Cross-section of geology and structure along Melville Point cliff face 23
4.3 Photographs and photomicrographs of Melville Point massive 24
greenstone, pillow lavas and cherty-mudstone units
4.4 Stratigraphic columns across Melville Point 26
4.5 Geological map of Barlings Head region 29
4.6 Geological map of Barlings Head 31
4.7 Structural and geological map of Barlings Head 32
4.8 Cross section through the mélange at Barlings Head 33
4.9 Photographs and photomicrographs of Barlings Head black mudstone, 35
greenstone and quartz units
4.10 Photomicrographs of quartz sandstone and greenstone from Barlings 36
Head
4.11 Photographs and photomicrographs of Barlings Head disrupted chert 39
and interbedded lithic sandstone and mudstone units
4.12 Geology and structure of the antiform in the Barlings Head mélange 40
4.13 Photographs and photomicrographs of Barlings Head clay-rich 41
siliceous mudstone and lithic sandy mudstone units
5.1 Ti vs. V magma discrimination diagram of (Shervais 1982) for basalts 50
5.2 Nb-Y-Zr magma discrimination diagram of Meschede (1986) for basalts 52
5.3 K2O vs. Al2O3 diagram for Barlings Head sedimentary units 54
5.4 Fe-Al-Si diagram for Barlings Head sedimentary units 60
5.5 Th vs. U diagram for Barlings Head sedimentary units 62
6.1 Conceptual models of mélange formation for Barlings Head 69

vii
LIST OF TABLES
4.1 X-ray diffraction results for Barlings Head and Melville Point units 44
5.1 Laboratory XRF whole rock geochemical data for volcanic units. 47
5.2 Average hand-held XRF whole rock geochemical data for volcanic units. 48
5.3 Laboratory XRF whole rock geochemical data for sedimentary units 58
5.4 Average hand-held XRF whole rock geochemical data for sedimentary 64
units

viii
ACKNOWLEDGEMENTS
It is with immense gratitude that I acknowledge my supervisor, Associate Professor
Chris Fergusson, for his invaluable support and encouragement throughout the
year. Your knowledge, time and patience during this journey has been so greatly
appreciated.
The mediocre teacher tells. The good teacher explains. The superior teacher demonstrates. The great teacher inspires. - William Arthur Ward
Thank you for inspiring me and challenging me. Your passion and expertise has
provided me with valuable lifelong knowledge and experience that will help me
throughout my career in geology and will not be forgotten.
A special thank you to Associate Professor Brian Jones and Associate Professor
Allen Nutman for your assistance and guidance in undertaking and interpreting
XRD and XRF analyses. Your knowledge and advice was very important to the
production of this thesis, thank you.
I would also like to thank José Abrantes for preparing my thin sections and your
assistance in in preparing samples for XRF and XRD. Your friendly nature and
stories made many long days of crushing rocks considerably more enjoyable.
Also, to Associate Professor Paul Carr for providing me with my major and trace
element data.
Finally, to my family, thank you for your constant understanding and support, and
particularly to my dad for always making sure I was armed with a hot cup of tea.
To Sean, thank you for always helping me keep things in perspective.

1
CHAPTER ONE
INTRODUCTION
1.1 Introduction
The subduction and accretion of oceanic and terrigenous material is an
important process for continental growth along convergent margins. These
materials are accreted on to the overriding plate through frontal accretion,
underplating and kneading of trench-slope sediments, to form a subduction
complex (Kearey et al. 2009). The identification of paleo-subduction zones has
commonly been controversial, made particularly difficult when suspected sites of
subduction are poorly exposed. Their complexity is increased by the wide array of
structural and stratigraphic styles that may develop along subduction zones. For
example, while mélange is a common feature of subduction zones, it may not
develop at subduction zones with a low strain rate and it can also feature in other
non-subduction settings such as along transform faults (Kearey et al. 2009). As
such, a strict characterisation of subduction zones, particularly those in ancient
terrains, and their recognition can be problematic.
The Narooma Accretionary Complex, within the Paleozoic Lachlan Fold
Belt of southeastern New South Wales, has been the focus of numerous studies
because of its extensive outcrops of accreted rocks. These can reveal critical
information on the history of subduction and deformation, the paleo-environment
in which they formed and the tectonic environment in which they were emplaced
(Prendergast & Offler 2012). The tectonic setting and development of the inferred
subduction complex still continues to be debated, given the highly deformed
nature of these rocks, and stratigraphic and structural differences from other
subduction complexes. However, as mentioned above, such differences are to be
expected as all-encompassing criteria for modern and paleo-subduction terranes
are debated in the literature.

2
This study documents the geology of the Narooma Accretionary Complex,
focusing on the coastal exposures of these rocks between Melville Point and Long
Nose Point, south of Batemans Bay, New South Wales (Figure 1.1). This subset
of the accretionary complex has been chosen as the study area because current
understanding of the geological relationships is in need of further work and they
present the best exposures for analysis unobscured by cover.
Figure 1.1: Location of the study area and the Cambrian and Ordovician rocks of the Narooma Accretionary Complex which extends up to 15 km inland along the south coast of New South Wales, with trends of bedding/cleavage and major units. Inset shows location within the Lachlan
Fold Belt in Australia. Modified after Fergusson & Frikken (2003) and Prendergast & Offler (2012).

3
1.2 Aims
The overarching aim of this study is to document the geological nature and
origin of the selected rock exposures to improve understanding of the inferred
early Palaeozoic subduction complex and its tectonic development.
The main objectives of this thesis are listed below.
1. Describe field relationships between mafic volcanic rocks and surrounding
rocks of the Wagonga Group in parts of the headland exposures at Melville Point
and Barlings Head.
2. Determine the facies variations across the selected outcrops.
3. Characterise the mineralogical and geochemical composition of the rock units.
4. Determine the spatial distribution of the rock units and their implications for the
overall distribution of rock types.
5. Establish the correlation between the two study areas.
The outcome of this project will be new petrographic and geochemical
knowledge of the various units combined with new detailed geological maps
showing the nature and spatial distribution of the rock types. This will enable
constraints to be placed on the existing hypotheses for the development of the
outcrops and impart further insight to the tectonic history of the subduction
complex. Existing conflicting hypotheses variably impart sedimentary, tectonic and
diapiric models as major mechanisms contributing to its development.
1.3 Location
A complex assemblage of highly deformed oceanic Lachlan Fold Belt rocks
occurs in excellent exposures in southeastern New South Wales. These have
been interpreted as part of an early Paleozoic subduction complex – the Narooma
Accretionary Complex – in the eastern subprovince of the Lachlan Fold Belt
(Offler et al. 1998). The area examined in this thesis is located 20 km south of

4
Batemans Bay at Tomakin (Figure 1.2). The study area incorporates Melville Point
and stretches eastwards to Barlings Head occupying an area of ~1 km2.
Figure 1.2: Study area 20 km south of Batemans Bay. Geology and thrust faults modified from Fergusson & Frikken (2003). See Figure 1.1 for location.
1.4 Methodology
1. Spatial Analysis and Mapping
Digital aerial photography of Batemans Bay with a 50 cm spatial
resolution was used as the basis for the production of a detailed geological map in
addition to observations and data collected during two weeks of field work. Initial
field work involved major facies descriptions, critical structural measurements and
preliminary sampling of lithologies for XRD and thin section analysis. Spatial data
was collected using a hand held Garmin 72 global positioning system (GPS) and
was processed using EasyGPS software. Spatial data associated with sampling
points, lithological locations and relationships, structural measurements and hand-
held XRF data was imported into an ArcGIS geodatabase. This data was then
processed with ArcGIS to produce detailed geological maps of the study area that
show the nature, structure and spatial distribution of the rock types.
5
2. Sample collection
Thirty-three samples were collected from the Wagonga Group at the
selected coastal outcrops. Twenty-five were taken from Barlings Head and eight
were from Melville Point. GPS points were recorded of sample localities, while
representative lithologies, sedimentary structures, textures and mesoscopic facies
characteristics were described and photographed on site with a suite of samples
collected for further analysis.
3. Thin sections
Eleven thin sections were prepared and examined at the University of
Wollongong. Sections were analysed using transmitted light petrography on a
Leica DM2500 petrological microscope, to identify and quantify primary minerals
and alteration mineral assemblages, textures and structures. Photomicrographs
were taken using a Leica DFC2500 camera.
4. X-Ray Diffraction
Fifteen samples were analysed using X-Ray Diffraction (XRD) at the
University of Wollongong to identify unknown mineral phases. Samples were
crushed into a homogenous fine powder using a chrome TEMA mill machine and
subsequently analysed using a Philips 1150 PW Bragg-Brentano diffractometer
using CuKα radiation. Diffraction peaks were identified and shifted using Traces
V.4 software and mineral identification and quantification from the peaks were
undertaken using Siroquant software. Siroquant provides a chi-squared value
during sample analysis which indicates the ‘goodness of fit’ or how well the model
fits the powder diffraction pattern, and thus indicating the reliability of the results.
These values need to be considered during interpretation of the XRD data. During
refinements of the model to fit the peak patterns, the chi-squared value is initially
large and gradually decreases as the statistical quality of fit to the data improves.
6
Chi-squared values of 5 – 7 are considered relatively good fits, while chi squared
values of <3 indicate a well-refined pattern, i.e. more reliable results.
5. Geochemical analysis
Samples were analysed for whole rock geochemistry using two methods
of X-ray fluorescence (XRF) analysis; a hand-held Niton 3XLt GOLDD+ XRF and
a SPECTRO XEPOS (laboratory based) XRF at the University of Wollongong
The Niton 3XLt GOLDD+ XRF was used to measure the geochemistry of
representative lithologies across the outcrop localities in the field, as well as
samples collected and analysed at the University of Wollongong. The device was
standardised at the start, middle and end of a day using the NIST 2780 and 2709a
standards. The data collected was then calibrated against these standards based
on the Standard Reference Material chart certifying the correct elemental values
of the standards.
Seventeen samples of representative lithologies previously analysed
using the Niton 3XLt GOLDD+ XRF were additionally analysed using the
SPECTRO XEPOS laboratory based XRF to assess the accuracy of the hand-
held XRF data and collect further major and trace element data. The samples
were crushed into a fine powder using a chrome TEMA mill and then prepared
into pressed pellets for trace element analysis by mixing 5 g of powder with a
Polyvinyl Acetate (PVA) binder and pressing to ~2500 psi into an aluminium cup.
The pellets were then dried in a 65°C oven for 24 hours. Glass buttons were
made for major element analysis by fusing 300‒400 mg of samples with 2.4 g of
the appropriate flux for the sample type. 400 mg of sample was added to pure
metaborate flux used for high silica (>65% SiO2) samples, while 300 mg of sample
was added to a 12:22 tetraborate metaborate flux for lower silica (45–65% SiO2)
samples. Samples were then mixed with the flux in platinum crucibles and heated
over the course of one hour from 600 to 970°C so that the flux melts and the
sample dissolves. An ammonium-iodide (NH4I) pellet was added to reduce

7
viscosity prior to pouring of the molten material onto graphite moulds and allowing
the fused mixture to cool, making homogenous glass disks.
Loss on ignition was calculated by weighing then heating 1 g of sample in
a ceramic crucible for two hours in a 1050ºC oven. Samples were weighed again
after baking and the difference in weights converted to weight percent loss on
ignition. This provides a measure of volatile and other added compounds present
in the sample.

8
CHAPTER TWO
REGIONAL SETTING
2.1 The Lachlan Fold Belt
The Narooma Accretionary Complex in southeastern New South Wales is
the easternmost structural belt of the Lachlan Fold Belt (Powell 1983) which forms
part of the broader Tasman Orogenic Zone of eastern Australia (Miller & Gray
1996). The 700 km wide, 1200 km long belt is characterised by a widespread
Ordovician quartz-turbidite succession that is typically over 2000 m thick, as well
as scattered mafic and felsic volcanic rocks, intrusive bodies, chert and other
marine sedimentary rocks (VandenBerg et al. 2000; Gray & Foster 2004). The
current association between these lithologies and their age, structure and
geological evolution has enabled identification of three distinct zones that
comprise the Palaeozoic Lachlan Fold Belt: the western province (major
deformations at 450–420 Ma), central province (440–420 Ma) and eastern
province (430–340 Ma) (Figure 2.1) (Gray 1997; Hough et al. 2007).
The Lachlan Fold Belt formed during cratonisation of the eastern Australian
continental margin. However, by what method this occurred and in what tectonic
setting, remains an incredibly controversial and perplexing issue. Many authors
have claimed that cratonisation occurred through accretion across several
subduction zones active in the early Paleozoic, one in each subprovince (Figure
2.1) (Gray et al. 1997; Offler et al. 1998; Foster & Gray 2000; Fergusson 2003).
The eastern subprovince contains the inferred west-dipping subduction zone
responsible for the Narooma Accretionary Complex (Miller & Gray 1997).
The development and deformation of the Lachlan Fold Belt, involving
stepwise accretion accompanied by structural thickening and shortening, occurred
from the Late Ordovician (~450 Ma) to the early Carboniferous through a series of
episodic orogenic cycles including the Delamerian (510–490 Ma), Benambran
(490–440 Ma), Bindian (418–410 Ma), Tabberabberan (430–380 Ma) and
9
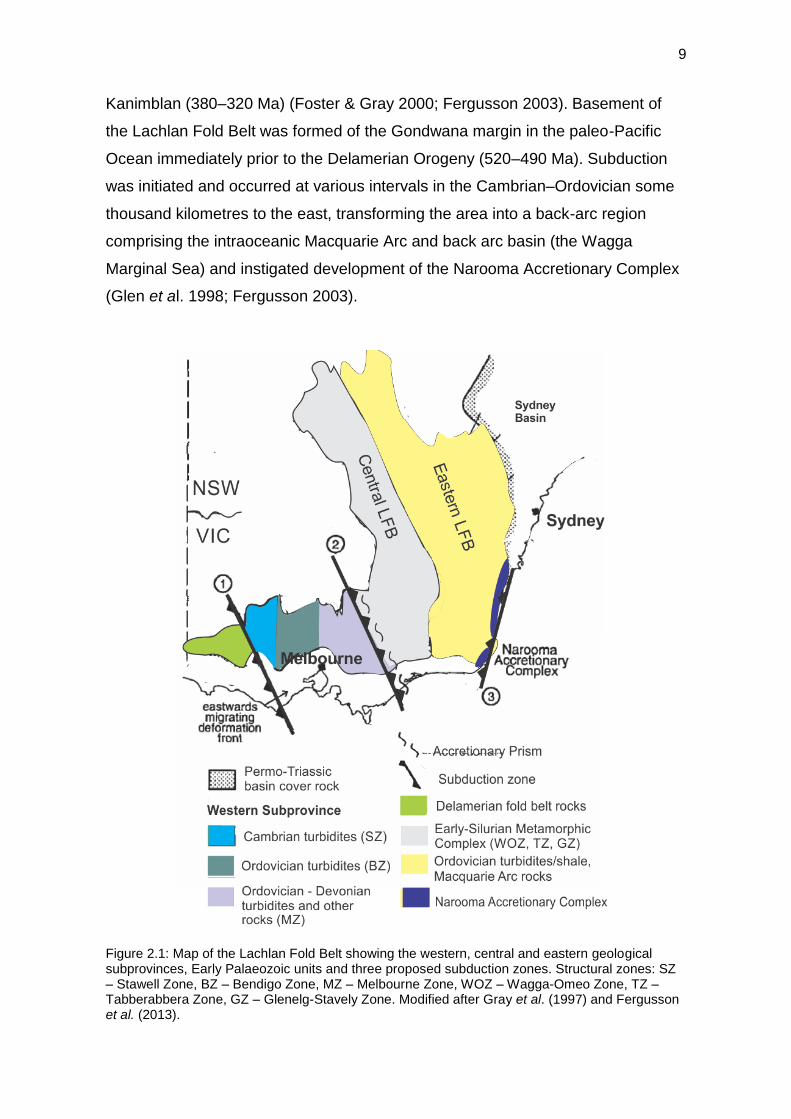
Kanimblan (380–320 Ma) (Foster & Gray 2000; Fergusson 2003). Basement of
the Lachlan Fold Belt was formed of the Gondwana margin in the paleo-Pacific
Ocean immediately prior to the Delamerian Orogeny (520–490 Ma). Subduction
was initiated and occurred at various intervals in the Cambrian–Ordovician some
thousand kilometres to the east, transforming the area into a back-arc region
comprising the intraoceanic Macquarie Arc and back arc basin (the Wagga
Marginal Sea) and instigated development of the Narooma Accretionary Complex
(Glen et al. 1998; Fergusson 2003).
Figure 2.1: Map of the Lachlan Fold Belt showing the western, central and eastern geological subprovinces, Early Palaeozoic units and three proposed subduction zones. Structural zones: SZ – Stawell Zone, BZ – Bendigo Zone, MZ – Melbourne Zone, WOZ – Wagga-Omeo Zone, TZ – Tabberabbera Zone, GZ – Glenelg-Stavely Zone. Modified after Gray et al. (1997) and Fergusson et al. (2013).

10
The eastern Lachlan Fold Belt is comprised of an inland fold-thrust belt (the
Bungonia Delegate fold-thrust belt) that arose during latest Ordovician to mid-
Devonian plate convergence between the paleo-Pacific Ocean and Gondwana,
and occupied an arc-frontal setting above a west-dipping subduction zone
(Fergusson & Vandenberg 1990). The inland belt is transitional with increased
deformation into a coastal belt of complexly deformed continental-derived and
ocean-floor sequence type rocks that are widely regarded to be part of a
subduction complex, termed the Narooma Accretionary Complex (Figure 2.1)
(Miller & Gray 1996; Offler et al 1998; Prendergast 2007).
2.2 The Narooma Accretionary Complex
The Narooma Accretionary Complex is an inferred west-dipping, folded,
imbricated succession along the south coast of New South Wales, comprising
Cambro-Ordovician rocks extending up to 15 km inland (Figures 1.1 and 2.1)
(Offler et al. 1998; Miller & Gray 1996; Fergusson & Frikken 2003). The complex
comprises the inferred structurally higher Adaminaby Group, a craton-derived
Ordovician quartz turbidite succession, that overlies the Cambrian–Ordovician
ocean floor deposits of the Wagonga Group, which, in their exposures to the north
and south of Batemans Bay trend approximately north–south (Glen et al. 2004;
Prendergast & Offler 2012).
Alternative models for the tectonic development of this region have been
suggested. Glen et al. (2004) proposed a transform trench model in which
accretion of the Narooma Terrane to the Gondwana margin occurred by low angle
strike-slip to oblique convergence and the absence of an accretionary prism. This
model was challenged by Fergusson and Miller (2005) on the basis of the
absence of any identified Late Ordovician to Silurian major strike-slip faults which
are fundamental to the model proposed by Glen et al. (2004), as well as
sedimentary and deformation structures, and recognisable sets of lithologies
evident that are consistent with subduction/accretion processes which may or may
not have involved an oblique convergence vector.
11
2.2.1 Evidence for subduction
Recognition of a paleo-subduction zone along the south coast of New
South Wales was founded on the presence of an accretionary complex of ocean-
floor sequence basalts, turbidites and pelagic rocks (Powell 1983; Prendergast
2007), that is of particular importance to the subduction model for this area as
accretionary complexes do not always develop. This has been observed in some
modern subduction zones, where the ocean floor sequences are subducted and
no offscraping occurs (Hilde 1983; von Huene & Scholl 1991). The subduction
model for the development of the Narooma Accretionary Complex is well
supported (Miller & Gray 1996; Gray & Foster 1998; Fergusson & Frikken 2003;
Prendergast 2007). Analyses of the stratigraphy and structure have identified
early deformation fabrics and thrust-faulting resulting in repetition of ocean-floor
sequences occurring in these Cambro-Ordovician rocks (Bischoff & Prendergast
1987; Fergusson & Frikken 2003; Prendergast 2007). These features have been
identified in modern accretionary complexes along active subduction zones (Taira
et al. 1992), and as such are considered evidence for a paleo-subduction zone
along the southeastern coastal margin.
The highly deformed chert-basalt-turbidite sequence of the inferred
subduction complex features chaotic block-in-matrix melange, soft-sediment
deformation and evidence of underplating (bedding parallel fabrics, isoclinal
recumbent folds), among other sequences and structures, that have been noted
as similar to features observed in the Shimanto Accretionary Complex, Japan and
the Kodiak Accretionary Complex, Alaska (Offler et al. 1998; Miller & Gray 1996).
Prendergast (2007) compared fabrics observed in outcrop and thin-
sections of the Wagonga Group in the Narooma Accretionary Complex with those
reported from Ocean Drilling Program (ODP) and Deep Sea Drilling Program
(DSDP) cores taken in modern accretionary wedges, and found a close match in
structures including dewatering channels, spalling and spaced foliation. The
correspondence between fabrics found in the inferred accretionary complex at
Narooma to those found in modern accretionary prisms such as the Nankai Prism,
provides substantial support for the subduction zone setting at Batemans Bay.

12
Particular significance has been placed on the occurrence of spaced foliation
(Prendergast 2007) which has been constrained to all active margin zones as this
structure has not been identified in any passive margin setting (Lundberg and
Moore 1986). Prendergast (2007) also suggested the stratigraphy of the Narooma
Accretionary Complex — as a sequence of craton-derived turbidites overlying
ocean floor sediments— is consistent with being an accreted package associated
with a subduction zone, as this stratigraphy is analogous to that of the Nankai
Prism.
In addition to structural evidence, the subduction model is also supported
by illite crystallinity (IC) values and b0 cell spacing of white micas from Narooma
and Bermagui further south that indicate sub-greenschist (middle to upper
anchizone) metamorphic conditions consistent with a setting in the low to middle
levels of a subduction complex (Offler et al. 1998). These data also suggest burial
having occurred at approximately 10 km to 15 km depth, indicating that the rocks
may have formed during underplating in a subduction complex (Offler et al. 1998;
Prendergast et al. 2011).

13
CHAPTER THREE
STRATIGRAPHIC SETTING
Three facies associations of the subduction complex were first introduced
by Powell (1983, 1984) for the New South Wales south coast; the Wagonga beds
and an inland and coastal facies of greywacke and slate. The Wagonga beds
have since been redefined as the Wagonga Group and the turbidites are now
considered part of the Adaminaby Group (Glen 1994).
3.1 Geology and geochronology
3.1.1 Wagonga Group
The Wagonga Group is a highly deformed unit that consists of chert, black
shale, mudstone, basalt and associated limestone (Offler et al. 1998; Bischoff &
Prendergast 1987). Two formations have been recognised in the Wagonga Group
following revision of the subdivisions by Glen et al. (2004): (1) the interbedded
chert, mudstone and siltstone of the Narooma Chert (Glen et al. 2004), and (2) the
chaotic clast-in-matrix mélange of the Bogolo Formation (Miller & Gray 1996).
One unit of volcanic breccia and associated parautocthonous limestone beds and
clasts has also been identified within the Wagonga Group (Bischoff & Prendergast
1987). An additional formation in the Wagonga Group is the Kianga Basalt; a
mafic volcanic-rich unit that occurs at the base of the Wagonga Group between
the overlying Narooma Chert and the underlying Bogolo Formation. The Kianga
Basalt occurs as massive basalt, and as volcanic breccias of centimetre–metre
size clasts of basalt and pillow fragments in a volcaniclastic matrix, that alternate
with siltstone beds several centimetres thick (Glen 1994; Glen 2004). The Kianga
Basalt has since been dismissed as a separate a separate formation by Glen et
al. (2004), and has been redefined as part of the Bogolo Formation. However, the
Kianga Basalt clearly exists as a distinct separate unit in places, such as Melville
Point in the study area.
14
The Narooma Chert is a highly deformed unit of bedded chert and black
mudstone. The well bedded chert commonly ranges from pale light grey/yellow to
black in colour. The chert beds occur from 1 cm to 30 cm thick and alternate with
thinner siliceous mudstone layers of millimetres to 10 cm thick, displaying sharp,
occasionally faulted contacts between them (Fergusson & Frikken 2003; Glen et
al. 2004). The unit is highly folded and displays spectacular chevron folds in
places (Glen et al. 2004).
The Bogolo Formation mélange at Batemans Bay and Narooma consists of
poorly sorted, randomly distributed pods (centimetre to >20 m diameter) of
abundant lithic and quartzose sandstone and minor chert, siliceous mudstone,
and vesicular basalt, in a foliated mudstone (>90–99%) matrix (Fergusson &
Frikken 2003; Prendergast 2007). It has been variably referred to as a block-in-
matrix mélange (Miller & Gray 1996, 1997; Fergusson & Frikken 2003), locally as
a ‘diamictite’ (Jenkins et al. 1982) and as conglomerate (Glen et al. 2004).
The ages of fossils from the Wagonga Group have been established to
determine the age of the units: graptolite fossils extracted from black shales south
of Batemans Bay have provided an Eastonian–Bolindian (Late Ordovician) age
(Jenkins et al. 1982); Late Cambrian–Early Ordovician conodonts have been
found in cherts and siliceous mudstones (Stewart & Glen 1991); and Middle–Late
Cambrian fossils have been discovered in limestone clasts and beds at
Burrewarra Point (Bischoff & Prendergast 1987). The Bogolo Formation has been
interpreted as younger than the structurally overlying Narooma Chert on the basis
of the gradational contact observed between the upper chert and lower Bogolo
Formation (Glen et al. 2004) and the presence of clasts within the melange that
appear to be derived from the overlying units (Miller & Gray 1996).
3.1.2 Adaminaby Group
The Adaminaby Group turbidite unit is comprised of fine to coarse grained
interbedded quartzose sandstone (beds up to 3 m thick) and mudstone, with
15
occasional chert beds <1 m thick that contain latest Cambrian–earliest Ordovician
conodonts, and is the dominant sequence in the imbricated succession
(VandenBerg & Stewart 1992; Fergusson & Frikken 2003; Prendergast 2007).
This age is consistent with the ages of detrital zones extracted from two samples
of the Adaminaby Group sandstone at Melville Point. Rare pods and lenses of
basalt occur within the Adaminaby Group turbidites at Burrewarra Point north of
the study area, that have not been found elsewhere within the Adaminaby Group
outside of Batemans Bay (Fergusson & Frikken 2003).
3.2 Structure
A history of intense deformation in the Narooma Accretionary Complex
resulted in the development of early structures in unlithified or poorly lithified rocks
including synsedimentary folds, disaggregated bedding and faults, mud injection
and mélange formation, that have been overprinted by three phases of pervasive
tectonic deformation: D1, D2, and D3 (Fergusson & Frikken 2003; Prendergast
2007). Major regional D1 deformation caused by intense east–west compression
produced north–south trending (020°) tight to isoclinal mesoscopic folds (F1). F1
folds in the Wagonga Group are commonly asymmetrical and dip to the west,
implying tectonic transport to the east. S1, an associated well-developed axial
planar cleavage, is commonly slaty and also shows a consistent dip to the west
(Prendergast 2007). These structures are overprinted by open to tight, north–
south trending parasitic F2 folds and a spaced to slaty crenulation cleavage. The
cleavage is defined by the parallel alignment of fine grained neocrystalline white
mica minerals, associated with a younger regional D2 deformation. F2 and S2
occur slightly oblique to F1 and S1, and similarly display a moderate to steep west
dip (Fergusson & Frikken 2003; Prendergast 2007). A younger, less intense D3
regional deformation caused by a north–south compression is responsible for
kinking of the units and developed a poorly preserved crenulation cleavage
(Frikken 1997; Prendergast 2007).
16
3.3 Tectonic origin and development of units
The origin and tectonic processes responsible for the formation and
emplacement of units within the subduction complex remains a contentious issue.
Previous studies have proposed hypotheses for the depositional environment of
the units and the tectonic implications of their relative positions across the
Batemans Bay and Narooma region (Fergusson & Frikken 2003; Glen et al. 2004;
Prendergast 2007). However, the distribution of basalts across the study area and
the significance of complex field relationships between the basalt and surrounding
rocks for their emplacement, has not been addressed in detail.
3.2.1 Origin of Adaminaby and Wagonga Group units
The Adaminaby Group turbidite sequence is suggested to have been
deposited in a passive margin setting by VandenBerg & Stewart (1992), and partly
in a convergent margin setting by Fergusson et al. (2013). Derived from the active
adjoining Delamerian‒Ross orogenic belt, sediments prograded rapidly off the
Gondwana craton following collision of VanDieland with the Delamerian active
margin across a marginal sea to form a huge submarine fan (Fergusson et al.
2013). This Ordovician turbidite fan is considered to have been similar in size to
the modern Bengal Fan, with an initial fan length of at least 1300 km prior to
structural shortening (Powell 1983; VandenBerg & Stewart 1992; Miller & Gray
1996).
The chert and black mudstone of the Wagonga Group were proposed to
have been deposited further east, simultaneously to the adjacent turbidites, as
deep-sea abyssal-plain deposits representing the most distal facies of the
submarine fan (Powell 1983; Miller & Gray 1996). The associated basalt,
limestone beds and clasts of the Wagonga Group at Burrewarra Point, however,
are suggested to have been derived from a seamount that was incorporated into
the complex as an exotic sliver during subduction (Bischoff & Prendergast 1987).

17
3.2.2 Hypotheses for the emplacement of basalt in the complex
Intense post-accretion deformation has overprinted early structures in this
ancient succession, making it particularly difficult to infer the processes
responsible for the unusual distribution of greenstone and to interpret field
relationships between the rocks.
The host basaltic breccia, in which the limestone occurs, is considered to
have been deposited close to its source as a debris flow due to its poor sorting
and the subangular shape of the basalt and limestone clasts (Bischoff &
Prendergast 1987). Basalt also occurs as fragments within the chaotic block-in-
matrix mélange of the Bogolo Formation that outcrops at Burrewarra Point to the
north of the study area, and at Narooma to the south (Miller & Gray 1996). The
absence of faceted and slickenside faces on blocks within the mélange is
considered to be evidence for deposition by backflow or debris flow prior to the
pervasive tectonic overprint that occurred during underplating and subsequent
underthrusting of the mélange beneath the chert and turbidites (Miller & Gray
1996). The contact between the mélange and the overlying Wagonga Group that
truncates bedding (Miller & Gray 1996), alongside pinch and swell features and
folding observed in the mélange (Prendergast 2007), are common structures
associated with downslope movement of sediment (Taira et al. 1992).
Additionally, Offler et al. (1998) demonstrated from b0 and IC data that
deformation and metamorphism of the Bogolo Formation occurred in a higher
geothermal gradient at a lower pressure, indicative of the mélange arising from a
debris flow that was deformed at a shallow level, close to the toe of the
accretionary wedge.
Alternatively, it has been proposed that shear zone thickening caused by
the migration of faults (Moore & Byrne 1987) in the complex is responsible for the
mélange formation (Prendergast 2007). At Batemans Bay, the north–south trend
of the mélange outcrop and the corresponding orientations preserved within
disrupted bedding in the mélange supports formation via shear zone thickening
and some as olistostromal flows (Prendergast 2007). Fergusson and Frikken
(2003), however, argued that the wealth of sandstone clasts present across the

18
whole Bogolo Formation, despite being some distance from the turbidites in
places, is inconsistent with formation by shear zone thickening which dictates
these fragments must be derived from adjacent units rather than distal units.
Prendergast (2007) also considered the block-in-matrix mélange to be formed by
thrust faulting, based on disparate ages of rocks and repetition of lithologies
across the study area. Repetition of lithologies is supported by evidence of three
major fault slices of the Adaminaby Group occurring between Melville Point and
Burrewarra Point.
At Melville Point, the outcrop occurs as an imbricated stratigraphic
succession with a faulted base between the Wagonga Group greenstone unit and
the Adaminaby Group turbidites in the east, and has led to recognition of a thrust-
slice mechanism for greenstone emplacement (Fergusson & Frikken 2003;
Prendergast 2007).
Deformation and mobilisation of unconsolidated sediments in subduction
zones is a condition for diapirism of low density masses into overlying units.
Detailed mapping of the disrupted units south of Batemans Bay by Fergusson and
Frikken (2003) have revealed evidence of soft sediment disruption including
flame-like injection features, and discontinuous bands of the Adaminaby Group
and Bogolo Formation across the complex that are not representative of thrust
sheets. Instead, these are considered early mud diapirs that cross cut the
stratigraphic section (Fergusson & Frikken 2003). Basalts of the Bogolo Formation
contain low-density altered clay-rich rinds that are assumed to have enabled their
diapiric emplacement within the Adaminaby Group, and subsequent mud
diapirism of parts of the latter unit. Prendergast (2007) identified two mud diapirs
with distinct boundaries at Lilli Pilli Headland south of Batemans Bay, but
contends that the absence of clear diapiric boundaries elsewhere in the area does
not support the model of widespread mud diapirism. Furthermore, Prendergast
(2007) argued that relic bedding preserved in much of the mélange, with similarly
preserved north‒south orientations, would not be retained if it were a product of
mud diapirism that cross-cut sedimentary layering, as proposed by Fergusson and
Frikken (2003).

19
Further detailed mapping of this area, accompanied by comprehensive
structural, chemical and petrographic analyses of the greenstone and surrounding
units, is required to constrain the models for the significance of the relationships
between the units, and has been undertaken in this study.
20
CHAPTER FOUR
STRATIGRAPHY, STRUCTURE AND FACIES
This chapter provides an integrated description of the stratigraphy,
structure and petrography of all the distinguishable facies recognised within the
study area, and places them within their respective formations to enable a
comprehensive understanding of the units and their relationships. This facilitates
interpretation of their tectonic settings, and mechanisms responsible for their
emplacement (Chapter 6).
Barlings Head is a complex and poorly understood locality, previously
mapped in some detail by Frikken (1997). He recognised disrupted chert, lithic
sandstone and mudstone (turbidites), and basalt, with locally offset contacts along
several faults. Black siliceous mudstone of the Narooma Chert occurs in the east
with a presumed faulted contact with the greenstone to the west (Fergusson &
Frikken 2003). Detailed exploration and analysis of the facies variants that occur
at Barlings Head and at Melville Point enables previously proposed correlations
between the units in these headlands to be tested. Much more detailed mapping
than previously possible has been undertaken over the eastern part of the Melville
Point headland and the western part of the Barlings Head platform north of
Barlings Island, using the rectified digital aerial photographs as a base and a GPS
instrument (e.g. Figure 4.1).
Stratigraphic and structural relationships in subduction zones and
accretionary complexes have long been documented (Karig & Sharman 1975).
The study of active sites of subduction provides a modern analogue for identifying
and understanding ancient subduction zones and complexes, and their tectonic
settings. Accretionary complexes are characterised by significant deformation and
faulting, with formation of imbricate thrust slices of sediments scraped off the
down-going plate; typically ocean floor volcanic rocks, pelagic sediments (chert,
hemipelagic shales) and turbidites (Shipboard Scientific Party 2001). This
characteristic stratigraphy is observed in outcrop at Melville Point. While Barlings

21
Head superficially also conforms to this stratigraphic model, with characteristic
deformation and accreted oceanic units, closer examination in the course of this
study has revealed that the outcrop has significantly more complex lithologies and
structures than previously thought (Fergusson & Frikken 2003).
4.1 Melville Point
Stratigraphic relationships between the rock units at Melville Point are
relatively straight forward (Figure 4.1). Melville Point is recognised as a
stratigraphic succession with a faulted base between the Wagonga Group and
Adaminaby Group in the east (Fergusson & Frikken 2003; Fergusson 2003;
Prendergast 2007). The greenstones of the Wagonga Group are overlain by a
coherent stratigraphic sequence of well-bedded, highly folded chert and mudstone
of the Narooma Chert. In turn, the Narooma Chert is conformably overlain by
quartzose turbidites of the basal Adaminaby Group, with another lense of
Narooma Chert lithologies occurring within the Adaminaby Group turbidites further
to the west (Figures 4.1 and 4.2).
The succession dips steeply to the west and abundant mesoscale tight to
isoclinal folds occur in the Narooma Chert. The contact between the Narooma
Chert and underlying greenstone is also tightly folded. Melville Point is an
important geological locality because of the well exposed contact between the
Narooma Chert and the Adaminaby Group.
Conodonts have been identified in thick sections from a thin chert layer in
the Adaminaby Group in the western part of the rock platform and indicate a latest
Cambrian to earliest Ordovician age (Bischoff and Prendergast 1987). This age is
consistent with the minimum age of detrital zircons extracted from sandstone
samples from the Adaminaby Group at this locality (Fergusson et al. 2013).
22
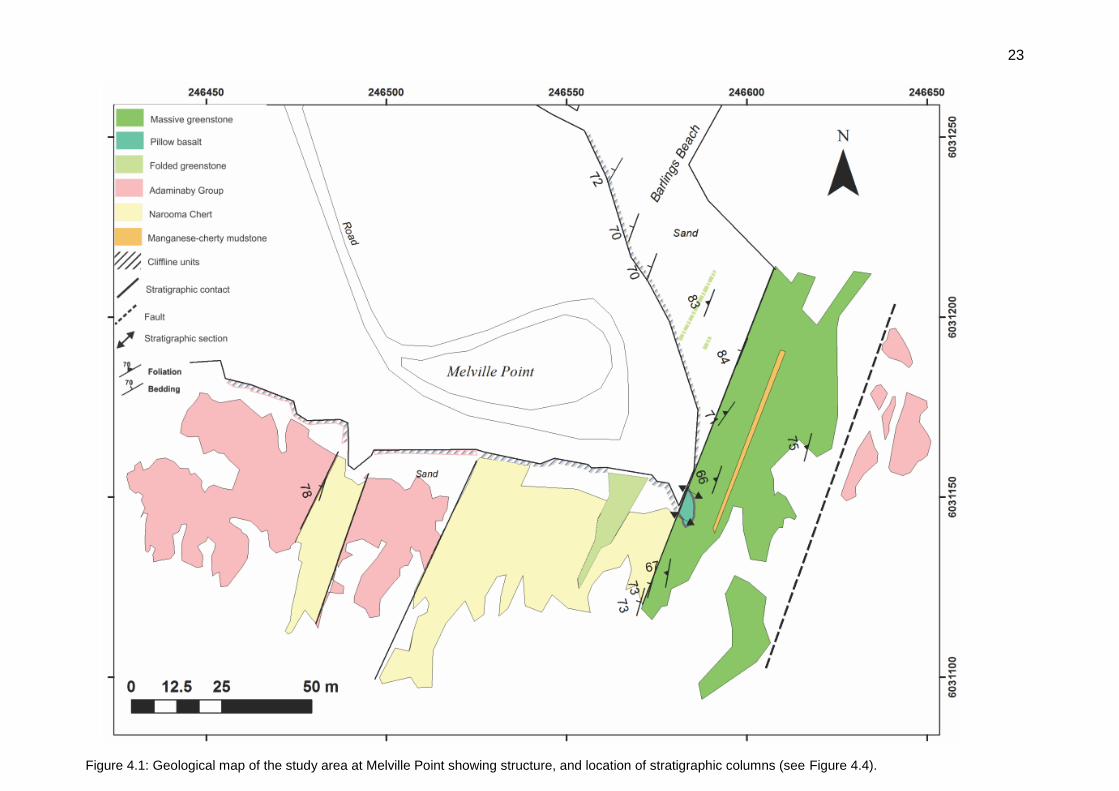
4.1.2 Facies
The following facies comprise the eastern part of the rock platform mapped in
detail in this thesis at Melville Point (MP):-
- MP massive greenstone
- Manganese-cherty mudstone
- MP pillow greenstone
- MP folded greenstone
- Melville Point massive greenstone
The massive greenstone unit occurs as a prominent ~30 m wide outcrop,
trending north-northeast to south-southeast, on the southeastern side of the rock
platform at Melville Point (Figures 4.1 and 4.2). It is a fine-grained foliated unit
with speckled-green, altered mineral inclusions and rare occurrences of thin
siderite veins, green mineral veins and brown weathering, transitional to a more
intensely foliated pebbly/conglomerate layer in the west with some intermittent
thin cherty bands and possible volcanic rock fragments up to 20 cm long.
Relic primary textures of highly altered ferromagnesian and felspathic
minerals are visible in thin section, however, no substantial primary mineral has
been preserved to enable identification (Figure 4.3a). Alteration of the primary
minerals in the massive greenstone has caused the unit to be dominated by
secondary clay minerals (79.3%), predominantly illite-muscovite (63.5%). Chlorite
is also significant alteration component (9.9%), together with kaolin (5.9%), as
shown by XRD analysis (Table 4.1).
Two stratigraphic sections were measured and documented in detail
between the massive greenstone unit and the Narooma Chert (Figure 4.4).
.
23
Figure 4.1: Geological map of the study area at Melville Point showing structure, and location of stratigraphic columns (see Figure 4.4).
24
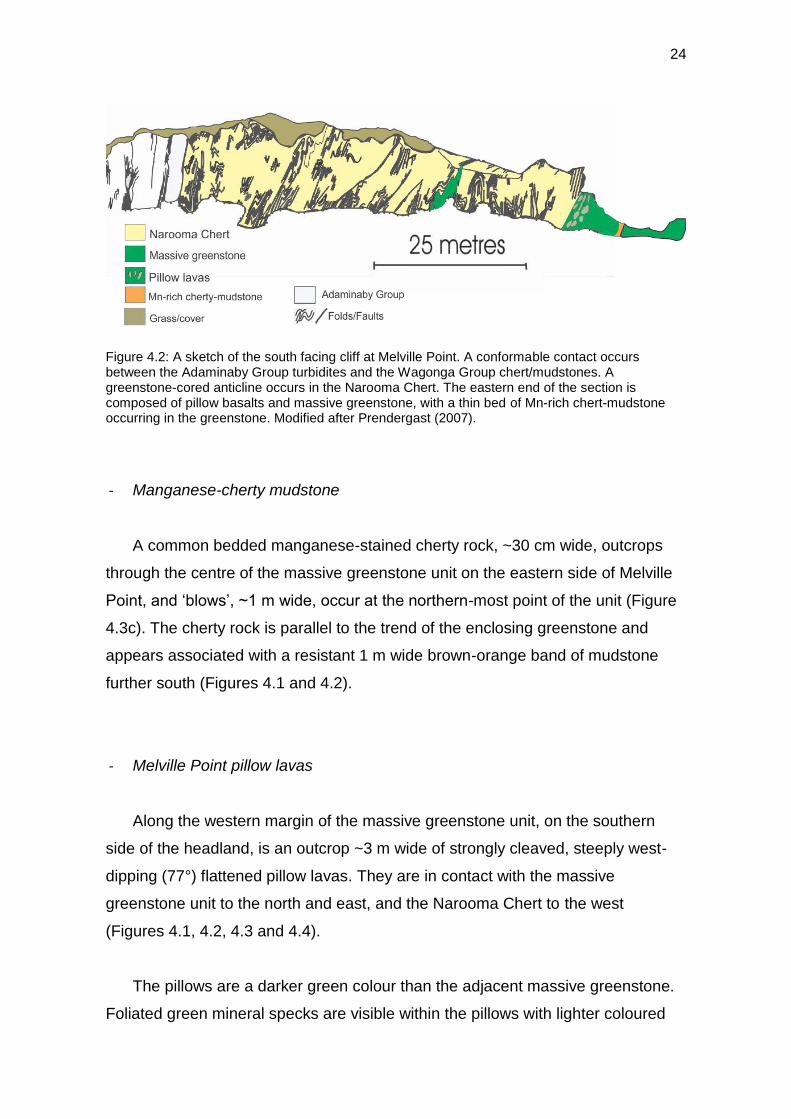
Figure 4.2: A sketch of the south facing cliff at Melville Point. A conformable contact occurs between the Adaminaby Group turbidites and the Wagonga Group chert/mudstones. A greenstone-cored anticline occurs in the Narooma Chert. The eastern end of the section is composed of pillow basalts and massive greenstone, with a thin bed of Mn-rich chert-mudstone occurring in the greenstone. Modified after Prendergast (2007).
- Manganese-cherty mudstone
A common bedded manganese-stained cherty rock, ~30 cm wide, outcrops
through the centre of the massive greenstone unit on the eastern side of Melville
Point, and ‘blows’, ~1 m wide, occur at the northern-most point of the unit (Figure
4.3c). The cherty rock is parallel to the trend of the enclosing greenstone and
appears associated with a resistant 1 m wide brown-orange band of mudstone
further south (Figures 4.1 and 4.2).
- Melville Point pillow lavas
Along the western margin of the massive greenstone unit, on the southern
side of the headland, is an outcrop ~3 m wide of strongly cleaved, steeply west-
dipping (77°) flattened pillow lavas. They are in contact with the massive
greenstone unit to the north and east, and the Narooma Chert to the west
(Figures 4.1, 4.2, 4.3 and 4.4).
The pillows are a darker green colour than the adjacent massive greenstone.
Foliated green mineral specks are visible within the pillows with lighter coloured
25
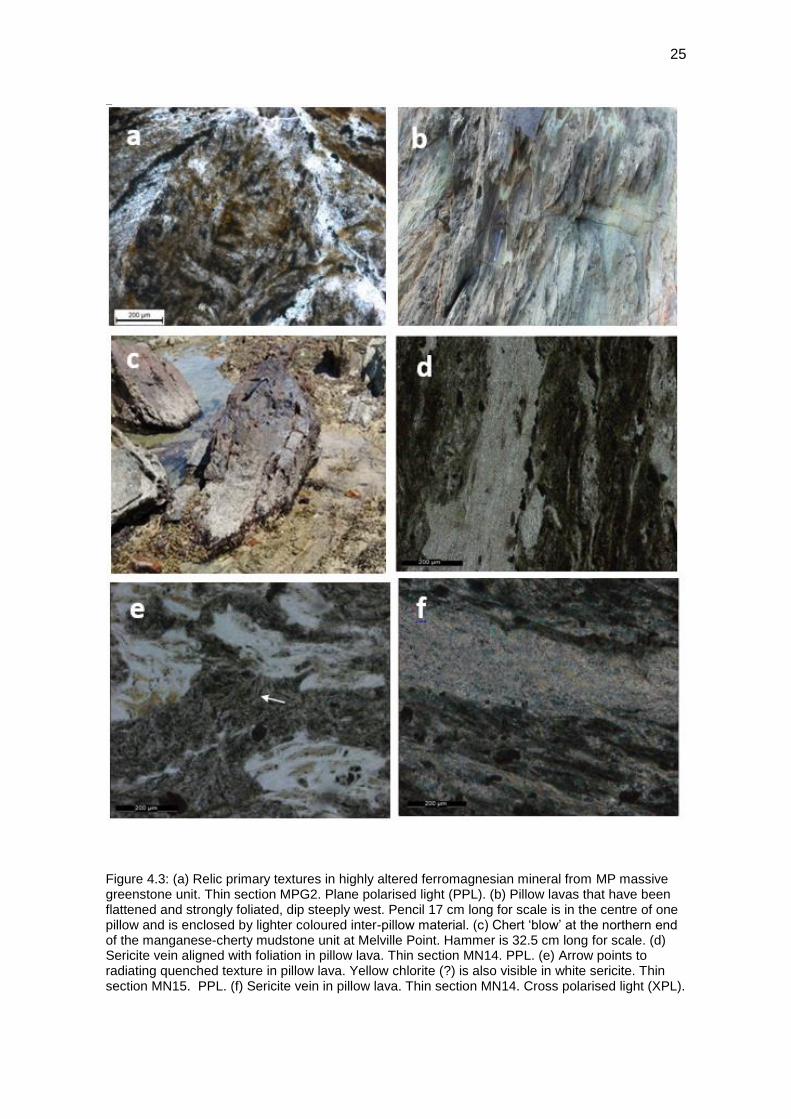
Figure 4.3: (a) Relic primary textures in highly altered ferromagnesian mineral from MP massive greenstone unit. Thin section MPG2. Plane polarised light (PPL). (b) Pillow lavas that have been flattened and strongly foliated, dip steeply west. Pencil 17 cm long for scale is in the centre of one pillow and is enclosed by lighter coloured inter-pillow material. (c) Chert ‘blow’ at the northern end of the manganese-cherty mudstone unit at Melville Point. Hammer is 32.5 cm long for scale. (d) Sericite vein aligned with foliation in pillow lava. Thin section MN14. PPL. (e) Arrow points to radiating quenched texture in pillow lava. Yellow chlorite (?) is also visible in white sericite. Thin section MN15. PPL. (f) Sericite vein in pillow lava. Thin section MN14. Cross polarised light (XPL).

26
interpillow material. The pillows lavas have been flattened and altered during
deformation into elongate pillow-shapes with a strong, west dipping foliation
overprinting them (Figure 4.3b).
- Melville Point folded greenstone
Highly altered greenstone occurs along the south side of the headland
occupying the core of multiple z-shaped east-verging folds with a steeply west-
dipping, axial planar foliation, within the overlying Narooma Chert. They also
occur on the northeast side of the headland where greenstone is exposed in the
cores of several anticlines in the cliff and on the beach. As the greenstone is less
resistant than the surrounding Narooma Chert, it has been weathered more
readily, causing the cores of the folds to be partially hollowed out.

27
Figure 4.4: Stratigraphic columns for two sections across the southeastern part of Melville Point. The southern-most section (a) crosses ~E-W, starting location S 35.119460 E 150.123463. In (b) section crosses ~E-W on east side of headland, 5-10 m north of (a), starting location S 35.109469
E 150.1234654.
A. B.

28
4.2 Barlings Head
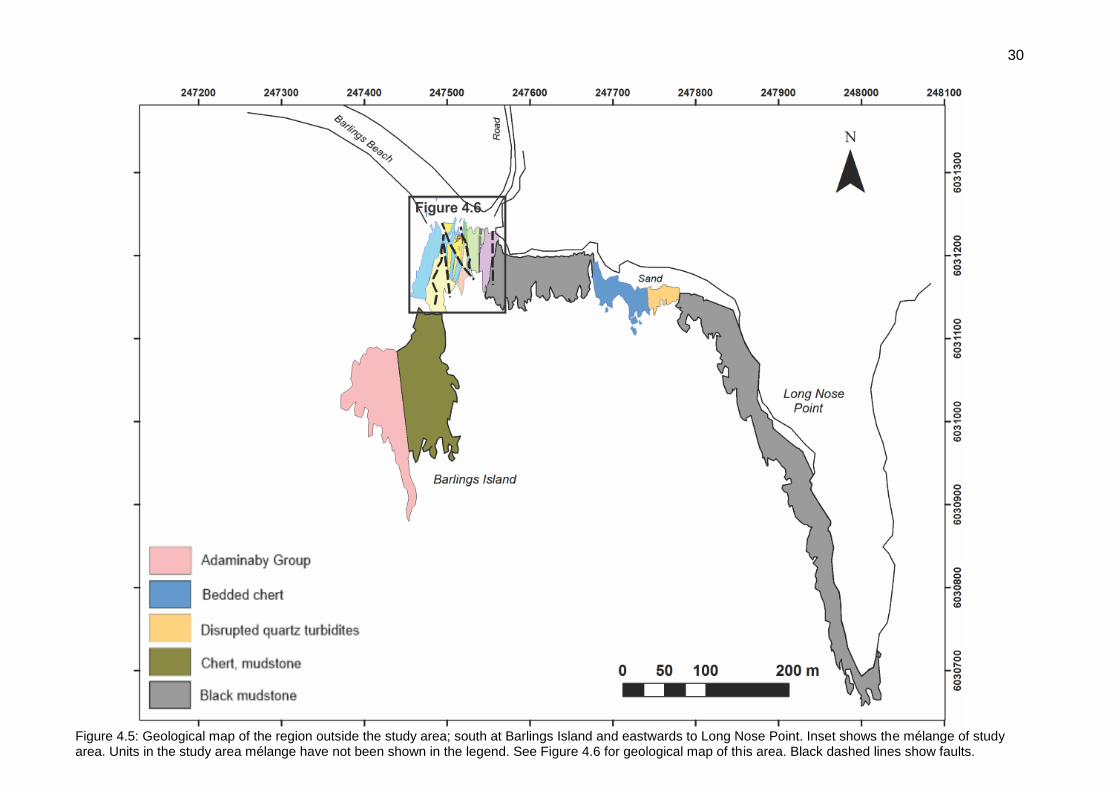
Most of the rock platform at Barlings Head to Long Nose Point (Figure 4.5) is
dominated by faulted units of black mudstone and chert of the Wagonga Group.
These rocks lack fossil age control but further north along the coast contain Late
Ordovician graptolites at two localities (Jenkins et al. 1982). The rock platform at
the western end of Barlings Head and Barlings Island includes a disrupted
assemblage of rocks units that are similar to the stratigraphic assemblage at
Melville Point, with basal greenstone overlain by chert and mudstone of the
Narooma Chert which, in turn, is overlain by Adaminaby Group turbidites. Mapping
of this part of the rock platform at Barlings Head by Frikken (1997) recognised
greenstone in faulted contact with black mudstone to the east. West of the
greenstone he documented disrupted chert-mudstone, with fault slivers of lithic
sandstone and mudstone (turbidites), in faulted contact with quartzose turbidites of
the Adaminaby Group to the southwest on Barlings Island (Figure 4.5).
In this study, it has been found that greater complexity occurs in the
exposures at the western end of Barlings Head than previously considered. The
key distinction between Melville Point and the western end of Barlings Head is the
complex outcrop of mixed and disrupted units that occurs in the centre of this
sequence (Figures 4.5 and 4.6). The array and arrangement of facies that outcrop
in this area, including several different types of turbidites, chert and greenstone, do
not follow the conventional sequence seen in imbricated ocean plate successions
from oldest to youngest rocks; basaltic basement overlain by progressively younger
layers of (hemi)pelagic chert and mudstones, to upward coarsening and thickening
mudstone and sandstone turbidites (Taira et al. 1992).Overall, the outcrop is
referred to as a mélange, which has undergone a multifaceted and highly disruptive
tectonic development, resulting in many different rock types to be juxtaposed.
As the units in the mélange have tectonised contacts, they are described in
terms of structural rather than stratigraphic relationships. Inferred Late Ordovician
black mudstone to the east is structurally overlain, with faulted contacts, by a mixed
chert and brown mudstone unit, and a narrow zone ~5 m across of mélange with a

29
matrix of black mudstone, andquartz sandstone lenticular fragments, and
greenstone fragments and injections. The mélange has an inferred faulted contact
with a massive greenstone unit to the west (Figure 4.6). Westward of this
greenstone unit, discontinuous units of mudstone, lithic sandstone and disrupted
chert occur irregularly across the breadth of the rock platform. An antiform outcrops
in the centre of the mélange, with a mudstone core that is folded within overlying
disrupted chert. Several anastomosing faults also are present cutting across the
mélange as shown by offset units across them (Figure 4.6). The faults form sand-
filled gutters across the rock platform and were considered by Frikken (1997) to
have strike-slip displacement, although the faults themselves are too poorly
exposed to be sure of this.
30
Figure 4.5: Geological map of the region outside the study area; south at Barlings Island and eastwards to Long Nose Point. Inset shows the mélange of study area. Units in the study area mélange have not been shown in the legend. See Figure 4.6 for geological map of this area. Black dashed lines show faults.

31
4.2.1 Facies
The following facies comprise the mélange zone at Barlings Head (BH):-
- Black mudstone
- Mixed brown mudstone, bedded chert
- Black mudstone, quartz sandstone and greenstone mélange
- BH massive greenstone
- Intermingled turbidites, greenstone and chert
- Disrupted chert and mudstone
- Interbedded lithic sandstone and minor mudstone (turbidites)
- Clay-rich siliceous mudstone
- Iron-rich mudstone
- Lithic mudstone
- Black mudstone
Black mudstone occurs as an extensive, ~120 m wide, well-bedded outcrop on
the headland and adjacent rock platform, in the east at Barlings Head (Figure 4.6).
The facies is composed of steeply west-dipping (~81°) black mudstone beds that
are commonly interlaminated with thin layers of white mudstone. The unit has a
well-developed slaty fabric at a high angle (~89°) to the bedding in the fold hinges,
while limbs are subparallel or at a low angle <10°, and a crenulation cleavage at a
low angle to the slaty cleavage, related to later deformation (Figure 4.7 and 4.8).
Lensoidal orange concretions of mudstone with iron oxides also occur in the unit
and range from 10–50 cm in diameter. These are developed intermittently
throughout the unit and have resulted from precipitation of minerals from the black
mudstone and their concentration into commonly concave iron oxide rich pods,
which subsequently have been weathered in the surface environment.
Thin section analysis shows the unit is dominated by very fine rounded to sub-
rounded grains of recrystallised quartz and contains common iron oxides (Figure
4.9a). Carbon is responsible for the mudstone’s distinctive black colouration.

32
Figure Figure 4.6: Geological map of the mélange at Barlings Head. Location of the cross section (Figure 4.8) is shown.

33
Figure 4.7: Structural map of the mélange at Barlings Head.

34
Figure 4.8: Cross section through the mélange at Barlings Head, showing faults, cleavage and
bedding. Location of the cross section, structure and key to the lithologies is shown in Figures 4.6
and 4.7.
- Mixed brown mudstone and bedded chert
Directly west of the black mudstone unit lies a mixed zone of thin chert
(siliceous) beds amongst brown weathered mudstone. The chert beds are lenticular
to boudinaged and lie parallel to the prevailing steeply west-dipping cleavage (79-
88°), with some beds displaying local tight folding. The unit has undergone intense
weathering resulting in imperceptible bedding in the mudstone. Greenstone
injections occur at the northern end of the outcrop near the contact with overlying
sand. They appear more altered than greenstones injections that occur elsewhere
in the mélange.
- Black mudstone, quartz sandstone and greenstone mélange
This facies occurs as a ~3 m wide zone of mélange along the eastern contact
of the adjacent mixed chert and mudstone unit (Figure 4.6). The mélange consists
primarily of a matrix of black siliceous mudstone enclosing randomly distributed
discontinuous layers of quartz sandstone (several per m2) 10 cm to 50 cm long,
with elongate injections (0.5-4 m long) of slaty greenstone. The black mudstone
has the appearance of a flow fabric, with an overprinting north–south striking
35
foliation that has intensified the parallel alignment of the sandstone fragments and
the cleavage (Figure 4.9c-f).
The injected greenstone is a greenish-grey fine grained basaltic rock that
displays a strong vertically dipping foliation and occurs as discontinuous lenticular
fragments and injections through the black mudstone. Small scale injections and
mixing occur along the contacts between the black mudstone and injected
greenstone. The greenstone is highly altered and contains clay-rich vesicular
fragments (Figure 4.9f). The mélange forms an irregular contact with the foliated
greenstone unit to the west and similarly with the mixed zone of chert/weathered
mudstone to the east.
Thin section analysis of the quartz sandstone shows aligned clasts which
indicate the clear fabric, composed of poorly sorted fine to coarse grains of quartz
that display a subrounded to rounded nature. Quartz grains are mainly
monocrystalline displaying undulose extinction, and mica flakes occur between
quartz grains (Figure 4.10). The injected greenstone displays a strong foliation in
thin section, that is defined by chlorite, and has no primary textures or minerals
evident (Figure 4.10).
- Barlings Head massive greenstone
The Barlings Head massive greenstone unit (Figure 4.9b) is a 10 m wide
outcrop of light greenish fine-grained rock that has been intensely altered from an
initial basic igneous rock. It has a near-vertical dipping (82‒90°) north-south
foliation, and primary minerals are replaced by secondary clay minerals which
dominate the rock composition. The unit forms an irregular contact partially
covered by sand with the jumbled mudstone/chert/ and injecting greenstone unit to
the west.

36
Figure 4.9: (a) Fine, rounded to sub rounded grains of recrystallised quartz in black mudstone.
Brown iron oxides can be seen in the lower-right of the image. XPL. Thin section N.11. (b) Massive
greenstone outcrop at Barlings Head, looking south. Contacts with black mudstone to east and disrupted chert/mudstone to west. Unit is ~10 m wide. (c) Looking south at mélange of black mudstone with small quartz sandstone pods and lighter coloured injecting greenstone. (d) Quartz sandstone pod in black mudstone, with lighter coloured greenstone injecting into the black mudstone. Note flow fabric of black mudstone around the sandstone. (e) Quartz sandstone fragment in black mudstone unit. (f) Clay-rich vesicular fragments/clasts in foliated injecting greenstone. Hammer is 32.5 cm for scale.
f

37
Figure 4.10: (a), (b), (c) and (d) Quartz sandstone from intermingling unit at Barlings Head, in plane-polarised PPL and cross-polarised light XP). Subrounded - rounded, poorly sorted, fine - coarse grains of quartz dominate. Aligned clasts indicate the fabric. Thin section N.12. (b) Undulose extinction of quartz grains is visible in upper right of image. (c) Micas with a high birefringence are visible between quartz grains. XPL. (d) Fabric is clearly displayed in quartz sandstone. PPL. (e) Strong foliation visible in injected greenstone. No primary textures are visible due to extensive
alteration. Thin section N.10. PPL.

38
- Intermingled turbidites, greenstone and chert
A complex zone of mixed mudstone and injected greenstone with intermittent
beds of lenticular – boudinaged chert occurs along the western contact of the
massive greenstone unit, east of the disrupted chert band with a benchmark
(Figure 4.6). The unit is composed mainly of cleaved mudstone with thin (<10 cm)
siliceous beds, in which cleavage dip is parallel to bedding dip (Figure 4.7). Small
clay-rich injections of light-coloured greenstone occur in the mudstone at the
northern end of the outcrop and have a vertical foliation similar to the enclosing
mudstone-chert unit. The outcrop continues on the southern side of the north-
northwest trending fault, however the unit here has been more exposed to
weathering and is also more obstructed by seaweed and sand. Thin chert beds are
also present here with bedding parallel to the steeply dipping cleavage (dip of 86°)
and some small pods of sandstone occur strewn throughout the mudstone. In the
south the unit is in contact with interbedded lithic sandstone and mudstone to the
west and more disrupted chert to the east.
- Disrupted chert
This unit occurs as a chert mélange, with disrupted chert beds set in a siliceous
mudstone matrix occurring as elongate outcrops parallel to the regional north-south
striking foliation. Outcrops are scattered across the breadth of the rock platform and
eastern part of the beach. The light grey to black chert beds are 1 cm to 2.5 m in
length and up to 40 cm wide, and have been stretched into boudinaged fragments.
The unit displays a generally very steep foliation (82‒90°) dipping to the west, but
local irregularities occur as gentler dips and slight changes in dip direction.
Disrupted lenticular layering with late folds having axial planes dipping moderately
southwest (10°) (Figure 4.11a) occur along the main chert bar with the concrete
benchmark in the east, while in a chert rib outcrop to the west lenticular layering is
folded about the main cleavage (Figure 4.11b). Along the major northwest fault that
cross-cuts the rock platform, the disrupted chert and surrounding units have
39
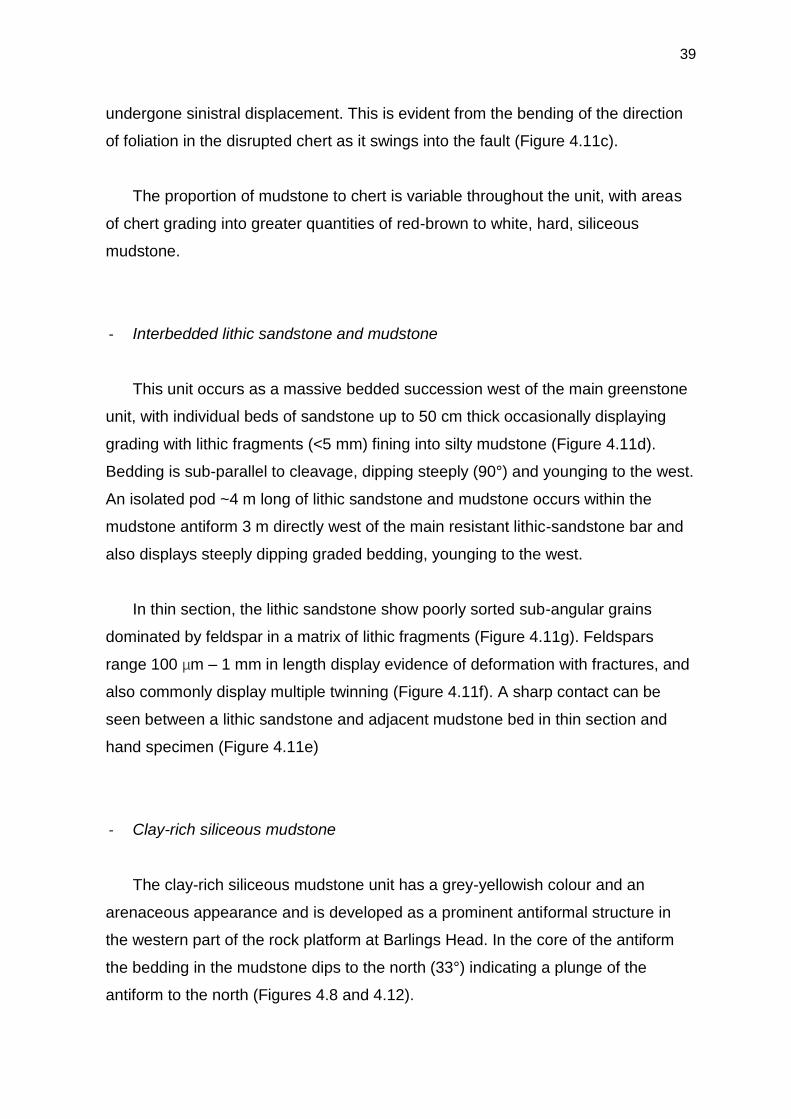
undergone sinistral displacement. This is evident from the bending of the direction
of foliation in the disrupted chert as it swings into the fault (Figure 4.11c).
The proportion of mudstone to chert is variable throughout the unit, with areas
of chert grading into greater quantities of red-brown to white, hard, siliceous
mudstone.
- Interbedded lithic sandstone and mudstone
This unit occurs as a massive bedded succession west of the main greenstone
unit, with individual beds of sandstone up to 50 cm thick occasionally displaying
grading with lithic fragments (<5 mm) fining into silty mudstone (Figure 4.11d).
Bedding is sub-parallel to cleavage, dipping steeply (90°) and younging to the west.
An isolated pod ~4 m long of lithic sandstone and mudstone occurs within the
mudstone antiform 3 m directly west of the main resistant lithic-sandstone bar and
also displays steeply dipping graded bedding, younging to the west.
In thin section, the lithic sandstone show poorly sorted sub-angular grains
dominated by feldspar in a matrix of lithic fragments (Figure 4.11g). Feldspars
range 100 µm – 1 mm in length display evidence of deformation with fractures, and
also commonly display multiple twinning (Figure 4.11f). A sharp contact can be
seen between a lithic sandstone and adjacent mudstone bed in thin section and
hand specimen (Figure 4.11e)
- Clay-rich siliceous mudstone
The clay-rich siliceous mudstone unit has a grey-yellowish colour and an
arenaceous appearance and is developed as a prominent antiformal structure in
the western part of the rock platform at Barlings Head. In the core of the antiform
the bedding in the mudstone dips to the north (33°) indicating a plunge of the
antiform to the north (Figures 4.8 and 4.12).

40
Figure 4.11: (a) Disrupted lenticular layering with late folds along disrupted chert bar (with benchmark). (b) Disrupted lenticular layering is folded about main cleavage in chert. Brunton compass is 15 cm long, Top of the GPS unit visible is 7 cm wide for scale (c) Chert foliation swings into fault indicating sinistral shearing along the fault. (d) Photograph of interbedded lithic sandstone and mudstone. (e) Close up of sandstone/mudstone contact. Coarse-grained lithic sandstone on left grades into silty mudstone (note sample has been cracked). (f) Feldspar grains show multiple twinning and fractured grains. XPL. (g) Poorly-sorted feldspar grains in a matrix dominated by recrystallised lithic fragments. PPL. Thin section N.1.

41
The unit also outcrops as a high relief band on the northern side of the north-
northwest fault, along the western contact of the massive greenstone unit, where
it has a well-developed steeply east dipping (80‒87°) foliation (Figure 4.12).
Additional outcrops of the clay-rich siliceous mudstone occur irregularly on the
southern side of the prominent northwest-trending fault and on the far western
side of the rock platform (Figure 4.6).
Figure 4.12: Enlarged geological map showing structure of the antiform with a core of clay-rich siliceous mudstone and iron-rich mudstone that is folded with overlying disrupted chert. Bedding in
core of antiform dips north 33°.
42
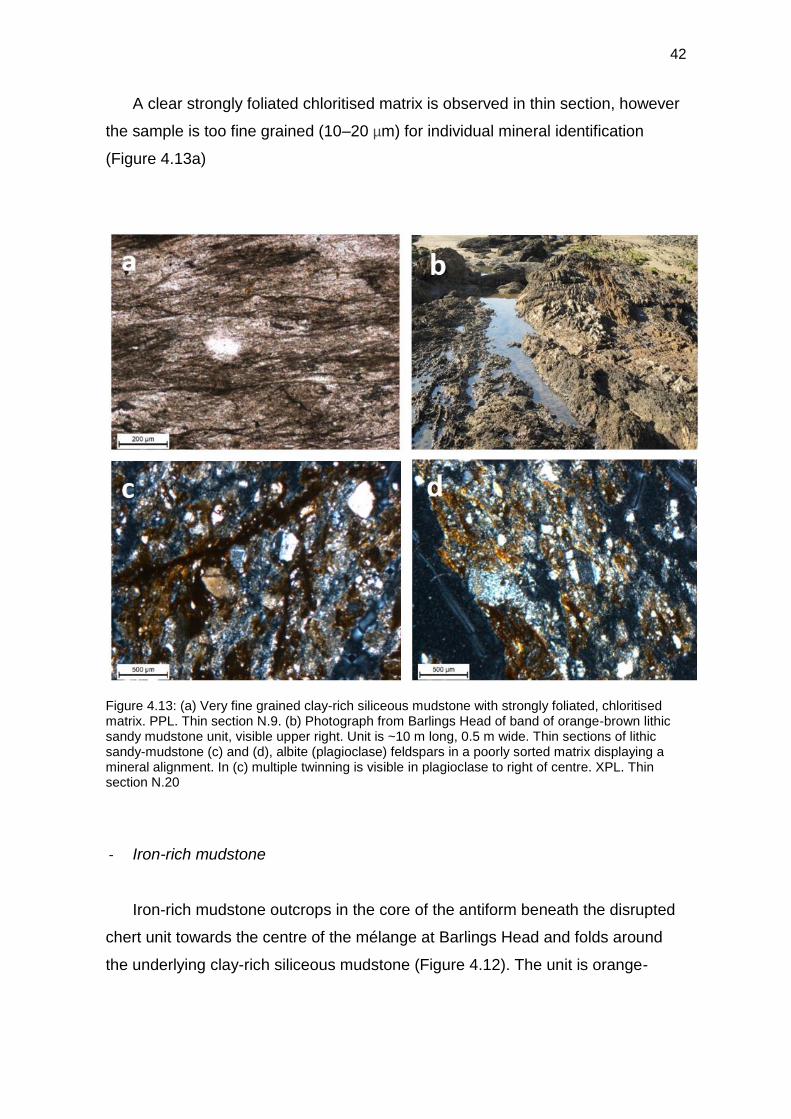
A clear strongly foliated chloritised matrix is observed in thin section, however
the sample is too fine grained (10‒20 µm) for individual mineral identification
(Figure 4.13a)
Figure 4.13: (a) Very fine grained clay-rich siliceous mudstone with strongly foliated, chloritised matrix. PPL. Thin section N.9. (b) Photograph from Barlings Head of band of orange-brown lithic sandy mudstone unit, visible upper right. Unit is ~10 m long, 0.5 m wide. Thin sections of lithic sandy-mudstone (c) and (d), albite (plagioclase) feldspars in a poorly sorted matrix displaying a mineral alignment. In (c) multiple twinning is visible in plagioclase to right of centre. XPL. Thin section N.20
- Iron-rich mudstone
Iron-rich mudstone outcrops in the core of the antiform beneath the disrupted
chert unit towards the centre of the mélange at Barlings Head and folds around
the underlying clay-rich siliceous mudstone (Figure 4.12). The unit is orange-

43
brown and more resistant than the underlying mudstone, and displays greater
relief in the field.
- Lithic sandy-mudstone
Lithic sandy-mudstone outcrops as an orange-brown resistant strip up to 60
cm wide along the western contact of the massive greenstone unit (Figures 4.6
and 4.13b). It has a moderate (56°) to steeply west-dipping foliation. In thin
section, sub-angular plagioclase feldspars are dispersed throughout the poorly-
sorted matrix which displays a mineral alignment typical of the foliation in these
rocks (Figure 4.13c, d).
4.2.2 X-Ray Diffraction Results
X-ray diffraction results for the different facies are shown in Table 4.1 and
Table 4.2. XRD analysis was only conducted on one sample of the black
mudstone at Barlings Head. More work is needed to document the mineralogical
variations in this unit given that it contains local laminated layers of white
mudstone and iron oxide concretions. The XRD analysis of the single sample
showed non-expanding clays dominate the rock composition (~49.4%), with a
major proportion of this comprised of illite-smectite (47.4%) with minor chlorite
(1.6%) and kaolin (0.4%). Quartz amounts to 47.7% of the total, alongside minor
albite (2%), and pyrite (1%) which may account for iron oxides evident in thin
sections and iron oxide concretions in the outcrop.
The quartz sandstone from the zone of mélange in the eastern part of the
mapped area at Barlings Head (Figure 4.6) has an assemblage comprising quartz
(67%), albite (11%), muscovite (10%), siderite (4%), and chlorite, illite, kaolin,
pyrite and biotite (<15%). The injected greenstone from this mélange has been
subject to extensive alteration with feldspars dominating the composition (albite
57%), abundant clay minerals consisting of mixed layer clays (13%), illite (7%)
and kaolin (2%), with only minor quartz (12%).

44
XRD analysis of the disrupted chert unit shows a low mineralogical quartz
content for chert (80%) with significant illite-muscovite (15%), kaolin (4%) and
chlorite (6%), along with siderite and pyrite (<1%), indicating that they are impure
cherts.
XRD analysis of the lithic sandstone shows quartz is only a minor component
in the mineral assemblage (21%) while albite is dominant comprising 56% of the
mineral assemblage. Muscovite (11%), kaolin (7%) and chlorite (4%) form the
remainder of the mineralogy assemblage.
The quartz dominated clay-rich siliceous mudstone (54-57% quartz) unit is
rich in clay minerals (45%) with muscovite-illite (32.9-39.2%), chlorite (2.5-4.6%),
kaolin (2-2.9%) and smectite (3.9%), and less abundant pyrite (1.1%).
In the lithic sandy-mudstone unit, albite is dominant (42.4%) whilst quartz is low at
31.8% and is followed by an abundance of secondary clay minerals including
muscovite-illite (16.7%), chlorite (2.4%), kaolin (4.4%) and mixed-layer clays
(2.4%).
A small carbonaceous rock that occurs next to the antiform was also
analysed, and is dominated by quartz (64.9%), muscovite (15.3%), and is high in
mixed-layer clays (6.9%).

45
Table 4.1: X-ray diffraction results for rock samples from units at Barlings Head (N2 – N21) and
Melville Point (MPG1a, b, c).
Table 4.1: (continued)
Sample N2 N3 N7 N9 N10 N11 N12 N14 N15
Rock type Lithic
sandstone
Clayey siliceous mudstone
Cherty mudstone -mixed unit
Clayey siliceous mudstone
Injected greenstone
Black mudstone
Quartz sandstone
Carbon. rock
Clayey siliceous mudstone
Chi Squared 4.22 3.26 2.81 3 2.13 3.4 3.21 1.98 3.41
Quartz 20.9 53 80 54.1 12.4 47.7 66.6 64.9 56.6
Albite 56.3 0.6 0 0.2 54.7 2 11.3 2.6 0
Muscovite 11.4 39.5 12.3 34.4 1.4 38.8 9.3 15.3 26.2
Chlorite 4.1 2.6 0.5 2.5 5.9 1.6 0.4 2.4 4.6
Kaolin 7 3.3 3.9 2.9 2 0.4 0.5 3.9 2
Illite 0 0 2.9 4.8 6.8 8.6 1.6 4 6.7
Siderite 0 0 0.1 0 0 0 3.6 0 0
Pyrite 0.4 1 0.4 1.1 3.4 1 0.2 0 0
Mixed layer clays
0 0 0 0 13.4 0 0 6.9 3.9
Goethite 0 0 0 0 0 0 0 0 0
Biotite 0 0 0 0 0 0 6.4 0 0
Sample N20 N21 MPG1a MPG1b MPG1c
Rock type Lithic sandy -mudstone
Clayey siliceous mudstone
Massive greenstone
Brown vein ?Siderite
Green vein
Chi Squared 4.15 3.22 4.75 3.18 5.03
Quartz 31.8 53.9 20.4 67.3 30.4
Albite 42.4 0 0 1.9
Muscovite 14.3 37.8 63.5 0.2 26.3
Chlorite 2.4 1.9 9.9 0.5
Kaolin 4.4 2.5 5.9 3.6 0.4
Illite 2.4 2.9 0 4.6 42.9
Siderite 0 0 0 0.6 0
Pyrite 0 1 0.2 0.8 0
Mixed layer clays
2.4 0 0 4.3 0
Goethite 0 0 0 15.6 0
Biotite 0 0 0 0 0
46
CHAPTER 5
GEOCHEMISTRY
This chapter provides a detailed analysis and description of the
geochemistry of the mafic volcanic rocks and deep marine sedimentary
successions that include turbidites, chert and pelagic rocks, of the Wagonga
Group that outcrop within the study area. As these units have all experienced
intense deformation and alteration, interpreting the evolutionary relationships and
primary mineralogy of the units is difficult. Whole-rock geochemistry is important
for understanding the protolith origin, depositional environment and geodynamic
setting in which they were emplaced.
Previous studies of the Narooma Accretionary Complex have analysed the
geochemistry of the Wagonga Group basalts from the basaltic breccia unit at
Burrewarra Point, and further north towards Batemans Bay, and the basaltic
breccia and pillow basalts from Narooma (Prendergast & Offler 2012). However,
geochemical data for the basalt (greenstone) and surrounding sedimentary units
of the Wagonga Group from the outcrops at Melville Point and Barlings Head,
have not been documented prior to the present study.
5.1 Volcanic Units
Two samples of the massive greenstone and two samples of the injected
greenstone units from Barlings Head, along with a single sample of the Melville
Point massive brecciated greenstone and four samples of the Melville Point pillow
greenstones, were analysed for whole rock geochemistry (major and trace
elements) by laboratory based X-ray fluorescence (XRF). Chemical data is
presented in Table 5.1. Additionally, 25 hand-held XRF measurements were taken
across the greenstone units, for which the average and range of data is shown in
Table 5.2 and full results in Appendix E. The sensitivity of the hand-held XRF
47
instrument is reduced on rocks that are porous, wet, and/or have a weathered
crust. These influences have been considered when interpreting the data.
High loss on ignition values across all non-basaltic samples (5.3‒8.7%) but
particularly in the mafic volcanic rocks (6.45‒12.18%) indicate a high degree of
alteration of the rocks with contribution principally from secondary hydrated
phases and are consistent with the interpretation that the Wagonga Group has
been subject to lower greenschist facies metamorphism during subduction (Offler
et al. 1998; Prendergast et al. 2011). Due to strong alteration of the samples,
many major and trace elements are likely to vary from their initial concentrations
as they are remobilised during secondary processes. As such, interpretation of
the geochemical results has relied on the use of relatively immobile incompatible
elements or high field strength (HFS) elements such as Ti, Y, Zr, Nb, Th, and their
ratios, as these are considered stable under most metamorphic and alteration
events. Incompatible low field strength (LFS) elements such as K, Na, Ca and Ba,
however, have not been used as these may be mobilised during such events
(Rollinson 1993). Na and Cl values are influenced by the coastal location of the
units and exposure to salt water, so their true quantity in the rocks has not been
determined by either the hand-held XRF or laboratory XRF.
All volcanic units analysed by laboratory XRF show elevated TiO2, Fe2O3,
MgO and V concentrations which suggest their mafic chemistry (Winter 2010).
Fe2O3 concentrations are variable, ranging from ~11‒17% at Barlings Head, and
~5-8% at Melville Point. MgO is less variable ranging 3.3‒5.5% across both
greenstone localities. Al2O3 concentrations are high ~16‒25%, and show some
scatter within the Melville Point greenstones (20.9‒24.4%). The significant K2O
content in the Barlings Head massive greenstone (~4%), and the Melville Point
greenstones (~6%) are greater than in fresh volcanic rocks (Miyashiro 1975), and
indicates they are potassic mafic rocks that may have been altered by K-rich fluids
during early alteration (Prendergast & Offler 2012).

48
Table 5.1: Laboratory XRF whole rock geochemical data for volcanic units.
Catalogue no. HONS844 HONS845 HONS848 HONS851 HONS855 HONS856 HONS857 HONS858 HONS859
Sample no. BN1 BN2 BN32 BN36 MPG2 MN12 MN13 MN14 MN15
Rock type BH massive
BH massive
BH injected
BH injected
MP massive
MP pillows
MP pillows
MP pillows
MP pillows
Major elements (wt. %)
SiO2 47.33 49.32 43.25 48.86 54.77 52.04 48.15 51.96 47.73
Al2O3 17.81 16.82 17.40 17.24 20.85 23.42 24.40 22.00 23.55
K2O 4.02 3.76 2.48 2.21 4.67 5.97 6.67 5.65 5.80
*Fe2O3 11.74 10.98 17.42 11.57 8.01 6.13 4.57 5.21 7.32
TiO2 2.72 2.55 1.14 2.40 1.54 1.32 1.39 1.28 1.34
Na2O 1.49 1.65 0.69 4.32 0.35 0.59 0.76 0.68 0.61
MgO 5.52 5.30 3.58 4.69 3.34 3.48 3.64 3.65 4.87
P2O5 0.52 0.59 0.47 0.69 0.12 1.14 0.74 0.71 0.72
S 0.02 0.02 0.04 0.02 0.02 0.00 0.03 0.03 0.03
CaO 0.36 0.52 0.36 0.96 0.07 1.72 0.84 1.35 0.99
MnO 0.05 0.05 0.09 0.12 0.10 0.03 0.03 0.03 0.04
LOI 8.49 7.62 12.18 7.92 7.12 6.45 7.68 7.14 7.78
O=S -0.01 -0.01 -0.02 -0.01 -0.01 0.00 -0.01 -0.02 -0.01
Total 100.09 99.19 99.15 101.02 100.99 102.31 98.94 99.73 100.78
Trace elements (ppm)
V 278.9 246.8 417.5 206.1 581.4 440 503 514.1 688.9
Co 26.8 34.4 24.1 71.8 19.2 17.9 30.6 28.5 21
Cu 33.5 41.4 701 37.7 172.7 155.1 117.6 105.5 135.4
Zn 71.6 73.7 271.7 190.8 104.4 86.6 65.3 79.4 112.7
Ga 17.2 15.8 21.2 14.3 20.1 18.9 22.1 19.9 18.9
Ge <1 1.2 1.2 2 2.7 2.2 0.7 0.8 2.5
As 0.6 16.8 26.4 22.8 16 0.7 0.9 <1 1.9
Br 4.5 19.1 32.7 15 8.6 5.3 25.6 30.9 19.4
Rb 84.1 75 84.9 62.3 99.5 103.2 117 100.7 103.8
Sr 80.9 94.8 41.7 142.9 22.2 60.1 51.3 44.1 43.4
Y 24.1 25.7 54.8 54.7 26.6 41.4 56.9 48 48.7
Zr 236.5 221.4 101.2 213.7 89.2 62.6 71.5 67.5 72.7
Nb 73.5 68.4 4.5 64.5 6.7 4.4 4.8 4 4.6
Ba 1016 683.3 594.8 261.7 765.2 1144 1318 1105 1113
La 28 31.1 <4 66.7 12.2 <4 <4 4.3 <4
Ce <4 56.1 <4 140.7 12.3 20 20.1 9 5.3
Hf 5.1 6.5 10.7 8.3 4 4.4 3.9 4.4 3.9
Th 6.5 6.6 3 5.2 <1 0.5 <1 <1 <1
U <1 <1 <1 <1 18.2 27 30.4 19.3 55.1
*Total iron expressed as Fe2O3. Elements predominantly below detection limits were omitted (Se, Mo, Cd, Sn, Sb, Cs, Ta, W, Hg, Bi). BH = Barlings Head, MP = Melville Point .

49
Table 5.2: Average hand-held XRF whole rock geochemical data for volcanic units. UNIT Injecting Gn BH Massive Gn BH Fold Gn MP Pillow Gn MP
No. of readings (n=10) (n=6) (n=3) (n=6)
Average Range Average Range Average Range Average Range
SiO2 wt.% 14.56 3.41-38.65 14.79 8.19-22.36 52.23 48.43-56.51 35.00 13.67-66.48
Al2O3 wt.% 3.17 0.40-11.27 2.92 1.33-6.50 17.92 17.33-18.69 9.67 2.04-20.37
K2O wt.% 1.71 0.15-3.77 1.64 1.19-2.13 5.90 5.53-6.10 3.85 2.83-4.72
Fe2O3 wt.% 7.17 4.18-13.29 11.85 9.27-13.35 0.94 0.68-1.26 5.54 1.99-9.26
P2O5 0.08 0.02-0.22 0.17 0.12-0.26 0.20 0.11-0.27 0.10 0.03-0.21
CaO wt.% 4.68 0.19-31.73 1.69 1.36-2.66 0.66 0.29-1.04 0.48 0.13-0.99
TiO2 1.05 0.52-1.94 1.79 1.44-2.46 1.94 0.93-3.50 1.00 0.68-1.32
MnO wt.% 0.04 0.02-0.06 0.05 0.04-0.07 0.02 0.02-0.02 0.04 0.03-0.05
Total 32.46 14.44-69.42 34.91 24.32-48.34 79.81 74.96-82.27 55.68 22.72-88.03
Zr 139.29 32.47-207.57 197.07 182.33-233.10 89.06 48.90-160.87 61.25 44.84-81.06
S 1801.12 360.22-4329.15 4189.50 1097.29-6486.92 855.14 560.08-1026.92 649.62 276.55-1988.80
V 149.50 63.50-247.46 208.96 163.34-256.91 405.90 387.05-418.51 277.71 154.82-404.71
Cr 120.09 37.42-235.21 241.91 186.40-269.13 616.18 344.57-946.74 867.99 557.67-1309.86
Co 14.82 11.09-18.56
15.22 15.22-15.22 1.28 1.28-1.28 <LOD
Ni 29.20 15.28-73.80 65.79 49.50-79.58 22.14 16.93-30.29 39.46 21.96-71.27
Cu 108.18 41.01-277.58 63.83 45.58-109.59 28.09 16.98-34.13 154.46 82.66-229.94
Zn 270.81 87.73-906.93 271.92 204.91-374.78 20.96 17.14-23.81 314.21 133.38-574.21
As 51.14 6.59-126.12
215.88 84.94-490.30 <LOD
8.00 6.75-9.25
Se <LOD
<LOD
3.04 3.04-3.04
<LOD
Rb 70.44 30.51-156.57 122.36 35.47-196.92 62.64 56.93-70.75 121.28 54.98-205.88
Sr 82.54 29.32-126.02 97.65 48.37-123.46 46.08 34.23-57.79 29.65 17.64-43.51
Nb 27.45 2.43-59.34 52.05 34.67-67.36 17.02 6.64-25.02 5.34 0.00-8.76
Mo 3.66 2.68-4.85 <LOD
4.28 2.95-5.78
3.07 3.07-3.07
Ag <LOD
<LOD
9.79 9.79-9.79
<LOD
Cd <LOD
<LOD
29.45 29.45-29.45
<LOD
Sb <LOD
<LOD
56.09 56.09-56.09
<LOD
Ba 873.82 423.47-1762.76 815.77 515.99-1203.58 2012.70 1637.77-2235.08 1122.55 933.03-1270.47
Pb 14.74 6.95-27.17 8.97 7.57-12.94 6.57 6.38-6.75 8.70 7.61-9.79
Th 2.23 2.23-2.23 <LOD
<LOD
<LOD
U 7.10 7.10-7.10 <LOD
61.59 50.95-68.59
22.55 11.91-33.00
50
Traditional methods used to classify volcanic rocks such as the total alkali
versus silica (TAS) diagram developed by the IUGS involving SiO2, K2O and
Na2O, cannot be used for metamorphosed or extensively altered rocks, as these
elements are mobile (Le Maitre 1984). As such, this study relies on discrimination
diagrams utilising immobile high-field strength (HFS) elements that have been
developed for metamorphosed and altered igneous rocks as a means for
determining their tectonomagmatic environment.
The Ti/V classification diagram of Shervais (1982) is used to diagnose the
tectonic setting of modern volcanic associations. Ti and V are immobile HFS
elements that are relatively abundant in basaltic rocks, and Ti/V ratios are
unchanged between fresh and altered rocks. The basis for the Ti/V discriminant
diagram is that V is a sensitive indicator of oxygen fugacity (FO2). FO2 of the
magma affects the crystal/liquid partitioning of V, while Ti is relatively unaffected.
Thus, in oxidising environments V will favour partitioning in to the melt, causing
low Ti/V ratios. Ti/V plots distinguish between four basic tectonic settings for
basalt: island-arc related basalts with low Ti/V ratios of <20 such as arc tholeiites,
calcalkaline and shoshonite suites; mid ocean ridge basalts (MORB) and flood
basalts have Ti/V ratios between 20 and 50; and alkali basalts from continents
and oceans have Ti/V ratios >50 (Shervais 1982).
Both the hand-held XRF data and the laboratory XRF data were plotted on
the Ti/V discrimination diagram (Figure 5.1). The laboratory XRF data is used in
the geochemical analysis to confirm the reliability of hand-held XRF data. While
both datasets show general agreement in their results, the hand-held data gives
slightly lower readings of the major and trace elements as measurements were
taken in very wet conditions. Under this classification the Barlings Head massive
and injected greenstones plots in the alkaline ocean island basalt field (OIB). This
is shown definitively by the laboratory data with Ti/V ratios of 58.5 to 69.9, while
the hand-held data displays a clear trend into this field, with slightly lower Ti/V
ratios of 40‒60. Several anomalous values from Barlings Head plot within the mid-
ocean ridge basalt and arc-related basalt fields. However, these are expected to
be unreliable indicators of magmatic affinity, as these were samples taken from
small highly altered outcrops of greenstone injected into surrounding units; their

51
chemistry may have been affected by weathering of the surrounding rock,
particularly as small-scale mixing was apparent in places (see Section 4.1.2).
An OIB classification of the Barlings Head greenstones is consistent with
the setting determined by Prendergast & Offler (2012) for Wagonga Group basalts
from a basaltic breccia north and east of the study area at Burrewarra Point and
from a basaltic breccia and basalt pillows south of the study area at Narooma.
Samples from these units produced an alkaline, ocean island basalt affinity
(Prendergast & Offler 2012). The basalt samples analysed from these locations
are also plotted in Figure 5.1 and have Ti/V ratios primarily falling between 60 and
100.
Figure 5.1: Volcanic units plotted on the Ti/V magma series discrimination diagram of Shervais
(1982).

52
SiO2 values of 47.73‒54.77% (laboratory XRF) for the Melville Point
greenstones are consistent with a basaltic classification, however, they are
associated with a different tectonomagmatic setting to the Barlings Head
greenstone. As with the Barlings Head greenstone, the laboratory XRF data from
Melville Point plots definitively within the respective field, in this case as volcanic
arc–related basalts(Ti/V ratios 11–18), while the hand-held XRF data shows a
clear trend into this field despite displaying slightly higher Ti/V ratios (11–32).
Samples plot near chondritic trends, have generally high V abundances
(laboratory V: 440‒689 ppm) and develop minor overlap with the MORB ratios
when V is lower than 350 ppm (hand-held V 154–418 ppm); all consistent with an
island arc tholeiite classification (Shervais 1982). Several samples from Melville
Point plot anomalously as MORB and OIB. These are not considered diagnostic
of their actual magmatic affinity as these measurements were taken from small
exposures of highly altered greenstone that was enclosed within the overlying
Wagonga Group sedimentary rocks that may have affected these readings.
Crawford et al. (2003) documented the geochemistry of exposed volcanic
basement boninites from the western Lachlan Fold Belt associated with a
Cambrian island arc. These plot distinctively on the classification diagram of
Shervais (1982) with low Ti/V ratios (~20) and much lower Ti and V abundances
(Ti 79436‒12649 ppm, V 330‒495 ppm) to the Melville Point island arc tholeiite
units.
The Nb-Zr-Y discrimination diagram of Meschede (1986) has been used to
discriminate between mid-ocean ridge basalts (N-MORBS and P-MORBS), within-
plate tholeiites (WPT), within plate alkali basalts (WPA) and volcanic arc basalts
(VAB). However, VAB plot within both the WPT and N-MORB fields. This diagram
follows on from the conventional Ti-Zr-Y diagram of Pearce and Cann (1973) by
employing Nb; an important discriminator of different types of MORB, as well as
continental tholeiites. Analyses of samples with <10 ppm Nb are less precise,
however Meschede (1986) demonstrated that the Nb-Zr-Y diagram is still
applicable in such cases. Laboratory XRF data has been plotted in Figure 5.2.

53
Hand-held XRF data has not been plotted, as the instrument cannot detect
yittrium (Y).
Under this classification, the Barlings Head greenstone units are classified
as within-plate alkali basalts, whilst the Melville Point greenstone units plot in the
N-MORB/VAB field; these settings cannot be distinguished using the
discrimination plot of Meschede (1986) alone and as such, in conjunction with the
Ti/V discriminant diagram of Shervais (1982), their setting is consistent with VAB.
One sample of the Barlings Head greenstone plots differently to the other
samples, within the VAB field, but this is expected to be an unreliable result as the
sample was taken from a small amount of greenstone that was injected and
intermingled through the eastern tectonic mélange unit at the eastern boundary of
the greenstone, which may have contaminated its chemistry. The alkaline OIB
units documented by Prendergast and Offler (2012) also plot in the within plate
alkali-basalts, in the same field as the Barlings Head greenstone units. These
findings are consistent with the two volcanic units being derived from the same
volcanic source. The implications of this outcome will be discussed in Chapter 6.
Figure 5.2: Volcanic units plotted on the 2Nb-Zr/4-Y magma series discrimination diagram of Meschede (1986). Al: within plate alkali basalts; All: within plate basalts and tholeiites; B: E-MORB; C: within plate tholeiites and volcanic arc basalts; D: N-MORB volcanic arc basalts.

54
5.2 Sedimentary Units
The geochemistry of terrigenous clastic sedimentary rocks, such as
mudstone and sandstone, can be used to constrain their provenance, weathering
conditions and tectonic settings. While the mineralogy of these rocks may be
affected by diagenesis and metamorphism, their bulk geochemistry remains
essentially the same (Taylor & McLennan 1985; Cox et al. 1995). Major elements
are useful in determining original detrital mineralogy, however trace elements
such as Th, Hf, Zr, Ti, Nb and La are most suitable for establishing provenance
and tectonic setting as they are relatively immobile. These trace elements have
very low water-upper crust partition coefficient and residence time values. They
are seldom partitioned into natural waters and are present in the oceans for very
short periods of times, less than average-ocean mixing times. Therefore, they are
partitioned almost exclusively into clastic sedimentary rocks and are most likely to
reflect their source composition (Taylor and McLennan 1985).
Geochemical parameters such as the K/Rb ratio and the K2O/Al2O3 ratio
are useful for understanding provenance, intensity of weathering and clay-mineral
influence on mudstone and sandstone compositions. The K/Rb ratio of Taylor
(1966) was developed as an important petrogenetic index of igneous and
metamorphic rocks. These elements show a general geochemical coherence, and
it is the deviations from this coherence that are important (Shaw 1968). Rb is
contained mainly within K-feldspars, mica and clay minerals in sedimentary rocks.
When these rocks undergo alteration, Rb is largely concentrated relative to K. As
such, altered sedimentary rocks such as mudstone and shale tend to have high
concentrations of Rb (~160 ppm), which is contained in clay minerals such as illite
and montmorillonite, producing lower K/Rb ratios than those of unaltered
sedimentary or igneous rocks (Shaw 1968; Heier & Billings 1970; Mielke1979).
The K2O/Al2O3 ratio of Cox et al. (1995) can be used to determine the
original composition of sedimentary rocks, as clay minerals and feldspar minerals
bear distinct values for this ratio. Clay minerals have a higher proportion of Al2O3
than non-clay silicate minerals and while K2O may be depleted in rocks that have
undergone intense chemical weathering, it is generally well-retained in mudstones

55
with high proportions of the clay mineral illite. Thus, if the mudstone is sourced
from recycled older sediments it will have a high illite content (Cox et al. 1995).
The K2O/Al2O3 ratio of sedimentary rocks with abundant alkali feldspar
minerals ranges from 0.4‒1, whereas sedimentary rocks with high proportions of
clay minerals will produce lower K2O/Al2O3 ratios; illite-rich rocks have a
K2O/Al2O3 of ~0.3, and rocks with abundant other clay minerals (montmorillonite,
kaolin) have values approaching zero. Therefore, K2O/Al2O3 ratios > 0.5 indicate
the dominance of feldspar in the source rock, while values < 0.4 suggest minimal
feldspar in the source rock. The K2O/Al2O3 ratios for the sedimentary units derived
from the laboratory XRF data are plotted against clay and feldspar minerals in
Figure 5.3.
Figure 5.3: Values of the K2O/Al2O3 ratio for the sedimentary units at Barlings Head, and for specific K-feldspar minerals and clay minerals. Data from Deer et al. (1966) and Cox et al. (1995).
56
The geochemistry of mudstones and sandstones that comprise the
mélange zone at Barlings Head have not been analysed previously. Eight
samples of the clastic sedimentary rocks were collected from Barlings Head and
analysed for major and trace elements by laboratory XRF for which the data is
provided in Table 5.3. Values for Cr, Ni, Co are ignored due to the potential for
contamination by the Cr-steel crushing vessel (TEMA). Additionally 37 hand-held
XRF measurements of the units were taken in the field, for which the average
values and range for each unit is shown in Table 5.4, with full results listed in
Appendix E.
While averaging the hand-held XRF data for these units does narrow the
range of elemental values and assist (alongside petrographic data) in
discriminating the units (see Table 5.4), there remains a clear level of inaccuracy
shown by the low totals of major elements. This may be overcome if the results
are precise, despite being inaccurate. The precision of the hand-held XRF data
can be determined by the relative values of the elements. The use of element
ratios shows that the hand-held measurements taken on wet samples are
imprecise as they show highly variable values, compared to hand-held XRF
measurements of dry samples which show more constrained, consistent values.
For example, the K2O/Al2O3 ratio from the hand-held XRF data of the clay-rich
siliceous mudstone varies between 0.26‒0.75 for wet samples, while values of
0.19‒0.26 are significantly more precise for dry samples. The range in K2O/Al2O3
values for the wet clay-rich siliceous mudstone samples is not a product of
geochemical variation within the unit, as ratio values given by the laboratory XRF
data (0.25‒0.3) display only negligible variance. In wet conditions, readings
appear to be on average 30% lower than the expected element concentrations,
and less commonly up to 20% higher than expected.
5.2.1 Major element geochemistry
The sandstone pods from the small black mudstone, injected greenstone
and sandstone mélange are mainly composed of SiO2, which ranges from 75.47‒
87.73%, based on two hand-held XRF measurements of dry samples taken within
the laboratory. Al2O3 (6.55‒7.53%), Fe2O3 (2.72‒3.22%) and K2O (1.67‒2.44%)

57
are also major oxides present. The data confirms the XRD and thin section data
that the sandstone is silica (quartz) rich. Two hand-held XRF measurements of
the quartz sandstone taken in the field during heavy rainfall give SiO2 values of
15.06‒16.75%. These abnormally low values are due to the very wet conditions
on the outcrop when the measurements were taken, which caused the instrument
to produce lower readings across all measured elements and thus very low sum
totals of all elements (18.62‒23.89%).
In contrast, the sandstone from the interbedded lithic sandstone and
mudstone unit has SiO2 contents of 51.89‒66.61%. These are much lower than
for the quartz sandstones. They have abundant major oxides of Al2O3 (10.68‒
18.55%), Fe2O3 (4.14‒11.52%), MgO (<LOD – 3.46%) and K2O (1.39‒3.25%).
The high average Fe2O3 composition (8.32%) and MgO (3.46%) reflects a likely
mafic-volcanic source for the unit. The data confirms the XRD and thin section
data that the sandstone is lithic with abundant mafic volcanic rock fragments and
altered plagioclase.
The K2O/Al2O3 ratios of the quartz sandstone (0.26‒0.3) and the lithic
sandstone (0.13‒0.31) lie in the range of values for clay minerals, and particularly
reflect the significant contribution of illite to the composition of both units which
has a K2O/Al2O3 ratio of ~0.3 (Figure 5.3).
Fifteen black mudstone samples were analysed by hand-held-XRF and one
sample analysed by laboratory XRF. The average black mudstone composition
based on the hand-held data indicates an average SiO2 of 46.43%. However, the
readings show significant variation as SiO2 values range from 9.74‒66.26%. This
large range in values reflects the large range in the sum totals for major elements
(15.07‒42.4‒84.97%). The single laboratory XRF sample has a SiO2 value of
66.46%, slightly higher than the range given by the hand-held data, although as
this is only one sample the level of consistency between the hand-held and
laboratory XRF data for the black mudstone cannot be deduced. Additional major
oxides present in the unit given by the average hand-held data are Al2O3 (9.33%),
Fe2O3 (4.56%) and K2O (2.04%). The high Fe2O3 content of the black mudstone,
up to 9.61%, is attributed to the presence of pyrite (1% by XRD) and is also

58
reflected in the observed iron oxide concretions at outcrop scale and in thin
section. The K2O/Al2O3 ratio of this unit, which ranges between 0.09‒0.42, lies in
the range of values for clay minerals and supports the large proportion of clay
minerals that comprise the unit, as shown by the XRD data (Table 4.1). The unit
also shows very high Ba concentration (1445 ppm hand-held average; 1325 ppm
laboratory XRF); significantly larger than the average Ba composition of all other
sedimentary units at Barlings Head (524‒1203 ppm). The significance of this will
be discussed in section 5.2.2.
Three samples of the clay-rich siliceous mudstone were analysed by
laboratory XRF and 11 were measured using the hand-held XRF, of which 8 were
taken in the field on wet samples and 3 were taken at the university on dry
samples. The samples analysed by laboratory XRF show considerable loss on
ignition values (5.78‒8.70%) and a K2O/Al2O3 ratio of ~0.3 (the same value as
illite), reflecting the considerable proportion of smectite clay minerals that
comprise the unit; consistent with the XRD results of the mudstone. The
laboratory XRF data also revealed very little variation in major elements; SiO2
(64.14‒69.04%), Al2O3 (14.73‒16.16%), Fe2O3 (4.46‒4.94%) and K2O (3.67‒
4.46%). Similarly the three dry samples measured by the hand-held XRF
demonstrated little variation in major elements and presented results analogous to
the laboratory samples; SiO2 (67.03‒71.31%), Al2O3 (13.04‒19.47%), Fe2O3
(4.96‒7.37%) and K2O (2.46‒5.02%). However, the eight hand-held
measurements taken on the wet outcrop were very imprecise, with substantial
variation occurring across most major elements; SiO2 (20.84‒80.48%), Al2O3
(2.46‒14.16%), Fe2O3 (0.83‒4.68%) and K2O (1.65‒3.88%).
Lying contiguous to the clay-rich siliceous mudstone, is the unit of iron-rich
mudstone, from which one sample was analysed by laboratory XRF and three
hand-held XRF readings were taken on the outcrop. This unit displays a similar
chemistry (laboratory XRF SiO2 65.92%; Al2O3 14.12%; K2O 3.55%) to the clay-
rich siliceous mudstone, although the iron-rich mudstone is, as expected, enriched
in Fe2O3 (7.46%).

59
Table 5.3: Laboratory XRF whole rock geochemical data for sedimentary units.
Catalogue no. HONS846 HONS847 HONS849 HONS850 HONS852 HONS853 HONS854 HONS860
Sample no. BN29 BN30 BN33 BN34 BN41 BN44 BN42 BH1
Rock type
Clay-rich
siliceous
mudstone
Clay-rich
siliceous
mudstone
Mudstone/
Greenstone
(mixed unit)
Black
mudstone
Lithic-
sandy
mudstone
Clay-rich
siliceous
mudstone
Iron-rich
mudstone
Lithic
sandstone
Major elements (wt. %)
SiO2 64.14 66.94 66.96 66.46 58.42 69.04 65.92 54.10
Al2O3 14.99 16.16 15.36 13.21 17.33 14.73 14.12 15.66
K2O 4.46 4.16 4.62 0.80 2.61 3.67 3.55 2.08
Fe2O3 4.94 4.85 3.39 5.81 8.10 4.46 7.46 11.52
TiO2 0.64 0.67 0.67 0.84 0.82 0.62 0.60 0.76
Na2O 0.22 0.43 0.26 4.40 3.03 0.33 0.25 3.04
MgO 1.52 1.31 1.50 1.60 2.65 1.13 2.13 3.46
P2O5 0.11 0.09 0.09 0.09 0.14 0.09 0.14 0.30
S 0.01 0.02 0.02 0.04 0.03 0.03 0.02 0.05
CaO 0.04 0.05 0.06 0.16 0.22 0.05 0.11 0.14
MnO 0.07 0.05 0.04 0.07 0.10 0.06 0.08 1.00
LOI 8.70 5.78 8.54 5.30 5.30 6.44 5.82 6.84
O=S -0.01 -0.01 -0.01 -0.02 -0.02 -0.01 -0.01 -0.02
Total 99.86 100.54 101.52 98.83 98.79 100.68 100.21 99.01
Trace elements (ppm)
S 4646 589 5184 1608 766 2721 725 823
V 110 115 111 706 229 102 192 242
Co 14 7 14 13 21 6 23 60
Cu 106 109 68 105 203 96 83 243
Zn 112 60 41 157 189 75 87 263
Rb 156 155 150 24 72 131 95 69
Sr 18 14 31 324 153 14 71 160
Y 26 12 20 15 35 12 22 195
Zr 128 131 153 91 89 131 191 104
Nb 13 14 13 4 4 13 46 4
Ba 929 777 1035 1325 536 713 654 406
La 28 17 35 8 38 8 35 33
Hf 4 5 1 5 5 4 6 15
Th 16.6 17.8 17.1 1.7 2.4 15.5 9.6 4.5
U 1.3 1.3 <1 5.4 <1 <1 <1 <1
Th/U 12.8 13.7 17.1 0.31 2.4 15.5 9.6 4.5
K2O/Al2O3 0.3 0.26 0.3 0.06 0.15 0.25 0.25 0.13
K/Rb 237 223 255 279 300 233 309 251

60
Mudstone from the intermingled turbidites, greenstone and chert unit is
geochemically indistinguishable to the clay-rich siliceous mudstone. The
laboratory XRF data for this mudstone provides near-identical readings for major
elements (SiO2 66.96%); Al2O3 15.36%; Fe2O3 3.39%; K2O 4.62%) to the clay-rich
siliceous mudstone. The units also have the same K2O/Al2O3 ratio of 0.3,
reflecting the large proportion of illite in both facies. Abundances of immobile HFS
elements are also the same across both units: clay-rich siliceous mudstone (TiO2
0.62-0.67%, Nb 13‒14 ppm, Th 15.5‒17.8 ppm); mudstone from the intermingled
unit (TiO2 0.67%, Nb 13 ppm, Th 17.1 ppm). The corresponding geochemistry
indicates that the mudstone from both units share the same provenance, as these
relatively immobile elements best preserve a record of their source rock
composition, despite the rock undergoing chemical and physical processes
(Taylor & McLennan 1985).
A small unit of lithic sandy mudstone is geochemically similar to the lithic
sandstone but has a greater clay-fraction and thus higher concentrations of clay
mineral elements Al2O3 (17.33%) and K2O (2.61%), in addition to higher SiO2
(58.42%) and lower Fe2O3 (8.1%). The chemistry indicates the unit may represent
a mixture of the clay-rich siliceous mudstone and lithic sandstone facies. This
interpretation is consistent with the petrographic analysis of the unit, in which its
mineralogy also falls midway between these two facies (see Table 4.1).
The Fe–Al–Si plot (Figure 5.4) shows that, although some measurements
are more imprecise given the highly variable elemental abundances in some of
the units, the laboratory data generally supports the hand-held data for the
sedimentary units. The mudstones fall close to the illite and smectite
compositions, reflecting the large proportion of clay minerals in the units. The
sediment geochemistry reflects a continuum between the silica-rich chert and the
Fe-Al rich pelitic end-members.

61
Figure 5.4: Fe-Si-Al plot for mudstone and chert from Barlings Head and clay mineral end
member compositions.
5.2.2 Trace element geochemistry
Trace element concentrations determined by laboratory XRF for the
turbidite units are variable; Rb (69‒156 ppm), Cs (<4 ppm), Nb (4‒46 ppm), Sr
(14‒160 ppm), V (102‒242 ppm). However, their average concentrations are very
similar to post Archean average shale (PAAS) and upper continental crust (UCC)
values (Taylor & McLennan 1985). It is also apparent from the high abundances
of heavy metals Zn (263 ppm), Hf (15 ppm), Sr (160 ppm) and V (242 ppm) in the
lithic sandstone, that heavy mineral fractionation has occurred, whereby these
heavy elements, due to their resistance to weathering and high specific gravity,
are deposited in coarser grained sediments (Taylor & McLennan 1985).

62
The black mudstone unit shows distinctive values for trace elements that
differ markedly to the other sedimentary units at Barlings Head, across both the
laboratory and hand-held XRF results. From the laboratory data, both Sr (324
ppm) and V (706 ppm) occur in much higher abundances. This is supported by
the average hand-held data for the black mudstone. The unit is also depleted in
Rb (24 ppm) and K (0.8%), however the K/Rb average ratio of ~277 is
comparable to the average upper continental crust K/Rb ratio of 250 (Taylor &
McLennan 1985). Low Rb concentrations may be due to the preferential
coherence of Ba to K, over Rb, as occurs in this facies (Ba 1325 ppm) (Taylor
1965). Rb is also less readily absorbed by clay minerals in low pH waters. This is
consistent with hemipelagic deposition of the black mudstone in the more acidic
waters of a deep-marine environment (Salminen et al. 2005).
5.2.2.1 Th and U
The Th/U ratio can be used to determine the degree of weathering and
sediment recycling. High Th/U ratios occur as uranium is oxidised and depleted
with increased weathering (McLennan et al. 1995). Values above the Th/U ratio of
~3.8 for the upper continental crust indicate intense weathering of the source
rocks and substantial sediment recycling have occurred (Taylor & McLennan
1985). The black mudstone has significantly lower Th (1.7 ppm) and higher U (5.4
ppm) than the turbidite units. The black mudstone has a Th/U ratio of ~0.31
indicative of minimal weathering and recycling, while the clay-rich siliceous
mudstone ratio of ~12.8‒15.5 reflects intense weathering and recycling of the
source rock. The inverse U/Th ratio is an indicator of redox conditions during
deposition (Jones & Manning 1994). U/Th ratios <1.25 suggest oxic conditions,
while above 1.25 indicates suboxic to anoxic deposition conditions. The black
mudstone has a U/Th value of 3.18 which reflects the low solubility of U in such
conditions and its subsequent enrichment in reduced sediments in a deep-sea
setting (McLennan et al. 1995). The turbidite U/Th ratios between 0.06‒0.22
suggest they were deposited in more oxidising conditions consistent with the
shallow waters of the Ordovician turbidite fan.

63
Figure 5.5: Th/U diagram with sedimentary units from Barlings Head and the upper continental crust (UCC) average plotted.
5.2.2.2 Ba
High concentrations of Ba in pelagic sediments can occur as a result of
volcanic and biological processes (Bostrom et al. 1973). The black mudstone unit
is enriched in Ba (laboratory XRF 1325 ppm, hand-held XRF ~1083‒6805 ppm
normalised) relative to the turbidites (laboratory XRF <1035 ppm). Ba solubility
increases with water depth, however, its preservation in deep sea sediments is
facilitated when contained within the mineral barite or another mixed barium-
sulfate phase that may contain additional minor elements such as Sr, which will
also be concentrated (McManus et al. 1998). The fraction of Ba present in the
form of barite has not been quantified, however the large amount of Sr (laboratory
XRF 324 ppm; hand-held XRF ~388 ppm normalised) suggests some contribution
may have been made by another carrier phase.

64
Barium in pelagic sediments is thought to be largely biogenic (Bostrom et
al. 1973), accumulated from the breakdown of benthic organisms (foraminifera).
Thus, high Ba concentrations occur in sediments underlying the most biologically
productive ocean regions (Falkner et al. 1993; McManus et al. 1998). Ba readings
from the black mudstone unit are similar to those attained for pelagic sediments
from the Arabian Sea (up to 1306 ppm), where Ba is concentrated as a result of a
low organic carbon oxidation rate which prevents the generation of authigenic U
that can corrupt Ba preservation. Organic carbon oxidation is associated with
carbon export, which decreases with distance offshore to cause conditions of low
carbon export in deep sea pelagic settings (i.e. where the black mudstone
accumulated) (McManus et al. 1998). Similar Ba concentrations (1670‒6260 ppm)
have also been found in the black shale from the Abercrombie Beds, New South
Wales, which were deposited in a deep marine environment where the activity of
planktonic organisms (such as radiolarians whose remains occur in the unit)
concentrated Ba (Morand 1990). The elevated Sr levels in the black mudstone
unit at Barlings Head may attest to Ba concentration by biogenic processes and
the breakdown of marine organisms, with Ba able to substitute for Sr in the
celestite (SrSO4) shells made by certain marine organisms (Falkner 1993;
McManus et al. 1998).
Ba may also be sourced from submarine volcanism. Ba may be leached
from basaltic oceanic crust or sourced from mantle degassing along spreading
ridges and seamounts, however, such processes account for only a small
proportion of deposited Ba (Bostrom et al. 1973). Concentration of Ba in the
pelagic mudstone likely arose by input of continental detritus, decaying organisms
and volcanic processes in an environment with high Ba preservation potential; a
deep marine setting with low carbon export, high biological productivity and a fast
accumulation rate (McManus et al. 1998).
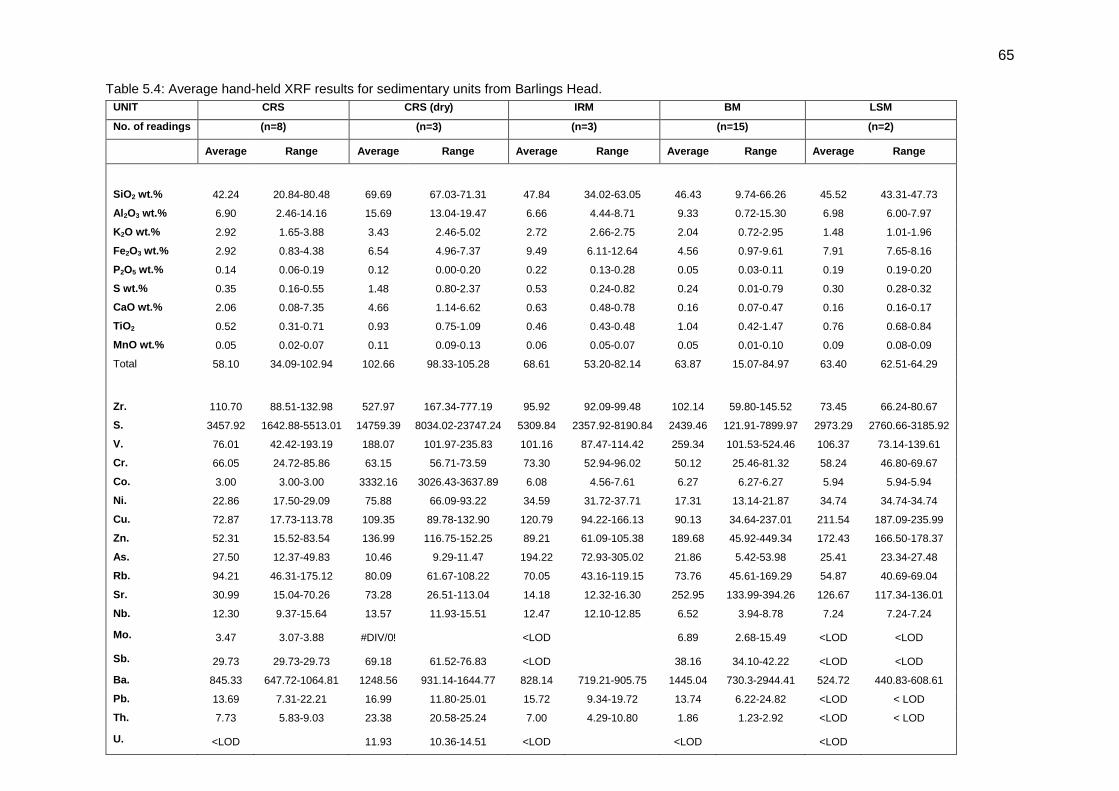
65 Table 5.4: Average hand-held XRF results for sedimentary units from Barlings Head.
UNIT CRS CRS (dry) IRM BM LSM
No. of readings (n=8) (n=3) (n=3) (n=15) (n=2)
Average Range Average Range Average Range Average Range Average Range
SiO2 wt.% 42.24 20.84-80.48 69.69 67.03-71.31 47.84 34.02-63.05 46.43 9.74-66.26 45.52 43.31-47.73
Al2O3 wt.% 6.90 2.46-14.16 15.69 13.04-19.47 6.66 4.44-8.71 9.33 0.72-15.30 6.98 6.00-7.97
K2O wt.% 2.92 1.65-3.88 3.43 2.46-5.02 2.72 2.66-2.75 2.04 0.72-2.95 1.48 1.01-1.96
Fe2O3 wt.% 2.92 0.83-4.38 6.54 4.96-7.37 9.49 6.11-12.64 4.56 0.97-9.61 7.91 7.65-8.16
P2O5 wt.% 0.14 0.06-0.19 0.12 0.00-0.20 0.22 0.13-0.28 0.05 0.03-0.11 0.19 0.19-0.20
S wt.% 0.35 0.16-0.55 1.48 0.80-2.37 0.53 0.24-0.82 0.24 0.01-0.79 0.30 0.28-0.32
CaO wt.% 2.06 0.08-7.35 4.66 1.14-6.62 0.63 0.48-0.78 0.16 0.07-0.47 0.16 0.16-0.17
TiO2 0.52 0.31-0.71 0.93 0.75-1.09 0.46 0.43-0.48 1.04 0.42-1.47 0.76 0.68-0.84
MnO wt.% 0.05 0.02-0.07 0.11 0.09-0.13 0.06 0.05-0.07 0.05 0.01-0.10 0.09 0.08-0.09
Total 58.10 34.09-102.94 102.66 98.33-105.28 68.61 53.20-82.14 63.87 15.07-84.97 63.40 62.51-64.29
Zr. 110.70 88.51-132.98 527.97 167.34-777.19 95.92 92.09-99.48 102.14 59.80-145.52 73.45 66.24-80.67
S. 3457.92 1642.88-5513.01 14759.39 8034.02-23747.24 5309.84 2357.92-8190.84 2439.46 121.91-7899.97 2973.29 2760.66-3185.92
V. 76.01 42.42-193.19 188.07 101.97-235.83 101.16 87.47-114.42 259.34 101.53-524.46 106.37 73.14-139.61
Cr. 66.05 24.72-85.86 63.15 56.71-73.59 73.30 52.94-96.02 50.12 25.46-81.32 58.24 46.80-69.67
Co. 3.00 3.00-3.00 3332.16 3026.43-3637.89 6.08 4.56-7.61 6.27 6.27-6.27 5.94 5.94-5.94
Ni. 22.86 17.50-29.09 75.88 66.09-93.22 34.59 31.72-37.71 17.31 13.14-21.87 34.74 34.74-34.74
Cu. 72.87 17.73-113.78 109.35 89.78-132.90 120.79 94.22-166.13 90.13 34.64-237.01 211.54 187.09-235.99
Zn. 52.31 15.52-83.54 136.99 116.75-152.25 89.21 61.09-105.38 189.68 45.92-449.34 172.43 166.50-178.37
As. 27.50 12.37-49.83 10.46 9.29-11.47 194.22 72.93-305.02 21.86 5.42-53.98 25.41 23.34-27.48
Rb. 94.21 46.31-175.12 80.09 61.67-108.22 70.05 43.16-119.15 73.76 45.61-169.29 54.87 40.69-69.04
Sr. 30.99 15.04-70.26 73.28 26.51-113.04 14.18 12.32-16.30 252.95 133.99-394.26 126.67 117.34-136.01
Nb. 12.30 9.37-15.64 13.57 11.93-15.51 12.47 12.10-12.85 6.52 3.94-8.78 7.24 7.24-7.24
Mo. 3.47 3.07-3.88 #DIV/0!
<LOD
6.89 2.68-15.49 <LOD <LOD
Sb. 29.73 29.73-29.73 69.18 61.52-76.83 <LOD
38.16 34.10-42.22 <LOD <LOD
Ba. 845.33 647.72-1064.81 1248.56 931.14-1644.77 828.14 719.21-905.75 1445.04 730.3-2944.41 524.72 440.83-608.61
Pb. 13.69 7.31-22.21 16.99 11.80-25.01 15.72 9.34-19.72 13.74 6.22-24.82 <LOD < LOD
Th. 7.73 5.83-9.03 23.38 20.58-25.24 7.00 4.29-10.80 1.86 1.23-2.92 <LOD < LOD
U. <LOD
11.93 10.36-14.51 <LOD
<LOD
<LOD

66
Table 5.4: continued
UNIT Cherty-mudstone Quartz sandstone (dry) Quartz sandstone (wet – field) Lithic sandstone (wet - field) Lithic sandstone (dry)
No. of readings (n=2) (n=2) (n=2) (n=2) (n=2)
Average Range Average Range Average Range Average Range Average Range
SiO2 wt.% 20.96 19.47-22.44 81.60 75.47-87.73 15.91 15.06-16.75 58.48 51.89-65.07 66.01 65.42-66.61
Al2O3 wt.% 2.28 0.38-4.18 7.04 6.55-7.53 0.22 0.22-0.22 11.37 10.68-12.06 17.99 17.42-18.55
K2O wt.% 2.95 1.77-4.12 1.96 1.67-2.24 1.04 0.76-1.31 2.32 1.39-3.25 2.32 2.09-2.55
Fe2O3 wt.% 5.68 4.58-6.78 2.97 2.72-3.22 3.25 1.96-4.54 6.52 4.14-8.90 10.12 10.11-10.12
P2O5 0.07 0.02-0.11 0.18 0.16-0.20 0.06 0.06-0.07 0.16 0.12-0.19 0.05 0.05-0.05
S wt.% 0.14 0.10-0.18 1.38 1.14-1.62 0.25 0.18-0.32 0.25 0.21-0.29 0.35 0.22-0.47
CaO wt.% 0.34 0.19-0.50 0.88 0.59-1.17 0.34 0.32-0.37 0.14 0.10-0.18 0.70 0.63-0.78
TiO2 0.52 0.36-0.68 0.38 0.33-0.43 0.28 0.21-0.35 0.76 0.60-0.91 0.03 0.03-0.04
MnO wt.% 0.03 0.02-0.03 0.03 0.02-0.03 0.02 0.02-0.03 0.08 0.06-0.10 0.14 0.14-0.15
Total 32.96 26.90-39.03 96.41 91.86-100.95 21.26 18.62-23.89 80.08 75.91-84.24 97.72 97.57-97.87
Zr. 176.14 174.01-178.26 240.86 205.37-276.35 227.63 205.49-249.76 93.75 79.85-107.66 102.46 99.72-105.20
S. 1365.81 959.97-1771.65 13822.89 11439.75-16206.02 2477.69 1801.56-3153.83 2495.04 2089.41-2900.67 3453.92 2193.08-4714.75
V. 127.00 72.86-181.14 30.75 0.00-61.50 71.77 71.77-71.77 137.09 85.50-188.68 204.61 180.85-228.38
Cr. 120.95 71.39-170.50 <LOD 0.00-0.00 49.25 49.25-49.25 67.75 60.10-75.40 86.41 82.81-90.01
Co. <LOD <LOD 1296.06 1289.60-1302.53 <LOD 0.00-0.00 5.19 5.19-5.19 3143.42 3143.42-3143.42
Ni. 17.31 17.16-17.46 39.33 31.38-47.27 16.32 13.09-19.54 28.89 28.89-28.89 74.37 71.73-77.01
Cu. 37.94 25.96-49.93 18.00 17.88-18.13 30.21 29.11-31.31 147.46 110.88-184.04 221.89 189.69-254.08
Zn. 225.13 179.47-270.79 54.63 51.09-58.17 115.44 77.28-153.60 141.25 88.34-194.16 298.35 296.31-300.39
As. 88.65 84.44-92.87 20.09 17.39-22.79 48.05 12.07-84.02 20.79 18.48-23.10 13.95 12.99-14.91
Rb. 220.97 72.62-369.32 83.95 53.27-114.63 88.26 59.52-117.00 49.99 47.32-52.67 41.00 39.57-42.42
Sr. 34.63 22.18-47.07 25.02 23.67-26.38 29.52 29.02-30.03 74.25 12.14-136.35 116.88 109.83-123.94
Nb. 15.71 12.49-18.94 8.95 8.76-9.14 11.05 11.05-11.05 12.96 12.96-12.96 18.15 17.64-18.65
Mo. 3.61 3.16-4.05 4.29 4.29-4.29 2.95 2.95-2.95 <LOD
<LOD
Ba. 1203.30 943.69-1462.91 789.79 765.79-813.8 627.62 477.98-777.25 570.55 415.63-725.46 721 697-745
Pb. 12.83 10.19-15.46 12.62 8.19-17.04 13.23 8.44-18.02 11.98 8.48-15.48 6.68 6.13-7.22
Th. 3.41 3.28-3.54 14.81 10-19.61 3.19 3.05-3.34 7.65 7.65-7.65 < LOD
U. <LOD
<LOD
< LOD
< LOD
< LOD

67
CHAPTER SIX
DISCUSSION
This chapter provides a discussion of the structural, lithological and
geochemical data that was described in previous chapters and presents an
interpretation for the evolution of the rocks at Melville Point and Barlings Head,
including the tectonic setting and depositional environments of the facies, and
appraises the post depositional emplacement mechanisms responsible for the
mélange zone at Barlings Head.
6.1 Stratigraphic setting and mélange development
Understanding the evolution of ancient accretionary complexes is arduous
as they are characterised by significant post-accretional deformation and
alteration of the rock units, and often occur as limited outcrops. The excellent rock
exposures at Melville Point are established as an imbricated ocean plate
succession; they occur as coherent stratigraphic sequences of ocean floor
volcanic rocks, pelagic sedimentary rocks and turbidites, with a faulted base. At
Barlings Head however, the rock units do not follow the conventional sequence of
imbricated successions and instead form a highly disrupted mélange zone.
Examining the processes of mélange formation occurring in modern sites of
subduction, such as in Barbados and the Mariana forearc, provides a useful
analogue for understanding the formation of the mélange at Barlings Head.
Mélanges, commonly observed along convergent plate margins in both
active and ancient accretionary complexes, have long been attributed to large
scale sedimentary slumping to form olistostromes as well as to tectonic disruption
associated with complex fault networks (Robertson & Ustaömer; Osozawa et al.
2009; Fester et al. 2010). However, the mechanisms for mélange formation on the
scale seen in accretionary complexes has been reconsidered, and it is believed
by some authors that massive mud diapirism provides a more adequate

68
mechanism for extensive outcrops of mélange in ancient accretionary complexes
(Kopf 2002; Wakita 2012; Barber 2013). Alternatively, tectonic processes of fault
widening/thickening, have also been proposed as a mechanism for the formation
of tectonic mélanges in accretionary complexes (Moore & Byrne 1987).
6.1.1 Diapirism
Mud diapirs and associated mud volcanoes, and their presence in
accretionary complexes has been an increasingly studied phenomena for several
decades (Stride 1982; Barber 2013). At deeper levels, mud diapirs are thought to
be largely affected by buoyancy, as lower density mud rises upward relative to its
higher density surroundings and produce a cylindrical form. At shallower depths
however, their shape becomes more irregular and it is thought that overpressure
bears a greater influence on diapir development (Yamagata & Ogawa 1989).
Here, over-pressurised fluids mobilised by faulting, incorporate mud and more
consolidated rock along their path as they rise and penetrate the overlying units
(Barber & Brown 1988).
Diapirism has been suggested as responsible for the Bogolo Formation
mélange that outcrops at Batemans Bay and also forms the core of the Narooma
anticlinorium (Fergusson & Frikken 2003). Features of the Bogolo Formation,
including the presence of abundant quartz sandstone fragments despite being
some distance from the nearest source, and the large scale of the Narooma
Anticlinorium comparable to mud volcanoes documented from the Mediterranean
Ridge (Robertson et al. 1996), are consistent with mud diapirism in the
accretionary complex (Fergusson & Frikken 2003).
Certain conditions in the accretionary complex may promote diapirism.
High water content and low friction of clay minerals in an unconsolidated mud
cause it to have both low viscosity and yield strength, allowing it to flow easily.
Tectonic disturbance of the unconsolidated mud source may initiate diapirism by
increasing overpressure in the mud, weakening overlying units and creating faults
and fractures through which the mud can penetrate(Sumner & Westbrook 2001;
Barber 2013). The subduction of seamounts can also facilitate diapirism as it

69
causes a change in curvature of the overlying sequence, generating fractures
along which diapirs can travel (Figure 6.1) (Fryer et al. 1985).
Diapirism has also been associated with the accretion of thick sequences
of rapidly deposited turbidites, such as the Orinoco Fan in the Barbados
Accretionary Complex (Brown & Westbrook 1988). Here, unconsolidated water-
saturated clays of the Orinoco Fan are accreted to the complex where they are
overpressured and extruded from the underlying complex, rising diapirically to
form a field of more than 450 mud volcanos (Barber & Brown 1988; Sumner &
Westbrook 2001). A similar circumstance may have transpired in the eastern
Lachlan Fold Belt. The accretion of the extensive, rapidly deposited Ordovician
turbidite fan that prograded off the Gondwana Margin (Fergusson et al. 2013),
supplemented by overburden pressure from stacking of thrust slices (Sumner &
Westbrook 2001), may have created conditions favouring diapirism in the
Narooma Accretionary Complex.
The turbidite quartz-illite-chlorite mixtures observed at Barlings Head,
including the clay-rich siliceous mudstone cored antiform, enclosed within
disrupted chert, are out of sequence in the mélange zone as these mixed and
disrupted rocks do not follow the stratigraphic sequence of accreted ocean plate
successions (basalt – pelagic sediments – sandstones and mudstones), and may
have been diapirically emplaced. The mudstone core of the antiform does not
show radial orientation of foliation or pipe-like features characteristic of diapirs
(Orange 1990), as later widespread regional deformation has caused overprinting
of foliation, and deformation by faulting and shortening of the rock units. Mud
disrupted during underplating or offscraping, may have been mobilised and
intruded along faults and bedding layering into the overlying units, and to form the
core of the antiform within the less permeable disrupted chert, as demonstrated
for active mud diapirism in Indonesia (Williams et al. 1984; Barber 2013). The
clay-rich siliceous mudstone has also incorporated a large ~ 4 m block of
interbedded lithic sandstone and mudstone into the core of the antiform, which
may have been a fragment, taken up during intrusion of the mud, from the
adjacent strike bar of interbedded lithic sandstone and mudstone. Folding of the
mud within enclosing units and plunging of the core to the north, with an axial

70
planar cleavage, has occurred in response to deformation and metamorphism
occurring at great depths ~15 km within the subduction complex (Prendergast et
al. 2011).
Figure 6.1: Conceptual models for the formation and emplacement of the Barlings Head mélange by fault zone thickening, diapirism or both, as compared to the imbrication of the Melville Point units. Inset shows fault zone thickening, with abandoned (broken lines) and active faults (unbroken lines), with diapirically injecting greenstone (green) cross cutting overlying units.
The occurrence of abundant (several per m2) small pods of exotic quartz
sandstone within the black mudstone in the narrow eastern mélange unit at the
eastern boundary of the greenstone, may indicate stratal disruption along an early
fault, whereby unconsolidated black mudstone has been diapirically injected along
the fault, incorporating semi-lithified quartz sandstone fragments along its path.
The black mudstone has the appearance of a flow fabric, flowing around and
between the pods. The preferred alignment shown by the pods indicate a flow
parallel orientation and alignment by deformation/metamorphism responsible for
the flow fabric developing into a cleavage as reported in other mélanges (Agar &
Prior 1995; Barber & Brown 1988). The black mudstone and quartz sandstone
unit has later injections of greenstone from the adjacent massive greenstone
71
through it, which has developed the same foliation. The lenticular shape of the
injections and the small-scale injections and mixing observed along the contacts
between black mudstone and greenstone indicate the black mudstone was still
relatively unconsolidated when the greenstone was injected.
Similar injections of greenstone also occur through the mudstone and chert
along the western contact of the greenstone unit. The high LOI of the greenstone
(7.62–12.18) imply that it is an intensely altered clayey unit. As much of this
alteration may have occurred prior to accretion, the clay-rich nature of the
greenstone when it was accreted, in addition to overpressure generated by the
accretion process (Barber 2013), may have caused it to be mobilised and flow,
injecting along its contacts with adjacent units. Furthermore, the entire greenstone
unit may have been diapirically emplaced, as opposed to diapirism in the unit
being limited to a small amount of post-accretion remobilisation of the greenstone
along its contacts. Following its accretion at depth, clay and water content in the
greenstone may have been sufficient to cause it locally to rise diapirically,
crosscutting the overlying units and injecting into neighbouring units as it flowed
(Figure 6.1). However, its location here most likely reflects early imbrication
followed by diapiric remobilisation, as the overall assemblage here is consistent
with Melville Point, where the greenstone and other units are imbricated.
Serpentine mud volcanoes that form seamounts in the Mariana forearc
(Fryer 1996; Fryer et al. 1999) may serve as a useful analogue for the process of
diapiric injection of the altered basalts into the Narooma Accretionary Complex
and accordingly, in the mélange at Barlings Head. In the Mariana forearc, fluids
derived from the subducting slab causes metamorphism (serpentinization) of fault
gouged, deep seated ultramafic rocks to produce a slurry of serpentine mud
containing blueschist clasts from the metamorphosed subducted plate. The
serpentine mud rises diapirically along fault planes where it is erupted on the
seafloor to produce numerous seamounts in the Mariana forearc (Fryer 1996;
Fryer et al. 1999). Basalt that was subducted in the ancient subduction zone in the
eastern Lachlan Fold Belt may have been altered at shallow depths, and possibly
also from deeper level greenschist facies metamorphism, from water driven off the

72
subducting slab and diapirically injected along planes of weakness into the
accretionary complex.
No cross-cutting relationships in the form of visible diapir boundaries are
observed in the mélange, however, these have often been modified or destroyed
by later deformation (Barber 2013).
6.1.2 Fault zone thickening
Tectonic mélanges are chaotic mixtures of rock units, which may include
exotic blocks, of different ages and origins that form by underplating and
offscraping during subduction, causing tectonic deformation through extensive
out-of-sequence thrusting and faulting in the subduction complex (Fester et al.
2010). Fault thickening is the process of formation of tectonic mélanges (Moore &
Byrne 1987; Fester et al. 2010). As deformation progresses, fault surfaces are
abandoned and faults migrate from the deformed sediment into adjoining
undeformed sediment, to form broad shear zones of gradually increasing
thicknesses (Moore & Byrne 1987). The abandonment of faults and their
propagation into undeformed, weaker sediments is brought about by several
factors. The first is strain hardening of the sediment as a result of decreasing
porosity and cementation. Porous, unconsolidated sediment that is subducted and
deformed under unique set of stresses and drained or dilating conditions will
eventually consolidate when a critical state between these conditions is reached.
The fault zone will then abandon the strengthened deformed sediment for the
adjacent porous sediment, leaving a thickened deformed interval (Moore & Byrne
1987).
Changes in fluid pressure may also cause fault abandonment as fluid
escapes deforming sediments along faults with lower fluid pressures. This causes
a drop in fluid pressure in the dewatered sediment of the fault zone and
subsequent strain hardening of the fault zone, causing the fault to be abandoned
and deformation to initiate in adjacent undeformed sediment with higher pore fluid
pressure (Moore & Byrne 1987).

73
The reorientation of fault zones may also cause deformation to propagate
into nearby undeformed sediments. Rotational deformation will change fault zone
orientation, causing it to move away from a critical-state and deformation will
reinitiate on a plane with more ideal conditions for failure (Moore & Byrne 1987).
These processes of fault thickening, may have been active in the
subduction complex. Cyclical migration of faults during continued deformation in
the complex would have led to the gradual widening of fault zones and complex
stratal disruption to form the mélange that occurs at Barlings Head. The out-of-
sequence units at Barlings Head suggest a mechanism of recurrent out-of-
sequence thrusting in the subduction complex responsible for their configuration.
Mud diapirism may have also been a component in this model for mélange
formation, as out-of-sequence thrusts and faults may have acted as conduits for
the intrusion of unconsolidated mixtures into the fault zone.
Fault or shear zone thickening has been previously suggested for the
Wagonga Group mélange at Batemans Bay. Prendergast (2007) proposed that
the complex faulting, intermixing and disparate ages of rocks units in the
Wagonga Group is consistent with mélange formation by shear zone thickening,
and further suggested that the boundary exposed at Melville Point between the
Wagonga Group and the Adaminaby Group may represent the upper boundary of
the thickened shear zone.
No discrete thrust faults are visible in the mélange at Barlings Head,
although an early fault must have existed between the greenstone-chert unit and
the black mudstone to the east as now represented by the zone of tectonic
mélange. Remobilisation along this zone involving potential diapirism and fault
zone widening, in addition to later strong ductile shortening producing tight folds
and strong foliations, has extensively overprinted these inferred early structures
making them almost impossible to distinguish.

74
6.1.3 Olistostrome
Olistostromes are sedimentary mélanges, formed at the base of fault
scarps by gravitationally induced mass wasting (slumps, block slides, debris
flows) (Barber & Brown 1988; Fester et al. 2010). As material moves downslopes
it plucks up fragments of underlying rock types, including exotic lithified blocks,
which are mixed through the muddy matrix, till it is deposited at the base of the
slope. Olistostromes have recently been considered subordinate to diapiric
mélanges, on the basis that no such sedimentary deposits are currently being
formed in association with modern accretionary complexes of the type and scale
adequate to produce all ancient accretionary mélanges (Barber & Brown 1988;
Fester et al. 2010).
An olistostrome origin has been suggested for the Bogolo Formation at
Batemans Bay and Narooma on the basis of soft sediment folds, small and
angular clasts and extensional dismembering of competent beds, which have
been proposed to have formed by sedimentary mixing of clasts freed by
extensional strike-slip faulting in a trench environment (Jenkins et al. 1982; Miller
& Gray 1996; Glen et al. 2004). Early folds occurring in the Wagonga Group at
Batemans Bay, in which cleavage and fractures appear absent, have been
attributed by Fergusson & Frikken (2003) as related to superficial down-slope
movement. An olistostrome model has been has been dismissed as mud-matrix
olistostromes with fragments of quartz and chert, similar to those proposed for the
Bogolo Formation, have only been identified in one other locality in the Ordovician
quartz turbidite succession; the Wonnangatta Line in eastern Victoria (Fergusson
1987). The overall form of the Bogolo Formation as anastomosing discontinuous
strips is considered more attributable to mud diapirism (Fergusson & Frikken
2003) or shear-zone thickening (Prendergast 2007).
An olistostrome model is not sufficient to explain the mélange at Barlings
Head. The extensive faulting and inferred out-of-sequence thrusting that has
occurred and the absence of slab-sized fragments with the same composition as
the mudstone detritus at Barlings Head is consistent with a tectonic rather than
sedimentary origin (cf. Fergusson 1984). Also, considering that olistostromes

75
similar to the mélange at Barlings Head have not been identified elsewhere in the
Wagonga Group, it is unlikely that this mélange is a product of mass sedimentary
transport. Additionally, modern accretionary analogues show only very limited
mass transport, on a small scale (Fester et al. 2010), and usually only involve
mobilisation of the muddy trench slope cover (Underwood 1984). While in large
scale slumps that do occur, such as the 10 km slump scar in the south of Timor,
only the uppermost (several tens of metres) unconsolidated sediments are
affected (Barber & Brown 1988). Therefore, it is unlikely the large array of stratally
disrupted ocean-sequence rocks occurring in the ~90 m wide mélange at Barlings
Head are olistostromes. Blocks of lithified rocks brought to the surface of
accretionary complexes by diapirism can be involved in later slumping, however
this is a very rare occurrence in modern accretionary complexes (Barber & Brown
1988).
Furthermore, the overall form of the Barlings Head mélange as a myriad of
anastomosing subparallel faults enclosing generally lenticular linear fragments of
disrupted units is consistent with the mélange as a product of progressive
deformation or ‘structural slicing’ (Bosworth 1984) in a thickening fault zone
(Cowan 1985). The presence of irregular and injecting contacts between units, as
well as out-of-sequence turbidite mixtures, suggests that some diapiric intrusion of
mudstone, greenstone or both along zones of weakness such as thrusts, faults
and bedding planes, into overlying and adjacent units, has also occurred.
6.2 Geochemical setting of basalts
In Chapter Five, discrimination diagrams utilising immobile high field-
strength elements were used to distinguish between the magmatic affinities of the
greenstone units identified at Melville Point and Barlings Head. It was
demonstrated that the Barlings Head greenstone unit is of alkaline ocean-island
basalt affinity, plotting well within the OIB field on the Ti vs. V diagram (Figure 5.1)
of Shervais (1982), while the Melville Point greenstone plotted with much lower
Ti/V ratios as island-arc basalt in affinity. The Barlings Head and Melville Point
greenstone units exhibited the same magmatic affinities on the Nb-Zr-Y diagram

76
(Figure 5.2) of Meschede (1986), plotting as within-plate alkali basalts and
volcanic arc basalts respectively.
Prendergast and Offler (2012) documented the geochemistry of basalts
occurring in the Wagonga Group north of the study area towards Batemans Bay,
between Burrewarra Point and Lilli Pilli Headland, and south at Wagonga Inlet and
Surf Beach in Narooma. The basalt at Batemans Bay occurs as clasts in a
basaltic breccia unit and in mélange, while at Narooma a basaltic breccia occurs
in addition to a small unit of basaltic pillow lavas. At Burrewarra Point,
parautocthonous limestone beds and limestone clasts occur within the basaltic
breccia unit and contain middle and late Cambrian fossils (Bischoff & Prendergast
1987). The Batemans Bay and Narooma basalts have undergone intense
alteration (LOI 2.44–8.06) and demonstrate an alkaline ocean-island basalts
affinity (Zr/Ti = 0.012–0.023; Nb/Y = 1.13–2.96; Prendergast & Offler 2012) akin to
the alkaline basalt affinity of the Barlings Head greenstones (LOI 7.62–12.18;
Zr/Ti = 0.014–0.015; Nb/Y = 0.08–3.05; see Table 5.1) (ratios after Pearce 1996).
The corresponding geochemical affinity of the Barlings Head greenstone to the
Batemans Bay and Narooma basalts indicates that they may have been derived
from a similar source, which has been interpreted for the Batemans Bay and
Narooma units as volcanic fragments of a seamount ~60 km wide that was
underplated at depth and underwent lower greenschist metamorphism
(Prendergast & Offler 2012).
Seamounts are usually capped by several hundred metres of limestone,
with thicknesses up to 800 m recorded from Barremian–Albian (121–98 Ma)
limestone from Pacific Ocean seamounts (Shipboard Scientific Party 1993).
Limestones at Burrewarra Point are only a couple of metres thick and have been
assessed as late Drumian (~500 Ma) and late Cambrian (~485 Ma) (Percival et al.
2011). This implies an interval of ~15 Ma, a significant period for limestone to
accumulate considering that ~800 m of limestone that formed in a ~23 Ma interval
on the Pacific Ocean seamounts (Shipboard Scientific Party 1993). Therefore, as
such a small amount of limestone outcrops at Burrewarra Point in comparison,
much of the original limestone was probably subducted, and deformation and
erosion is expected to have reduced much of the limestone that was accreted.
77
The Melville Point massive and pillow-lava greenstones were derived from
an alternative volcanic setting. Their island arc tholeiitic signature is distinguished
by their characteristic low Nb/Zr (0.06–0.08), Zr/Y (1.26–3.35) and Ti/Y (146.6–
346.4) ratios (Sivell & Rankin 1983; Gill 2010). Depletion in these HFS elements,
in addition to a Th/U ratio below 3 (0.02–0.05), reflects a high degree of partial
melting of the depleted mantle source of the volcanic arc (Sivell & Rankin 1983;
McLennan et al. 1995). These are inferred to have been erupted at considerable
ocean depth by their association with the pelagic sediment (chert) – an
association also seen in the central Mariana forearc (Stern & Smoot 1998) – and
their emplacement in the subduction complex occurred through the collision and
accretion of the forearc of an intraoceanic island arc.
78
CHAPTER SEVEN
CONCLUSION
The current work has illustrated the complex geology, structures and
relationships that occur at Melville Point and Barlings Head in Narooma
Accretionary Complex, through detailed mapping of the lithological units.
Furthermore, geochemical, petrographic and mineralogical analyses of rock
samples from these localities have enabled detailed classification and description
of the fourteen varied lithologies, which include several newly recognised facies.
The highly altered volcanic rocks consist of an alkaline ocean-island basalt
affinity unit and island-arc tholeiitic affinity units, at Barlings Head and Melville
Point respectively. They are derived from different oceanic settings, representing
intensely altered and deformed accreted fragments of a seamount at Barlings
Head and the forearc an intraoceanic island arc at Melville Point, that were carried
into the early Paleozoic subduction zone. The Melville Point island arc volcanic
units were erupted at considerable ocean depth as indicated by their relationship
with the stratigraphically overlying pelagic units, from a depleted mantle source
(Th/U <3). Geochemical consistencies occur between the Barlings Head ocean-
island basalts and the ocean-island basalts occurring at Burrewarra Point,
revealed by their similarity in immobile element classifications and tectonic
discrimination plots.
All rock units have been strongly altered and deformed, as reflected by the
pervasive foliation that overprints each unit and in the high proportions of
secondary clay minerals in the basalts. The source of the turbidites has
undergone intense weathering and sediment recycling (Th/U >3.8), and were
deposited in oxic shallow waters (U/Th <1.25) as part of the Ordovician turbidite
fan. The black mudstone was deposited in suboxic to anoxic conditions (U/Th
>1.25) in a deep marine environment (elevated Ba ~1325 ppm) from a source that
experienced minimal weathering and recycling (Th/U <3.8).

79
Rock units at Barlings Head have undergone intense stratal disruption to
form a mélange zone with exotic and out-of-sequence lithologies occurring.
Mélange formation is interpreted to have occurred by progressive deformation in a
thickening fault zone, causing out-of-sequence thrusting and faulting of the rock
units. The quartz-illite-chlorite mudstone mixtures were emplaced by out-of-
sequence thrusting or through diapirism of unconsolidated mud along faults into
the overlying units. Injections of greenstone into adjacent units also indicate a
diapiric component occurring either following accretion of the semi-consolidated
massive greenstone unit or during diapirism of the entire greenstone unit into the
overlying sedimentary units. It is likely the mélange at Barlings Head is the
outcome of a complex interaction and superposition of both tectonic and diapiric
processes.
Greater understanding of the rock units at both localities and the
mechanisms of mélange formation requires further geochemical analyses and
geochronological studies to be conducted on both the sedimentary and volcanic
rocks. Testing of the conditions for diapiric mobilisation of the basalts is needed to
confirm the influence of diapirism. Additionally, understanding the processes
responsible for deformation of the disrupted chert unit would benefit from
microstructural and geochemical analyses of this unit.

80
REFERENCES
Agar S. M. & Prior D. J. 1995. Faulting and fluid flow in accreted sediments: Hole
863B, Chile triple junction. In Lewis S. D., Behrmann J. H., Musgrave R. J.
& Cande S. C..eds. Proceedings of the Ocean Drilling Program, Scientific
Results 141, pp. 3-12.
Barber A. J. 2013. The origin of mélanges: Cautionary tales from Indonesia,
Journal of Asian Earth Sciences 76, 428-438.
Barber T. & Brown K. 1988. Mud diapirism: the origin of mélanges in accretionary
complexes? Geology Today May-June, 89-94.
Bischoff G. C. O. & Prendergast E. I. 1987. Newly discovered middle and Late
Cambrian fossils from the Wagonga beds of New South Wales, Australia.
Neues Jahrbuch fur Geologie und Palaontologie 175, 39-64.
Bostrom K., Joensuu O., Moore C., Bostrom B., Dalziel M. & Horowitz A. 1973.
Geochemistry of barium in pelagic sediments. Lithos 6, 159-174.
Bosworth W. 1984. The relative roles of boudinaged and ‘structural slicing’ in the
disruption of layered rock sequences. Journal of Geology 92, 447-456.
Brown K. & Westbrook G. K. 1988. Mud diapirism and subcretion in the Barbados
Ridge Complex. Tectonics 7, 613–640.
Cowan D. S. 1985. Structural styles in Mesozoic and Cenozoic mélanges in the
western Cordillera of North America. Geological Society of America Bulletin
96 (4), 451-462.
Cox R., Lowe D. R. & Cullers R. L. 1995. The influence of sediment recycling and
basement composition on evolution of mudrock chemistry in the
southwestern United States. Geochimica et Cosmochimica Acta, 59 (14),
2919-2940.

81
Crawford A. J., Cayley R. A., Taylor D. H., Morand V. J., Gray C. M., Kemp A. I.
S., Wohlt K. E., VandenBerg A. H. M., Moore D. H., Maher S., Direen N.
G., Edwards J., Donaghy A. G., Anderson J. A. & Black L. P. 2003.
Neoproterozoic and Cambrian continental rifting, continent-arc collision and
post-collisional magmatism. In Birch W. D. ed. Geology of Victoria:
Geological Society of Australia Special Publication 23, Geological Society
of Australia, Sydney, Australia, pp. 73-93.
Deer W. A., Howie R. A., and Zussman J. 1966. An Introduction to the Rock-
Forming Minerals. Longman, UK.
Falkner K. K., Klinkhammer G.P., Bowers T.S., Todd J.F., Lewis B.L., Landing
W.M. & Edmond J.M. 1993. The behavior of barium in anoxic marine
waters, Geochimica et Cosmochimica Acta 57 (3), 537-554.
Fergusson C. L. 1984. The Gundahl Complex of file New England Fold Belt,
eastern Australia: a tectonic mélange formed in a Palaeozoic subduction
complex. Journal of Structural Geology 6 (3), 257-271.
Fergusson C. L. 2003. Ordovician-Silurian accretion tectonics of the Lachlan Fold
Belt, southeastern Australia. Australian Journal of Earth Sciences 50 (4),
475-490.
Fergusson C. L. & Coney P. 1992. Convergence and intraplate deformation in the
Lachlan Fold Belt of southeastern Australia. Tectonophysics 214 (1-4),
417-439.
Fergusson C. L. & Frikken P. 2003. Diapirism and structural thickening in an Early
Palaeozoic subduction complex, southeastern New South Wales, Australia.
Journal of Structural Geology 25, 43–58.
Fergusson C. L. & Miller J. M. 2005. Discussion and Reply Narooma Terrane:
implications for the construction of the outboard part of the Lachlan
Orogen. Australian Journal of Earth Sciences 52, 1035-1041.
Fergusson C. L., Nutman A. P., Kamiichi T. & Hidaka H. 2013. Evolution of the
Cambrian active continental margin: the Delamerian-Lachlan connection in

82
southeastern Australia from a zircon perspective. Gondwana Research 24
(3-4), 1051-1066.
Fergusson C. L. & VandenBerg A. H. M. 1990. Middle Palaeozoic thrusting in the
eastern Lachlan Fold Belt, southeastern Australia. Journal of Structural
Geology 12, 577–589.
Festa A., Pini G. A., Dilek Y. & Codegone G. 2010. Mélanges and mélange
forming processes: a historical overview and new concepts. International
Geology Review 52 (10), 1040-1105.
Fletcher J. M., Stephens C. J., Petersen E. U. & Skerl L. 1997. Greenschist facies
hydrothermal alteration of ocean gabbros: a case study of element mobility
and reaction paths. In Karson J. A., Cannat M., Miller D. J. & Elthon D.
eds. Proceedings of the Ocean Drilling Program, Scientific Results 153, pp.
389-398.
Foster D. & Gray D. 2000. Evolution and Structure of the Lachlan Fold Belt
(Orogen) of Eastern Australia. Annual Review of Earth and Planetary
Sciences 28, 47-80.
Frikken P. 1997. The stratigraphy and structure of the early Palaeozoic
succession – Burrewarra Point, southeastern N.S.W. Honours Thesis,
University of Wollongong (unpublished).
Fryer P., Ambos E. L. & Husson D. M. 1985. Origin and emplacement of Mariana
forearc seamounts. Geology 13, 774-777.
Fryer P. 1996. Tectonic evolution of the Mariana convergent margin: Reviews of
Geophysics 34, 89-125.
Fryer P., Wheat C. G. & Mottl M. J. 1999. Mariana blueschist mud volcanism:
implications for conditions within the subduction zone. Geology 27, 103-
106.
Gill R. 2010. Igeneous Rocks and Processes: a practical guide. Wiley-Blackwell,
West Sussex.

83
Glen R. A. 1994. Cambro-Ordovician sedimentary/metamorphic rocks. In: Lewis
P. C., Glen R. A., Pratt G. W. & Clarke I. eds. Bega –Mallacoota 1:250 000
Geological Sheet SJ/55-4, SJ55-8: Explanatory Notes, pp. 15–33.
Geological Survey of New South Wales, Sydney.
Glen R., Walshe J., Barron L. & Watkins, J. 1998. Ordovician convergent-margin
volcanism and tectonism in the Lachlan sector of east Gondwana.
Geology 26, 751-754.
Glen R. A., Stewart I. R. & Percival I. G. 2004. Narooma Terrane: implications for
the construction of the outboard part of the Lachlan Orogen. Australian
Journal of Earth Sciences 51, 859–884.
Gray D. R. 1997. Tectonics of the southeastern Australian Lachlan Fold Belt.
Structural and Thermal Aspects. In: Burg J. P. & Ford M. eds. Orogeny
Through Time, Geological Society of London Special Publication 121 pp.
149–177.
Gray, D. R., Foster, D. A. and Bucher, M. B. 1997. Recognition and definition of
orogenic events in the Lachlan Fold Belt. Australian Journal of Earth
Sciences 44, 489-501.
Gray D. R. & Foster D. A. 1998. Character and kinematics of faults within
turbidite-dominated Lachlan Orogen: implications for tectonic evolution of
eastern Australia. Journal of Structural Geology 20, 1691–1720.
Gray D. & Foster D. 2004. Tectonic evolution of the Lachlan Orogen, southeast
Australia:historical review, data synthesis and modern perspectives.
Australian Journal of Earth Sciences 51, 773-817.
Gray D., Foster D. & Bucher M. 1997. Recognition and definition of orogenic
events in the Lachlan Fold Belt. Australian Journal of Earth Sciences 44,
489-501.
Heier K. S. & Billings G. K. 1970. Rubidium. In Wedepohl K. H. ed. Handbook of
geochemistry, 2 (2), Springer-Verlag, Berlin/Heidelberg, pp. 37B1-37K3.

84
Hilde T. W. C. 1983. Sediment subduction versus accretion around the Pacific.
Tectonophysics 99,381-397.
Hough M., Bierlein F. & Wilde A. 2007. A review of the metallogeny and
tectonics of the Lachlan Orogen. Mineralium Deposita 42, 435-448.
Jenkins C. J., Kidd P. R. & Mills K. J. 1982. Upper Ordovician graptolites from the
Wagonga Beds near Batemans Bay, New South Wales. Journal of the
Geological Society of Australia 29, 367-373.
Jones B. & Manning D. A. C. 1994. Comparison of geochemical indices used for
the interpretation of palaeoredox conditions in ancient mudstones.
Chemical Geology 111, 111-129.
Karig D. E. & Sharman G. F. 1975. Subduction and accretion in trenches.
Geological Society of America Bulletin 86 (3), 377-389.
Kearey P., Klepeis K. & Vine F. 2009. Global Tectonics, 3rd ed., Wiley-
Blackwell, West Sussex.
Kopf A, 2002. Significance of mud volcanism. Reviews of Geophysics 40, 1–51.
Le Maitre R. W. 1984. A proposal by the IUGS Subcommission on the
Systematics of Igneous Rocks for a chemical classification of volcanic
rocks based on the total alkali silica (TAS) diagram: (on behalf of the IUGS
Subcommission on the Systematics of Igneous Rocks). Australian Journal
of Earth Sciences, 31 (2), 243-255.
Lundberg N. & Moore J. C. 1986. Macroscopic structural features in Deep Sea
Drilling Project cores from forearc regions. In: Moore J. C. ed. Structural
Fabrics in Deep Sea Drilling Project Cores from Forearcs. Geological
Society of America Memoir 166, pp. 13 – 44. .
McLennan S. M., Hemming S. R., Taylor S. R. & Erikkson K. A. 1995. Early
Proterozoic crustal evolution: Geochemical and Nd-Pb isotopic evidence
85
from metasedimentary rocks, southwestern North America. Geochemimica
et Cosmochimica Acta 59 (6), 1153-1177.
McManus J., Berelson W. M., Klinkhammer G. P., Johnson K. S., Coale K. H,
Anderson R. F, Kumar N., Burdige D. J, Hammond D. E, Brumsack H. J.,
McCorkle D. C. & Rushdi A. 1998. Geochemistry of barium in marine
sediments: implications for its use as a paleoproxy, Geochimica et
Cosmochimica Acta 62, (21–22), 3453-3473.
Meschede M. 1986. A method of discriminating between different types of mid-
ocean ridge basalts and continental tholeiites with the Nb-Zr-Y diagram.
Chemical Geology 56, 207-218.
Mielke J.E. 1979. Composition of the Earth's crust and distribution of the
elements. In: Siegel, F.R. (Ed.), Review of Research on Modern Problems
in Geochemistry. UNESCO Report, Paris, pp. 13–37.
Miller J. McL. & Gray D. R. 1996. Structural signature of sediment accretion in a
Palaeozoic accretionary complex, southeastern Australia. Journal of
Structural Geology 18 (10), 1245-1258.
Miyashiro A. 1975. Classification, characteristics and origin of ophiolites. Journal
of Geology 83, 249–281.
Moore J. C. & Byrne T. 1987. Thickening of fault zones: a mechanism of mélange
formation in accreting sediments. Geology 15, 1040 – 1043.
Offler R., Miller J. M., Gray D. R., Foster D. A. & Bale R. 1998. Crystallinity and b0
spacing of K-white micas in a Paleozoic accretionary complex, eastern
Australia: metamorphism, paleogeotherms, and structural style of an
underplated sequence. Journal of Geology 106, 495-509.
Osozawa, S., Morimoto, J., & Flower, F.J. 2009. ‘Block-in-matrix’ fabrics that lack
shearing butpossess composite cleavage planes: A sedimentary mélange
origin for the Yuwan accretionarycomplex in the Ryukyu island arc, Japan.
Geological Society of America Bulletin 121 (7–8), 1190–1203.

86
Pearce J. 1996. A users guide to basalt discrimination diagrams. In Wyman D.
ed. Trace Element Geochemistry of Igneous Rocks: Applications for
Massive Sulphide Exploration: Geological Association of Canada, Short
Course Notes (12), pp.79-113.
Pearce J.A., Harris N.B.W., and Tindle A.G. 1984. Trace element discrimination
diagrams for the tectonic interpretation of granitic rocks. Journal of
Petrology 25 (4), 956-983.
Pearce J. & Cann J. 1973. Tectonic setting of basic volcanic rocks determined
using trace element analyses. Earth and Planetary Science Letters 19, 90-
300.
Percival. I. G., Quinn C.D. & Glen R. A. 2011. A review of Cambrian and
Ordovician stratigraphy in New South Wales. Quarterly Notes of the
Geological Survey of New South Wales 137, 1-41.
Powell C. McA. 1983. Tectonic relationshiup between the Late Ordovician and
Late Silurian palaeogeographies of southeastern Australia. Journal of the
Geological Society of Australia 30 (3-4), 353-373.
Powell C. McA. 1984. Ordovician to earliest Silurian: marginal sea and island arc;
Silurian to mid-Devonian dextral transtensional margin; Late Devonian and
Early Carboniferous: continental magmatic arc along the eastern edge of
the Lachlan Fold Belt. In: Veevers J. J. ed. Phanerozoic Earth History of
Australia, pp. 290–340. Clarendon Press, Oxford
Prendergast E. I. 2007. Early Palaeozoic subduction in the southeastern Lachlan
Fold Belt, Batemans Bay, New South Wales. Australian Journal of Earth
Sciences 54 (4), 481-501.
Prendergast E. I. & Offler R. 2012. Underplated seamount in the Narooma
accretionary complex, NSW, Australia. Lithos 154, 224-234.
Prendergast E. I., Offler R., Phillips D. & Zwingmann H. 2011. 40Ar/39Ar and K–Ar
ages: early Paleozoic metamorphism and deformation in the Narooma
accretionary complex, NSW. Australian Journal of Earth Sciences 58 (1),
21-32.

87
Robertson A., Ocean Drilling Program Leg 160 Scientific Party. 1996. Mud
volcanism on the Mediterranean Ridge: initial results of Ocean Drilling
Program Leg 160. Geology 24, 239-242.
Robertson A.H.F. & Ustaömer T. 2011. Role of tectonic-sedimentary mélange and
Permian-Triassic cover units, central and southern Turkey, in Tethyan
continental margin evolution. Journal of Asian Earth Sciences 40, 98–120.
Rollinson H. 1993. Using Geochemical Data: Evaluation, Presentation,
Interpretation. Pearson Prentice Hall, Essex.
Salminen, R., Batista, M. J., Bidovec. M., Demetriades. A., De Vivo. B., De Vos.
W., Duris. M., Gilucis. A., Gregorauskiene. V., Halamic. J., Heitzmann. P.,
Lima. A., Jordan. G., Klaver. G., Klein. P., Lis. J., Locutura. J., Marsina. K.,
Mazreku. A., O'Connor. P. J., Olsson. S.Å., Ottesen. R.-T., Petersell. V.,
Plant, J.A., Reeder. S., Salpeteur. I., Sandström. H., Siewers. U., Steenfelt.
A. & Tarvainen. T. 2005. Geochemical Atlas of Europe. Part 1: Background
Information, Methodology and Maps. Espoo, Geological Survey of Finland.
Shaw D. M. 1968. A review of K-Rb fractionation trends by covariance
analysis. Geochimica et Cosmochimica Acta 32 (6), 573-601.
Shervais J. W. 1982. Ti-V plots and the petrogenesis of modern and ophiolitic
lavas. Earth and planetary science letters, 59 (1), 101-118.
Shipboard Scientific Party. 1992. Synthesis of results, Leg 143. In Sager W. W.,
Winterer E. L. & Firth J. V. et al. Proceedings of the Ocean Drilling
Program. Initial Reports 143, 13-29.
Shipboard Scientific Party. 2001. Site 1174. In: Moore G. F., Taira A., Klaus A. et
al. Proceedings Ocean Drilling Project Initial Reports 190, pp. 1 – 149.
Sivell W. & Rankin P. 1983. Arc-tholeiite and ultramafic cumulate, Brook Street
Volcanics, west O’Urvilie Island, New Zealand. New Zealand Journal of
Geology and Geophysics 26 (3), 239-257.

88
Stern R. J. & Smoot N. C. 1998. A bathymetric overview of the Mariana forearc.
The Island Arc 7, 525-540.
Stewart I. R. & Glen R. A. 1991. New Cambrian and Early Ordovician ages from
the New South Wales south coast. Quarterly Notes of the Geological
Survey of New South Wales 85, 1–8.
Stride A.H., Belderson R.H. & Kenyon N.H. 1982. Structural grain, mud
volcanoes and other features on the Barbados Ridge Complex revealed by
Gloria long-range side-scan sonar. Marine Geology 49, 187–196
Sumner R. H & Westbrook G. K. 2001. Mud diapirism in front of the Barbados
Ridge accretionary wedge: the influence of fracture zones and North
America-South America plate motions. Marine and Petroleum Geology 18
(5), 591-613.
Taira A., Hill J. F., Berner U., Bruckmann T., Byrne T.,Chabernaud A. F. &
Poucher J. P. 1992. Sediment deformation and hydrogeology of the Nankai
Trough accretionary prism: synthesis of shipboard results of ODP Leg 131.
Earth and Planetary Science Letters 109, 431 – 450.
Taylor S. R., Emeleus C. H. & Exley C. S. 1956. Some anomalous K/Rb ratios in
igneous rocks and their petrological significance. Geochimica et
Cosmochimica Acta 10, 284-229.
Taylor S. R. & McLennan S. M. 1985. The Continental Crust: Its Composition and
Evolution. Blackwell, Oxford.
Van Kranendonk M. J., Collins W. J., Hickman A., & Pawley M. J. 2004. Critical
tests of vertical vs. horizontal tectonic models for the Archaean East
Pilbara Granite–Greenstone Terrane, Pilbara Craton, Western Australia.
Precambrian Research 131, 173-211.
VandenBerg A. H. M. & Stewart I. R. 1992. Ordovician terranes of the
southeastern Lachlan Fold Belt: stratigraphy, structure and
palaeogeographic reconstruction. Tectonophysics 214, 159 – 176.

89
VandenBerg A. H. M., Willman C. E., Maher S., Simons B. A., Cayley R. A.,
Taylor D. H., Morand V. J., Moore D. H. & Radojkovic A. 2000. The
Tasman Fold Belt System in Victoria. Geology and Mineralisation of
Proterozoic to Carboniferous rocks. Geological Survey of Victoria Special
Publication.
von Huene R. & Scholl D. W. 1991. Observations at convergent margins
concerning sediment subduction, subduction erosion, and the growth of
continental crust. Reviews of Geophysics 29 (3), 217-284.
Wakita K. 2012. Mappable features of mélanges derived from Ocean Plate
Stratigraphy in the Jurassic accretionary complexes of Mino and
Chichibu terranes in Southwest Japan. Tectonophysics (568–569), 74–85.
Williams P. R., Pigram C. J. & Dow D. B. 1984. Mélange production and the
importance of shale diapirism in accretionary terranes. Nature 309, 145-
146.
Winchester J. & Floyd P. 1977. Geochemical discrimination of different magma
series and their differentiation products using immobile elements. Chemical
Geology 20, 325-343.
Winter, J. 2001. An Introduction to Igneous and Metamorphic Petrology. Prentice
Hall, New Jersey.
Yamagata T. & Ogawa Y. 1989. Role of mud diapirism for the formation of chaotic
rocks. Journal of Geological Sciences, Japan 95 (4), 297-310.

90
APPENDIX A
SAMPLE LIST
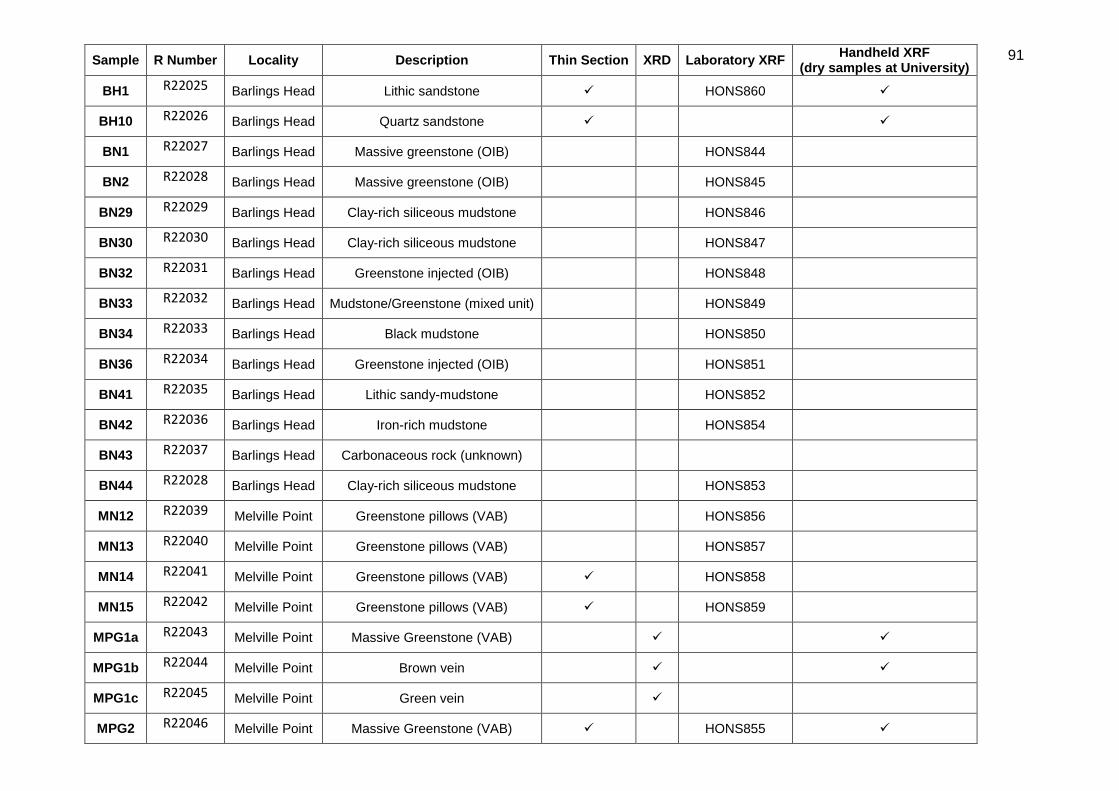
91
Sample R Number Locality Description Thin Section XRD Laboratory XRF Handheld XRF
(dry samples at University)
BH1 R22025 Barlings Head Lithic sandstone HONS860
BH10 R22026 Barlings Head Quartz sandstone
BN1 R22027 Barlings Head Massive greenstone (OIB) HONS844
BN2 R22028 Barlings Head Massive greenstone (OIB) HONS845
BN29 R22029 Barlings Head Clay-rich siliceous mudstone HONS846
BN30 R22030 Barlings Head Clay-rich siliceous mudstone HONS847
BN32 R22031 Barlings Head Greenstone injected (OIB) HONS848
BN33 R22032 Barlings Head Mudstone/Greenstone (mixed unit) HONS849
BN34 R22033 Barlings Head Black mudstone HONS850
BN36 R22034 Barlings Head Greenstone injected (OIB) HONS851
BN41 R22035 Barlings Head Lithic sandy-mudstone HONS852
BN42 R22036 Barlings Head Iron-rich mudstone HONS854
BN43 R22037 Barlings Head Carbonaceous rock (unknown)
BN44 R22028 Barlings Head Clay-rich siliceous mudstone HONS853
MN12 R22039 Melville Point Greenstone pillows (VAB) HONS856
MN13 R22040 Melville Point Greenstone pillows (VAB) HONS857
MN14 R22041 Melville Point Greenstone pillows (VAB) HONS858
MN15 R22042 Melville Point Greenstone pillows (VAB) HONS859
MPG1a R22043 Melville Point Massive Greenstone (VAB)
MPG1b R22044 Melville Point Brown vein
MPG1c R22045 Melville Point Green vein
MPG2 R22046 Melville Point Massive Greenstone (VAB) HONS855

92
Sample R Number Locality Description Thin
Section XRD
Laboratory XRF
N2 R22047 Lithic sandstone Barlings Head
N3 R22048 Clay-rich siliceous mudstone Barlings Head
N7 R22049 Cherty-mudstone (mixed unit) Barlings Head
N9 R22050 Clay-rich siliceous mudstone Barlings Head
N10 R22051 Greenstone injected (OIB) Barlings Head
N11 R22052 Black mudstone Barlings Head
N12 R22053 Quartz sandstone Barlings Head
N14 R22054 Carbonaceous rock (unknown) Barlings Head
N15 R22055 Clay-rich siliceous mudstone Barlings Head
N16 R22056 Iron-rich mudstone Barlings Head
N20 R22057 Lithic sandy-mudstone Barlings Head
N21 R22058 Clay-rich siliceous mudstone Barlings Head

93
APPENDIX B
XRD RESULTS

94
Sample N2 N3 N7 N9 N10 N11 N12 N14 N15 N16 N20 N21 MPG1a MPG1b MPG1c
Chi Squared 4.22 3.26 2.81 3 2.13 3.4 3.21 1.98 3.41 3.03 4.15 3.22 4.75 3.18 5.03
Quartz 20.9 53 80 54.1 12.4 47.7 66.6 64.9 56.6 78.6 31.8 53.9 20.4 67.3 30.4
Albite 56.3 0.6 0 0.2 54.7 2 11.3 2.6 0 0 42.4 0 0 1.9
Muscovite 11.4 39.5 12.3 34.4 1.4 38.8 9.3 15.3 26.2 3.2 14.3 37.8 63.5 0.2 26.3
Chlorite 4.1 2.6 0.5 2.5 5.9 1.6 0.4 2.4 4.6 1 2.4 1.9 9.9 0.5
Kaolin 7 3.3 3.9 2.9 2 0.4 0.5 3.9 2 3.7 4.4 2.5 5.9 3.6 0.4
Illite 0 0 2.9 4.8 6.8 8.6 1.6 4 6.7 4.7 2.4 2.9 0 4.6 42.9
Siderite 0 0 0.1 0 0 0 3.6 0 0 0 0 0 0 0.6 0
Pyrite 0.4 1 0.4 1.1 3.4 1 0.2 0 0 1 0 1 0.2 0.8 0
Mixed layer clays 0 0 0 0 13.4 0 0 6.9 3.9 0 2.4 0 0 4.3 0
Goethite 0 0 0 0 0 0 0 0 0 7.9 0 0 0 15.6 0
Biotite 0 0 0 0 0 0 6.4 0 0 0 0 0 0 0 0

95
APPENDIX C
LABORATORY XRF RESULTS

96
Cat. No. HONS844 HONS845 HONS846 HONS847 HONS848 HONS849 HONS850 HONS851
Rock type BH
massive greenstone
BH massive
greenstone
Clay-rich siliceous
mudstone
Clay-rich siliceous
mudstone
BH injected
greenstone
Mixed mudstone/ greenstone
Black mudstone
BH injected
greenstone
Sample BN1 BN2 BN29 BN30 BN32 BN33 BN34 BN36
Major elements (wt%)
Na2O 1.49 1.65 0.22 0.43 0.69 0.26 4.40 4.32
MgO 5.52 5.30 1.52 1.31 3.58 1.50 1.60 4.69
Al2O3 17.81 16.82 14.99 16.16 17.40 15.36 13.21 17.24
SiO2 47.33 49.32 64.14 66.94 43.25 66.96 66.46 48.86
P2O5 0.52 0.59 0.11 0.09 0.47 0.09 0.09 0.69
S 0.02 0.02 0.01 0.02 0.04 0.02 0.04 0.02
K2O 4.02 3.76 4.46 4.16 2.48 4.62 0.80 2.21
CaO 0.36 0.52 0.04 0.05 0.36 0.06 0.16 0.96
TiO2 2.72 2.55 0.64 0.67 1.14 0.67 0.84 2.40
MnO 0.05 0.05 0.07 0.05 0.09 0.04 0.07 0.12
Fe2O3 11.74 10.98 4.94 4.85 17.42 3.39 5.81 11.57
LOI 8.49 7.62 8.70 5.78 12.18 8.54 5.30 7.92
O=S -0.01 -0.01 -0.01 -0.01 -0.02 -0.01 -0.02 -0.01
Total 100.09 99.19 99.86 100.54 99.15 101.52 98.83 101.02
Trace elements (ppm)
S 124 2064 4646 589 2634 5184 1608 325
Cl 1627 67130 39850 4720 59940 33940 3127 5491
V 279 247 110 115 418 111 706 206
Cr 410 306 106 133 29 108 86 310
Co 27 34 14 7 24 14 13 72
Ni 172 163 22 23 61 19 19 190
Cu 34 41 106 109 701 68 105 38
Zn 72 74 112 60 272 41 157 191
Ga 17 16 20 20 21 19 19 14
Ge <1 1 2 3 1 2 2 2
As 1 17 6 22 26 12 8 23
Se <1 <1 <1 <1 <1 <1 <1 <1
Br 5 19 21 12 33 23 10 15
Rb 84 75 156 155 85 150 24 62
Sr 81 95 18 14 42 31 324 143
Y 24 26 26 12 55 20 15 55
Zr 237 221 128 131 101 153 91 214
Nb 74 68 13 14 5 13 4 65
Mo <1 <1 <1 <1 <1 <1 <1 <1
Cd <2 <2 <2 <2 <2 <2 <2 <2
Sn <3 <3 <3 <3 <3 <3 <3 <3
Sb <3 3 3 3 3 <3 4 <3
I <3 <3 <3 <3 <3 <3 <3 <3
Cs <4 <4 <4 <4 <4 <4 <4 <4
Ba 1016 683 929 777 595 1035 1325 262
La 28 31 28 17 <4 35 8 67
Ce <4 56 58 30 <4 77 <4 141
Hf 5 7 4 5 11 1 5 8
W <3 <3 <3 <3 <3 <3 <3 <3
Hg <1 <1 <1 <1 <1 <1 <1 <1
Pb <1 <1 <1 <1 <1 <1 <1 <1
Bi <1 <1 <1 <1 <1 <1 <1 <1
Th 6.5 6.6 16.6 17.8 3 17.1 1.7 5.2
U <1 <1 1.3 1.3 <1 <1 5.4 <1

97
Cat. No. HONS852 HONS853 HONS854 HONS855 HONS856 HONS857 HONS858 HONS859 HONS860
Rock type
Lithic sandy-
mudstone
Clay-rich siliceous
mudstone
Iron-rich mudstone
MP massive
greenstone
MP pillow greenstone
MP pillow greenstone
MP pillow greenstone
MP pillow greenstone
MP pillow greenstone
Sample BN41 BN44 BN42 MPG2 MN12 MN13 MN14 MN15 BH1
Major elements (wt%)
Na2O 3.03 0.33 0.25 0.35 0.59 0.76 0.68 0.61 3.04
MgO 2.65 1.13 2.13 3.34 3.48 3.64 3.65 4.87 3.46
Al2O3 17.33 14.73 14.12 20.85 23.42 24.40 22.00 23.55 15.66
SiO2 58.42 69.04 65.92 54.77 52.04 48.15 51.96 47.73 54.10
P2O5 0.14 0.09 0.14 0.12 1.14 0.74 0.71 0.72 0.30
S 0.03 0.03 0.02 0.02 0.00 0.03 0.03 0.03 0.05
K2O 2.61 3.67 3.55 4.67 5.97 6.67 5.65 5.80 2.08
CaO 0.22 0.05 0.11 0.07 1.72 0.84 1.35 0.99 0.14
TiO2 0.82 0.62 0.60 1.54 1.32 1.39 1.28 1.34 0.76
MnO 0.10 0.06 0.08 0.10 0.03 0.03 0.03 0.04 1.00
Fe2O3 8.10 4.46 7.46 8.01 6.13 4.57 5.21 7.32 11.52
LOI 5.30 6.44 5.82 7.12 6.45 7.68 7.14 7.78 6.84
O=S -0.02 -0.01 -0.01 -0.01 0.00 -0.01 -0.02 -0.01 -0.02
Total 98.79 100.68 100.21 100.99 102.31 98.94 99.73 100.78 99.01
Trace elements (ppm)
S 766 2721 725 419 79 834 1607 929 823
Cl 7714 19800 10810 6174 2770 22800 17290 13460 5643
V 229 102 192 581 440 503 514 689 242
Cr 95 112 244 986 1228 1418 1318 1349 94
Co 21 6 23 19 18 31 29 21 60
Ni 26 22 112 151 64 106 96 154 36
Cu 203 96 83 173 155 118 106 135 243
Zn 189 75 87 104 87 65 79 113 263
Ga 16 18 16 20 19 22 20 19 17
Ge 3 1 1 3 2 1 1 3 2
As 7 13 19 16 1 1 <1 2 6
Se <1 <1 <1 <1 <1 <1 <1 <1 <1
Br 15 23 11 9 5 26 31 19 14
Rb 72 131 95 100 103 117 101 104 69
Sr 153 14 71 22 60 51 44 43 160
Y 35 12 22 27 41 57 48 49 195
Zr 89 131 191 89 63 72 68 73 104
Nb 4 13 46 7 4 5 4 5 4
Mo <1 <1 <1 <1 <1 <1 <1 <1 <1
Cd <2 <2 <2 <2 <2 <2 <2 <2 <2
Sn <3 <3 <3 <3 <3 <3 <3 <3 <3
Sb <3 <3 <3 <3 <3 <3 <3 <3 <3
I <3 <3 <3 <3 <3 <3 <3 <3 <3
Cs <4 <4 <4 <4 <4 <4 <4 <4 <4
Ba 536 713 654 765 1144 1318 1105 1113 406
La 38 8 35 12 <4 <4 4 <4 33
Ce 60 32 60 12 20 20 9 5 68
Hf 5 4 6 4 4 4 4 4 15
W <3 <3 <3 <3 <3 <3 <3 <3 <3
Hg <1 <1 <1 <1 <1 <1 <1 <1 <1
Pb <1 <1 <1 <1 <1 <1 <1 <1 <1
Bi <1 <1 <1 <1 <1 <1 <1 <1 <1
Th 2.4 15.5 9.6 <1 0.5 <1 <1 <1 4.5
U <1 <1 <1 18.2 27 30.4 19.3 55.1 <1

98
APPENDIX D
HAND-HELD XRF RESULTS
(Laboratory)
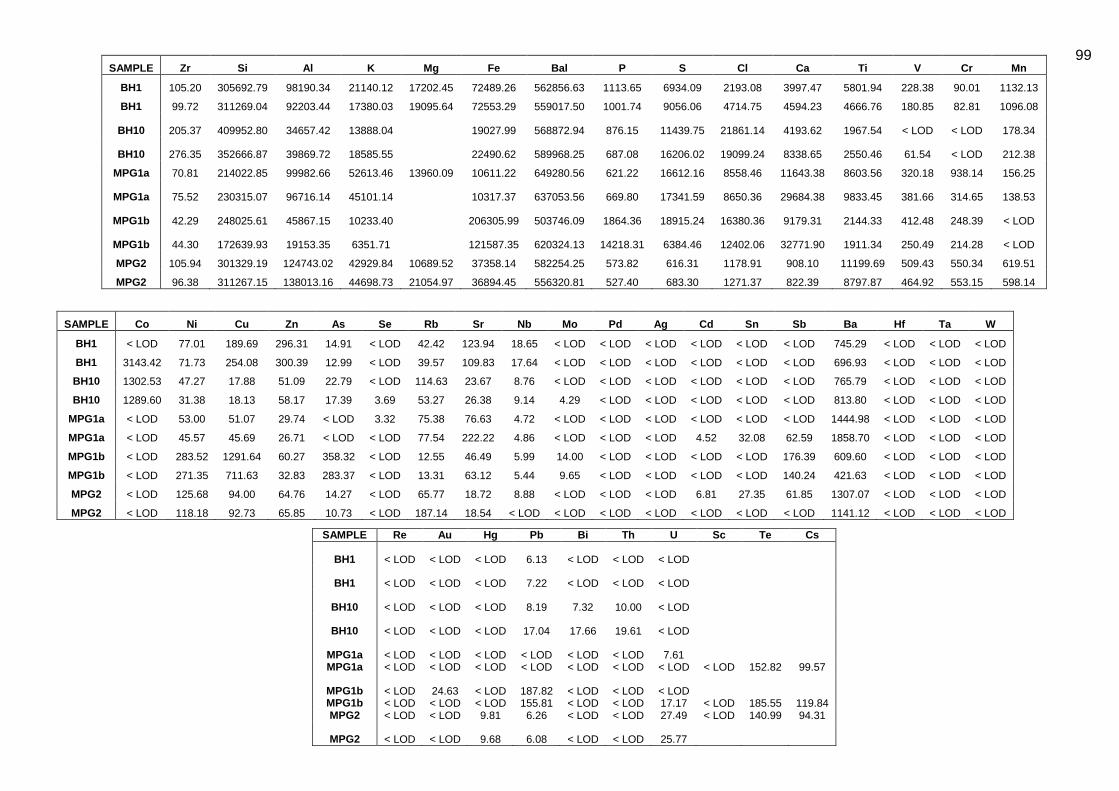
99
SAMPLE Zr Si Al K Mg Fe Bal P S Cl Ca Ti V Cr Mn
BH1 105.20 305692.79 98190.34 21140.12 17202.45 72489.26 562856.63 1113.65 6934.09 2193.08 3997.47 5801.94 228.38 90.01 1132.13
BH1 99.72 311269.04 92203.44 17380.03 19095.64 72553.29 559017.50 1001.74 9056.06 4714.75 4594.23 4666.76 180.85 82.81 1096.08
BH10 205.37 409952.80 34657.42 13888.04
19027.99 568872.94 876.15 11439.75 21861.14 4193.62 1967.54 < LOD < LOD 178.34
BH10 276.35 352666.87 39869.72 18585.55
22490.62 589968.25 687.08 16206.02 19099.24 8338.65 2550.46 61.54 < LOD 212.38
MPG1a 70.81 214022.85 99982.66 52613.46 13960.09 10611.22 649280.56 621.22 16612.16 8558.46 11643.38 8603.56 320.18 938.14 156.25
MPG1a 75.52 230315.07 96716.14 45101.14
10317.37 637053.56 669.80 17341.59 8650.36 29684.38 9833.45 381.66 314.65 138.53
MPG1b 42.29 248025.61 45867.15 10233.40
206305.99 503746.09 1864.36 18915.24 16380.36 9179.31 2144.33 412.48 248.39 < LOD
MPG1b 44.30 172639.93 19153.35 6351.71
121587.35 620324.13 14218.31 6384.46 12402.06 32771.90 1911.34 250.49 214.28 < LOD
MPG2 105.94 301329.19 124743.02 42929.84 10689.52 37358.14 582254.25 573.82 616.31 1178.91 908.10 11199.69 509.43 550.34 619.51
MPG2 96.38 311267.15 138013.16 44698.73 21054.97 36894.45 556320.81 527.40 683.30 1271.37 822.39 8797.87 464.92 553.15 598.14
SAMPLE Co Ni Cu Zn As Se Rb Sr Nb Mo Pd Ag Cd Sn Sb Ba Hf Ta W
BH1 < LOD 77.01 189.69 296.31 14.91 < LOD 42.42 123.94 18.65 < LOD < LOD < LOD < LOD < LOD < LOD 745.29 < LOD < LOD < LOD
BH1 3143.42 71.73 254.08 300.39 12.99 < LOD 39.57 109.83 17.64 < LOD < LOD < LOD < LOD < LOD < LOD 696.93 < LOD < LOD < LOD
BH10 1302.53 47.27 17.88 51.09 22.79 < LOD 114.63 23.67 8.76 < LOD < LOD < LOD < LOD < LOD < LOD 765.79 < LOD < LOD < LOD
BH10 1289.60 31.38 18.13 58.17 17.39 3.69 53.27 26.38 9.14 4.29 < LOD < LOD < LOD < LOD < LOD 813.80 < LOD < LOD < LOD
MPG1a < LOD 53.00 51.07 29.74 < LOD 3.32 75.38 76.63 4.72 < LOD < LOD < LOD < LOD < LOD < LOD 1444.98 < LOD < LOD < LOD
MPG1a < LOD 45.57 45.69 26.71 < LOD < LOD 77.54 222.22 4.86 < LOD < LOD < LOD 4.52 32.08 62.59 1858.70 < LOD < LOD < LOD
MPG1b < LOD 283.52 1291.64 60.27 358.32 < LOD 12.55 46.49 5.99 14.00 < LOD < LOD < LOD < LOD 176.39 609.60 < LOD < LOD < LOD
MPG1b < LOD 271.35 711.63 32.83 283.37 < LOD 13.31 63.12 5.44 9.65 < LOD < LOD < LOD < LOD 140.24 421.63 < LOD < LOD < LOD
MPG2 < LOD 125.68 94.00 64.76 14.27 < LOD 65.77 18.72 8.88 < LOD < LOD < LOD 6.81 27.35 61.85 1307.07 < LOD < LOD < LOD
MPG2 < LOD 118.18 92.73 65.85 10.73 < LOD 187.14 18.54 < LOD < LOD < LOD < LOD < LOD < LOD < LOD 1141.12 < LOD < LOD < LOD
SAMPLE Re Au Hg Pb Bi Th U Sc Te Cs
BH1 < LOD < LOD < LOD 6.13 < LOD < LOD < LOD
BH1 < LOD < LOD < LOD 7.22 < LOD < LOD < LOD
BH10 < LOD < LOD < LOD 8.19 7.32 10.00 < LOD
BH10 < LOD < LOD < LOD 17.04 17.66 19.61 < LOD
MPG1a < LOD < LOD < LOD < LOD < LOD < LOD 7.61
MPG1a < LOD < LOD < LOD < LOD < LOD < LOD < LOD < LOD 152.82 99.57
MPG1b < LOD 24.63 < LOD 187.82 < LOD < LOD < LOD
MPG1b < LOD < LOD < LOD 155.81 < LOD < LOD 17.17 < LOD 185.55 119.84 MPG2 < LOD < LOD 9.81 6.26 < LOD < LOD 27.49 < LOD 140.99 94.31
MPG2 < LOD < LOD 9.68 6.08 < LOD < LOD 25.77

100
SAMPLE Zr Si Al K Mg Fe Bal P S Cl Ca Ti V Cr Mn
N1 84.56 209093.58 76009.95 13462.37
56287.22 637637.44 611.91 9122.66 59832.96 3362.63 4394.75 181.89 56.21 863.49
N2 57.71 155389.99 43630.92 10896.03
47823.38 657473.00 467.12 11626.93 112180.96 4021.58 2989.24 124.83 66.69 669.39
N3 161.39 263763.29 65001.74 28495.24
32391.41 602010.94 634.95 28115.27 44873.26 6869.18 4304.21 204.10 64.96 754.87
N3 147.77 295243.93 97398.81 40408.40
34300.19 575763.25 465.51 20711.06 14175.49 5052.68 4203.30 98.97 84.08 748.36
N4 102.10 201542.23 72748.65 18665.86
55560.01 660094.63 511.16 16582.63 29808.70 7749.04 4211.86 147.87 79.61 904.87
N4 104.83 215765.18 71785.72 16537.47
56569.01 660853.94 608.84 17650.89 17947.52 6755.56 4423.40 284.97 28.48 875.46
N7 50.51 168802.93 66332.14 29327.40
40335.36 686641.63 836.53 2109.13 61254.02 1254.62 5470.22 88.20 112.31 189.42
N15 639.38 330491.09 77133.30 23452.96 19802.75 51561.78 521918.91 853.68 12496.90 1703.69 44502.45 6507.87 235.47 56.71 877.48
N15 777.19 313232.32 68997.91 20417.42 15625.93 51001.23 546955.56
8034.02 1713.31 47348.42 5746.69 106.05 59.15 972.01
N16 167.54 289733.29 108754.58 10626.74
111690.53 564522.31 899.52 1604.80 3470.63 1847.60 5316.17 96.54 84.46 341.18
N21 167.34 333201.90 103036.47 41657.55 16656.76 34715.74 539079.88 770.83 23747.24 2557.46 8138.70 4490.17 245.26 73.59 659.76
SAMPLE Cu Zn As Se Rb Sr Nb Mo Pd Ag Cd Sn Sb Ba Hf Ta W
N1 116.08 181.22 8.47 < LOD 88.00 140.24 6.35 < LOD < LOD < LOD < LOD < LOD < LOD 577.50 < LOD < LOD < LOD
N2 135.33 131.82 12.45 < LOD 41.15 79.34 3.93 < LOD < LOD < LOD < LOD < LOD < LOD 401.39 < LOD < LOD < LOD
N3 72.94 110.57 6.10 < LOD 103.79 22.63 14.02 < LOD < LOD 9.18 4.62 31.37 57.37 1377.84 < LOD < LOD < LOD
N3 73.78 112.05 5.60 < LOD 106.60 18.35 13.35 < LOD < LOD < LOD < LOD < LOD < LOD 1104.19 < LOD < LOD < LOD
N4 141.98 183.02 13.53 4.24 43.74 208.63 8.85 < LOD < LOD < LOD < LOD < LOD < LOD 747.90 < LOD < LOD < LOD
N4 134.05 230.17 13.18 < LOD 37.80 205.52 6.50 < LOD < LOD 10.92 6.22 31.81 86.03 1014.74 < LOD < LOD < LOD
N7 56.74 20.72 4.83 < LOD 60.24 10.39 3.63 < LOD < LOD < LOD < LOD < LOD < LOD 655.21 < LOD < LOD < LOD
N15 105.38 141.97 9.29 < LOD 70.39 113.04 11.93 < LOD < LOD 10.47 8.75 33.78 76.83 1169.76 < LOD < LOD < LOD
N15 132.90 152.25 11.47 < LOD 61.67 80.29 13.28 < LOD < LOD < LOD < LOD < LOD < LOD 931.14 < LOD < LOD < LOD
N16 139.30 100.15 15.31 < LOD 44.69 15.25 14.49 < LOD < LOD < LOD < LOD < LOD < LOD 970.04 < LOD < LOD < LOD
N21 89.78 116.75 10.63 < LOD 108.22 26.51 15.51 < LOD < LOD 10.84 6.40 33.66 61.52 1644.77 < LOD < LOD < LOD
SAMPLE Re Au Hg Pb Bi Th U Sc Te Cs
N1 < LOD < LOD < LOD 7.46 < LOD < LOD < LOD
N2 < LOD < LOD 9.83 8.80 < LOD < LOD < LOD
N3 < LOD < LOD < LOD 9.01 19.92 22.49 10.89 < LOD 138.80 101.43
N3 < LOD < LOD 10.29 8.39 24.51 24.54 10.99
N4 < LOD < LOD < LOD 6.34 < LOD < LOD < LOD
N4 < LOD < LOD < LOD 14.58 < LOD < LOD < LOD < LOD 156.17 103.58
N7 < LOD < LOD < LOD 6.07 < LOD < LOD < LOD
N15 < LOD < LOD < LOD 11.80 22.39 24.32 10.91 < LOD 161.38 112.51
N15 < LOD < LOD < LOD 25.01 23.72 25.24 10.36
N16 < LOD < LOD < LOD < LOD 9.36 12.05 10.90
N21 < LOD < LOD < LOD 14.17 19.21 20.58 14.51 < LOD 150.54 111.32

101
APPENDIX E
HAND-HELD XRF RESULTS
(Field)

102
UNIT Locality Cr Mn Co Ni Cu Zn As Se Rb Sr Nb Mo Pd Ag
BH injected greenstone BH 206.02 439.52
15.57 79.81 906.93 46.92 < LOD 59.91 49.38 49.98 < LOD < LOD < LOD
BH injected greenstone BH 122.98 164.56
15.28 46.67 231.80 38.94 < LOD 88.86 86.99 33.63 2.68 < LOD < LOD
BH injected greenstone BH 199.57 260.17
34.02 41.01 356.75 50.08 < LOD 63.01 65.95 59.34 3.39 < LOD < LOD
BH injected greenstone BH 62.11 203.94
< LOD 79.18 262.19 6.59 < LOD 156.57 104.40 < LOD 3.18 < LOD < LOD
BH injected greenstone BH 123.65 281.01
16.07 54.89 232.76 35.81 < LOD 61.10 114.74 43.33 3.51 < LOD < LOD
BH injected greenstone BH < LOD 329.67 < LOD 20.47 109.35 88.93 20.84 < LOD 30.51 29.32 2.43 < LOD < LOD < LOD
BH injected greenstone BH 37.42 340.84 < LOD < LOD 164.31 87.73 31.97 < LOD 119.92 59.00 4.91 3.43 < LOD < LOD
BH injected greenstone BH 41.98 499.28 18.56 < LOD 277.58 175.20 < LOD < LOD 38.81 119.22 3.68 < LOD < LOD < LOD
BH injected greenstone BH 51.86 404.07 11.09 < LOD 146.75 111.62 102.97 < LOD 40.81 126.02 14.13 4.58 < LOD < LOD
BH injected greenstone BH 235.21 473.42 < LOD 73.80 82.21 254.21 126.12 < LOD 44.91 70.42 58.27 4.85 < LOD < LOD
BH massive greenstone BH 186.40 545.20
79.58 53.58 220.88 96.76 < LOD 75.75 100.30 34.67 < LOD < LOD < LOD
BH massive greenstone BH 269.13 532.13
64.62 59.67 374.78 190.60 < LOD 196.92 119.97 53.99 < LOD < LOD < LOD
BH massive greenstone BH 228.35 295.96
49.50 45.58 204.91 84.94 < LOD 70.35 97.90 51.82 < LOD < LOD < LOD
BH massive greenstone BH 257.71 337.22
61.86 64.01 280.48 195.46 < LOD 169.34 123.46 54.91 < LOD < LOD < LOD
BH massive greenstone BH 249.36 379.35
66.73 50.53 294.08 237.20 < LOD 186.33 95.89 49.56 < LOD < LOD < LOD
BH massive greenstone BH 260.48 442.54 15.22 72.44 109.59 256.36 490.30 < LOD 35.47 48.37 67.36 < LOD < LOD < LOD
Black mudstone BH 31.00 142.06
< LOD 42.05 134.21 < LOD < LOD 70.22 177.08 7.59 3.56 < LOD < LOD
Black mudstone BH 50.07 151.86
15.01 36.07 99.17 < LOD < LOD 53.06 220.22 8.78 < LOD < LOD < LOD
Black mudstone BH < LOD 117.34
< LOD 44.70 86.14 < LOD < LOD 87.33 152.00 5.99 2.68 < LOD < LOD
Black mudstone BH 49.84 167.27
14.38 70.14 144.04 < LOD < LOD 58.60 172.20 8.66 4.74 < LOD < LOD
Black mudstone BH 76.54 789.01
17.93 123.60 449.34 38.76 < LOD 169.29 380.04 < LOD 15.49 < LOD < LOD
Black mudstone BH 36.32 550.84
< LOD 99.86 332.81 < LOD < LOD 51.10 358.21 7.37 10.60 < LOD < LOD
Black mudstone BH 42.68 452.77
20.91 70.01 258.11 41.89 4.08 105.18 394.26 7.19 12.02 < LOD < LOD
Black mudstone BH 68.25 616.40
13.14 101.03 301.75 9.48 5.97 50.41 386.87 7.79 8.45 < LOD < LOD
Black mudstone BH 60.03 415.63
14.99 40.20 256.10 10.78 < LOD 50.41 329.14 6.68 6.30 < LOD < LOD
Black mudstone BH 81.32 478.82
< LOD 56.07 239.04 8.23 < LOD 55.00 301.50 8.02 7.02 < LOD < LOD
Black mudstone BH < LOD 101.91
< LOD 153.67 159.52 < LOD < LOD 92.91 237.12 4.37 3.52 < LOD < LOD
Black mudstone BH 25.46 83.67
< LOD 105.87 45.92 5.42 < LOD 65.85 152.23 4.38 2.82 < LOD < LOD
Black mudstone BH 25.58 111.65
< LOD 34.64 74.52 10.14 < LOD 95.75 133.99 3.94 3.96 < LOD < LOD
Black mudstone BH 39.10 385.93 < LOD 20.24 136.96 84.57 18.10 7.38 45.61 243.84 < LOD 7.33 < LOD < LOD
Black mudstone BH 65.38 742.40 6.27 21.87 237.01 179.99 53.98 3.58 55.68 155.54 3.95 7.90 < LOD < LOD

103
UNIT Locality Cd Sn Sb Ba Hf Ta
Re Au Hg Pb Bi Th U Sc Te Cs
BH injected greenstone BH < LOD < LOD < LOD 1133.85 < LOD < LOD < LOD < LOD < LOD < LOD 6.95 < LOD < LOD
BH injected greenstone BH < LOD < LOD < LOD 435.22 < LOD < LOD < LOD < LOD < LOD < LOD < LOD < LOD < LOD
BH injected greenstone BH < LOD < LOD < LOD 471.14 < LOD < LOD < LOD < LOD < LOD < LOD < LOD < LOD < LOD
BH injected greenstone BH < LOD < LOD < LOD 907.45 < LOD < LOD < LOD < LOD < LOD < LOD < LOD < LOD < LOD
BH injected greenstone BH < LOD < LOD < LOD 423.47 < LOD < LOD < LOD < LOD < LOD < LOD < LOD < LOD < LOD
BH injected greenstone BH < LOD < LOD < LOD 881.59 < LOD < LOD
< LOD < LOD < LOD 27.17 < LOD < LOD
BH injected greenstone BH < LOD < LOD < LOD 959.81 < LOD < LOD
< LOD < LOD < LOD 14.75 < LOD < LOD
BH injected greenstone BH < LOD < LOD < LOD 772.61 < LOD < LOD
< LOD < LOD < LOD 9.35 < LOD < LOD
BH injected greenstone BH < LOD < LOD < LOD 990.27 < LOD < LOD
< LOD < LOD < LOD 16.10 < LOD 2.23
BH injected greenstone BH < LOD < LOD < LOD 1762.76 < LOD < LOD
< LOD < LOD 14.00 14.11 < LOD < LOD
BH massive greenstone BH < LOD < LOD < LOD 633.18 < LOD < LOD < LOD < LOD < LOD < LOD 12.94 < LOD < LOD
BH massive greenstone BH < LOD < LOD < LOD 965.22 < LOD < LOD < LOD < LOD < LOD 12.05 7.57 < LOD < LOD
BH massive greenstone BH < LOD < LOD < LOD 754.29 < LOD < LOD < LOD < LOD 7.76 < LOD < LOD < LOD < LOD
BH massive greenstone BH < LOD < LOD < LOD 1203.58 < LOD < LOD < LOD < LOD 9.53 < LOD < LOD < LOD < LOD
BH massive greenstone BH < LOD < LOD < LOD 822.35 < LOD < LOD < LOD < LOD < LOD < LOD 7.77 < LOD < LOD
BH massive greenstone BH < LOD < LOD < LOD 515.99 < LOD < LOD
< LOD < LOD < LOD 7.59 < LOD < LOD
Black mudstone BH 26.71 23.94 42.22 1814.43 < LOD < LOD < LOD < LOD < LOD < LOD 24.82 8.84 2.92
< LOD 140.14 87.96
Black mudstone BH < LOD < LOD < LOD 1246.10 < LOD < LOD < LOD < LOD < LOD < LOD 13.80 9.11 2.56
Black mudstone BH < LOD < LOD < LOD 757.85 < LOD < LOD < LOD < LOD < LOD < LOD 12.80 < LOD 1.23
Black mudstone BH < LOD < LOD < LOD 1380.42 < LOD < LOD < LOD < LOD < LOD < LOD 15.58 5.66 2.28
Black mudstone BH < LOD < LOD < LOD 1966.22 < LOD < LOD < LOD < LOD < LOD < LOD 13.29 < LOD < LOD
Black mudstone BH 16.46 23.45 34.10 1865.08 < LOD < LOD < LOD < LOD < LOD < LOD 14.00 < LOD < LOD
< LOD 114.13 80.16
Black mudstone BH < LOD < LOD < LOD 1556.99 < LOD < LOD < LOD < LOD < LOD < LOD 17.76 < LOD 1.41
Black mudstone BH < LOD < LOD < LOD 1435.59 < LOD < LOD < LOD < LOD < LOD 10.49 16.25 < LOD < LOD
Black mudstone BH < LOD < LOD < LOD 1506.92 < LOD < LOD < LOD < LOD < LOD < LOD 9.36 < LOD 1.40
Black mudstone BH < LOD < LOD < LOD 1352.16 < LOD < LOD < LOD < LOD < LOD < LOD 9.26 5.54 2.01
Black mudstone BH < LOD < LOD < LOD 732.65 < LOD < LOD < LOD < LOD < LOD < LOD 13.43 < LOD 1.71
Black mudstone BH < LOD < LOD < LOD 730.30 < LOD < LOD < LOD < LOD < LOD < LOD 8.23 < LOD 1.71
Black mudstone BH < LOD < LOD < LOD 973.58 < LOD < LOD < LOD < LOD < LOD < LOD 6.22 < LOD 1.39
Black mudstone BH < LOD < LOD < LOD 1412.95 < LOD < LOD
< LOD < LOD < LOD 17.48 < LOD < LOD
Black mudstone BH < LOD < LOD < LOD 2944.41 < LOD < LOD
< LOD < LOD < LOD < LOD < LOD < LOD

104
UNIT Locality Zr Si Al K Mg Fe Bal P S Cl Ca Ti V
Carbonaceous rock (unknown) BH 172.28 117668.43 17201.15 22298.34 < LOD 45956.07 768137.00 1268.20 10636.30 21277.38 3026.27 3637.14 < LOD
Disrupted chert BH 7.90 394154.27 4682.30 2559.28 < LOD 2847.40 639605.88 755.27 2643.76 20953.12 1421.42 165.27 152.79
Disrupted chert BH 37.62 418706.57 13438.06 9253.69 < LOD 11408.77 621254.56 329.22 406.12 2956.67 1983.49 1030.17 58.49
Disrupted chert BH 7.09 314308.62 1373.95 1495.33 < LOD 2950.36 725496.75 448.69 1413.96 6657.76 963.50 143.18 < LOD
Disrupted chert BH 37.87 460357.80 22274.08 10365.44 9213.90 8188.98 575505.25 280.64 496.12 3438.39 3138.53 1541.98 37.92
Disrupted chert BH 10.48 496564.56 2637.22 < LOD < LOD 2182.99 579488.00 < LOD 639.53 7063.23 528.41 83.86 41.65
Disrupted chert BH 17.45 396713.69 6296.66 4412.51 < LOD 1867.50 636080.13 < LOD 3698.16 13500.13 7421.76 658.98 < LOD
Disrupted chert BH < LOD 334333.52 5347.96 458.68 < LOD 2564.41 676701.44 1959.25 2374.92 23998.63 9076.13 37.78 < LOD
Disrupted chert BH 116.21 287573.81 31623.98 16003.06 < LOD 16650.73 653413.06 < LOD 8533.21 37877.74 4333.29 2587.50 < LOD
Clay-rich siliceous mudstone BH 88.51 97404.09 13003.12 13659.51 < LOD 8350.53 814692.25 < LOD 2703.65 15852.10 52544.16 1845.77 < LOD
Clay-rich siliceous mudstone BH 123.36 172331.31 27407.05 20019.84 < LOD 5839.96 776250.38 259.78 2576.95 8145.11 22981.87 2585.68 42.42
Clay-rich siliceous mudstone BH 132.98 188840.00 35846.78 24385.77 < LOD 22556.55 741434.81 669.58 4096.24 9822.97 14518.09 4226.95 193.19
Clay-rich siliceous mudstone BH 120.57 117791.71 21129.61 24988.55 < LOD 22910.87 801613.88 734.34 5513.01 12334.32 15057.20 3063.27 56.95
Clay-rich siliceous mudstone BH 94.45 201091.06 37249.26 24037.49 13226.73 24070.40 732595.63 817.06 3198.53 7604.71 5718.13 3027.82 < LOD
Clay-rich siliceous mudstone BH 108.41 167561.44 30220.63 24203.90 17109.50 30610.66 747926.69 818.90 4265.89 12467.28 5731.69 3103.59 44.30
Clay-rich siliceous mudstone BH 109.35 376095.45 74928.95 30339.41 18504.10 25687.47 566398.56 339.19 1642.88 5617.89 557.41 3615.05 59.03
Clay-rich siliceous mudstone BH 108.01 258073.66 52239.79 32199.72 19059.83 23595.64 669270.50 638.01 3666.17 8264.21 944.28 3386.89 60.19
Iron-rich mudstone BH 99.48 217049.37 36088.04 22820.70 < LOD 88396.34 653235.19 1237.64 5380.75 11167.98 3452.13 2888.24 101.58
Iron-rich mudstone BH 92.09 158975.82 23489.33 22080.99 < LOD 68072.47 724821.25 1120.25 8190.84 17322.94 5545.93 2597.37 114.42
Iron-rich mudstone BH 96.20 294642.40 46086.40 22765.71 22392.84 42711.67 632656.19 585.16 2357.92 5957.84 4489.38 2717.04 87.47
Lithic sandstone BH 107.66 304066.49 56516.57 27021.31 11963.27 28968.86 638098.13 518.63 2089.41 7052.89 723.45 3626.64 85.50
Lithic sandstone BH 79.85 242469.67 63832.68 11507.49 15814.90 62218.56 659232.56 849.86 2900.67 7288.57 1313.21 5474.53 188.68
Lithic sandy-mudstone BH 80.67 202382.71 42191.90 16279.67 < LOD 53542.17 717420.88 866.41 3185.92 9601.43 1185.49 5062.13 139.61
Lithic sandy-mudstone BH 66.24 223018.66 31738.35 8372.80 < LOD 57082.19 716807.94 819.71 2760.66 5547.81 1128.08 4079.35 73.14
Mixed cherty-mudstone BH 178.26 90986.22 2031.90 14712.23 < LOD 32031.21 869429.31 99.48 959.97 3231.96 1339.78 2148.55 72.86
Mixed cherty-mudstone BH 174.01 104875.85 22108.74 34200.86 < LOD 47400.99 806711.13 483.46 1771.65 2105.98 3589.14 4103.60 181.14
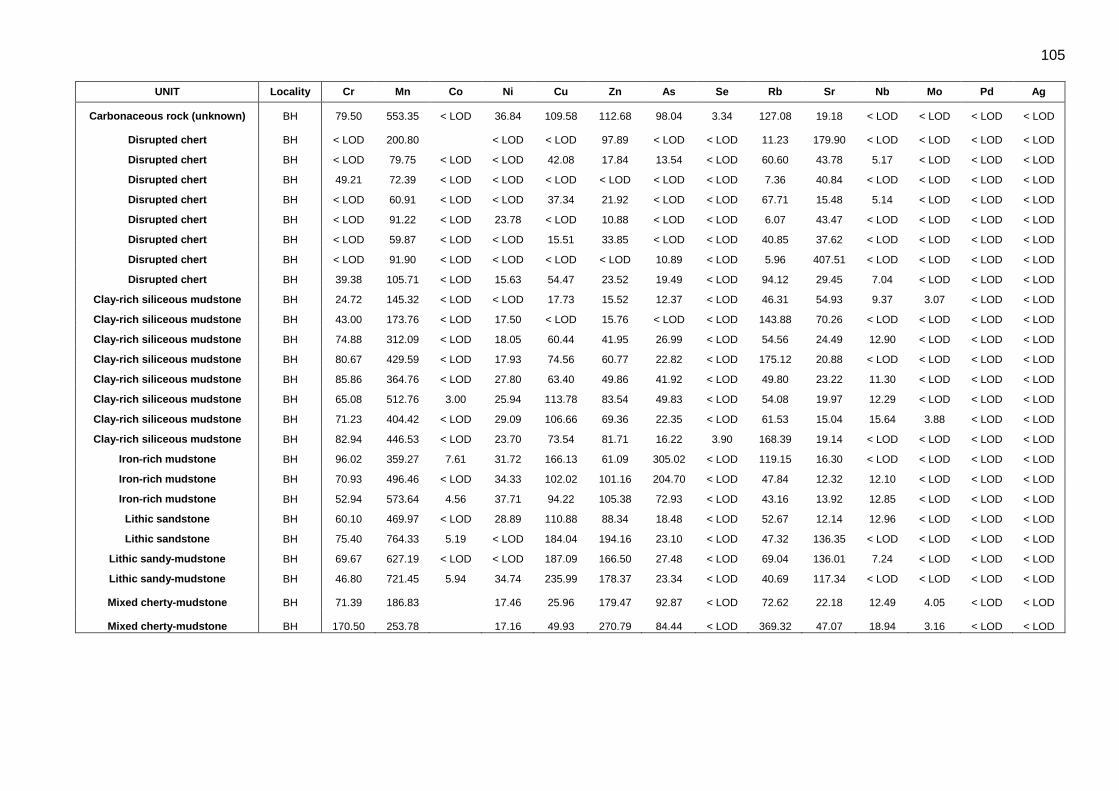
105
UNIT Locality Cr Mn Co Ni Cu Zn As Se Rb Sr Nb Mo Pd Ag
Carbonaceous rock (unknown) BH 79.50 553.35 < LOD 36.84 109.58 112.68 98.04 3.34 127.08 19.18 < LOD < LOD < LOD < LOD
Disrupted chert BH < LOD 200.80
< LOD < LOD 97.89 < LOD < LOD 11.23 179.90 < LOD < LOD < LOD < LOD
Disrupted chert BH < LOD 79.75 < LOD < LOD 42.08 17.84 13.54 < LOD 60.60 43.78 5.17 < LOD < LOD < LOD
Disrupted chert BH 49.21 72.39 < LOD < LOD < LOD < LOD < LOD < LOD 7.36 40.84 < LOD < LOD < LOD < LOD
Disrupted chert BH < LOD 60.91 < LOD < LOD 37.34 21.92 < LOD < LOD 67.71 15.48 5.14 < LOD < LOD < LOD
Disrupted chert BH < LOD 91.22 < LOD 23.78 < LOD 10.88 < LOD < LOD 6.07 43.47 < LOD < LOD < LOD < LOD
Disrupted chert BH < LOD 59.87 < LOD < LOD 15.51 33.85 < LOD < LOD 40.85 37.62 < LOD < LOD < LOD < LOD
Disrupted chert BH < LOD 91.90 < LOD < LOD < LOD < LOD 10.89 < LOD 5.96 407.51 < LOD < LOD < LOD < LOD
Disrupted chert BH 39.38 105.71 < LOD 15.63 54.47 23.52 19.49 < LOD 94.12 29.45 7.04 < LOD < LOD < LOD
Clay-rich siliceous mudstone BH 24.72 145.32 < LOD < LOD 17.73 15.52 12.37 < LOD 46.31 54.93 9.37 3.07 < LOD < LOD
Clay-rich siliceous mudstone BH 43.00 173.76 < LOD 17.50 < LOD 15.76 < LOD < LOD 143.88 70.26 < LOD < LOD < LOD < LOD
Clay-rich siliceous mudstone BH 74.88 312.09 < LOD 18.05 60.44 41.95 26.99 < LOD 54.56 24.49 12.90 < LOD < LOD < LOD
Clay-rich siliceous mudstone BH 80.67 429.59 < LOD 17.93 74.56 60.77 22.82 < LOD 175.12 20.88 < LOD < LOD < LOD < LOD
Clay-rich siliceous mudstone BH 85.86 364.76 < LOD 27.80 63.40 49.86 41.92 < LOD 49.80 23.22 11.30 < LOD < LOD < LOD
Clay-rich siliceous mudstone BH 65.08 512.76 3.00 25.94 113.78 83.54 49.83 < LOD 54.08 19.97 12.29 < LOD < LOD < LOD
Clay-rich siliceous mudstone BH 71.23 404.42 < LOD 29.09 106.66 69.36 22.35 < LOD 61.53 15.04 15.64 3.88 < LOD < LOD
Clay-rich siliceous mudstone BH 82.94 446.53 < LOD 23.70 73.54 81.71 16.22 3.90 168.39 19.14 < LOD < LOD < LOD < LOD
Iron-rich mudstone BH 96.02 359.27 7.61 31.72 166.13 61.09 305.02 < LOD 119.15 16.30 < LOD < LOD < LOD < LOD
Iron-rich mudstone BH 70.93 496.46 < LOD 34.33 102.02 101.16 204.70 < LOD 47.84 12.32 12.10 < LOD < LOD < LOD
Iron-rich mudstone BH 52.94 573.64 4.56 37.71 94.22 105.38 72.93 < LOD 43.16 13.92 12.85 < LOD < LOD < LOD
Lithic sandstone BH 60.10 469.97 < LOD 28.89 110.88 88.34 18.48 < LOD 52.67 12.14 12.96 < LOD < LOD < LOD
Lithic sandstone BH 75.40 764.33 5.19 < LOD 184.04 194.16 23.10 < LOD 47.32 136.35 < LOD < LOD < LOD < LOD
Lithic sandy-mudstone BH 69.67 627.19 < LOD < LOD 187.09 166.50 27.48 < LOD 69.04 136.01 7.24 < LOD < LOD < LOD
Lithic sandy-mudstone BH 46.80 721.45 5.94 34.74 235.99 178.37 23.34 < LOD 40.69 117.34 < LOD < LOD < LOD < LOD
Mixed cherty-mudstone BH 71.39 186.83
17.46 25.96 179.47 92.87 < LOD 72.62 22.18 12.49 4.05 < LOD < LOD
Mixed cherty-mudstone BH 170.50 253.78
17.16 49.93 270.79 84.44 < LOD 369.32 47.07 18.94 3.16 < LOD < LOD

106
UNIT Locality Cd Sn Sb Ba Hf Ta
Re Au Hg Pb Bi Th U Sc Te Cs
Carbonaceous rock (unknown) BH < LOD < LOD < LOD 672.18 < LOD < LOD
< LOD < LOD < LOD 6.60 < LOD 6.72
Disrupted chert BH 20.73 27.35 43.91 574.79 < LOD < LOD < LOD < LOD < LOD < LOD 20.25 < LOD < LOD
< LOD 150.98 79.87
Disrupted chert BH < LOD < LOD < LOD 610.95 < LOD < LOD
< LOD < LOD < LOD < LOD < LOD 1.50
Disrupted chert BH < LOD < LOD < LOD 574.27 < LOD < LOD
< LOD < LOD < LOD 10.27 < LOD < LOD
Disrupted chert BH < LOD < LOD < LOD 451.56 < LOD < LOD
< LOD < LOD < LOD 8.36 < LOD 2.18
Disrupted chert BH < LOD < LOD < LOD 196.40 < LOD < LOD
< LOD < LOD < LOD 8.67 < LOD < LOD
Disrupted chert BH < LOD < LOD < LOD 323.02 < LOD < LOD
< LOD < LOD 7.83 16.79 < LOD 1.51
Disrupted chert BH < LOD < LOD < LOD 207.80 < LOD < LOD
< LOD < LOD < LOD 8.31 < LOD 1.60
Disrupted chert BH < LOD < LOD < LOD 541.32 < LOD < LOD
< LOD < LOD < LOD 20.66 5.97 3.68
Clay-rich siliceous mudstone BH < LOD < LOD < LOD 647.72 < LOD < LOD
< LOD < LOD < LOD 8.42 12.54 5.83
Clay-rich siliceous mudstone BH < LOD < LOD < LOD 685.14 < LOD < LOD
< LOD < LOD < LOD 15.91 < LOD 6.21
< LOD 180.30 125.71
Clay-rich siliceous mudstone BH < LOD 22.50 29.73 954.72 < LOD < LOD
< LOD < LOD < LOD 15.25 19.94 8.70
< LOD 98.64 78.81
Clay-rich siliceous mudstone BH < LOD < LOD < LOD 809.68 < LOD < LOD
< LOD 6.23 < LOD 7.31 < LOD 8.79
Clay-rich siliceous mudstone BH < LOD < LOD < LOD 907.14 < LOD < LOD
< LOD < LOD < LOD 10.50 16.04 7.21
Clay-rich siliceous mudstone BH < LOD < LOD < LOD 712.07 < LOD < LOD
< LOD < LOD 11.44 8.09 18.94 8.29
Clay-rich siliceous mudstone BH < LOD < LOD < LOD 981.39 < LOD < LOD
< LOD < LOD < LOD 22.21 20.45 9.03
Clay-rich siliceous mudstone BH < LOD < LOD < LOD 1064.81 < LOD < LOD
< LOD < LOD 10.75 21.84 < LOD 7.80
Iron-rich mudstone BH < LOD < LOD < LOD 905.75 < LOD < LOD
< LOD < LOD < LOD 19.72 < LOD 4.29
Iron-rich mudstone BH < LOD < LOD < LOD 859.47 < LOD < LOD
< LOD < LOD < LOD 18.09 15.51 5.91
Iron-rich mudstone BH < LOD < LOD < LOD 719.21 < LOD < LOD
< LOD < LOD < LOD 9.34 24.50 10.80
Lithic sandstone BH < LOD < LOD < LOD 725.46 < LOD < LOD
< LOD < LOD < LOD 15.48 16.87 7.65
Lithic sandstone BH < LOD < LOD < LOD 415.63 < LOD < LOD
< LOD < LOD < LOD 8.48 < LOD < LOD
Lithic sandy-mudstone BH < LOD < LOD < LOD 608.61 < LOD < LOD
< LOD < LOD < LOD < LOD < LOD < LOD
Lithic sandy-mudstone BH < LOD < LOD < LOD 440.83 < LOD < LOD
< LOD < LOD < LOD < LOD < LOD < LOD
Mixed cherty-mudstone BH < LOD < LOD < LOD 943.69 < LOD < LOD < LOD < LOD < LOD < LOD 10.19 9.07 3.28
Mixed cherty-mudstone BH < LOD < LOD < LOD 1462.91 < LOD < LOD < LOD < LOD < LOD < LOD 15.46 < LOD 3.54
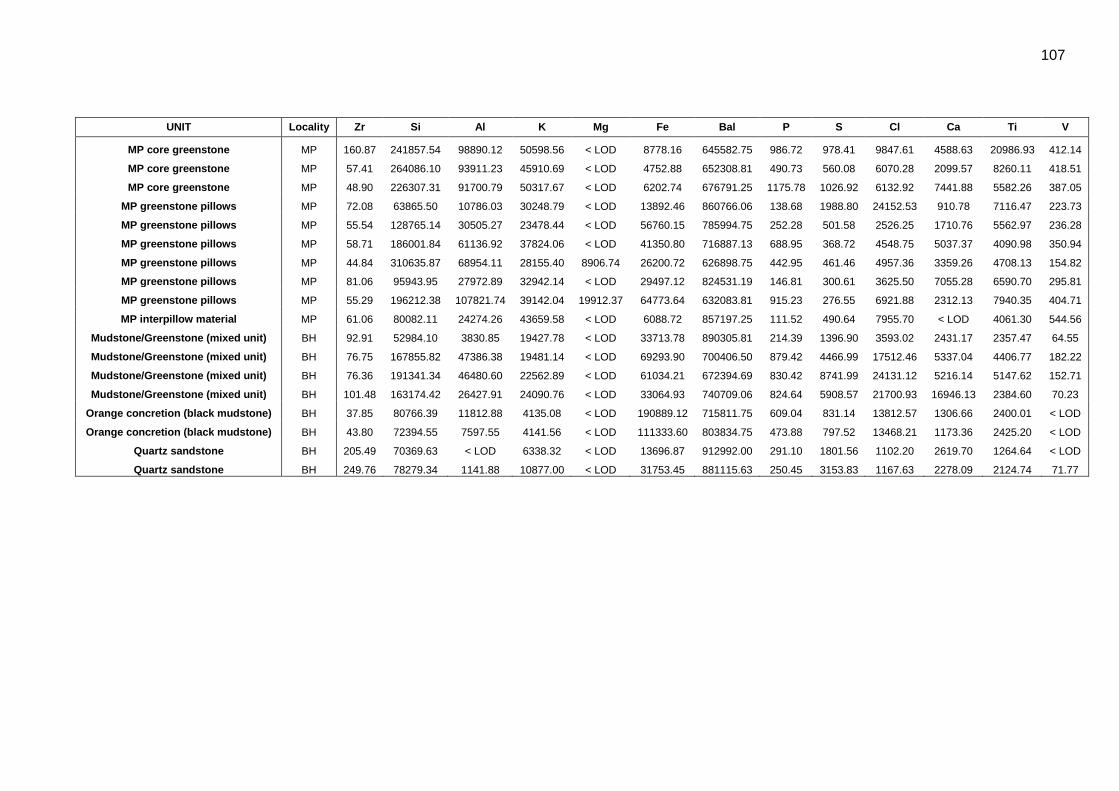
107
UNIT Locality Zr Si Al K Mg Fe Bal P S Cl Ca Ti V
MP core greenstone MP 160.87 241857.54 98890.12 50598.56 < LOD 8778.16 645582.75 986.72 978.41 9847.61 4588.63 20986.93 412.14
MP core greenstone MP 57.41 264086.10 93911.23 45910.69 < LOD 4752.88 652308.81 490.73 560.08 6070.28 2099.57 8260.11 418.51
MP core greenstone MP 48.90 226307.31 91700.79 50317.67 < LOD 6202.74 676791.25 1175.78 1026.92 6132.92 7441.88 5582.26 387.05
MP greenstone pillows MP 72.08 63865.50 10786.03 30248.79 < LOD 13892.46 860766.06 138.68 1988.80 24152.53 910.78 7116.47 223.73
MP greenstone pillows MP 55.54 128765.14 30505.27 23478.44 < LOD 56760.15 785994.75 252.28 501.58 2526.25 1710.76 5562.97 236.28
MP greenstone pillows MP 58.71 186001.84 61136.92 37824.06 < LOD 41350.80 716887.13 688.95 368.72 4548.75 5037.37 4090.98 350.94
MP greenstone pillows MP 44.84 310635.87 68954.11 28155.40 8906.74 26200.72 626898.75 442.95 461.46 4957.36 3359.26 4708.13 154.82
MP greenstone pillows MP 81.06 95943.95 27972.89 32942.14 < LOD 29497.12 824531.19 146.81 300.61 3625.50 7055.28 6590.70 295.81
MP greenstone pillows MP 55.29 196212.38 107821.74 39142.04 19912.37 64773.64 632083.81 915.23 276.55 6921.88 2312.13 7940.35 404.71
MP interpillow material MP 61.06 80082.11 24274.26 43659.58 < LOD 6088.72 857197.25 111.52 490.64 7955.70 < LOD 4061.30 544.56
Mudstone/Greenstone (mixed unit) BH 92.91 52984.10 3830.85 19427.78 < LOD 33713.78 890305.81 214.39 1396.90 3593.02 2431.17 2357.47 64.55
Mudstone/Greenstone (mixed unit) BH 76.75 167855.82 47386.38 19481.14 < LOD 69293.90 700406.50 879.42 4466.99 17512.46 5337.04 4406.77 182.22
Mudstone/Greenstone (mixed unit) BH 76.36 191341.34 46480.60 22562.89 < LOD 61034.21 672394.69 830.42 8741.99 24131.12 5216.14 5147.62 152.71
Mudstone/Greenstone (mixed unit) BH 101.48 163174.42 26427.91 24090.76 < LOD 33064.93 740709.06 824.64 5908.57 21700.93 16946.13 2384.60 70.23
Orange concretion (black mudstone) BH 37.85 80766.39 11812.88 4135.08 < LOD 190889.12 715811.75 609.04 831.14 13812.57 1306.66 2400.01 < LOD
Orange concretion (black mudstone) BH 43.80 72394.55 7597.55 4141.56 < LOD 111333.60 803834.75 473.88 797.52 13468.21 1173.36 2425.20 < LOD
Quartz sandstone BH 205.49 70369.63 < LOD 6338.32 < LOD 13696.87 912992.00 291.10 1801.56 1102.20 2619.70 1264.64 < LOD
Quartz sandstone BH 249.76 78279.34 1141.88 10877.00 < LOD 31753.45 881115.63 250.45 3153.83 1167.63 2278.09 2124.74 71.77

108
UNIT Locality Cd Sn Sb Ba Hf Ta
Re Au Hg Pb Bi Th U Sc Te Cs
MP core greenstone MP < LOD < LOD < LOD 2165.25 < LOD < LOD
< LOD < LOD < LOD < LOD < LOD < LOD
MP core greenstone MP < LOD < LOD < LOD 1637.77 < LOD < LOD
< LOD < LOD 7.33 6.38 < LOD < LOD
MP core greenstone MP 29.45 38.03 56.09 2235.08 < LOD < LOD
< LOD < LOD 11.00 6.75 < LOD < LOD
< LOD 180.30 125.71
MP greenstone pillows MP < LOD < LOD < LOD 1255.72 < LOD < LOD < LOD < LOD < LOD < LOD < LOD < LOD < LOD
MP greenstone pillows MP < LOD < LOD < LOD 942.49 < LOD < LOD < LOD < LOD < LOD < LOD < LOD < LOD < LOD
MP greenstone pillows MP < LOD < LOD < LOD 1270.47 < LOD < LOD < LOD < LOD < LOD < LOD 9.79 < LOD < LOD
MP greenstone pillows MP < LOD < LOD < LOD 933.03 < LOD < LOD < LOD < LOD < LOD < LOD < LOD < LOD < LOD
MP greenstone pillows MP < LOD < LOD < LOD 1237.76 < LOD < LOD < LOD < LOD < LOD < LOD 7.61 < LOD < LOD
MP greenstone pillows MP < LOD < LOD < LOD 1095.85 < LOD < LOD < LOD < LOD < LOD < LOD < LOD < LOD < LOD
MP interpillow material MP < LOD < LOD < LOD 1249.70 < LOD < LOD < LOD < LOD < LOD < LOD < LOD < LOD < LOD
Mudstone/Greenstone (mixed unit) BH < LOD < LOD < LOD 1017.27 < LOD < LOD < LOD < LOD < LOD < LOD 25.78 15.19 4.33
Mudstone/Greenstone (mixed unit) BH < LOD < LOD < LOD 746.23 < LOD < LOD
< LOD < LOD < LOD 10.48 < LOD < LOD
Mudstone/Greenstone (mixed unit) BH < LOD < LOD < LOD 803.62 < LOD < LOD
< LOD < LOD < LOD 6.25 < LOD < LOD
Mudstone/Greenstone (mixed unit) BH < LOD < LOD < LOD 1011.81 < LOD < LOD
< LOD < LOD < LOD 14.03 13.72 6.48
Orange concretion (black mudstone) BH < LOD < LOD < LOD 354.68 < LOD < LOD < LOD < LOD < LOD < LOD < LOD < LOD < LOD
Orange concretion (black mudstone) BH < LOD < LOD < LOD 261.58 < LOD < LOD < LOD < LOD < LOD < LOD < LOD < LOD < LOD
Quartz sandstone BH < LOD < LOD < LOD 477.98 < LOD < LOD < LOD < LOD < LOD < LOD 8.44 < LOD 3.05
Quartz sandstone BH < LOD < LOD < LOD 777.25 < LOD < LOD < LOD < LOD < LOD < LOD 18.02 10.12 3.34

109
UNIT Locality Cr Mn Co Ni Cu Zn As Se Rb Sr Nb Mo Pd Ag
MP core greenstone MP 946.74 170.54 < LOD 30.29 34.13 23.81 < LOD 3.04 70.75 46.23 25.02 5.78 < LOD < LOD
MP core greenstone MP 557.24 132.66 1.28 19.19 16.98 17.14 < LOD < LOD 56.93 34.23 6.64 2.95 < LOD < LOD
MP core greenstone MP 344.57 141.88 < LOD 16.93 33.16 21.93 < LOD < LOD 60.25 57.79 19.40 4.13 16.44 9.79
MP greenstone pillows MP 743.63 286.01
21.96 133.66 133.38 9.25 < LOD 78.16 38.63 7.63 3.07 < LOD < LOD
MP greenstone pillows MP 628.62 412.85
51.73 216.25 423.55 < LOD < LOD 54.98 17.64 4.68 < LOD < LOD < LOD
MP greenstone pillows MP 1059.09 256.45
33.33 165.69 285.26 < LOD < LOD 205.88 41.28 < LOD < LOD < LOD < LOD
MP greenstone pillows MP 557.67 211.27
22.70 82.66 182.76 < LOD < LOD 136.11 18.47 5.64 < LOD < LOD < LOD
MP greenstone pillows MP 909.06 282.90
35.76 98.57 286.10 < LOD < LOD 193.36 43.51 < LOD < LOD < LOD < LOD
MP greenstone pillows MP 1309.86 404.47
71.27 229.94 574.21 6.75 < LOD 59.19 18.35 8.76 < LOD < LOD < LOD
MP interpillow material MP 453.77 83.72
10.28 19.93 50.35 < LOD < LOD 103.83 22.18 4.28 < LOD < LOD < LOD
Mudstone/Greenstone (mixed unit) BH 92.00 322.98
14.14 73.02 172.50 139.07 < LOD 88.25 16.44 10.21 < LOD < LOD < LOD
Mudstone/Greenstone (mixed unit) BH 74.35 869.42 6.83 29.38 218.19 219.87 189.45 < LOD 29.23 64.97 5.64 < LOD < LOD < LOD
Mudstone/Greenstone (mixed unit) BH 71.70 631.35 7.47 29.52 194.91 159.43 223.20 < LOD 33.08 52.13 5.46 < LOD < LOD < LOD
Mudstone/Greenstone (mixed unit) BH 53.20 325.27 3.27 27.86 55.96 41.39 182.93 < LOD 52.71 22.54 10.21 < LOD < LOD < LOD
Orange concretion (black mudstone) BH 147.06 1905.19
< LOD 322.31 1809.39 30.06 < LOD 6.21 85.88 8.71 < LOD < LOD < LOD
Orange concretion (black mudstone) BH 113.73 686.86
< LOD 231.54 1579.12 27.41 < LOD 10.18 106.98 8.01 < LOD < LOD < LOD
Quartz sandstone BH < LOD 138.74
13.09 29.11 77.28 12.07 < LOD 117.00 30.03 < LOD < LOD < LOD < LOD
Quartz sandstone BH 49.25 198.76
19.54 31.31 153.60 84.02 4.73 59.52 29.02 11.05 2.95 < LOD < LOD