relationships between the largescale atmosphere and the smallscale convective state...
TRANSCRIPT
JOURNAL OF GEOPHYSICAL RESEARCH: ATMOSPHERES, VOL. 118, 11,534–11,545, doi:10.1002/jgrd.50645, 2013
Relationships between the large-scale atmosphere and the small-scaleconvective state for Darwin, AustraliaL. Davies,1 C. Jakob,2 P. May,3 V. V. Kumar,3 and S. Xie4
Received 6 March 2013; revised 10 July 2013; accepted 10 July 2013; published 25 October 2013.
[1] A persistent problem for numerical weather and climate models is the representationof tropical convective precipitation which for the most part occurs on spatial andtemporal scales too small and too short to be explicitly resolved. Given that modelparameterizations represent this subgrid convection as a function of the large-scaleatmospheric state, an understanding of the strongest relationships between the two scalesis needed. This study introduces a method to create two concurrent long-term data setsthat describe both the large-scale atmosphere and the characteristics of the small-scaleconvection. Important relationships between these two scales are then investigated. It isfound that convective precipitation, through convective precipitation area, has thestrongest relationship with dynamical variables such as moisture convergence andvertical velocity at midlevels. The magnitude of the fluctuations of convective strengthabout the mean is found to be anticorrelated with the strength of the large-scale variables,indicating a more stochastic behavior of tropical convection in weakly than stronglyforced regimes, respectively. Atmospheric stability related variables are not found to bepositively related to either convective precipitation area or convective precipitationintensity, which is often an assumption made in convective parameterization. On thecontrary, in a more unstable atmosphere, there is lower convective precipitation.Citation: Davies, L., C. Jakob, P. May, V. V. Kumar, and S. Xie (2013), Relationships between the large-scale atmosphere andthe small-scale convective state for Darwin, Australia, J. Geophys. Res. Atmos., 118, 11,534–11,545, doi:10.1002/jgrd.50645.
1. Introduction[2] Atmospheric convection is an important phenomenon
which drives weather and climate in the tropics as well asthe global general circulation. Convection is relevant on arange of spatial and temporal scales from large-scale phe-nomena, such as the Inter-Tropical Convergence Zone, ElNino-Southern Oscillation, and the Madden-Julian Oscilla-tion, to short weather time scales, such as an individualsquall line and mesoscale convective systems. Numericalmodels exhibit limitations in their ability to capture convec-tive phenomena. Particular examples include biases in thetropical mean precipitation distribution [Sun et al., 2006;Zhang et al., 2007] and significant timing errors in the diur-nal cycle of convection over land [Yang and Slingo, 2001].
1School of Mathematics, Monash University, Melbourne, Victoria,Australia.
2ARC Centre of Excellence for Climate System Science, MonashUniversity, Melbourne, Victoria, Australia.
3Centre for Australian Weather and Climate Research, Bureau ofMeteorology, Melbourne, Victoria, Australia.
4Atmospheric Sciences Division, Lawrence Livermore NationalLaboratory, Livermore, California, USA.
Corresponding author: L. Davies, School of Earth Sciences, TheUniversity of Melbourne, Melbourne 3010, Victoria, Australia.([email protected])
©2013. American Geophysical Union. All Rights Reserved.2169-897X/13/10.1002/jgrd.50645
Shortcomings in model simulations have been related to themodel representation of convection [e.g., Neale et al., 2008;Bechtold et al., 2008; Zhang et al., 2006; Neale and Slingo,2003; Wang and Schlesinger, 1999]. This is largely due tothe limitations of the convective parameterizations used inmodels to represent the subgrid scale behavior of convectionin relation to the resolved large-scale processes. Accuraterepresentation of convection is particularly important forthe tropics where precipitation is generally associated withconvective cloud systems.
[3] Convective parameterizations (see Arakawa [2004]for a full review of convective parameterization approaches)generally exploit some relationship between the large-scale,given by the atmospheric state at the model grid box scale,and the convective scale. The schemes mostly invoke anassumption that the two scales are in quasi-equilibrium[Arakawa and Schubert, 1974; Emanuel, 1991; Brown andBretherton, 1997] and use these assumptions to provideclosure to the model equations. A variable which charac-terizes the thermodynamic state of the atmosphere, such asConvectively Available Potential Energy (CAPE), is oftenused to determine convective strength. CAPE is the verti-cal integral of the temperature perturbation of a buoyant airparcel ascending from near the surface to its level of neutralbuoyancy. A comprehensive investigation of other possi-ble relationships, between a large range of large-scale andsmall-scale variables, which may be used in the closure ofconvective parameterizations is somewhat lacking.
11,534

DAVIES ET AL.: RELATIONSHIPS BETWEEN SCALES AT DARWIN
[4] Another possible limitation of convective parameteri-zations (and other parameterizations in general) is that theydetermine the subgrid scale convective behavior determinis-tically, meaning that for a given large-scale state, only onepossible convective state can be attained. This is unlikelyto be true in the real atmosphere, but traditional param-eterizations cannot produce variability about their meanrelationship between the two scales. Several cloud-resolvingmodels (CRM) studies have identified variability in the largeto small-scale relationships, however, to our knowledgethere are no observational studies investigating the stochas-tic nature of these relationships [e.g., Cohen and Craig,2006; Shutts and Palmer, 2007; Plant and Craig, 2008].There have been several attempts to include stochasticelements in the description of convection in models. Buizzaet al. [1999] showed that applying multiplicative noise to thephysics tendencies improved modeled skill. Lin and Neelin[2007] used empirical relationships to adjust the convec-tive parameterization. Khouider and Majda [2006] used aMarkov chain lattice to stochastically describe the evolutionof convective cloud types in a model grid-cell. Plant andCraig [2008] developed a fully stochastic convective param-eterization. These studies have used either assumptions ofempirical relationships or higher resolution models, such asCRM, to study the stochastic nature of the relationships.This study aims to supplement this earlier work by providingobservations of the key relationships and also quantifyingtheir stochastic components.
[5] In this study, we first develop two concurrent data sets,one representing the large-scale atmosphere and another thesmall-scale convective state, over a sufficiently long timeperiod to sample a large range of different states. Thesedata sets are then used to investigate important relationshipsbetween the two scales and furthermore to determine thestochastic nature of the relationships. Section 2 describesthe methodology used to derive data sets for the large-scaleatmospheric state and the concurrent small-scale convec-tive state. Section 3 then discusses some key relationshipsbetween the two scales that are relevant for convectiveparameterizations. The stochastic nature of these relation-ships is probed in section 4. The following sections thendiscuss the results (section 5) and summarize the mainconclusions (section 6).
2. Deriving Concurrent Long-Term Large-ScaleAtmospheric and Convective States
[6] To investigate relationships between the large-scaleatmospheric state and associated convection, two concurrentdata sets are required, one that describes the average state ofthe atmosphere over an area similar to that of a Global Cli-mate Model (GCM) grid-box and another that describes thesubgrid-scale behavior of convection. In order to investigatea wide range of meteorological conditions and to increasesampling, these data sets should be as long as possible. Thissection describes the derivation of two such data sets for atropical location, i.e., Darwin, Australia.
2.1. The Large-Scale State for a Tropical Location[7] In order to study convection, the large-scale state
data set should, ideally, include both thermodynamic anddynamic variables with a high degree of accuracy. An
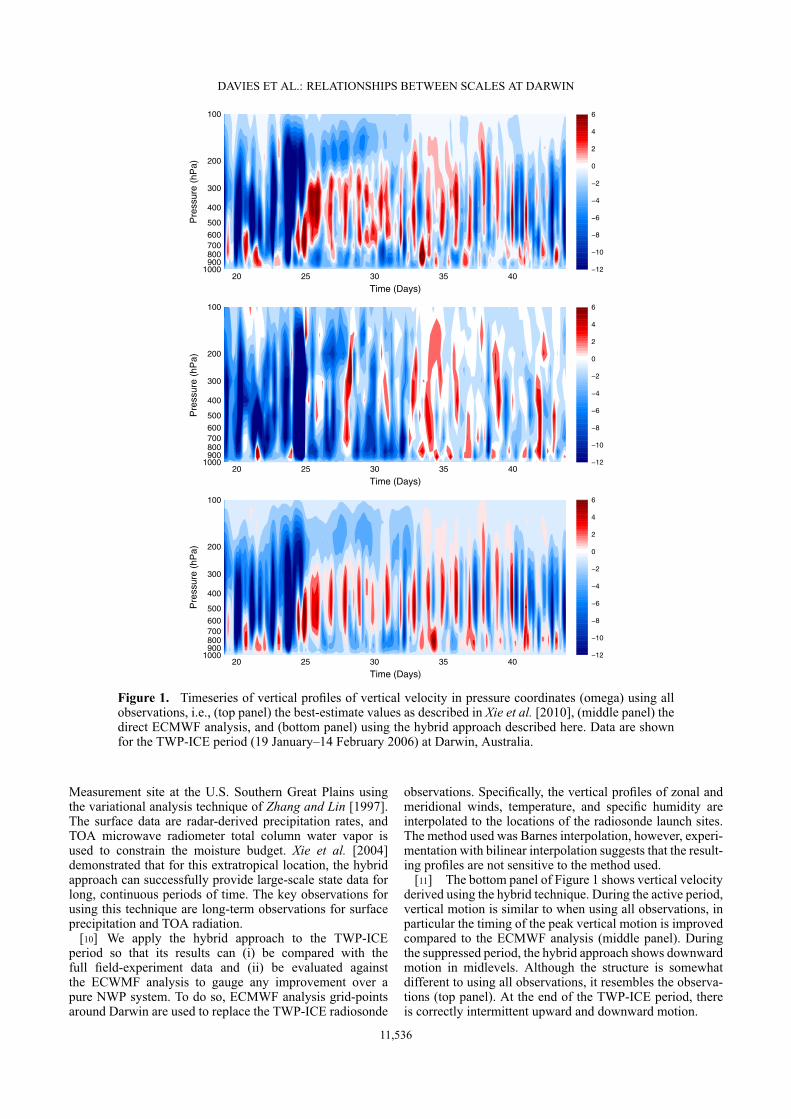
important source of such large-scale state data sets arethe observations made during the intensive observationperiods of field experiments such as TOGA-COARE:(Tropical Ocean-Global Atmosphere-The Coupled Ocean-Atmosphere Response Experiment) and Global AtmosphericResearch Program’s Atlantic Tropical Experiment (GATE)[Webster and Lukas, 1992; Houze Jr and Betts, 1981]. Suchstudies often deploy arrays of radiosonde observations andcollect surface and top of the atmosphere data includingenergy and water fluxes. A useful method to analyze thisdata is the variational budget analysis developed by Zhangand Lin [1997] where radiosonde, top of the atmosphere(TOA), and surface data are combined and constrained bythe vertically integrated heat and moisture budgets. Zhanget al. [2001] showed that surface precipitation data signif-icantly improved the quality of the analysis. While fieldexperiments produce the most comprehensive data sets tostudy tropical convection, they are usually of short dura-tion, which prevents a large-sample statistical analysis of therelationship between convection and the large-scale state ofthe atmosphere. The top panel of Figure 1 shows an exam-ple of the results from such a field experiment. It shows thetime-height evolution of vertical motion during the recentTropical Warm Pool-International Cloud Experiment (TWP-ICE) at Darwin, Australia [May et al., 2008] as derivedby the variational analysis technique described above [Xieet al., 2010]. It can be seen that there is strong upwardmotion during the active monsoon period (before day 25which is 25 January 2006). A subsequent suppressed mon-soon period is associated with downward motion between700 and 200 hPa and toward the end of the TWP-ICE period(after day 33 which is 3 February 2006), the diurnal cyclebecomes dominant with frequently alternating upward anddownward motion.
[8] A source of long-term large-scale data sets is oper-ational or reanalyses of the atmosphere as provided byseveral numerical weather prediction (NWP) centers. Suchdata sets cover many years and in principle provide a goodsource of large-scale information. However, analysis tech-niques in the tropics are not as far advanced as those inthe extratropics and the lack of dynamical constraints, aswell as the increased role of diabatic processes, limits theaccuracy of the resulting analysis products. This is exem-plified by the middle panel of Figure 1 which shows ver-tical motion for TWP-ICE from the European Centre forMedium-Range Weather Forecasts (ECMWF) operationalanalysis. It shows upward motion during the active mon-soon consistent with the observations, although the verticalstructure differs somewhat. It appears the timing of peakprecipitation lags the observations, and this behavior is dis-cussed in Petch et al. [2013]. During the suppressed period,the analysis fails to show the midlevel downward motion(compare to the observations, top panel) and the diurnallydriven period is not well captured.
[9] To exploit both the strengths of the variational anal-ysis technique and to overcome some of the weaknesses ofNWP analysis results, a hybrid approach was developed byXie et al. [2004]. NWP analysis is used as a replacementfor radiosonde observations which provides higher tempo-ral resolution sounding data than the twice daily long-termobservations available. The analysis data are combined withsurface and TOA observations at the Atmospheric Radiation
11,535
DAVIES ET AL.: RELATIONSHIPS BETWEEN SCALES AT DARWIN
Time (Days)
Pre
ssur
e (h
Pa)
20 25 30 35 40
100
200
300
400
500600700800900
1000
100
200
300
400
500600700800900
1000
100
200
300
400
500600700800900
1000
−12
−10
−8
−6
−4
−2
0
2
4
6
−12
−10
−8
−6
−4
−2
0
2
4
6
−12
−10
−8
−6
−4
−2
0
2
4
6
Time (Days)
Pre
ssur
e (h
Pa)
20 25 30 35 40
Time (Days)
Pre
ssur
e (h
Pa)
20 25 30 35 40
Figure 1. Timeseries of vertical profiles of vertical velocity in pressure coordinates (omega) using allobservations, i.e., (top panel) the best-estimate values as described in Xie et al. [2010], (middle panel) thedirect ECMWF analysis, and (bottom panel) using the hybrid approach described here. Data are shownfor the TWP-ICE period (19 January–14 February 2006) at Darwin, Australia.
Measurement site at the U.S. Southern Great Plains usingthe variational analysis technique of Zhang and Lin [1997].The surface data are radar-derived precipitation rates, andTOA microwave radiometer total column water vapor isused to constrain the moisture budget. Xie et al. [2004]demonstrated that for this extratropical location, the hybridapproach can successfully provide large-scale state data forlong, continuous periods of time. The key observations forusing this technique are long-term observations for surfaceprecipitation and TOA radiation.
[10] We apply the hybrid approach to the TWP-ICEperiod so that its results can (i) be compared with thefull field-experiment data and (ii) be evaluated againstthe ECWMF analysis to gauge any improvement over apure NWP system. To do so, ECMWF analysis grid-pointsaround Darwin are used to replace the TWP-ICE radiosonde
observations. Specifically, the vertical profiles of zonal andmeridional winds, temperature, and specific humidity areinterpolated to the locations of the radiosonde launch sites.The method used was Barnes interpolation, however, experi-mentation with bilinear interpolation suggests that the result-ing profiles are not sensitive to the method used.
[11] The bottom panel of Figure 1 shows vertical velocityderived using the hybrid technique. During the active period,vertical motion is similar to when using all observations, inparticular the timing of the peak vertical motion is improvedcompared to the ECMWF analysis (middle panel). Duringthe suppressed period, the hybrid approach shows downwardmotion in midlevels. Although the structure is somewhatdifferent to using all observations, it resembles the observa-tions (top panel). At the end of the TWP-ICE period, thereis correctly intermittent upward and downward motion.
11,536

DAVIES ET AL.: RELATIONSHIPS BETWEEN SCALES AT DARWIN
−70 −60 −50 −40 −30 −20 −10 0 10−70
−60
−50
−40
−30
−20
−10
0
10
Omega 500hPa (hPa hr−1)
Om
ega
500h
Pa
(hP
a hr
−1)
Figure 2. Relationship of 500 hPa vertical velocity inpressure coordinates (omega) derived using the variationalapproach from all observations on the x axis against bothomega at 500 hPa from ECMWF analysis shown as crossesand 500 hPa omega derived using the variational methodbut using the hybrid approach (as discussed in the text)shown as points. Data are shown for the TWP-ICE period(19 January–14 February 2006) at Darwin, Australia.
[12] Figure 2 compares vertical velocity at 500 hPaderived with variational analysis using the hybrid approachand the ECMWF analysis to vertical velocity at 500 hPaderived with variational analysis from all observations. Itis clear that when using the hybrid approach, the represen-tation of vertical velocity substantially improves comparedto the ECMWF analysis. Correlating all observed values ofvertical velocity at 500 hPa with those derived from thehybrid approach and the ECMWF analysis yields correlationcoefficients of 0.98 and 0.25, respectively.
[13] Having demonstrated the utility of the hybridapproach in providing reliable estimates of large-scale infor-mation, we apply the technique to derive three wet seasons(2004/2005, 2005/2006, and 2006/2007) of the large-scalestate information for the TWP-ICE region around Darwin.The analysis technique is limited to periods, such as the wetseason, when there are sufficient observations of precipita-tion. This data set is derived using the ECMWF operationalanalysis as radiosonde surrogate and constraining the varia-tional analysis with area-mean surface precipitation derivedfrom the polarimetric C-band radar (CPOL) [Keenan et al.,1998] using the algorithm of Bringi et al. [2004]. It is
worth noting that the use of the area-mean total precip-itation as a constraint in the variational analysis limitsits use as a surrogate for convective activity below. Theradar data are processed in the same way as during theTWP-ICE experiment [see Xie et al., 2010 for more detail].The resulting data set has approximately 1900 samples at6-hourly intervals.
2.2. Defining the Concurrent Convective State[14] To correctly associate a particular large-scale atmo-
spheric condition with a convective state, a description ofthe latter is also required concurrent in space and time withthe large-scale state. To achieve this, a detailed analysis ofthe CPOL observations at 2.5 km above the surface is per-formed. Firstly, the data are classified into its convectiveand stratiform components using the algorithm of Steineret al. [1995]. This method classifies pixels with large val-ues of radar reflectivity as convective and then associatessufficiently intense, nearby precipitation values as also con-vective. Other precipitating radar pixels are classified asstratiform. The classified data are then area-averaged overthe 6 h periods which are ˙3 h the time of the large-scale state to produce convective and stratiform precipitationrates. Precipitation rates are further decomposed into areaand intensity as given by P = ! I, where P is precipitation, !is precipitation area, and I is precipitation intensity (definedas precipitation per unit precipitation area), for the same6 h periods. Additional information on the small-scale stateis found by analyzing the statistics of convective cells usingthe Thunderstorm Identification, Tracking, Analysis, andNowcasting (TITAN) radar data analysis tool [Dixon andWiener, 1993] which identifies characteristics of individualconvective storms. Further detail on this analysis can befound in Kumar et al. [2012].
[15] While the focus of this study is on how the convec-tive scale variables relate to the large scale, it is worthwhiledetermining how the small-scale variables relate to eachother. Table 1 shows correlations coefficients between thesmall-scale variables related to both the convective and strat-iform parts of the precipitation processes. Domain-averagedtotal precipitation is strongly correlated with both convec-tive precipitation (through convective precipitation area)and stratiform precipitation. This result may be related tothe finding of Mapes et al. [2006] who suggested thatconvective and stratiform precipitation exhibit similar rela-tionships over different spatial and temporal scales. Totalprecipitation area is very strongly correlated with strati-form precipitation area as stratiform precipitation dominatesthe areal coverage. While both convective and stratiform
Table 1. Summary of Correlations Between Small-Scale Precipitation Variables
Convective Stratiform Convective StratiformPrecipitation Convective Precipitation Precipitation Precipitation Precipitation Precipitation
Area Precipitation Area Stratiform Area Intensity Intensity
Precipitation 0.85 0.94 0.93 0.94 0.81 0.50 0.44Precipitation area 1.00 0.65 0.71 0.93 0.99 0.34 0.23Convective precipitation 1.00 0.96 0.75 0.61 0.57 0.49Convective precipitation area 1.00 0.79 0.66 0.52 0.49Stratiform precipitation 1.00 0.92 0.37 0.33Stratiform precipitation area 1.00 0.31 0.20Convective precipitation intensity 1.00 0.88
11,537
DAVIES ET AL.: RELATIONSHIPS BETWEEN SCALES AT DARWIN
−1.5 −1 −0.5 0 0.5 1 1.5 2 2.5 3
−1.5 −1 −0.5 0 0.5 1 1.5 2 2.5 3
−1.5 −1 −0.5 0 0.5 1 1.5 2 2.5 3
0
0.5
1
1.5
2
2.5
3
Moisture convergence (mm hr−1)−1.5 −1 −0.5 0 0.5 1 1.5 2 2.5 30
0.2
0.4
0.6
0.8
1
1.2
1.4
1.6
1.8
2
Moisture convergence (mm hr−1)
Moisture convergence (mm hr−1) Moisture convergence (mm hr−1)
Con
vect
ive
prec
ipita
tion
(mm
hr−1
)
0
0.01
0.02
0.03
0.04
0.05
0.06
0.07
0.08
0.09
0.1
Con
vect
ive
prec
ipita
tion
area
−2 −1.5 −1 −0.5 0 0.5 1 1.5 2 2.5 30
5
10
15
20
25
30
35
Con
vect
ive
prec
ipita
tion
inte
nsity
(m
m h
r−1)
d
b
0
0.2
0.4
0.6
0.8
1
1.2
1.4
1.6
1.8
2
Moisture convergence (mm hr−1)
Pre
cipi
tatio
n (m
m h
r−1)
Str
atifo
rm p
reci
pita
tion
(mm
hr−1
)
0 0.2 0.4 0.6 0.8 1 1.2 1.4 1.6 1.8 20
0.2
0.4
0.6
0.8
1
1.2
1.4
1.6
1.8
2
Str
atifo
rm p
reci
pita
tion
(mm
hr−1
)
Convective precipitation (mm hr−1)
fe
c
a
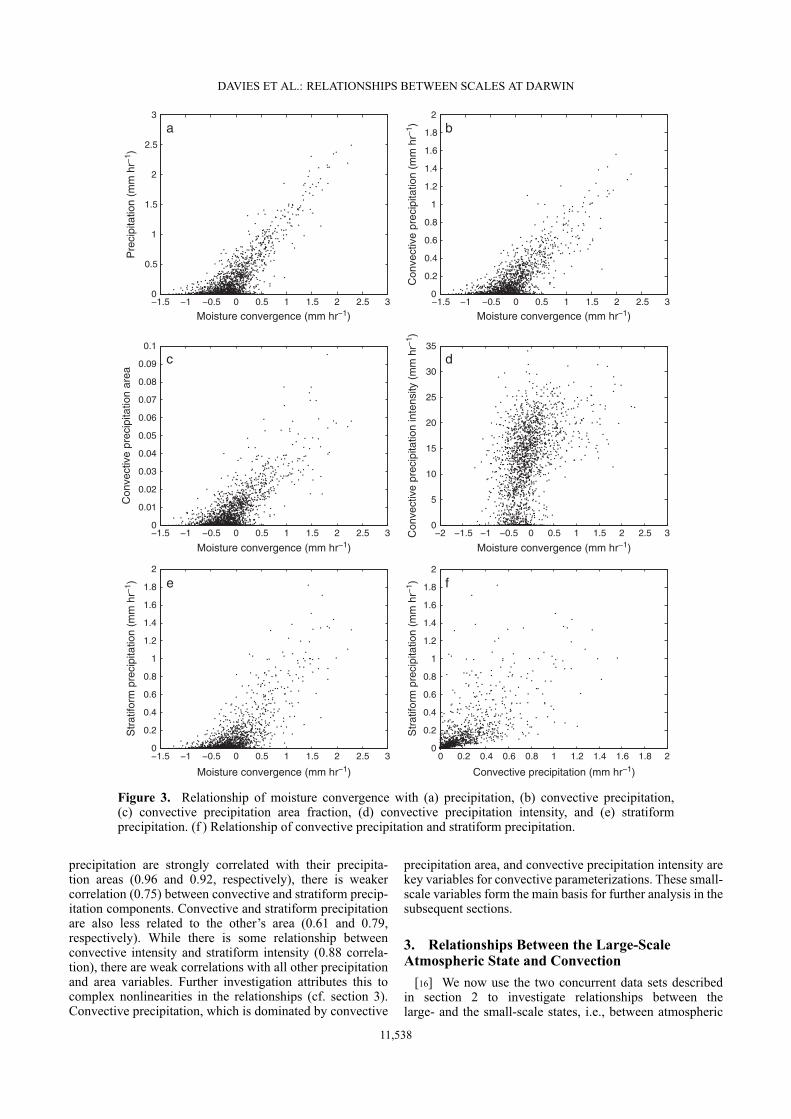
Figure 3. Relationship of moisture convergence with (a) precipitation, (b) convective precipitation,(c) convective precipitation area fraction, (d) convective precipitation intensity, and (e) stratiformprecipitation. (f ) Relationship of convective precipitation and stratiform precipitation.
precipitation are strongly correlated with their precipita-tion areas (0.96 and 0.92, respectively), there is weakercorrelation (0.75) between convective and stratiform precip-itation components. Convective and stratiform precipitationare also less related to the other’s area (0.61 and 0.79,respectively). While there is some relationship betweenconvective intensity and stratiform intensity (0.88 correla-tion), there are weak correlations with all other precipitationand area variables. Further investigation attributes this tocomplex nonlinearities in the relationships (cf. section 3).Convective precipitation, which is dominated by convective
precipitation area, and convective precipitation intensity arekey variables for convective parameterizations. These small-scale variables form the main basis for further analysis in thesubsequent sections.
3. Relationships Between the Large-ScaleAtmospheric State and Convection
[16] We now use the two concurrent data sets describedin section 2 to investigate relationships between thelarge- and the small-scale states, i.e., between atmospheric
11,538
DAVIES ET AL.: RELATIONSHIPS BETWEEN SCALES AT DARWIN
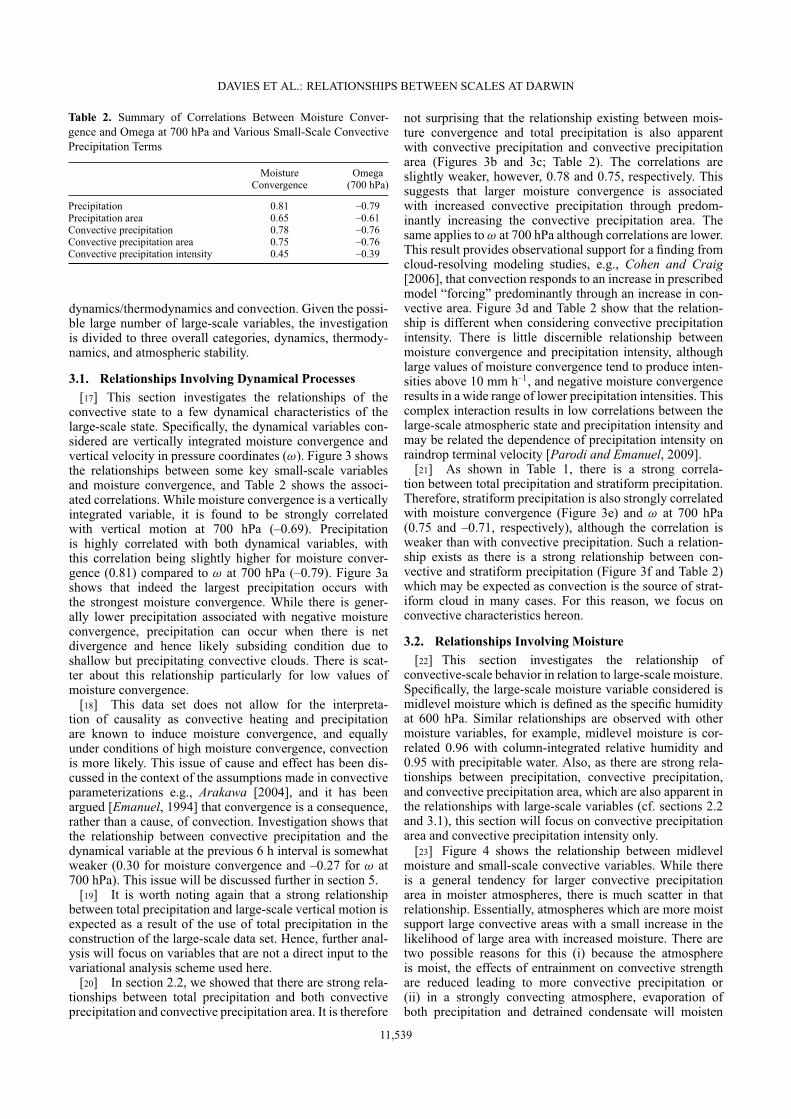
Table 2. Summary of Correlations Between Moisture Conver-gence and Omega at 700 hPa and Various Small-Scale ConvectivePrecipitation Terms
Moisture OmegaConvergence (700 hPa)
Precipitation 0.81 –0.79Precipitation area 0.65 –0.61Convective precipitation 0.78 –0.76Convective precipitation area 0.75 –0.76Convective precipitation intensity 0.45 –0.39
dynamics/thermodynamics and convection. Given the possi-ble large number of large-scale variables, the investigationis divided to three overall categories, dynamics, thermody-namics, and atmospheric stability.
3.1. Relationships Involving Dynamical Processes[17] This section investigates the relationships of the
convective state to a few dynamical characteristics of thelarge-scale state. Specifically, the dynamical variables con-sidered are vertically integrated moisture convergence andvertical velocity in pressure coordinates (!). Figure 3 showsthe relationships between some key small-scale variablesand moisture convergence, and Table 2 shows the associ-ated correlations. While moisture convergence is a verticallyintegrated variable, it is found to be strongly correlatedwith vertical motion at 700 hPa (–0.69). Precipitationis highly correlated with both dynamical variables, withthis correlation being slightly higher for moisture conver-gence (0.81) compared to ! at 700 hPa (–0.79). Figure 3ashows that indeed the largest precipitation occurs withthe strongest moisture convergence. While there is gener-ally lower precipitation associated with negative moistureconvergence, precipitation can occur when there is netdivergence and hence likely subsiding condition due toshallow but precipitating convective clouds. There is scat-ter about this relationship particularly for low values ofmoisture convergence.
[18] This data set does not allow for the interpreta-tion of causality as convective heating and precipitationare known to induce moisture convergence, and equallyunder conditions of high moisture convergence, convectionis more likely. This issue of cause and effect has been dis-cussed in the context of the assumptions made in convectiveparameterizations e.g., Arakawa [2004], and it has beenargued [Emanuel, 1994] that convergence is a consequence,rather than a cause, of convection. Investigation shows thatthe relationship between convective precipitation and thedynamical variable at the previous 6 h interval is somewhatweaker (0.30 for moisture convergence and –0.27 for ! at700 hPa). This issue will be discussed further in section 5.
[19] It is worth noting again that a strong relationshipbetween total precipitation and large-scale vertical motion isexpected as a result of the use of total precipitation in theconstruction of the large-scale data set. Hence, further anal-ysis will focus on variables that are not a direct input to thevariational analysis scheme used here.
[20] In section 2.2, we showed that there are strong rela-tionships between total precipitation and both convectiveprecipitation and convective precipitation area. It is therefore
not surprising that the relationship existing between mois-ture convergence and total precipitation is also apparentwith convective precipitation and convective precipitationarea (Figures 3b and 3c; Table 2). The correlations areslightly weaker, however, 0.78 and 0.75, respectively. Thissuggests that larger moisture convergence is associatedwith increased convective precipitation through predom-inantly increasing the convective precipitation area. Thesame applies to ! at 700 hPa although correlations are lower.This result provides observational support for a finding fromcloud-resolving modeling studies, e.g., Cohen and Craig[2006], that convection responds to an increase in prescribedmodel “forcing” predominantly through an increase in con-vective area. Figure 3d and Table 2 show that the relation-ship is different when considering convective precipitationintensity. There is little discernible relationship betweenmoisture convergence and precipitation intensity, althoughlarge values of moisture convergence tend to produce inten-sities above 10 mm h–1, and negative moisture convergenceresults in a wide range of lower precipitation intensities. Thiscomplex interaction results in low correlations between thelarge-scale atmospheric state and precipitation intensity andmay be related the dependence of precipitation intensity onraindrop terminal velocity [Parodi and Emanuel, 2009].
[21] As shown in Table 1, there is a strong correla-tion between total precipitation and stratiform precipitation.Therefore, stratiform precipitation is also strongly correlatedwith moisture convergence (Figure 3e) and ! at 700 hPa(0.75 and –0.71, respectively), although the correlation isweaker than with convective precipitation. Such a relation-ship exists as there is a strong relationship between con-vective and stratiform precipitation (Figure 3f and Table 2)which may be expected as convection is the source of strat-iform cloud in many cases. For this reason, we focus onconvective characteristics hereon.
3.2. Relationships Involving Moisture[22] This section investigates the relationship of
convective-scale behavior in relation to large-scale moisture.Specifically, the large-scale moisture variable considered ismidlevel moisture which is defined as the specific humidityat 600 hPa. Similar relationships are observed with othermoisture variables, for example, midlevel moisture is cor-related 0.96 with column-integrated relative humidity and0.95 with precipitable water. Also, as there are strong rela-tionships between precipitation, convective precipitation,and convective precipitation area, which are also apparent inthe relationships with large-scale variables (cf. sections 2.2and 3.1), this section will focus on convective precipitationarea and convective precipitation intensity only.
[23] Figure 4 shows the relationship between midlevelmoisture and small-scale convective variables. While thereis a general tendency for larger convective precipitationarea in moister atmospheres, there is much scatter in thatrelationship. Essentially, atmospheres which are more moistsupport large convective areas with a small increase in thelikelihood of large area with increased moisture. There aretwo possible reasons for this (i) because the atmosphereis moist, the effects of entrainment on convective strengthare reduced leading to more convective precipitation or(ii) in a strongly convecting atmosphere, evaporation ofboth precipitation and detrained condensate will moisten
11,539

DAVIES ET AL.: RELATIONSHIPS BETWEEN SCALES AT DARWIN
0 1 2 3 4 5 6 7 8 90
0.01
0.02
0.03
0.04
0.05
0.06
0.07
0.08
0.09
0.1
Moisture at 600 hPa (g kg−1)
Con
vect
ive
prec
ipita
tion
area
frac
tion
0 1 2 3 4 5 6 7 8 90
5
10
15
20
25
30
35
Moisture at 600 hPa (g kg−1)
Con
vect
ive
prec
ipita
tion
inte
nsity
(m
m h
r−1)
ba
Figure 4. Relationship of 600 hPa moisture with (a) convective precipitation area fraction and (b) con-vective precipitation intensity. Also shown are mean and ˙1 standard deviation values for deciles ofthe data set.
the atmosphere. This result does not suggest causality butshows that a weak relationship exists. Figure 4a, usingconvective precipitation area rather than total precipitation,somewhat resembles distributions in Bretherton et al. [2004]and Holloway and Neelin [2009] with increasing precip-itation area for larger values of moisture. However, therelationship does not have the strong pickup in precipita-tion shown in Holloway and Neelin [2009] who used 1 hradiosonde data nor the more gradual increase Brethertonet al. [2004] found using daily data. Figure 4a shows thatthere is much scatter in the relationship between midlevelmoisture and convective area consistent with the findingsof Peters and Neelin [2006] who found an increase in pre-cipitation variance for high values of precipitable water.The differences between the findings in this study and theresults in previous studies may be somewhat explained byMasunaga [2012] who found that the timescales investigatedwere important when determining the nature of the relation-ship between precipitable water and precipitation. Figure 4bshows the perhaps surprising result that convective precipi-tation intensity does not show much discernible relationshipwith midlevel moisture, with the exception that in a very dryatmosphere domain-mean convective intensity is slightlylower. This implies that at least small but strong convectiveclouds can exist in any atmosphere and that once again, it isthe area of convection that increases in atmospheres that aremore moist.
[24] Figure 5 shows a different perspective on how con-vective precipitation relates to moisture. Here probabilitydistributions of precipitation in convective cells from theTITAN analysis [Kumar et al., 2012], averaged over 6 h,are shown as a function of midlevel (600 hPa) moisture.The precipitation distributions are sorted into deciles basedon midlevel moisture and then averaged over each decile.Red colors represent averages with the largest moisture andblue colors averages with the low moisture. In general, manymore convective cells are observed when the atmosphere ismoist, thus reflecting the increased convective area shownin Figure 3. Therefore, for each decile, the distribution isnormalized by the number of convective cells observed inthat decile. When the atmosphere is moist, the numerous
convective cells tend to have lower precipitation intensity.As the atmosphere dries, there is a shift in the distributiontoward fewer convective cells but with larger values of pre-cipitation intensity. This shows that in a moist atmosphere,convective cells are less intense, but more numerous; how-ever, in a drier atmosphere, while there are fewer convectivecells over all, the individual cells are more likely to bemore intense.
3.3. Relationships Involving Atmospheric Stability[25] This section will investigate the relationship of con-
vective scale activity with two measures of atmosphericstability: Convective Available Potential Energy (CAPE),which is a vertically integrated measure of the buoyancy ofa parcel lifted from 990 hPa, and a measure more frequentlyused by weather forecasters to predict convective show-ers and thunderstorms called the K-index [Charba, 1977].
0 5 10 15 20 25 30 35 40 45 500
0.02
0.04
0.06
0.08
0.1
0.12
0.14
0.16
0.18
0.2
Nor
mal
ised
freq
uenc
y
Precipitation rate (mm hr−1)
Figure 5. Distribution of precipitation rate per convectivecell averaged over deciles of 600 hPa moisture. The distri-bution is normalized by the total number of convective cellsin each decile. Deciles with large moisture are in red anddeciles with low moisture are in blue.
11,540

DAVIES ET AL.: RELATIONSHIPS BETWEEN SCALES AT DARWIN
0 200 400 600 800 1000 1200 1400 1600 1800 20000
0.01
0.02
0.03
0.04
0.05
0.06
0.07
0.08
0.09
0.1
CAPE (J kg−1) CAPE (J kg−1)
Con
vect
ive
prec
ipita
tion
area
frac
tion
0 200 400 600 800 1000 1200 1400 1600 1800 20000
5
10
15
20
25
30
35
Con
vect
ive
prec
ipita
tion
inte
nsity
(m
m h
r−1)
Con
vect
ive
prec
ipita
tion
inte
nsity
(m
m h
r−1)
10 15 20 25 30 35 40 45 500
0.01
0.02
0.03
0.04
0.05
0.06
0.07
0.08
0.09
0.1
Con
vect
ive
prec
ipita
tion
area
frac
tion
Modified k−index (K) Modified k−index (K)10 15 20 25 30 35 40 45 50
0
5
10
15
20
25
30
35
Figure 6. Relationship of (top) CAPE and (bottom) K-index with (left) convective precipitation areafraction and (right) convective precipitation intensity. In the top panels, also shown are mean and ˙1standard deviation values for deciles of the data set.
The K-index is calculated based on temperature (T) anddew point temperature (Td) at key pressure levels as shownin equation (1).
K =T1000 hPa + T850 hPa
2– T500 hPa
„ ƒ‚ …(a)
+Td,1000 hPa + Td,850 hPa
2„ ƒ‚ …(b)
– (T700 hPa – Td,700 hPa)„ ƒ‚ …(c)
(1)
[26] Figure 6 shows the relationships between CAPE,K-index, and selected small-scale variables. Convectiveprecipitation and CAPE effectively have zero correlation(–0.003) showing that, at least for this data set, CAPE isnot likely to be a good predictor of convective precipitationconsistent with McBride and Frank [1999]. The relationshipbetween CAPE and precipitation has been also discussedin Xie and Zhang [2000] and Zhang [2002]. CAPE at theprevious 6 h interval has slight positive correlation withconvective precipitation (0.06) which is discussed further insection 5. Detailed investigation shows that CAPE increasesthrough a combination of an increased height of the levelof neutral buoyancy and larger perturbations in the par-cel temperature throughout the atmosphere compared to theenvironment. Convective precipitation intensity also doesnot have a strong relationship with CAPE.
[27] The K-index on the other hand has a very differentrelationship with convective precipitation. Figure 6 (bottomleft) shows that convective precipitation values greater than0.5 mm h–1 only occur for values of K-index greater than35 K. Generally, in the forecasting context, K-index valuesgreater than 30 K indicate potential of Mesoscale ConvectiveCloud (MCC) and greater than 40 K almost 100% chance ofthunderstorms.
[28] Equation (1) indicates that the K-index has three dis-tinct components. Term (a) relates to lower troposphericstability, term (b), a measure of mean low-level (boundarylayer) moisture, and finally, term (c) relates to midlevelhumidity. Given that the K-index includes term (a), which isalso relevant for CAPE, it is instructive to investigate whichof these terms, if any, has the dominant role in determin-ing the relationship to convective precipitation. Investigationshows that the stability component of the K-index (terma) has very similar relationship with convective precipita-tion to that of CAPE (Figure 6, top left). CAPE and thestability component of the K-index are correlated 0.7. Thelow-level moisture and midlevel humidity components ofthe K-index (terms b and c) are correlated 0.77 and 0.94,respectively, with the full K-index, rendering these termsimportant for determining the K-index values. The relation-ship between the humidity component of the K-index andconvective precipitation, in particular, resembles Figure 4a.
11,541
DAVIES ET AL.: RELATIONSHIPS BETWEEN SCALES AT DARWIN
−1.5 −1 −0.5 0 1 20
0.2
0.4
0.6
0.8
Con
vect
ive
rain
fall
(mm
hr−1
)
Moisture convergence (mm hr−1)
15 88 343 673 436 145 76 21 12 5
0.5 1.50
0.5
1
1.5
2
Nor
mal
ised
sta
ndar
d de
viat
ion
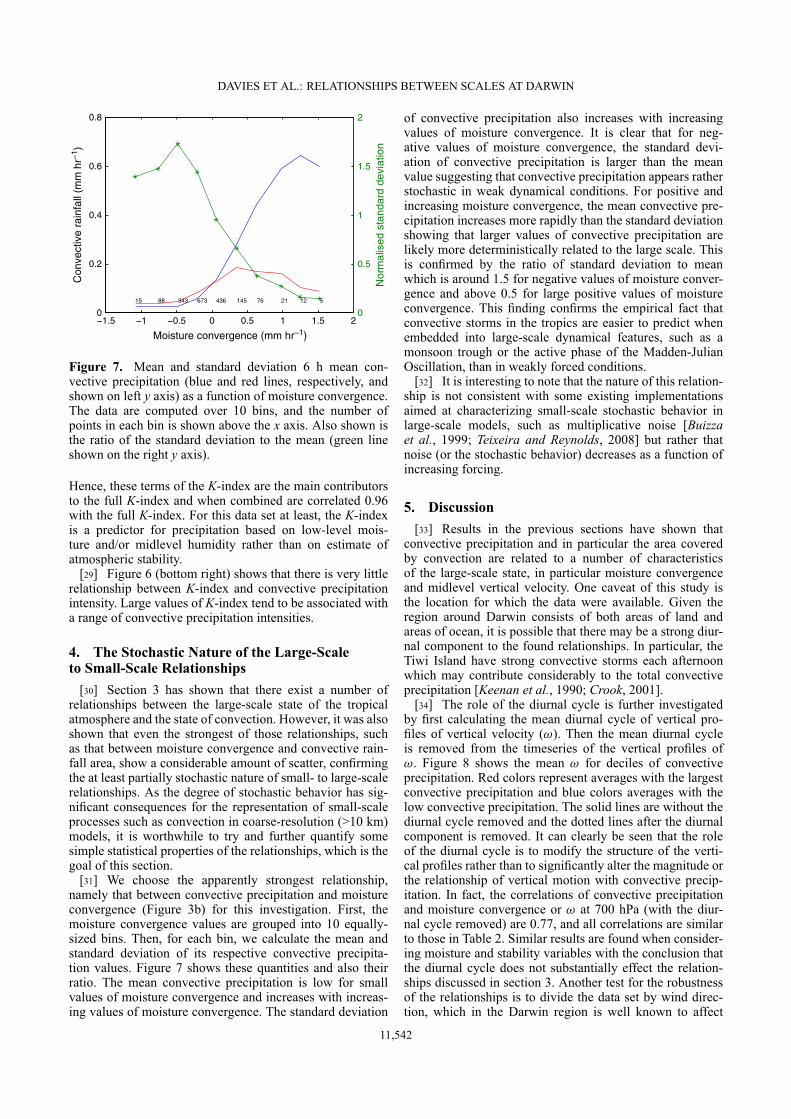
Figure 7. Mean and standard deviation 6 h mean con-vective precipitation (blue and red lines, respectively, andshown on left y axis) as a function of moisture convergence.The data are computed over 10 bins, and the number ofpoints in each bin is shown above the x axis. Also shown isthe ratio of the standard deviation to the mean (green lineshown on the right y axis).
Hence, these terms of the K-index are the main contributorsto the full K-index and when combined are correlated 0.96with the full K-index. For this data set at least, the K-indexis a predictor for precipitation based on low-level mois-ture and/or midlevel humidity rather than on estimate ofatmospheric stability.
[29] Figure 6 (bottom right) shows that there is very littlerelationship between K-index and convective precipitationintensity. Large values of K-index tend to be associated witha range of convective precipitation intensities.
4. The Stochastic Nature of the Large-Scaleto Small-Scale Relationships
[30] Section 3 has shown that there exist a number ofrelationships between the large-scale state of the tropicalatmosphere and the state of convection. However, it was alsoshown that even the strongest of those relationships, suchas that between moisture convergence and convective rain-fall area, show a considerable amount of scatter, confirmingthe at least partially stochastic nature of small- to large-scalerelationships. As the degree of stochastic behavior has sig-nificant consequences for the representation of small-scaleprocesses such as convection in coarse-resolution (>10 km)models, it is worthwhile to try and further quantify somesimple statistical properties of the relationships, which is thegoal of this section.
[31] We choose the apparently strongest relationship,namely that between convective precipitation and moistureconvergence (Figure 3b) for this investigation. First, themoisture convergence values are grouped into 10 equally-sized bins. Then, for each bin, we calculate the mean andstandard deviation of its respective convective precipita-tion values. Figure 7 shows these quantities and also theirratio. The mean convective precipitation is low for smallvalues of moisture convergence and increases with increas-ing values of moisture convergence. The standard deviation
of convective precipitation also increases with increasingvalues of moisture convergence. It is clear that for neg-ative values of moisture convergence, the standard devi-ation of convective precipitation is larger than the meanvalue suggesting that convective precipitation appears ratherstochastic in weak dynamical conditions. For positive andincreasing moisture convergence, the mean convective pre-cipitation increases more rapidly than the standard deviationshowing that larger values of convective precipitation arelikely more deterministically related to the large scale. Thisis confirmed by the ratio of standard deviation to meanwhich is around 1.5 for negative values of moisture conver-gence and above 0.5 for large positive values of moistureconvergence. This finding confirms the empirical fact thatconvective storms in the tropics are easier to predict whenembedded into large-scale dynamical features, such as amonsoon trough or the active phase of the Madden-JulianOscillation, than in weakly forced conditions.
[32] It is interesting to note that the nature of this relation-ship is not consistent with some existing implementationsaimed at characterizing small-scale stochastic behavior inlarge-scale models, such as multiplicative noise [Buizzaet al., 1999; Teixeira and Reynolds, 2008] but rather thatnoise (or the stochastic behavior) decreases as a function ofincreasing forcing.
5. Discussion[33] Results in the previous sections have shown that
convective precipitation and in particular the area coveredby convection are related to a number of characteristicsof the large-scale state, in particular moisture convergenceand midlevel vertical velocity. One caveat of this study isthe location for which the data were available. Given theregion around Darwin consists of both areas of land andareas of ocean, it is possible that there may be a strong diur-nal component to the found relationships. In particular, theTiwi Island have strong convective storms each afternoonwhich may contribute considerably to the total convectiveprecipitation [Keenan et al., 1990; Crook, 2001].
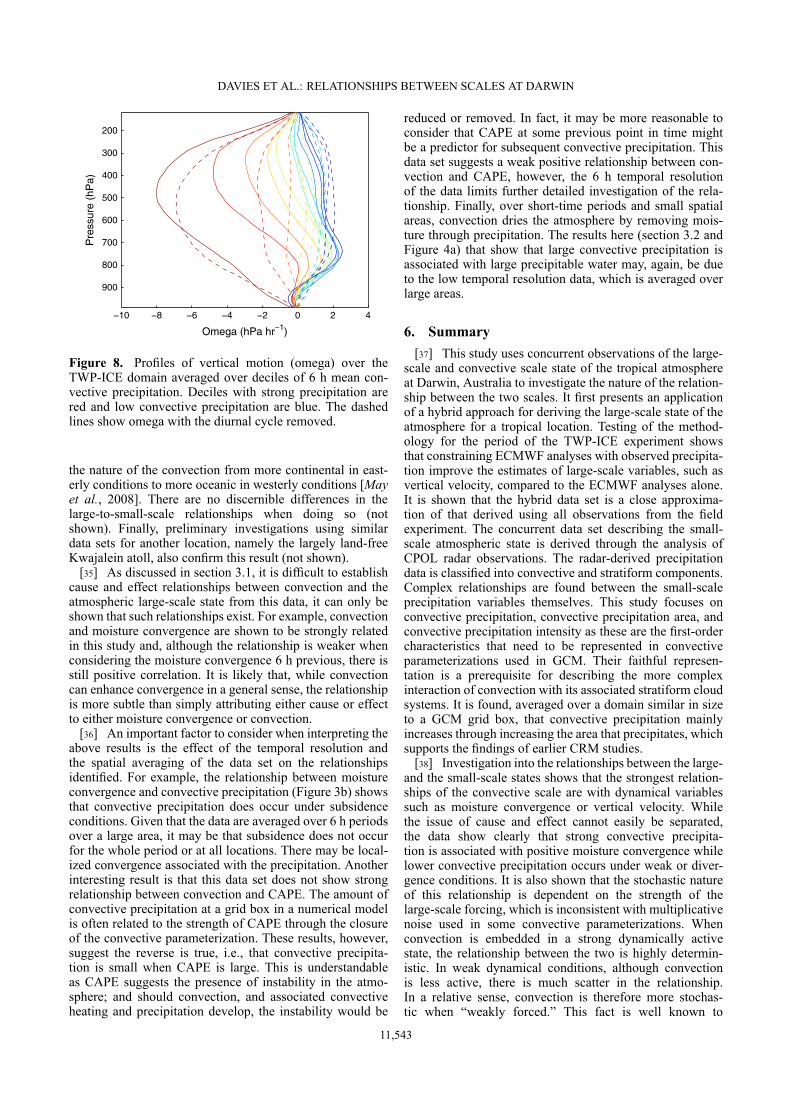
[34] The role of the diurnal cycle is further investigatedby first calculating the mean diurnal cycle of vertical pro-files of vertical velocity (!). Then the mean diurnal cycleis removed from the timeseries of the vertical profiles of!. Figure 8 shows the mean ! for deciles of convectiveprecipitation. Red colors represent averages with the largestconvective precipitation and blue colors averages with thelow convective precipitation. The solid lines are without thediurnal cycle removed and the dotted lines after the diurnalcomponent is removed. It can clearly be seen that the roleof the diurnal cycle is to modify the structure of the verti-cal profiles rather than to significantly alter the magnitude orthe relationship of vertical motion with convective precip-itation. In fact, the correlations of convective precipitationand moisture convergence or ! at 700 hPa (with the diur-nal cycle removed) are 0.77, and all correlations are similarto those in Table 2. Similar results are found when consider-ing moisture and stability variables with the conclusion thatthe diurnal cycle does not substantially effect the relation-ships discussed in section 3. Another test for the robustnessof the relationships is to divide the data set by wind direc-tion, which in the Darwin region is well known to affect
11,542
DAVIES ET AL.: RELATIONSHIPS BETWEEN SCALES AT DARWIN
−10 −8 −6 −4 −2 0 2 4
200
300
400
500
600
700
800
900
Omega (hPa hr−1)
Pre
ssur
e (h
Pa)
Figure 8. Profiles of vertical motion (omega) over theTWP-ICE domain averaged over deciles of 6 h mean con-vective precipitation. Deciles with strong precipitation arered and low convective precipitation are blue. The dashedlines show omega with the diurnal cycle removed.
the nature of the convection from more continental in east-erly conditions to more oceanic in westerly conditions [Mayet al., 2008]. There are no discernible differences in thelarge-to-small-scale relationships when doing so (notshown). Finally, preliminary investigations using similardata sets for another location, namely the largely land-freeKwajalein atoll, also confirm this result (not shown).
[35] As discussed in section 3.1, it is difficult to establishcause and effect relationships between convection and theatmospheric large-scale state from this data, it can only beshown that such relationships exist. For example, convectionand moisture convergence are shown to be strongly relatedin this study and, although the relationship is weaker whenconsidering the moisture convergence 6 h previous, there isstill positive correlation. It is likely that, while convectioncan enhance convergence in a general sense, the relationshipis more subtle than simply attributing either cause or effectto either moisture convergence or convection.
[36] An important factor to consider when interpreting theabove results is the effect of the temporal resolution andthe spatial averaging of the data set on the relationshipsidentified. For example, the relationship between moistureconvergence and convective precipitation (Figure 3b) showsthat convective precipitation does occur under subsidenceconditions. Given that the data are averaged over 6 h periodsover a large area, it may be that subsidence does not occurfor the whole period or at all locations. There may be local-ized convergence associated with the precipitation. Anotherinteresting result is that this data set does not show strongrelationship between convection and CAPE. The amount ofconvective precipitation at a grid box in a numerical modelis often related to the strength of CAPE through the closureof the convective parameterization. These results, however,suggest the reverse is true, i.e., that convective precipita-tion is small when CAPE is large. This is understandableas CAPE suggests the presence of instability in the atmo-sphere; and should convection, and associated convectiveheating and precipitation develop, the instability would be
reduced or removed. In fact, it may be more reasonable toconsider that CAPE at some previous point in time mightbe a predictor for subsequent convective precipitation. Thisdata set suggests a weak positive relationship between con-vection and CAPE, however, the 6 h temporal resolutionof the data limits further detailed investigation of the rela-tionship. Finally, over short-time periods and small spatialareas, convection dries the atmosphere by removing mois-ture through precipitation. The results here (section 3.2 andFigure 4a) that show that large convective precipitation isassociated with large precipitable water may, again, be dueto the low temporal resolution data, which is averaged overlarge areas.
6. Summary[37] This study uses concurrent observations of the large-
scale and convective scale state of the tropical atmosphereat Darwin, Australia to investigate the nature of the relation-ship between the two scales. It first presents an applicationof a hybrid approach for deriving the large-scale state of theatmosphere for a tropical location. Testing of the method-ology for the period of the TWP-ICE experiment showsthat constraining ECMWF analyses with observed precipita-tion improve the estimates of large-scale variables, such asvertical velocity, compared to the ECMWF analyses alone.It is shown that the hybrid data set is a close approxima-tion of that derived using all observations from the fieldexperiment. The concurrent data set describing the small-scale atmospheric state is derived through the analysis ofCPOL radar observations. The radar-derived precipitationdata is classified into convective and stratiform components.Complex relationships are found between the small-scaleprecipitation variables themselves. This study focuses onconvective precipitation, convective precipitation area, andconvective precipitation intensity as these are the first-ordercharacteristics that need to be represented in convectiveparameterizations used in GCM. Their faithful represen-tation is a prerequisite for describing the more complexinteraction of convection with its associated stratiform cloudsystems. It is found, averaged over a domain similar in sizeto a GCM grid box, that convective precipitation mainlyincreases through increasing the area that precipitates, whichsupports the findings of earlier CRM studies.
[38] Investigation into the relationships between the large-and the small-scale states shows that the strongest relation-ships of the convective scale are with dynamical variablessuch as moisture convergence or vertical velocity. Whilethe issue of cause and effect cannot easily be separated,the data show clearly that strong convective precipita-tion is associated with positive moisture convergence whilelower convective precipitation occurs under weak or diver-gence conditions. It is also shown that the stochastic natureof this relationship is dependent on the strength of thelarge-scale forcing, which is inconsistent with multiplicativenoise used in some convective parameterizations. Whenconvection is embedded in a strong dynamically activestate, the relationship between the two is highly determin-istic. In weak dynamical conditions, although convectionis less active, there is much scatter in the relationship.In a relative sense, convection is therefore more stochas-tic when “weakly forced.” This fact is well known to
11,543

DAVIES ET AL.: RELATIONSHIPS BETWEEN SCALES AT DARWIN
forecasters in tropical regions when forecasting weather on adaily basis.
[39] Strong relationships with stability related variables,such as CAPE, are neither found with convective precipita-tion area nor convective precipitation intensity. The relation-ship identified suggests that when convective precipitationis large, CAPE is most likely to be small, although thereis much scatter in the relationship. In fact, a model of con-vection based on CAPE would suggest a highly stochasticrelationship which highlights a possible limitation of currentdeterministic convective parameterization that are based onCAPE closures.
[40] This study shows that the construction of a high qual-ity long-term data set describing the large-scale atmosphereat a tropical location is possible. In addition to NWP anal-ysis data, the method requires frequent radar observationsto calculate precipitation and related small-scale variables.Such data sets can be used to investigate the fundamentalrelationships between convection and the large-scale atmo-sphere. Furthermore, where relationships are identified, theirdeterministic or stochastic nature can be determined. Suchdata sets provide valuable observational evidence to developconvective parameterizations.
[41] Acknowledgments. Davies and Jakob are supported by theOffice of Science (BER), U.S. Department of Energy under grant DE-SC0002731.
[42] The contributions of S. Xie to this work were performed underthe auspices of the U. S. Department of Energy (DOE), Office of Science,Office of Biological and Environmental Research by Lawrence LivermoreNational Laboratory under contract DE-AC52-07NA27344 and supportedby the Atmospheric Radiation Measurement Program of the Office ofScience at the DOE.
ReferencesArakawa, A. (2004), The cumulus parameterisation problem: Past, present
and future, J. Atmos. Sci., 17(13), 2493–2525.Arakawa, A., and W. Schubert (1974), Interaction of a cumu-
lus cloud ensemble with the large-scale environment, Part1, J.Atmos. Sci., 31, 674–701, doi:10.1175/1520-0469(1974)031<0674:IOACCE>2.0.CO;2.
Bechtold, P., M. Köhler, T. Jung, F. Doblas-Reyes, M. Leutbecher, M. J.Rodwell, F. Vitart, and G. Balsamo (2008), Advances in simulating atmo-spheric variability with the ECMWF model: From synoptic to decadaltime-scales, Q. J. R. Meteorol. Soc., 134(634), 1337–1351.
Bretherton, C. S., M. Peters, and L. Black (2004), Relationships betweenwater vapor path and precipitation over the tropical oceans, J. Clim., 17,1517–1528.
Bringi, V., T. Tang, and V. Chandrasekar (2004), Evaluation of a newpolarmetrically based Z-R relation, J. Atmos. Oceanic Technol., 21,612–623.
Brown, R. G., and C. Bretherton (1997), A test of the strict quasi-equilibrium theory on long time and space scales, J. Atmos. Sci., 54,624–638.
Buizza, R., M. Miller, and T. N. Palmer (1999), Stochastic representationof model uncertainties in the ECMWF ensemble prediction system, Q. J.R. Meteorol. Soc., 125, 2887–2908.
Charba, J. P. (1977), Operational System for Predicting Thunderstorms Twoto Six Hours in Advance, National Weather Service, NOAA.
Cohen, B., and G. Craig (2006), Fluctuations in an equilibrium convectiveensemble. Part II: Numerical experiments, J. Atmos. Sci., 63, 2005–2015.
Crook, N. A. (2001), Understanding Hector: The dynamics of islandthunderstorms, Mon. Weather Rev., 129(6), 1550–1563.
Dixon, M., and G. Wiener (1993), TITAN: Thunderstorm identification,tracking, analysis, and nowcasting-A radar-based methodology, J. Atmos.Oceanic Technol., 10(6), 785–797.
Emanuel, K. (1991), A scheme for representing cumulus convection inlarge-scale models, J. Atmos. Sci., 48(21), 2313–2329.
Emanuel, K. A. (1994), Atmospheric Convection, 1st ed., Oxford UniversityPress.
Holloway, C. E., and J. D. Neelin (2009), Moisture vertical structure, col-umn water vapor, and tropical deep convection, J. Atmos. Sci., 66(6),1665–1683.
Houze Jr, R. A., and A. K. Betts (1981), Convection in gate, Rev. Geophys.,19(4), 541–576.
Keenan, T., B. Morton, X. S. Zhang, and K. Nyguen (1990),Some characteristics of thunderstorms over Bathurst and MelvilleIslands near Darwin, Australia, Q. J. R. Meteorol. Soc., 116(495),1153–1172.
Keenan, T. D., K. Glasson, F. Cummings, T. S. Bird, J. Keller, and J. Lutz(1998), The BMRC/NCAR C-band polarimetric (CPOL) radar system,J. Atmos. Oceanic Technol., 15, 871–886.
Khouider, B., and A. Majda (2006), Multicloud convective parametriza-tions with crude vertical structure, Theor. Comput. Fluid Dyn., 20,351–375.
Kumar, V. V., A. Protat, P. T. May, C. Jakob, G. Penide, S. Kumar, andL. Davies (2012), On the effects of large-scale environment and surfacetypes on convective cloud characteristics over Darwin, Australia, Mon.Weather Rev., 141, 1358–1374.
Lin, J., and J. Neelin (2007), Toward stochastic deep convective parameter-ization in general circulation models, Geophys. Res. Lett., 30(4), 1162,doi:10.1029/2002GL016203.
Mapes, B., S. Tulich, J. Lin, and P. Zuidema (2006), The mesoscale con-vection life cycle: Building block or prototype for large-scale tropicalwaves? Dyn. Atmos. Oceans, 42, 3–29.
Masunaga, H. (2012), Short-term versus climatological relationshipbetween precipitation and tropospheric humidity, J. Clim., 25,7983–7990.
May, P. T., J. H. Mather, G. Vaughan, C. Jakob, G. M. McFarquhar, K. N.Bower, and G. G. Mace (2008), The tropical warm pool internationalcloud experiment, Bull. Am. Meteorol. Soc., 89, 629–645.
McBride, J. L., and W. M. Frank (1999), Relationships between stabilityand monsoon convection, J. Atmos. Sci., 56, 2436.
Neale, R., and J. Slingo (2003), The maritime continent and its role in theglobal climate: A GCM study, J. Clim., 16(5), 834–848.
Neale, R. B., J. H. Richter, and M. Jochum (2008), The impact of convec-tion on ENSO: From a delayed oscillator to a series of events, J. Clim.,21(22), 5904–5924.
Parodi, A., and K. Emanuel (2009), A theory for buoyancy andvelocity scales in deep moist convection, J. Atmos. Sci., 66(11),3449–3463.
Petch, J., A. Hill, L. Davies, A. Fridlind, C. Jakob, Y. Lin, S. Xie, andP. Zhu (2013), Evaluation of intercomparisons of four different typesof model simulating TWP-ICE, Q. J. R. Meteorol. Soc., doi:10.1002/qj.2192.
Peters, O., and J. D. Neelin (2006), Critical phenomena in atmosphericprecipitation, Nat. Phys., 2, 393–396.
Plant, R. S., and G. C. Craig (2008), A stochastic parameterization fordeep convection based on equilibrium statistics, J. Atmos. Sci., 65,87–105.
Shutts, G., and T. Palmer (2007), Convective forcing fluctuations in a cloud-resolving model: Relevance to the stochastic parameterization problem,J. Clim., 20, 187–202.
Steiner, M., R. Houze, and S. Yuter (1995), Climatological characterisa-tion of three-dimensional storm structure from operational radar and raingauge data, J. Appl. Meteorol., 34, 1978–2007.
Sun, Y., S. Solomon, A. Dai, and R. W. Portmann (2006), How often doesit rain?, J. Clim., 19(6), 916–934.
Teixeira, J., and C. A. Reynolds (2008), Stochastic nature of physi-cal parameterizations in ensemble prediction: A stochastic convectionapproach, Mon. Weather Rev., 136(2), 483–496.
Wang, W., and M. E. Schlesinger (1999), The dependence on convectionparameterization of the tropical intraseasonal oscillation simulated by theUIUC 11-layer atmospheric GCM, J. Clim., 12(5), 1423–1457.
Webster, P., and R. Lukas (1992), TOGA-COARE: The coupled ocean-atmosphere response experiment, Bull. Am. Meteorol. Soc., 73(9),1377–1416.
Xie, S., R. T. Cederwall, and M. Zhang (2004), Developing long-termsingle-column model/cloud system - resolving model forcing datausing numerical weather prediction products constrained by surface andtop of the atmosphere observations, J. Geophys. Res., 109, D01104,doi:10.1029/2003JD004045.
Xie, S., T. Hume, C. Jakob, S. A. Klein, R. B. McCoy, and M. Zhang (2010),Observed large-scale structures and diabatic heating and drying profilesduring TWP-ICE, J. Clim., 23, 57–79.
Xie, S., and M. Zhang (2000), Impact of the convection triggering func-tion on single-column model simulations, J. Geophys. Res., 105(D11),14–983.
Yang, G. Y., and J. Slingo (2001), The diurnal cycle in the tropics, Mon.Weather Rev., 129, 784–801.
11,544

DAVIES ET AL.: RELATIONSHIPS BETWEEN SCALES AT DARWIN
Zhang, C., M. Dong, S. Gualdi, H. H. Hendon, E. D. Maloney, A. Marshall,K. R. Sperber, and W. Wang (2006), Simulations of the Madden–Julianoscillation in four pairs of coupled and uncoupled global models, Clim.Dyn., 27(6), 573–592.
Zhang, G. J. (2002), Convective quasi-equilibrium in midlatitude conti-nental environment and its effect on convective parameterization, J.Geophys. Res., 107(D14), doi:10.1029/2001JD001005.
Zhang, M. H., and J. L. Lin (1997), Constrained variational analysisof sounding data based on column integrated budgets of mass, heat,
moisture, and momentum: Approach and application to ARM measure-ments, J. Atmos. Sci., 54, 1503–1524.
Zhang, M. H., J. L. Lin, R. T. Cederwall, J. J. Yio, and S. C. Xie (2001),Objective analysis of ARM IOP data: Method and sensitivity, Mon.Weather Rev., 129, 295–311.
Zhang, X., W. Lin, and M. Zhang (2007), Toward understanding thedouble intertropical convergence zone pathology in coupled ocean-atmosphere general circulation models, J. Geophys. Res., 112, D12102,doi:10.1029/2006JD007878.
11,545