relationships between problem solving strategies and brain
TRANSCRIPT

1
Relationships Between Problem Solving Strategies and Brain Hemisphericity in High School Students
Approved:
____________________________ Dr. Heather C. Galloway
Director, University Honors Program Approved: _____________________________ Dr. M. Alejandra Sorto Department of Mathematics Supervising Professor ________________________________ Dr. Terence McCabe Department of Mathematics Second Reader

2
RELATIONSHIPS BETWEEN PROBLEM SOLVING STRATEGIES AND BRAIN HEMISPHERICITY IN
HIGH SCHOOL STUDENTS
HONORS THESIS
Presented to the Honors Committee of
Texas State University-San Marcos
In Partial Fulfillment of
the Requirements
For Graduation in the University Honors Program
By
Erin Michelle Oliver
San Marcos, Texas
May 2009

3
Abstract The associations between problem solving strategies and brain
hemisphericity are examined. The hypothesis is that there is a correlation between
the methods used to solve a single opened-ended mathematics problem and the
scores obtained in the Style of Learning and Thinking Questionnaire, which
measures student’s brain dominance (Torrance, 1988). A total of 98 ninth grade
students were randomly selected from a High School in South East Texas to be
surveyed. The students completed a demographic questionnaire, an open-ended
mathematics problem and the Style of Learning and Thinking questionnaire.
Results show that as hypothesized, students who tested high for left brain
dominance tended to prefer a written, logical explanation strategy to solve certain
complexity levels of the mathematics problems. Also, as hypothesized, students who
tested high in right brain dominance, tended to prefer drawing diagrams to solve
certain complexity levels of the mathematics problem. However, the listing method
did not correlate with left brain dominance as expected on any level of complexity of
the mathematics problem. The relationships identified in this study show that the
general characteristics associated with each hemisphere of the brain, also apply to
mathematical problem solving. This information could be used to help develop more
whole brained mathematical problem solvers, by teaching strategies that are
associated with both hemispheres.

4
Acknowledgements I would like to thank God for all of the blessings and opportunities I have been given. My Parents- Thank you Mom and Dad for all of the ways you have helped me. From the time I was little you always encouraged me to give 110% in everything I started. You have both been the best examples of how to do this and you have always supported me in everything I have done. Thank you for all of the things you have taught me and for all the love and support you have provided. I love you both and I am so thankful that I was blessed with such great parents. Dr. Sorto- Thank you so much Dr. Sorto for your patience and guidance. From the 10:00 pm phone calls to the hours of meetings in your office, you were always there giving me support. Having never met me before, you took a chance and gave me the opportunity to learn so much about Mathematics Education. I can never repay you for all the ways you have helped me. Thank you so much. Dr. McCabe- Thank you Dr. McCabe for helping me develop an idea. I came to you lost and overwhelmed and you helped me to formulate my topic. Maybe now I can study the accuracy of the thumb test!

5
Table of Contents
Introduction 6
Review of Literature 7
Methodology 21
Results 31
Discussion 42
Recommendations 43
References
45
List of Appendices
Appendix A: Additional Results 47
Appendix B: IRB Documents 49
Appendix C:Instruments 54
Appendix D: Data Collection Instructions 61
Appendix E: Raw Data 65

6
Entering my senior year at Texas State University, I realized that I would soon
be standing in front of a class of high school students faced with the task of teaching
them one of the most difficult subjects of their education, mathematics. As I
pondered this challenge, I decided to visit some of my professors for advice. I
eventually ended up in the office of a professor I had never met, Dr. Terence
McCabe. Dr. McCabe has taught for 20 years at Texas State University and
received the 2003 Presidential Teaching Award, the Alumni Teaching Award and the
Outstanding Teaching Award from the College of Science several times. Dr.
McCabe has a very unique approach to teaching mathematics. He does not rely on
the typical methods of using textbooks, guided practice and structured strategies.
McCabe uses the strategies of discovery learning and the inquiry based teaching
method. For example, in his approach to teaching general problem solving, McCabe
encourages his students to answer four questions; (1) What do you know? (2) What
are you trying to show? (3) Can you draw a picture? And (4) Does this remind you of
anything you have already done? His methods focus more on the use of exploration
problems, rather than simply following examples. My discussion with Dr. McCabe,
lead to the revelation of one of his favorite problems, known as the hand shake
problem. After working through this problem, I learned something very important
about myself. I had always thought of myself as being very left-brained. By left-
brained, I mean that I identify with all of the typical tasks in which the left hemisphere
of the brain specializes. For example, I am a very logical, organized and sequential
type of person. As I approached the handshake problem, I immediately started with
my left brain ways of thinking, but then something strange happened. I quickly

7
changed to a method that was more representative of right brain characteristics.
Was I more whole-brained than I thought? Or did this particular problem push me to
use other methods? This moment is what led to the development of my thesis
project. I wanted to find out if the ways in which we approach mathematical problem
solving are related to the hemisphere of the brain in which we are dominant. It was
also possible that this information could help me as a teacher, and possibly the field
of mathematics education. After Dr. McCabe and I discussed the possible
connection between hemispheric dominance and approaches to problem solving, he
introduced me to another professor by the name of Dr. Alejandra Sorto. Dr. Sorto is
another professor at Texas State recognized for her teaching. She has received the
Graduate Student Excellence in Teaching Award at Michigan State, the Texas State
Mathematics Department and College of Science Teaching Award, and is a 2009
Presidential Teaching Award nominee. Dr. McCabe and Dr. Sorto often work
together on research for Mathematics Education. Dr. Sorto, who has a PhD from
Michigan State University in the field of Mathematics and Statistics Education, took
an interest in my idea and accepted when I asked her to be my thesis supervisor.
And that is where it all began….
Review of Literature
Research Related to Problem Solving
According to Adding it Up: Helping children learn mathematics, by the
National Research Council, for a student to be proficient in mathematics five
components must be accomplished: conceptual understanding, procedural fluency,
strategic competency, adaptive reasoning and productive disposition (2001). For the

8
purposes of this research we focus mainly on strategic competency and adaptive
reasoning. Strategic competence refers to a students’ ability to formulate
mathematical problems, represent them and then solve them. This process is most
commonly known as mathematical problem solving (National Research Council,
2001). According to the National Council of Teachers of Mathematics (2000),
problem solving “is the hallmark of mathematical activity and a major means of
developing mathematical knowledge” (p.116). Adaptive reasoning leads to what we
will later discuss as metacognition, or the ability to think about ones’ own thinking.
A vast amount of research has been conducted in the area of mathematical
problem solving. Problem solving, which is considered to be the core of most
mathematics curricula, is a cognitive process directed at achieving a goal when no
solution method is obvious to the problem solver (Yunus & Ali, 2008). The Principles
and Standards for School Mathematics, specifies that schools should enable
students to accomplish the following: build new mathematical knowledge through
problem solving, solve problems that arise in mathematics and in other contexts,
apply and adapt a variety of appropriate strategies to solve problems and monitor
and reflect on the process of mathematical problem solving (NCTM, 2000).Different
elements of teaching and learning problem solving have been developed and
generalized by mathematics educators. We will present and discuss the main
aspects of those mentioned most commonly in the literature. Of the literature
reviewed, we have determined that there are four basic elements of problem solving.
These elements include content understanding, problem solving strategies,
metacognition and motivation (Yunus & Ali, 2008). Each of these components is

9
responsible for different parts of the problem solving process. For the purposes of
our research we will first discuss the different problem solving strategies and then
the use of metacognition.
Research of Problem Solving Approaches
Problem solving strategies have been a controversial issue in the field of
mathematics for many years. Some mathematicians believe that general problem
solving processes must be taught, while others emphasize the need for more
problem specific strategies. There are basically two categories of classification for
problem solving in the field of mathematics; those that are aligned with the teachings
of Polya, and those that are not. The first category stems from the work of George
Polya. Polya was a researcher, author and teacher whose methods greatly affected
the way we teach problem solving today. He wrote three books that dealt with
problem solving in mathematics titled, How to Solve It (1945), Mathematics and
Plausible Reasoning (1954) and Mathematics Discovery (1965) (Passmore, 2007). It
was Polya’s opinion that the main point of mathematics education should be to teach
problem-solving methods (Polya, 2002). He developed a four-step process which
specified that students must first understand the problem, chose a suitable strategy
for solving it, use the strategy and then evaluate it. Polya also emphasized heuristics
such as Drawing a Diagram, Working Backwards or Finding a Pattern to reach a
solution to a problem (Passmore, 2007). Many math educators agree with Polya;
however, they focus mostly on the second step of the problem solving process.
Darin Beigie, states that the second step of Polya’s process is the key ingredient in
the problem-solving experience (2008). His research addresses the integration of

10
content to guide the problem solving process. Beigie’s studies have shown that
students who perform better on traditional tasks are also superior at combining
distinct procedures to solve a new and more difficult problem (2008). This suggests
that better teaching of content could also be a method to improve problem solving
skills; however mastering content does not always indicate that students truly
understand what they are doing (Beigie, 2008). Some other problem solving
strategies that stem from Polya are the guess and check method, considering a
simpler case, making a table, chart or list, looking for patterns, using logical
reasoning, acting out the problem, working backwards or using the process of
elimination (Beigie 2008). An example of Polya’s four step process being put into
action is shown below. This example comes from a book used to teach pre-service
teachers how to incorporate problem solving in the classroom (Bennett & Nelson,
2004). This problem (Box 1) uses both the heuristics of drawing a diagram and
working backwards.
Box 1. Example problem adapted from Mathematics for elementary teachers: a
conceptual approach (2004).
Problem: A businesswoman went to the bank to send half of her money to a stockbroker. She paid a $2.00 parking fee before entering the bank. Once inside the bank, she sent half of her money to the stockbroker. On the way out she was required to pay a $1.00 mail fee. She did not spend any more money that day. On the second day she returned to the bank and had to pay the $2.00 parking fee before entering the bank to send half of her remaining money to the stockbroker. Once again, on the way out she had to pay a $1.00 mail fee. If she had $182.00 left, how much money did she have before the trip to the bank on the first day?
Understanding the Problem: Let’s begin by guessing the original amount of money, say, $800.00, to get a better feel for the problem. Question 1: If the businesswoman begins the day with $800.00, how much money will she have at the end of the first day, after paying the parking fee before entering the bank, giving half of her money to the stockbroker and then paying the mail fee as she is leaving?
Devising a Plan: Guessing the original amount of money is one possible strategy, but

11
it requires too many computations. Since we know the businesswoman has $182.00 at the end of the second day, a more appropriate strategy for solving the problem is to retrace her steps back through the bank. First, she receives $1.00 back from the mail fee. Continue to work back through the second day in the bank. Question 2: How much money did the businesswoman have at the beginning of the second day?
Carrying Out the Plan: The businesswoman had $368.00 at the beginning of the
second day. Continue to work backward through the first day to determine how much money she had at the beginning of that day. Question 3: What was this amount?
Looking Back: You can now check the solution by beginning with $740, the original amount of money, and going through the expenditures for both days to see if $182.00 is the remaining amount. The problem can be varied by replacing $182.00 at the end of the second day by any amount and working backward to the beginning of the first day. Question 4: For example, if there was $240.00 at the end of the second day, what was the original amount of money?
Answers to Questions 1-4: 1. $398.00
2. The following diagram shows that the businesswoman had $368.00 at the
beginning of the second day. $182.00 $183.00 $366.00 $368.00 Receive $1.00 Receive ½ Receive $2.00 mail fee. of money sent. Parking fee.
3. The diagram shows that the businesswoman had $740.00 at the beginning of the
day, so this is the original amount of money.
$368.00 $369.00 $738.00 $740.00 Receive $1.00 Receive ½ Receive $2.00 mail fee. of money sent. Parking fee.
4. $972.00
ParkingFee$2.00
Send½ofmoney Mailfee$1.00
Endofday2Beginningofday2
Endofday1
Beginningofday1

12
Another alteration of Polya’s techniques is suggested by Dr. Richard Lesh
and Dr. Judith Zawojewski. They propose using Polya’s heuristics as a language to
help problem solvers reflect on how they solved previous problems, rather than as a
list of techniques they should use (2007). In other words, by introducing the students
to the terms guess or draw a diagram, students can identify what they have done in
the past and try to determine if it will work again. Koichu, Berman and Moore tested
a similar idea known as heuristics literacy (2007). They defined heuristic literacy as
not only the use of heuristic vocabulary, but also the internalized heuristics used in
the actual task of problem solving (Koichu, Berman & Moore, 2007). They found the
development of heuristic literacy and mathematical achievement were correlated
with respect to students’ scores on the SAT (Koichu, Berman & Moore, 2007).
In contrast to Polya, some researchers have determined that introducing
students to heuristics is often not effective for improving problem solving abilities.
Schoenfeld claims that teaching the heuristic strategies proposed by Polya are much
too general because each problem requires a unique approach and application of
problem solving methods (1985). Therefore the students must not only learn the
different heuristics but also all of the possible ways they can be altered. Lesh and
Zawojewski drew the conclusion that short lists of heuristics such as Polya’s are too
general, yet creating long lists of situation specific processes becomes so tedious
that learning when and how to use all of the strategies would become the heart of
problem solving instruction (2007). Lester makes the claim that teaching students

13
about problem solving strategies or heuristics actually does little to improve their
ability to solve problems (1994).
After reviewing the research, one important factor that has been left out of
problem solving strategies is brain hemispheric dominance. Hemispheric dominance
refers to a concept known as hemisphericity, which specifies that an individual
processes information primarily through the left hemisphere or the right hemisphere
or a combination of both (explained in detail below) (Saleh, 2001). According to the
hemisphericity research in relation to cognitive styles, it appears that some of the
general heuristics/problem specific strategies are more closely aligned with one
hemisphere of the brain than the other. Has a possible relationship between brain-
dominance and problem solving strategies been overlooked? Identifying this
relationship could help mathematics educators improve the teaching and learning of
problem solving.
Research Related to Metacognition
Taking the focus back to the four elements of problem solving and
mathematical proficiency, we now shift to a focus on metacognition. Several studies
have shown that metacognition greatly impacts an individual’s ability to solve
problems efficiently. A study by J. H. Hartman (1998) suggests that metacognition
affects acquisition, comprehension, retention and application of what is learned. It
also affects learning efficiency, critical thinking and problem solving. Metacognition is
the skill that enables students to monitor their thought processes and determine their
strengths and weaknesses with respect to problem solving (Yunus & Ali, 2008).

14
According to Flavell, metacognition refers to “one’s knowledge concerning
one’s own cognitive processes (1976).” A study conducted by Yunus and Ali (2008)
concluded that metacognition scores can predict, to a certain extent, achievement. A
study by Kramarski, Mevarech and Arami (2002) concluded that students who had
been exposed to metacognition instruction in a mathematics lesson significantly
outperformed those who were not, on standard tasks and authentic tasks. In addition
to this finding, they also determined that those students had been introduced to
metacognition instruction were better at justifying their answers and the techniques
they used (Kramarski, Mevarech &Arami, 2002). According to Passmore,
metacognitive training, which encourages self-regulation, should be combined with
approaches such as Polya’s to achieve successful problem solving (2007). If we
combine the use of metacognition with knowledge of brain hemisphericity and
problem solving strategies aligned with that hemisphericity, it could better equip
students to solve more in depth mathematical problems.
Research Related to Hemisphericity and its Relation to Problem Solving
and Metacognition
Now we shift the focus to the tool of metacognition and problem solving, the
brain. The concept of complementary specialization refers to the idea that each
hemisphere of the brain is specialized for different functions. It has not always been
understood that each side of the brain was responsible for different functions. In fact,
for a period of time it was even believed that the left side of the brain was dominant
and that the right side of the brain was considered to be the minor side (Springer &
Deutsch, 1998). We now know that both sides of the brain are equally important,

15
only they specialize in different tasks. The human brain is split into two hemispheres
which communicate via the corpus callosum. In terms of cognitive styles, it is
generally accepted that the left hemisphere of the brain deals primarily with verbal,
sequential, temporal and digital characteristics. It is also speculated that the left
hemisphere is responsible for logical, analytical and rational thought. The right side
of the brain is most commonly characterized as nonverbal, visuospatial,
simultaneous, spatial and analogical. Types of thinking that are typically associated
with the right hemisphere include synthetic, Gestalt and intuitive thought (Springer &
Deutsch, 1998). Gestalt thinking refers to the viewing of things we see as whole
forms, instead of individual parts that make up the whole. Research by Iaccino,
refers to the differences in hemispheric functions as simply left-analytic versus right-
holistic modes of information processing (1993). Left-analytic mode of thinking refers
to the breaking down of information into separate components. These separate
components are then processed individually in a very orderly fashion. The right-
holistic mode of thinking is productive in distinguishing patterns of relationships
between parts of a stimulus array, integrating many inputs simultaneously and
arriving at complete configuration (Iaccino, 1993). From this information we can see
that approaches to problem solving might differ with respect to which side of the
brain in which a person is more dominant. Understanding that each hemisphere
incorporates a different cognitive style, leads to the idea of hemisphericity.
Hemisphericity refers to the concept that an individual processes information
primarily through the left hemisphere or the right hemisphere or a combination of
both (Saleh, 2001). In many cases an individual relies on one hemisphere of the

16
brain more than the other. The idea that a person has a more dominant hemisphere
has many further implications. Individual, occupational, cultural and educational
preferences are all possible areas that are affected by brain hemisphericity (Iaccino,
1993). For example, left-moders are described as more logical and rational whereas
right-moders are more imaginative and creative. With respect to occupation and
education, a study done by Amany Saleh revealed a correlation between brain
hemisphericity and choice of major (2001). The results from this research study
showed that students majoring in arts, literature, education, communications,
nursing and law were found to be right-brain dominant, whereas students majoring in
business, engineering and science showed left-brain dominance (Saleh, 2001).
These findings provide information that could be useful for educators in the future.
Administrators and teachers in middle schools, high schools and colleges could use
knowledge of a student’s hemisphericity to help guide them into career and
educational paths in which they would excel. Knowledge of a child’s hemisphericity
could also help teachers to better accommodate students needs in the classroom.
Studies have shown that students who are taught through methods that correspond
with their hemispheric style achieved higher test scores (Saleh, 2001). Substantial
amounts of research also indicate that to maximize learning, the left and right
hemispheres must work harmoniously. To amplify and unite the knowledge of left
and right brain characteristics to achieve whole brain instruction is the current focus
of many educators (Respress & Lutfi, 2006). Educators could help students achieve
this harmonious relationship by using teaching strategies that are both categorized
as right brain dominant and left brain dominant. A researcher by the name of Bernice

17
McCarthy, felt so strongly about the importance of hemisphericity in education that
she developed an instructional cycle that provided right-brain oriented instruction
and left-brain oriented instruction called the 4MAT (Scott, 1994). Her lesson cycle
combined both the concepts of brain hemisphericity and Kolb’s model of learning
styles. The identified learning styles show that students either perceive concretely or
abstractly and process actively or reflectively (Scott, 1994). Based on these
conditions there are four different learning styles. In McCarthy’s model, she
addresses each learning style as well as both hemispheres of the brain. In all this
creates eight different ways of processing information, and McCarthy believed that
each lesson should include activities to meet the needs of each specific learner
(McCarthy, 1990). Thus, she developed the 4MAT cycle which includes eight
different activities to complete a lesson cycle and encourages students to feel
comfortable working in all style of thinking (McCarthy, 1997). Incorporating a good
variety of learning styles when teaching can help meet the needs of every student,
as well as encourage the use of both hemispheres harmoniously.
The next question that arises is how do we test for hemisphericity? There are
several measures that are used to classify an individuals’ hemisphericity. Some tests
involve the use of neuroimaging to identify patterns of activity in the brain while the
subject is performing some type of mental operation (Springer & Deutsch, 1998).
Another test uses visual stimuli to determine the differences in the ways individuals
perform on half-field presentations (Springer& Deutsch, 1998). As we have already
determined from previous research, the left side of the brain controls the right side of
the body and the right side of the brain controls the left side of the body. This also

18
applies to the visuals fields of each eye. The assumption of this study is that
performance will be superior when a stimulus is presented initially to the visual field
of the hemisphere specialized for processing it (Springer & Deutsch, 1998). A final,
yet less common, method of testing for hemispheric dominance is by paper-and-
pencil measures (Albaili, 1996). Of the few paper-and-pencil tests that have been
developed to assess cognitive style or hemisphericity in students, perhaps the most
popular is the Style of Learning and Thinking developed by Paul Torrance. This
questionnaire “is a standardized measure of left-right thinking style” (Liao & Chuang,
2007). According to the Mental Measurements Yearbook, the SOLAT is commonly
used for determining a student’s brain hemisphere preference and learning style with
respect to problem solving (Torrance, 1988). The results of this test are used to
determine if a student is more left-brain dominant, right-brain dominant or whole-
brain dominant. Further information on this test will be included in the methods
portion.
As far as the field of mathematics education is concerned, there is still much
research to be done in the area of problem solving. As stated in the Second
Handbook of Mathematical Research, the amount of research on problem solving
has declined in recent years (Lesh & Zawojewski, 2007). It is clear that for students
to be successful in mathematical problem solving, they must have both Strategic
Competencies and Adaptive Reasoning skills (National Research Council, 2001).
Although we still have not determined the best method for teaching problem solving,
we have determined that metacognition must play a role. One tool in the use of
metacognition could be the application of hemisphericity and its implications in the

19
problem solving process. It is clear that hemisphericity has an impact on learning
styles. It is suggested that differential utilization of the hemispheres reflects an
individuals’ cognitive style, which is their preference to an approach for problem
solving. According to Springer & Deutsch (1998), “A tendency to use verbal or
analytic approaches to problems is seen as evidence of left-side hemisphericity,
whereas those who favor holistic or spatial ways of dealing with information are seen
as right-hemisphere people “(pg. 294). Examples of the various methods students
use to reach a solution to the same problem are provided below. This problem
comes from another book, titled Thinking through Mathematics, which is used to
help pre-service teachers learn how to teach inquiry and problem solving skills in the
classroom (1990).
Problem (2): In the barnyard, I have some chickens and some rabbits. I count 50 heads and 120 legs. How many of each type of animal is in the barnyard?
Figures 1.1 to 1.7 represent different student created responses to problem (2).
Figure 1.2.Visual approach to solving the problem.
Figure 1.1.Algebraic approach to solving the problem.

20
Figure 1.3. Visual approach to solving the Figure 1.4. Algebraic approach to problem combined with guessing and checking. solving the problem, different from the Figure 1.1.
Figure 1.5. Using a table/ chart to solve Figure 1.6. Guess and check approach the problem. to solve the problem.
Figure 1.7.Using a table/chart different than, Figure 1.5 to solve the problem.

21
As we can see there are many different ways to solve the same problem.
Each student approached the problem differently and still arrived at the same
answer. The differences in the methods used to solve the problem are a result of the
students’ different learning styles and hemisphericity. If we can increase the amount
of metacognition instruction our students receive by using the knowledge of how
hemisphericity impacts mathematical problem solving, it will only aid in the
improvement of problem solving abilities. I will seek to identify the different methods
used to reach a solution to a mathematics problem and their relation to a students’
hemisphericity. I hypothesize that students who use methods such as tables, charts,
lists, logical reasoning, and process of elimination to solve the problem will show a
left hemispheric dominance when tested. I also hypothesize that students who use
techniques such as draw a diagram, guess and check, look for patterns, act out the
problem or work backwards to solve the problem will display right hemispheric
dominance when tested. The results of this exploratory study will provide more
information as to how hemisphericity relates to mathematics problem solving and
how we could eventually achieve the harmonious use of both hemispheres.
Methodology Conceptual Framework
This study will seek to find the relationship between students’ brain
hemisphericity and preferred strategies to solving a mathematics problem. To
determine any association that brain hemisphericity might have for mathematics
education, we must measure these two constructs and identify if any relationship
exists. Brain hemisphericity refers to the concept that an individual processes

22
information primarily through the left hemisphere or the right hemisphere or a
combination of both (Saleh, 2001). With respect to cognitive styles, it is generally
accepted that the left hemisphere of the brain deals primarily with verbal, sequential,
temporal and digital characteristics. It is also speculated that the left hemisphere is
responsible for logical, analytical and rational thought. The right side of the brain is
most commonly characterized as nonverbal, visuospatial, simultaneous, spatial and
analogical. Types of thinking that are typically associated with the right hemisphere
include synthetic, Gestalt and intuitive thought. (Springer & Deutsch, 1998). Further
research suggests that the specialization differences should be referred to as left-
analytic and right-holistic modes of information processing (Iaccino, 1993). Students’
brain hemisphericity will be sought through a non-invasive method. In turn, these
cognitive styles can also be associated with preferred strategies by students when
solving mathematical problems with any constraints.
A preferred strategy refers to a student’s choices in response to a non-
standardized open ended mathematics problem. George Polya, the pioneer of
problem solving education, specifies that students use many different heuristics to
solve problems. Some of these heuristics include Drawing a Diagram, Working
Backwards or Finding a Pattern to reach a solution to a problem (Passmore, 2007).
Some other problem solving strategies that stem from Polya are the guess and
check method, considering a simpler case, making a table, chart or list, looking for
patterns, using logical reasoning, acting out the problem, working backwards or
using the process of elimination (Beigie 2008). The method a student chooses to
use is their “preferred strategy.”
23
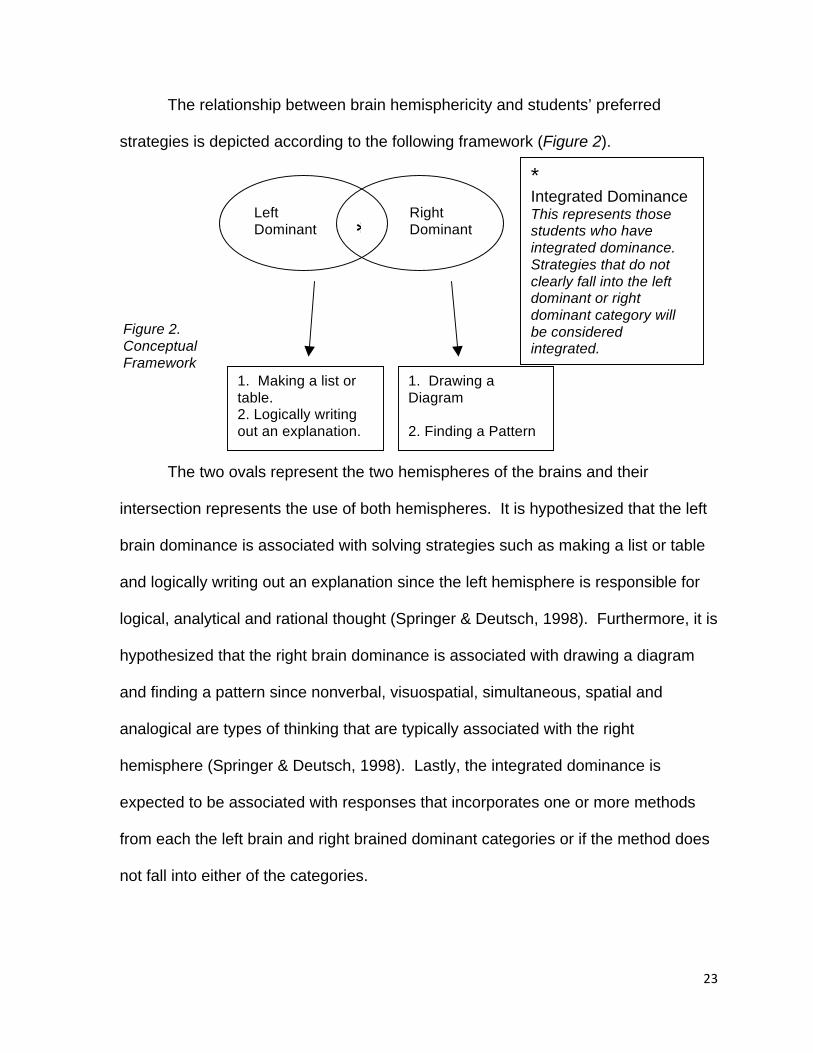
The relationship between brain hemisphericity and students’ preferred
strategies is depicted according to the following framework (Figure 2).
The two ovals represent the two hemispheres of the brains and their
intersection represents the use of both hemispheres. It is hypothesized that the left
brain dominance is associated with solving strategies such as making a list or table
and logically writing out an explanation since the left hemisphere is responsible for
logical, analytical and rational thought (Springer & Deutsch, 1998). Furthermore, it is
hypothesized that the right brain dominance is associated with drawing a diagram
and finding a pattern since nonverbal, visuospatial, simultaneous, spatial and
analogical are types of thinking that are typically associated with the right
hemisphere (Springer & Deutsch, 1998). Lastly, the integrated dominance is
expected to be associated with responses that incorporates one or more methods
from each the left brain and right brained dominant categories or if the method does
not fall into either of the categories.
1. Making a list or table. 2. Logically writing out an explanation.
1. Drawing a Diagram 2. Finding a Pattern
Left Dominant
Right Dominant
Figure 2. Conceptual Framework
*
* Integrated Dominance This represents those students who have integrated dominance. Strategies that do not clearly fall into the left dominant or right dominant category will be considered integrated.

24
Analytic Framework
Population and sample
The population for this study is made up of 622 ninth grade students from a
High School in Southeast Texas. Of the 622 students, 63% are Caucasian, 25% are
Hispanic, 8% are African American, 3% are Asian/Pacific Islander and 1% are
Alaskan/Native American. Out of these students, 9% are considered Special
Education and 19% are considered Economically Disadvantaged. Most of these
students previously attended five different intermediate schools. The scores from the
math portion of the 2008 Texas Assessment of Knowledge and Skills tests are
provided below (Table 1) for the five intermediate schools which contribute to this
population. These test results show that the population from which we are drawing
our sample is very competent in the area of mathematics.
Table 1 Intermediate TAKS Data 2008
Intermediate School
Number Tested
Percent Passed
Percent Commended
School A 351 94 31 School B 324 97 46 School C 355 100 56 School D 426 98 48 School E 292 96 34
Of the 622 freshman students that attend this school, a sample of 98 is being
tested for the data collection of this study. These 98 students are randomly selected
by their advisory class. Advisory is a class that all students attend for 30 minutes,
one time a week. This advisory acts as the students “homeroom,” giving them
important school and testing information. The students are randomly placed in

25
advisories, and the seven advisories chosen for this study were selected at random
as well. Although this sample is greatly representative of the population, one group
of students was excluded from the study. Advisory classes which contain at risk
students are excluded from the study for various reasons given by the administrators
of the school. The demographic information for the sample is provided in the tables
below.
Table 2 Table 3 Student Sample Age Student Sample Gender Number of Students
Age
32 14 60 15 6 16 Table 4 Student Sample Ethnicity Ethnicity White African
American Hispanic Asian Other
Number of Students
52 8 26 4 8
Percent of Students
53% 8% 27% 4% 8%
The sample only varies slightly in their mathematics experience. A total of
65% percent of the students in the sample are currently taking Algebra I. The
remaining 35% of students are either enrolled in Regular/Advanced Geometry or
Regular/Advanced Algebra II. Of these students 22% identify themselves as English
Language Learners and 36% identify themselves as Gifted and Talented.
Data Collection
The students are being tested during two different advisory class periods. At
each testing protocol, the students will receive a copy of the Consent and Assent
Male Female 48 50

26
Forms (see Appendix B) as required by the Institutional Review Board. During the
first advisory class period, the students will be filling out a demographic
questionnaire and solving the mathematical problem. The demographic information
is described in the sample above. The final advisory class session is used for the
students to complete the Style of Learning and Thinking Questionnaire (see
Appendix C for a copy of the instruments). These three items are only connected by
a number to maintain anonymity. Teachers will record each student’s number to
ensure that data for each student is kept together through this collection process.
Upon completion of all three tasks, the advisory teachers will destroy any identifying
information, such as the names accompanied with the numbers on the instruments.
The sample is split in to seven different advisory classes, in which each teacher will
read word for word directions for the administration of the instruments (see Appendix
D for teacher instructions).
Variable Measurement and Methodology
To measure these two constructs, two different instruments are used. The
first instrument is used to determine students’ brain hemisphericity. In 1988, Dr. Paul
Torrance developed a questionnaire known as the Style of Learning and Thinking
(SOLAT). This questionnaire is designed to help determine a students’ dominance in
either the left cerebral hemisphere, right cerebral hemisphere or the integration of
both. The questionnaire is a series of 28 non-invasive questions that help distinguish
hemispheric specialization.
The second instrument is a non-standardized math problem, which has been
proven to elicit different methods for solving (T. McCabe, personal communications,

27
March 11, 2009). The responses to this problem are then categorized by a scale that
has been developed based on theory (see Figure 2. Conceptual Framework above).
The categorization of these responses helps to identify any correlation relationship
between the preferred strategies and the SOLAT results.
Instruments
SOLAT
The initial version of the SOLAT was intended to be used to test adults. It
originally consisted of 50 items that were based on research findings in reference to
specialized functions of the left and right hemispheres. Each item on the original
SOLAT had three possible responses for the subject to select. The first response
was representative of left specialization, while the second response was
representative of right specialization. The third response on this version was left
available for subjects who showed an integration of the hemispheres for a particular
question. The initial test of the first version of the SOLAT was given administered to
78 graduate students. The results showed that there was much ease in completing
the 50 items in about 15 minutes. Analysis of the three scales (left, right and
integrated) revealed that almost all of the items had satisfactory correlation
coefficients. Items that had marginal or submarginal internal consistency were
eliminated, leaving only 36 items to which four more were added later to arrive at a
total of 40 questions for the adult version. Several attempts have been made to
adapt the adult version into a youth version. Many of these attempts involved
simplifying the vocabulary to a level that children and youths would understand.
However, Bernice McCarthy along with Jamie Smith assisted in adapting the test to

28
represent situations that were within the behavioral repertoire of children (Torrance,
1988). Mary Kolesinski also assisted these researchers in making further
adjustments for the youth version of the test. In the development of both the
Elementary and Youth forms, standard procedures were followed. Each initial
version consisted of 50 items. The test items were checked against cumulative
research on hemispheric specialization. The 50 question surveys were given to 400
children in grades K through 5 and 1,000 in grades 6 through 12. After thorough
analysis, the tests were reduced to 25 items for the Elementary version, and 28
items for the Youth version (see Appendix C for a copy).
The testing environment for the Youth form of the SOLAT is designed for a
classroom setting. A good testing setting must be arranged and maintained
throughout testing. During the administration of the SOLAT, the students will be in
their advisory classrooms. The advisory classrooms are the location in which all
testing is completed for this particular school. This ensures a good testing
environment which will easily be maintained. The testing process is thoroughly
explained to the students. For each item, there are two statements and four different
ways to respond. Students can either check the first statement if describes them,
check the second statement if it describes them, check both statements if they feel
that both apply, or check neither statement.
Scoring this test is fairly straight forward. The tests are marked on paper
which has a carbon key attached. After they are turned in, using the carbon key, the
number of L’s (Lefts) and the number of R’s (Rights) and the number of statements
in which both were checked (Whole-Brained) are counted and totaled. A tally is also

29
made of the items that were left blank. These numbers represent the Raw Scores
and are recorded on the Profiles Form. The Raw Scores are then converted to
Standard Scores and Percentiles by using the conversion table provided with the
Profile Form. These Standard Scores and Percentiles were calculated on the actual
distribution of the Raw Scores and do not follow the “normal curve.” This percentile
ranking is used in conjunction with the preferred strategies responses to determine if
there is any correlation.
Mathematics Problem
The problem that is being used to elicit the students’ preferred strategy has
been used in several similar research studies. This type of mathematical problem
allows for variation in the methods used to solve it and has proven to have many
different strategies to achieve the correct answer. The problem is stated below in
Box 2 and is also in Appendix C.
Box 2. Mathematics Problem
Instructions: Please show how you would answer each of the following problems by using the first method that comes to you. It is very important to show (on this paper) how you are thinking of the problem and your thought process. Having the correct answer is not the focus of this exercise. We want to see the way you think about the problem. Problem: A High School is hosting a round robin soccer tournament, in which each team must play every other team once. For each of the following numbers of teams, please indicate how many total games would be played. I should be able to look at your work, and determine the number of games for each situation. 2 teams 3 teams 4 teams 5 teams 6 teams Have you solved a similar problem before? Yes No hbjjhk

30
Similar types of problems have been used several times in college classroom
settings, as well as elementary classroom settings to test for problem solving
methods (T. McCabe, personal communications, March 11, 2009). The most
commonly used strategies for solving this type of problem are drawing a diagram,
finding a pattern, making a list or table, or logically writing out an explanation. The
students’ responses to the first three portions of the mathematical problem are being
used to assign each student to a category. It is important to use their initial
responses because this is the best indicator of brain dominance. As the students
continue working the problem they begin to analyze their method and might decide
to change.
To characterize the responses, a common rubric is used. Each response has
a label which corresponds to each of the solving strategies under consideration.
See Figure 3 for the description and example of the strategies. More examples can
also be found in Appendix E.
Figure 3. Coding of Responses with Examples Listing: uses words or objects to list each game that will be played
Diagramed Listing: listing the number of teams, but using connectors (lines/arcs) to represent each game

31
Drawing a Diagram: uses shapes and connectors (lines/arcs) to account for each game
Written Logical Explanation: uses words or phrases to describe what will happen
Blank: No response
A statistical Analysis of Variance (ANOVA) is used to find the association
between the SOLAT scores and the strategies used to solve the mathematics
problem.
Results
The results for the mathematics problem and the SOLAT are presented
separately, followed by the comparison of the two. To examine information from the
mathematical problem a simple frequency chart was used, and a T-test with mean
50 was used for examination of the distribution of the SOLAT scores. ANOVA was
used to analyze the comparison of the mathematics problem with the SOLAT for the
final results.

32
Mathematics Problem
The first step of analysis was to analyze the different methods that the sample
group used to answer the mathematics problem. In the first examination of the
methods used to solve the mathematical problem, we classified the responses into
nine different categories. To ease the analysis process, we created numerical codes
corresponding to each category. The numerical codes and categories were: 1-
Listing, 2- Diagrammed Listing, 3-Vertical Diagram, 4- Positioned Diagram, 5-
Written Logical Explanation, 6- Answer Only, 7- Other, 8- Blank/No Response, 9-
Written “I Don’t Know”. The categories were later collapsed into the five responses
discussed previously in the Methods section to analyze with the results of the
SOLAT. The reason for this was that we want to test the hypothesis that certain
methods of solving the mathematical problems are related with certain brain
dominance. The mathematical problem required the students to respond to six
different cases; one for each different number of teams involved in the tournament.
The first case was to consider 2 teams; the next case was to consider 3 teams, and
so on. Figure 4 shows the frequency of the responses for each portion of the
mathematics problem.

33
Figure 4. Frequency of Strategies Used to Solve Mathematics Problem
Figure 4. Response Key: 1-Listing, 2- Diagrammed Listing, 3-Vertical Diagram, 4- Positioned Diagram, 5- Written Logical Explanation, 6- Answer Only, 7- Other, 8- Blank/No Response, 9-Written “I Don’t Know”
It is worth noting that the two most popular responses were Listing and
Diagramed Listing for all cases except for the case of 2 teams. When answering the
case of 2 teams, students preferred to just write the answer. The reason for this
could be due to the fact that it is very simple to figure out the total number of games
when there are only two teams. Figure 5 shows examples of the most popular
responses. These responses were used more often as the preferred strategy when
the number of teams in the problem increased to 4, 5 and 6.
Figure 5. Listing, Diagrammed Listing and Diagram Responses
Listing Diagrammed Listing Diagram

34
SOLAT
The second step of analysis was to score the SOLAT results. After
completion of the SOLAT, Raw Scores were converted into Standard Scores, which
were then converted into Percentile Scores. These Percentile Scores indicated what
percentage of students their age, they exceed in dominance for each the left, right
and whole brain scales. Students could either score high on the Left Percentile, high
on the Right Percentile, high on both, or high on the Whole Percentile. A high
percentile score on both the left and right however, did not indicate whole brain
dominance. Figures 6.1, 6.2 and 6.3 represent the distribution of the percentiles from
the SOLAT with respect to the typical ninth grade results. Each graph is
accompanied by the mean and standard deviation of the distribution. Recall that a
50 on the percentile score corresponds to the median response expected from the
typical ninth grader. Hence, to quantify the comparison of the observed brain
dominance of the respondents to the “typical” ninth graders, a one sample T-test for
each of the percentile scores was performed against the null value of 50.

35
Figure 6.1. Left Percentile Distribution
Figure 6.2. Right Percentile Distribution

36
Figure 6.3. Whole Percentile Distribution
Figure 6.1 shows the percentile results for the SOLAT instrument associated
with left brain dominance. As expected, the sample tested approximately normal for
the typical ninth grade population, with mean 50.65 and standard deviation 28.49
and p=0.82. Hence, the respondents are typical of ninth graders. However, Figure
6.2 which shows the percentile results for the SOLAT in association with right brain
dominance shows a left skewed distribution than what is typically expected. The
mean was 69.06 and the standard deviation was 27.54 and p<0.0001.This indicates
that there was an abnormally large amount of the students in the sample who were
classified as scoring high on the Right Percentile Scale. This abnormality in the
sample could cause other abnormal results in the comparison of the Mathematics
Problem Response and the SOLAT results. Figure 6.3, which shows the percentile
results for the SOLAT instrument associated with whole brain dominance, is only
37
slightly inconsistent with that of the typical ninth grade population, with a mean of
41.15 and a standard deviation of 30.72 and p=0.0053.
ANOVA- Mathematics Problem and SOLAT
The relationship between the responses to the Mathematics Problem and the
SOLAT results were analyzed using Analysis of Variance (ANOVA). ANOVA tests
were performed for each case (2 teams, 3 teams, 4 teams, 5 teams, and 6 teams)
versus percentile scores for left, right, and whole brain. Many ANOVA tests were
conducted, and several tested to be significant. The results that are represented by
Figure 7.1 are for the case of 2 teams, whereas the results represented by Figures
7.2 and 7.3 are for the case of 5 teams. Similar results (p-values) were found for
other cases, but these specific cases presented the most significant results for one
of each of the three percentiles; right, left and whole. Additional significant
relationships can be found in Appendix A. Response labels correspond to the
defined responses in Figure 3 in the Methods section. Also, below each graph is a
table which contains the information obtained by the Analysis of Variance (ANOVA).

38
Figure 7.1. Responses for 2 Teams in Relation to Right Percentiles
Table 5 Analysis of Variance for Right Percentile and Responses for 2 Teams Source DF SS MS F P Groups 4 6464.33 1616.08 2.240 0.0707 Error 93 67107.3 721.58 -- -- Total 97 73571.6 -- -- --
The first result that stands out from Figure 7.1 is the significant relationship
(p=0.0707) among the problem solving strategies depending on right brain
dominance. This result is strongly consistent with the original hypothesis. We can
see that the students scoring high on the right percentile, most often responded to

39
the 2 Teams portion of the Mathematics Problem, with either a Blank response, a
Diagram or a List. The distribution of the Diagramming response is concentrated in
the higher percentiles. This shows, as hypothesized, that students scoring the
highest in the right percentile primarily used the Diagram strategy to solve the
problem. However, the result of right brain dominant individuals using the Listing
strategy is inconsistent with the hypothesis since this method is, in theory,
associated with the left brain. A possible reason for this result could be the abnormal
SOLAT results discussed previously. This particular sample had an abnormally
skewed distribution for the number of students scoring high in the right percentile.
Also, there was a group of students who scored high on both the right and left
percentiles, which would explain this crossover result. But, we can see that the
Listing strategy was more distributed than the Diagram strategy, which adds
confidence to the conclusion that Diagramming was the preferred strategy for those
scoring high in the right percentile.

40
Figure 7.2. Responses for 5 Teams in Relation to Left Percentiles
Table 6 Analysis of Variance for Left Percentile and Responses for 5 Teams Source DF SS MS F P Groups 4 6584.79 1646.20 2.121 0.0843 Error 93 72173.4 776.06 -- -- Total 97 78758.2 -- -- --
Analysis of Figure 7.2 showed another significant (p=0.0843) relationship
among the problem solving strategies depending on left brain dominance. This result
is also consistent with the original hypothesis to some extent. The diagram shows
that students scoring high on the left percentile responded to the 5 Teams portion of
the Mathematics Problem, most often with either a Written Logical Explanation

41
response, a Diagramed List or a List. As hypothesized, students scoring high in the
left percentile used a Written Logical Explanation response or a Listing method to
solve the mathematics problem. Surprisingly, students scoring high in the left
percentile also used Diagrammed Lists to solve the problem. This finding could be
also attributed to the fact that the students could have been from the group that
scored high on both the left and right percentiles of the SOLAT.
Figure 7.3. Responses for 5 Teams in Relation to Whole Percentiles
Table 7 Analysis of Variance for Whole Percentile and Responses for 5 Teams Source DF SS MS F P Groups 4 8249.74 2062.43 2.303 0.0642 Error 93 83271 895.39 -- -- Total 97 91520.7 -- -- --

42
The final significant (p=0.0642) relationship, represented in Figure 7.3, was
between the problem solving strategies depending on whole brain dominance. This
result is consistent with the research; however we made no specific hypothesis for
whole brain dominance. We can see that students scoring high on the whole brain
percentile responded to the 5 Teams portion of the Mathematics Problem most often
with either a List or a Diagram. Using the Conceptual Framework (Figure 2) as a
guide, we can see that Listing is under the Left Dominant section and Diagrams are
under the Right Dominant section. Therefore, students who tested to be high on the
whole brain percentile used either a hypothesized left brain strategy or a
hypothesized right brain strategy. This correlates with the idea that whole brain
dominant individual’s use either a combination of methods or sometimes choose a
left brain dominant strategy, while at other times they choose a right brain dominant
strategy.
Discussion
It was clearly identified through this research that several methods for solving
a mathematics problem correlated with specific brain dominance. As hypothesized,
students who tested high for left brain dominance tended to prefer a written, logical
explanation strategy to solve certain levels of complexity of the mathematics
problems. Also, as hypothesized, students who tested high in right brain dominance,
tended to prefer drawing diagrams to solve certain levels of complexity of the
mathematics problem. These two relationships show that the general characteristics

43
associated with each hemisphere of the brain, also apply to mathematical problem
solving.
A highly possible reason for the results that proved to be inconsistent with the
hypothesis is the fact that this sample contained an abnormally large number of right
brain dominant individuals. This could explain why the listing strategy tested to be a
more right brain dominant strategy. Perhaps a more explicit brain dominance test
could be used to more accurately classify the students as either right brain
dominant, left brain dominant or whole brain dominant. The SOLAT allowed for
students to score high on two percentiles, rather than eliminating two percentiles and
having a final classification as left, right or whole brained. This could also have been
a reason for the abnormal amount of students scoring high on the right percentile.
Recommendations
There are vast amounts of research in the field of mathematics education.
However, the results of this study indicate that it could be beneficial for more
research to be done in the area of relating brain hemisphericity to teaching
mathematical problem solving. A possible step for future research could be to
identify why the results were more significant for the more complex portions of the
mathematics problem. Another interesting factor would be to determine if any
correlation exists between a students’ rating of mathematics and their brain
hemisphericity or between their gender and hemisphericity. In addition to these
investigations, a different method for testing brain hemisphericity, such as
neuroimaging or visual field tests could be used. The results of these studies could
have various implications for mathematics education. Most importantly, this

44
information could be used to help develop more whole brained mathematical
problem solvers, by teaching strategies that are associated with both hemispheres.
45
References Albaili, M. A. (1996). Inferred Hemispheric Style and Problem-Solving Performance. Perceptual and Motor Skills, 83, 427-434. Altun, M. & Memnum, D. S. (2008). Mathematics Teacher Trainees’ Skills and Opinions on Solving Non-Routine Mathematical Problems. Journal of Theory & Practice in Education, 4(2), 213-238.
Beigie, D. (2008). Integrating Content to Create Problem-Solving Opportunities. Mathematics Teaching in the Middle School, 13(6), 352-360. Bennett, A.B., & Nelson, L.T. (2004). Mathematics for Elementary Teachers: A Conceptual Approach. New York: McGraw-Hill. Flavell, J. H. (1976). Metacognitive aspects of problem solving. In L. B. Resnick, The Nature of Intelligence, 12, 231- 235.Hillsdale, NJ: Lawrence Erlbaum Associates. Hartman, H. J. (1998). Metacognition in teaching and learning: An introduction. Instructional Science, 26, 1-3. Iaccino, J.F. (1993). Left Brain- Right Brain Differences: inquires, Evidence and New Approaches. Hillsdale, New Jersey: Lawrence Erlbaun Associates. Koichu, B., Berman, A., Moore, M. (2007). Heuristic literacy development and its relation to mathematical achievements of middle school students. Instructional Science, 35(2), 99-139. Kramarski, B., Mevarech, Z.R., & Arami, M. (2002). The effects of metacognition instruction on solving mathematical authentic tasks. Educational Studies in Mathematics, 49, 225-250. Lesh, R., Zawojewski, J. (2007). Problem Solving and Modeling. Second Handbook of Research on Mathematics Teaching and Learning, 763-803. Lester, Jr, F. K. (1994). Musings about mathematical problem-solving research: 1970–1994.Journal for Research in Mathematics Education, 25(6), 660–675. Liao, C., Chuang, S.H.(2007). Assessing the effect of cognitive styles with different learning modes on learning outcome. Perceptual and Motor Skills,105,184- 190. McCarthy, B. (1997). A Tale of Four Learners: 4MAT’s Learning Styles. Educational Leadership, 54(6),46-51.

46
McCarthy, B. (1990). Using the 4MAT System to Bring Learning Styles to Schools. Educational Leadership,48(2),31-37. National Council of Teachers of Mathematics. (2000). Principles and Standards for School Mathematics. Reston, VA: The National Council of Teachers of Mathematics, Inc. National Research Council. (2001). Adding it up: Helping children learn mathematics. Washington, DC: J. Kilpatrick, J. Swafford, and B. Findell (Eds). Passmore, T. (2007). Polya's legacy: Fully forgotten or getting a new perspective in theory and practice? Australian Senior Mathematics Journal, 21(2), 44-53. Polya, G. (2002). Transcribed from video lesson by Thomas C. O’Brien.
The Goals of Mathematical Education Part 1. MT: Mathematics Teaching,181, 5. Polya, G. (2002) Transcribed from video Lesson by Thomas C. O’Brien. The Goals of Mathematical Education Part 2. MT: Mathematics Teaching,181, 42. Respress, T. & Lutfi, G. (2006). Whole Brain Learning: The Fine Arts with Students at Risk.Reclaiming Children & Youth, 15(1) 24-31. Saleh, A.(2001). Brain Hemisphericity and Academic Majors: A Correlation Study. College Student Journal, 35(2),193. Schoenfeld, A. H. (1985). Mathematical problem solving. New York: Academic Press.
Scott, H.V.(1994). A Serious Look at the 4MAT Model. Information Analyses. Silver, E.A., Kilpatrick, J., & Schlesinger, B. (1990). Thinking Through Mathematics: Fostering Inquiry and Communication in Mathematics Classrooms. New York: Robert Orrill and Dennie Wolf (Eds.) Springer, S.P., & Deutsch, G. (1998). Left Brain, Right Brain: Perspectives from Cognitive Neuroscience. New York: W.H. Freeman. T. McCabe (personal communication, March 11, 2009) Torrance, P.E., (1988). Style of Learning and Thinking. Scholastic Testing Service, Inc. Yunus, A. S. & Ali, W.Z. (2008). Metacognition and Motivation in Mathematical Problem Solving. International Journal of Learning, 15(3), 121-131.

47
Appendix A
Additional Results
Table 8 Analysis of Variance for Left Percentile and Responses for 3 Teams Source DF SS MS F P Groups 4 6575.6 1643.90 2.118 0.0847 Error 93 72182.6 776.16 -- -- Total 97 78758.2 -- -- --
48
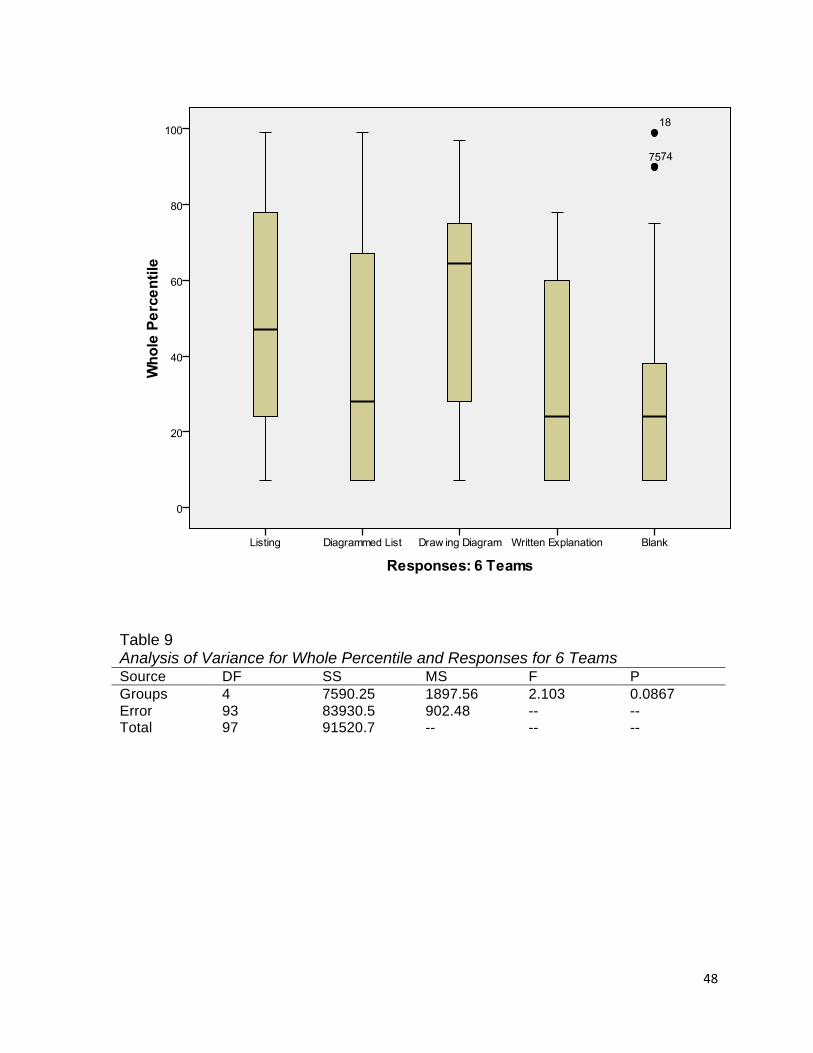
Table 9 Analysis of Variance for Whole Percentile and Responses for 6 Teams Source DF SS MS F P Groups 4 7590.25 1897.56 2.103 0.0867 Error 93 83930.5 902.48 -- -- Total 97 91520.7 -- -- --

49
Appendix B
IRB Documents Assent Form Study Title: Relationships between problem solving strategies and brain hemisphericity in High School students. Institutional Review Board Approval Number: 2009P200 Hello, my name is Erin Oliver. I am currently a student teacher, from Texas State University, placed at Clear Creek High School. This semester I will be conducting research in your advisory classroom for my Undergraduate Honors Thesis.
The anonymous results of this study will be used to help establish if a relationship exists between the methods students use to solve math problems, and the side of the brain in which they test dominant. The human brain is split down the middle into two sides, each of which specializes in certain tasks. These two sides are connected by the corpus callosum, which runs down the middle and acts as a bridge between the two sides. Some individuals test to be more left brain dominant, right brain dominant or some show more of an integrated dominance. The results of this study could eventually help teachers to improve individual student instruction and raise achievement.
The study will consist of three tasks for you to complete. The first task is
simply a demographic questionnaire. The demographics that will be collected are as follows: age, gender, ethnicity, mathematics experience, parents’ education, graphing calculator experience and favorite subject. The second task is the Style of Learning and Thinking Questionnaire, developed by Torrance, McCarthy and Smith (1988). This is a 28 question survey which helps determine your brain dominance. Some sample items from the survey are provided below: Place a check mark in the blank if the statement is true of you. You may check one or both of the statements in a pair or neither – whatever fits you. _ I tend to solve problems with a playful approach. _ I tend to solve problems with a serious, business-like approach. _ I like to express feelings in plain language. _ I like to express feelings in poetry, song, dance, or art.
The third task that you will complete will be to solve a mathematical word problem. Achieving the correct answer to the problem is not the point of interest. Rather, we are interested in observing the specific methods you choose.
50
This study is completely voluntary. If at any time you choose not to answer a question, there will be no discrimination towards you in any way. Refusal to participate in this study will not affect your relationship with Texas State University. To maintain anonymity, no names or identifying information will be collected during this study. All data records will be securely held by me, Erin Oliver, through analysis, and will be discarded after May 15, 2009. Results of the study will be made available upon request. If you have any questions regarding the study, or would like to withdraw yourself from the study please contact me through the contact information provided.
This study will take three small portions of your advisory over three weeks. Willingly accepting the surveys during the next two advisory classes, will affirm your willingness to participate in this study. If you should choose not to participate, you will remain in class to complete other work. Please indicate your name below if you would like to volunteer to be interviewed after the study has taken place. This interview will contribute to the research and would be greatly appreciated. Thank you for your cooperation. I, ________________________ would like to be contacted to participate in a follow up interview.

51
Consent Form Study Title: Relationships between problem solving strategies and brain hemisphericity in High School students. Institutional Review Board Approval Number: 2009P200 Dear Parent/Guardian, Hello, my name is Erin Oliver. I am currently a student teacher, from Texas State University, placed at Clear Creek High School. This semester I will be conducting research at Clear Creek High School for my Undergraduate Honors Thesis. You can contact me at any time by emailing me at [email protected] or by calling 832-457-1826. The anonymous results of this study will be used to help establish if a relationship exists between the methods students use to solve math problems, and the side of the brain in which they test dominant. The human brain is split down the middle into two sides, each of which specializes in certain tasks. These two sides are connected by the corpus callosum, which runs down the middle and acts as a bridge between the two sides. Some individuals test to be more left brain dominant, right brain dominant or some show more of an integrated dominance. The results of this study could eventually help teachers to improve individual student instruction and raise achievement. The study will consist of three tasks for your child to complete. The first task is simply a demographic questionnaire. The demographics that will be collected are as follows: age, gender, ethnicity, mathematics experience, parents’ education, graphing calculator experience and favorite subject. The second task is the Style of Learning and Thinking Questionnaire, developed by Torrance, McCarthy and Smith (1988). This is a 28 question survey which helps determine your child’s brain dominance. Some sample items from the survey are provided below: Place a check mark in the blank if the statement is true of you. You may check one or both of the statements in a pair or neither – whatever fits you. _ I tend to solve problems with a playful approach. _ I tend to solve problems with a serious, business-like approach. _ I like to express feelings in plain language. _ I like to express feelings in poetry, song, dance, or art.
The third task that your child will complete will be to solve a mathematical word problem. Achieving the correct answer to the problem is not the point of

52
interest. Rather, we are interested in observing the specific methods your child chooses.
The selection of the ninth grade campus to complete this study was made for many reasons. The first reason for choosing these students is that not much research has been conducted for students of this age group. Second, most ninth grade students have had the same amount of exposure to mathematical problem solving. The final reason for choosing these students is because of the logistical benefits of the ninth grade center. All ninth graders attend a weekly advisory, which is the location in which this study will take place. This can ensure consistency and randomized selection of the students to participate in the study. The study will only take a small portion of their advisory sessions and no outside work will be requested. This study is completely voluntary. If at any time your child chooses not to answer a question, there will be no discrimination towards them in any way. Refusal to participate in this study will not affect your child’s relationship with Texas State University. To maintain anonymity, no names or identifying information will be collected during this study. All data records will be securely held by me, Erin Oliver, through analysis, and will be discarded after May 15, 2009. Results of the study will be made available upon request. If you have any questions regarding the study, or would like to withdraw your child from the study please contact me through the contact information provided. If you have any other questions about this research study please contact Dr. Jon Lasser or Ms. Becky Northcut, whose contact information is provided below. I thank you for your consideration and for your child’s participation in this study. It is my hope that the results of this study will lead to important implications for the field of mathematics education. Sincerely, Miss Erin Oliver [email protected] 832-457-1826 Dr. Jon Lasser [email protected] 512-245-3413 Ms. Becky Northcut 512-245-2102

53
Institutional Review Board Application
Certificate of Approval Applicant: Erin Oliver
Application Number : 2009P200
Project Title: Relationship between problem solving strategies and brain hemisphericity in High School mathematics students.
Date of Approval: 03/04/09
Expiration Date: 03/04/10

54
Appendix C
Instruments
DEMOGRAPHIC QUESTIONNAIRE
1. Age (circle one): 11or younger 12 13 14 15 16 17 or older 2. Gender (circle one): Male Female 3. Ethnicity (circle one): Caucasian Hispanic African American Asian Other 4. Current Mathematics Class (circle one): 8th Grade Math Geometry Algebra II (Enriched)
8th Grade Math (PreAP/GT) Geometry (PreAP/GT) Algebra II (PreAp/GT)
Algebra I Math Models Precalculus
Algebra I (PreAP/GT) Algebra II Precalculus (PreAP/GT)
Other (Please List): 5. Please circle all of your Previous Math Classes: 8th Grade Math Geometry Algebra II (Enriched)
8th Grade Math (PreAP/GT) Geometry (PreAP/GT) Algebra II (PreAp/GT)
Algebra I Math Models Precalculus
Algebra I (PreAP/GT) Algebra II Precalculus (PreAP/GT)
Other (Please List): 6. Are you classified as an English Language Learner (circle one)?

55
Yes No 7. Are you or have you ever been classified as a gifted learner (circle one)? Yes No 8. Highest Degree of Parents Education (circle one): Both graduated from College One graduated from College
Neither graduated from College Both graduated High School One graduated High School
Neither graduated High School 9. How many years including this year have you used a graphing calculator in the classroom (circle one)? 0 1 2 3 4 or more 10. How do you feel about mathematics (circle one)? I hate it! I dislike it. It is alright. I like it. I love it! 11. Please list any extracurricular math experience (clubs, math camps, competitions): 12. Please list your favorite subject and why:

56
Mathematics Problem Instructions: Please show how you would answer each of the following problems by using the first method that comes to you. It is very important to show (on this paper) how you are thinking of the problem and your thought process. Having the correct answer is not the focus of this exercise. We want to see the way you think about the problem. Problem: A High School is hosting a round robin soccer tournament, in which each team must play every other team once. For each of the following numbers of teams, please indicate how many total games would be played. I should be able to look at your work, and determine the number of games for each situation. 2 Teams 3 Teams 4 Teams

57
5 Teams 6 Teams Have you solved a similar problem before? Yes No

58

59

60

61
Appendix D
Data Collection Instructions
DATA COLLECTION INSTRUCTIONS Summary:
This study will take place over two advisory sessions. Each data collection session should only take about 15-20 minutes. Because this study is being used for research purposes, the results must remain anonymous. For this reason you will hold on to the ROLL SHEET which will contain each student’s ID Number and then destroy it by shredding it after the second day of testing. Also, Consent/Assent Forms must be passed out at the beginning of every day of testing. This is a rule from the Texas State University Institutional Review Board. I will provide all needed forms for you. Day One (April 2, 2009):
• Pass out the Assent and Consent Forms before doing anything. Instruct the students to read the Assent Form and allow time for them to do so. Also, tell them to take the Consent Form home to their parents/guardians. On this day of testing, students will be filling out a demographic questionnaire
and answering a mathematics problem. If a student is absent please write ABSENT at the top of the paper and place it in the folder. A power point presentation will be provided for your students to follow. Leave the slide that says Demographic Questionnaire up and have them fill out the questionnaire. Then move to the slide that says Mathematical Problem and have them work it following the instructions. Please read the power point word for word to the students. Offer clarification if they need it, but do not suggest anything as to the methods to solve the problems. Some ideas to emphasize are the following:
• Please use the first method that comes to your mind. • You must show you work and the methods you used to arrive at your
answer for each problem. • Achieving the correct answer is not the point of interest. Once they have filled out the demographic questionnaire and answered the
problem completely, go to the final slide. The students will need to bring both documents up to you and staple them together. Then they will write their name beside their ID Number on the ROLL SHEET. After they turn it in please make sure that they do not have any identifying information written on the documents, and make sure they have followed instructions as far as circling answers. Some questions on the questionnaire require more than one answer and some require a single answer. Then check to make sure they completed the math problem. No

62
blank forms should be accepted. Also, please double check that they wrote their name by the appropriate ID Number on the ROLL SHEET. This can be checked by looking at the top of each questionnaire to ensure that the ID Number matches with the students name on the ROLL SHEET. Place all finished questionnaires with the math problem stapled to the back in the folder and I will be by to pick them up either at the end of advisory or at the beginning of 7th period. Day Two (April 9, 2009):
• Pass out the Assent and Consent Forms before doing anything. Instruct the students to read the Assent Form and allow time for them to do so. Also, tell them to take the Consent Form home to their parents/guardians.
On the second day, pass the SOLAT forms out to the students one-by-one
according to the numbers on the ROLL SHEET. Read the instructions and power point to the students and make sure that they have a good understanding of how to respond on the form. Make sure the students complete the questionnaire before they turn it in. It is okay if some are left blank, but most should be answered. Once all surveys have been returned please destroy the roll sheet by shredding it completely. I cannot see the names of the students accompanied with the ID Numbers. This would break the anonymity of the study. Place all finished questionnaires in the folder and I will be by to pick them up either at the end of advisory or at the beginning of 7th period.
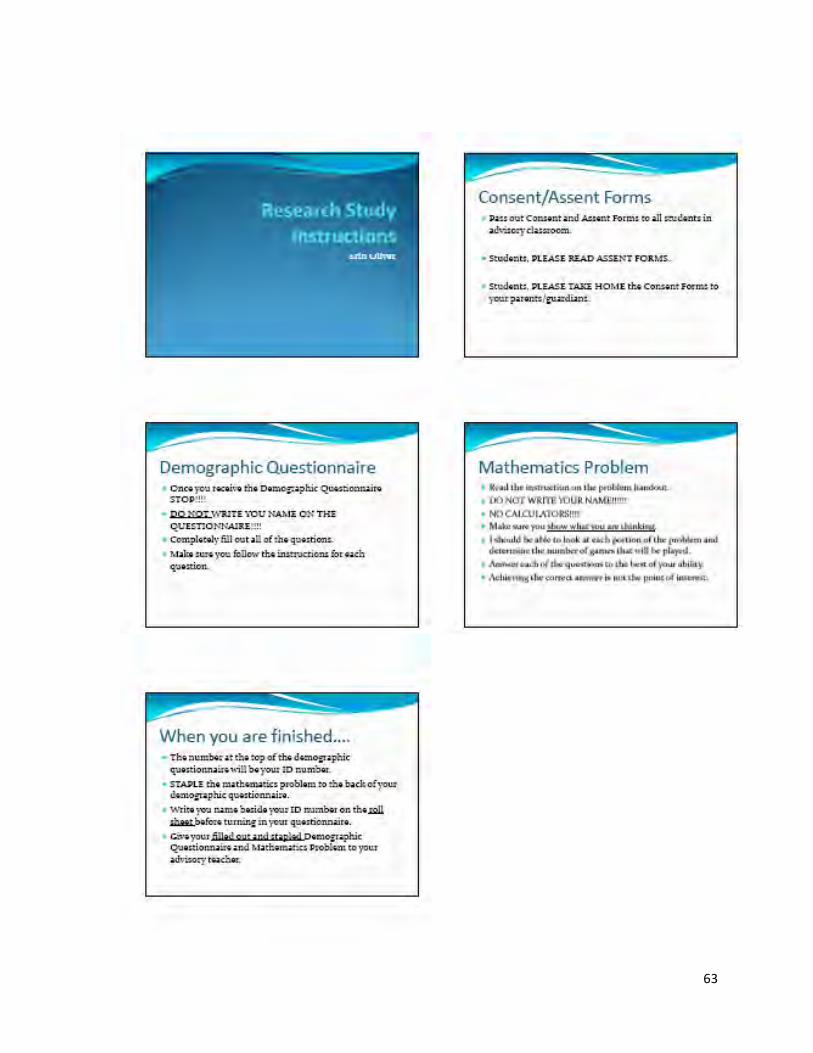
63

64

65
Appendix E
Raw Data

66

67
StudentIDNumber Age Gender Ethnicity
MathClass ELL GT
ParentEDU
CalcExp
RateMath
ExtraMath
FavSub
1 15 1 2 3 1 0 6 1 3 0 1
2 16 1 4 3 1 0 1 1 1 0 2
3 14 2 1 4 0 1 2 2 4 0 1
4 15 2 1 3 0 0 2 1 3 0 3
5 14 1 1 4 0 1 1 1 1 0 4
6 15 1 2 3 0 1 2 2 4 1 1
7 14 2 1 3 0 0 4 1 1 0 5
8 15 1 3 3 1 0 1 1 3 0 6
9 14 1 1 3 0 0 2 1 4 0 1
10 15 2 1 3 0 1 3 2 2 0 3
11 15 1 1 3 0 0 4 2 3 0 4
12 15 1 1 3 0 0 1 2 4 0 7
13 14 1 2 3 0 0 4 1 3 0 0
14 14 1 5 3 0 1 2 2 1 0 8
16 14 2 2 3 0 0 5 1 1 0 4
17 15 2 3 3 1 1 3 1 1 0 6
18 15 1 1 3 0 0 1 1 3 0 5
19 14 2 1 3 0 0 1 1 3 0 3
20 16 1 5 3 0 0 4 1 2 0 9
21 14 1 1 3 0 1 6 1 1 0 15
22 15 1 1 3 0 0 4 1 3 0 15
23 14 1 2 3 1 0 6 1 1 2 4
26 15 1 2 6 0 0 1 2 1 0 4
27 15 2 4 4 1 0 1 4 4 0 8
29 15 1 1 4 0 0 1 2 3 0 9
30 16 1 3 3 0 0 2 4 5 0 1
31 15 1 1 3 0 0 4 1 5 0 1
32 14 2 1 10 0 1 1 3 3 0 8
33 15 2 1 6 0 0 1 2 4 0 3
34 15 2 1 4 0 0 1 1 3 0 8
37 15 1 2 3 0 0 3 1 4 0 1
38 15 2 1 4 0 0 1 2 4 0 1
41 14 2 5 5 0 1 2 2 4 0 1
42 15 1 3 3 0 0 4 2 3 0 6
43 15 2 2 3 0 0 1 1 3 0 11
44 15 1 1 4 0 0 1 1 3 0 6
46 15 1 1 10 0 1 1 2 5 3 1
47 15 2 3 3 0 1 2 1 4 0 12
Tables Represent Demographic Data, Mathematical Problem Responses and SOLAT Scores:
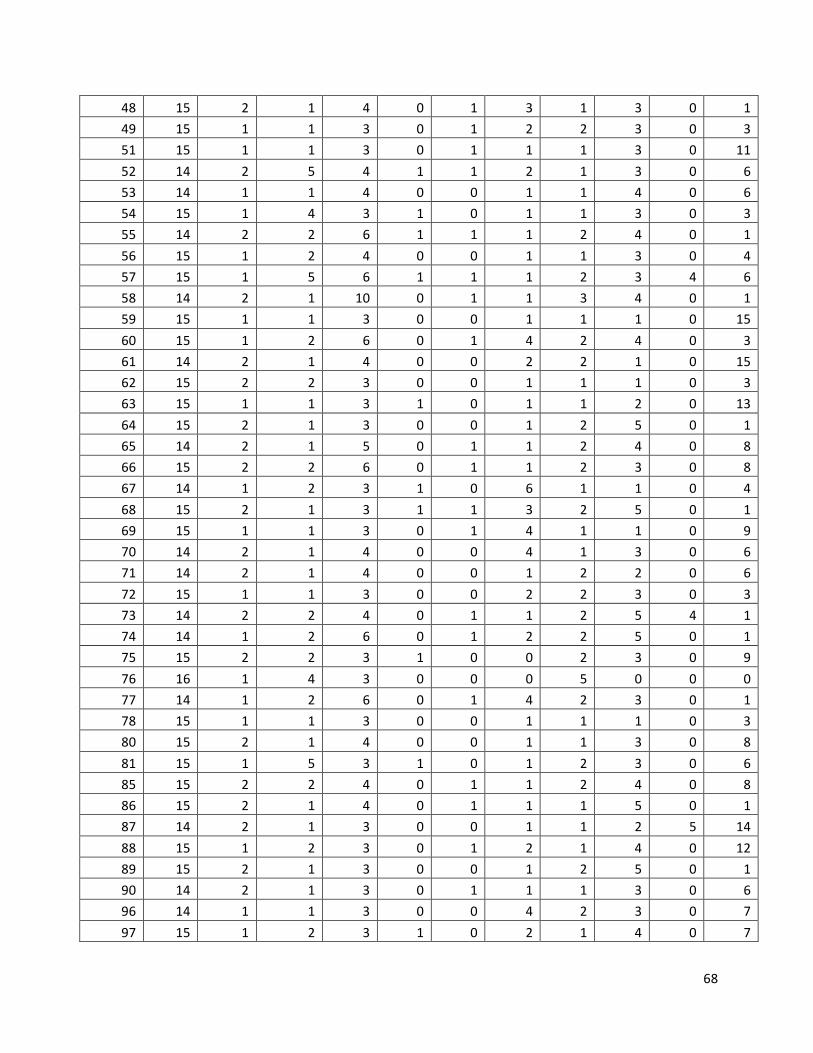
68
48 15 2 1 4 0 1 3 1 3 0 1
49 15 1 1 3 0 1 2 2 3 0 3
51 15 1 1 3 0 1 1 1 3 0 11
52 14 2 5 4 1 1 2 1 3 0 6
53 14 1 1 4 0 0 1 1 4 0 6
54 15 1 4 3 1 0 1 1 3 0 3
55 14 2 2 6 1 1 1 2 4 0 1
56 15 1 2 4 0 0 1 1 3 0 4
57 15 1 5 6 1 1 1 2 3 4 6
58 14 2 1 10 0 1 1 3 4 0 1
59 15 1 1 3 0 0 1 1 1 0 15
60 15 1 2 6 0 1 4 2 4 0 3
61 14 2 1 4 0 0 2 2 1 0 15
62 15 2 2 3 0 0 1 1 1 0 3
63 15 1 1 3 1 0 1 1 2 0 13
64 15 2 1 3 0 0 1 2 5 0 1
65 14 2 1 5 0 1 1 2 4 0 8
66 15 2 2 6 0 1 1 2 3 0 8
67 14 1 2 3 1 0 6 1 1 0 4
68 15 2 1 3 1 1 3 2 5 0 1
69 15 1 1 3 0 1 4 1 1 0 9
70 14 2 1 4 0 0 4 1 3 0 6
71 14 2 1 4 0 0 1 2 2 0 6
72 15 1 1 3 0 0 2 2 3 0 3
73 14 2 2 4 0 1 1 2 5 4 1
74 14 1 2 6 0 1 2 2 5 0 1
75 15 2 2 3 1 0 0 2 3 0 9
76 16 1 4 3 0 0 0 5 0 0 0
77 14 1 2 6 0 1 4 2 3 0 1
78 15 1 1 3 0 0 1 1 1 0 3
80 15 2 1 4 0 0 1 1 3 0 8
81 15 1 5 3 1 0 1 2 3 0 6
85 15 2 2 4 0 1 1 2 4 0 8
86 15 2 1 4 0 1 1 1 5 0 1
87 14 2 1 3 0 0 1 1 2 5 14
88 15 1 2 3 0 1 2 1 4 0 12
89 15 2 1 3 0 0 1 2 5 0 1
90 14 2 1 3 0 1 1 1 3 0 6
96 14 1 1 3 0 0 4 2 3 0 7
97 15 1 2 3 1 0 2 1 4 0 7

69
98 15 2 1 3 0 1 1 0 3 0 11
99 14 2 1 4 0 0 2 1 2 0 12
100 15 2 3 3 0 0 2 4 2 0 9
101 15 2 1 3 0 0 3 1 3 0 6
102 15 2 1 3 0 0 5 1 3 0 6
103 14 2 1 3 0 0 2 1 2 0 0
104 15 2 2 3 1 0 5 1 1 0 14
105 15 2 2 3 1 0 3 1 3 0 6
106 14 2 2 3 1 0 1 1 3 0 3
107 15 2 5 6 0 1 1 2 3 0 3
108 15 1 1 3 0 0 1 2 1 0 3
110 14 1 1 3 0 1 2 0 3 0 11
111 15 2 1 3 0 0 4 1 4 0 1
112 15 1 2 4 1 0 2 1 3 0 9
113 15 2 1 3 0 0 5 1 1 0 14
114 16 2 5 3 1 1 4 1 1 0 3
115 15 2 3 3 1 1 2 1 1 0 14
116 14 1 3 3 1 0 1 1 1 0 14
117 15 2 2 3 0 0 5 0 1 0 6
118 16 1 1 3 0 0 4 1 4 0 1
StudentIDNumber
PAPMath8 ALG1
PAPALG1 Geom
PAPGeom Mmod ALG2
ENALG2
PAPALG2 PreCal
PAPPreCal
1 0 0 0 0 0 0 0 0 0 0 02 1 0 0 0 0 0 0 0 0 0 03 0 0 0 0 0 0 0 0 0 0 04 0 0 0 0 0 0 0 0 0 0 05 1 0 0 0 0 0 0 0 0 0 06 0 0 0 0 0 0 0 0 0 0 07 1 0 0 0 0 0 0 0 0 0 08 0 0 0 0 0 0 0 0 0 0 09 0 0 0 0 0 0 0 0 0 0 0
10 1 0 0 0 0 0 0 0 0 0 011 1 0 0 0 0 0 0 0 0 0 012 0 0 0 0 0 0 0 0 0 0 013 0 0 0 0 0 0 0 0 0 0 014 1 0 0 0 0 0 0 0 0 0 016 0 0 0 0 0 0 0 0 0 0 017 0 0 0 0 0 0 0 0 0 0 018 0 0 0 0 0 0 0 0 0 0 019 0 0 0 0 0 0 0 0 0 0 020 0 0 0 0 0 0 0 0 0 0 021 0 0 0 0 0 0 0 0 0 0 0

70
22 0 0 0 0 0 0 0 0 0 0 023 0 0 0 0 0 0 0 0 0 0 026 1 0 1 0 0 0 0 0 0 0 027 1 0 0 0 0 0 0 0 0 0 029 1 0 0 0 0 0 0 0 0 0 030 0 0 0 0 0 0 0 0 0 0 031 0 0 0 0 0 0 0 0 0 0 032 1 0 1 0 1 0 0 0 0 0 033 1 0 1 0 0 0 0 0 0 0 034 1 0 0 0 0 0 0 0 0 0 037 0 0 0 0 0 0 0 0 0 0 038 1 0 0 0 0 0 0 0 0 0 041 1 0 1 0 0 0 0 0 0 0 042 0 0 0 0 0 0 0 0 0 0 043 0 0 0 0 0 0 0 0 0 0 044 1 0 0 0 0 0 0 0 0 0 046 1 0 1 0 1 0 0 0 0 0 047 0 0 0 0 0 0 0 0 0 0 048 1 0 0 0 0 0 0 0 0 0 049 0 0 0 0 0 0 0 0 0 0 051 0 0 0 0 0 0 0 0 0 0 052 1 0 0 0 0 0 0 0 0 0 053 1 0 0 0 0 0 0 0 0 0 054 0 0 0 0 0 0 0 0 0 0 055 1 0 1 0 0 0 0 0 0 0 056 1 0 0 0 0 0 0 0 0 0 057 1 0 1 0 0 0 0 0 0 0 058 1 0 1 0 1 0 0 0 0 0 059 0 0 0 0 0 0 0 0 0 0 060 1 0 1 0 0 0 0 0 0 0 061 1 0 0 0 0 0 0 0 0 0 062 0 0 0 0 0 0 0 0 0 0 063 0 0 0 0 0 0 0 0 0 0 064 0 0 0 0 0 0 0 0 0 0 065 0 1 0 0 0 0 0 0 0 0 066 1 0 1 0 0 0 0 0 0 0 067 0 0 0 0 0 0 0 0 0 0 068 1 0 0 0 0 0 0 0 0 0 069 0 0 0 0 0 0 0 0 0 0 070 1 0 0 0 0 0 0 0 0 0 071 1 0 0 0 0 0 0 0 0 0 072 1 0 0 0 0 0 0 0 0 0 073 0 0 0 0 0 0 0 0 0 0 074 1 0 1 0 0 0 0 0 0 0 075 0 0 0 0 0 0 0 0 0 0 076 0 0 0 0 0 0 0 0 0 0 0

71
77 1 0 1 0 0 0 0 0 0 0 078 0 0 0 0 0 0 0 0 0 0 080 1 0 0 0 0 0 0 0 0 0 081 0 0 0 0 0 0 0 0 0 0 085 1 0 0 0 0 0 0 0 0 0 086 1 0 0 0 0 0 0 0 0 0 087 0 0 0 0 0 0 0 0 0 0 088 0 0 0 0 0 0 0 0 0 0 089 0 0 0 0 0 0 0 0 0 0 090 1 0 0 0 0 0 0 0 0 0 096 0 0 0 0 0 0 0 0 0 0 097 0 0 0 0 0 0 0 0 0 0 098 1 0 0 0 0 0 0 0 0 0 099 1 0 0 0 0 0 0 0 0 0 0
100 0 0 0 0 0 0 0 0 0 0 0101 1 0 0 0 0 0 0 0 0 0 0102 0 0 0 0 0 0 0 0 0 0 0103 0 0 0 0 0 0 0 0 0 0 0104 0 0 0 0 0 0 0 0 0 0 0105 0 0 0 0 0 0 0 0 0 0 0106 0 0 0 0 0 0 0 0 0 0 0107 1 0 1 0 0 0 0 0 0 0 0108 0 0 0 0 0 0 0 0 0 0 0110 0 0 0 0 0 0 0 0 0 0 0111 0 0 0 0 0 0 0 0 0 0 0112 1 0 0 0 0 0 0 0 0 0 0113 0 0 0 0 0 0 0 0 0 0 0114 0 0 0 0 0 0 0 0 0 0 0115 0 0 0 0 0 0 0 0 0 0 0116 0 0 0 0 0 0 0 0 0 0 0117 0 0 0 0 0 0 0 0 0 0 0118 0 0 0 0 0 0 0 0 0 0 0

72
StudentIDNumber 2‐teams 3‐teams 4‐teams 5‐teams 6‐teams Experience
1 6 6 8 6 8 2
2 2 2 2 2 8 0
3 1 1 1 3 3 14 4 7 7 2 2 1
5 6 6 4 4 6 06 1 3 9 9 9 1
7 3 2 2 2 2 1
8 2 2 6 2 6 09 6 5 5 5 5 0
10 4 4 4 4 4 111 1 1 1 1 1 0
12 4 4 4 4 4 113 4 4 6 6 6 1
14 1 1 1 1 1 2
16 5 9 8 8 8 017 9 8 8 8 8 2
18 3 3 3 3 3 019 5 8 8 8 8 1
20 6 9 9 8 8 0
21 6 1 1 1 1 122 8 8 8 8 8 0
23 6 2 2 2 6 126 6 6 5 6 6 1
27 6 1 1 1 1 129 6 7 7 7 7 1
30 8 8 8 8 8 0
31 2 2 2 2 6 032 3 3 2 2 2 1
33 3 1 1 1 1 134 1 1 1 1 1 1
37 1 1 1 1 1 0
38 6 2 2 2 2 141 6 1 1 1 1 0
42 6 6 8 8 8 043 7 3 3 3 3 1
44 6 1 1 1 1 046 2 2 2 2 2 1
47 6 3 3 3 3 1
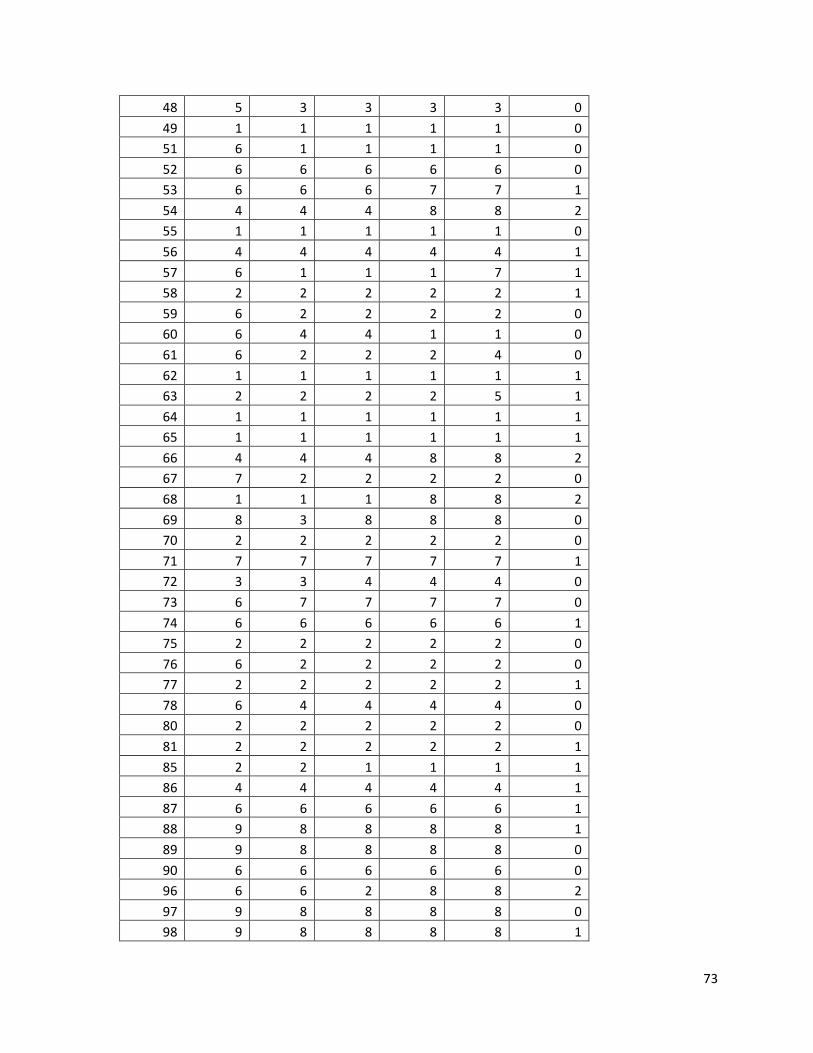
73
48 5 3 3 3 3 0
49 1 1 1 1 1 051 6 1 1 1 1 0
52 6 6 6 6 6 053 6 6 6 7 7 1
54 4 4 4 8 8 255 1 1 1 1 1 0
56 4 4 4 4 4 1
57 6 1 1 1 7 158 2 2 2 2 2 1
59 6 2 2 2 2 060 6 4 4 1 1 0
61 6 2 2 2 4 0
62 1 1 1 1 1 163 2 2 2 2 5 1
64 1 1 1 1 1 165 1 1 1 1 1 1
66 4 4 4 8 8 267 7 2 2 2 2 0
68 1 1 1 8 8 2
69 8 3 8 8 8 070 2 2 2 2 2 0
71 7 7 7 7 7 172 3 3 4 4 4 0
73 6 7 7 7 7 0
74 6 6 6 6 6 175 2 2 2 2 2 0
76 6 2 2 2 2 077 2 2 2 2 2 1
78 6 4 4 4 4 080 2 2 2 2 2 0
81 2 2 2 2 2 1
85 2 2 1 1 1 186 4 4 4 4 4 1
87 6 6 6 6 6 188 9 8 8 8 8 1
89 9 8 8 8 8 0
90 6 6 6 6 6 096 6 6 2 8 8 2
97 9 8 8 8 8 098 9 8 8 8 8 1

74
99 9 8 8 8 8 0
100 1 1 6 8 8 2101 4 4 4 4 4 0
102 2 2 2 2 2 1103 9 8 8 8 8 1
104 6 6 6 8 8 2105 2 2 2 2 4 1
106 3 1 1 1 1 0
107 2 2 2 8 8 2108 2 2 2 2 2 1
110 7 2 2 7 7 1111 7 7 7 7 7 0
112 7 7 7 7 7 1
113 2 2 2 8 8 2114 8 8 8 8 8 2
115 8 8 8 8 8 2116 6 2 2 2 2 0
117 9 8 8 8 8 2118 2 9 8 8 8 2

75
StudentIDNumber
LeftRaw
LeftStandard
LeftPercentile
RightRaw
RightStandard
RightPercentile
WholeRaw
WholeStandard
WholePercentile Blank
1 11 112 78 9 96 47 8 105 67 0
2 9 103 62 15 118 84 0 73 7 4
3 4 82 21 15 118 84 9 109 72 0
4 15 129 95 6 84 30 4 89 38 3
5 5 86 28 12 107 65 11 116 78 0
6 7 95 49 21 143 99 0 73 7 0
7 1 70 7 20 142 99 6 97 53 1
8 8 99 54 9 96 47 8 105 67 3
9 4 82 21 7 88 37 0 73 7 17
10 5 86 28 17 126 95 6 97 53 0
11 9 103 62 17 126 95 2 81 24 0
12 8 99 54 15 118 84 5 93 47 0
13 6 91 34 16 122 90 6 97 53 0
14 3 78 18 6 84 30 19 148 99 0
16 1 70 7 8 92 42 2 81 24 17
17 13 120 88 15 118 84 0 73 7 0
18 7 95 49 6 84 30 8 105 67 7
19 5 86 28 5 80 20 17 144 99 1
20 2 74 15 26 148 99 0 73 7 0

76
21 4 82 21 24 146 99 0 73 7 0
22 5 86 28 23 145 99 0 73 7 0
23 13 120 88 10 99 53 0 73 7 5
26 20 151 99 5 80 20 3 85 28 0
27 4 82 21 8 92 42 16 140 97 0
29 7 95 49 15 118 84 6 97 53 0
30 18 149 99 10 99 53 0 73 7 0
31 12 116 82 16 122 90 0 73 7 0
32 4 82 21 14 115 79 10 113 75 0
33 17 141 97 11 103 57 0 73 7 0
34 13 120 88 10 99 53 4 89 38 1
37 6 91 34 14 115 79 5 93 47 3
38 12 116 82 4 76 15 8 105 67 4
41 10 107 68 12 107 65 6 97 53 0
42 8 99 54 2 69 7 4 89 38 14
43 3 78 18 14 115 79 11 116 78 0
44 5 86 28 10 99 53 10 113 75 3
46 1 70 7 3 72 9 24 158 99 0
47 8 99 54 9 96 47 10 113 75 1
48 4 82 21 12 107 65 11 116 78 1
49 3 78 18 8 92 42 16 140 97 1

77
51 4 82 21 8 92 42 12 120 83 4
52 8 99 54 20 142 99 0 73 7 0
53 11 112 78 9 96 47 4 89 38 4
54 12 116 82 16 122 90 0 73 7 0
55 8 99 54 15 118 84 0 73 7 5
56 7 95 49 13 111 70 7 101 62 1
57 11 112 78 12 107 65 3 85 28 2
58 6 91 34 19 141 99 0 73 7 3
59 15 129 95 11 103 57 0 73 7 2
60 6 91 34 9 96 47 13 124 90 0
61 14 124 92 13 111 70 1 77 20 0
62 4 82 21 24 146 99 0 73 7 0
63 2 74 15 14 115 79 10 113 75 2
64 9 103 62 16 122 90 3 85 28 0
65 3 78 18 14 115 79 11 116 78 0
66 1 70 7 19 141 99 8 105 67 0
67 6 91 34 14 115 79 1 77 20 7
68 14 124 92 10 99 53 3 85 28 1
69 6 91 34 20 142 99 2 81 24 0
70 12 116 82 16 122 90 0 73 7 0
71 7 95 49 21 143 99 0 73 7 0

78
72 16 137 96 8 92 42 3 85 28 1
73 20 151 99 7 88 37 0 73 7 1
74 12 116 82 10 99 53 6 97 53 0
75 8 99 54 10 99 53 3 85 28 7
76 10 107 68 15 118 84 2 81 24 1
77 6 91 34 12 107 65 10 113 75 0
78 3 78 18 19 141 99 2 81 24 4
80 7 95 49 17 126 95 3 85 28 1
81 8 99 54 19 141 99 0 73 7 1
85 0 65 5 21 143 99 7 101 62 0
86 4 82 21 24 146 99 0 73 7 0
87 16 137 96 11 103 57 1 77 20 0
88 6 91 34 9 96 47 13 124 90 0
89 11 112 78 4 76 15 13 124 90 0
90 10 107 68 18 138 96 0 73 7 0
96 13 120 88 14 115 79 1 77 20 0
97 11 112 78 7 88 37 10 113 75 0
98 5 86 28 21 143 99 2 81 24 0
99 4 82 21 24 146 99 0 73 7 0
100 8 99 54 19 141 99 0 73 7 1
101 0 65 5 19 141 99 8 105 67 1

79
102 10 107 68 18 138 96 0 73 7 0
103 8 99 54 17 126 95 3 85 28 0
104 8 99 54 19 141 99 1 77 20 0
105 5 86 28 7 88 37 16 140 97 0
106 7 95 49 15 118 84 6 97 53 0
107 2 74 15 22 144 99 3 85 28 1
108 12 116 82 4 76 15 11 116 78 1
110 5 86 28 6 84 30 17 144 99 0
111 13 120 88 11 103 57 4 89 38 0
112 4 82 21 19 141 99 5 93 47 0
113 7 95 49 13 111 70 3 85 28 5
114 11 112 78 17 126 95 0 73 7 0
115 8 99 54 18 138 96 0 73 7 2
116 15 129 95 9 96 47 4 89 38 0
117 9 103 62 16 122 90 3 85 28 0
118 7 95 49 5 80 20 8 105 67 8