relationships between ozone exposure and yield loss in european wheat and potato—a comparison of...
TRANSCRIPT

Atmospheric Environment 38 (2004) 2259–2269
ARTICLE IN PRESS
*Correspond
E-mail addr
1352-2310/$ - se
doi:10.1016/j.at
Relationships between ozone exposure and yield loss inEuropean wheat and potato—a comparison ofconcentration- and flux-based exposure indices
H. Pleijela,*, H. Danielssona,b, K. Ojanper.ac, L. De Temmermand,P. H .ogye, M. Badianif, P.E. Karlssonb
aDepartment of Applied Environmental Science, G .oteborg University, P.O. Box 464, G .oteborg SE-405 30, SwedenbSwedish Environmental Research Institute, P.O. Box 47086, G .oteborg SE-402 58, SwedencMTT Agrifood Research Finland, Environmental Research, Jokioinen FI-31600, Finland
dVAR, Leuvensesteenweg 17, Tervuren BE-3080, Belgiume Institute for Landscape and Plant Ecology (3 2 0), University of Hohenheim, Schloss Mittelbau (West), Stuttgart D-70599, GermanyfDipartemento di Biotecnologie per il Monitoraggio ed AgroAlimentare ed Ambientale, Universit !a Mediterranea di Reggio Calabria,
Facolt !a di Agraria—Loc. Feo di Vito 89124 Regio Calabria, Italy
Received 9 July 2003; received in revised form 9 September 2003; accepted 15 September 2003
Abstract
Data from open-top chamber experiments with field grown crops, performed in Sweden, Finland, Belgium, Italy and
Germany, were combined to derive relationships between yield and ozone exposure for wheat (Triticum aestivum L.) and
potato (Solanum tuberosum L.). Three different exposure indices were compared: AOT40 (accumulated exposure over a
threshold ozone concentration of 40nmolmol�1), CUOt (cumulative stomatal uptake of ozone, using a constant ozone
uptake rate threshold of t nmolm�2 s�1) and mAOTc0 (conductance modified AOT using a threshold concentration for
ozone of c0 nmol mol�1). The latter is essentially a combination of AOT and CUO. Ozone uptake was estimated using a
Jarvis-type multiplicative model for stomatal conductance. In terms of correlation between relative yield (RY) and ozone
exposure, CUO5, the CUO index with an ozone uptake rate threshold of 5nmolm�2 s�1, performed best for both wheat
and potato, resulting in r2 values of 0.77 and 0.64, respectively. CUO5 performed considerably better in terms of the
correlation between RY and ozone exposure, than AOT40 for wheat, while mAOT10, the best performing mAOT index
in this case, was intermediate in performance for this crop. For potato, the differences between the different ozone
exposure indices AOT40, CUO5 and mAOT20 (the mAOT index performing best for potato) in the correlation between
RY and ozone exposure were relatively small. To test the assumption that the non-stomatal deposition of ozone was
negligible for the uppermost, sunlit leaves, measurements of ozone uptake in relation to leaf conductance for water vapor
of wheat leaves in a cuvette system were used. The non-stomatal deposition of ozone to the leaves turned out to be
comparatively small. Based on the non-stomatal conductance (gns ¼ 15mmolm�2 s�1) estimated for the wheat leaves in
the cuvette system, it was concluded that the consequence of omitting the non-stomatal conductance is small. In
conclusion the study indicated that the ozone uptake based approach showed a high degree of fitting along a north-south
European transect of pedoclimatic conditions, and represents a better and more relevant approach to the quantification of
ozone effects on crops growth than the use of ozone exposure indices purely based on ozone concentrations.
r 2004 Elsevier Ltd. All rights reserved.
Keywords: Dose-response; Non-stomatal deposition; Ozone; Solanum; Stomatal conductance; Triticum
ing author. Tel.: +46-31-773-2532; fax: +46-31-773-2984.
ess: [email protected] (H. Pleijel).
e front matter r 2004 Elsevier Ltd. All rights reserved.
mosenv.2003.09.076

ARTICLE IN PRESSH. Pleijel et al. / Atmospheric Environment 38 (2004) 2259–22692260
1. Introduction
During the last decades, the effects of ground-level
ozone on plants have been among the environmental
impacts considered by the European co-operation on air
pollution emissions control (Borrell et al., 1997). This
has lead to a request from policymakers to scientists for
methods to quantify these effects, which has stimulated
an intensive work aiming at the development of
quantitative methods for this purpose.
For ozone effects on vegetation, it is possible to
discern three generations of exposure index concepts,
which have been used in the Convention on Long-Range
Transboundary Air Pollution (CLRTAP) under the
United Nations Economic Commission for Europe
(UNECE). The initial step was taken in 1988, when
the first generation of critical levels for gaseous
pollutants was agreed upon (UNECE, 1988). A second
step was taken in 1992–1993 when the exposure index
AOT40, i.e. the accumulated exposure over a threshold
concentration for ozone of 40 nmolmol�1, was intro-
duced to define critical levels for ozone. It was shown
that this index provided relatively strong correlation
with observed effects (Ashmore and Wilson, 1994;
Fuhrer and Achermann, 1994). The AOT40 index
mainly reflects the ozone concentrations in the air
nearby the plants, the only aspect of ozone uptake
considered being that ozone exposure is only accumu-
lated for daylight hours. There was, however, an
awareness within the scientific community that the
effects of ozone are likely to be related to the ozone
uptake of the plants, which lead to suggestions to
move towards an ozone uptake concept to express ozone
exposure (Gr .unhage and J.ager, 1994).
Based on the consideration that the leaf uptake
of phytotoxic ozone, deposition to exterior surfaces
probably not being very harmful, is strongly controlled
by stomatal conductance (Kerstiens and Lendzian,
1989), a developmental work was initiated. This resulted
in attempts to use stomatal conductance modelling
(Gr .uters et al., 1995; Emberson et al., 1998; Emberson
et al., 2000a), mainly based on the multiplicative
principles put forward by Jarvis (1976), in order to
estimate the stomatal response to different environmen-
tal variables and, in the end, ozone uptake. This was
the birth of the third generation of ozone exposure
indices.
The ozone absorption that takes place upon the leaf
exterior surfaces is not without importance (Fowler
et al., 2001; Gerosa et al., 2003). Although not directly
harmful, non-stomatal deposition complicates the cal-
culation of stomatal ozone uptake when applying a
resistance analogue model, without including a resis-
tance for the ozone uptake by the leaf outer surface
(Gr .unhage et al., 2000). If the non-stomatal deposition
is substantial compared to the stomatal, neglecting the
non-stomatal component potentially leads to significant
errors in the estimation of the stomatal flux.
Nevertheless, based on the stomatal conductance
modelling, further stages were taken to test if improve-
ments in dose–response relationships could be obtained
compared to the AOT40 models. By testing a series of
open-top chamber (OTC) experiments with wheat
(Triticum aestivum L.), representing rather strong year-
to-year variation in weather conditions, it turned out to
be the case that a substantial reduction in the inter-
experimental variation in response to ozone was
obtained by using estimated ozone uptake instead of
AOT40 (Pleijel et al., 2000).
More recently, Pleijel et al. (2002) and Danielsson
et al. (2003) used observed stomatal conductance to
calibrate the multiplicative Jarvis-type conductance
model for potato (Solanum tuberosum L.) and wheat,
respectively, and to combine these models with yield
response data from OTC experiments with field grown
crops. In addition, in these two studies the uncertainty in
the parameter estimations were discussed, and the
influence of the choice of ozone uptake rate thresholds
on the performance of the dose–response functions was
evaluated, since there is evidence that apoplastic
antioxidants can efficiently scavenge toxic ozone by-
products until a certain threshold is reached (Polle and
Rennenberg, 1993; Turcs!anyi et al., 2000).
The suggested change from AOT40 to an uptake-
based concept has not been uncontroversial. For the
communication of the results to policymakers and other
stakeholders, as well as the implementation via inte-
grated assessment modelling in air pollution abatement
strategies, a certain degree of continuity in terms of
concepts used is desirable. Thus, there have been
suggestions to develop a version of the AOT exposure
index, which is sensitive to one or several stomatal
conductance modifying factors, in order to build on the
preceding models, and to make possible the use of only a
limited number of ozone uptake modifying factors for
the case that certain model-driving variables are not
available. Gr .unhage et al. (1999) suggested one concept
for a modified AOT approach.
It should be noted that in North America a
developmental work has been initiated to identify flux
based concepts, considering also the detoxification
capacity of the plant, to evaluate ozone metric and
potential ambient air quality standards (Musselman and
Massman, 1999; Massman et al., 2000; Panek et al.,
2002), which are conceptually related to the work
presented in this paper.
The aim of the present study was to present relation-
ships between relative yield and ozone exposure in terms
of AOT40, CUOt (cumulative uptake of ozone based on
conductance modelling, using different ozone uptake
rate thresholds t), and a conductance modified AOT
(mAOT) using a related but slightly different concept

ARTICLE IN PRESSH. Pleijel et al. / Atmospheric Environment 38 (2004) 2259–2269 2261
from that of Gr .unhage et al. (1999), for wheat and
potato. The study was based on the empirical data
included in Danielsson et al. (2003) and Pleijel et al.
(2002) and seven additional data sets concerning wheat
from OTC experiments performed in Belgium, Italy and
Finland. A further aim was to test the importance of the
non-stomatal deposition of ozone to wheat leaves, based
on a series of cuvette measurements, in which the fluxes
of water vapor and ozone of wheat leaves were measured
in parallel.
2. Materials and methods
2.1. Experiments included
Basic information concerning the OTC experiments
included in the present study, all with field-grown crops,
are summarised in Table 1. Twelve different experiments
with wheat from four different countries and seven
different experiments with potato, representing four
countries, were included. The wheat part of the study
made use of data from four cultivars of T. aestivum and
one cultivar of durum wheat, Triticum turgidum ssp.
durum, while for potato all data were from a single
source (in The Netherlands) of the cultivar Bintje. Basics
of the studies have been published in the scientific
Table 1
Basic information concerning the experiments included in the study
Country, year Cultivar Treatments
Wheat
Belgium 1994 Minaret CF, NF
Belgium 1995 Minaret CF, NF
Belgium 1996 Minaret CF, NF
Finland 1991 Satu CF, NF
Finland 1992 Satu NF, NF+
Finland 1993 Satu CF, NF, NF+
Sweden 1987 Drabant CF, NF, NF+
Sweden 1988 Drabant CF, NF, NF+, NF++
Sweden 1994 Dragon NF, NF+, NF++, NF+++
Sweden 1995 Dragon NF, NF+
Sweden 1997 Dragon CF, NF, NF+, NF++
Italy 1996 Duilio CF, CF+, CF++
Potato
Belgium 1998 Bintje CF, NF, NF+
Belgium 1999 Bintje CF, NF, NF+
Finland 1998 Bintje NF, NF+, NF++
Germany 1998 Bintje NF, NF+
Germany 1999 Bintje NF, NF+
Sweden 1998 Bintje NF, NF+
Sweden 1999 Bintje CF, NF, NF+
CF charcoal filtered air; CF+ charcoal filtered air with additional ozo
air with additional ozone; n number of OTC replicates. All wheat culti
L. The Italian cultivar was a durum wheat, Triticum turgidum ssp. du
literature and relevant references are given in Table 1.
One data point (a non-filtered air treatment of the
Swedish data set from 1999) was removed as an outlier
from the potato data set based on statistical considera-
tions. The durum wheat data set consisted of a CF
treatment and a series of OTCs with ozone added to
charcoal-filtered air, all having different ozone levels.
The chambers were grouped into treatments based on
whether the ozone concentration distributions differed
significantly or not between the different chambers. One
treatment in the data set from Sweden 1997 and one
treatment in the data set from Italy 1995 were removed
because ozone concentrations frequently exceeded
130 nmolmol�1 ozone.
2.2. Calculation of exposure indices
2.2.1. Accumulated exposure over threshold (AOT)
AOT40 has been the exposure index used for critical
levels for ozone in Europe (Fuhrer et al., 1997). In the
present study it was calculated for the same period as the
CUO index and conductance modified AOT. For wheat,
the integration period started at anthesis and continued
until 700�C days (base temperature 0�C) after anthesis
(Danielsson et al., 2003). Consequently, the AOT40
values used here are not directly comparable with those
used by Fuhrer and Achermann (1994). These were
n Reference
3 Bender et al. (1999)
3 Bender et al. (1999)
3 Bender et al. (1999)
5 Ojanper.a et al. (1994) and Pleijel et al. (1997)
5 Ojanper.a et al. (1994) and Pleijel et al. (1997)
5 Ojanper.a et al. (1994) and Pleijel et al. (1997)
7 Pleijel et al. (1991)
5 Pleijel et al. (1991)
3 Pleijel et al. (1999)
5 Pleijel et al. (1998)
5 Gelang et al. (2000)
1–3 Badiani et al. (1996)
3 Pleijel et al. (2002) and De Temmerman et al. (2002)
3 Pleijel et al. (2002) and De Temmerman et al. (2002)
4 Pleijel et al. (2002) and De Temmerman et al. (2002)
3 Pleijel et al. (2002) and De Temmerman et al. (2002)
5 Pleijel et al. (2002) and De Temmerman et al. (2002)
6 Pleijel et al. (2002) and De Temmerman et al. (2002)
4 Pleijel et al. (2002) and De Temmerman et al. (2002)
ne; NF non-filtered air; NF+, NF++, NF+++ non-filtered
vars except the Italian belonged to the species Triticum aestivum
rum Desf.

ARTICLE IN PRESSH. Pleijel et al. / Atmospheric Environment 38 (2004) 2259–22692262
based on longer time periods, which included pre-
anthesis exposure and post-end of grain filling exposure.
These two periods were considered redundant in the
present study, based on the observation that post-
anthesis ozone exposure seems to dominate the effect on
grain yield (Pleijel et al., 1998), and that ozone exposure
cannot influence grain yield after the end of grain filling.
For potato, ozone exposure was integrated from tuber
initiation (when tubers start to form on the roots) until
haulm harvest and from emergence until haulm harvest
for comparison.
2.2.2. Cumulative uptake of ozone (CUO)
CUO is the cumulative uptake of ozone per unit leaf
area (mmolm�2) based on hourly estimates of the ozone
uptake rate U : Only the uppermost leaf level is
considered, which receives most of the light and is most
important for photosynthesis. An ozone uptake rate
threshold t (nmolm�2 s�1) can be used (CUOt), which is
similar to the cut-off concentration c0 in the AOT
concept, based on hourly averages of the ozone uptake
rate. Ozone uptake by the leaves was estimated using
multiplicative conductance models based on the princi-
ples suggested by Jarvis (1976):
gs ¼ maxfgmin; gmaxðgphengO3gVPDgT gPARgtimeÞg; ð1Þ
where gmin and gmax denote, respectively, the minimum
and maximum stomatal conductance allowed for a
certain species by the model. The factors gVPD; gT ; gPAR
and gtime represent the short-term (based on hourly
averages) effects of leaf-to-air vapor pressure difference,
leaf temperature, photosynthetically active radiation
and time of day, respectively. The influence of time-of-
day is most likely an effect of the internal water potential
of the plant (Livingston and Black, 1987). The long-term
Table 2
Functions and constants used in the multiplicative conductance m
radiation, mmolm�2 s�1
Wheat
gmaxa 414mmol H2O m�2 s�1
gmin 0:01gmax
gPAR y¼ ð1� e�0:012PARÞgVPD y¼ ð1þ ðVPD=2:7Þ8Þ�1
gT If Tp27�C then y ¼ ðð1þ ðT=17Þ�10Þ�1Þ � 1:01If T > 27�C then y ¼ ð1þ ðT=35Þ25Þ�1
gtime y¼ ð1þ ðtime=0:72Þ15Þ�1
gphen If DDAp0 then y ¼ 1
If DDA>0 then y¼ ð1þ ðDDA=740Þ8Þ�1
gO3y¼ ð1þ ð
PCUO0=6:48Þ10Þ�1
VPD, leaf-to-air vapor pressure deficit of the air, kPa. T, leaf temper
expressed as hour/24. DDA, number of 0�C days after anthesis in whe
after emergence in potato, using a base temperature of 2�C. CUO0, e
before anthesis. AOT0, sum of all hourly ozone concentrations startiaExpressed on a total leaf area basis, recalculated for O3 when use
influences of phenology (mainly leaf aging) and ozone
are described by gphen and gO3; respectively. For both
crops gphen was expressed in terms of thermal time
accumulation, since plant development is known to be
modelled more accurately using that approach than
using time (Campbell and Norman, 1998; Pleijel et al.,
2000; Hacour et al., 2002).
In wheat, elevated ozone after anthesis has a strong
senescence-promoting effect (Ojanper.a et al., 1992). This
means that ordinary senescence under such conditions
may have little influence on stomatal conductance.
Because of that, a most limiting factor concept was
used for the two factors gphen and gO3in wheat
(Danielsson et al., 2003):
gs ¼ maxfgmin; gmaxðmin½gphengO3gVPDgT gPARgtimeÞg:
ð2Þ
The gmax values and the g functions for wheat and
potato were taken from Danielsson et al. (2003) and
Pleijel et al. (2002), respectively (Table 2).
The uptake rate U of ozone to a plant leaf is the
product of a conductance gactual and an ozone concen-
tration cactual: If the reference point is close to the leaves,
the main components of gactual are the stomatal
conductance (gs ¼ 1=rs; rs is the stomatal resistance)
and the leaf boundary layer conductance (gb ¼ 1=rb; rbis the leaf boundary layer resistance), which can be
combined using the resistance analogue:
F ¼cactual
rb þ rsð3Þ
assuming that the ozone concentration within the leaf is
close to zero (Laisk et al., 1989) and that non-stomatal
ozone deposition to the leaf exterior is negligible.
odels for wheat and potato. PAR, photosynthetically active
Potato
685mmol H2O m�2 s�1
0:001gmax
y¼ ð1� e�0.0090 PAR)
y¼ ð1þ ðVPD=3:5Þ6Þ�1
If Tp29�C then y ¼ ð1þ ðT=18Þ�10 þ 0:001Þ�1
If T > 29�C then y ¼ ð1þ ðT=37Þ20 þ 0:002Þ�1
y¼ ð1þ ðtime=0:7Þ10Þ�1
y¼ ð1þ ðDDE=1250Þ5Þ�1
y¼ ð1þ ðAOT0=40Þ5Þ�1
ature, �C. SWP, soil water potential, MPa. time, time of day is
at, using a base temperature of 0�C. DDE, number of 0�C days
stimated uptake of ozone, mmolm�2, cumulated from 14 days
ng from emergence and onwards (mmolmol�1 h).
d to calculate CUO.

ARTICLE IN PRESSH. Pleijel et al. / Atmospheric Environment 38 (2004) 2259–2269 2263
Constant values for rb were used for the calculation of
the dose–response functions. They were taken from
Pleijel et al. (2000) for wheat (gb ¼ 1138mmolm�2 s�1
O3) and from Pleijel et al. (2002) based on Unsworth
et al. (1984) for potato (gb ¼ 1073mmolm�2 s�1 O3) to
represent the air movement situation in the OTCs. The
conversion factor for molecular diffusivity from water
vapor to ozone was 0.61.
2.2.3. Conductance modified AOT
Eq. (3) can also be modified to:
U ¼ gactualcactual: ð4Þ
Here gactual represents the total conductance for ozone
uptake by a leaf from a reference point near the leaf as
above.
A theoretical modified ozone concentration cmod is
now introduced in Eq. (5). This is the ozone concentra-
tion, which results in the same uptake of ozone as in
Eq. (4), if the conductance were at its maximum:
gactualcactual ¼ gmaxcmod: ð5Þ
This can be used to modify observed or modelled ozone
concentrations if gmax is known and an accurate measure
of the actual conductance is available, such as based on
the kind of multiplicative model used in the present
study:
cmod ¼gactual
gmaxcactual: ð6Þ
cmod can be viewed as a bioavailable ozone concentra-
tion, since the ratio gactual=gmax in Eq. (6) determines the
relative bioavailability of ozone. The concentration cmod
can be converted to a corresponding conductance
modified concentration for ozone and can be used to
calculate a conductance modified mAOT c0 index, using
any cut-off concentration c0:
2.3. Estimation of the non-stomatal flux of ozone and of
its importance
If we assume the non-stomatal resistance (rns ¼ 1=gns)
to be in parallel with the stomatal resistance, and the
resulting resistance of these to act in series with the
boundary layer resistance, the stomatal ozone flux by
the leaf, according to Kirchhoff’s current laws, is
Ustomatal ¼cactual
rb þ rs þ ðrbrs=rnsÞ: ð7Þ
In order to evaluate the influence of the non-stomatal
flux of ozone, a series of cuvette measurements
performed in the laboratory, in which the ozone
flux and the water vapor flux of wheat leaves were
measured in parallel, was used. The temperature of the
cuvette was 20�C, the maximum photosynthetically
active radiation 950mmolm�2 s�1 and the relative
humidity 45–55%. The air flow rate through the system
was 0.6 lmin�1 and the air residence time in the cuvette
20 s. The air of the cuvette was continuously stirred by
the fan. This was assumed to completely remove the leaf
boundary layer resistance. The ozone concentration of
the cuvette during the measurements was kept at
65710 nmolmol�1. Measurements were made in dark-
ness, in intermediate light, in full light, and in full light
after cutting the leaf from the rest of the plant.
Measurements of the empty cuvette were also made
both in darkness and in light. The cuvette and gas
exchange system has been described in detail by Wallin
et al. (1990).
2.3.1. Yield–response regressions
The regression analysis of yield in relation to ozone
exposure was based on the principles suggested by
Fuhrer and Achermann (1994). First, regression for each
individual experiment was made. The grain yield
treatment means were then divided by the intercept for
each experiment. Thus, zero exposure was always
associated with no effect at the individual experiment
level, and relative yield (RY) from different experiments
become comparable on a common, relative scale.
For the calculations of ozone uptake by the plants in
the different experiments, leaf temperature and leaf-to-
air vapor pressure difference was replaced by air
temperature and vapor pressure deficit nearby the
canopy, respectively. For sensitivity analysis of this
simplification, see Pleijel et al. (2002) and Danielsson
et al. (2003).
3. Results
3.1. Comparison of different ozone exposure indices
For potato the strongest correlation between relative
yield and ozone exposure was obtained using CUO5
and the ozone exposure integration period from
tuber initiation until haulm harvest (r2 ¼ 0:64). There-fore, the regressions for potato shown in Figs. 1–3
were all based on that exposure period. The correspond-
ing regressions using the period from emergence until
haulm harvest were: y=0.98�0.0086�AOT40 (r2 ¼0:57), y=0.98�0.018�CUO5 (r2 ¼ 0:58), and y=
0.98�0.062�mAOT20 (r2 ¼ 0:56). In the data sets used
here, the average duration of the period from emergence
until haulm harvest was 1553�C days above 2�C (Pleijel
et al., 2002), whereas the average period between
emergence and tuber initiation was 298�C days
above 2�C.
The response functions based on AOT40 for potato
and wheat are presented in Fig. 1. The r2 values for the
two regressions were 0.57 and 0.41, respectively. The
best performing AOT indices were AOT30 for potato

ARTICLE IN PRESS
0 2 4 6 8 10
CUO5, mmol m-2
0
0.2
0.4
0.6
0.8
1.0
1.2
Rel
ativ
e yi
eld
BE
FI
GE
SE
Potato
y = 0.99 – 0.026*CUOr = 0.64p = 0.0001
y = 0.99 – 0.026*CUOr = 0.64p = 0.0001
0 0.4 0.8 1.2 1.6 2.0 2.4
CUO , mmol m
0
0.2
0.4
0.6
0.8
1.0
1.2R
elat
ive
yiel
d
BE
FI
IT
SE
Spring wheat
y = 0.99 – 0.147*CUOr = 0.77p < 0.0000
.45 -2
.40
=
(a) (b)
Fig. 2. Relationships between RY and the calculated cumulative uptake of ozone with an ozone uptake rate threshold of
5 nmolm�2 s�1, CUO5 (a) from anthesis until 700�C days after anthesis for wheat and (b) from tuber initiation until harvest for potato.
AOT40, µmol mol-1 hours
0 4 8 12 160
0.2
0.4
0.6
0.8
1.0
1.2
Rel
ativ
e yi
eld
BE
FI
GE
SE
Potato
y = 0.98 – 0.0098*AOT40r = 0.56p = 0.0006
20 24
y = 0.98 – 0.0098*AOT40r = 0.56p = 0.0006
3 6 9 12 150
AOT40, µmol mol-1 hours
0
0.2
0.4
0.6
0.8
1.0
1.2
Rel
ativ
e yi
eld
BE
FI
IT
SE
Spring wheat
y = 0.97 – 0.016*AOT40r = 0.41p < 0.0000
0
0.2
0.4
0.6
1.0
1.2
Rel
ativ
e yi
eld
= – 0r
(a) (b)
Fig. 1. Relationships between relative yield and AOT40 (a) from anthesis until 700�C days after anthesis for spring wheat and (b) from
tuber initiation until harvest for potato.
mAOT20, µmol mol-1 hours
0 10 20 30 400
0.2
0.4
0.6
0.8
1.0
1.2
Rel
ativ
e yi
eld
BE
FI
GE
SE
Potato
y = 0.98 – 0.0073*mAOT20r = 0.57p = 0.0005=
BE
FI
IT
SE
Spring wheat
y = 0.98 – 0.014*mAOT10r = 0.63p < 0.0000
240
mAOT10, µmol mol-1 hours
0
0.2
0.4
0.6
0.8
1.0
1.2
Rel
ativ
e yi
eld
4 8 12 16 20(a) (b)
Fig. 3. Relationships between relative yield and (a) mAOT10 (conductance modified AOT10) from anthesis until 700�C days after
anthesis for wheat and (b) mAOT20 (conductance modified AOT20) from tuber initiation until harvest for potato.
H. Pleijel et al. / Atmospheric Environment 38 (2004) 2259–22692264
(r2 ¼ 0:59) and AOT10 (r2 ¼ 0:63) for wheat. For
wheat, also AOT20 and AOT30 had r2 values >0.6.
In Fig. 2, the best CUO indices for wheat and potato
are shown. In both cases the ozone uptake rate
threshold, t; of 5 nmolm�2 s�1 provided the best
correlation between RY and ozone exposure, using
steps of 1 nmolm�2 s�1 for testing t (Table 3). The
intercept of the CUO5 regression for both crops (0.99)
ARTICLE IN PRESS
y1 = 0.0264x + 0.427
R2 = 0.970
y2 = 0.659x + 10.7
R2 = 0.970
0
1
2
3
4
5
6
7
8
9
10
0 50 100 150 200 250 300 350
Leaf conductance for water vapour, mmol m-2 s-1
Leaf
ozo
ne fl
ux a
t 40
nmol
mol
-1 O
3
nmol
m-2
s-1
0
50
100
150
200
250
Leaf
con
duct
ance
for
O 3
, mm
ol m
-2 s
-1
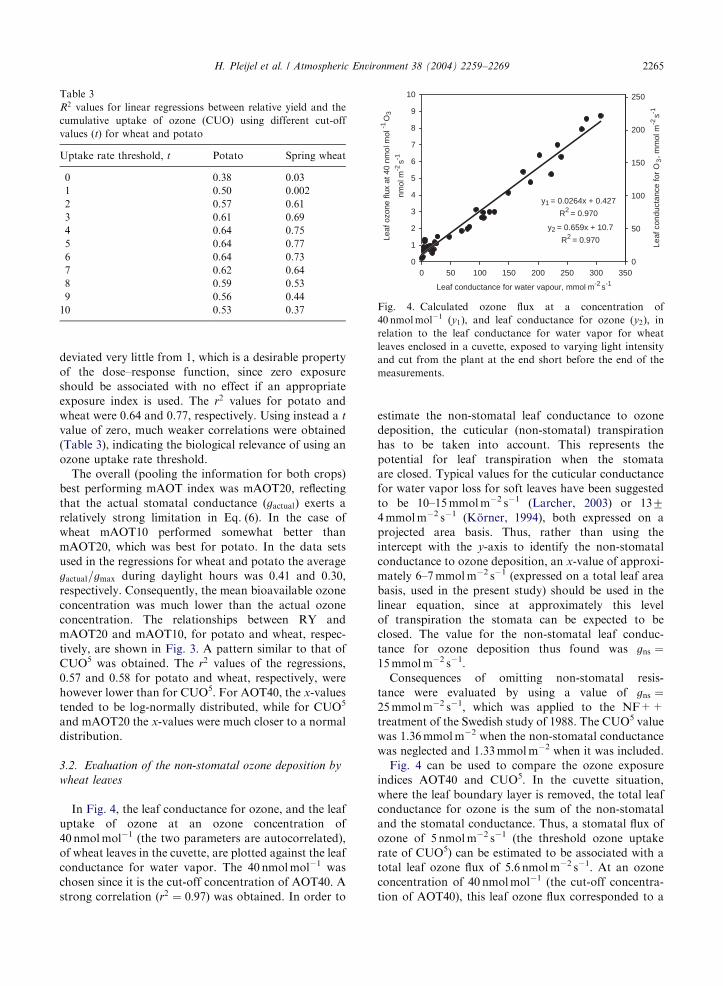
Fig. 4. Calculated ozone flux at a concentration of
40 nmolmol�1 (y1), and leaf conductance for ozone (y2), in
relation to the leaf conductance for water vapor for wheat
leaves enclosed in a cuvette, exposed to varying light intensity
and cut from the plant at the end short before the end of the
measurements.
Table 3
R2 values for linear regressions between relative yield and the
cumulative uptake of ozone (CUO) using different cut-off
values (t) for wheat and potato
Uptake rate threshold, t Potato Spring wheat
0 0.38 0.03
1 0.50 0.002
2 0.57 0.61
3 0.61 0.69
4 0.64 0.75
5 0.64 0.77
6 0.64 0.73
7 0.62 0.64
8 0.59 0.53
9 0.56 0.44
10 0.53 0.37
H. Pleijel et al. / Atmospheric Environment 38 (2004) 2259–2269 2265
deviated very little from 1, which is a desirable property
of the dose–response function, since zero exposure
should be associated with no effect if an appropriate
exposure index is used. The r2 values for potato and
wheat were 0.64 and 0.77, respectively. Using instead a t
value of zero, much weaker correlations were obtained
(Table 3), indicating the biological relevance of using an
ozone uptake rate threshold.
The overall (pooling the information for both crops)
best performing mAOT index was mAOT20, reflecting
that the actual stomatal conductance (gactual) exerts a
relatively strong limitation in Eq. (6). In the case of
wheat mAOT10 performed somewhat better than
mAOT20, which was best for potato. In the data sets
used in the regressions for wheat and potato the average
gactual=gmax during daylight hours was 0.41 and 0.30,
respectively. Consequently, the mean bioavailable ozone
concentration was much lower than the actual ozone
concentration. The relationships between RY and
mAOT20 and mAOT10, for potato and wheat, respec-
tively, are shown in Fig. 3. A pattern similar to that of
CUO5 was obtained. The r2 values of the regressions,
0.57 and 0.58 for potato and wheat, respectively, were
however lower than for CUO5. For AOT40, the x-values
tended to be log-normally distributed, while for CUO5
and mAOT20 the x-values were much closer to a normal
distribution.
3.2. Evaluation of the non-stomatal ozone deposition by
wheat leaves
In Fig. 4, the leaf conductance for ozone, and the leaf
uptake of ozone at an ozone concentration of
40 nmolmol�1 (the two parameters are autocorrelated),
of wheat leaves in the cuvette, are plotted against the leaf
conductance for water vapor. The 40 nmolmol�1 was
chosen since it is the cut-off concentration of AOT40. A
strong correlation (r2 ¼ 0:97) was obtained. In order to
estimate the non-stomatal leaf conductance to ozone
deposition, the cuticular (non-stomatal) transpiration
has to be taken into account. This represents the
potential for leaf transpiration when the stomata
are closed. Typical values for the cuticular conductance
for water vapor loss for soft leaves have been suggested
to be 10–15mmolm�2 s�1 (Larcher, 2003) or 1374mmolm�2 s�1 (K .orner, 1994), both expressed on a
projected area basis. Thus, rather than using the
intercept with the y-axis to identify the non-stomatal
conductance to ozone deposition, an x-value of approxi-
mately 6–7mmolm�2 s�1 (expressed on a total leaf area
basis, used in the present study) should be used in the
linear equation, since at approximately this level
of transpiration the stomata can be expected to be
closed. The value for the non-stomatal leaf conduc-
tance for ozone deposition thus found was gns ¼15mmolm�2 s�1.
Consequences of omitting non-stomatal resis-
tance were evaluated by using a value of gns ¼25mmolm�2 s�1, which was applied to the NF++
treatment of the Swedish study of 1988. The CUO5 value
was 1.36mmolm�2 when the non-stomatal conductance
was neglected and 1.33mmolm�2 when it was included.
Fig. 4 can be used to compare the ozone exposure
indices AOT40 and CUO5. In the cuvette situation,
where the leaf boundary layer is removed, the total leaf
conductance for ozone is the sum of the non-stomatal
and the stomatal conductance. Thus, a stomatal flux of
ozone of 5 nmolm�2 s�1 (the threshold ozone uptake
rate of CUO5) can be estimated to be associated with a
total leaf ozone flux of 5.6 nmolm�2 s�1. At an ozone
concentration of 40 nmolmol�1 (the cut-off concentra-
tion of AOT40), this leaf ozone flux corresponded to a

ARTICLE IN PRESSH. Pleijel et al. / Atmospheric Environment 38 (2004) 2259–22692266
leaf conductance for water vapor of 196mmolm�2 s�1.
At higher stomatal conductance than this, in combina-
tion with lower ozone concentrations, there may be
additions to CUO5, but not to AOT40. At lower
stomatal conductance, but higher ozone concentrations,
there will be contributions to AOT40 but not necessarily
to CUO5.
4. Discussion
For potato, the integration period from tuber initia-
tion until haulm harvest, the period during which
growing tubers are present on the stolons, resulted in a
slightly better regression between RY and CUO5
compared to the integration period from emergence
until haulm harvest. This is in accordance with the
response pattern in wheat, in which species exposure
after anthesis, the period during which growing grains
are present seem to be most important for effects on
grain yield (Pleijel et al., 1998; Soja et al., 2000). The
difference between the two periods for potato was,
however, not very large. A disadvantage in using the
period starting at tuber initiation until haulm harvest is
that this period is likely to be harder to identify in
mapping and modelling exercises. In potato, the period
of tuber growth comprises a substantial part of the total
life cycle of the plant, 81% in the present study, while
the grain filling period in wheat comprises of a much
shorter part of the life cycle (Pleijel et al., 1998).
Three different types of exposure indices for ozone
effects on crops were tested in the present study. The
best performance was obtained with CUO5, but also the
mAOT20 index performed better than the presently used
AOT40, in particular for wheat. From a mechanistic
point of view it seems to be a step forward to use a CUO
approach, where the bioavailability of ozone comes into
play, as suggested earlier by i.e. Massman et al. (2000).
The distribution of the x-values of the regressions
favor the choice of CUO5 compared to AOT40, the
latter having log-normally distributed x-values. It
should be kept in mind that the use of a constant value
to represent the detoxification capacity, the t value of
5 nmolm�2 s�1, represents a simplification. However this
approach is likely to be more biologically realistic than
using no quantitative representation of detoxification
capacity. In the future, more advanced dose–response
relationships are likely to incorporate diurnal and
seasonal variation in the detoxification capacity
(Massman et al., 2000).
There was a clear difference between wheat and
potato in that the difference in correlation between the
different exposure indices was small for potato but large
for wheat. Although a larger genetic and climatic
difference was present in the data set for wheat, the
best correlation obtained for wheat had a much higher
correlation coefficient than for potato. In part, this is
likely to be an effect of the larger variability of a potato
field, where a few tenths of plants fit into an OTC having
a ground area of 1–10m2, while the number of wheat
ears in an OTC plot varies from hundreds to thousands.
Also, the smaller number of experiments included for
potato (seven) compared to wheat (12) may have
influenced the outcome of the investigation in terms of
the difference in correlation between RY and ozone
exposure.
The regression between RY and CUO5 for wheat
revealed a relatively large degree of consistency among
different varieties of wheat in different climates.
Compared to AOT40, it is likely that large site-to-site
and year-to-year variability in ozone uptake is elimi-
nated by using stomatal conductance modelling, as was
the case also in the earlier study by Pleijel et al. (2000).
From the results in Fig. 2b, different cultivars tended to
show different sensitivity to ozone. For instance, the
cultivar Minaret seems to be slightly less sensitive than
the durum wheat cultivar from Italy. Possibly, such
differences would diminish if different cultivar specific
gmax values were used for the wheat varieties. Such
information was not available for the present study. As a
matter of fact, using only Swedish data, obtained from
two genetically related cultivars, yielded a correlation
coefficient as high as 0.90 (Danielsson et al., 2003). The
limited range of cultivars of wheat (five, only one of
which a winter grown crop) and especially of potato
(only one cultivar) is of course a limitation of the present
study. Another limitation is that no drought-stressed
plants were used in the experiments and for the
calibrations of the conductance model. In reality crops
may experience soil water shortage if not irrigated or
grown in humid climates. In order not to overestimate
ozone uptake soil water effects should be included
in further developments of the models presented in
this study.
In the study by Pleijel et al. (2000), the best correlation
between RY and CUO was obtained when using no cut-
off value t for the ozone exposure index. The difference
from the present study, in which a cut-off value of
5 nmolm�2 s�1 was adopted, is due to changes in the
stomatal conductance model, i.e. the use of a lower gmin;inclusion of gtime and gO3
factors and a change of the
gvpd function. Since these changes were based on actual
conductance measurements performed in the field
(Danielsson et al., 2003), they are likely to represent
improvements of the stomatal conductance model.
It is worth noting that Gr .unhage et al. (2001), using
a different approach for estimating risks for negative
effects of ozone on plants, came to the conclusion
that concentrations of ozone down to approximately
20 nmolmol�1 may cause toxic effects on plants. This
is in agreement with the present study, where concen-
trations down to approximately 20 nmolmol�1 may

ARTICLE IN PRESSH. Pleijel et al. / Atmospheric Environment 38 (2004) 2259–2269 2267
contribute to ozone damage if the leaf conductance is
close to its maximum value.
Another type of thresholds or cut-off value has also
been used in establishing the critical levels for ozone. A
least significant effect associated with a certain exposure
to get a critical value was suggested by the critical level
meeting in Kuopio (K.arenlampi and Sk.arby, 1996).
Since the least significant effect according the regressions
between RY and ozone exposure was around 5%, the
ozone exposure associated with that damage level was
used to identify the critical level (Pleijel, 1996). Conse-
quently, the statistical uncertainty associated with the
regressions used formed a basis for quantitatively taking
that uncertainty into account. In the present study the
5% yield loss level was associated with a CUO5 of
approximately 0.3mmolm�2 for wheat. The corre-
sponding figures for potato were 1.6mmolm�2 if the
period from tuber initiation until haulm harvest was
used, and 1.7mmolm�2 if the period from emergence
until haulm harvest was used. For wheat the 5% damage
level corresponded well with the least significant effect
according to the regression in Fig. 2b, but for potato the
least significant RY loss was around 5.5% associated
with a CUO5 exposure of 1.7mmolm�2 using tuber
initiation until haulm harvest as the integration period,
and a 6.5% RY loss from 2.5mmolm�2 if emergence
until haulm harvest was used. When comparing the
critical CUO5 values for wheat and potato, it has to be
kept in mind that the duration of the period of
integration of ozone exposure is much longer for potato,
that the stomatal conductance of potato is larger than
for wheat and that potato seems to be less sensitive to
ozone than wheat according to the present study.
It is essential to view CUO and mAOT as exposure
indices, which are sensitive to the same set of factors
which influence the stomatal conductance of the upper-
most, sunlit leaves of the crop canopy. Hence, the
bioavailability of ozone to the leaves which are most
important for the ozone impact on photosynthesis is
mirrored by the exposure index. Consequently, CUO
does not represent the total flux of ozone per unit
ground area. The total flux has a number of other
components: uptake by soil and organic litter on the soil
surface, and shaded, often partly or fully senescent
leaves with low stomatal conductance, which scarcely
contribute to the production of grain and of tubers. For
upscaling of ozone flux to canopy level see Emberson
et al. (2000b).
There are both advantages and disadvantages using
either the total flux or the uppermost leaf approach. The
uppermost leaves receive most of the sunlight and are
least senescent. This means that they are most important
for the photosynthesis on which grain and tuber
production is based. Furthermore, the flux per unit
ground area is not of direct importance for yield loss
estimations, but indirectly it is important to be able to
estimate ozone concentration gradients, which is needed
to estimate the ozone concentration at canopy height.
However, for the toxicological evaluation of potential
yield loss it seems more relevant to base it on the most
productive leaves and to avoid the ozone uptake by the
soil and parts of the canopy which may consume
substantial amounts of ozone without influencing yield
to any considerable extent. More specifically, an
advantage of the sunlit leaf approach is that the ratio
gns=gs is the smallest for that leaf category. As illustrated
in Fig. 4, the gns=gs ratio of a green wheat leaf exposed
to saturating radiation is around 1:20 if other factors are
not strongly limiting stomatal conductance. As a
consequence of this high ratio, the difference in CUO5
for the NF++ treatment of 1988 in Sweden was very
small. For older leaves in the depth of the canopy,
receiving much less solar radiation levels than sunlit
leaves, the gns=gs ratio is likely to be much higher. When
using the results of Fig. 4, however, it should be kept in
mind that the measurements were made in the labora-
tory. Field grown plants may differ in non-stomatal
conductance from greenhouse grown, and the literature
on this point is scanty.
A point to note is that there exists a systematic and
transparent way of omitting or adding stomatal
conductance modifying factors using the multiplicative
approach, simply by setting that factor to one. This
holds for both the CUO and the mAOT approaches. It is
essential that the dose–response function used is
calibrated using the same multiplicative factors that
are used in the application, e.g. mapping or other
estimations of yield loss. This allows, if required, to
move successively from concentration based to ozone
uptake based ozone exposure indices. A soil moisture
factor, gswp; which was omitted in the present study,
could be added to the model using a relationship
describing the influence of soil moisture on stomatal
conductance in wheat or potato.
5. Conclusions
The main conclusions of the present study were: (1)
Using conductance modelling and assuming one com-
mon gmax for European wheat, a consistent relationship
between RY and CUO5 with strong correlation was
obtained for OTC grown wheat from climates ranging
from Finland, over Sweden and Belgium to Italy. (2)
Although the range of climatic conditions in Europe
covered was smaller for potato than for wheat, the
relationship between RY and CUO5 was weaker, and
the improvement using CUO5, compared to using
AOT40, was smaller. (3) The use of a flux modified
AOT (mAOT) approach resulted in yield–response
relationships similar to those with CUO5. Accuracy in
the response-relationship for wheat was however lost

ARTICLE IN PRESSH. Pleijel et al. / Atmospheric Environment 38 (2004) 2259–22692268
using mAOT20, which reflects the closer relationship
between yield effect and ozone uptake above a thresh-
old, compared to the flux modified ozone concentration.
(4) In wheat, non-stomatal deposition of ozone was
indicated to be small compared to the stomatal uptake
and hence to be of little importance for the derivation of
the dose–response relationship between RY and CUO5
in wheat.
Acknowledgements
Thanks are due to the ASTA programme funded by
Mistra-Research (Sweden) and the Swedish National
Environment Protection Agency for financial support to
the present study.
References
Ashmore, M.R., Wilson, R.B. (Eds.), 1994. Critical Levels for
Air Pollutants in Europe. Department of the Environment,
London, pp. 209.
Badiani, M., Rossini, F., Paolacci, A.R., Perani, C., Porri, A.,
D’annibale, A., Falesiedi, G., Maggini, A., Giovannozzi
Sermanni, G., Ambrogi, R., 1996. The 1995 ozone experi-
ment on durum wheat (Triticum durum L.) in Viterbo
(Central Italy): preliminary results on yield and grain
mineral nutrition. In: Knoflacher, M., Schneider, J., Soja,
G. (Eds.), Exceedance of Critical Loads and Levels. Spatial
and Temporal Interpretation of Elements in Landscape
Sensitive to Atmospheric Pollutants. Umweltbundesamt
(Federal Environment Agency), Vienna, pp. 113–122.
Bender, J., Hertstein, U., Black, C.R., 1999. Growth and yield
responses of spring wheat to increasing carbon dioxide,
ozone and physiological stresses: a statistical analysis of
ESPACE-wheat results. European Journal of Agronomy 10,
185–195.
Borrell, P., Builtjes, P.J.H., Grennfelt, P., Hov, Ø., 1997.
Photo-oxidants, Acidification and Tools; Policy Applica-
tions of EUROTRAC Results. Springer, Berlin, Heidelberg,
New York, 216pp.
Campbell, G.S., Norman, J.M., 1998. An introduction to
Environmental Biophysics, 2nd Edition. Springer, Berlin,
Heidelberg, New York, 286pp.
Danielsson, H., Pihl Karlsson, G., Karlsson, P.E., Pleijel, H.,
2003. Ozone uptake modelling and flux-response relation-
ships—an assessment of ozone-induced yield loss in spring
wheat. Atmospheric Environment 37, 475–485.
De Temmerman, L., Wolf, J., Colls, J., Bindi, M., Fangmeier,
A., Finnan, J., Ojanper.a, K., Pleijel, H., 2002. Effect of
climatic conditions on tuber yield (Solanum tuberosum L.) in
the European ‘CHIP’ experiments. European Journal of
Agronomy 17, 243–255.
Emberson, L.D., Ashmore, M.R., Cambridge, H.M., 1998.
Development of methodologies for Mapping Level II
Critical Levels of Ozone. DETR Report No. EPG 1/3/82.
Imperial College of London, London. 113pp.
Emberson, L.D., Ashmore, M.R., Cambridge, H.M., Simpson,
D., Tuovinen, J.-P., 2000a. Modelling stomatal ozone flux
across Europe. Environmental Pollution 109, 403–413.
Emberson, L.D., Simpson, D., Tuovinen, J.-P., Ashmore,
M.R., Cambridge, H.M., 2000b. Towards a model of ozone
deposition and stomatal uptake over Europe. EMEP/MSC-
W 6/2000. Norwegian Meteorological Institute Research
Note No. 42.
Fowler, D., Flechard, C., Cape, J.N., Storeton-West, R.L.,
Coyle, M., 2001. Measurements of ozone deposition to
vegetation, quantifying the flux, the stomatal and non-
stomatal components. Water, Air and Soil Pollution 130,
63–74.
Fuhrer, J., Achermann, B., 1994. Critical levels for ozone. A
UN-ECE workshop report. Schriftenreihe der FAC Liebe-
feld 16, 42–57.
Fuhrer, J., Sk.arby, L., Ashmore, M.R., 1997. Critical levels for
ozone effects on vegetation in Europe. Environmental
Pollution 97, 91–106.
Gelang, J., Pleijel, H., Sild, E., Danielsson, H., Younis, S.,
Selld!en, G., 2000. Rate and duration of grain filling in
relation to flag leaf senescence and grain yield in spring
wheat (Triticum aestivum) exposed to different concentra-
tions of ozone. Physiologia Plantarum 110, 366–375.
Gerosa, G., Cieslik, S., Ballarin-Denti, A., 2003. Partitioning of
ozone fluxes between stomatal and other pathways over a
wheat field in the Po River Plain during the growing season.
In: Midgley, P.M., Reuther, M. (Eds.), Transport and
Chemical Transformation in the Troposphere. Proceedings
from the EUROTRAC-2 Symposium 2002. Margraf Verlag,
Weikersheim, 310pp.
Gr .unhage, L., J.ager, H.-J., 1994. Influence of the atmospheric
conductivity on the ozone exposure of plants under
ambient conditions: considerations for establishing ozone
standards to protect vegetation. Environmental Pollution
85, 125–129.
Gr .unhage, L., J.ager, H.-J., Haenel, H.-D., L .opmeier, F.-J.,
Hanewald, K., 1999. The European critical levels for ozone:
improving their usage. Environmental Pollution 105,
163–173.
Gr .unhage, L., Haenel, H.-D., J.ager, H.-J., 2000. The exchange
of ozone between vegetation and atmosphere: micrometeor-
ological techniques and models. Environmental Pollution
109, 373–392.
Gr .unhage, L., Krause, G.H.M., K .ollner, B., Bender, J., J.ager,
H.-J., Weigel, H.-J., Guderian, R., 2001. A new flux-
oriented concept to derive critical levels for ozone to protect
vegetation. Environmental Pollution 111, 355–362.
Gr .uters, U., Fangmeier, A., J.ager, H.-J., 1995. Modelling
stomatal responses of spring wheat (Triticum aestivum L. cv.
Turbo) to ozone and different levels of water supply.
Environmental Pollution 87, 141–149.
Hacour, A., Craigon, J., Vandermeiren, K., Ojanper.a, K.,
Pleijel, H., Danielsson, H., H .ogy, P., Finnan, J., Bindi, M.,
2002. CO2 and ozone effects on canopy development of
potato crops across Europe. European Journal of Agron-
omy 17, 257–272.
Jarvis, P.G., 1976. The interpretation of the variations in leaf
water potential and stomatal conductance found in canopies
in the field. Philosophical Transactions of the Royal Society,
London B 273, 593–610.

ARTICLE IN PRESSH. Pleijel et al. / Atmospheric Environment 38 (2004) 2259–2269 2269
K.arenlampi, L., Sk.arby, L., 1996. Critical Levels for ozone in
Europe. Testing and Finalizing the Concepts. UN-ECE
Workshop Report, University of Kuopio, Department of
Ecology and Environmental Science, University of Kuopio,
363pp.
Kerstiens, G., Lendzian, K.J., 1989. Interactions between ozone
and plant cuticles. 1. Ozone deposition and permeability.
New Phytologist 112, 13–19.
K .orner, C., 1994. Leaf diffusive conductances in the major
vegetation types of the globe. In: Schulze, E.D., Caldwell,
M.M. (Eds.), Ecophysiology of Photosynthesis. Ecological
Studies 100. Springer, Berlin, Heidelberg, New York,
pp. 463–490.
Laisk, A., Kull, O., Moldau, H., 1989. Ozone concentrations in
leaf intercellular spaces is close to zero. Plant Physiology 90,
1163–1167.
Larcher, W., 2003. Physiological Plant Ecology, 4th Edition.
Springer, Berlin, Heidelberg, New York, 506pp.
Livingston, N.J., Black, T.A., 1987. Stomatal characteristics
and transpiration of three species of conifer seedlings
planted on a high elevation south-facing clear-cut. Cana-
dian Journal of Forest Research 17, 1273–1282.
Massman, W.J., Musselman, R.C., Lefohn, A.S., 2000. A
conceptual dose–response model to develop a standard to
protect vegetation. Atmospheric Environment 34, 745–759.
Musselman, R.C., Massman, W.J., 1999. Ozone flux to
vegetation and its relationship to plant response and
ambient air quality standards. Atmospheric Environment
33, 65–73.
Ojanper.a, K., Sutinen, S., Pleijel, H., Selld!en, G., 1992.
Exposure of spring wheat, Triticum aestivum L., cv.
Drabant, to different concentrations of ozone in open-top
chambers: effects on the ultrastructure of flag leaf cells. New
Phytologist 120, 39–48.
Ojanper.a, K., Leinonen, P., Yl.aranta, T., 1994. Effects of ozone
on the grain yield of spring wheat in an open-top chamber
experiment in Finland. In: Fuhrer, J., Achermann, B. (Eds.),
Critical Levels for Ozone. A UN-ECE Workshop Report.
Schriftenreihe der FAC Liebefeld 16, 248–251.
Panek, J.A., Kurpius, M.R., Goldstein, A.H., 2002. An
evaluation of ozone exposure metrics for a seasonally
drought-stressed ponderosa pine ecosystem. Environmental
Pollution 117, 93–100.
Pleijel, H., 1996. Statistical aspects of critical levels for ozone.
In: K.arenlampi, L., Sk.arby, L. (Eds.), Critical Levels for
Ozone in Europe. Testing and Finalizing the Concepts. UN-
ECE Workshop Report. University of Kuopio, Department
of Ecology and Environmental Science, University of
Kuopio, 363pp.
Pleijel, H., Sk.arby, L., Wallin, G., Selld!en, G., 1991. Yield
and grain quality of spring wheat (Triticum aestivum L.,
cv. Drabant) exposed to different concentrations of ozone
in open-top chambers. Environmental Pollution 69,
151–168.
Pleijel, H., Ojanper.a, K., Mortensen, L., 1997. Effects of
tropospheric ozone on the yield and grain protein content of
spring wheat (Triticum aestivum L.) in the Nordic countries.
Acta Agriculturae Scandinavica Section B, Soil and Plant
Science 47, 20–25.
Pleijel, H., Danielsson, H., Gelang, J., Sild, E., Selld!en, G.,
1998. Growth stage dependence of the grain yield response
to ozone in spring wheat (Triticum aestivum L.). Agricul-
ture, Ecosystems and Environment 70, 61–68.
Pleijel, H., Gelang, J., Danielsson, H., Younis, S., Karlsson,
P.E., Wallin, G., Sk.arby, L., Selld!en, G., 1999. Effects of
elevated carbon dioxide, ozone and water availability on
spring wheat growth and yield. Physiologia Plantarum 108,
61–70.
Pleijel, H., Danielsson, H., Pihl Karlsson, G., Gelang, J.,
Karlsson, P.E., Selld!en, G., 2000. An ozone flux–response
relationship for wheat. Environmental Pollution 109,
453–462.
Pleijel, H., Danielsson, H., Vandermeiren, K., Blum, C., Colls,
J., Ojanper.a, K., 2002. Stomatal conductance and ozone
exposure in relation to potato tuber yield—results from the
European CHIP programme. European Journal of Agron-
omy 17, 303–317.
Polle, A., Rennenberg, H., 1993. The significance of antiox-
idants in plant adaptation to environmental stress. In:
Fowden, L., Mansfield, T.A., Stoddart, J. (Eds.), Plant
Adaptation to Environmental Stress. Chapman and Hall,
London, Glasgow, New York, pp. 263–274.
Soja, G., Barnes, J.D., Posch, M., Vandermeiren, K., Pleijel,
H., Mills, G., 2000. Phenological weighting of ozone
exposure in the calculation of critical levels for wheat, bean
and plantain. Environmental Pollution 109, 517–524.
Turcs!anyi, E., Lyons, T., Pl .ochl, M., Barnes, J., 2000. Does
ascorbate in the mesophyll cell walls form the first line of
defence against ozone? Testing the concept using broad
bean (Vicia faba L.). Journal of Experimental Botany 51,
901–910.
UNECE, 1988. ECE Critical Levels Workshop, Bad Harzburg.
Final Draft Report.
Unsworth, M.H., Heagle, A.S., Heck, W.W., 1984. Gas
exchange in open-top filed chambers. II. Resistances to
ozone uptake by soybeans. Atmospheric Environment 18,
381–385.
Wallin, G., Sk.arby, L., Selld!en, G., 1990. Long-term exposure
of Norway spruce, Picea abies (L.) Karst., to ozone in open-
top chambers. I. Effects on the capacity of net photosynth-
esis, dark respiration and leaf conductance of shoots of
different ages. New Phytologist 115, 335–344.