relationships between epas scores and college preparatory ... · the core set of courses is defined...
TRANSCRIPT
A C T Rese&rcli R eport Series 2 0 0
Relationships Between EPAS® Scores and College Preparatory Course Work in High School
David J. W oodruff
ACT A u g u st

For additional copies write: A C T Research Report Series P.O. Box 168Iowa City, Iowa 52243-0168
© 2 0 0 3 by ACT, Inc. All rights reserved.
Relationships Between EPAS Scores and College Preparatory Course Work in High School
David J. Woodruff


Abstract
ACT’s Educational Planning and Assessment System (EPAS) consists of three testing
programs: EXPLORE, PLAN, and the ACT Assessment Program (ACT). EXPLORE is
administered in the eighth grade, PLAN in the tenth grade, and ACT in the eleventh or twelfth
grade. This report investigates relationships among the Composite scores of these three test
batteries and the relationships the three Composite test scores have with high school grade point
average (HSGPA). The primary interest of the study was whether taking a set of college
preparatory courses, here labeled the “core” set of courses, has a positive relationship with
students’ ACT scores, when the students have identical EXPLORE scores before starting high
school. The study presents evidence that the three test batteries comprising EPAS are valid and
consistent measures of students’ academic achievement. It also concludes that no matter what
students’ initial level of achievement, as represented by their EXPLORE Composite scores,
students who take the core set of courses are more likely to have higher ACT Composite scores
than students who take less than the core set of courses.


Acknowledgements
The author thanks Qing Yi for help with the data analyses, Dean Colton for helpful
conceptual discussions, and Richard Sawyer for editorial assistance.

!

Relationships Between EPAS Scores and College Preparatory Course Work in High School
This report presents the results of a study of the three testing programs comprising ACT’s
Educational Planning and Assessment System (EPAS): EXPLORE, PLAN, and the ACT
Assessment (ACT). The study used the Composite scores of students who recently took all three
of the test batteries while attending middle/junior high school and high school. The analyses
considered the inter-relationships among the Composite scores of the three test batteries and the
relationships of the Composite scores with high school grade point average (HSGPA). The study
also considered differences between students who took the ACT in their junior year of high
school and students who took the ACT in their senior year of high school. The main focus of the
study was whether taking the “core” set of courses is related to ACT Composite scores when
students had identical EXPLORE Composite scores before starting high school. Results of the
analyses are presented in several tables and in two graphs.
The core set of courses is defined as taking four years of English courses, three years of
mathematics courses, three years of social studies courses, and three years of science courses. In
determining whether a student has satisfied the core set of courses, all courses that the student
has taken, is taking, and plans to take at the time of the ACT administration are counted. A
student’s core status therefore measures both the student’s achievements and the student’s goals.
For simplicity of expression, the phrase “took the core set of courses” is used in this report.
However, it should be understood that the student might be in the process of taking the core set
of courses, rather than having completed all of the core courses at the time of testing.
Each of the three test batteries comprising EPAS is composed of four tests: English,
Mathematics, Reading, and Science. The Composite score for each battery is the average of that
battery’s four test scores. The content of the three test batteries is carefully constructed to reflect

the middle/junior high and high school college preparatory curriculum. ACT conducts national
curriculum studies to ensure the continued appropriateness of the content of the three test
batteries comprising EPAS. The last such study reviewed state educational standards for the 49
states that had published such standards, and surveyed 21,900 middle/junior high and high
school teachers, along with 1,500 curriculum specialists. ACT also has developed Standards for
Transition for the three EPAS test batteries. These standards describe the skills and knowledge
that most students scoring in particular score ranges can demonstrate. These standards help
students better understand their scores on the three test batteries in terms of the knowledge and
skills necessary for success in school.
Given the curriculum-based content of the ACT, one would expect that students who take
more college preparatory courses in high school would have higher ACT scores. Noble and
McNabb (1989) found a positive relationship between core course work and ACT scores. Schiel,
Pommerich, and Noble (1996) studied the relationship between college preparatory course work
and ACT scores for students with identical PLAN scores. They found a positive relationship
between core course work and ACT scores, even among students with the same PLAN
Composite score. The present study examines the relationship between high school course work
and ACT scores among students who have the same EXPLORE Composite score.
Data
The data consist of those students in the high school graduating class of 2002 who took all
three of the EPAS test batteries while attending middle/junior high school and high school. All of
the students attended public junior and senior high schools, and the primary language spoken in
the home was English. The sample of students was 57% female and 43% male. Approximately
2
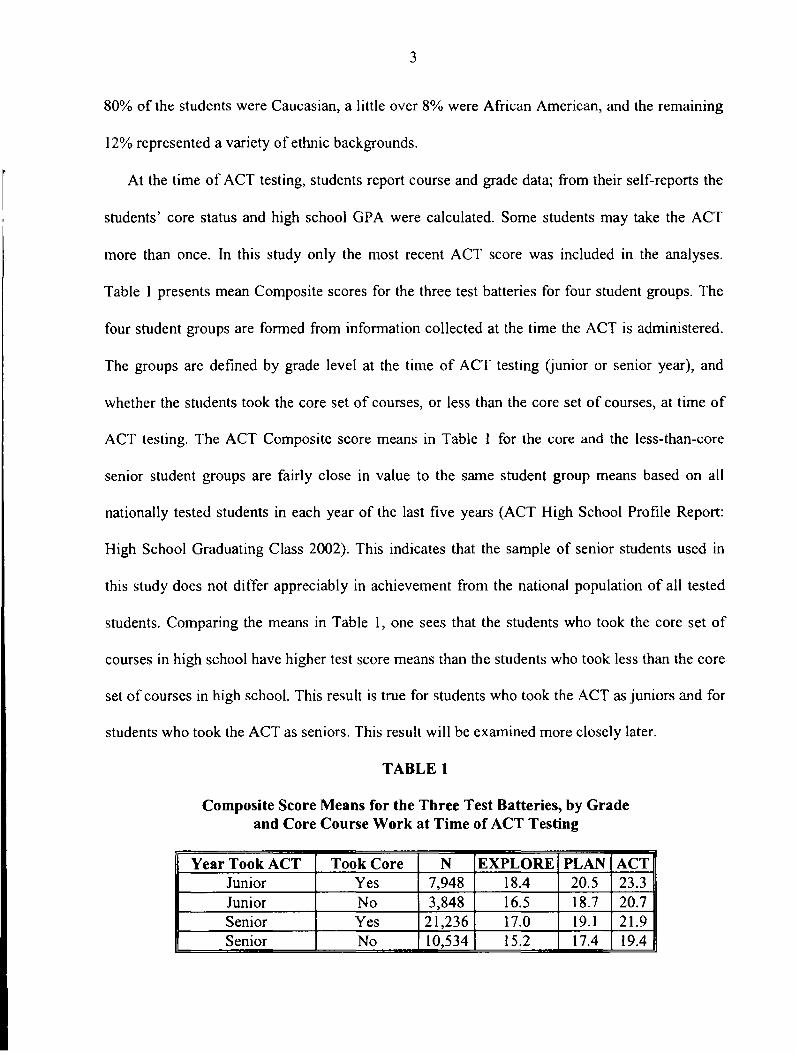
80% of the students were Caucasian, a little over 8% were African American, and the remaining
12% represented a variety of ethnic backgrounds.
At the time of ACT testing, students report course and grade data; from their self-reports the
students’ core status and high school GPA were calculated. Some students may take the ACT
more than once. In this study only the most recent ACT score was included in the analyses.
Table 1 presents mean Composite scores for the three test batteries for four student groups. The
four student groups are formed from information collected at the time the ACT is administered.
The groups are defined by grade level at the time of ACT testing (junior or senior year), and
whether the students took the core set of courses, or less than the core set of courses, at time of
ACT testing. The ACT Composite score means in Table 1 for the core and the less-than-core
senior student groups are fairly close in value to the same student group means based on all
nationally tested students in each year of the last five years (ACT High School Profile Report:
High School Graduating Class 2002). This indicates that the sample of senior students used in
this study does not differ appreciably in achievement from the national population of all tested
students. Comparing the means in Table 1, one sees that the students who took the core set of
courses in high school have higher test score means than the students who took less than the core
set of courses in high school. This result is true for students who took the ACT as juniors and for
students who took the ACT as seniors. This result will be examined more closely later.
3
TABLE 1
Composite Score Means for the Three Test Batteries, by Grade and Core Course Work at Time of ACT Testing
Year Took ACT Took Core N EXPLORE PLAN ACTJunior Yes 7,948 18.4 20.5 23.3Junior No 3,848 16.5 18.7 20.7Senior Yes 21,236 17.0 19.1 21.9Senior No 10,534 15.2 17.4 19.4

Method
Correlations among the three Composite scores of EPAS were computed, as were the
correlations of these Composite scores with high school GPA. In addition, mean differences in
ACT Composite scores between students who satisfy the core requirement and those who do not
are computed for each group of students with the same EXPLORE Composite score. It is
important to recognize that the data used in this study are observational rather than experimental
data. The students were not randomly assigned to the two different groups: “take the core set of
courses” and “take less than the core set of courses.” Their group membership was determined
by self-selection. Of course, it would be nearly impossible to do an experiment where high
school students were randomly assigned to take either the core set of courses or less than the core
set of courses. Though observational data, unlike experimental data, cannot prove a causal
relationship, it can support such an inference.
Results
Table 2 presents correlations of HSGPA with the Composite scores of each of the three test
batteries for students taking the ACT in their junior year of high school and for students taking
the ACT in their senior year of high school. Within each year, students are further divided into
core and less-than-core groups. The correlations are quite high when one considers the wide
variety of subjects in which students can take classes and the differing grading standards among
subjects, teachers, and schools. The values of these correlations support the assertion that the
three test batteries are measuring the knowledge and skills taught in the middle school and high
school curricula. The ACT has a slightly higher correlation with HSGPA than do PLAN and
EXPLORE, but that is to be expected, because the ACT is given nearer the end of high school
than are the other two test batteries. The correlations of the three test batteries with HSGPA are
4

essentially equal for juniors and seniors. Note that not all students reported their grades, so the
HSGPA analysis reported in Table 2 is based on a smaller sample of students than the analyses
that follow.
TABLE 2
Correlations of HSGPA with EXPLORE, PLAN, and ACT Composite Scores, by Grade and Core Course Work at Time of ACT Testing
Year Took ACT Took Core N EXPLORE PLAN ACTJunior Yes 7,602 0.51 0.52 0.54Junior No 3,494 0.52 0.55 0.56Senior Yes 20,477 0.53 0.53 0.55Senior No 9,500 0.52 0.54 0.54
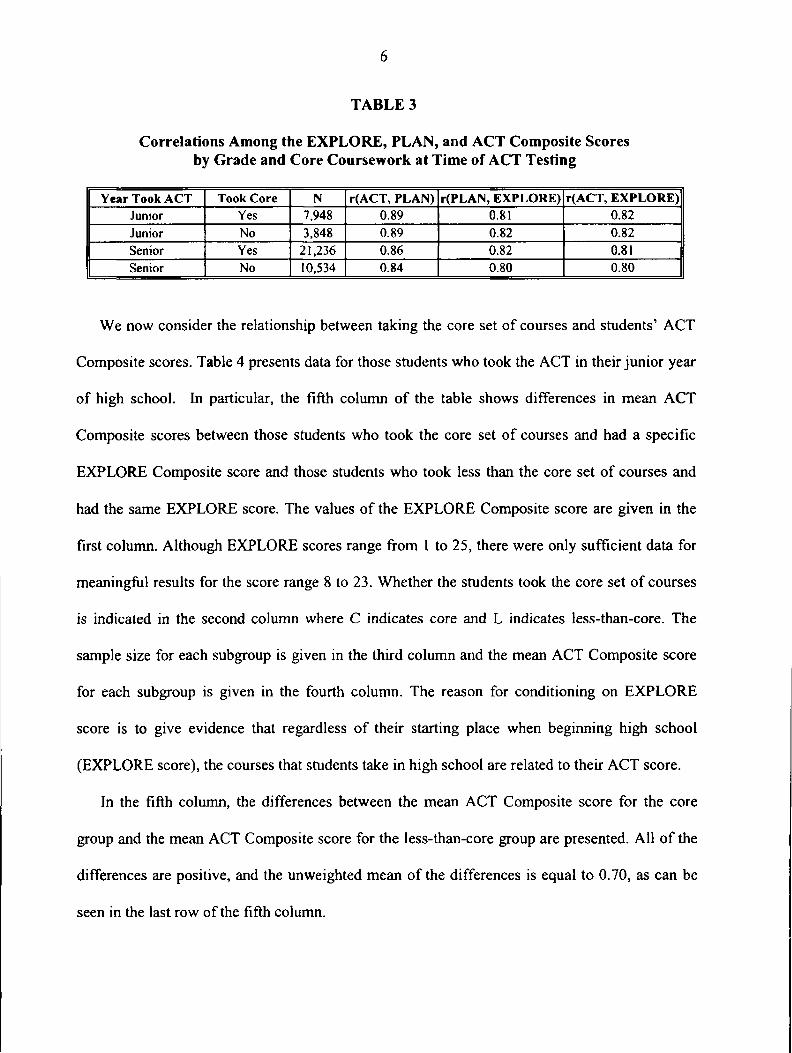
Correlations among the Composite scores of the three test batteries for the four different
student groups are presented in Table 3. All the students in this study took EXPLORE in the
eighth grade, though students can take EXPLORE in the ninth grade. All students took PLAN in
the tenth grade. Some students took the ACT in the eleventh grade; other students took the ACT
in the twelfth grade. So, the interval between the administration of ACT and PLAN is one or two
years. The interval between the administration of PLAN and EXPLORE is two years, and the
interval between the administration of ACT and EXPLORE is three or four years. The stability
indicated by these high values for the correlations among the three test batteries over such long
test administration intervals indicates that the EPAS is consistently measuring a common set of
attributes as students progress through the grades. EPAS is curriculum-based, and is designed to
measure educational achievement. The inter-correlations among the three EPAS test batteries are
consistent with the objective of measuring the skills and knowledge students acquire in school.
6
Correlations Among the EXPLORE, PLAN, and ACT Composite Scores by Grade and Core Coursework at Time of ACT Testing
TABLE 3
Y ear Took A CT Took Core N r(ACT, PLAN) r(PLAN, EXPLORE) r(A CT, EX PLO RE)Junior Yes 7,948 0.89 0.81 0.82Junior No 3,848 0.89 0.82 0.82Senior Yes 21,236 0.86 0.82 0.81Senior No 10,534 0.84 0.80 0.80
We now consider the relationship between taking the core set of courses and students’ ACT
Composite scores. Table 4 presents data for those students who took the ACT in their junior year
of high school. In particular, the fifth column of the table shows differences in mean ACT
Composite scores between those students who took the core set of courses and had a specific
EXPLORE Composite score and those students who took less than the core set of courses and
had the same EXPLORE score. The values of the EXPLORE Composite score are given in the
first column. Although EXPLORE scores range from 1 to 25, there were only sufficient data for
meaningful results for the score range 8 to 23. Whether the students took the core set of courses
is indicated in the second column where C indicates core and L indicates less-than-core. The
sample size for each subgroup is given in the third column and the mean ACT Composite score
for each subgroup is given in the fourth column. The reason for conditioning on EXPLORE
score is to give evidence that regardless of their starting place when beginning high school
(EXPLORE score), the courses that students take in high school are related to their ACT score.
In the fifth column, the differences between the mean ACT Composite score for the core
group and the mean ACT Composite score for the less-than-core group are presented. All of the
differences are positive, and the unweighted mean of the differences is equal to 0.70, as can be
seen in the last row of the fifth column.
7
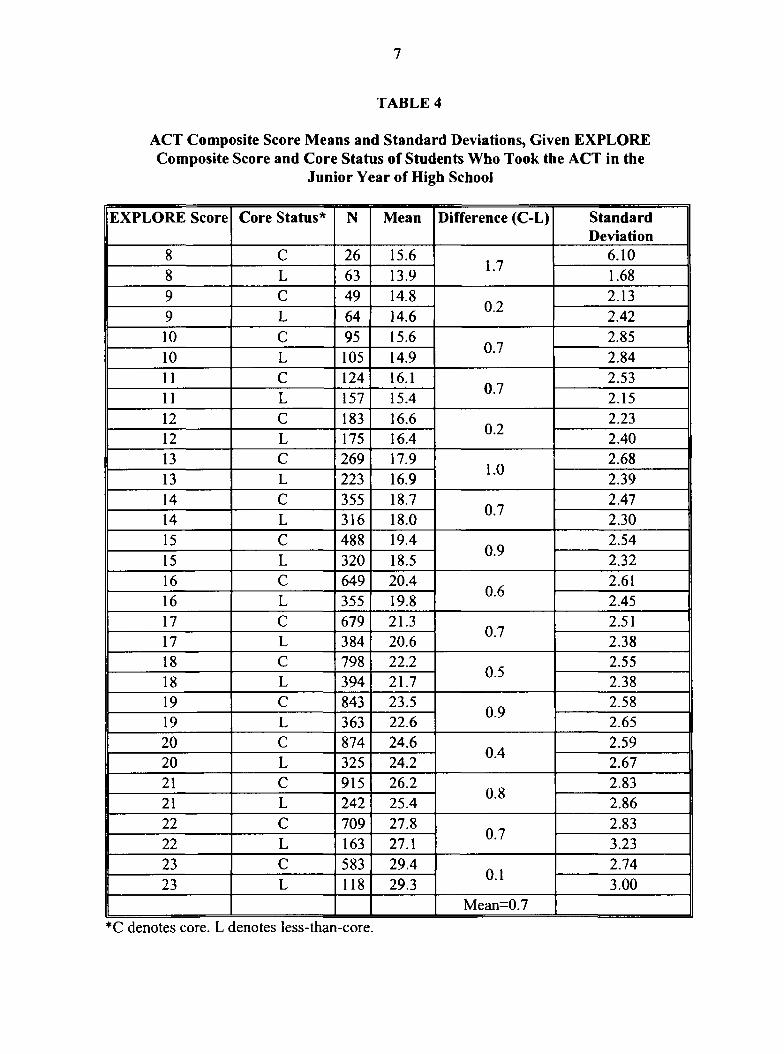
TABLE 4
ACT Composite Score Means and Standard Deviations, Given EXPLORE Composite Score and Core Status of Students Who Took the ACT in the
Junior Year of High School
EXPLORE Score Core Status* N Mean Difference (C-L) StandardDeviation
8 C 26 15.61.7
6.108 L 63 13.9 1.689 C 49 14.8
0.22.13
9 L 64 14.6 2.4210 C 95 15.6
0.72.85
10 L 105 14.9 2.8411 C 124 16.1
0.72.53
11 L 157 15.4 2.1512 C 183 16.6
0.22.23
12 L 175 16.4 2.4013 C 269 17.9
1.02.68
13 L 223 16.9 2.3914 C 355 18.7
0.72.47
14 L 316 18.0 2.3015 C 488 19.4
0.92.54
15 L 320 18.5 2.3216 C 649 20.4
0.62.61
16 L 355 19.8 2.4517 C 679 21.3
0.72.51
17 L 384 20.6 2.3818 C 798 22.2
0.52.55
18 L 394 21.7 2.3819 C 843 23.5
0.92.58
19 L 363 22.6 2.6520 C 874 24.6
0.42.59
20 L 325 24.2 2.6721 C 915 26.2
0.82.83
21 L 242 25.4 2.8622 C 709 27.8
0.72.83
22 L 163 27.1 3.2323 C 583 29.4
0.12.74
23 L 118 29.3 3.00Mean-0.7
*C denotes core. L denotes less-than-core.

The sixth column of Table 4 contains the ACT Composite score standard deviation for each
of the 32 different EXPLORE score-by-core status student subgroups. The standard deviations
and means are used to compute effect sizes. Effect sizes provide a practical interpretation of the
mean differences, as discussed below.
The results presented in Table 4 indicate that for students with the same EXPLORE
Composite score in junior high school, taking the core set of courses in high school is associated
with an average 0.70 point increase in their ACT Composite score. One way of evaluating the
meaningfulness of this increase is to perform statistical significance tests. However, statistical
significance is a function of sample size, and when sample size is large, as in this case, very
small differences can be highly statistically significant. A more practical index of the size of a
difference is an effect size (Light, Singer, and Willet, 1990). In comparing the difference
between the means of just two groups, an effect size is defined as the difference between the two
means divided by the weighted average of the two within-group standard deviations. In the
present case, there are sixteen between-group mean differences, so the mean of these sixteen
mean differences, which equals 0.70, is used. The divisor is the weighted mean within-group
standard deviation of the thirty-two groups, which equals 2.60. Hence the effect size for the
juniors is 0.70/2.60 = 0.26. This is considered a modest effect size (Light, Singer, and Willet,
1990). Schiel (1998) discusses other interpretations of differences between mean ACT scores.
Table 5 presents the same data and statistical analyses as Table 4, but for students who took
the ACT in their senior year of high school. In Table 5 EXPLORE Composite scores range from
6 to 25. The results for the seniors in Table 5 show a larger gain for the core group than the
results for the juniors in Table 4. The mean of the nineteen mean differences is 0.86. The
weighted mean within-group standard deviation equals 2.49. Therefore, the effect size for the
8

seniors is 0.86/2.49 = 0.35. This is a modest effect size. For those students who take the ACT in
the senior year of high school and have the same EXPLORE Composite score in junior high
school, taking the core set of courses is associated with an average increase of almost one point
(0.86) in their ACT Composite score. This is a larger gain than that found for those students
taking the ACT in their junior year of high school.
The larger gain for seniors could be due to the seniors having taken more core courses than
the juniors at the time of ACT testing. Recall that core status classification is based on the
courses the students have taken, are taking, and plan to take at the time of ACT testing. Students
taking the ACT as seniors probably have taken and are taking more core courses than students
taking the ACT as juniors, whereas the core status classification of the juniors may be based
more on courses the juniors are planning to take, but have not yet taken.
An examination of the sample size (N) column in Table 4 and Table 5 shows that as the
EXPLORE Composite score increases, there is a larger proportion of students taking the core set
of courses. This indicates that students with higher EXPLORE Composite scores are more likely
to take the core set of courses than are students with lower EXPLORE Composite scores. In an
experimental study, this could be controlled by randomly assigning equal numbers of students to
take the core set of courses and to take less than the core set of courses. Nonetheless, of those
students with the same EXPLORE Composite score, those taking the core set of courses have an
average increase of nearly one point in their ACT Composite score, as compared to those
students who do not take the core set of courses.
9

10
TABLE 5
ACT Composite Score Means and Standard Deviations, Given EXPLORE Composite Score and Core Status of Students Who Took the ACT in the
Senior Year of High School
EXPLORE Score Core Status* N Mean Difference (C-L) S tandardDeviation
6 C 34 16.1 4.406 L 37 13.6 2.5 2.797 C 80 15.3 3.447 L 108 13.7 1.6 2.128 C 148 15.0 2.218 L 220 14.3 0.7 2.339 C 251 15.1 2.369 L 340 14.5 0.6 2.1010 C 400 f 5.8 2.3710 L 503 15.2 0.6 2.1411 C 669 16.5 2.3311 L 589 15.7 0.8 2.2412 C 912 17.0 2.3412 L 800 16.3 0.7 2.1813 C 1248 17.8 2.3513 L 934 17.1 0.7 2.2514 C 1621 18.6 2.3614 L 1060 17.9 0.7 2.3215 C 1765 19.5 2.3715 L 1020 18.8 0.7 2.4016 C 2017 20.5 2.5616 L 1016 19.7 0.8 2.4117 C 2053 21.5 2.5217 L 943 20.6 0.9 2.5118 C 2129 22.5 2.5818 L 809 21.7 0.8 2.6919 C 2117 23.5 2.6219 L 707 22.6 0.9 2.6720 C 1955 24.9 2.6020 L 568 24.2 0.7 2.8621 C 1676 26.3 2.6321 L 420 25.5 0.8 2.8222 C 1159 27.4 2.5722 L 279 26.6 0.8 2.9123 C 683 28.8 2.4823 L 130 28.3 0.5 2.3124 C 282 30.0 2.5924 L 34 29.4 0.6 2.75
Mean=0.86
*C denotes core. L denotes less-than-core.

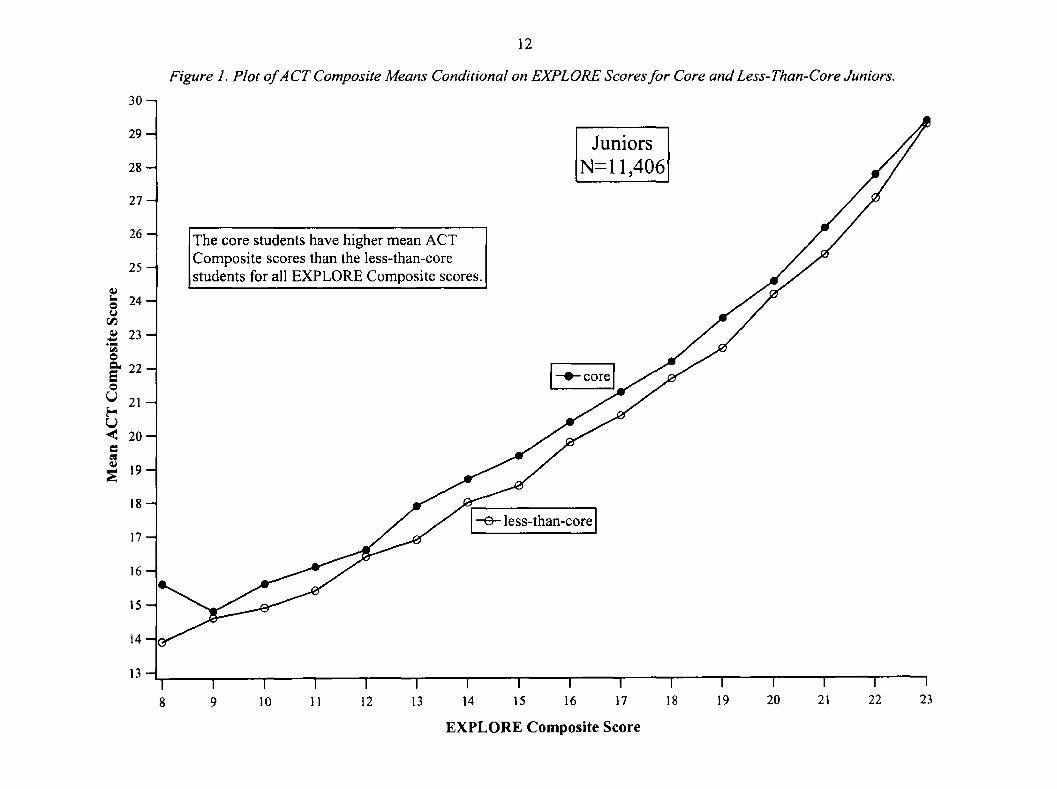
Graphical representations of the data in Tables 4 and 5 are presented in Figures 1 and 2.
Figure 1 presents data for those students who took the ACT in their junior year of high school.
EXPLORE Composite scores are represented on the horizontal axis; these are the scores given in
the first column of Table 4. The conditional mean ACT Composite scores given in the fourth
column of Table 4 are represented on the vertical axis. The ACT Composite score conditional
means for the students who took the core set of courses are represented by large solid circles and
are connected by lines. The ACT Composite score conditional means for the students who took
less than the core set of courses are represented by large hollow circles and also are connected by
lines. The two lines represent the relationship between ACT Composite scores and EXPLORE
Composite scores; one line is for the core group and the other line is for the less-than-core group.
The core group line everywhere lies above the less-than-core group line and this graphically
demonstrates the average increase in ACT scores that students with a given EXPLORE score
may gain by taking the core set of courses.
Figure 2 is identical in form to Figure 1, except that it uses the data given in Table 5. Figure 2
is similar to Figure 1, except that the separation between the core group line and the less-than-
core group line is slightly larger and the two lines are slightly smoother in Figure 2. Figure 2
graphically demonstrates that seniors with the same EXPLORE Composite score who take the
core set of courses tend to have slightly larger gain in their ACT Composite scores than do
juniors, though juniors also show gain. The two lines in Figure 2 that relate mean ACT
Composite scores to EXPLORE Composite scores for the two core status groups are slightly
smoother than the same two lines in Figure 1. This is most likely due to the larger number of
seniors in the study. There are 31,716 seniors and 11,406 juniors in the study; hence there are
more than 2.5 as many seniors as there are juniors. It is typically the case that more students take
11
30
29
28
27
26
25
24
23
22
21
20
19
18
17
16
15
14
13
Figure 1. Plot o f ACT Composite Means Conditional on EXPLORE Scores for Core and Less-Than-Core Juniors.
12
"T22
I10 11 12 13
T14 15
T16
T17 18 19 20 21 23
EXPLORE Composite Score

30
29
28
27
26
25
24
23
22
21
20
19
18
17
16
15
14
13
13
Figure 2. Plot o f ACT Composite Means Conditional on EXPLORE Scores for Core and Less-Than-Core Seniors.
T21
T22
~ r23
12410 11
I12
T"13 14 15 16
I
17I
18I
19 20
EXPLORE Composite Score

the ACT in the senior year of high school rather than the junior year of high school. In addition,
any students who took the ACT in both the junior and senior year of high school would have
only their senior year ACT score included in the study.
Discussion
EPAS is curriculum-based, and the ACT is designed to measure the knowledge and skills
taught in high school that are necessary for success in college. It is sensible that students may be
able to improve their ACT scores by taking the core set of college preparatory courses. Previous
studies listed above have found this result. This study has found that regardless of EXPLORE
Composite scores in the 8th grade, students who commit to taking the core set of courses in high
school can, on average, increase their ACT Composite scores by almost one point. Thus it
appears worthwhile for parents, teachers, and counselors to encourage students to commit to
taking the core set of courses.
In summary, the final conclusions of this study are three. First, the three test batteries
comprising EPAS have substantial correlations with HSGPA. This result supports the validity of
EPAS as a measure of the high school curriculum. Second, the three test batteries are highly
correlated with each other despite test administration gaps of one to four years, and are
consistently measuring common attributes as students progress through grades 8 to 12. These
high Composite score correlations are consistent with the primary goal of EPAS, which is to
measure the skills and knowledge students acquire in junior high and high school. Third, no
matter what their academic level before high school, as represented by their EXPLORE
Composite score, students taking the core set of courses in high school are more likely to have
higher ACT Composite scores than students taking less than the core set of courses.
14

15
References
ACT (2002). ACT High School Profile Report: High School Graduating Class 2001. Iowa City, Iowa: ACT.
Light, J. L., Singer, J. D., & Willet, J. B. (1990). By design: planning research in higher education. Cambridge, Massachusetts: Harvard University Press.
Noble, J. & McNabb, T. (1989). Differential course work in high school: Implications for performance on the ACT assessment. (ACT Research Report Series 89-5). Iowa City, Iowa: ACT.
Schiel, J. (1998). Interpreting differences between mean ACT assessment scores. (ACT Research Report Series 98-1). Iowa City, Iowa: ACT.
Schiel, J., Pommerich, M., & Noble, J. (1996). Factors associated with longitudinal educational achievement, as measured by PLAN and ACT Assessment Scores. (ACT Research Report Series 96-5). Iowa City, Iowa: ACT.


