relationships between aprn state practice authority
TRANSCRIPT

University of New MexicoUNM Digital Repository
Nursing ETDs Electronic Theses and Dissertations
Fall 12-18-2018
Relationships Between APRN State PracticeAuthority, Perceived Autonomy, Professionalism,and Interprofessional Team Function Among ANational Sample Of APRNs In the U.S.Patricia Rae GilmanUniversity of New Mexico
Follow this and additional works at: https://digitalrepository.unm.edu/nurs_etds
Part of the Other Nursing Commons
This Dissertation is brought to you for free and open access by the Electronic Theses and Dissertations at UNM Digital Repository. It has beenaccepted for inclusion in Nursing ETDs by an authorized administrator of UNM Digital Repository. For more information, please [email protected].
Recommended CitationGilman, Patricia Rae. "Relationships Between APRN State Practice Authority, Perceived Autonomy, Professionalism, andInterprofessional Team Function Among A National Sample Of APRNs In the U.S.." (2018). https://digitalrepository.unm.edu/nurs_etds/43
i
Patricia Rae Gilman Candidate
College of Nursing Department
This dissertation is approved, and it is acceptable in quality and form for publication:
Approved by the Dissertation Committee:
Dr. Elizabeth Tigges, PhD, RN, PNP-BC Chairperson
Dr. Mark Parshall, PhD, RN, FAAN
Dr. Kim Cox, PhD, RN, CNM
Dr. Sally Cohen, PhD, RN, FAAN
ii
RELATIONSHIPS BETWEEN APRN STATE PRACTICE AUTHORITY, PERCEIVED AUTONOMY, PROFESSIONALISM, AND INTERPROFESSIONAL
TEAM FUNCTION AMONG A NATIONAL SAMPLE OF APRNS IN THE U.S.
BY
PATRICIA R. GILMAN
A.S., Nursing, Brainerd Community College, 1986 B.S., Nursing, Augsburg College, 2007
M.S. Advanced Practice Nursing, Winona State University, 2010
DISSERTATION
Submitted in Partial Fulfillment of the Requirements for the Degree of
Doctor of Philosophy
Nursing
The University of New Mexico Albuquerque, New Mexico
December 2018
iii
ACKNOWLEDGEMENTS
This project would not have been possible without the funding assistance from the
Robert Wood Johnson Foundation. Special mention is given to the Robert Wood Johnson
Foundation Nursing and Health Policy Collaborative Director Alexia Green and staff,
Antoinette Sabedra and Bryan Nicholas Jackson for their ongoing dedication and
assistance.
I would like to acknowledge my dissertation committee for their support and
advice: Dr. Elizabeth Tigges, PhD, RN, PNP-BC (Chair), Dr. Mark Parshall, PhD, RN,
FAAN and Dr. Kim Cox, PhD, RN, CNM, (internal members), and Dr. Sally Cohen, PhD,
RN, FAAN (external member). Additionally, many thanks to Blake Boursaw, MS, for his
advice and assistance with the analyses for this project.
Finally, I would like to thank my family and friends for their support and
especially my husband, John, for his many sacrifices and unwavering support and
encouragement during this project. This was a journey to remember.
iv
RELATIONSHIPS BETWEEN APRN STATE PRACTICE AUTHORITY, PERCEIVED AUTONOMY, PROFESSIONALISM, AND
INTERPROFESSIONAL TEAM FUNCTION AMONG A NATIONAL SAMPLE OF APRNS IN THE U.S.
by
Patricia Rae Gilman
A.S., NURSING, BRAINERD COMMUNITY COLLEGE
B.S., NURSING, AUGSBURG COLLEGE
M.S., ADVANCED PRACTICE NURSING, WINONA STATE UNIVERSITY
P.H.D., NURSING, UNIVERSITY OF NEW MEXICO
ABSTRACT
Healthcare that includes high performing interprofessional clinical teams (IPTs) is
one recommended strategy to provide optimal quality and cost-effective care delivery.
Highly functional IPTs are characterized by effective communication, trust, respect,
collaboration, information-sharing, and conflict resolution and are more efficient than
individual providers working alone. Internally, IPT members’ relationships and
understanding of both one’s own professional identity and others’ role and
responsibilities are crucial to team functionality and effectiveness. Externally, factors
including regulatory practice environments might influence the effectiveness and
performance of both individual team members and the team overall. Inconsistencies
between states’ practice authority (SPA) for advanced practice nurses (APRNs) provides
an opportunity to study the effects on IPT function. This study examined relationships
between APRN SPA, with perceived autonomy, professionalism, and IPT function in a
national sample APRNs (N =222) from across the U.S who worked in IPTs within the
past year for at least six months. APRNs in this study perceived a high level of autonomy

v
and moderate level of professionalism and IPT function. Significant relationships were
found between SPA and autonomy. No relationship was found between SPA and IPT
function and SPA did not moderate between professionalism and IPT function. However,
the direct relationship between SPA and autonomy implies that an indirect relationship
could exist that might affect how IPT function is perceived. This study adds to the body
of nursing science and informs on strategies for future inquiry regarding team function
and APRN policy and regulation.

vi
TABLE OF CONTENTS
LIST OF FIGURES ...........................................................................................................x
LIST OF TABLES .......................................................................................................... xii
CHAPTER 1 INTRODUCTION .....................................................................................1
Interprofessional Team Function ...................................................................................2
State Practice Authority .................................................................................................3
Professional Identity ......................................................................................................5
Autonomy ......................................................................................................................6
Professionalism ..............................................................................................................7
Conceptual Framework ..................................................................................................8
Purpose of the Study ......................................................................................................8
Research Questions ........................................................................................................9
Scope of the Study .......................................................................................................10
Study Design ..........................................................................................................10
Definitions..............................................................................................................11
Limitations ...................................................................................................................15
Internal Validity .....................................................................................................15
Construct Validity ..................................................................................................16
External Validity ....................................................................................................16
Statistical Conclusion Validity ..............................................................................17
Human Subjects .....................................................................................................17
Assumptions .................................................................................................................18
Significance of the Study .............................................................................................19

vii
CHAPTER 2 CONCEPTUAL FRAMEWORK AND REVIEW OF
LITERATURE ........................................................................................................20
Conceptual Framework ................................................................................................20
Identity Theories ..........................................................................................................21
Social Identity ........................................................................................................21
Professional Identity ..............................................................................................22
Place-Identity .........................................................................................................27
Summary ................................................................................................................28
Literature Review.........................................................................................................30
Interprofessional Team Function ...........................................................................30
States’ Practice Authority ......................................................................................38
Autonomy ..............................................................................................................42
Professionalism ......................................................................................................46
Summary and Conclusion ............................................................................................47
CHAPTER 3 METHODS...............................................................................................50
Study Design ................................................................................................................50
Sample....................................................................................................................51
Statistical Power Analysis......................................................................................52
Procedures ....................................................................................................................53
Data Collection ......................................................................................................53
Instruments and Measures......................................................................................54
Statistical Analyses ................................................................................................64
Human Subjects ...........................................................................................................71
viii
Potential Risks and Steps to Mitigate Risks ..........................................................71
CHAPTER 4 RESULTS .................................................................................................73
Statistical Analyses ................................................................................................73
CHAPTER 5 DISCUSSION ..........................................................................................84
State Practice Authority ...............................................................................................84
Autonomy and IPT Function .......................................................................................86
Professionalism and IPT Function ...............................................................................88
Implications..................................................................................................................89
Nursing Science and Research ...............................................................................89
Health Policy ..........................................................................................................90
Conclusion ...................................................................................................................92
APPENDICES ..................................................................................................................93
APPENDIX A POWER ANALYSIS .............................................................................94
APPENDIX B EMAIL INVITATION ..........................................................................99
APPENDIX C SCREENING ITEMS .........................................................................100
APPENDIX D UNIVERSITY OF NEW MEXICO HEALTH SCIENCES
CENTER INFORMED CONSENT ....................................................................101
APPENDIX E STUDY QUESTIONNAIRE ...............................................................103
APPENDIX F ORIGINAL INSTRUMENTS FOR MEASURES ............................110
APPENDIX G MODIFICATION DETAILS FOR HALL’S
PROFESSIONALISM SCALE ...........................................................................116
APPENDIX H STATE APRN PRACTICE AUTHORITY CROSS-
REFERENCE TABLE .........................................................................................119

ix
APPENDIX I DESCRIPTIVES ...................................................................................123
APPENDIX J PRELIMINARY DATA ANALYSIS .................................................128
APPENDIX K STATISTICAL TESTS FOR RESEARCH QUESTIONS .............141
REFERENCES ...............................................................................................................148
x
LIST OF FIGURES
Figure 1. Conceptual model of proposed mediating relationships: The mediating role of perceived autonomy between state practice authority and APRN perceived IPT function. ................................................................................................................9
Figure 2. Conceptual model of proposed moderating relationships: The moderating role of state practice authority between professionalism and perceived IPT function. .......................................................................................................................9
Figure 3. Conceptual diagram depicting the factors that influence an individual’s professional identity development across the lifespan. ..............................................23
Figure 4. T-TPQ Cronbach’s α coefficients and intercorrelation. .....................................56 Figure 5. Details for DPBS factor analysis. .......................................................................59 Figure 6. Comparison between Hall’s Professionalism Scale and Snizek’s modified
Professionalism Scale. ...............................................................................................61 Figure 7. Conceptual model of proposed mediating relationships: The mediating role
of perceived autonomy between state practice authority and APRN perceived IPT function. ..............................................................................................................67
Figure 8. Conceptual model of proposed moderating relationships: The moderating role of state practice authority between perceived professionalism between perceived IPT function. ..............................................................................................70
Figure 9. Advanced practice state and organization practice authority parity. Diagram indicates that the majority of APRNs practice in organizations at the same level as defined by state practice authority. ......................................................76
Figure 10. Scatterplot depicting the relationship between interprofessional team function and professionalism N = 222. ......................................................................80
Figure 11. Scatter plot representing the interaction of state practice authority between professionalism and IPT function in a national sample of APRNs (N = 222). ...........................................................................................................................83
Figure A1. A priori calculations for power against a range of sample sizes using r = .20 effect size for correlation, f = 0.20 for ANOVA, and R2 = .04 for multiple regression using G*Power©. .....................................................................................94
Figure A2. A priori calculations for power against a range of sample sizes using r = .25 effect size for correlation, f = .258 for ANOVA, and R2 = .0625 for multiple regression using G*Power©. .......................................................................95
Figure A3. Effect size calculation for Correlation using G*Power©. ...............................96
Figure A4. Effect size calculation for ANOVA using G*Power©. ..................................97 Figure A5. Effect size calculation for multiple linear regression with 5 predictors
using G*Power©. ......................................................................................................98
xi
Figure F1. TeamSTEPPS® Teamwork Perceptions Questionnaire. ...............................112 Figure F2. Dempster Practice Behaviors Scale................................................................113 Figure F3. Professionalism Scale. ....................................................................................114 Figure F4. The Professionalism Scale. ............................................................................115 Figure J1.1. Q-Q plot of distribution of T-TPQ mean scores. .........................................128 Figure J1.2. P–P plot of distribution of T-TPQ mean scores. ..........................................129 Figure J1.3. Box plot for distribution of T-TPQ mean scores. ........................................129 Figure J1.4. Histogram for distribution of T-TPQ mean scores. .....................................130 Figure J2.1. Q-Q plot for distribution of DPBS mean scores. .........................................130 Figure J2.2. P–P plot for distribution of DPBS mean scores. ..........................................131 Figure J2.3. Box plot for distribution of DPBS mean scores...........................................131 Figure J2.4. Histogram for distribution of DPBS mean scores........................................132 Figure J3.1. Distribution of PS mean scores. ...................................................................132 Figure J3.2. P–P plot for distribution of PS mean scores. ...............................................133 Figure J3.3. Box plot for distribution of PS mean scores. ...............................................133 Figure J3.4. Histogram for distribution of PS mean scores. ............................................134 Figure K1. Line graph for T-TPQ mean scores by state practice authority level. ...........142 Figure K3. Line graph for DPBS mean scores by state practice authority level. ............144 Figure K4. Scatter plot for the relationship between IPT function and autonomy. .........144 Figure K5. Scatter plot for the relationship between IPT function and
professionalism. .......................................................................................................145
xii
LIST OF TABLES
Table 1. State Practice Authority Levels for APRNs by State ..........................................40 Table 2. Demographic Variables .......................................................................................63 Table 3. Inclusion and Exclusion Matrix for Study Participants N = 402 .........................73 Table 4. Characteristics of Study Participants (N = 222)...................................................74 Table 5. Comparison of Mean Scores Between APRN Groups ........................................77 Table 6. Means, Standard Deviation, and One-Way Analysis of Variance Effects of
State Practice Authority (SPA) and Interprofessional Team Function (T-TPQ) .......78 Table 7. Means, Standard Deviation, and One-Way Analysis of Variance Effects of
State Practice Authority (SPA) and Autonomy (DPBS) ............................................79 Table 8. Pearson Product–Moment Correlations Between Measures of
Interprofessional Team Function (T-TPQ), Autonomy (DPBS), and Professionalism (PS) ..................................................................................................79
Table 9. Multiple Linear Regression Model Summary for Testing Moderating Effects of State Practice Authority (SPA) Between Professionalism (PS) and Interprofessional Team Function (T-TPQ) Using Restricted Practice Authority as the Referent Category ............................................................................................82
Table 10. Multiple Linear Regression Model for Predictors of Interprofessional Team (IPT) Function (N = 222) .................................................................................82
Table H1. Cross-Reference Table of State Practice Authority Levels by State and APRN Type ..............................................................................................................119
Table I1. Inclusion/Exclusion Frequencies for Study Participants ..................................123 Table I2. Frequencies .......................................................................................................123 Table I3. Descriptives Frequency Table ..........................................................................124 Table I4. Comparison of Means.......................................................................................126 Table I5. Test of Homogeneity of Variances ...................................................................126 Table I6. ANOVA ............................................................................................................126 Table I7. Multiple Comparisons of Mean Scores ............................................................127 Table I8. Collinearity Regression ....................................................................................127 Table J4. Test for Collinearity for Independent Variables Dempster Practice
Behavior Scale (DPBS), Professionalism Scale (PS), and State Practice Authority. .................................................................................................................134
Table J5.1. TeamSTEPPS T-TPQ® Reliability Tests and Statistics ...............................135 Table J5.2. Dempster Professional Behavior Scale (DPBS) Reliability Tests and
Statistics ...................................................................................................................137
xiii
Table J5.3. Professionalism Scale (PS) Reliability Tests and Statistics ..........................139 Table K1.1. Test of Homogeneity of Variances ..............................................................141 Table K1.2. ANOVA: T-TPQ Mean Score .....................................................................141 Table K1.3. Multiple Comparisons: Tukey HSD ............................................................141 Table K1.4. T-TPQ Mean Score Tukey HSDa,b ...............................................................142 Table K3.1. Test of Homogeneity of Variances ..............................................................143 Table K3.2. ANOVA: DPBS Mean Score .......................................................................143 Table K3.3. Multiple Comparisons: Tukey HSD ............................................................143 Table K3.4. DPBS Mean Score: Tukey HSDa,b ...............................................................143 Table K4.1. Correlations ..................................................................................................145 Table K5.1. Statistical Tests for Relationships between IPT Function and
Professionalism: Correlations ..................................................................................146 Table K6.1. Sequence of Analyses and Output for Three-Step Regression Analysis
Using Interaction Terms to Test for Moderation of State Practice Authority Between Professionalism and IPT Function ............................................................146
1
CHAPTER 1
INTRODUCTION
Strategies that include a comprehensive approach to care while maintaining
patient and provider satisfaction and lower costs are necessary to provide high-quality
healthcare that meets the needs of individuals with increasingly complex health
conditions, many of which require specialized practitioners to manage. Healthcare that
includes high performing interprofessional clinical teams (IPTs) is one such strategy.
Collectively teams can synthesize, refine, and implement a greater amount of diverse
knowledge to make decisions, solve problems, innovate, and execute tasks more
effectively and efficiently than any individual working alone (Anonson et al., 2009).
High functioning teams are characterized by effective communication, trust, respect,
collaboration, information sharing, and conflict resolution among IPT members (Agency
for Healthcare Research and Quality [AHRQ]; Interprofessional Education Collaborative
Expert Panel [IPEC], 2011). However, IPT function whether actual or perceived might be
influenced by both internal (individual behaviors and perceptions) and external
(environmental and social) factors that affect the effectiveness and performance of both
individual team members and the team overall.
This cross-sectional internet-based self-administered survey study examined the
direct and indirect relationships between state practice authority with perceived autonomy,
professionalism and IPT function in a national sample of advanced practice nurses
(APRNs) in the U.S. Specifically, using an internet-based survey the purpose of this
study is to: (1) determine if environmental factors (state practice authority) have a direct
or indirect effect on APRN perception of IPT function; (2) examine the extent to which
2
APRN perception of autonomy and professionalism directly and significantly associate
with APRN perception of (IPT) function; (3) determine the extent to which APRN
perception of autonomy mediates the relationship between state practice authority and
IPT function, and (4) to determine the extent to which state practice authority moderates
the relationship between APRN perception of professionalism and IPT function in a
national sample of APRNs in the United States.
Interprofessional Team Function
The IOM (2001, 2011) reports that highly functioning healthcare teams have a
higher degree of coordination of care and better patient outcomes. According to IPEC
(2011), communication, collaboration, trust, and mutual respect are essential components
and competencies for highly functional teams. However, some studies suggest conflict
among the diverse professions within IPTs due to lack of knowledge about other
members’ profession and roles and environments such as the traditional hierarchical
nature of healthcare structures influence how individuals within IPTs function (Mitchell,
Parker, & Giles, 2011). IPTs perform better when all members have knowledge of each
other’s scope of practice, skill, and expertise and acknowledge each individual’s
contributions to the team’s effectiveness (Almost & Laschinger, 2002; Anonson et al.,
2009). Team and individual effectiveness (IPT function) suffer when team members
disrespect and devalue other team members (Fagermoen, 1997). Furthermore, team
members depend on each other’s expertise and competence to fulfill the team’s goals
(Anonson et al., 2009). The question is, do healthcare structural environments, such as
state practice authority, which regulate the scope of practice of APRN team members,
change the IPT’s function in any way?
3
Secondly, are there interactions between state practice authority and APRNs’
perceptions of professionalism and autonomy that would in turn change how they
perceive IPT function? A considerable amount of literature exists about autonomy,
professionalism, and IPT function, separately in healthcare settings. However, no studies
were found that examine state practice authority, perceived autonomy and
professionalism together or their influence on perceived IPT function.
State Practice Authority
In the U.S. over 267,000 APRNs (National Council of State Boards of Nursing
(NCSBN, 2017) practice in various settings including rural, urban, inpatient acute care,
outpatient and urgent care clinics, public health, and specialty clinics. Significant
variation exists among states’ practice authority not only in legislative and policy
language but also among the four APRN groups. In general, aside from states that do not
recognize APRNs or designate practice authority for APRNs, state practice authority falls
into three main categories: (1) restricted practice authority refers to practice where the
APRN is supervised by a physician, DO, dentist, or chiropractor; (2) reduced practice
authority refers to practice under a written agreement between the APRN and physician,
DO, dentist, or chiropractor that defines the scope of practice by which the APRN will
practice; and (3) full practice authority refers to the ability for APRNs to practice without
the oversight or supervision of a physician, DO, dentist, or chiropractor. Refer to the
definitions section for complete detail.
Recommendations from the IOM (2001, 2011) clearly support APRN autonomous
practice and the implementation of interprofessional team-based care as measures to
improve the public’s access to comprehensive quality healthcare and lower overall costs.
4
However, no studies were found that examined APRN practice authority related to the
perception of IPT function. Ultimately, the IPT will function more effectively if
individual members can fulfill his or her professional role. The APRN, as a member of
the interprofessional clinical practice team (IPT), contributes to the functionality and
performance of the team, that in turn, leads to measurable team outcomes. Therefore, it is
important to study factors, including regulatory environments, which support or threaten
how APRNs perceive autonomy and professionalism that in turn relates to how IPT
function is perceived.
It is worth mentioning that not all states recognize the APRN title, even though
APRNs may be nationally certified and legally title protected, nor do all states
acknowledge the education and training that prepares APRNs for autonomous practice
within their scope of practice regulation. The focus of this study involves the state
practice authority environment. However, even in states that provide legislative language
for full scope of practice, some organizations (healthcare institutions, systems, and
insurers) reduce or restrict APRN practice authority (National Governor’s Association,
2012). Restrictions to APRN practice authority applied at the organizational level prevent
the APRN from fulfilling their professional role and have the potential for ambiguity and
confusion among IPT members. Studies indicate that practice environments where
administrators model and support full scope of practice yield higher levels of
collaboration among team members (Almost & Laschinger, 2002; Regan, Laschinger, &
Wong, 2016), thereby contributing to a higher level of team function. This study
examined how state practice authority directly or indirectly affects IPT function among a
sample of APRNs in the U.S.

5
Professional Identity
Multiple factors influence how individual practitioners perceive their function
within their respective professional roles and work settings. The literature on professional
identity and professionalism cites education, values, and traditions within the discipline
as major contributing factors to professional identity development (Baumann & Kolotylo,
2009; Godfrey & Crigger, 2017). Acquiring professional identity is a socialization
process that begins with formal entry-level education and develops over the course of the
professional’s career (Godfrey & Crigger, 2017; MacIntosh, 2003). Professional identity
is a component of overall identity that develops through social influences such as societal
status, interactions with others (professional and social), and interpretations of
experiences (Godfrey & Crigger, 2017; Johnson, Cowin, Wilson, & Young, 2012).
Others have defined professional identity in nursing as a reflection of individual values
and beliefs as a guide for decision-making, interaction, and action regarding caring for
patients (Fagermoen, 1997). Accordingly, foundational concepts of nursing including
decision-making, interaction, and action are analogous to practice autonomy and
fundamentally necessary to both identify oneself and function as an APRN. This study
uses two dimensions of professional identity, perceived autonomy and professionalism, to
examine how they relate to state practice authority and perceived IPT function.
A well-developed sense of professional identity is necessary for the APRN to
perform autonomously within the IPT because it establishes knowledge of the scope of
practice and work APRNs do. A strong sense of one’s professional identity also allows
the individual to distinguish the difference between oneself and other professionals
within the IPT and is known as self-categorization (Tajfel & Turner, 1979). Consequently,
6
as an IPT member, it is reasonable to consider that any factor that threatens APRN
professional identity or its components also threatens the ability of the IPT to achieve
optimal function.
Autonomy
Weston (2010, para. 13) provides the definition of nurse autonomy as “the ability
to act according to one’s knowledge and judgment, providing nursing care within the full
scope of practice as defined by existing professional, regulatory, and organizational rules.”
Dempster (1990) defined autonomy as the state of being independent, free, and self-
directing. In Dempster’s study, nurse practitioners describe perceived autonomy as an
essential component of APRN practice and necessary in the ability to practice to the full
extent of their skill and knowledge.
A significant amount of literature exists regarding APRN autonomy. The most
frequently addressed issues related to APRN autonomy are prescriptive authority and
patient safety. Evidence suggests autonomous practice is not only necessary for APRNs
to practice to the fullest extent of their education and training (Dempster, 1990), but also
is safe, high-quality care for patients (Newhouse et al., 2011). Restrictive practice
policies, such as certain state laws and regulations, reduce APRN autonomy (Pan, Straub,
& Geller, 1997). Some studies suggest that restrictive regulatory practices contribute to
higher public safety risks and limit the public’s accessibility to healthcare (Rudner Lugo,
O’Grady, Hodnicki, & Hanson, 2010). Since autonomy is a necessary component of
optimal APRN function, it is logical to assume that autonomy is a significant contributor
to IPT function because if the APRN is unable to perform as an independent contributor
the team will be unable to rely on him or her as a fully functioning team member, thus
7
implying that the APRN may perceive less effective IPT functioning. This study sought
to determine if APRNs’ perceived autonomy has a direct effect or mediates the
relationship between state practice authority and IPT function.
Professionalism
Professionalism is a complex multidimensional concept, and a consensus on its
definition does not exist (Young, 2010). Furthermore, the terms professionalism and
professional identity have been used interchangeably making concise measurement
challenging. Key attributes of professionalism identified in the literature include
autonomy, knowledge, competence, professionhood, accountability, advocacy,
collaborative practice, and commitment (Baumann & Kolotylo, 2009; Young, 2010).
Environmental attributes of professionalism in nursing include control of nursing practice,
quality of nursing work life, professional support, shared governance, and environmental
culture and climate (Baumann & Kolotylo, 2009). A study of Canadian nursing faculty
and students identified these same professional and environmental attributes (Akhtar-
Danesh et al., 2013). Hampton and Hampton (2000, p. 218) defined professionalism as
the “behavioral orientation that professionals possess toward their field, such as sense of
calling and belief in public service.” Hampton and Hampton’s definition suggests
professionalism is the manifestation of one’s professional identity, making it separate
from, but a component of professional identity. This study focused on professionalism
because no reliable instrument could be found to measure professional identity in the
APRN population. Furthermore, no study was found that examined the relationship
between professionalism and APRN perception of IPT function. In this study, that
8
relationship was explored; in addition, the possible moderating effect of state practice
authority between perceived professionalism and IPT function was examined.
Conceptual Framework
The conceptual framework for this study is supported by identity theories and the
primary theory guiding this study is professional identity theory (PIT), which is an
extension of social identity theory [SIT] (Tajfel and Turner, 1979). Professional identity
theory provides the conceptual rationale for linking the professional identity constructs of
professionalism and autonomy to perceived IPT function. However, professional identity
theory alone is insufficient for explaining the potential association of distal factors (state
practice authority) between perceived autonomy, professionalism, and IPT function . As
such, the use of the PIT is augmented by the inclusion of place-identity (Proshansky,
Fabian, & Kaminoff, 1983), which in this study is a way of explaining the hypothesized
relationships between state practice authority and perceived autonomy, professionalism,
and perceived IPT function.
Purpose of the Study
The primary purpose of this study is to examine the relationships between state
practice authority, perceived autonomy, professionalism, and IPT function in a national
sample of APRNs in the U.S. Aims include: (1) to determine if state practice authority
has a direct or indirect effect on APRN perception of IPT function; (2) to examine the
extent to which APRN perception of autonomy and professionalism directly and
significantly associate with APRN perception of IPT function; (3) to determine the extent
to which APRN perception of autonomy mediates the relationship between state practice
9
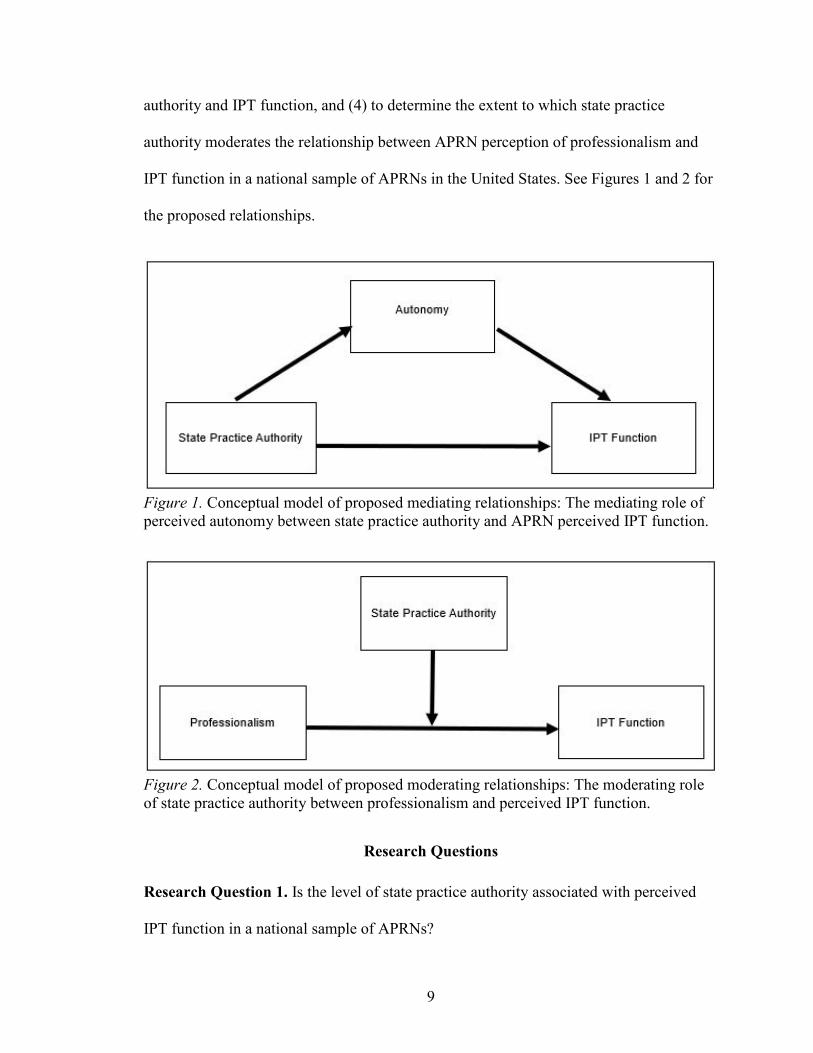
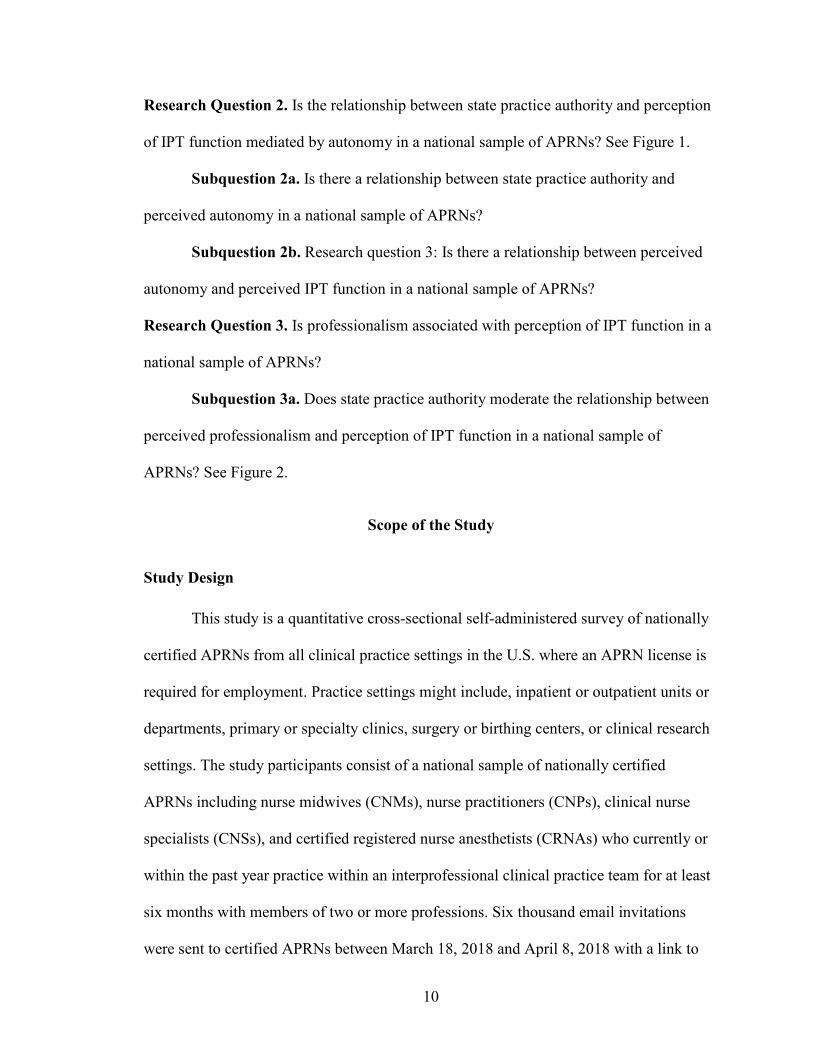
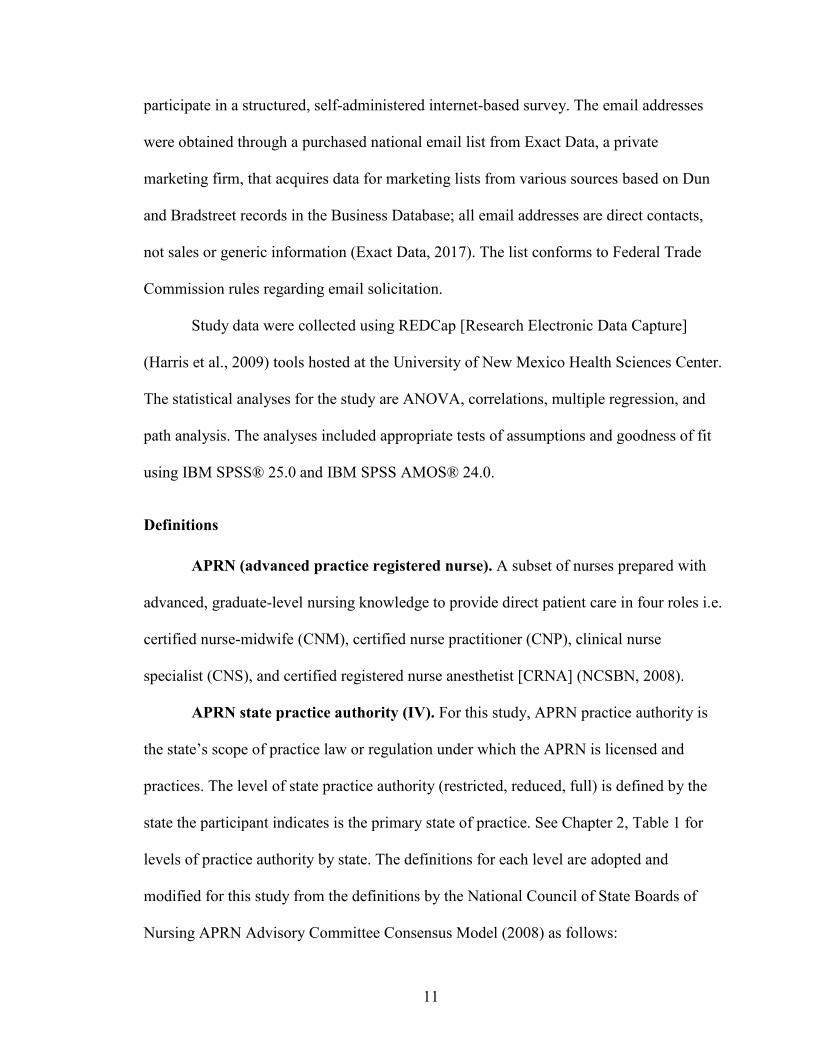
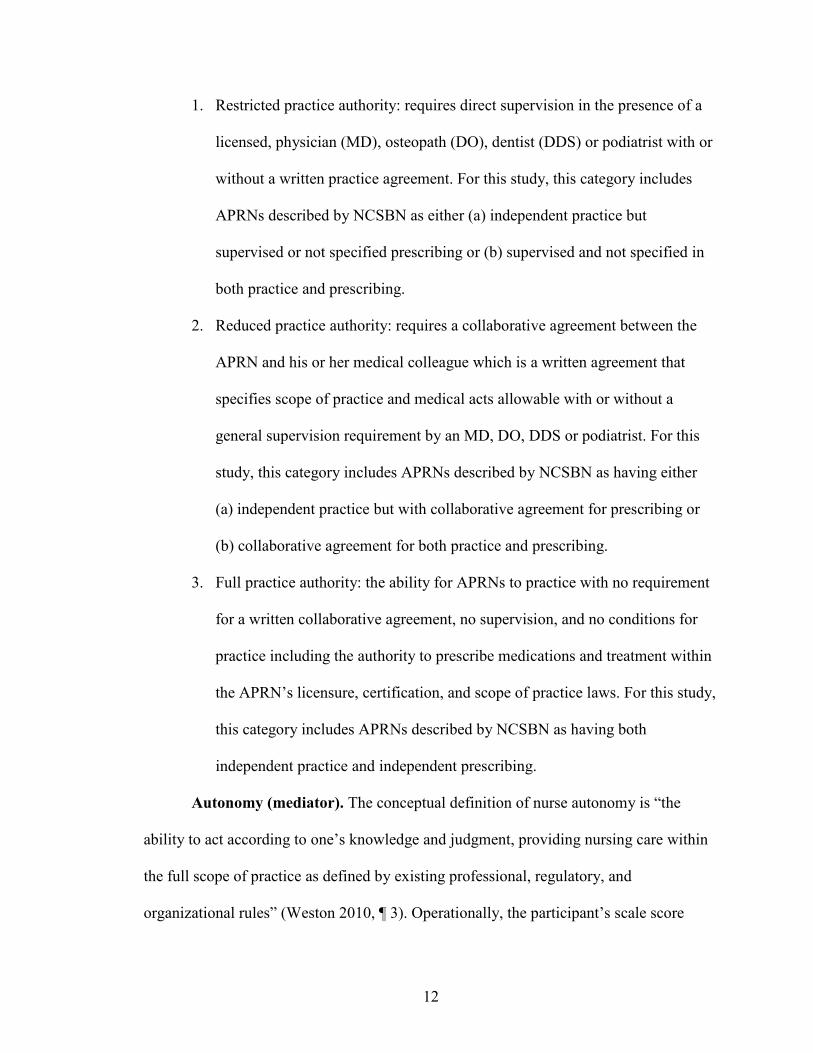
authority and IPT function, and (4) to determine the extent to which state practice
authority moderates the relationship between APRN perception of professionalism and
IPT function in a national sample of APRNs in the United States. See Figures 1 and 2 for
the proposed relationships.
Figure 1. Conceptual model of proposed mediating relationships: The mediating role of perceived autonomy between state practice authority and APRN perceived IPT function.
Figure 2. Conceptual model of proposed moderating relationships: The moderating role of state practice authority between professionalism and perceived IPT function.
Research Questions
Research Question 1. Is the level of state practice authority associated with perceived
IPT function in a national sample of APRNs?
10
Research Question 2. Is the relationship between state practice authority and perception
of IPT function mediated by autonomy in a national sample of APRNs? See Figure 1.
Subquestion 2a. Is there a relationship between state practice authority and
perceived autonomy in a national sample of APRNs?
Subquestion 2b. Research question 3: Is there a relationship between perceived
autonomy and perceived IPT function in a national sample of APRNs?
Research Question 3. Is professionalism associated with perception of IPT function in a
national sample of APRNs?
Subquestion 3a. Does state practice authority moderate the relationship between
perceived professionalism and perception of IPT function in a national sample of
APRNs? See Figure 2.
Scope of the Study
Study Design
This study is a quantitative cross-sectional self-administered survey of nationally
certified APRNs from all clinical practice settings in the U.S. where an APRN license is
required for employment. Practice settings might include, inpatient or outpatient units or
departments, primary or specialty clinics, surgery or birthing centers, or clinical research
settings. The study participants consist of a national sample of nationally certified
APRNs including nurse midwives (CNMs), nurse practitioners (CNPs), clinical nurse
specialists (CNSs), and certified registered nurse anesthetists (CRNAs) who currently or
within the past year practice within an interprofessional clinical practice team for at least
six months with members of two or more professions. Six thousand email invitations
were sent to certified APRNs between March 18, 2018 and April 8, 2018 with a link to
11
participate in a structured, self-administered internet-based survey. The email addresses
were obtained through a purchased national email list from Exact Data, a private
marketing firm, that acquires data for marketing lists from various sources based on Dun
and Bradstreet records in the Business Database; all email addresses are direct contacts,
not sales or generic information (Exact Data, 2017). The list conforms to Federal Trade
Commission rules regarding email solicitation.
Study data were collected using REDCap [Research Electronic Data Capture]
(Harris et al., 2009) tools hosted at the University of New Mexico Health Sciences Center.
The statistical analyses for the study are ANOVA, correlations, multiple regression, and
path analysis. The analyses included appropriate tests of assumptions and goodness of fit
using IBM SPSS® 25.0 and IBM SPSS AMOS® 24.0.
Definitions
APRN (advanced practice registered nurse). A subset of nurses prepared with
advanced, graduate-level nursing knowledge to provide direct patient care in four roles i.e.
certified nurse-midwife (CNM), certified nurse practitioner (CNP), clinical nurse
specialist (CNS), and certified registered nurse anesthetist [CRNA] (NCSBN, 2008).
APRN state practice authority (IV). For this study, APRN practice authority is
the state’s scope of practice law or regulation under which the APRN is licensed and
practices. The level of state practice authority (restricted, reduced, full) is defined by the
state the participant indicates is the primary state of practice. See Chapter 2, Table 1 for
levels of practice authority by state. The definitions for each level are adopted and
modified for this study from the definitions by the National Council of State Boards of
Nursing APRN Advisory Committee Consensus Model (2008) as follows:
12
1. Restricted practice authority: requires direct supervision in the presence of a
licensed, physician (MD), osteopath (DO), dentist (DDS) or podiatrist with or
without a written practice agreement. For this study, this category includes
APRNs described by NCSBN as either (a) independent practice but
supervised or not specified prescribing or (b) supervised and not specified in
both practice and prescribing.
2. Reduced practice authority: requires a collaborative agreement between the
APRN and his or her medical colleague which is a written agreement that
specifies scope of practice and medical acts allowable with or without a
general supervision requirement by an MD, DO, DDS or podiatrist. For this
study, this category includes APRNs described by NCSBN as having either
(a) independent practice but with collaborative agreement for prescribing or
(b) collaborative agreement for both practice and prescribing.
3. Full practice authority: the ability for APRNs to practice with no requirement
for a written collaborative agreement, no supervision, and no conditions for
practice including the authority to prescribe medications and treatment within
the APRN’s licensure, certification, and scope of practice laws. For this study,
this category includes APRNs described by NCSBN as having both
independent practice and independent prescribing.
Autonomy (mediator). The conceptual definition of nurse autonomy is “the
ability to act according to one’s knowledge and judgment, providing nursing care within
the full scope of practice as defined by existing professional, regulatory, and
organizational rules” (Weston 2010, ¶ 3). Operationally, the participant’s scale score
13
from the Dempster Practice Behaviors Scale [DPBS] (2009) represents APRN practice
autonomy. The DPBS is a 30-item 5-point Likert scale self-report instrument designed to
measure autonomy in practice by assessing behaviors, actions, and conduct related to
practice autonomy. Subscales include readiness, empowerment, actualization, and
validation. The author has given permission to use the instrument for this study.
Interprofessional team. As defined in the Institute of Medicine’s (IOM) Report,
Health Professions Education: A Bridge to Quality, (2003), “an interdisciplinary
[interprofessional] team is composed of members from different professions and
occupations with varied and specialized knowledge, skills, and methods” (p. 54).
Members of an IPT communicate and work together as colleagues to provide quality
individualized care for patients. For this study, an interprofessional clinical practice team
is a group of two or more members from different healthcare professions (both clinical
and nonclinical) of which the APRN is a member. Examples include but are not limited
to: physician, nurse (LPN/RN), pharmacist, physical therapist, nutritionist, social worker,
and clergy who work in clinical settings.
Perception of IPT function (DV). According to TeamSTEPPS® (American
Institutes for Research, 2010) framework effective highly functional teams exhibit
behaviors that reflect trust, respect, accountability, and reliability for each member of the
team (AHRQ website, n.d.). Highly functional teams keep each member informed, adapt
to unexpected circumstances, and hold each other accountable to the goals and
expectations of both team members and the team overall.
The scale score from the TeamSTEPPS® T-TPQ for Office-Based Care
(American Institutes for Research, 2010) survey questionnaire represents the APRN’s

14
perception of his or her IPT’s function for this study. The T-TPQ is a publicly available
35-item self-report instrument that measures individual team members’ perception of
group-level team skills and behavior using a 5-point Likert scale. Core components of
teamwork measures within the T-TPQ instrument include team structure, leadership,
communication, mutual support, and situation monitoring.
Professional identity. The concept of professional identity in nursing is defined
as “a sense of oneself that is influenced by characteristics, norms, and values of the
nursing discipline, resulting in an individual thinking, acting, and feeling like a nurse”
(Godfrey & Crigger, 2017, p. 379). Since no valid/reliable instrument specifically
measuring professional identity of APRNs was available, this study employed measures
for autonomy and professionalism which are major attributes of professional identity.
Professionalism. Conceptually, professionalism is defined as the behaviors
professionals display towards their profession. For this study the operational definition of
APRN’s perception of professionalism is the total score from the Professionalism Scale
questionnaire (Hampton & Hampton, 2000). The scale measures professionalism in nurse
midwives and is an adaptation of Snizek’s (1972) modified version of the original Hall’s
Professionalism Scale. The Hampton and Hampton version of the Professionalism Scale
is a 23-item 7-point Likert scale self-report instrument designed to measure five
constructs of professionalism in midwives including belief in public service, sense of
calling, professional association, autonomy, and self-regulation. The scale has been
modified for use with APRNs for this study. Authors were unavailable for permission to
use and modify the Professional Scale for Midwives.

15
Limitations
Internal Validity
Ambiguous temporal precedence. The cross-sectional design limits the ability to
determine causality between variables because of the potential bidirectional or reciprocal
causal relationship between variables. For example, does one’s perception of
professionalism and autonomy cause negative (or positive) perception of IPT function or
vice versa? A pretest–posttest design improves on the ability to determine which is cause
and which is effect (Shadish, Cook, & Campbell, 2001, pp. 55, 392). However, the large
sample size, time constraints, and cost make pretest–posttest design impractical for this
study.
Testing. The TeamSTEPPS® program and the T-TPQ (American Institutes for
Research, 2010) have been used in some healthcare settings as a process improvement
tool. Dempster’s Practice Behaviors Scale (Dempster, 1990, 2009) has been used in
several studies involving APRNs (Bahadori & Fitzpatrick, 2009; Cajulis & Fitzpatrick,
2007; DeKeyser Ganz, Toren, & Faldon, 2016; Maylone, Ranieri, Quinn Griffin,
McNulty, & Fitzpatrick, 2011; Petersen, Keller, Way, & Borges, 2015) and the
Professionalism Scale has been used in a study of CNMs (Hampton & Hampton, 2003)
and NPs (Settersten, 1991). The possibility exists that some APRNs have had experience
with the questionnaires in their work setting or in other studies. Knowing the questions
and responses prior to the survey could influence how APRNs think they should respond
based on previous scores.
16
Construct Validity
Mono-method bias. This study uses three internet-based self-report instruments.
Instruments that have both positive and negative response questions are intended to
reduce mono-method bias.
Instrumentation. Since the instruments used in this study have been found to be
reliable and valid in measuring the constructs of interest in a variety of populations
including some APRNs and IPTs with APRN members, it is reasonable to expect that the
constructs are appropriately matched to the measures in this APRN population.
External Validity
Interaction of causal relationship with units. This study sample is a subset of
the total APRN population and might not represent the general APRN population. The
list from which this sample is obtained is an “opt-in” list where individuals choose to
participate. APRNs who are not on this list might not have the same perceptions of those
who are on the list.
Secondly, using one member-group (APRNs) to represent IPT function is less
optimal than obtaining information from multiple healthcare professionals. However, this
study’s focus is APRNs’ perception of their clinical practice team’s function and is not
measuring a team’s performance outcomes or comparing team members’ perceptions of
team function. Time constraints, access to and availability of participants, and cost are
factors in choosing to survey the APRN group over multiple professional groups that
make up IPTs.
Interaction of causal relationships with settings. This national sample is
intended to provide a diverse representation of APRNs in multiple contexts. Differences
17
between work settings such as urban vs. rural, community health centers vs. academic
treatment centers, or hospitals vs. clinics could influence the scores on the questionnaires.
Sampling errors. According to Dillman, Smyth, and Christian (2014), sampling
error occurs whenever obtaining a portion of the total population for a survey; it is
unavoidable in this study. Nonresponse error was a concern since the individuals within
the sample frame might choose not to complete the survey resulting in less than optimal
sample size. However, the sample size was adequate (N = 222) to perform all of the
analyses used in this study.
Statistical Conclusion Validity
Low statistical power. Participants might choose not to respond to the email
invitation to participate or the potential for emails to end up in spam mail exists. The
emails on the purchased list have been validated by the marketing firm as current
accurate emails. To mitigate nonresponse, Dillman et al. (2014) suggest multiple survey
methods. However, with the large sample requirement for this study, multiple survey
modes, such as the email plus direct mail, are cost prohibitive for this project.
Violated assumptions. Appropriate tests including tests for normal distribution of
interval or ratio item/scales scores and bivariate correlations and variance inflation factor
for multicollinearity were conducted to ensure assumptions were not violated (Pallant,
2013).
Human Subjects
Confidentiality. The data were collected through an anonymous electronic survey
using REDCap. Study data were collected and managed using REDCap tools hosted and

18
stored on a secure server at the University of New Mexico. The email list was not
downloaded with the survey responses from REDCap and was deleted at the end of the
data collection period (ending four weeks after the initial survey invitation was sent). The
downloaded deidentified data were stored on the coinvestigator’s password protected
computer in a private office with limited access. Raw data are stored in a file accessible
by the principle and coinvestigators on a secure server housed at the University of New
Mexico for a period of three years and then deleted.
Anonymity. No information was collected regarding participants’ personal
identifying information or specific employer.
Psychological. Potential anxiety related to survey questions exists. Participation
is voluntary and email requests to participate included an informed consent for voluntary
participation or resignation.
Assumptions
Assumption 1. The ability to practice in a manner representing the education and
training that identify with and fulfill the nurse’s professional role will support effective
IPT function resulting in better overall individual and team performance and improved
patient outcomes (Machin, Machin, & Pearson, 2012; Poghosyan & Liu, 2016; Weiland,
2015).
Assumption 2. The attainment and development of professional identity as
implied by high levels of autonomy and professionalism scores are essential for the
APRN to be a successful autonomous member of the IPT.
Assumption 3. State practice authority contributes to how an APRN perceives
their autonomy.
19
Assumption 4. State practice authority might moderate a relationship between
professionalism and IPT function.
Significance of the Study
This study examined the direct and indirect relationships of state practice
authority with perceived autonomy, professionalism, and IPT function in a national
sample of APRNs in the U.S. These relationships have not been studied in the APRN
population to date and represent a contribution to the current state of the science of
nursing knowledge regarding IPT function.
20
CHAPTER 2
CONCEPTUAL FRAMEWORK AND REVIEW OF LITERATURE
This chapter starts with an overview of the conceptual framework using identity
theories to provide a characterization of a highly functional interprofessional team (IPT).
Secondly, a review of the current research literature regarding IPT function in the
healthcare setting, advanced practice state practice authority, nurse autonomy, and
professionalism will be presented.
Conceptual Framework
This study postulates relationships between and among APRN state practice
authority and the constructs of perception of interprofessional team (IPT) function,
autonomy and professionalism [professional identity components] (See Figures 1 and 2).
The conceptual framework is supported by identity theories and the primary theory
guiding this study is professional identity theory (PIT), which is an extension of social
identity theory [SIT] (Tajfel & Turner, 1979). Professional identity theory provides the
conceptual rationale for linking perceived professional identity constructs of autonomy
and professionalism to perceived IPT function. However, professional identity theory
alone is not sufficient in explaining the potential association of distal factors (state
practice authority) to perceived autonomy, professionalism, and IPT function. As such,
the use of the PIT is augmented by the incorporation of place-identity (Proshansky et al.,
1983) used in this study as a means to explain the hypothesized relationships of state
practice authority to APRN perception of autonomy, professionalism, and IPT function.
21
Identity Theories
A formal theory of professional identity does not exist. Rather, professional
identity is an extension of social identity theory. Therefore, a brief historical background
of identity theory development is presented to clarify the relevance of professional
identity as a framework for this study.
Erik Erikson (1963) was one of the first psychodynamic theorists to explore and
define the concept of identity as a life-long developmental process influenced and shaped
by environmental (e.g., social, economic, political) factors (Skorikov & Vondracek,
2011). Erikson (1963, 1968) posited that identity is the interaction between an
individual’s social and cultural context that begins in early adolescence and continues
throughout the lifespan.
In contrast to Erikson’s psychodynamic theory which is based on Freudian
concepts, Tajfel and Turner (1979) introduced social identity theory based on the
psychosocial influences’ interaction with individuals and groups which is the foundation
for the development of professional identity theory. These theories provide insight about
how psychosocial influences interrelate with professionals, such as APRNs, in
establishing who they are, what they do, and how they fit into a professional role within
the professional diversity of interprofessional teams.
Social Identity
Social identity theorists focus on identity as categories, collective self, groups and
intergroup processes (Bothma, Lloyd, & Khapova, 2015). Tajfel and Turner (1979)
viewed the concept of identity through a psychosocial lens by exploring the interrelations
of social factors (prejudice, privilege, and competition) and individual thought and
22
behavior within and between groups. In-group relations not only reflect individuals’
perception of self but also how the individual integrates into a group and how the group
perceives the individual. Social identity theory [SIT] expands on in-group dynamics
(relationships and interactions with members of the same group) to include attitudes and
relationships of in-groups toward members of other groups (out-groups). Typical
examples of in-group-out-group relationships in social identity literature include the
differences and conflicts between medicine and nursing. Using SIT as a framework to
explain classification (labeling) differences between individuals, Turner (1982)
introduced the concept of self-categorization which considers how individuals embrace
group beliefs, values, and behaviors of the in-group while separating themselves from the
out-group. Consequently, groups become hierarchical in nature whereby individuals
strive to become part of the highest-level group through discrimination, stereotyping, and
possibly hostile behaviors (Bothma et al., 2015). Accordingly, group members adopt not
only a sense of belonging but also develop a sense of pride and prestige as they perceive
themselves as a member of an elite in-group with a higher social status than that of the
out-group(s). In-group-out-group behaviors in a diverse environment, such as the IPT,
might be a factor in both individual member performance and IPT function overall.
Professional Identity
Professional identity relates to how an individual perceives self as a professional
in a professional role. The professional self is a combination of both the individual’s
moral-ethical characteristics (social and environmental influences) and educational
preparation (social and professional influences) during which time the individual gains
role definition, knowledge, and responsibility (Cardoso, Batista, & Graça, 2014). This
23
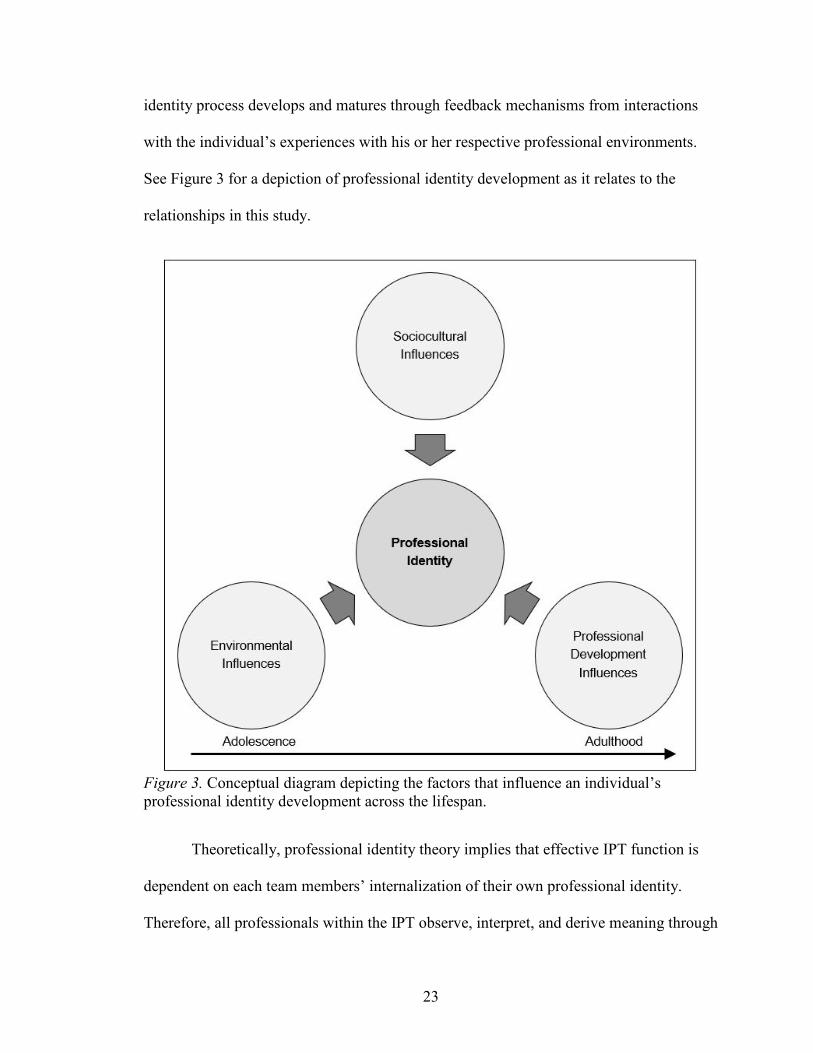
identity process develops and matures through feedback mechanisms from interactions
with the individual’s experiences with his or her respective professional environments.
See Figure 3 for a depiction of professional identity development as it relates to the
relationships in this study.
Figure 3. Conceptual diagram depicting the factors that influence an individual’s professional identity development across the lifespan.
Theoretically, professional identity theory implies that effective IPT function is
dependent on each team members’ internalization of their own professional identity.
Therefore, all professionals within the IPT observe, interpret, and derive meaning through
24
a professional lens that constitutes a professional worldview. Thus, IPT members will
perceive their team’s function through their respective professional lens which suggests a
link between perception of IPT function and professional identity (autonomy and
professionalism). For example, APRN autonomy, as a component of professional identity,
implies that the APRN has the knowledge and skill to do a job within a specific
professional scope. If regulatory practice authority restricts autonomy, a conflict between
what the APRN expects to do and actually does within the IPT might exist, which in turn
might drive how the APRN interprets the IPT experience.
Moreover, for teams to function at the highest level, team members need to have
knowledge and understanding of the work-related responsibilities of others on their team
(Almost & Laschinger, 2002; Anonson et al., 2009). Based on social identity theory
(Tajfel & Turner, 1979), professional identity development is a key driver in the ability to
differentiate between the professional role and responsibilities of one’s self and other IPT
members.
In the context of IPTs as a social group, APRNs’ contribute knowledge and
expertise to the team’s function as a unique professional who is different from others on
the IPT. According to identity theorists, individuals attach meaning to themselves to
define who they are and what they do in the workplace through personal attributes, social
group membership, and work roles (Ashforth, Harrison, & Corley, 2008). Fundamentally,
professional identity shapes behaviors, attitudes, and emotions in the context of the
professional’s work (Siebert & Siebert, 2005). Professional identity is a combination of
how one sees oneself and the social self where the individual identifies with a
professional group with common attitudes and goals (Caza & Creary, 2016). One way
25
individuals learn role definition and expectations is through interactions with other
members in the same group. (Caza & Creary, 2016; Tajfel & Turner, 1979). Therefore,
fulfilling the professional group’s expectations and constructing one’s professional
identity gives meaning to the role and associated group. Consequently, doing meaningful
work (a purpose in life) is analogous to having a sense of well-being, value, and worth in
society, i.e., a meaningful life (Tajfel & Turner, 1979). Therefore, as emphasized in this
discussion thus far, socialization is important in forming professional identity and
professional identity is important in meaningful work, which in turn is fundamental for
highly functional IPTs.
Professional identity construction and nursing. The development of
professional identity in all professions begins with the education and socialization
processes within the profession and continues to evolve throughout the professional’s
career (Godfrey & Crigger, 2017). APRN professional identity is based on the
longstanding principles, practice standards, and ethics of nursing (American Nurses
Association [ANA], 2015). Professional identity development represents both the
individual (self) and the collective (nursing profession) dimensions of the concept of
identity and characterizes two stages of identity, the development and professional stages
(Cardoso et al., 2014). Crigger & Godfrey (2014) emphasize that both psychological
paradigms, referring to character-building and being and social paradigms, referring to
socialization and doing, must be present to establish an individual’s professional identity.
For the profession of nursing, academic nursing programs are responsible for initiating
the socialization of nursing students into the profession. The student nurse becomes
familiar with the philosophy, values, ethics, mores, rules, and expectations associated
26
with being and acting as a nurse. During the initial stage, the student experiences the act
of being a nursing professional through didactic as well as clinical encounters so that at
the time of entry into the workforce the transition from student to professional is achieved.
This process of indoctrination is foundational in the development of professional identity.
APRNs begin the journey of new professional identity formation with the entry
into an APRN program (development stage) where the foundations of nursing philosophy
are reintroduced and explored and the APRN renews the association of self with the
profession at a higher level with new knowledge and new skills (Cardoso et al., 2014;
Crigger & Godfrey, 2014; Godfrey & Crigger, 2017). The professional stage builds on
the philosophical foundations of nursing and professional identity continues to mature as
the APRN enhances both individual identity (values, beliefs, independent thinking, and
decision-making), and social identity (social skills: group interaction, collaboration, and
communication with others) necessary to work in an interprofessional environment. As a
nurse transitions to the APRN role, a new identity begins to form while retaining the
original nursing identity. According to identity theorists, this transition is a critical point
at which a conflict between nurse and APRN identity occurs and as the conflict is
resolved, the APRN’s professional identity emerges and begins to develop (development
stage) and mature (professional stage). Essentially, the cycle of professional identity
development begins each time a change in jobs, roles, status, or events takes place
throughout the course of one’s nursing career (Schwartz et al., 2013). Literature has
mainly focused on the development stage of nurses’ professional identity. This study’s
focus is the professional stage of APRN professional identity which includes autonomy
and professionalism.
27
As described thus far, APRNs’ values, beliefs, and identities are the result of
socialization into the profession of nursing and continue to evolve in a transformative
process as the APRN experiences changes throughout his or her career. Individual factors
that contribute to professional identity development include new role responsibilities and
conflicts between self-expectations as a professional and what others allow or expect.
Environmental factors include laws, regulations, rules, and organizational and group
practice settings contribute to individuals’ perception of professional identity. Social
factors such as sociocultural influences and individual factors such as interpersonal and
interprofessional relationships and interactions also contribute to individuals’ perception
of professional identity and professionalism throughout one’s career. The goal for the
APRN is to successfully fulfill the expectations of self, the nursing profession, and
society as a knowledgeable, qualified, competent autonomous professional. Professional
identity theory implies that achievement of such a goal relies not only on the APRN’s
ability to identify with the role, but also to do the work for which he or she is trained to
do.
Place-Identity
Place-identity extends self-identity by considering the environmental aspects that
contribute to identity development. Place-identity is derived from self-theory which
explains not only the process by which one distinguishes oneself from others, but also
how objects, things, spaces, and places relate to and are different from the individual self
(Proshansky et al., 1983). Proshansky et al. describe Place-identity as a substructure of
self-identity that consists of broadly conceived cognitions that represent memories, ideas,
28
feelings, attitudes, values, preferences, meanings, and conceptions of behaviors and
experience associated with physical settings in individuals’ day-to-day existence.
In conjunction with the past physical setting (environmental past), interactions
with others shape an individual’s place-identity and, essentially, self-identity. These
identities are subject to changes that influence day-to-day experiences and life-style,
including work-life. Theoretical assumptions of place-identity include a sense of
belonging and purpose and a sense of rootedness or centeredness giving meaning to life
through a process of engenderment and attachment to geographically locatable places. In
other words, individuals develop attachments to places such as birth-places or associated
places of growing-up years that are retained throughout the life-cycle.
In this study place identity helps to explain how environmental factors such as
state practice authority relate to an APRN’s perception of autonomy, professionalism,
and IPT function. Place identity implies that the IPT is an environment that reflects each
member’s sense of belonging and his or her perception and conception of the team’s
importance in the context of work. Highly functional IPTs depend on each member’s
optimal performance to achieve the team’s goals and expectations to deliver high-quality
care. Place identity implies that an APRN’s perception of how an IPT functions could be
influenced by experiences with environments during training (classroom and clinical
environments) or past and present employment settings which could include the state
regulatory environments of practice authority.
Summary
Obvious similarities exist between the identity theories described herein. These
theories, including place-identity, explain the sociocultural and environmental contexts
29
within the developmental processes of individuals’ ability to achieve successful, fulfilling
lives (both private and professional) throughout the life span. Although no universal
theoretical framework for professional identity exists, the extant literature, as described in
this paper, reflects models and concepts that contribute to our understanding of the
fundamentals of professional identity development and its relationship to work
environments. Studies among nursing students’ professional identity formation and
transition to practice are becoming more prevalent. However, empirical research is
limited on the professional stage of identity development and the relationship of
professional identity with APRN nursing practice and practice environments (Godfrey &
Crigger, 2017). This study seeks to contribute to bridging this gap in nursing research.
Environmentally, the concept of “place” incorporates not only physical ties but
also emotional ties that influence the ability for professionals to fulfill their respective
roles in the professional arena and society. Place-theory as described by Proshansky et al.
(1983) implies that APRNs who experience regulatory restrictions on scope of practice
that inhibit the ability to perform in a manner by which he or she has been educated and
professionally socialized will experience self-identity uncertainty and therefore,
professional identity uncertainty. Consequently, the APRN’s perception of professional
identity (autonomy and professionalism) and IPT function will likely be different from
APRNs who practice in less restrictive regulatory environments.
Traditionally, identity theorists mainly focused on the individual self and the
profession, and not on the environmental factors regarding professional identity
development. This study intends to address this gap by examining the links between
APRN practice environments (state practice authority), APRN perception of autonomy
30
and professionalism as dimensions of professional identity, and perception of IPT
function using both professional identity and place-identity as a framework.
Literature Review
Interprofessional Team Function
The existing research literature about IPTs includes a broad range of professions.
Studies about team structure and function include management and organizational
disciplines, aviation, construction and engineering, education, and healthcare. In the
healthcare literature the study of IPTs continues to be a focus of researchers to help
inform improvements in care delivery related to quality, patient outcomes, efficiencies,
and cost. Studies suggest interprofessional collaboration, communication, and
organizational support of autonomous practice are associated with highly functional
teams (Almost & Laschinger, 2002; Apker, Propp, & Zabava Ford, 2005; Fagermoen,
1997). The 2001 IOM report, Crossing the Quality Chasm, emphasized the need to
improve care delivery. The report discussed the use of multidisciplinary teams and the
challenges regarding regulating practice authority and overlapping roles. Yet, little is
known about the environmental factors such as state regulation on practice authority that
could influence how IPTs function. To address this gap, this study examined the direct
and indirect relationships of environmental factors, i.e., state practice authority, with
APRN perception of autonomy, professionalism, and IPT function.
IPTs, environments, and team behavior. Studies have indicated that highly
functional teams exhibit superior communication skills, share knowledge and information,
can resolve conflicts, and recognize and respect member roles which ultimately results in
better overall team function, less job strain, and improved patient care outcomes. Studies
31
connect external environmental factors to how teams function. For example, using a
cross-sectional nonexperimental study, Almost and Laschinger (2002) surveyed 63 acute
care and 54 primary care NPs from Ontario, Canada regarding their perceptions of access
to work empowerment (information, support, resources, and opportunity). Out of a
possible range of 4 to 20, total empowerment scores for ACNPs (M = 12.89, SD = 2.53)
and PCNPs (M = 14.71, SD = 1.95) were moderately high. The overall consensus among
NPs was that structural empowerment enhances collaboration with both managers and
physicians. NPs in their study perceived a higher degree of trust, respect, autonomy,
shared decision-making, and better communication as contributors to effectiveness in
their work setting. Thus, NPs in their study experienced less job strain and expressed
similar characteristics found in highly functional IPTs. Although Almost and
Laschinger’s study did not specifically examine the relationships proposed in this study,
i.e., perceptions of autonomy, professionalism, or IPT function, it does reflect how the
individual APRN perceptions of the work environment, and autonomy in particular,
relate to IPT function.
Another study by Anonson et al., (2009) used grounded theory and interviewed 24
IPT professionals from acute care and community-based settings to determine the
competencies involved in effective IPT collaborative team practice. The participants in
their study felt that shared-leadership within the team was an essential component for
effective IPT practice and optimal patient care. They identified self-regulation of team
function, willingness to accept leadership roles, and advocacy for team practice as
contributors to team effectiveness. The participants also indicated that trust, respect, and
communication that includes all team members are important aspects of IPT function
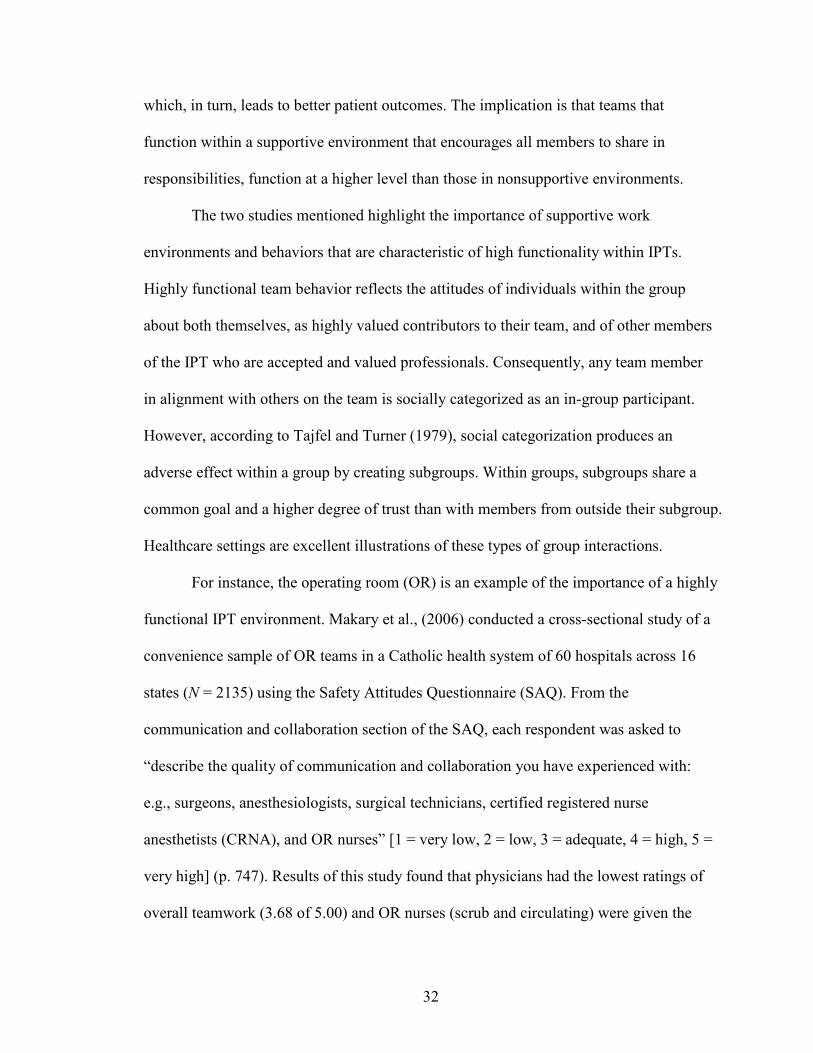
32
which, in turn, leads to better patient outcomes. The implication is that teams that
function within a supportive environment that encourages all members to share in
responsibilities, function at a higher level than those in nonsupportive environments.
The two studies mentioned highlight the importance of supportive work
environments and behaviors that are characteristic of high functionality within IPTs.
Highly functional team behavior reflects the attitudes of individuals within the group
about both themselves, as highly valued contributors to their team, and of other members
of the IPT who are accepted and valued professionals. Consequently, any team member
in alignment with others on the team is socially categorized as an in-group participant.
However, according to Tajfel and Turner (1979), social categorization produces an
adverse effect within a group by creating subgroups. Within groups, subgroups share a
common goal and a higher degree of trust than with members from outside their subgroup.
Healthcare settings are excellent illustrations of these types of group interactions.
For instance, the operating room (OR) is an example of the importance of a highly
functional IPT environment. Makary et al., (2006) conducted a cross-sectional study of a
convenience sample of OR teams in a Catholic health system of 60 hospitals across 16
states (N = 2135) using the Safety Attitudes Questionnaire (SAQ). From the
communication and collaboration section of the SAQ, each respondent was asked to
“describe the quality of communication and collaboration you have experienced with:
e.g., surgeons, anesthesiologists, surgical technicians, certified registered nurse
anesthetists (CRNA), and OR nurses” [1 = very low, 2 = low, 3 = adequate, 4 = high, 5 =
very high] (p. 747). Results of this study found that physicians had the lowest ratings of
overall teamwork (3.68 of 5.00) and OR nurses (scrub and circulating) were given the

33
highest ratings of teamwork (4.20 of 5.00). Additionally, each group rated their peer
group teamwork higher than they rated other groups and overall teamwork. This study
points out how the social and professional identity aspect of teams’ members plays an
integral part in the behaviors of team members towards each other and could contribute to
overall team function.
Other studies have examined the complexity of team behavior and how diversity
can influence how team members perceive themselves and others on the team, a concept
known as professional identity salience (Mitchell & Boyle, 2015). Mitchell and Boyle
point out that social categorization produces both negative and positive effects on the
diversity within groups and leads to team innovation and a willingness to acquire another
point of view. In their cross-sectional study surveys were distributed to 301 members of
70 IPTs and their team leaders across an assortment of healthcare organizations in the UK.
Team members consisted of nurses (51%), physicians (10.5%), and the remaining 38.5%
was comprised of paramedical professionals, biomedical scientists, welfare workers,
pharmacists, dieticians, psychologists, dentists, occupational and physiotherapists,
podiatrists, opticians, and radiographers. Team leaders mainly consisted of nurses (53%)
and physicians (14%). Aspects of team function measured included, professional
diversity (IV), professional identity salience [mediator] (the individual’s ability to self-
categorize, recognize and categorize others, and distinguish self from others), open-
mindedness norms (moderator), and team innovation (DV) with team size and team
tenure as control variables. Mitchell and Boyle applied structural equation modeling
techniques (similar to analysis proposed for this study), which was helpful in determining
that professional salience was positively and significantly associated with innovation
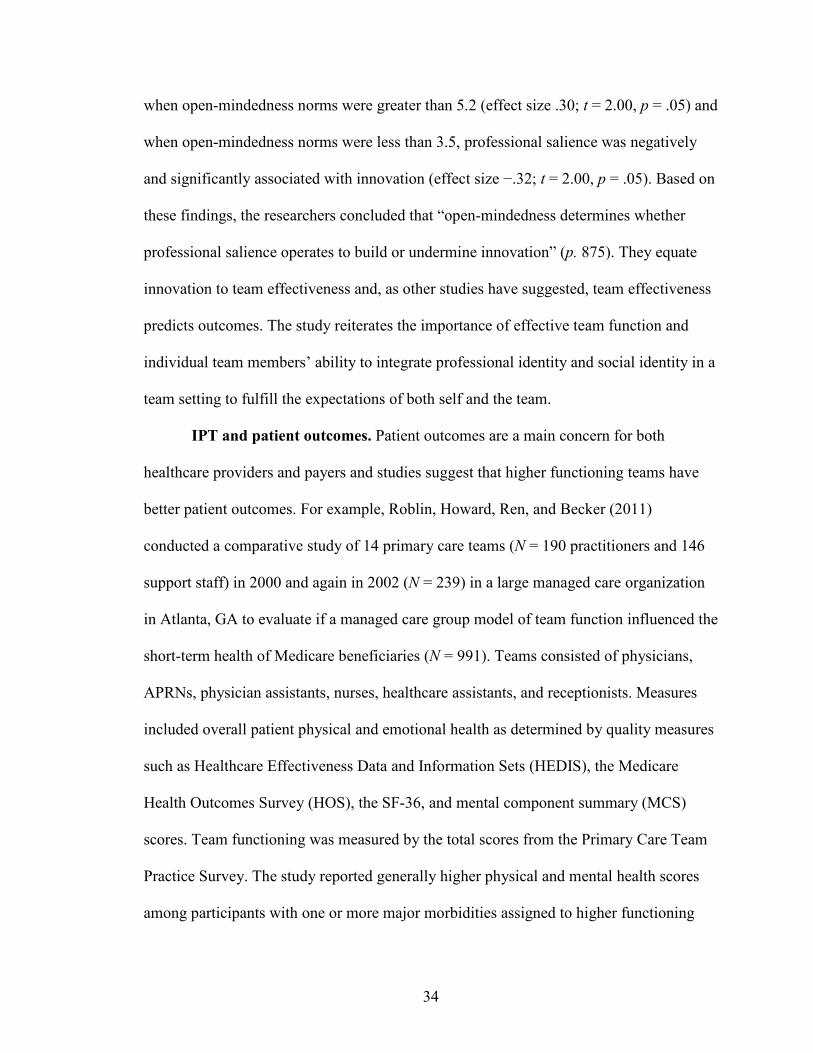
34
when open-mindedness norms were greater than 5.2 (effect size .30; t = 2.00, p = .05) and
when open-mindedness norms were less than 3.5, professional salience was negatively
and significantly associated with innovation (effect size −.32; t = 2.00, p = .05). Based on
these findings, the researchers concluded that “open-mindedness determines whether
professional salience operates to build or undermine innovation” (p. 875). They equate
innovation to team effectiveness and, as other studies have suggested, team effectiveness
predicts outcomes. The study reiterates the importance of effective team function and
individual team members’ ability to integrate professional identity and social identity in a
team setting to fulfill the expectations of both self and the team.
IPT and patient outcomes. Patient outcomes are a main concern for both
healthcare providers and payers and studies suggest that higher functioning teams have
better patient outcomes. For example, Roblin, Howard, Ren, and Becker (2011)
conducted a comparative study of 14 primary care teams (N = 190 practitioners and 146
support staff) in 2000 and again in 2002 (N = 239) in a large managed care organization
in Atlanta, GA to evaluate if a managed care group model of team function influenced the
short-term health of Medicare beneficiaries (N = 991). Teams consisted of physicians,
APRNs, physician assistants, nurses, healthcare assistants, and receptionists. Measures
included overall patient physical and emotional health as determined by quality measures
such as Healthcare Effectiveness Data and Information Sets (HEDIS), the Medicare
Health Outcomes Survey (HOS), the SF-36, and mental component summary (MCS)
scores. Team functioning was measured by the total scores from the Primary Care Team
Practice Survey. The study reported generally higher physical and mental health scores
among participants with one or more major morbidities assigned to higher functioning
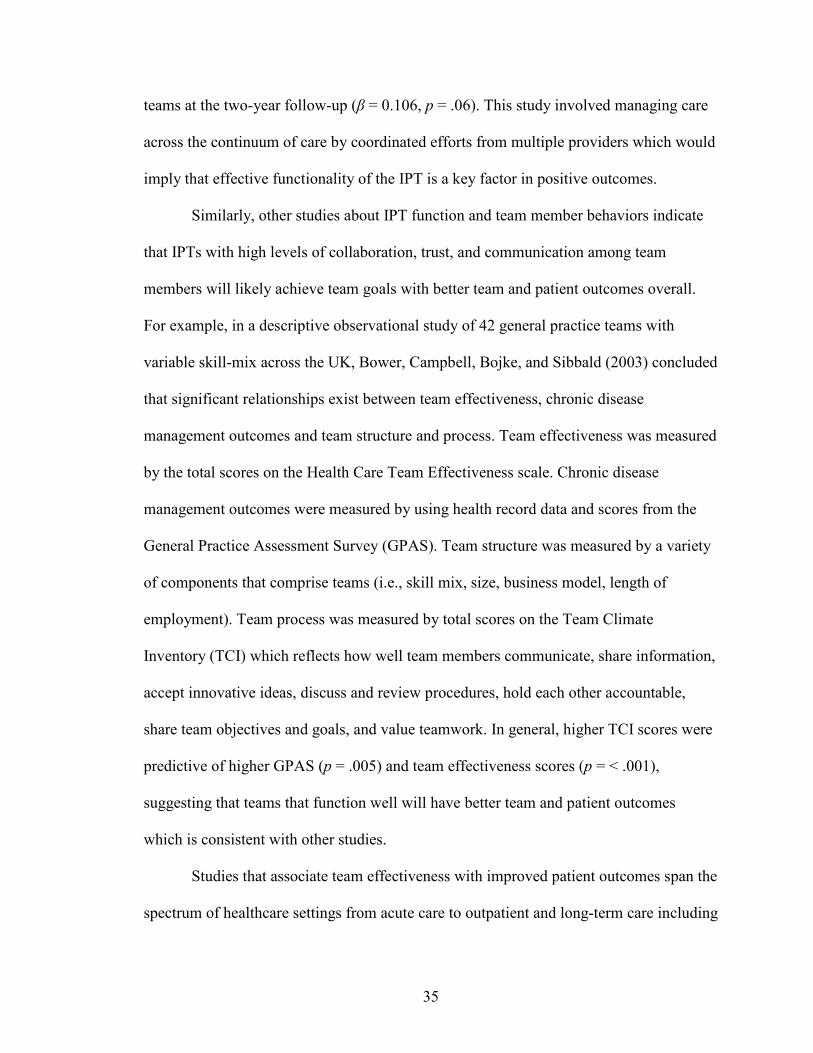
35
teams at the two-year follow-up (β = 0.106, p = .06). This study involved managing care
across the continuum of care by coordinated efforts from multiple providers which would
imply that effective functionality of the IPT is a key factor in positive outcomes.
Similarly, other studies about IPT function and team member behaviors indicate
that IPTs with high levels of collaboration, trust, and communication among team
members will likely achieve team goals with better team and patient outcomes overall.
For example, in a descriptive observational study of 42 general practice teams with
variable skill-mix across the UK, Bower, Campbell, Bojke, and Sibbald (2003) concluded
that significant relationships exist between team effectiveness, chronic disease
management outcomes and team structure and process. Team effectiveness was measured
by the total scores on the Health Care Team Effectiveness scale. Chronic disease
management outcomes were measured by using health record data and scores from the
General Practice Assessment Survey (GPAS). Team structure was measured by a variety
of components that comprise teams (i.e., skill mix, size, business model, length of
employment). Team process was measured by total scores on the Team Climate
Inventory (TCI) which reflects how well team members communicate, share information,
accept innovative ideas, discuss and review procedures, hold each other accountable,
share team objectives and goals, and value teamwork. In general, higher TCI scores were
predictive of higher GPAS (p = .005) and team effectiveness scores (p = < .001),
suggesting that teams that function well will have better team and patient outcomes
which is consistent with other studies.
Studies that associate team effectiveness with improved patient outcomes span the
spectrum of healthcare settings from acute care to outpatient and long-term care including

36
federal institutions. For example, Strasser et al. (2005) conducted a prospective
observational study of 50 IPTs that treated stroke patients at VA inpatient rehabilitation
units across the U.S. Interprofessional teams consisted of rehabilitation physicians, nurses,
occupational and physical therapists, social workers, and speech-language pathologists.
Team function was measured using four scales for team relations, six scales for team
actions, and two scales for organizational context related to team function. Outcomes
included (a) patients’ functional assessment as determined by a staff assessment tool that
measures motor and cognitive functions, and (b) discharge to home and length of stay
data obtained from healthcare records. The researchers reported three of the ten team
functioning measures were significantly associated with patient functional improvement
and team effectiveness was associated with length of stay (p < .05).
TeamSTEPPS® T-TPQ. The measure for IPT function for this study is the
TeamSTEPPS® T-TPQ for Office-Based Care questionnaire that was revised from the
original T-TPQ developed through a collaborative effort between the U.S. Department of
Defense and Agency for Healthcare Research and Quality (AHRQ) for use in acute care
in 2006 (American Institutes for Research, 2010). The T-TPQ was developed to measure
the individual team member’s perception of group-level teamwork skills within a given
medical work setting using five core dimensions i.e., team structure, leadership, situation
monitoring, mutual support, and communication. The T-TPQ has been shown to be an
excellent measure for team function. Keebler et al. (2014) conducted a confirmatory
factor analysis using data from 1,700 U.S. Army medical facility IPT staff who
completed the T-TPQ questionnaire. Keebler concluded that all five dimensions are
important and independent components for measuring individual perceptions of
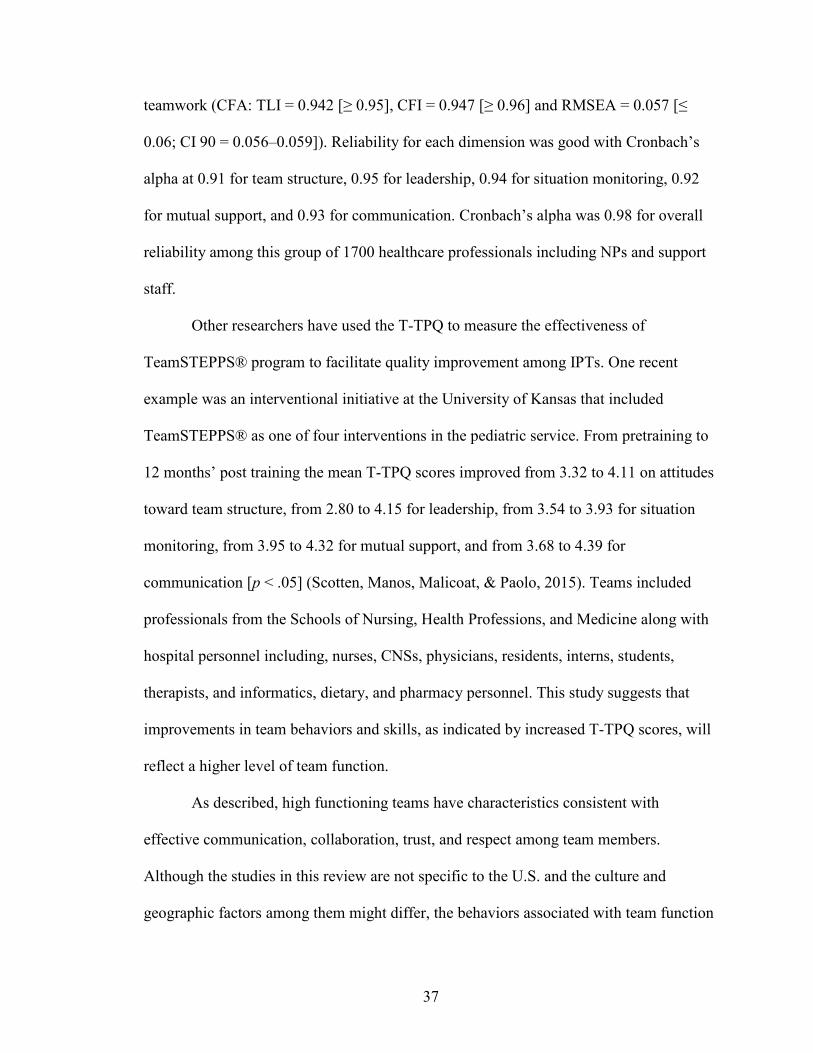
37
teamwork (CFA: TLI = 0.942 [≥ 0.95], CFI = 0.947 [≥ 0.96] and RMSEA = 0.057 [≤
0.06; CI 90 = 0.056–0.059]). Reliability for each dimension was good with Cronbach’s
alpha at 0.91 for team structure, 0.95 for leadership, 0.94 for situation monitoring, 0.92
for mutual support, and 0.93 for communication. Cronbach’s alpha was 0.98 for overall
reliability among this group of 1700 healthcare professionals including NPs and support
staff.
Other researchers have used the T-TPQ to measure the effectiveness of
TeamSTEPPS® program to facilitate quality improvement among IPTs. One recent
example was an interventional initiative at the University of Kansas that included
TeamSTEPPS® as one of four interventions in the pediatric service. From pretraining to
12 months’ post training the mean T-TPQ scores improved from 3.32 to 4.11 on attitudes
toward team structure, from 2.80 to 4.15 for leadership, from 3.54 to 3.93 for situation
monitoring, from 3.95 to 4.32 for mutual support, and from 3.68 to 4.39 for
communication [p < .05] (Scotten, Manos, Malicoat, & Paolo, 2015). Teams included
professionals from the Schools of Nursing, Health Professions, and Medicine along with
hospital personnel including, nurses, CNSs, physicians, residents, interns, students,
therapists, and informatics, dietary, and pharmacy personnel. This study suggests that
improvements in team behaviors and skills, as indicated by increased T-TPQ scores, will
reflect a higher level of team function.
As described, high functioning teams have characteristics consistent with
effective communication, collaboration, trust, and respect among team members.
Although the studies in this review are not specific to the U.S. and the culture and
geographic factors among them might differ, the behaviors associated with team function

38
(communication, collaboration, trust, and respect) are universal. Additionally,
environments that support these behaviors also contribute to improved team effectiveness
that, in turn, improves patient outcomes. Although the studies described thus far suggest
that highly functional teams are associated with better team effectiveness and better
patient outcomes in a variety of settings, further studies are needed to explore additional
factors. For example, environmental factors such as state practice authority and
individual level factors including autonomy, and professionalism might contribute to how
IPTs function. This study addresses this gap by examining the possible direct and indirect
relationships that exist between state practice authority and APRN perception of
autonomy, professionalism, and IPT function.
States’ Practice Authority
This section discusses state practice authority, as a possible contributor to APRN
perception of autonomy, professionalism, and IPT function. The literature suggests that
excessive rules and regulations impose a threat to APRN autonomy as shown by low
empowerment scores in studies by Bahadori and Fitzpatrick, (2009) and Petersen et al.
(2015). Additionally, the inconsistent language across states that describes APRN scope
of practice in legislative and organizational laws, rules, and regulations potentially
contributes to APRN practice authority ambiguity among IPT members. However, the
relationship between practice authority and how APRNs perceive their autonomy and IPT
function is unclear. As indicated in the study by Petersen et al., APRNs with less
oversight reported greater levels of autonomy. Therefore, it is conceivable that the
relationship between state practice authority and IPT function could be mediated by
APRNs’ perception of autonomy, which is one focus of this study.

39
Although APRNs, themselves, are often familiar with their respective state laws
regulating practice, other professional colleagues and IPT members may lack such
knowledge. Hence, it is plausible that this lack of knowledge affects team functioning.
However, the hypothesis is yet to be tested.
State regulatory and legislative language pertaining to APRN practice authority
include license to practice, certificate of recognition, approval to practice, authority to
practice, recognition, and certification or license with prescriptive privileges or
prescriptive authority (NCSBN, 2017). Further adding to the confusion is the
inconsistency among which regulatory agencies oversee practice authority within each
state; in some states, a board of nursing regulates APRN practice, in other states, the
Department of Health or the Board of Medicine regulates APRN practice. Some states
require an additional oversight from a Board of Pharmacy. Some states limit APRN
practice authority to specific APRN groups such as nurse practitioners (NPs), certified
registered nurse anesthetists (CRNAs), and certified nurse midwives (CNMs), but
exclude clinical nurse specialists (CNSs) i.e., not specifying “CNS” in the descriptions of
APRN or not providing legislative language for prescriptive authority.
As of September 2017, nineteen states and the District of Columbia have enacted
legislation for APRN full practice authority (independent) for one more APRN types.
Twenty-nine states have reduced or restricted practice authority for one or more of the
four APRN categories and one state does not specify any scope of practice authority
(NCSBN website, 2017) as shown in Table 1. Full practice authority does not necessarily
mean the APRN has prescriptive authority.
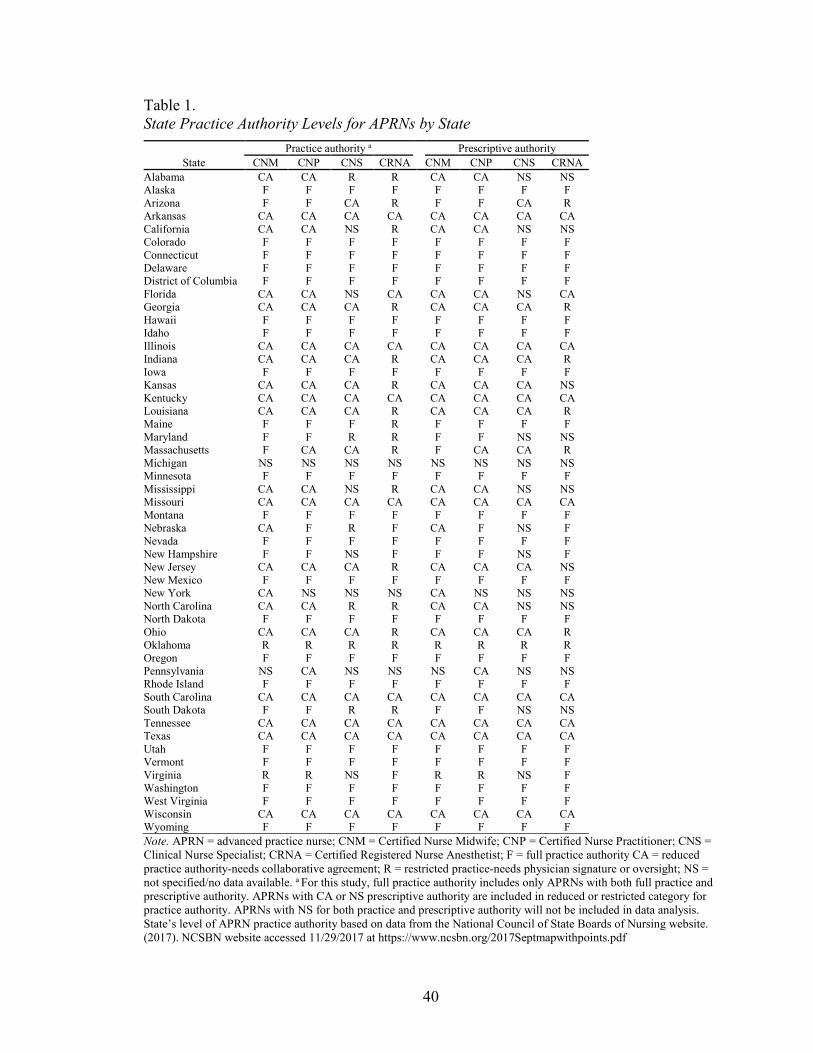
40
Table 1. State Practice Authority Levels for APRNs by State
State Practice authority a Prescriptive authority
CNM CNP CNS CRNA CNM CNP CNS CRNA Alabama CA CA R R CA CA NS NS Alaska F F F F F F F F Arizona F F CA R F F CA R Arkansas CA CA CA CA CA CA CA CA California CA CA NS R CA CA NS NS Colorado F F F F F F F F Connecticut F F F F F F F F Delaware F F F F F F F F District of Columbia F F F F F F F F Florida CA CA NS CA CA CA NS CA Georgia CA CA CA R CA CA CA R Hawaii F F F F F F F F Idaho F F F F F F F F Illinois CA CA CA CA CA CA CA CA Indiana CA CA CA R CA CA CA R Iowa F F F F F F F F Kansas CA CA CA R CA CA CA NS Kentucky CA CA CA CA CA CA CA CA Louisiana CA CA CA R CA CA CA R Maine F F F R F F F F Maryland F F R R F F NS NS Massachusetts F CA CA R F CA CA R Michigan NS NS NS NS NS NS NS NS Minnesota F F F F F F F F Mississippi CA CA NS R CA CA NS NS Missouri CA CA CA CA CA CA CA CA Montana F F F F F F F F Nebraska CA F R F CA F NS F Nevada F F F F F F F F New Hampshire F F NS F F F NS F New Jersey CA CA CA R CA CA CA NS New Mexico F F F F F F F F New York CA NS NS NS CA NS NS NS North Carolina CA CA R R CA CA NS NS North Dakota F F F F F F F F Ohio CA CA CA R CA CA CA R Oklahoma R R R R R R R R Oregon F F F F F F F F Pennsylvania NS CA NS NS NS CA NS NS Rhode Island F F F F F F F F South Carolina CA CA CA CA CA CA CA CA South Dakota F F R R F F NS NS Tennessee CA CA CA CA CA CA CA CA Texas CA CA CA CA CA CA CA CA Utah F F F F F F F F Vermont F F F F F F F F Virginia R R NS F R R NS F Washington F F F F F F F F West Virginia F F F F F F F F Wisconsin CA CA CA CA CA CA CA CA Wyoming F F F F F F F F Note. APRN = advanced practice nurse; CNM = Certified Nurse Midwife; CNP = Certified Nurse Practitioner; CNS = Clinical Nurse Specialist; CRNA = Certified Registered Nurse Anesthetist; F = full practice authority CA = reduced practice authority-needs collaborative agreement; R = restricted practice-needs physician signature or oversight; NS = not specified/no data available. a For this study, full practice authority includes only APRNs with both full practice and prescriptive authority. APRNs with CA or NS prescriptive authority are included in reduced or restricted category for practice authority. APRNs with NS for both practice and prescriptive authority will not be included in data analysis. State’s level of APRN practice authority based on data from the National Council of State Boards of Nursing website. (2017). NCSBN website accessed 11/29/2017 at https://www.ncsbn.org/2017Septmapwithpoints.pdf
41
The NCSBN website uses the terms independent, not-independent, and
prescriptive authority to identify each level of practice authority. However, some
controversy exists among the healthcare professions regarding the term “independent”
practitioner; the term misrepresents the nursing profession as isolationist and not
collaborative with other healthcare professions such as medicine. For clarity, this study
will define the three state APRN practice authority levels as follows:
1. Restricted practice authority: requires direct supervision in the presence of a
licensed, physician (MD), osteopath (DO), dentist (DDS) or podiatrist with or
without a written practice agreement. For this study, this category includes
APRNs described by NCSBN as either (a) independent practice but
supervised or not specified for prescribing or (b) supervised and not specified
in both practice and prescribing.
2. Reduced practice authority: requires a collaborative agreement between the
APRN and his or her medical colleague which is a written agreement that
specifies scope of practice and medical acts allowable with or without a
general supervision requirement by an MD, DO, DDS or podiatrist. For this
study, this category includes APRNs described by NCSBN as having either
(a) independent practice but with collaborative agreement for prescribing or
(b) collaborative agreement for both practice and prescribing.
3. Full practice authority: the ability for APRNs to practice with no requirement
for a written collaborative agreement, no supervision, and no conditions for
practice including the authority to prescribe medications and treatment within
the APRN’s licensure, certification, and scope of practice laws. For this study,
42
this category includes APRNs described by NCSBN as having both
independent practice and independent prescribing.
All practice levels in all states require APRNs, like physicians, to have current
state licensure as an APRN in a specific area or population of practice such as family,
acute care, primary care, adult/gerontology, pediatric, or psychiatric, among others.
However, the difference is such that laws and regulations regarding physicians’ licensure
enable a physician to practice in any state without restriction once licensure is obtained in
the state of practice. Since state-to-state regulation is not consistent for APRNs, this
disparity between medical and APRN regulatory practice authority standards suggests a
barrier to practice for APRNs and an opportunity to study the relationships that state
practice authority environments have with APRN perceived autonomy, professionalism,
and IPT function. No studies were found that examined the relationships of state practice
authority with APRN perception of IPT function.
Autonomy
This study proposed that a relationship exists between an APRN’s perception of
autonomy and IPT function. Conceptually, practice autonomy refers to a state of being
independent, free, and self-directing (Dempster, 1990), and the ability to exercise well-
thought-out independent judgment and discretionary decision-making within one’s scope
of practice (Batey & Lewis, 1982; Keenan, 1999; Weston, 2010). In conjunction with
scope of practice, autonomy is an important aspect of APRN practice. For example, Piil,
Kolbaek, Ottmann, and Rasmussen (2012) conducted a case study to examine the
perceptions of five APRNs in Denmark regarding professional identity in their role as
APRNs in expanded nursing practice. NPs in their study verbalized a higher degree of

43
autonomy in decision-making when associated with consultations. Consultations are
considered an autonomous skill and highly valued among this group of NPs. Likewise,
NPs in other studies, discussed in the next sections, indicate high levels of autonomy.
Therefore, it would be reasonable to consider that autonomous practice is a necessary
characteristic of APRN team members that contributes to the functionality of an IPT.
Among APRNs, nurse practitioners are the largest and most publicly recognizable
group. Consequently, studies of APRN autonomy tend to be focused on the NP group.
Furthermore, NPs generally report high levels of autonomy. However, it is not clear
whether the other three groups of APRNs i.e., CNMs, CNSs, and CRNAs perceive the
same high levels of autonomy as their NP colleagues and few studies include all four
groups of APRNs in sampling. To address this gap, this study examined perception of
autonomy, professionalism, and IPT function in a sample of all APRNs.
Studies that used the Dempster Practice Behavior Scale (DPBS). The DPBS
has been used in multiple studies involving advanced practice autonomy and is the
instrument of choice for this study. One such study by Bahadori and Fitzpatrick (2009)
reported high levels of autonomy using the DPBS in their descriptive study of 48 primary
care nurse practitioners (PCNPs) who attended a clinical conference in Florida. Among
the subscales of the DPBS (readiness, actualization, empowerment, and validation),
PCNPs in the study reported high levels of autonomy (M = 127.19, SD = 10.25; range
105–146) overall. Additionally, NPs reported high levels of readiness (M = 46.42, SD =
4.85) and valuation (M = 14.08, SD = 1.41) related to autonomy, indicating they feel
competent and knowledgeable in decision-making ability and value their worth. The low
level of empowerment (M = 25.08, SD = 4.23) regarding autonomy could be a reflection

44
of the state level restrictions on practice authority, indicating a need to investigate the
relationships between regulatory environments and IPT function. To address this gap, this
study examined the proposed mediating relationship of autonomy with state practice
authority and IPT function.
Another descriptive correlational study by Petersen et al., (2015) described
APRNs in New Mexico (N = 259), including NPs, CNSs, and CRNAs, having high levels
of autonomy using the DPBS. The researchers indicate that physician oversight
significantly relates to autonomy (t (250) = 3.48, p = .001) and APRNs with no physician
oversight report higher levels of autonomy. This is a significant finding; the study implies
that APRN practice authority that is regulated by physicians in a state with full practice
authority for APRNs is a limiting factor in APRN practice autonomy.
Other studies using the DPBS include an earlier descriptive study by Cajulis and
Fitzpatrick (2007) of 55 acute care NPs in a U.S. East Coast metropolitan academic
Magnet hospital. The study indicated 41 % of NPs with very high and 31 % with
extremely high levels of autonomy with approximately 28% of NPs reporting
empowerment subscale high or very high. The study suggests that environments such as
Magnet designated institutions that promote collaboration and effective communication
strategies, both components of highly functional teams, might be a contributing factor in
high levels of autonomy for NPs.
Autonomy and IPT function. This study proposes a relationship between APRN
perception of autonomy and IPT function. No studies were found that examined the
relationship between autonomy and IPT function specifically. However, there is research
that examines the relationship between autonomy and constructs that might be similar to
45
IPT function such as collaboration and teamwork. For example, a cross-sectional study
by Maylone et al. (2011) examined the relationship between NPs’ perceptions of level of
NP practice autonomy and collaboration with physicians among a sample of 99 NPs
attending a national conference. Their findings indicate that NPs perceive high levels of
autonomy using the DPBS and high or moderately high levels of collaboration using the
modified Collaborative Practice Scale (CPS-APN). However, they found no correlation
between collaboration and autonomy (r = −.12).
In another cross-sectional study, Poghosyan and Liu (2016) examined NP
autonomy and the relationship between primary care NPs and leadership [practice
managers and medical directors] (N = 314) with teamwork in 163 Massachusetts primary
care practices. NP autonomy was measured using the Autonomy and Independent
Practice scale (AIP) and relationships to leadership were measured using the Nurse
Practitioner Primary Care Organizational Climate Questionnaire (NP-PCCOCQ). As seen
in other studies, NPs scored high on autonomy. Significant relationships were found
between NP autonomy and teamwork; for every unit increase on AIP mean score, TW
mean score increased by 0.271 units (p < 0.0001). In their study, the five-item Teamwork
Scale measured collaboration and teamwork, between NPs and physicians. By
comparison, this study will use the T-TPQ® for Office-Based Care version which
measures more dimensions of teamwork and is appropriate for all IPT members.
In summary, no studies were found that examined relationships between APRN
autonomy and IPT function specifically. However, related studies of collaboration and
teamwork suggest that it could be a productive area for study because negative
perceptions of autonomy might result in individual underperformance due to loss of
46
empowerment related to autonomy and potentially overall IPT dysfunction which could
result in less optimal team and patient outcomes.
Professionalism
In this study, the relationship between APRN perceived professionalism and IPT
function was examined. More studies were found regarding professionalism related to
nursing students and nurses than studies that involve professionalism among the APRN
population.
The literature describes professionalism as the manifestation of professional
identity which includes the actions and behaviors that reflect the APRN’s connection to
the profession and expectations of professional membership in the collective (Caza &
Creary, 2016; Tajfel & Turner, 1979). For example, nurses attend conferences not only to
enhance knowledge and competency but also to engage with other members of the
profession. Logically, a high level of professional identity would imply a high level of
professionalism and vice versa. Identity theorists suggest group interactions, such as
attending conferences, are characteristic of both social and professional identity among
groups including nursing professionals (Tajfel & Turner, 1979). Adams and Miller
(2001) point out that attending workshops, seminars, and conferences is indicative of
nursing professionalism and more than 95% of NPs (N = 502) in their study participated
in such activities.
Consensus on the meaning of professionalism does not exist in the literature even
though professionalism is associated with behavioral expectations among professional
groups including nursing. Furthermore, studies regarding professionalism among APRNs
are limited. In Adams and Miller’s (2001) study, the behavioral aspects of
47
professionalism among 502 NPs attending a national conference was examined. NPs
specified autonomy as one of the leading categories of professionalism. Using the
Professionalism in Nursing Behaviors Inventory, the mean composite score for
professionalism was 16.7 out of a possible 27, which was the highest average score for
NPs compared to other studies. Just as attending conferences and maintaining
professional knowledge are characteristics of professionalism, certification is a
professional behavior that implies a level of professionalism. In Adams’ and Miller’s
study, 427 NPs (85%) earned certification as an advanced practitioner.
Professionalism and IPT function. No studies could be found that examined the
relationship between APRN perception of professionalism and IPT function. Akhtar-
Danesh et al. (2013) examined attitudes towards professionalism among faculty and
nursing students (none were APRNs) using a mixed-method two-phase approach to
develop an instrument to measure professionalism. The major aspect of professionalism
among this group of 11 faculty and 20 students was communication, which according to
the literature is a necessary component of highly functional IPTs. It stands to reason that
if professionalism is associated with communication and collaboration, one would expect
a relationship to exist between professionalism and IPT function. This study addresses
the relationship between IPT function and professionalism in the APRN population at the
professional stage versus the developmental stage of identity development.
Summary and Conclusion
This chapter described the conceptual framework for this study based on identity
theories which were used to characterize IPTs. Professional identity theory is used to
explain how APRNs develop professional identity including the concepts of autonomy
48
and professionalism and how these concepts relate to how APRNs perceive IPT function.
Place identity is added to facilitate an understanding of how state practice authority
environments might influence how APRNs perceive IPT function.
Highly functions teams are characterized by superior communication,
collaboration, trust, and respect among team members. Additionally, the literature
regarding IPT function is extensive and includes a broad range of disciplines. However,
studies regarding the relationship between IPT function, state practice authority, APRN
perception of autonomy, and professionalism could not be found.
A review and description of states’ practice authority (see Table 1) relative to
APRNs’ role within the IPT were presented. Less than half of states provide legislative
language for full scope of practice (including independent prescribing) for APRNs.
Nevertheless, states’ legislative language regarding scope of practice is not consistent and
might contribute to how IPTs function. Secondly, organizations can institute more
restrictive rules than a state’s established practice authority, that could also contribute to
how IPTs function. To my knowledge, these two environments have not been studied
together, and no study could be found linking state practice authority to APRN perception
of autonomy, professionalism, or IPT function.
APRNs in the studies described in this chapter have consistently high scores for
autonomy and have reported a high degree of professionalism. Even so, some studies
suggest that regulatory practice environments, including states and organizations, can
either inhibit or promote IPT function through rules and behaviors that determine APRN
scope of practice. At the highest level, state practice authority dictates the scope of
practice for APRNs and might contribute to less effective IPT function if IPT members
49
are unclear of the APRN’s scope of practice. Therefore, it is conceivable that the
relationship between regulatory environments, such as state practice authority, and APRN
perceptions of autonomy and professionalism have both direct and indirect effects on
how IPTs function which has not been examined to date. This study addresses this gap by
examining the potential mediating effects of autonomy between state practice authority
and IPT function and the moderating effects of state practice authority between
professionalism and IPT function among APRNs in the U.S.
50
CHAPTER 3
METHODS
This study examined the direct and indirect relationships between the
environmental factor of state practice authority, with perceived autonomy,
professionalism and IPT function in a national sample of advanced practice nurses
(APRNs) in the U.S. Specifically, the purpose of this study is to: (1) determine if
environmental factors (state practice authority) have a direct or indirect effect on APRN
perception of IPT function; (2) examine the extent to which APRN perception of
autonomy and professionalism directly and significantly associate with APRN perception
of (IPT) function; (3) determine the extent to which APRN perception of autonomy
mediates the relationship between state practice authority and IPT function, and (4) to
determine the extent to which state practice authority moderates the relationship between
APRN perception of professionalism and IPT function in a national sample of APRNs in
the United States.
Study Design
This study used a quantitative cross-sectional self-administered web-based survey
design. This design was intended to obtain a broad representation of APRNs from across
the U.S. at various stages of their professional work-life at a single point in time. The
focus of this study was on the relationships between state practice authority and
perceptions of autonomy, professionalism, and IPT function of APRNs as a distinct group.
Time constraints, accessibility to participants, and cost made this design a practical
choice for this study.
51
Sample
Email addresses were obtained from a national email list purchased from Exact
Data who acquires data for marketing lists from various sources based on Dun and
Bradstreet records in the Business Database; all email addresses are direct contacts, not
sales or generic information (Exact Data, 2017). Exact Data compiles a specific list based
on the validity of the email address and the criteria given i.e., all nationally certified
APRNs (CNMs, CNPs, CNSs, and CRNAs) from all 50 states and the District of
Columbia. The list conforms to Federal Trade Commission rules regarding email
solicitation. The email data for the State Licensed file is 3rd party opted-in and overlaid
onto the state licensed records via several consumer-based sources. Sources for email and
mailing lists include government records, licensing boards, municipal directories,
telephone and office machine hookups, internet connections and searches, memberships,
attendee registers, web site registrations, DBAs (doing business as), incorporations,
yellow page and business white page directories, county courthouse records, Secretary of
State data, business magazines and newspapers, subscriptions, annual reports, 10-Ks and
other Security and Exchange Commission (SEC) filings, postal service information
including National Change of Address, ZIP+4 carrier route and Delivery Sequence Files.
The convenience sample for this study consisted of APRNs from any clinical
practice setting that requires APRN licensure/authority for their position and who, within
the past year or currently, practice within a clinical IPT with members of two or more
different professions for at least 6 months. Examples include but are not limited to:
physician, nurse (LPN/RN), pharmacist, physical therapist, nutritionist, social worker,
52
and clergy who work in clinical settings. Recruitment was from a U.S. national email list
sample (N = 6,000) as previously described.
Inclusion criteria. Participants (1) were licensed/authorized to practice as an
APRN; (2) required an APRN license in their current position, and (3) within the past
year or currently worked in an interprofessional clinical practice team environment (two
or more different professions who were not APRNs) for at least six months. Additionally,
the respondents must have identified the state in which they practice.
Exclusion criteria. Respondents were excluded from this study if they did not
meet inclusion criteria, they declined consent to participate by not accessing and
competing the survey, or they did not identify the state where they practice.
Statistical Power Analysis
Since the number of respondents and completed survey responses were unknown,
statistical power was plotted against sample size for each of the statistical analyses used
in this study under two differing assumed effect sizes (see Appendix A1 and A2). For
example, at α = .05, 1-β = 0.80, β = 0.20 a multiple linear regression with five predictors
would require a sample size of 200 to achieve sensitivity to medium effect sizes, 150 for
a one-way ANOVA with three groups, and 125 for bivariate correlation.
G*Power 3.1 (Faul, Erdfelder, Lane, & Buchner, 2007) was used to calculate
sensitivity to effect sizes for this sample of 222 APRNs at α = .05 and 1-β = 0.80. The
calculated effect size was r = .19 for Pearson’s correlations (small 0.1, medium 0.3, large
0.5) and f = 0.21 for ANOVA (small 0.1, medium, 0.25, large 0.4) (Cohen, 1988) which
indicated that the sample was large enough to detect medium effects and some small
effects. Refer to Appendix A3, A4. The calculated effect size for multiple linear

53
regression with five predictor variables (two indicator variables for the three-category
variable of state practice authority, two interaction terms, and one continuous predictor)
was f2 = 0.06 which indicated sensitivity to small effects using the standard effect size
thresholds of small 0.02, medium 0.15, and large 0.35 for Cohen’s f2. See Appendix A5.
Procedures
Data Collection
Upon University of New Mexico Institutional Review Board approval, six
thousand email invitations (Appendix B) to participate were sent to APRNs across the
U.S. using REDCap [Research Electronic Data Capture] (Harris et al., 2009). A second
email invitation was sent one week after the first invitations were sent, a third email
invitation was sent one week after the second invitation was sent, and a final invitation
was sent one week after the third invitation was sent. The survey was open for a total of
four weeks and was closed one week after the final email invitation was sent.
Participants were asked to respond to three statements that determined inclusion
for this study: (1) During the past year I have been nationally certified and licensed or
authorized to practice as one of the following, (CNM, CNP, CNS, CRNA), (2) Currently
or within the past year I have worked for at least six months with an interprofessional
clinical practice team with at least one other professional who is not an APRN (CNM,
CNP, CNS, CRNA). Examples (not all inclusive): physician, nurse (LPN/RN),
pharmacist, physical therapist, nutritionist, social worker, clergy, and (3) I was working
as a CNM, CNP, CNS, or CNRA on that interprofessional clinical practice team.
Additionally, it was necessary for respondents to provide the state in which they practice
for analysis purposes. If inclusion criteria were not met, a thank-you statement for their
54
willingness to participate was presented and the survey was terminated. The participants
who met the screening criteria (Appendix C) were taken to the consent page (Appendix
D); if they consented, the survey automatically opened (Appendix E).
Study data were collected using REDCap tools hosted at the University of New
Mexico. REDCap is a secure, web-based application designed to support data capture for
research studies, providing (1) an intuitive interface for validated data entry, (2) audit
trails for tracking data manipulation and export procedures, (3) automated export
procedures for seamless data downloads to common statistical packages such as SPSS
and AMOS, and (4) procedures for importing data from external sources (Harris et al.,
2009).
Instruments and Measures
In addition to inclusion and demographic questions, three separate instruments
represent the construct variables (IPT function, autonomy, and professionalism) that
made up this survey. Rationale for selection of each instrument included ease of use,
superior reliability and validity, and accessibility and permission to use the instrument.
IPT Function (DV). The T-TPQ® is a publicly available instrument that
measures the individual’s perceptions of group-level team-skills and behavior (American
Institutes for Research, 2010). The TeamSTEPPS® for Office-Based Care Teamwork
Perception Questionnaire (T-TPQ) is a 35-item self-report questionnaire using a 5-point
Likert scale (strongly disagree = 1; strongly agree = 5) modified from the original T-TPQ
for use in nonhospital settings (Appendix F1). The T-TPQ Office-Based version was
chosen because the items’ language is less specific regarding practice settings. The
instrument measures a total of five constructs: team structure (7 items), leadership (7
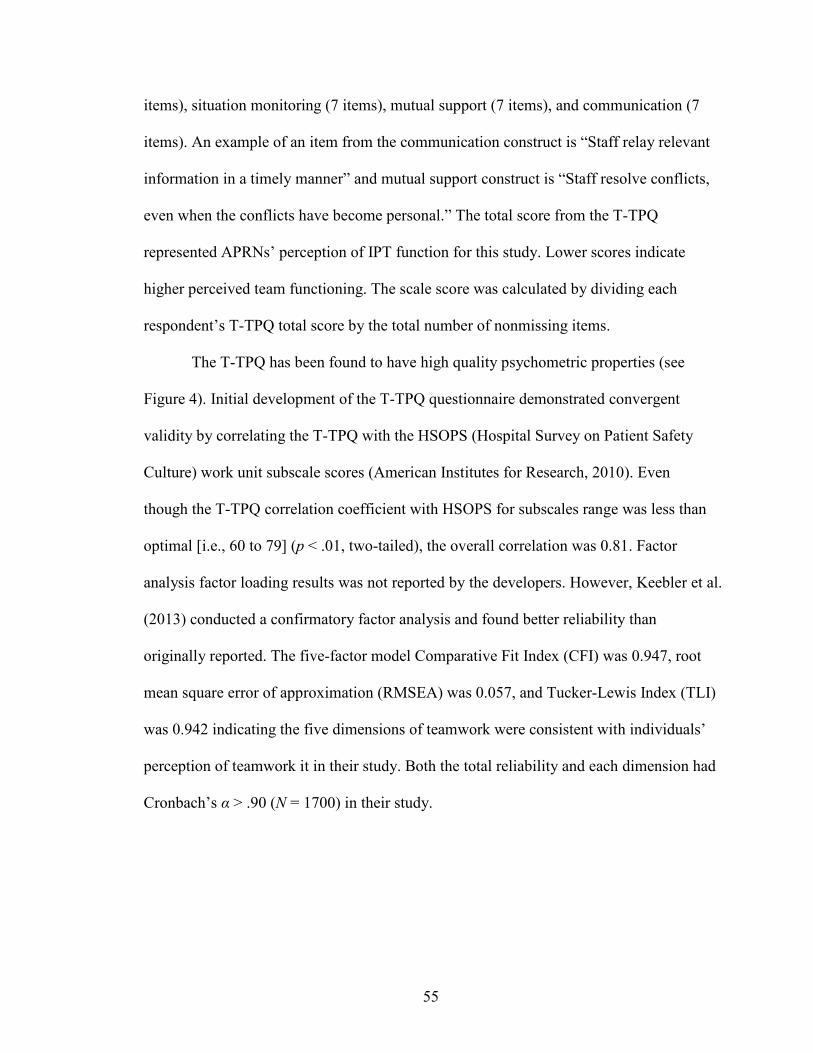
55
items), situation monitoring (7 items), mutual support (7 items), and communication (7
items). An example of an item from the communication construct is “Staff relay relevant
information in a timely manner” and mutual support construct is “Staff resolve conflicts,
even when the conflicts have become personal.” The total score from the T-TPQ
represented APRNs’ perception of IPT function for this study. Lower scores indicate
higher perceived team functioning. The scale score was calculated by dividing each
respondent’s T-TPQ total score by the total number of nonmissing items.
The T-TPQ has been found to have high quality psychometric properties (see
Figure 4). Initial development of the T-TPQ questionnaire demonstrated convergent
validity by correlating the T-TPQ with the HSOPS (Hospital Survey on Patient Safety
Culture) work unit subscale scores (American Institutes for Research, 2010). Even
though the T-TPQ correlation coefficient with HSOPS for subscales range was less than
optimal [i.e., 60 to 79] (p < .01, two-tailed), the overall correlation was 0.81. Factor
analysis factor loading results was not reported by the developers. However, Keebler et al.
(2013) conducted a confirmatory factor analysis and found better reliability than
originally reported. The five-factor model Comparative Fit Index (CFI) was 0.947, root
mean square error of approximation (RMSEA) was 0.057, and Tucker-Lewis Index (TLI)
was 0.942 indicating the five dimensions of teamwork were consistent with individuals’
perception of teamwork it in their study. Both the total reliability and each dimension had
Cronbach’s α > .90 (N = 1700) in their study.
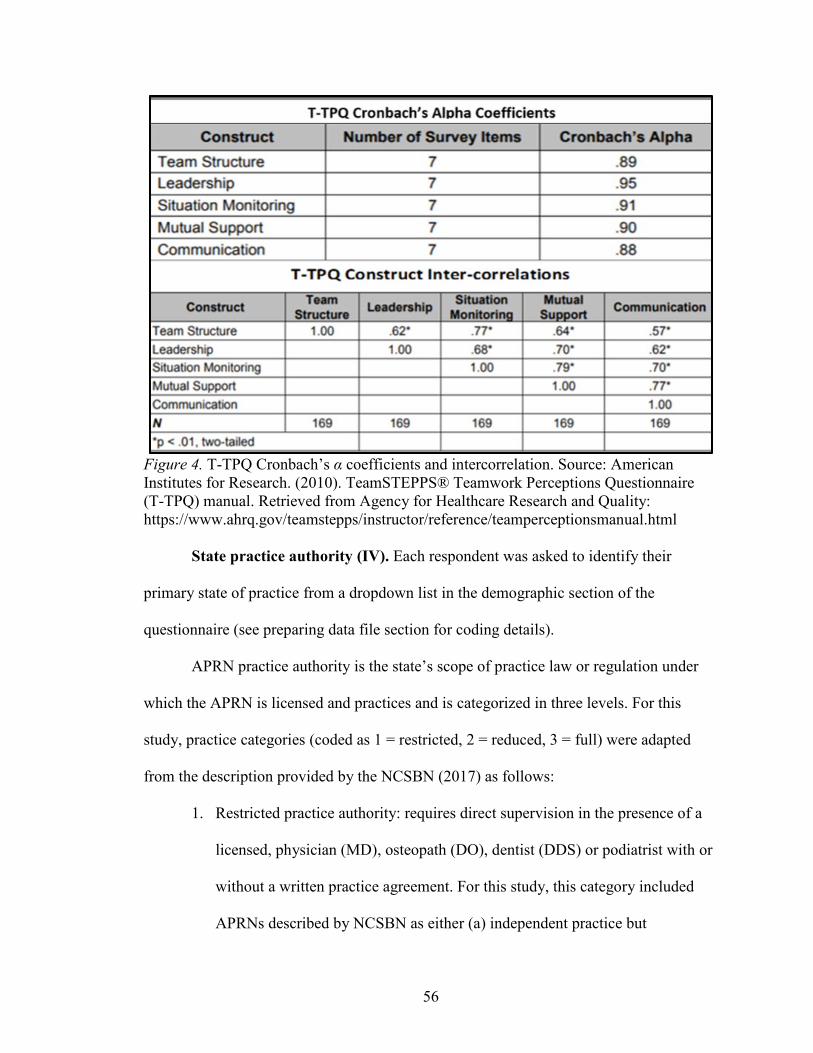
56
Figure 4. T-TPQ Cronbach’s α coefficients and intercorrelation. Source: American Institutes for Research. (2010). TeamSTEPPS® Teamwork Perceptions Questionnaire (T-TPQ) manual. Retrieved from Agency for Healthcare Research and Quality: https://www.ahrq.gov/teamstepps/instructor/reference/teamperceptionsmanual.html
State practice authority (IV). Each respondent was asked to identify their
primary state of practice from a dropdown list in the demographic section of the
questionnaire (see preparing data file section for coding details).
APRN practice authority is the state’s scope of practice law or regulation under
which the APRN is licensed and practices and is categorized in three levels. For this
study, practice categories (coded as 1 = restricted, 2 = reduced, 3 = full) were adapted
from the description provided by the NCSBN (2017) as follows:
1. Restricted practice authority: requires direct supervision in the presence of a
licensed, physician (MD), osteopath (DO), dentist (DDS) or podiatrist with or
without a written practice agreement. For this study, this category included
APRNs described by NCSBN as either (a) independent practice but
57
supervised or not specified for prescribing or (b) supervised and not specified
in both practice and prescribing.
2. Reduced practice authority: requires a collaborative agreement between the
APRN and his or her medical colleague which is a written agreement that
specifies scope of practice and medical acts allowable with or without a
general supervision requirement by an MD, DO, DDS or podiatrist. For this
study, this category included APRNs described by NCSBN as having either
(a) independent practice but with collaborative agreement for prescribing or
(b) collaborative agreement for both practice and prescribing.
3. Full practice authority: the ability for APRNs to practice with no requirement
for a written collaborative agreement, no supervision, and no conditions for
practice including the authority to prescribe medications and treatment within
the APRN’s licensure, certification, and scope of practice laws. For this study,
this category included APRNs described by NCSBN as having both
independent practice and independent prescribing.
Autonomy (IV). The DPBS (Cronbach’s α = .95) measures APRN professional
role identity in the practice setting [Dempster, 1990] (see Appendix F2). The DPBS is a
30-item 5-point Likert scale (range from not at all true to extremely true) designed to
measure hidden and obvious conduct in practice autonomy. Higher scores indicate higher
perceived autonomy. Theoretical constructs include (1) readiness (11 items), (2)
empowerment (7 items), (3) actualization (9 items), and (4) valuation (3 items).
Readiness includes components such as competence, skill, and mastery are behaviors and
actions that involve transitions from one level to another regarding autonomy in practice.
58
Empowerment is the legitimate status and right that enables action without others limiting
performance in the practice setting. Actualization refers to decision-making, directing,
accountability, and responsibility of taking action in the practice setting. Example items
from the DPBS (2009) include “I function with authority to do what I know should be
done” and “I have the power to influence decisions and actions of others.” The total score
from the Dempster Professional Behaviors Scale (DPBS) represented APRNs’ perception
of autonomy. Five negatively worded items were reverse scored. The scale score was
calculated by dividing each respondent’s DPBS total score by the total number of
nonmissing items.
The DPBS was developed using a grounded theory with interviews from 28
participants to validate autonomy dimensions extracted from the literature. The
subsequent analysis resulted in five dimensions and 40 items. Convergent and
discriminant validity was tested using the 40-item DPBS and three existing autonomy
scales (N = 569; 60 % NPs and 40% RNs). Content validity index was calculated at the
maximum of 1.0 from content expert ratings (N = 7). The DPBS was reduced to 30 items
after exploratory and confirmatory factor analysis including principal components
factoring with orthogonal varimax rotation and alpha factoring [N = 569] (Figure 5).
Construct and discriminant validity of the 30-item scale were tested and validated using a
multitrait–multimethod matrix in conjunction with several other scales with different
traits and measurement methods (Dempster, 1990). Convergent validity was moderate
with correlations ranging from .44 to .48. and discriminant validity was validated by
observing lower correlation values (range −.24 to −.52) than convergent correlation
values. The author gave permission to use the DPBS for this study.
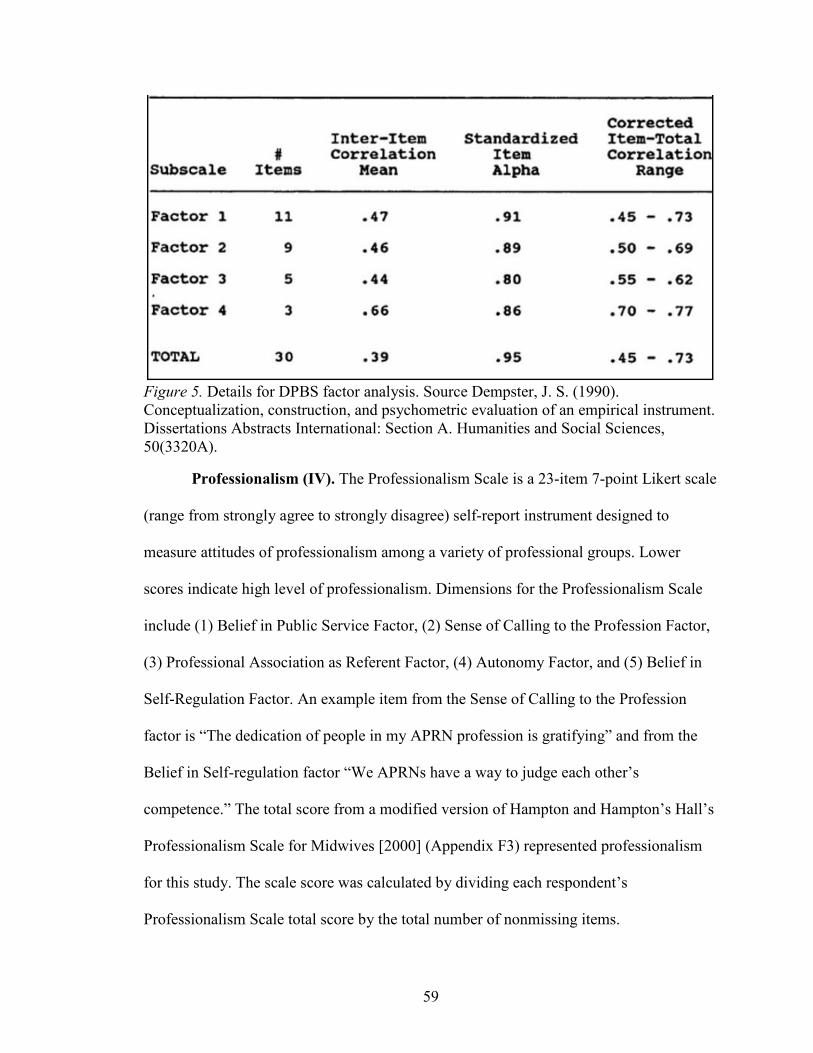
59
Figure 5. Details for DPBS factor analysis. Source Dempster, J. S. (1990). Conceptualization, construction, and psychometric evaluation of an empirical instrument. Dissertations Abstracts International: Section A. Humanities and Social Sciences, 50(3320A).
Professionalism (IV). The Professionalism Scale is a 23-item 7-point Likert scale
(range from strongly agree to strongly disagree) self-report instrument designed to
measure attitudes of professionalism among a variety of professional groups. Lower
scores indicate high level of professionalism. Dimensions for the Professionalism Scale
include (1) Belief in Public Service Factor, (2) Sense of Calling to the Profession Factor,
(3) Professional Association as Referent Factor, (4) Autonomy Factor, and (5) Belief in
Self-Regulation Factor. An example item from the Sense of Calling to the Profession
factor is “The dedication of people in my APRN profession is gratifying” and from the
Belief in Self-regulation factor “We APRNs have a way to judge each other’s
competence.” The total score from a modified version of Hampton and Hampton’s Hall’s
Professionalism Scale for Midwives [2000] (Appendix F3) represented professionalism
for this study. The scale score was calculated by dividing each respondent’s
Professionalism Scale total score by the total number of nonmissing items.

60
The Professionalism Scale is a modification of the original Hall’s professionalism
Scale [Hall 1968] (Appendix F4). Hall measured professionalism among eleven
occupational groups: physicians, nurses, accountants, teachers, lawyers, social workers,
stock brokers, librarians, engineers, personnel managers, and advertising executives (N =
328) using 10 items in each of the five dimensions of professionalism. Snizek (1972)
compared his data gathered from aeronautical, nuclear and chemical engineers, physicists
and chemists (N = 566) to Hall’s original data. Snizek used principal axis factor analysis
to reassess and compare the items’ fit to each of the five theoretical dimensions, resulting
in a modification of the original scale by reducing the number of items from 50 to 25
(Figure 6). The data show that in reducing the number of items, reliability overall was
slightly less using Hall’s original data with a greater reduction in total reliability using
Snizek’s data, but reliability scores remain within the acceptable range overall (α > .70).
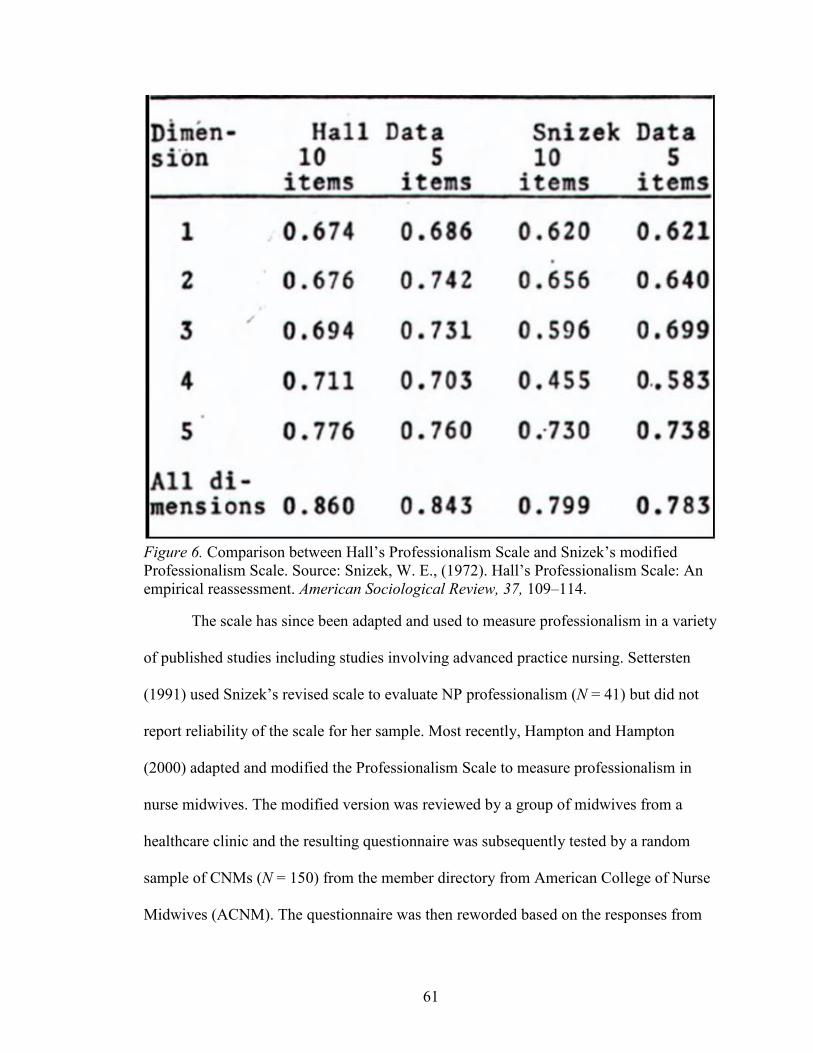
61
Figure 6. Comparison between Hall’s Professionalism Scale and Snizek’s modified Professionalism Scale. Source: Snizek, W. E., (1972). Hall’s Professionalism Scale: An empirical reassessment. American Sociological Review, 37, 109–114.
The scale has since been adapted and used to measure professionalism in a variety
of published studies including studies involving advanced practice nursing. Settersten
(1991) used Snizek’s revised scale to evaluate NP professionalism (N = 41) but did not
report reliability of the scale for her sample. Most recently, Hampton and Hampton
(2000) adapted and modified the Professionalism Scale to measure professionalism in
nurse midwives. The modified version was reviewed by a group of midwives from a
healthcare clinic and the resulting questionnaire was subsequently tested by a random
sample of CNMs (N = 150) from the member directory from American College of Nurse
Midwives (ACNM). The questionnaire was then reworded based on the responses from
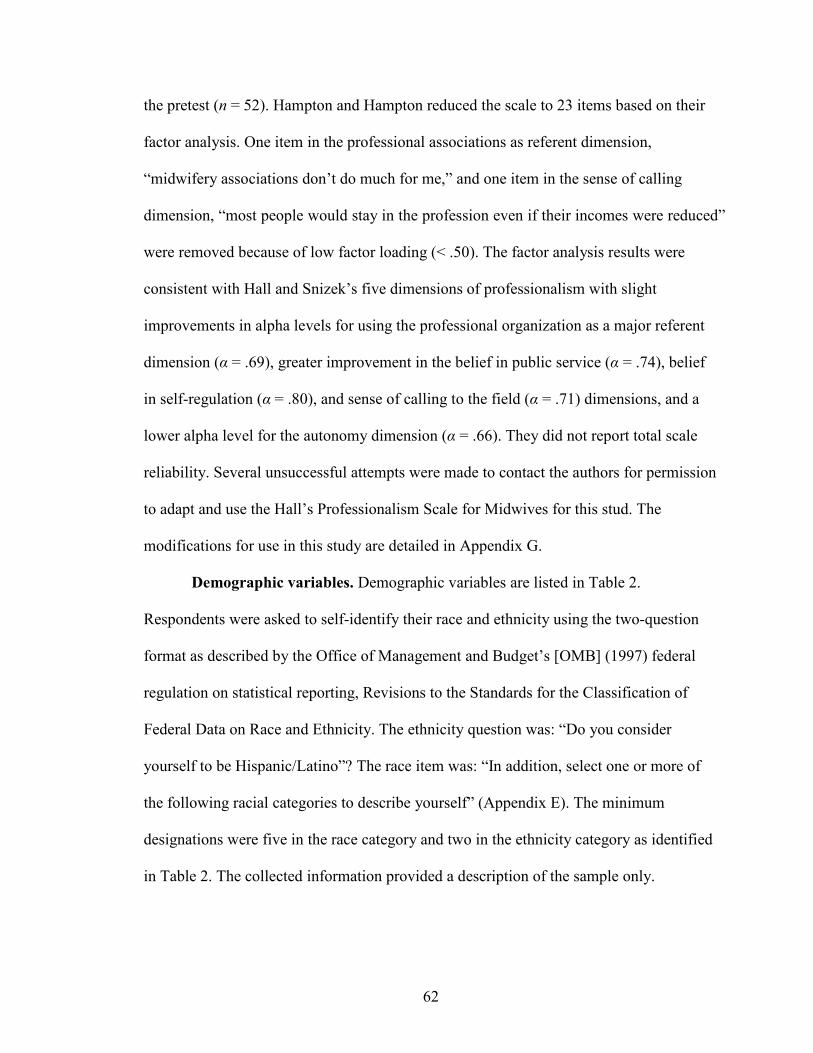
62
the pretest (n = 52). Hampton and Hampton reduced the scale to 23 items based on their
factor analysis. One item in the professional associations as referent dimension,
“midwifery associations don’t do much for me,” and one item in the sense of calling
dimension, “most people would stay in the profession even if their incomes were reduced”
were removed because of low factor loading (< .50). The factor analysis results were
consistent with Hall and Snizek’s five dimensions of professionalism with slight
improvements in alpha levels for using the professional organization as a major referent
dimension (α = .69), greater improvement in the belief in public service (α = .74), belief
in self-regulation (α = .80), and sense of calling to the field (α = .71) dimensions, and a
lower alpha level for the autonomy dimension (α = .66). They did not report total scale
reliability. Several unsuccessful attempts were made to contact the authors for permission
to adapt and use the Hall’s Professionalism Scale for Midwives for this stud. The
modifications for use in this study are detailed in Appendix G.
Demographic variables. Demographic variables are listed in Table 2.
Respondents were asked to self-identify their race and ethnicity using the two-question
format as described by the Office of Management and Budget’s [OMB] (1997) federal
regulation on statistical reporting, Revisions to the Standards for the Classification of
Federal Data on Race and Ethnicity. The ethnicity question was: “Do you consider
yourself to be Hispanic/Latino”? The race item was: “In addition, select one or more of
the following racial categories to describe yourself” (Appendix E). The minimum
designations were five in the race category and two in the ethnicity category as identified
in Table 2. The collected information provided a description of the sample only.
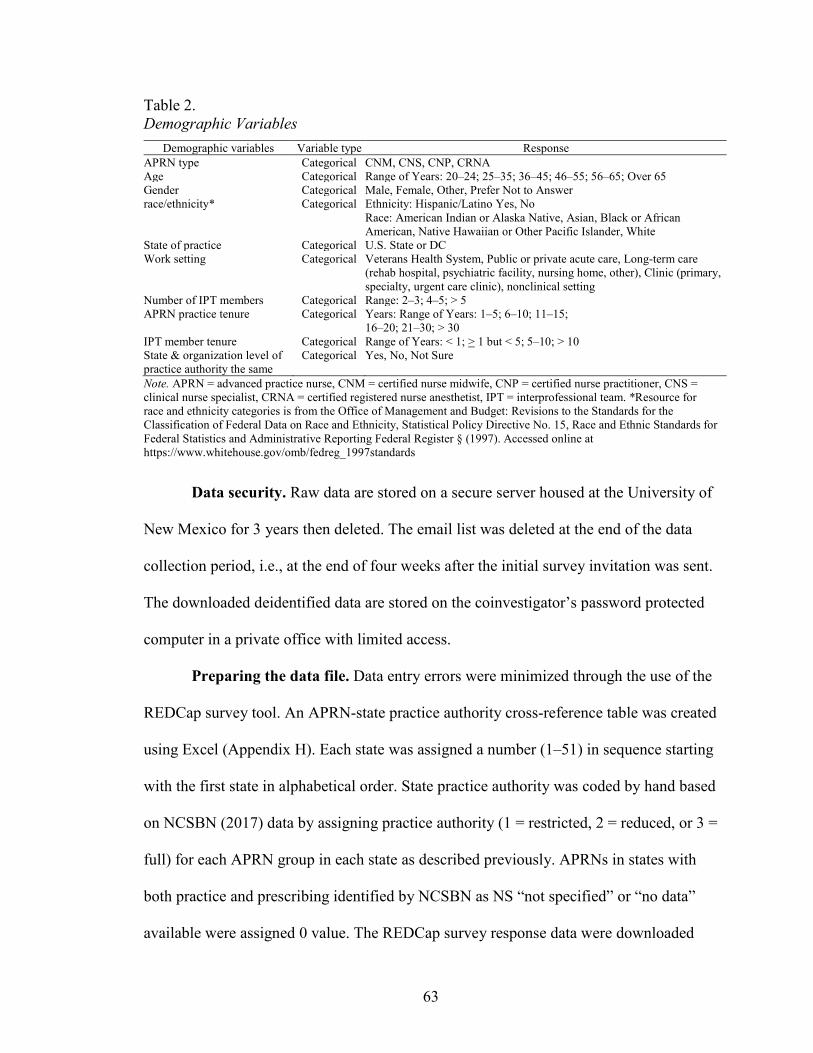
63
Table 2. Demographic Variables
Demographic variables Variable type Response APRN type Categorical CNM, CNS, CNP, CRNA Age Categorical Range of Years: 20–24; 25–35; 36–45; 46–55; 56–65; Over 65 Gender Categorical Male, Female, Other, Prefer Not to Answer race/ethnicity* Categorical Ethnicity: Hispanic/Latino Yes, No
Race: American Indian or Alaska Native, Asian, Black or African American, Native Hawaiian or Other Pacific Islander, White
State of practice Categorical U.S. State or DC Work setting Categorical Veterans Health System, Public or private acute care, Long-term care
(rehab hospital, psychiatric facility, nursing home, other), Clinic (primary, specialty, urgent care clinic), nonclinical setting
Number of IPT members Categorical Range: 2–3; 4–5; > 5 APRN practice tenure Categorical Years: Range of Years: 1–5; 6–10; 11–15;
16–20; 21–30; > 30 IPT member tenure Categorical Range of Years: < 1; > 1 but < 5; 5–10; > 10 State & organization level of practice authority the same
Categorical Yes, No, Not Sure
Note. APRN = advanced practice nurse, CNM = certified nurse midwife, CNP = certified nurse practitioner, CNS = clinical nurse specialist, CRNA = certified registered nurse anesthetist, IPT = interprofessional team. *Resource for race and ethnicity categories is from the Office of Management and Budget: Revisions to the Standards for the Classification of Federal Data on Race and Ethnicity, Statistical Policy Directive No. 15, Race and Ethnic Standards for Federal Statistics and Administrative Reporting Federal Register § (1997). Accessed online at https://www.whitehouse.gov/omb/fedreg_1997standards
Data security. Raw data are stored on a secure server housed at the University of
New Mexico for 3 years then deleted. The email list was deleted at the end of the data
collection period, i.e., at the end of four weeks after the initial survey invitation was sent.
The downloaded deidentified data are stored on the coinvestigator’s password protected
computer in a private office with limited access.
Preparing the data file. Data entry errors were minimized through the use of the
REDCap survey tool. An APRN-state practice authority cross-reference table was created
using Excel (Appendix H). Each state was assigned a number (1–51) in sequence starting
with the first state in alphabetical order. State practice authority was coded by hand based
on NCSBN (2017) data by assigning practice authority (1 = restricted, 2 = reduced, or 3 =
full) for each APRN group in each state as described previously. APRNs in states with
both practice and prescribing identified by NCSBN as NS “not specified” or “no data”
available were assigned 0 value. The REDCap survey response data were downloaded
64
into Excel. The state name and practice authority were coded in Excel using a lookup
formula and the APRN-state practice authority cross-reference table. The data from Excel
were imported into SPSS and screened for missing values. First, frequencies of each
variable were evaluated for values that fell outside of the possible range including each
item of each scale. Except for missing values, none fell outside of the possible range and
all were retained for analysis.
Scores for each scale were calculated by first reverse scoring any negatively
worded items’ responses using SPSS and second by summing the number of items for
each scale, then dividing by the number of nonmissing items in each scale (Pallant, 2013).
Items 8, 13, 17, 26, and 28 in the DPBS so that high scores indicated high levels of
autonomy. Item 2 in the PS Sense of Calling to the Profession dimension, 3 in the
Professional Association as Referent dimension, items 2, 3, 4, and 5 in the Autonomy
dimension, and items 4 and 5 in the Belief in Self-Regulation dimension were reverse
scored (high score indicates low levels of professionalism). Total scores were evaluated
for mean, minimum, and maximum values and compared to values from previous studies.
Residuals and outliers are a concern with multiple regression; residuals with a Cook’s
Distance > 1 and outliers found in the standardized residuals scatterplot, i.e., cases with
values outside of the expected range (values ~ 3) were evaluated for errors. Only 1 case
had Cook’s Distance > 1. No values represented errors. All values were retained.
Statistical Analyses
Descriptive statistics. Using SPSS, frequencies and percentages were used to
define the population characteristics and are presented in Chapter 4. ANOVA and
65
correlations were used to compare mean scores between groups. Also see Appendix I and
J.
Preliminary analysis. Mean, standard deviation, range of scores, skewness, and
kurtosis were evaluated for the normality of the distribution of scores using histograms,
Q-Q, P–P, and box plots (Appendix J1 through J3). Comparison of mean and the trimmed
mean were not significantly different, and all values were retained. However, it should be
noted that the literature indicates that APRNs, NPs in particular, generally report high
levels of autonomy and NPs represent the majority of respondents in this sample which
could explain the distribution of scores for the DPBS. Finally, scatterplots were assessed
to determine linearity of the relationships between the variables and show linear
relationships with no significant clustering. Specific tests are described in analysis of
each question.
An ANOVA was conducted to evaluate the difference in mean scores between
each of the APRN groups. To test multicollinearity, the data were screened for variance
inflation factor (VIF) which should be < 10 (Mansfield & Helms, 1982). (See Appendix
J4).
Reliability assessment. The scales used in the study were selected based on their
accessibility and sound reliability and validity. However, to ensure that the scales
demonstrate sound internal consistency for this study, (1) the interitem correlation matrix
was assessed for positive values indicating that the items measured characteristics
appropriately, (2) the corrected item-total correlation values were assessed for the degree
of correlation between the item and the whole scale [a value of < .3 indicates poor
correlation] (Pallant, 2013), and (3) Cronbach’s alphas were calculated. A Cronbach’s
66
alpha between .70 and .79 is considered good, a Cronbach’s alpha between .80 and .89 is
considered very good, and a Cronbach’s alpha .90 or higher is considered excellent
(Drost, 2011).
The T-TPQ had excellent total reliability and interitem correlation for each
dimension (Cronbach’s α > .90; N = 1700) in previous studies (Keebler et al., 2013).
Dempster (1990) reported the Cronbach's alpha for the DPBS at .95. For the modified PS,
Hampton and Hampton (2000) reported a Cronbach’s alpha > .70 for each dimension but
did not report on the total scale score.
Since this study was not measuring individual items or subsets within each scale,
all items in each scale were retained in the total scale score mean calculation. See Tables
J5.1 through J5.3 for reliability results.
Analysis of research questions. The analysis for each question is as follows.
Research Question 1. Is the level of state practice authority associated with
perceived IPT function in a national sample of APRNs?
To test the direct relationship between state practice authority and IPT function,
using SPSS the three levels of practice authority (IV) were entered into the equation with
IPT function (DV) and an analysis of variance (ANOVA) with post hoc comparisons
(Tukey’s HSD) was employed.
Research Question 2. Is the relationship between state practice authority and
perception of IPT function mediated by autonomy in a national sample of APRNs?
Baron and Kenny’s (1986) criteria for mediation requires (a) the predictor
variable (state practice authority) be related to the criterion variable (IPT function), (b)
the predictor variable be related to the mediator variable (autonomy), (c) the mediator

67
variable is related to the criterion variable when controlling for the predictor, and (d)
adding the mediator variable reduces the relationship between the predictor and the
criterion variables. For example, this study hypothesized that state practice authority
would be directly associated with APRN perception of autonomy which in turn affects
the perception of IPT function (Figure 7). The model also depicts a direct relationship
between state practice authority and IPT function and autonomy and IPT function.
However, the analysis showed the direct relationship between IPT function and state
practice authority is not significant and therefore, mediation using path analysis was not
tested.
Figure 7. Conceptual model of proposed mediating relationships: The mediating role of perceived autonomy between state practice authority and APRN perceived IPT function.
Subquestion 2a. Is there a relationship between level of state practice authority
and perceived autonomy in a national sample of APRNs?
An ANOVA with post hoc comparisons (Tukey's HSD) was conducted to test the
direct relationship between state practice authority and mean scores from the DPBS.
Levene’s test for homogeneity of variances was evaluated for violation of the assumption
of homogeneity.
68
Subquestion 2b. Is there a relationship between perceived autonomy and
perceived IPT function in a national sample of APRNs?
Pearson’s product–moment correlation was employed to test the strength and
direction of the relationship between total scores on the DPBS and total scores on the T-
TPQ. Scatter plots were used to test assumption of linearity and homoscedasticity; the
distribution of the data points was inspected for unorganized clustering, evenness of
shape of the cluster, and outliers. A general sense of the direction of the relationship was
determined by assessing the direction of the regression line (negative or positive) which
would indicate low or high scores. Data were checked for correct number and missing
cases. The coefficients were evaluated for the direction of the relationship between
autonomy and IPT function i.e., positive coefficient values would indicate a positive
relationship and negative values indicate negative relationships. The r values were
evaluated which determined the strength of relationship within a range from −1 to 1
[small r = .10–.29; medium r = .30 to .49, large r = .50 to 1] (Pallant, 2013). Next, the r
value was squared and multiplied by 100 to obtain the percent of variance that is
explained by autonomy on the T-TPQ scores. Finally, the significance level was assessed
to determine how much confidence exists in the results (p < .05).
Research Question 3. Is professionalism associated with perception of IPT
function in a national sample of APRNs?
Pearson’s product–moment correlation tested the relationship between total scores
on the PS and total scores on the T-TPQ using the same procedure for correlation as
described in the analysis for question 2b.
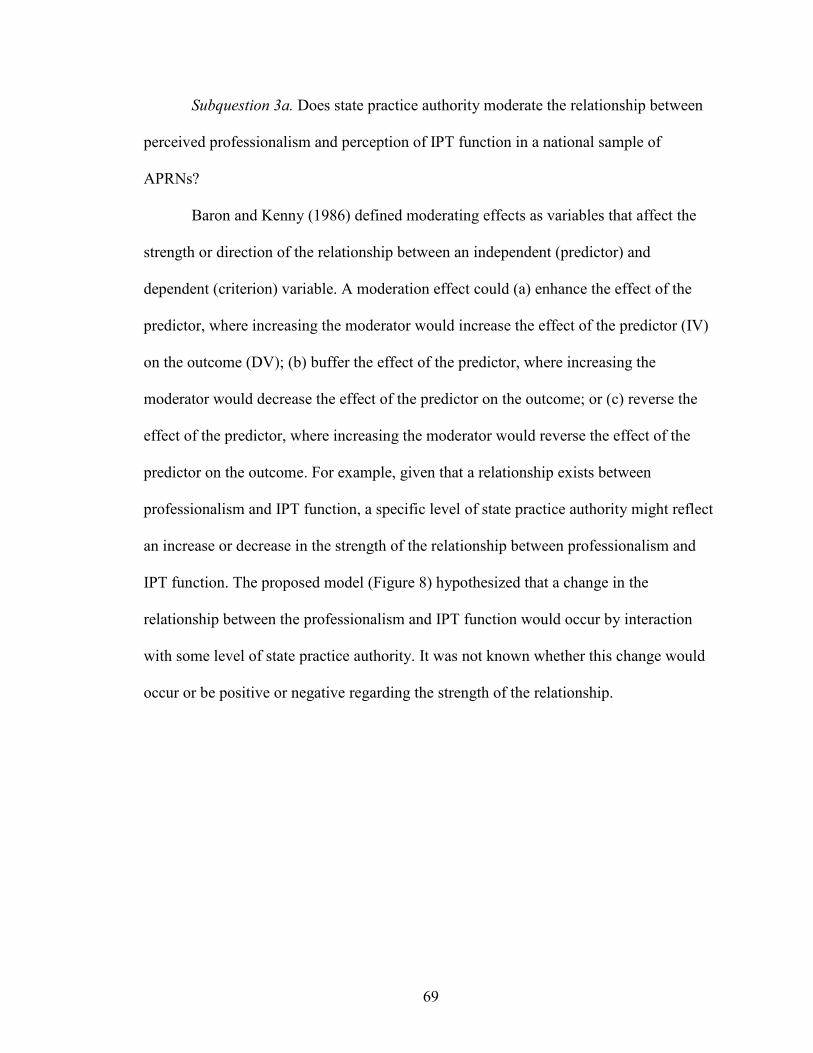
69
Subquestion 3a. Does state practice authority moderate the relationship between
perceived professionalism and perception of IPT function in a national sample of
APRNs?
Baron and Kenny (1986) defined moderating effects as variables that affect the
strength or direction of the relationship between an independent (predictor) and
dependent (criterion) variable. A moderation effect could (a) enhance the effect of the
predictor, where increasing the moderator would increase the effect of the predictor (IV)
on the outcome (DV); (b) buffer the effect of the predictor, where increasing the
moderator would decrease the effect of the predictor on the outcome; or (c) reverse the
effect of the predictor, where increasing the moderator would reverse the effect of the
predictor on the outcome. For example, given that a relationship exists between
professionalism and IPT function, a specific level of state practice authority might reflect
an increase or decrease in the strength of the relationship between professionalism and
IPT function. The proposed model (Figure 8) hypothesized that a change in the
relationship between the professionalism and IPT function would occur by interaction
with some level of state practice authority. It was not known whether this change would
occur or be positive or negative regarding the strength of the relationship.
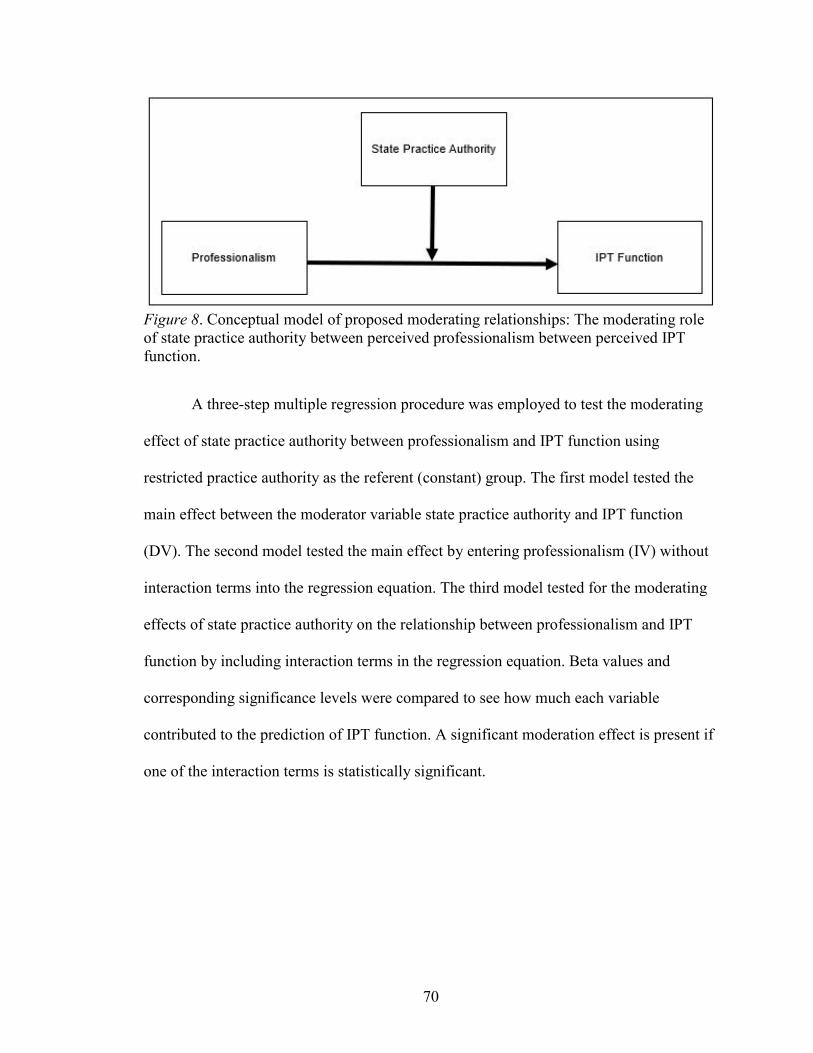
70
Figure 8. Conceptual model of proposed moderating relationships: The moderating role of state practice authority between perceived professionalism between perceived IPT function.
A three-step multiple regression procedure was employed to test the moderating
effect of state practice authority between professionalism and IPT function using
restricted practice authority as the referent (constant) group. The first model tested the
main effect between the moderator variable state practice authority and IPT function
(DV). The second model tested the main effect by entering professionalism (IV) without
interaction terms into the regression equation. The third model tested for the moderating
effects of state practice authority on the relationship between professionalism and IPT
function by including interaction terms in the regression equation. Beta values and
corresponding significance levels were compared to see how much each variable
contributed to the prediction of IPT function. A significant moderation effect is present if
one of the interaction terms is statistically significant.
71
Human Subjects
Potential Risks and Steps to Mitigate Risks
This is a minimal risk study because survey responses were anonymous with no
link to personal identifying information, or employers. Potential risks were loss of
confidentiality, anonymity, and participant burden.
Confidentiality. Study data were collected and managed using REDCap tools
hosted at the University of New Mexico Health Sciences Center. Raw data are stored on a
secure server located at the University of New Mexico and will be deleted after three
years. Emails were not downloaded with response data from REDCap. Emails have been
deleted from the REDCap tool. For analysis purposes, deidentified data are stored on the
coinvestigator’s pass-word protected computer in a private office with limited access.
Anonymity. The study responses were anonymous and deidentified upon
download from REDCap. No information was collected regarding participants’ personal
information or specific employer.
Participant burden. Potential for participant burden included receiving excessive
emails, test-taking anxiety, and time involved. All sample participants received one initial
email invitation. Three reminder emails were sent to non-respondents at one-week
intervals during the four-week data collection period. Participants were given contact
information and emails were removed from the email list immediately by the
coinvestigator upon request of a respondent. Participation was voluntary and email
requests to participate included a link to an informed consent page for voluntary
participation/resignation and included investigator and IRB contact information (see
Appendix D). The survey took approximately 30 minutes to complete. However, the

72
survey could have been completed in shorter time segments since the option to return and
complete until the survey close date was provided.
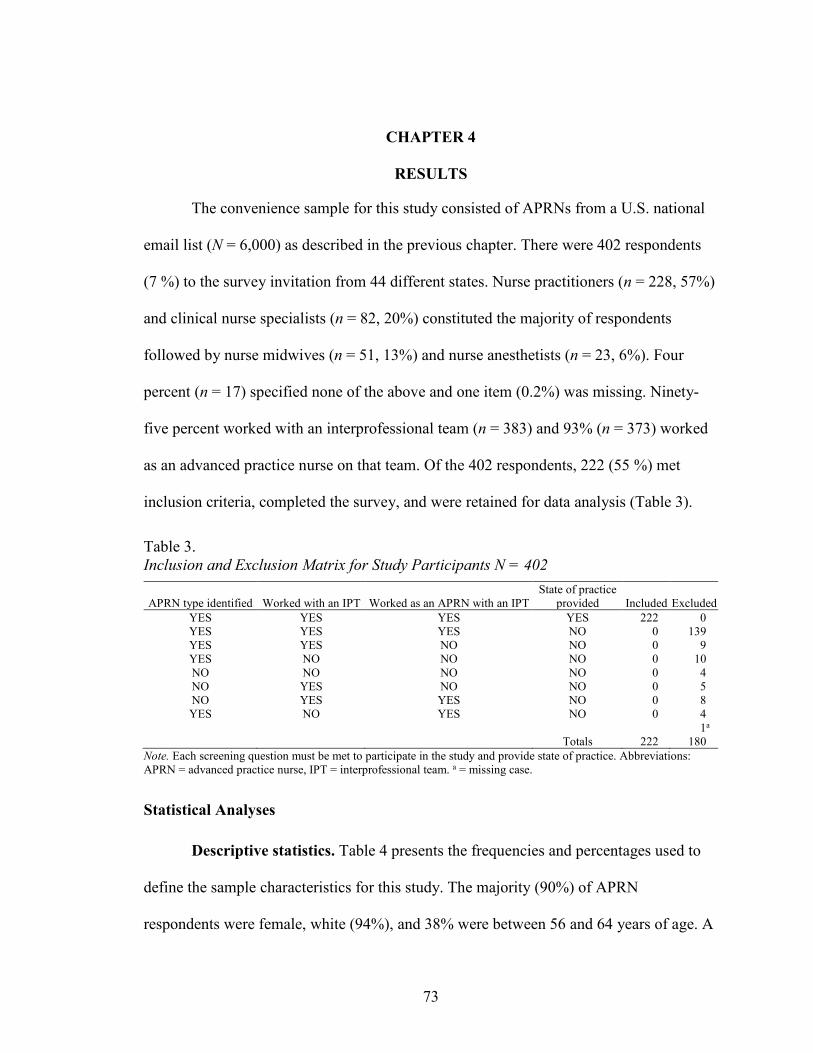
73
CHAPTER 4
RESULTS
The convenience sample for this study consisted of APRNs from a U.S. national
email list (N = 6,000) as described in the previous chapter. There were 402 respondents
(7 %) to the survey invitation from 44 different states. Nurse practitioners (n = 228, 57%)
and clinical nurse specialists (n = 82, 20%) constituted the majority of respondents
followed by nurse midwives (n = 51, 13%) and nurse anesthetists (n = 23, 6%). Four
percent (n = 17) specified none of the above and one item (0.2%) was missing. Ninety-
five percent worked with an interprofessional team (n = 383) and 93% (n = 373) worked
as an advanced practice nurse on that team. Of the 402 respondents, 222 (55 %) met
inclusion criteria, completed the survey, and were retained for data analysis (Table 3).
Table 3. Inclusion and Exclusion Matrix for Study Participants N = 402
APRN type identified Worked with an IPT Worked as an APRN with an IPT State of practice
provided Included Excluded YES YES YES YES 222 0 YES YES YES NO 0 139 YES YES NO NO 0 9 YES NO NO NO 0 10 NO NO NO NO 0 4 NO YES NO NO 0 5 NO YES YES NO 0 8 YES NO YES NO 0 4
1a Totals 222 180
Note. Each screening question must be met to participate in the study and provide state of practice. Abbreviations: APRN = advanced practice nurse, IPT = interprofessional team. a = missing case.
Statistical Analyses
Descriptive statistics. Table 4 presents the frequencies and percentages used to
define the sample characteristics for this study. The majority (90%) of APRN
respondents were female, white (94%), and 38% were between 56 and 64 years of age. A
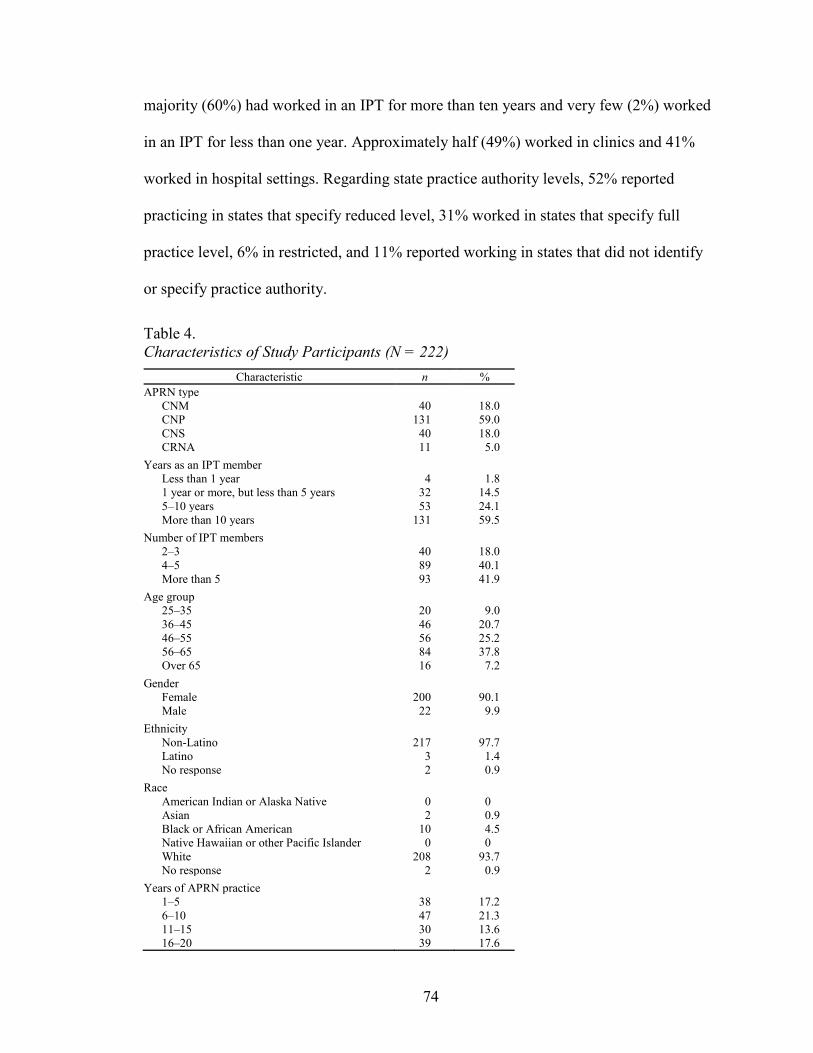
74
majority (60%) had worked in an IPT for more than ten years and very few (2%) worked
in an IPT for less than one year. Approximately half (49%) worked in clinics and 41%
worked in hospital settings. Regarding state practice authority levels, 52% reported
practicing in states that specify reduced level, 31% worked in states that specify full
practice level, 6% in restricted, and 11% reported working in states that did not identify
or specify practice authority.
Table 4. Characteristics of Study Participants (N = 222)
Characteristic n % APRN type
CNM 40 18.0 CNP 131 59.0 CNS 40 18.0 CRNA 11 5.0
Years as an IPT member Less than 1 year 4 1.8 1 year or more, but less than 5 years 32 14.5 5–10 years 53 24.1 More than 10 years 131 59.5
Number of IPT members 2–3 40 18.0 4–5 89 40.1 More than 5 93 41.9
Age group 25–35 20 9.0 36–45 46 20.7 46–55 56 25.2 56–65 84 37.8 Over 65 16 7.2
Gender Female 200 90.1 Male 22 9.9
Ethnicity Non-Latino 217 97.7 Latino 3 1.4 No response 2 0.9
Race American Indian or Alaska Native 0 0 Asian 2 0.9 Black or African American 10 4.5 Native Hawaiian or other Pacific Islander 0 0 White 208 93.7 No response 2 0.9
Years of APRN practice 1–5 38 17.2 6–10 47 21.3 11–15 30 13.6 16–20 39 17.6
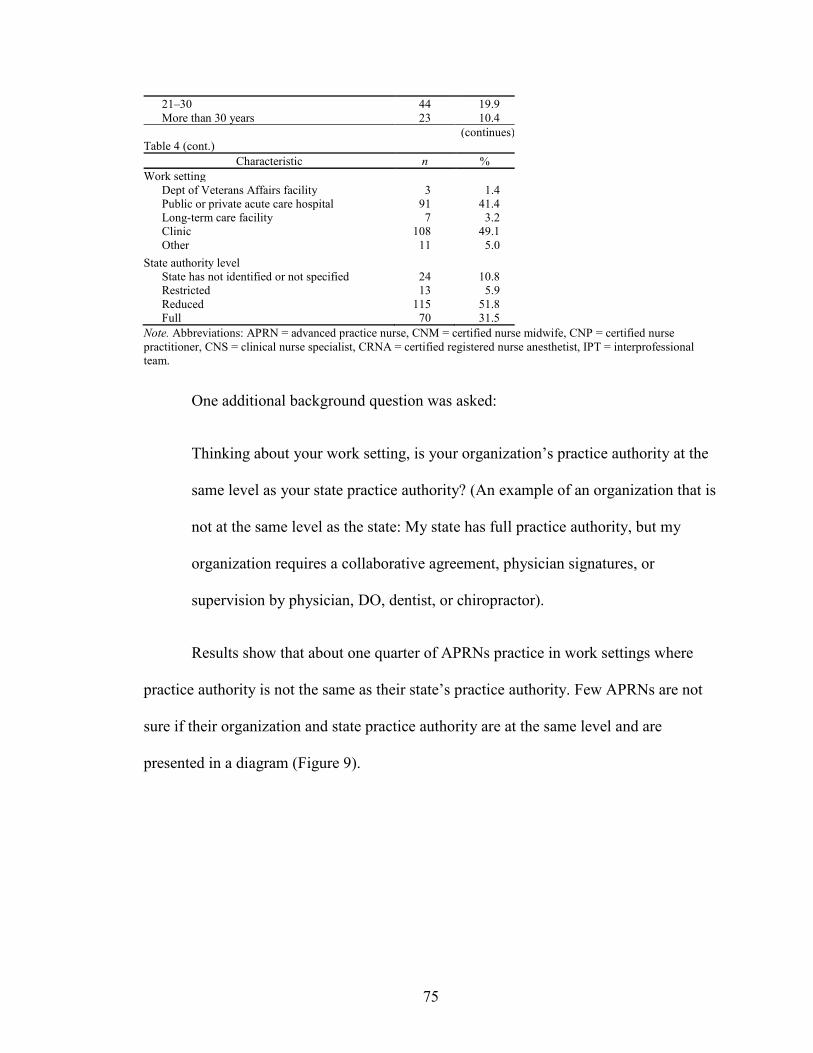
75
21–30 44 19.9 More than 30 years 23 10.4
(continues) Table 4 (cont.)
Characteristic n % Work setting
Dept of Veterans Affairs facility 3 1.4 Public or private acute care hospital 91 41.4 Long-term care facility 7 3.2 Clinic 108 49.1 Other 11 5.0
State authority level State has not identified or not specified 24 10.8 Restricted 13 5.9 Reduced 115 51.8 Full 70 31.5
Note. Abbreviations: APRN = advanced practice nurse, CNM = certified nurse midwife, CNP = certified nurse practitioner, CNS = clinical nurse specialist, CRNA = certified registered nurse anesthetist, IPT = interprofessional team.
One additional background question was asked:
Thinking about your work setting, is your organization’s practice authority at the
same level as your state practice authority? (An example of an organization that is
not at the same level as the state: My state has full practice authority, but my
organization requires a collaborative agreement, physician signatures, or
supervision by physician, DO, dentist, or chiropractor).
Results show that about one quarter of APRNs practice in work settings where
practice authority is not the same as their state’s practice authority. Few APRNs are not
sure if their organization and state practice authority are at the same level and are
presented in a diagram (Figure 9).
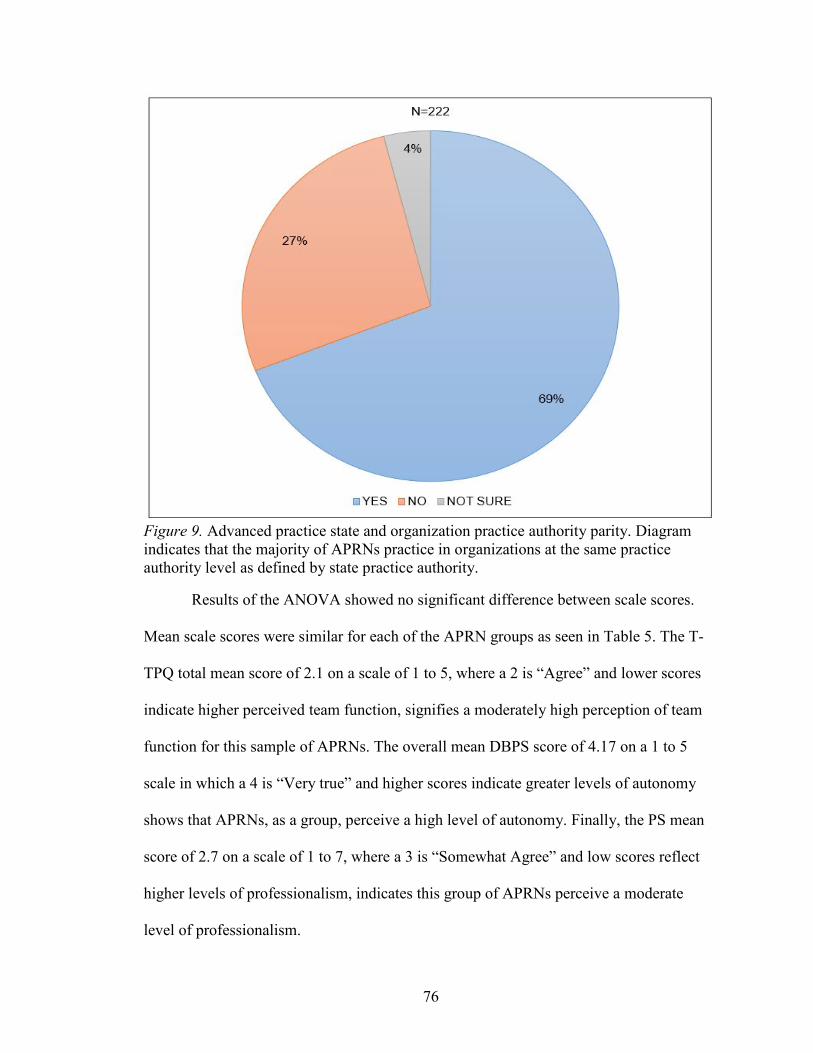
76
Figure 9. Advanced practice state and organization practice authority parity. Diagram indicates that the majority of APRNs practice in organizations at the same practice authority level as defined by state practice authority.
Results of the ANOVA showed no significant difference between scale scores.
Mean scale scores were similar for each of the APRN groups as seen in Table 5. The T-
TPQ total mean score of 2.1 on a scale of 1 to 5, where a 2 is “Agree” and lower scores
indicate higher perceived team function, signifies a moderately high perception of team
function for this sample of APRNs. The overall mean DBPS score of 4.17 on a 1 to 5
scale in which a 4 is “Very true” and higher scores indicate greater levels of autonomy
shows that APRNs, as a group, perceive a high level of autonomy. Finally, the PS mean
score of 2.7 on a scale of 1 to 7, where a 3 is “Somewhat Agree” and low scores reflect
higher levels of professionalism, indicates this group of APRNs perceive a moderate
level of professionalism.

77
Table 5. Comparison of Mean Scores Between APRN Groups
Range Scale APRN type n M SD Min Max
TeamSTEPPS-Team Perception Questionnaire (T-TPQ®)a CNM 40 2.05 .53 1 3 CNP 131 2.17 .52 1 4 CNS 40 2.19 .46 1 3 CRNA 11 1.96 .47 1 3 Total 222 2.14 .51 1 4
Dempster Practice Behavior Scale (DPBS) CNM 40 4.17 .54 2 5 CNP 130 4.19 .44 3 5 CNS 40 4.11 .52 3 5 CRNA 11 4.16 .39 4 5 Total 221 4.17 .47 2 5
Professionalism Scale (PS)a CNM 40 2.51 .46 2 4 CNP 130 2.67 .53 1 4 CNS 40 2.75 .60 2 4 CRNA 11 2.69 .49 2 3 Total 221 2.65 .52 1 4
Note. Abbreviations: APRN = advanced practice nurse, CNM = certified nurse midwife, CNP = certified nurse practitioner, CNS = clinical nurse specialist, CRNA = certified registered nurse anesthetist, IPT = interprofessional team. a = for T-TPQ and PS scales, low scores indicate higher levels of IPT function and professionalism.
Preliminary analysis. Skewness, and kurtosis were evaluated for the normality of
the distribution of scores. Histograms show reasonably normal distribution with slightly
positive skewness for T-TPQ scale (.30, kurtosis .31) and PS scale (.18; kurtosis −.26).
The distribution of scale scores for DPBS showed slight negative skewness (−.65,) and
kurtosis of .69. Visual inspection of Q-Q, P–P, and box plots show relatively normal
distribution of mean scores (Tables J1.1–J1.4, J2.1–J2.4, J3.1–J3.4) with few outliers.
Finally, scatterplots show linear relationships. Specific tests are described in analysis of
each question.
Reliability assessment. The T-TPQ shows all but item one had a corrected item-
total correlation > .3. Cronbach’s alpha is. 95 for this sample of APRNs. For the DPBS
all but one item had corrected item-total correlation > .3 and Cronbach’s alpha of .93
indicating excellent internal consistency. The PS shows 11 of the 23 items with corrected
item-total correlation of > .3 with Cronbach’s alpha of .76.
Analysis of research questions. The analysis for each question is as follows:

78
Research Question 1. Is the level of state practice authority associated with
perceived IPT function in a national sample of APRNs?
Levene’s test checked for homogeneity of variance for the ANOVA and is not
statistically significant. The results of the ANOVA (Table 6) indicate no significant
relationship between state practice authority and IPT function (F (2, 221) = 0.43), p
= .65) and a small effect (η2 = .004). Also see Appendix K1 through K4. Since no
relationship between state practice authority and IPT function was established, path
analysis to determine mediation between state practice authority and IPT function was
not completed.
Table 6. Means, Standard Deviation, and One-Way Analysis of Variance Effects of State Practice Authority (SPA) and Interprofessional Team Function (T-TPQ)
Restricted SPA Reduced SPA Full SPA Variable M SD M SD M SD
T-TPQ 2.07 .44 2.16 .51 2.16 .54
Research Question 2. Is the relationship between state practice authority and
perception of IPT function mediated by autonomy in a national sample of APRNs?
The previous analysis indicates that the direct relationship between IPT function
and state practice authority was not significant and the hypothesized relationship was not
supported. Therefore, mediation using path analysis was not tested.
Subquestion 2a. Is there a relationship between level of state practice authority
and perceived autonomy in a national sample of APRNs?
An ANOVA was conducted to test the direct relationship between state practice
authority and mean scores from the DPBS. Levene’s test for homogeneity of variances
was not significant (p = .38) indicating that the assumption had not been violated. The
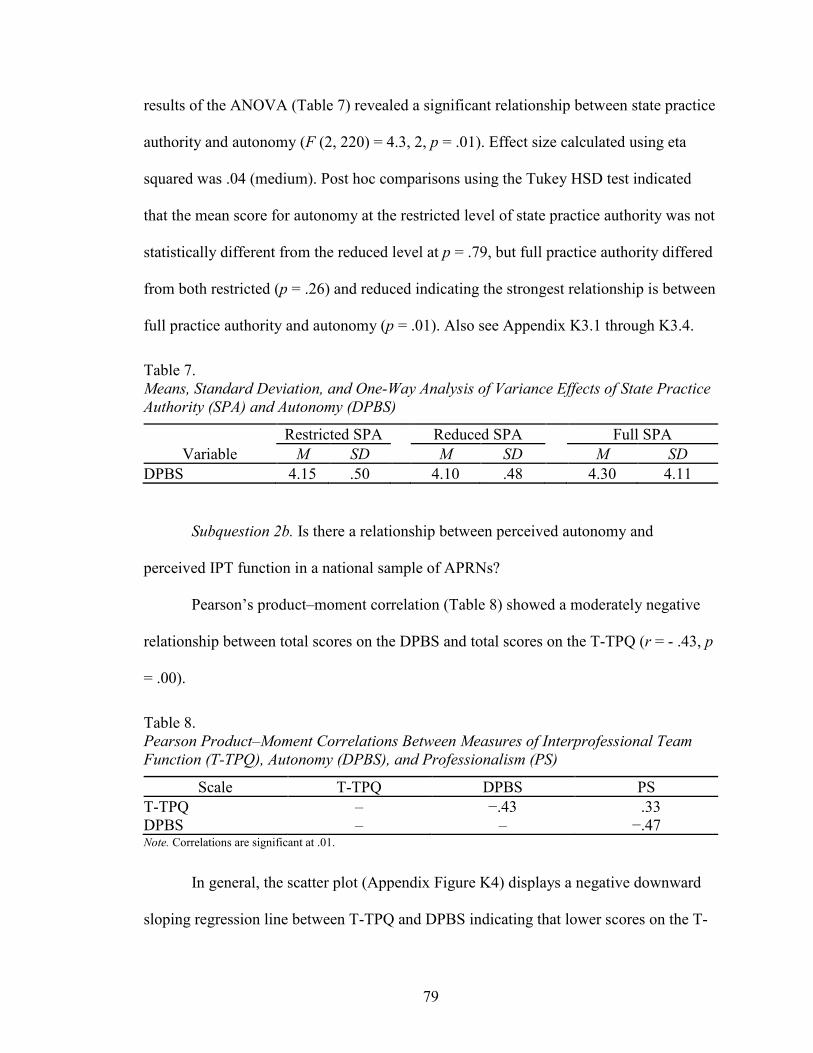
79
results of the ANOVA (Table 7) revealed a significant relationship between state practice
authority and autonomy (F (2, 220) = 4.3, 2, p = .01). Effect size calculated using eta
squared was .04 (medium). Post hoc comparisons using the Tukey HSD test indicated
that the mean score for autonomy at the restricted level of state practice authority was not
statistically different from the reduced level at p = .79, but full practice authority differed
from both restricted (p = .26) and reduced indicating the strongest relationship is between
full practice authority and autonomy (p = .01). Also see Appendix K3.1 through K3.4.
Table 7. Means, Standard Deviation, and One-Way Analysis of Variance Effects of State Practice Authority (SPA) and Autonomy (DPBS)
Restricted SPA Reduced SPA Full SPA Variable M SD M SD M SD
DPBS 4.15 .50 4.10 .48 4.30 4.11
Subquestion 2b. Is there a relationship between perceived autonomy and
perceived IPT function in a national sample of APRNs?
Pearson’s product–moment correlation (Table 8) showed a moderately negative
relationship between total scores on the DPBS and total scores on the T-TPQ (r = - .43, p
= .00).
Table 8. Pearson Product–Moment Correlations Between Measures of Interprofessional Team Function (T-TPQ), Autonomy (DPBS), and Professionalism (PS)
Scale T-TPQ DPBS PS T-TPQ – −.43 .33 DPBS – – −.47 Note. Correlations are significant at .01.
In general, the scatter plot (Appendix Figure K4) displays a negative downward
sloping regression line between T-TPQ and DPBS indicating that lower scores on the T-
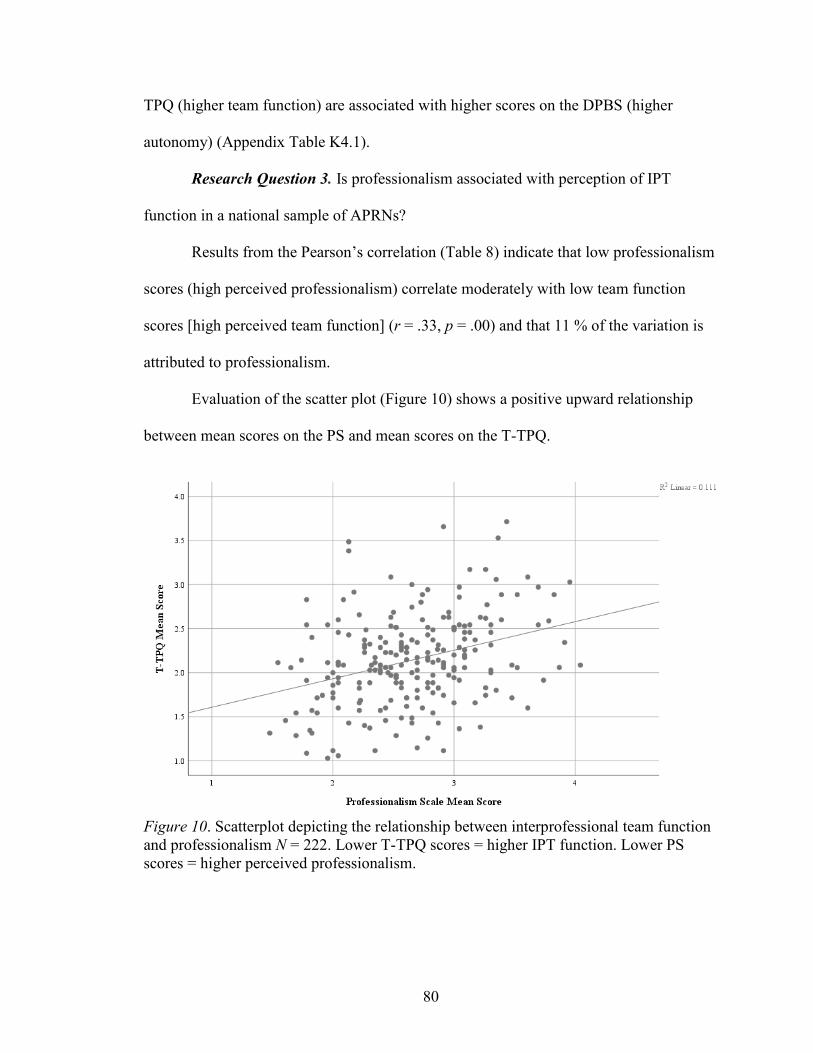
80
TPQ (higher team function) are associated with higher scores on the DPBS (higher
autonomy) (Appendix Table K4.1).
Research Question 3. Is professionalism associated with perception of IPT
function in a national sample of APRNs?
Results from the Pearson’s correlation (Table 8) indicate that low professionalism
scores (high perceived professionalism) correlate moderately with low team function
scores [high perceived team function] (r = .33, p = .00) and that 11 % of the variation is
attributed to professionalism.
Evaluation of the scatter plot (Figure 10) shows a positive upward relationship
between mean scores on the PS and mean scores on the T-TPQ.
Figure 10. Scatterplot depicting the relationship between interprofessional team function and professionalism N = 222. Lower T-TPQ scores = higher IPT function. Lower PS scores = higher perceived professionalism.
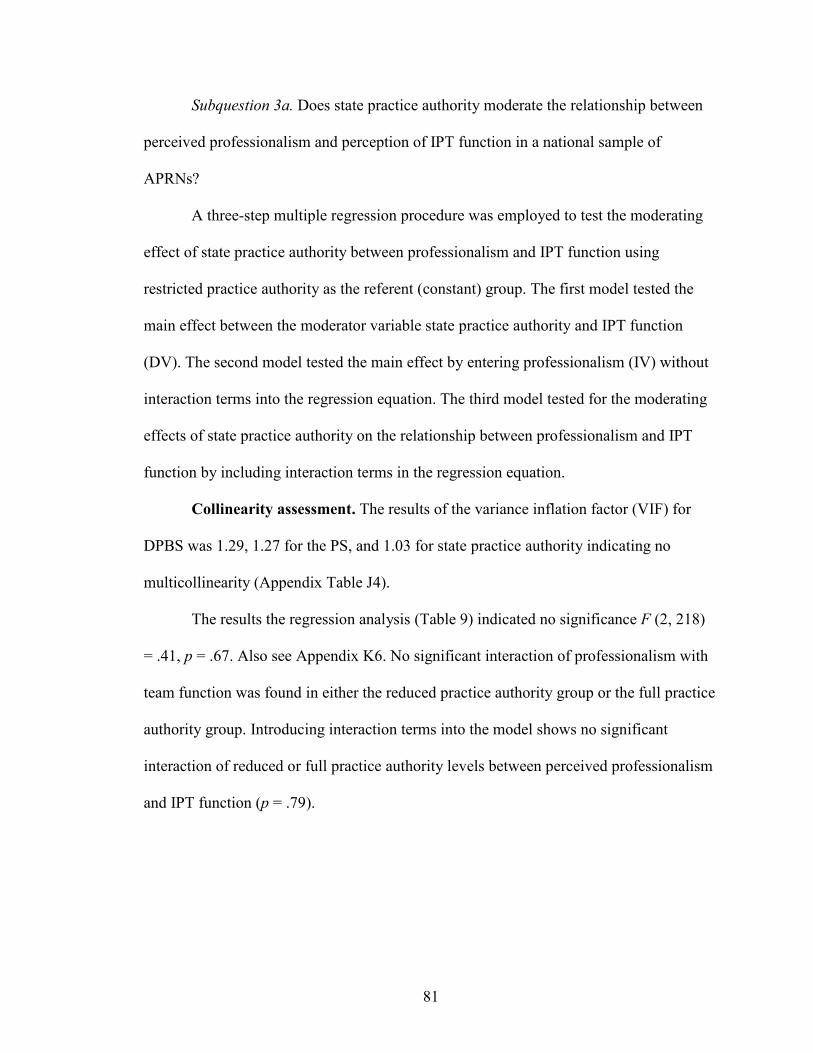
81
Subquestion 3a. Does state practice authority moderate the relationship between
perceived professionalism and perception of IPT function in a national sample of
APRNs?
A three-step multiple regression procedure was employed to test the moderating
effect of state practice authority between professionalism and IPT function using
restricted practice authority as the referent (constant) group. The first model tested the
main effect between the moderator variable state practice authority and IPT function
(DV). The second model tested the main effect by entering professionalism (IV) without
interaction terms into the regression equation. The third model tested for the moderating
effects of state practice authority on the relationship between professionalism and IPT
function by including interaction terms in the regression equation.
Collinearity assessment. The results of the variance inflation factor (VIF) for
DPBS was 1.29, 1.27 for the PS, and 1.03 for state practice authority indicating no
multicollinearity (Appendix Table J4).
The results the regression analysis (Table 9) indicated no significance F (2, 218)
= .41, p = .67. Also see Appendix K6. No significant interaction of professionalism with
team function was found in either the reduced practice authority group or the full practice
authority group. Introducing interaction terms into the model shows no significant
interaction of reduced or full practice authority levels between perceived professionalism
and IPT function (p = .79).
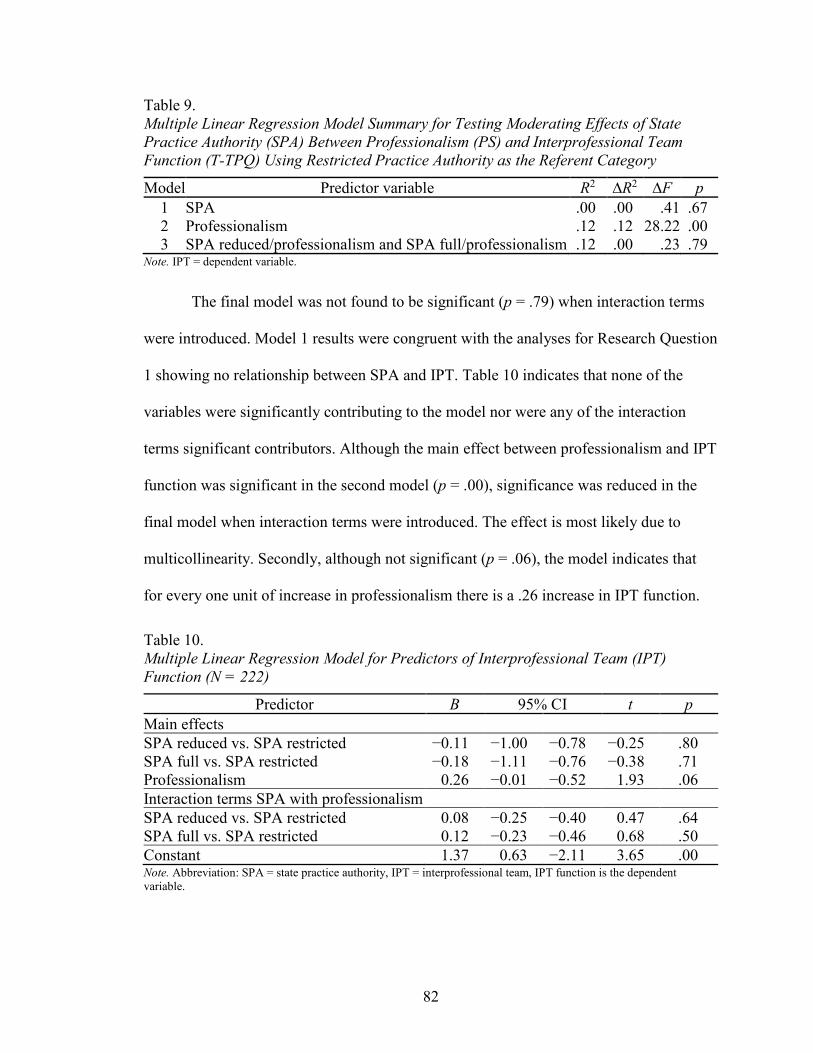
82
Table 9. Multiple Linear Regression Model Summary for Testing Moderating Effects of State Practice Authority (SPA) Between Professionalism (PS) and Interprofessional Team Function (T-TPQ) Using Restricted Practice Authority as the Referent Category
Model Predictor variable R2 ∆R2 ∆F p 1 SPA .00 .00 .41 .67 2 Professionalism .12 .12 28.22 .00 3 SPA reduced/professionalism and SPA full/professionalism .12 .00 .23 .79
Note. IPT = dependent variable.
The final model was not found to be significant (p = .79) when interaction terms
were introduced. Model 1 results were congruent with the analyses for Research Question
1 showing no relationship between SPA and IPT. Table 10 indicates that none of the
variables were significantly contributing to the model nor were any of the interaction
terms significant contributors. Although the main effect between professionalism and IPT
function was significant in the second model (p = .00), significance was reduced in the
final model when interaction terms were introduced. The effect is most likely due to
multicollinearity. Secondly, although not significant (p = .06), the model indicates that
for every one unit of increase in professionalism there is a .26 increase in IPT function.
Table 10. Multiple Linear Regression Model for Predictors of Interprofessional Team (IPT) Function (N = 222)
Predictor B 95% CI t p Main effects SPA reduced vs. SPA restricted −0.11 −1.00 −0.78 −0.25 .80 SPA full vs. SPA restricted −0.18 −1.11 −0.76 −0.38 .71 Professionalism 0.26 −0.01 −0.52 1.93 .06 Interaction terms SPA with professionalism SPA reduced vs. SPA restricted 0.08 −0.25 −0.40 0.47 .64 SPA full vs. SPA restricted 0.12 −0.23 −0.46 0.68 .50 Constant 1.37 0.63 −2.11 3.65 .00 Note. Abbreviation: SPA = state practice authority, IPT = interprofessional team, IPT function is the dependent variable.
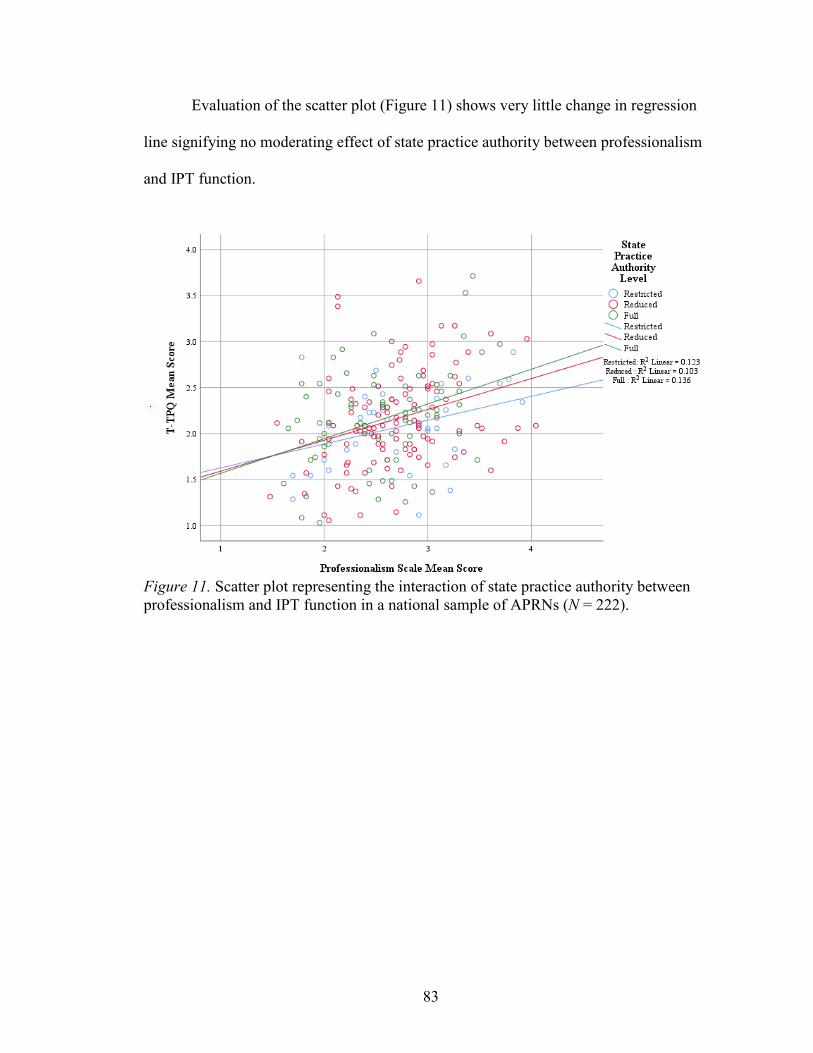
83
Evaluation of the scatter plot (Figure 11) shows very little change in regression
line signifying no moderating effect of state practice authority between professionalism
and IPT function.
Figure 11. Scatter plot representing the interaction of state practice authority between professionalism and IPT function in a national sample of APRNs (N = 222).
84
CHAPTER 5
DISCUSSION
This study was designed to (1) determine if environmental factors (state practice
authority) have a direct or indirect effect on APRN perception of IPT function; (2)
examine the extent to which APRN perception of autonomy and professionalism directly
and significantly associate with APRN perception of (IPT) function; (3) determine the
extent to which APRN perception of autonomy mediates the relationship between state
practice authority and IPT function, and (4) to determine the extent to which state
practice authority moderates the relationship between APRN perception of
professionalism and IPT function in a national sample of APRNs in the United States. A
considerable amount of literature exists about autonomy, professionalism, and IPT
function, separately in healthcare settings. However, no studies were found that examine
state practice authority, perceived autonomy and professionalism together or their
influence on perceived IPT function. As described in Chapter 2, this study was guided by
the underlying theories of identity, specifically professional identity, which implies that
high levels of autonomy and professionalism (professional identity components)
associate with higher-levels of interaction with others (Tajfel & Turner, 1979), as is
necessary when working with an IPT.
Since nurse practitioners (NPs) represent the most significant number of APRNs
nation-wide, it is not surprising that this study had more NP respondents than any other
group. Although in general, a broad representation of the four groups of APRNs from
across the country who work in a variety of settings with interprofessional teams made up
the sample. Furthermore, most of the respondents reported working with teams of more

85
than four members. More than half of the respondents reported working with an IPT for
more than ten years which would imply that this group of APRNs might work in
environments with higher levels of professionalism, autonomy, and team function.
State Practice Authority
All levels of state practice authority were reported with reduced practice authority
being the most represented among this group of APRNs. Surprisingly, about one-quarter
of the APRNs reported working in environments with different practice authority than
state practice authority. Although the survey question did not ask the specific direction of
difference, this finding implies more restriction on practice because organizations cannot
allow a greater degree of practice authority than the state regulation for APRN scope of
practice. For example, organizations cannot allow APRNs to practice without some
oversight in a state with restricted practice authority which requires supervision by a
physician.
As discussed in previous chapters, significant variation exists between states’
APRN scope of practice regulation. The inconsistency of regulatory language and
acknowledgement of the APRN title across states makes comparisons challenging and
difficult to determine the quality of results. This study included all APRNs as a single
group. However, a more in-depth analysis of the different APRN groups and their
respective state practice authority levels would be needed to determine the full effect of
state practice authority on specific groups.
86
Autonomy, State Practice Authority, and IPT Function
This study sought to determine if perceived autonomy has a direct effect or
mediates the relationship between state practice authority and IPT function. As discussed
in Chapter 1, individual team members contribute to a team’s function overall, and since
autonomy is a necessary component of optimal APRN function, it is logical to assume
that autonomy is a significant contributor to IPT function.
APRNs value autonomy and view autonomy as a necessary component of APRN
practice (Almost and Laschinger, 2002, Dempster, 1990, 2009, & Piil, Kolbaek, Ottmann,
and Rasmussen, 2012). In this study, APRNs in states with full and reduced practice
authority reported higher perceived autonomy than APRNs in states with restricted
practice authority. These findings are similar to those in a study by Peterson et al. (2015),
which found high levels of autonomy among APRNs in New Mexico, a full practice
authority state. Also, the analyses show a significant moderate association of the
relationship between autonomy and state practice authority. Other studies have similar
findings in that restrictive practice environments, such as state laws and regulations,
reduce levels of APRN autonomy (Pan, Straub, & Geller, 1997).
A variety of factors that this study did not address might contribute to the high
level of autonomy in APRNs. For example, specific APRN education programs might
instill a higher level of autonomy among graduates than others. Secondly, the sample was
similar to other studies in that this study used a convenience sample and the majority of
respondents in this study were NPs. Also, the majority of respondents were white,
female, and middle-aged which could explain higher autonomy scores related to more life
experience. The length of APRN practice tenure and practice experience might also

87
contribute to higher levels of autonomy as APRNs become more confident in their
knowledge and skills. A more in-depth analysis would be necessary to determine this
relationship since the length of APRN practice tenure for APRNs in this study was fairly
evenly distributed and no significant difference between the groups’ DPBS scale scores
was found.
Furthermore, the results of the analysis show that higher levels of autonomy and
higher levels of team function are moderately related which was similar to results found
in earlier studies by Poghosyan and Liu (2016). Although this study used a correlational,
rather than a causal study design, these findings suggest IPTs with autonomous APRN
members may function at higher levels. Since higher team function is associated with
better patient outcomes (IOM, 2001, 2010), providing supportive environments such as
less restrictive rules and by-laws in work settings in which APRNs can function at their
optimal scope of practice may be beneficial to both IPTs and patients.
However, one limitation of this study is that the relatively high perceived IPT
function scores found in this sample resulted in lack of variation in T-TPQ scores and
possible difficulty detecting differences or effects of variations between the three levels
of state practice authority. Secondly, this sample consisted of more experienced APRNs;
the environmental effects, such as work setting and IPT structure, on the perception of
IPT function might be different for less experienced APRNs working with IPTs. Finally,
the majority of APRNs in this study worked in teams with four or more members, and
many worked in teams of more than five members. This study did not consider whether
the APRNs were working in the same IPTs with the same members or different IPTs with
different members which might have produced a different survey response. More

88
research is needed to examine IPT structure, professional mix, and size compared to
experience levels of APRNs to help understand how these structural environmental
factors and autonomy contribute to IPT function.
Professionalism and IPT Function
Studies that examined the relationship between professionalism and APRN
perception of IPT function could not be found. This study addressed the gap and explored
the possible moderating effect of state practice authority between perceived
professionalism and IPT function. Additionally, comparative studies could not be found
that measured professionalism of APRNs at the professional stage. This study measured
professionalism of APRNs who had worked in IPTs for at least six months. APRNs in
this study perceive a moderate level of professionalism and a moderately high level of
IPT function as evidenced by the mean scores on the PS and T-TPQ. Consistent with the
assumption that professionalism is a necessary component of highly functional teams, the
results of this study found a significant relationship between professionalism and IPT
function. This is an important finding because if professionalism is related to IPT
function and IPT function is associated with patient outcomes, then fostering higher
professionalism in APRNs becomes a high priority to achieve better IPT function and
improved patient outcomes.
Even though a relationship exists between professionalism and IPT function, the
analysis shows that state practice authority did not moderate the relationship in this group
of APRNs. This is an interesting finding. One would assume that the APRN’s perception
of professionalism as it relates to IPT function would change or be different depending on
their scope of practice which is regulated by the state’s practice authority. A comparison
89
study to determine if APRNs perceive higher professionalism and IPT function in states
with full versus reduced or restricted practice authority at both the state and organization
levels would be helpful in understanding these relationships. Additionally, more than half
of APRNs in this study had worked as an APRN for more than ten years and with IPTs
more than ten years. Comparatively, the study by Adam’s and Miller’s (2001) found high
professionalism scores among NPs who worked less than five years which would imply
professionalism is established early and continues throughout APRN practice tenure.
Comparison studies to determine if length of APRN tenure affects perception of
professionalism and if length of tenure working with an IPT (or the same IPT) influences
perception of professionalism or IPT function would be useful in determining the
significance of these relationships.
Implications
Nursing Science and Research
This study supports existing knowledge in nursing science regarding autonomy
and professionalism among APRNs. Consistently autonomy is found to be a major
influence among APRNs. This study found a significant relationship between autonomy
and IPT function. The analyses also show an association between professionalism and
IPT function. However, this study examined only one disciplinary group of the IPT
which might not be an accurate representation of how IPTs function overall. A study
using mixed-methods design to gain a broader perspective of the significance of
autonomy and professionalism with IPT function using an interdisciplinary sample of
team members would provide richer data and better inform interdisciplinary program
development strategies.
90
The results of the analyses provide new knowledge regarding relationships
between IPT function, APRN practice authority, perceived autonomy, and
professionalism. No other study has examined the effects of state practice authority on
IPT function. This study found no direct effects between these two variables. However,
possible indirect effects might exist. More rigorous methods using more sophisticated
analysis such as structural equation modeling would be useful in determining the possible
indirect effects, including identifying confounding variables and causal effects that could
influence IPT function. Since this study used a convenience sample causal effects could
not be established.
Health Policy
The need to examine how IPTs function and regulatory components such as states’
APRN scope of practice are consistently acknowledged among agencies concerned about
healthcare outcomes and healthcare policy (IOM, 2001, 2011). Our understanding of the
implications of care delivery using IPTs is limited. This study contributes to the body of
knowledge that currently exists and provides new insight regarding states’ APRN
practice authority and the relationship to IPT function. More research would necessary to
substantiate this study’s findings. However, since no significant relationship was found
between state practice authority and IPT function in this sample; efforts to further
examine these relationships might not be practical. Instead, researchers might focus
efforts on examining influencing factors at the local IPT level such as management
structures and practices, hierarchical factors, and organizational or institutional rules and
regulations that regulate scope of practice within specific health delivery systems and the
effects of these structures on IPT function. The results of such studies might be beneficial
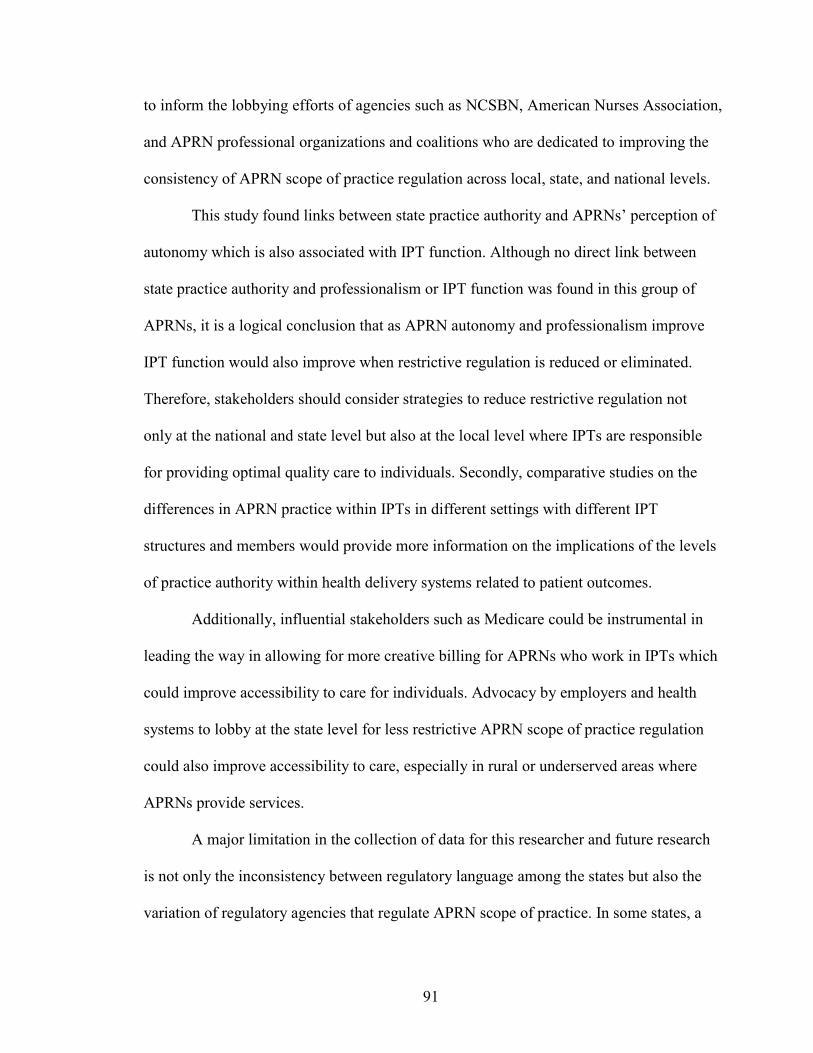
91
to inform the lobbying efforts of agencies such as NCSBN, American Nurses Association,
and APRN professional organizations and coalitions who are dedicated to improving the
consistency of APRN scope of practice regulation across local, state, and national levels.
This study found links between state practice authority and APRNs’ perception of
autonomy which is also associated with IPT function. Although no direct link between
state practice authority and professionalism or IPT function was found in this group of
APRNs, it is a logical conclusion that as APRN autonomy and professionalism improve
IPT function would also improve when restrictive regulation is reduced or eliminated.
Therefore, stakeholders should consider strategies to reduce restrictive regulation not
only at the national and state level but also at the local level where IPTs are responsible
for providing optimal quality care to individuals. Secondly, comparative studies on the
differences in APRN practice within IPTs in different settings with different IPT
structures and members would provide more information on the implications of the levels
of practice authority within health delivery systems related to patient outcomes.
Additionally, influential stakeholders such as Medicare could be instrumental in
leading the way in allowing for more creative billing for APRNs who work in IPTs which
could improve accessibility to care for individuals. Advocacy by employers and health
systems to lobby at the state level for less restrictive APRN scope of practice regulation
could also improve accessibility to care, especially in rural or underserved areas where
APRNs provide services.
A major limitation in the collection of data for this researcher and future research
is not only the inconsistency between regulatory language among the states but also the
variation of regulatory agencies that regulate APRN scope of practice. In some states, a
92
board of nursing regulates APRN practice, in other states, the Department of Health or
the Board of Medicine regulates APRN practice. Some states require an additional
oversight from a Board of Pharmacy. Some states limit APRN practice authority to
specific APRN groups and exclude others or specify different levels of practice authority
for different APRN groups. Furthermore, several certifying agencies exist for national
certification and not all certifications are accepted by state regulatory agencies for
licensing. These inconsistencies and variations make accurate data collection and analysis
challenging which in turn limits the ability to provide stakeholders and policymakers with
precise data for decision-making.
Conclusion
The literature establishes autonomy and professionalism as essential components
of APRN professional practice. This study corroborates previous nursing research
regarding the importance of autonomous practice among APRNs and suggests that the
autonomous practice of individual team members contributes to the overall function of
IPTs. Additionally, the literature suggests that restrictive regulatory rules reduce APRN
autonomy which was, in part, the rationale for exploring the relationship that state
practice authority would have on IPTs. Even though no direct relationship exists between
state practice authority and IPT function among this group of APRNs, significant
relationships exist between state practice authority and autonomy and between autonomy,
professionalism and IPT function. Many unknown factors could influence these
relationships including sociocultural, individual, educational, environmental, and
economic factors; more research is needed to examine their contribution to IPT function
if any.

93
APPENDICES
Appendix A Power Analysis .............................................................................................94 Appendix B Email Invitation ............................................................................................99 Appendix C Screening Items ..........................................................................................100 Appendix D University of New Mexico Health Sciences Center Informed Consent.....101 Appendix E Study Questionnaire....................................................................................103 Appendix F Original Instruments for Measures .............................................................110 Appendix G Modification Details for Hall’s Professionalism Scale ..............................116 Appendix H State APRN Practice Authority Cross-reference Table .............................119 Appendix I Descriptives .................................................................................................123 Appendix J Preliminary Data Analysis ...........................................................................128 Appendix K Statistical Tests for Research Questions ....................................................141

94
APPENDIX A
POWER ANALYSIS
A1. A priori Power Against Sample Size Calculation
Figure A1. A priori calculations for power against a range of sample sizes using r = .20 effect size for correlation, f = 0.20 for ANOVA, and R2 = .04 for multiple regression using G*Power©. Faul, F., Erdfelder, E., Lane, A., & Buchner, A. (2007). G*Power (3.1) [Measurement instrument]. Retrieved from http://www.gpower.hhu.de/en.html
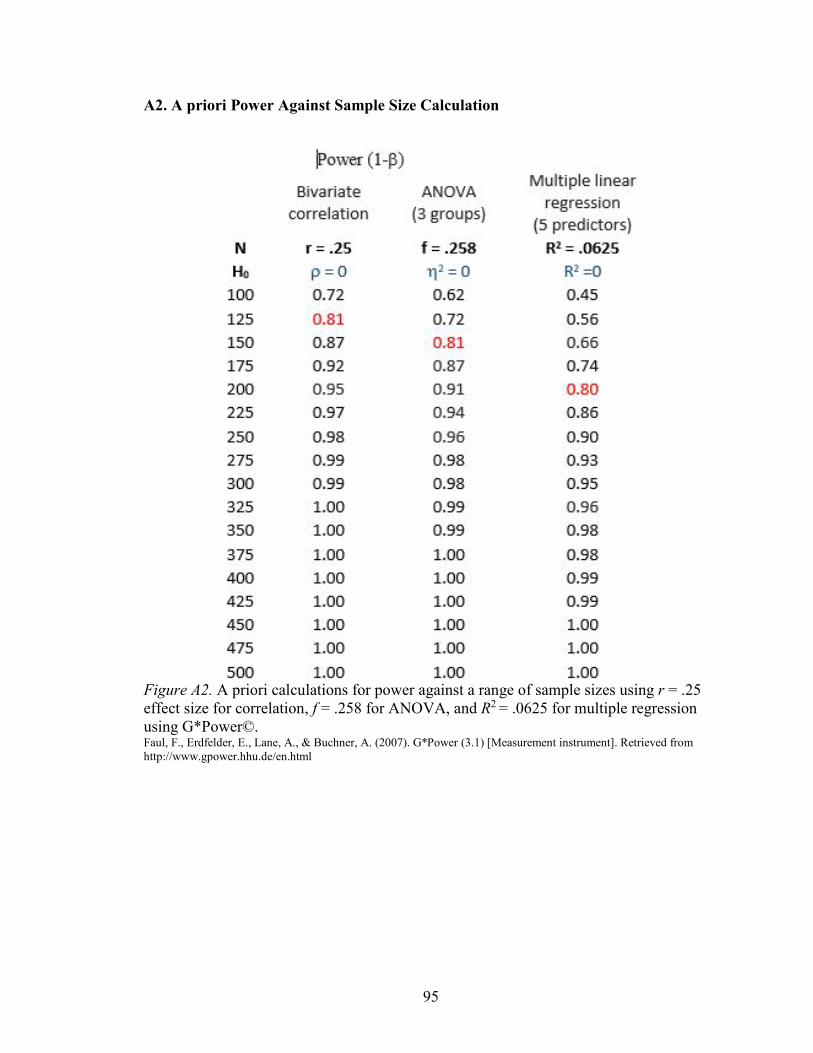
95
A2. A priori Power Against Sample Size Calculation
Figure A2. A priori calculations for power against a range of sample sizes using r = .25 effect size for correlation, f = .258 for ANOVA, and R2 = .0625 for multiple regression using G*Power©. Faul, F., Erdfelder, E., Lane, A., & Buchner, A. (2007). G*Power (3.1) [Measurement instrument]. Retrieved from http://www.gpower.hhu.de/en.html
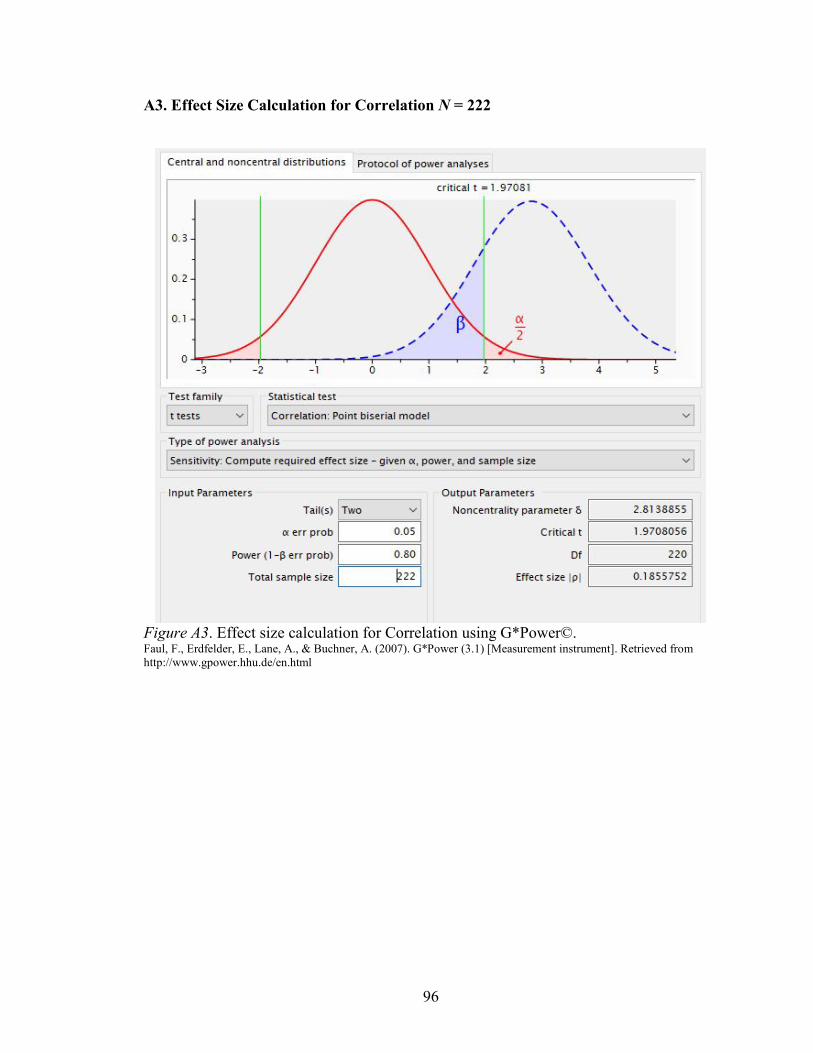
96
A3. Effect Size Calculation for Correlation N = 222
Figure A3. Effect size calculation for Correlation using G*Power©. Faul, F., Erdfelder, E., Lane, A., & Buchner, A. (2007). G*Power (3.1) [Measurement instrument]. Retrieved from http://www.gpower.hhu.de/en.html
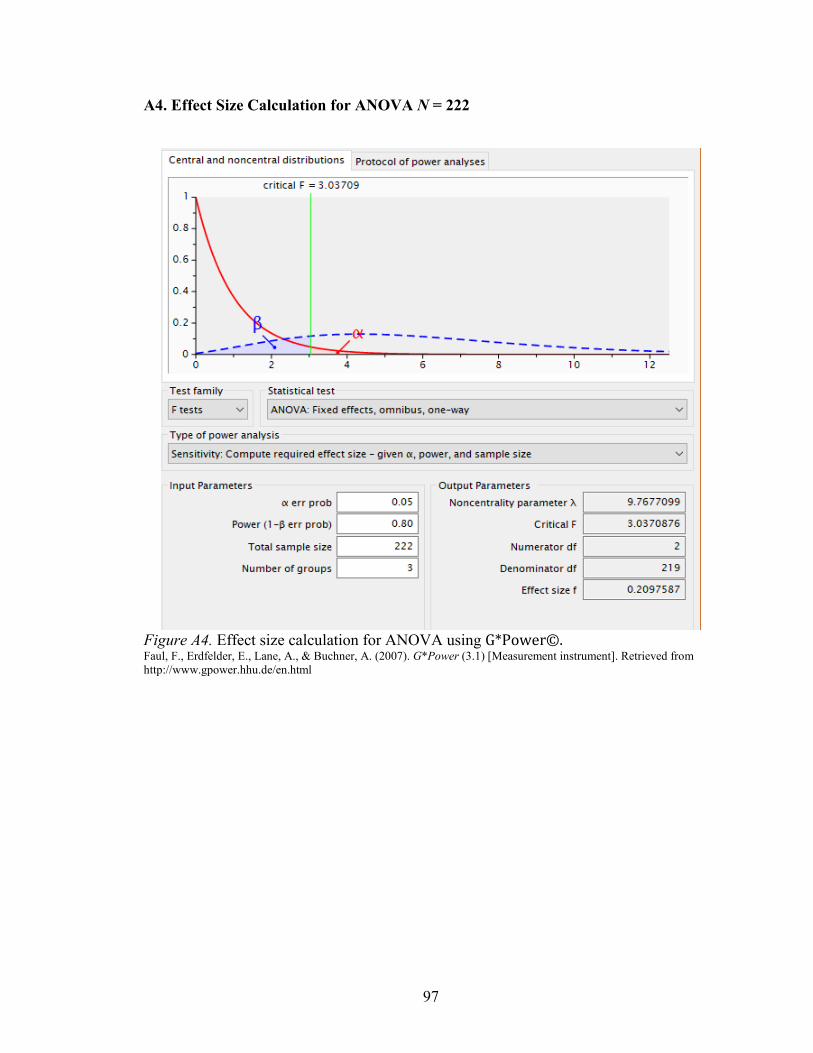
97
A4. Effect Size Calculation for ANOVA N = 222
Figure A4. Effect size calculation for ANOVA using G*Power©. Faul, F., Erdfelder, E., Lane, A., & Buchner, A. (2007). G*Power (3.1) [Measurement instrument]. Retrieved from http://www.gpower.hhu.de/en.html
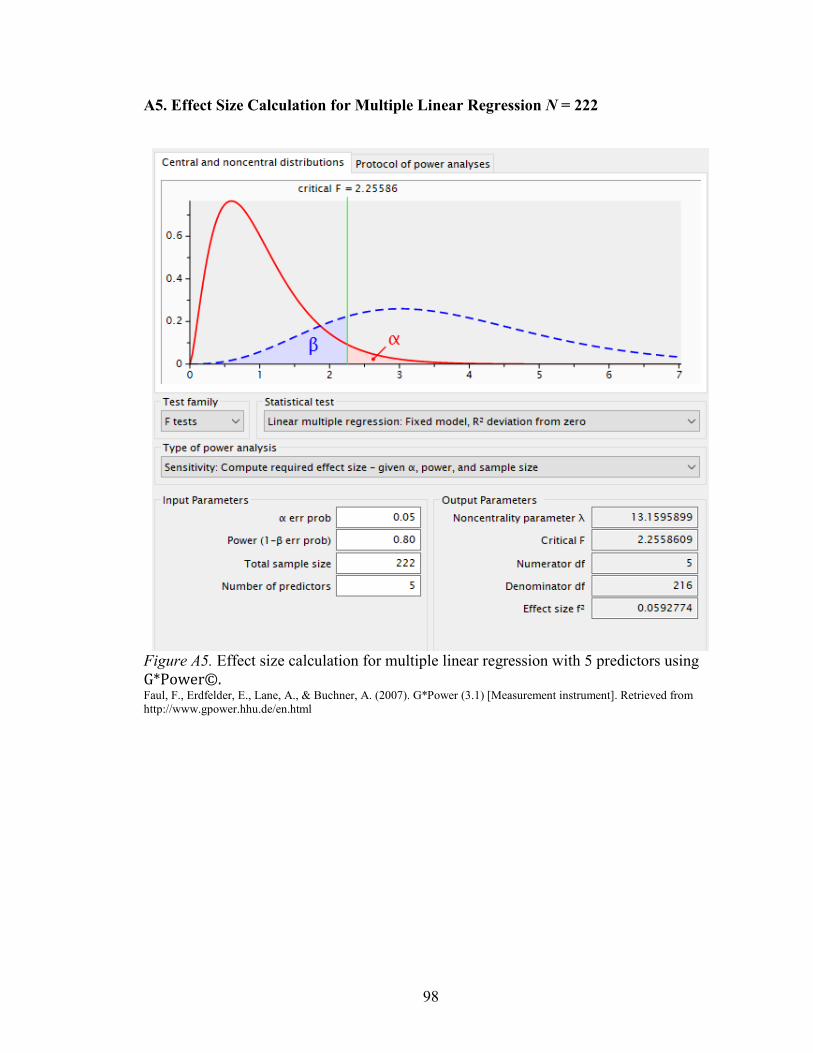
98
A5. Effect Size Calculation for Multiple Linear Regression N = 222
Figure A5. Effect size calculation for multiple linear regression with 5 predictors using G*Power©. Faul, F., Erdfelder, E., Lane, A., & Buchner, A. (2007). G*Power (3.1) [Measurement instrument]. Retrieved from http://www.gpower.hhu.de/en.html
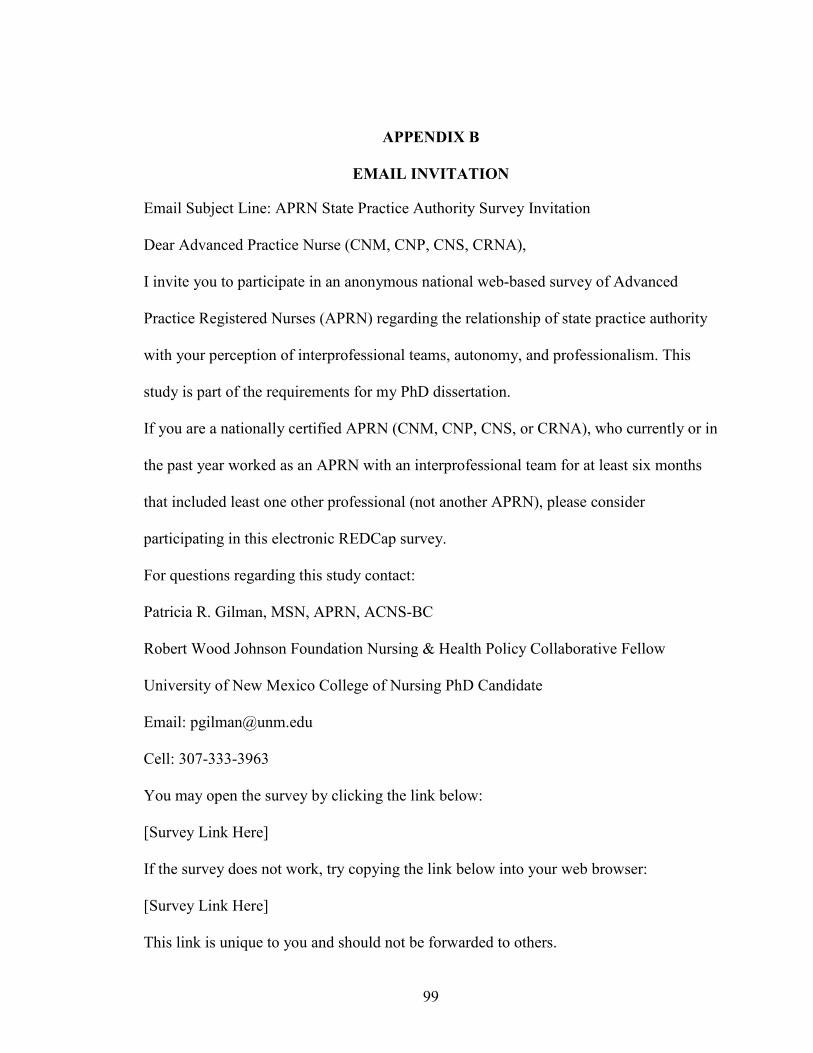
99
APPENDIX B
EMAIL INVITATION
Email Subject Line: APRN State Practice Authority Survey Invitation
Dear Advanced Practice Nurse (CNM, CNP, CNS, CRNA),
I invite you to participate in an anonymous national web-based survey of Advanced
Practice Registered Nurses (APRN) regarding the relationship of state practice authority
with your perception of interprofessional teams, autonomy, and professionalism. This
study is part of the requirements for my PhD dissertation.
If you are a nationally certified APRN (CNM, CNP, CNS, or CRNA), who currently or in
the past year worked as an APRN with an interprofessional team for at least six months
that included least one other professional (not another APRN), please consider
participating in this electronic REDCap survey.
For questions regarding this study contact:
Patricia R. Gilman, MSN, APRN, ACNS-BC
Robert Wood Johnson Foundation Nursing & Health Policy Collaborative Fellow
University of New Mexico College of Nursing PhD Candidate
Email: [email protected]
Cell: 307-333-3963
You may open the survey by clicking the link below:
[Survey Link Here]
If the survey does not work, try copying the link below into your web browser:
[Survey Link Here]
This link is unique to you and should not be forwarded to others.
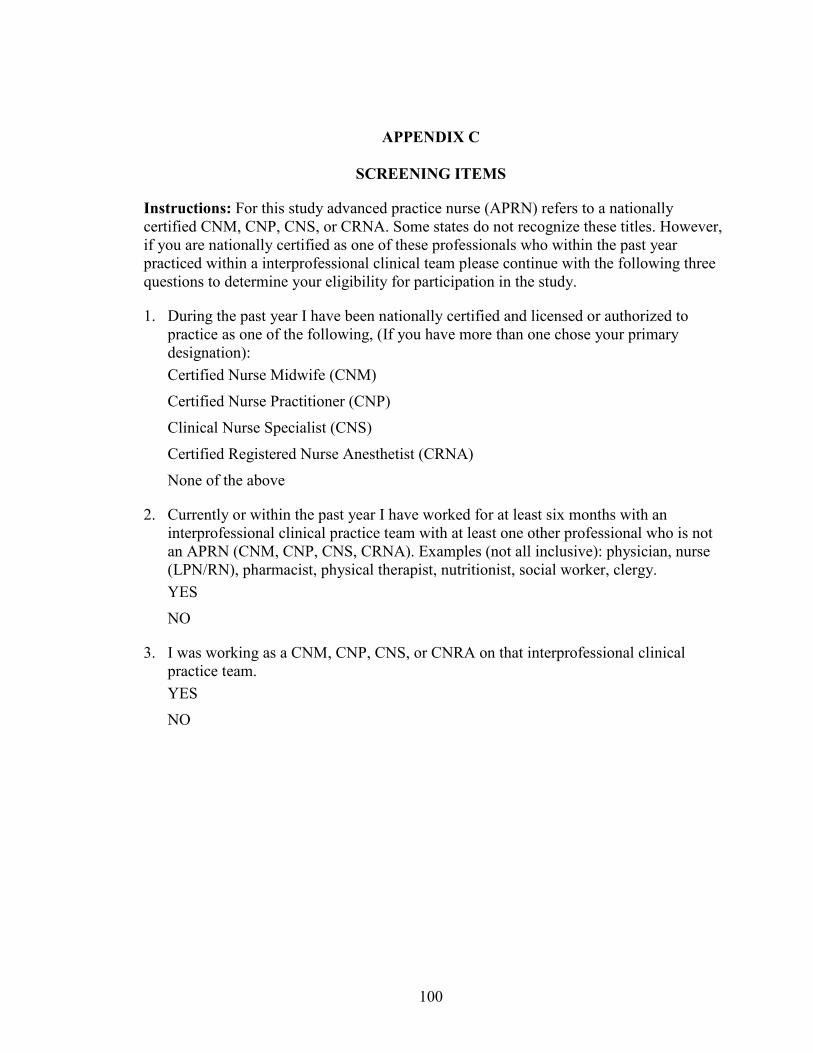
100
APPENDIX C
SCREENING ITEMS
Instructions: For this study advanced practice nurse (APRN) refers to a nationally certified CNM, CNP, CNS, or CRNA. Some states do not recognize these titles. However, if you are nationally certified as one of these professionals who within the past year practiced within a interprofessional clinical team please continue with the following three questions to determine your eligibility for participation in the study.
1. During the past year I have been nationally certified and licensed or authorized to practice as one of the following, (If you have more than one chose your primary designation): Certified Nurse Midwife (CNM) Certified Nurse Practitioner (CNP) Clinical Nurse Specialist (CNS) Certified Registered Nurse Anesthetist (CRNA) None of the above
2. Currently or within the past year I have worked for at least six months with an interprofessional clinical practice team with at least one other professional who is not an APRN (CNM, CNP, CNS, CRNA). Examples (not all inclusive): physician, nurse (LPN/RN), pharmacist, physical therapist, nutritionist, social worker, clergy. YES NO
3. I was working as a CNM, CNP, CNS, or CNRA on that interprofessional clinical practice team. YES NO
101
APPENDIX D
UNIVERSITY OF NEW MEXICO HEALTH SCIENCES CENTER INFORMED CONSENT
Relationships Between APRN State Practice Authority, Perceived Autonomy, Professionalism, and Interprofessional Team Function Among a National Sample of APRNs in the U.S. Dr. Beth Tigges, PhD, RN, PNP, BC and Patricia Gilman, MSN, APRN, ACNS-BC from the University of New Mexico College of Nursing are conducting a research study. The purpose of the study is to examine the relationships between Advanced Practice Registered Nurse (APRN) state practice authority, perceived autonomy, professionalism, and interprofessional team function among a national sample of APRNs. You are being asked to participate in this study because you are a nationally certified CNM, CNP, CNS, or CRNA who has in the past year or is currently practicing as such and who within the past year has worked in an interprofessional team setting for at least six months. Your participation will involve completing an anonymous, internet-based, self-administered survey. The survey should take about 30 minutes to complete. Your involvement in the study is voluntary, and you may choose not to participate. There are no names or identifying information associated with this survey. The survey includes questions such as “Staff relay relevant information in a timely manner,” “I have the power to influence decisions and actions of others,” and “The dedication of people in my APRN profession is gratifying.” You can refuse to answer any of the questions at any time. There are no known risks in this study, but some individuals may experience discomfort when answering questions. Emails will be deleted at the end of the survey period. All response data will be kept for three years on a secure server housed at the University of New Mexico and then destroyed (deleted). The findings from this project will provide information on the effect that state practice authority has on how APRNs perceive their autonomy, professionalism, and interprofessional team’s function. If published, results will be presented in summary form only. If you have any questions about this research project, please feel free to call Patricia Gilman at (307) 333-3963 or email at [email protected]. If you have questions regarding your legal rights as a research subject, you may call the UNMHSC Office of Human Research Protections at (505) 272-1129. By completing this internet-based survey, you will be agreeing to participate in the above described research study. Thank you for your consideration. Sincerely, Patricia Gilman, MSN, APRN, ACNS-BC PhD Candidate

102
University of New Mexico College of Nursing HRRC# Version Date 2-15-2018
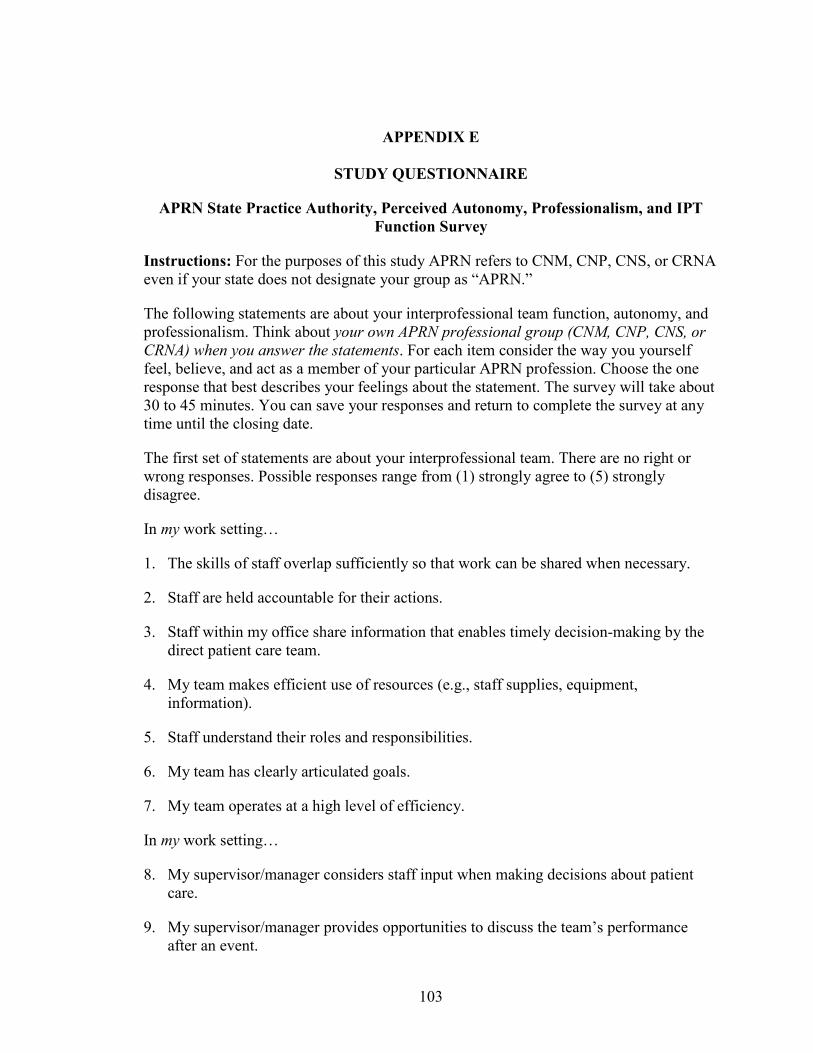
103
APPENDIX E
STUDY QUESTIONNAIRE
APRN State Practice Authority, Perceived Autonomy, Professionalism, and IPT Function Survey
Instructions: For the purposes of this study APRN refers to CNM, CNP, CNS, or CRNA even if your state does not designate your group as “APRN.”
The following statements are about your interprofessional team function, autonomy, and professionalism. Think about your own APRN professional group (CNM, CNP, CNS, or CRNA) when you answer the statements. For each item consider the way you yourself feel, believe, and act as a member of your particular APRN profession. Choose the one response that best describes your feelings about the statement. The survey will take about 30 to 45 minutes. You can save your responses and return to complete the survey at any time until the closing date.
The first set of statements are about your interprofessional team. There are no right or wrong responses. Possible responses range from (1) strongly agree to (5) strongly disagree.
In my work setting…
1. The skills of staff overlap sufficiently so that work can be shared when necessary.
2. Staff are held accountable for their actions.
3. Staff within my office share information that enables timely decision-making by the direct patient care team.
4. My team makes efficient use of resources (e.g., staff supplies, equipment, information).
5. Staff understand their roles and responsibilities.
6. My team has clearly articulated goals.
7. My team operates at a high level of efficiency.
In my work setting…
8. My supervisor/manager considers staff input when making decisions about patient care.
9. My supervisor/manager provides opportunities to discuss the team’s performance after an event.
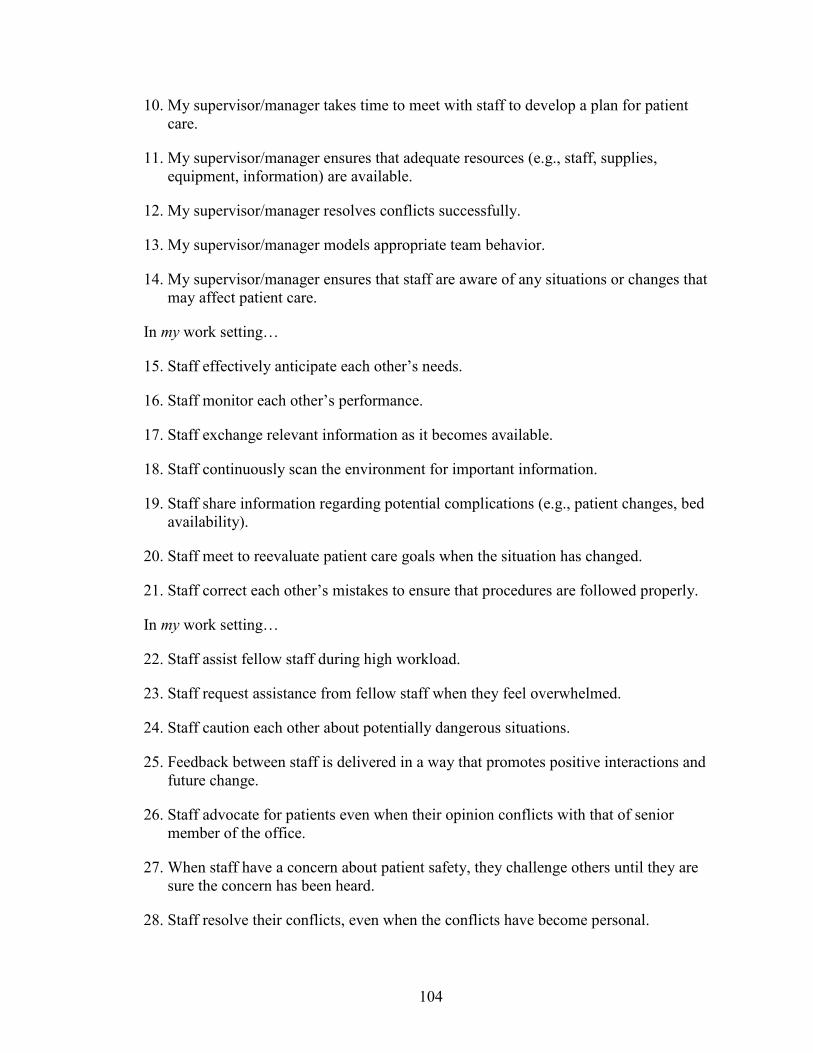
104
10. My supervisor/manager takes time to meet with staff to develop a plan for patient care.
11. My supervisor/manager ensures that adequate resources (e.g., staff, supplies, equipment, information) are available.
12. My supervisor/manager resolves conflicts successfully.
13. My supervisor/manager models appropriate team behavior.
14. My supervisor/manager ensures that staff are aware of any situations or changes that may affect patient care.
In my work setting…
15. Staff effectively anticipate each other’s needs.
16. Staff monitor each other’s performance.
17. Staff exchange relevant information as it becomes available.
18. Staff continuously scan the environment for important information.
19. Staff share information regarding potential complications (e.g., patient changes, bed availability).
20. Staff meet to reevaluate patient care goals when the situation has changed.
21. Staff correct each other’s mistakes to ensure that procedures are followed properly.
In my work setting…
22. Staff assist fellow staff during high workload.
23. Staff request assistance from fellow staff when they feel overwhelmed.
24. Staff caution each other about potentially dangerous situations.
25. Feedback between staff is delivered in a way that promotes positive interactions and future change.
26. Staff advocate for patients even when their opinion conflicts with that of senior member of the office.
27. When staff have a concern about patient safety, they challenge others until they are sure the concern has been heard.
28. Staff resolve their conflicts, even when the conflicts have become personal.
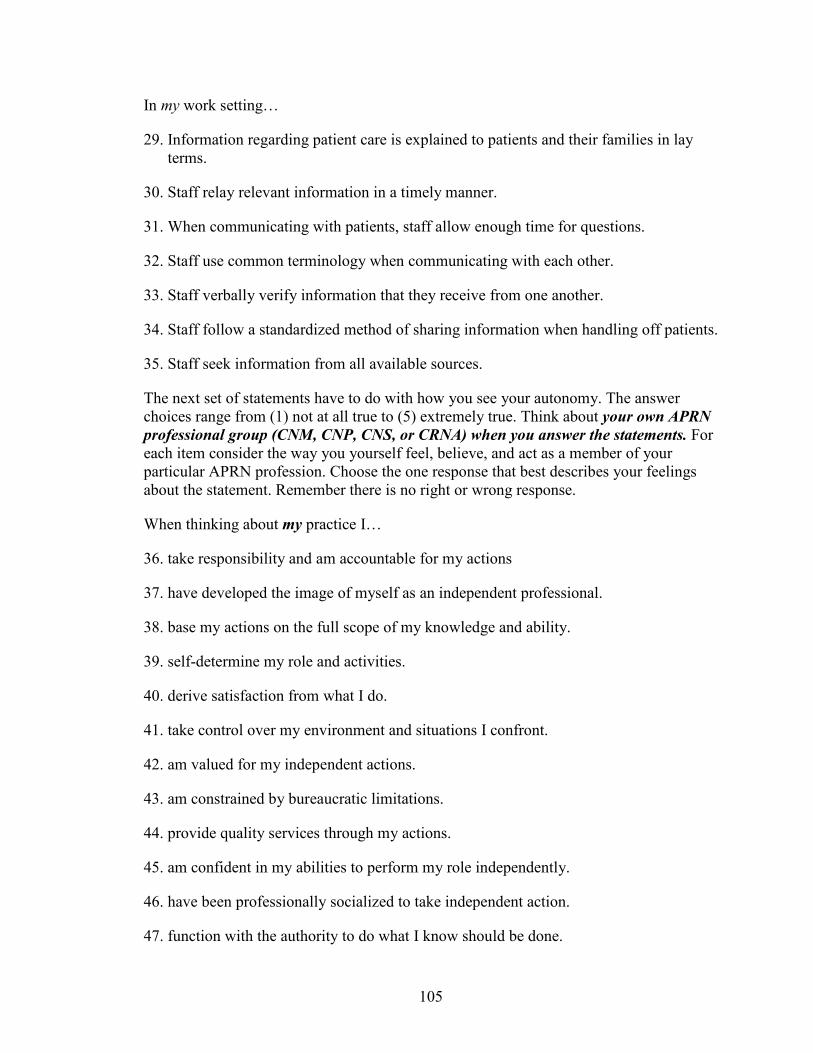
105
In my work setting…
29. Information regarding patient care is explained to patients and their families in lay terms.
30. Staff relay relevant information in a timely manner.
31. When communicating with patients, staff allow enough time for questions.
32. Staff use common terminology when communicating with each other.
33. Staff verbally verify information that they receive from one another.
34. Staff follow a standardized method of sharing information when handling off patients.
35. Staff seek information from all available sources.
The next set of statements have to do with how you see your autonomy. The answer choices range from (1) not at all true to (5) extremely true. Think about your own APRN professional group (CNM, CNP, CNS, or CRNA) when you answer the statements. For each item consider the way you yourself feel, believe, and act as a member of your particular APRN profession. Choose the one response that best describes your feelings about the statement. Remember there is no right or wrong response.
When thinking about my practice I…
36. take responsibility and am accountable for my actions
37. have developed the image of myself as an independent professional.
38. base my actions on the full scope of my knowledge and ability.
39. self-determine my role and activities.
40. derive satisfaction from what I do.
41. take control over my environment and situations I confront.
42. am valued for my independent actions.
43. am constrained by bureaucratic limitations.
44. provide quality services through my actions.
45. am confident in my abilities to perform my role independently.
46. have been professionally socialized to take independent action.
47. function with the authority to do what I know should be done.
106
48. have too many routine tasks to exercise independent action.
49. have a sense of professionalism.
50. have the rights and privileges I deserve.
51. have the professional experience needed for independent action.
52. am restrained in what I can do because I am powerless.
53. collaborate with others outside my field when I feel there is a need.
54. derive feelings of self-respect and esteem from what I do.
55. make my own decisions related to what I do.
56. possess ownership of my practice; that is, my role belongs to me.
57. have the power to influence decisions and actions of others.
58. have a sense of self-achievement.
59. am provided with legal basis for independent functioning.
60. demonstrate mastery of skills essential for freedom of action.
61. have my activities and actions programmed by others.
62. have the respect of those in other disciplines.
63. cannot optimally function because I do not have legal status.
64. establish the parameters and limits of my practice activities.
65. accept the consequences for the choices I make.
The next set of statements have to do with how you feel about your professionalism. The seven answer choices range from (1) strongly agree to (7) strongly disagree. Think about your own APRN professional group (CNM, CNP, CNS, or CRNA) when you answer the questions. For each item consider the way you yourself feel, believe, and act as a member of your particular APRN profession. Choose the one response that best describes your feelings about the statement. Remember there is no right or wrong response.
When thinking about my advanced practice profession…
66. I feel my APRN profession is essential to society.
67. I feel a real calling to my APRN profession.

107
68. The benefits my APRN professionals give to society are understated.
69. My APRN profession is an indispensable occupation.
70. If ever an occupation is indispensable, it is mine.
71. It encourages me to see the high level of idealism maintained by people in my APRN profession.
72. My APRN association does not do a great deal for me.
73. The dedication of people in my APRN profession is gratifying.
74. I believe professional APRN associations should be supported.
75. In my APRN profession, people believe in their work.
76. I systematically read my APRN professional publications.
77. I try to attend my APRN conferences at least annually.
78. Although I try, I do not read APRN journals often.
79. I make my own decisions regarding my work.
80. I do not have opportunities to exercise my own judgment.
81. My decisions are subject to review.
82. My enthusiasm for my APRN profession is not easy to maintain since there is not much autonomy.
83. Most of my decisions are reviewed.
84. I have ample opportunity to judge how other APRNs in my profession do their jobs.
85. I have a good idea how well others do their job.
86. We APRNs have a good idea about each other’s competence.
87. We APRNs do not have ways to judge each other’s competence.
88. APRNs do not know what APRN colleagues are doing.
Background Items
1. Please indicate how many different professions are represented in your interprofessional team. Include yourself and anyone different from your own
108
profession (not an APRN). Examples (not all inclusive): physician, nurse (LPN/RN), pharmacist, physical therapist, nutritionist, social worker, clergy 2–3 4–5 More than 5
2. How long have you worked in an interprofessional team with members other than APRNs? Less than 1 year More than 1 year but less than 5 years 5–10 years More than 10 years
3. What age group are you in? 20–24 25–35 36–45 46–55 56–65 Over 65
4. What gender do you most identify with? Female Male Other Gender Prefer not to answer (unspecified)
5. Do you consider yourself to be Hispanic/Latino? YES NO
6. In addition, select one or more of the following racial categories to describe yourself. American Indian or Alaska Native Asian Black or African American Hispanic or Latino Native Hawaiian or Other Pacific Islander White
109
7. How many years have you worked as an APRN ? 1–5 years 6–10 years 11–15 years 16–20 years 21–30 years More than 30 years
8. What state do you primarily practice in as an APRN? (Pick one from drop down list)
9. Thinking about your work setting: Identify the type of setting where you primarily practice. Department of Veterans Affairs (VA) healthcare facility/clinic public or private acute care hospital (inpatient unit, ED) long-term care facility (rehab hospital, psychiatric facility, nursing home, other) clinic (primary, specialty, or urgent care) other (e.g., birthing center, surgery center)
10. Thinking about your work setting, is your organization’s practice authority at the same level as your state practice authority? (An example of an organization that is not at the same level as the state: My state has full practice authority, but my organization requires a collaborative agreement, physician signatures, or supervision by physician, DO, dentist, or chiropractor.) YES, my organization’s practice authority is at the same level as state practice authority. NO, my organization’s practice authority is not at the same level as my state practice authority. NOT SURE
Thank You for Your Participation
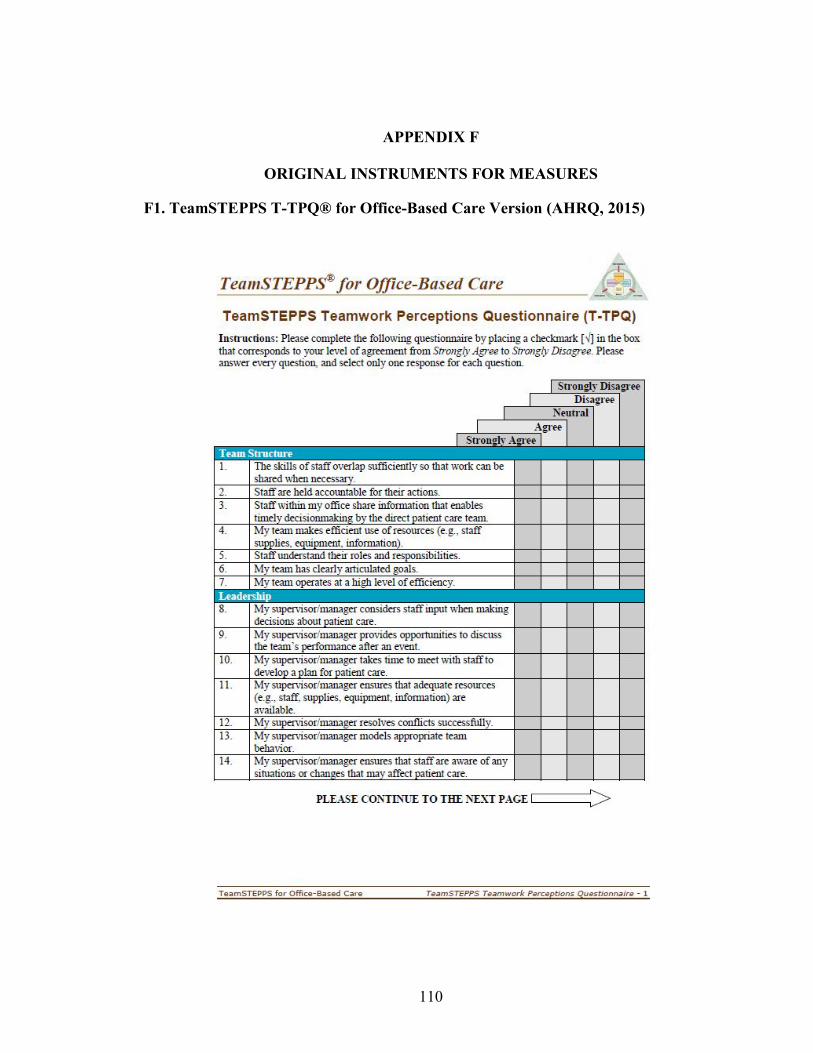
110
APPENDIX F
ORIGINAL INSTRUMENTS FOR MEASURES
F1. TeamSTEPPS T-TPQ® for Office-Based Care Version (AHRQ, 2015)

111

112
Figure F1. TeamSTEPPS® Teamwork Perceptions Questionnaire. American Institutes for Research (2010). TeamSTEPPS® Teamwork Perceptions Questionnaire (T-TPQ®) [Measurement instrument]. Published instrument. Retrieved from http://teamstepps.ahrq.gov/teamwork_perception_questionnaire.pdf
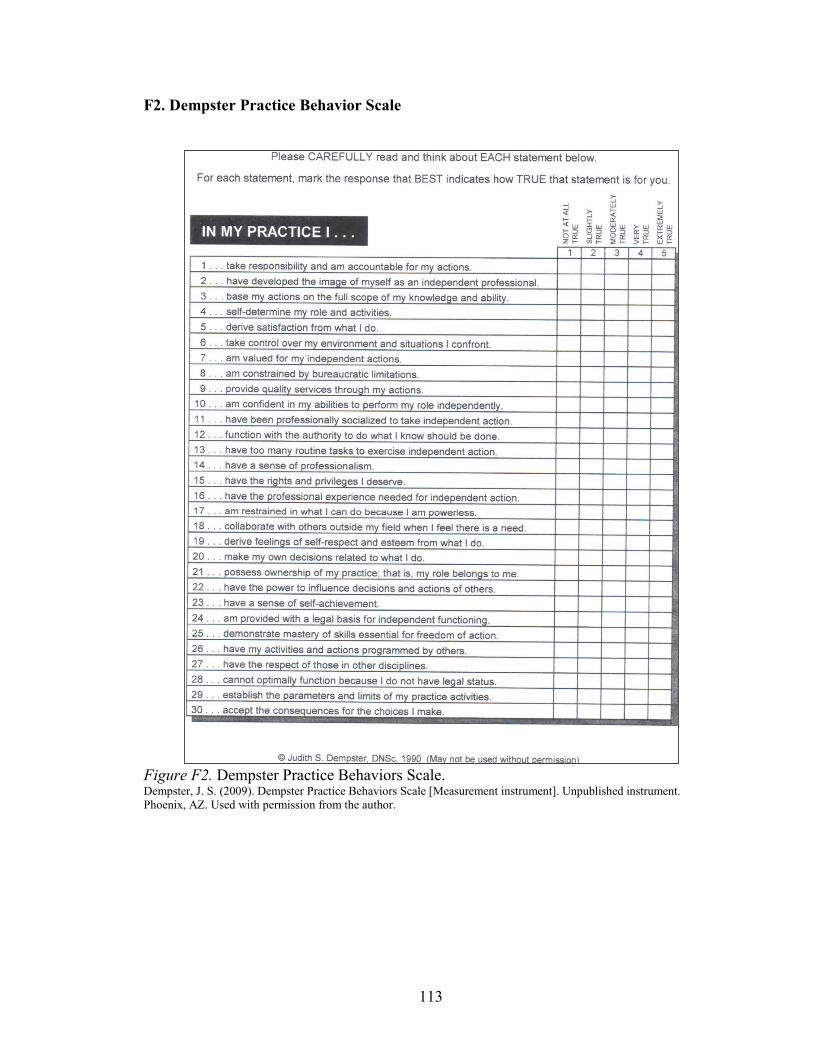
113
F2. Dempster Practice Behavior Scale
Figure F2. Dempster Practice Behaviors Scale. Dempster, J. S. (2009). Dempster Practice Behaviors Scale [Measurement instrument]. Unpublished instrument. Phoenix, AZ. Used with permission from the author.
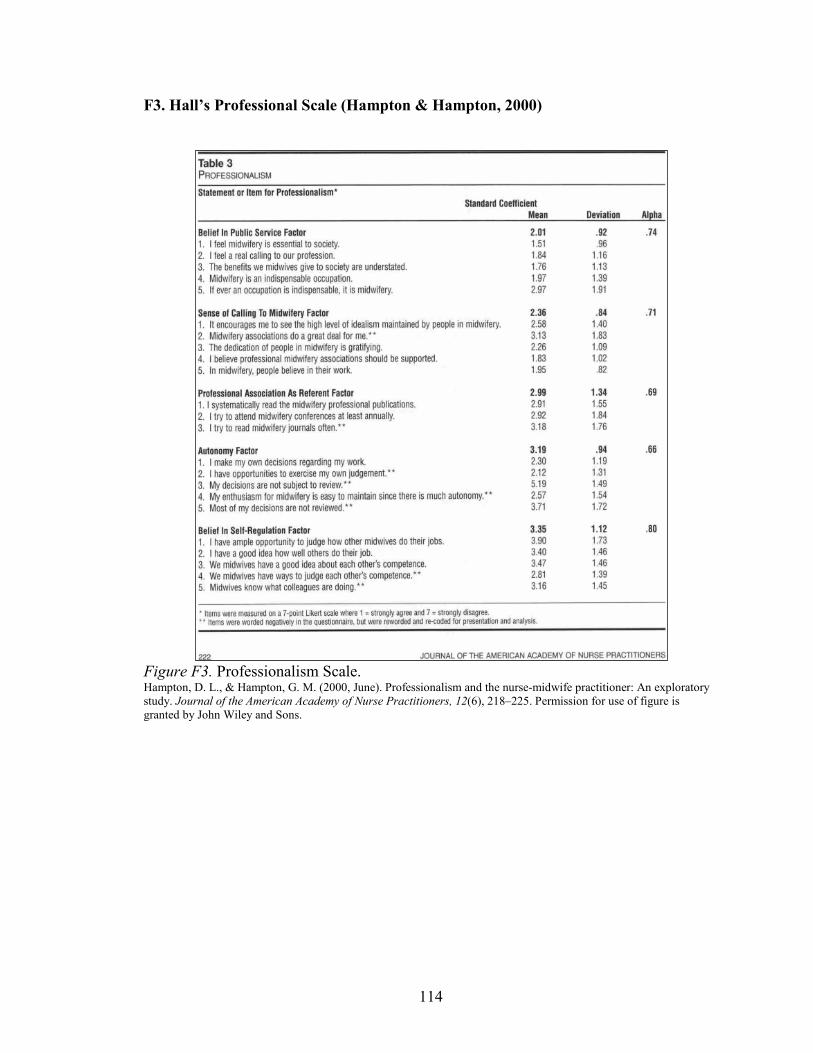
114
F3. Hall’s Professional Scale (Hampton & Hampton, 2000)
Figure F3. Professionalism Scale. Hampton, D. L., & Hampton, G. M. (2000, June). Professionalism and the nurse-midwife practitioner: An exploratory study. Journal of the American Academy of Nurse Practitioners, 12(6), 218–225. Permission for use of figure is granted by John Wiley and Sons.
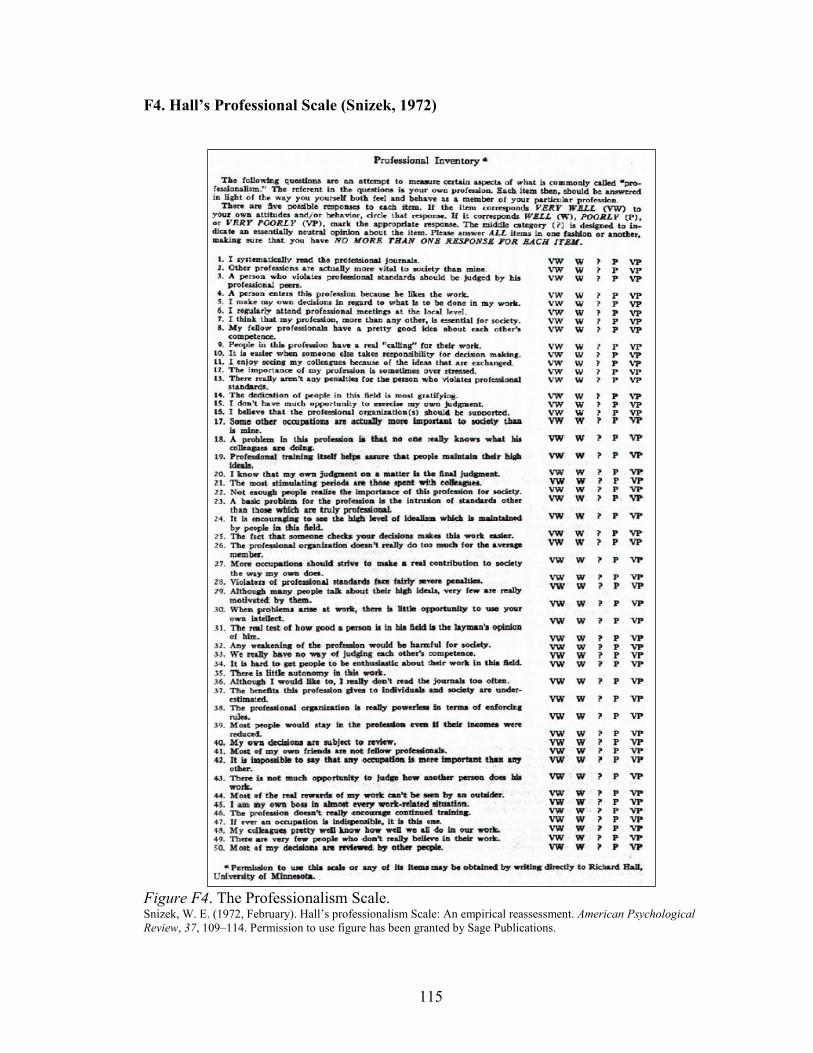
115
F4. Hall’s Professional Scale (Snizek, 1972)
Figure F4. The Professionalism Scale. Snizek, W. E. (1972, February). Hall’s professionalism Scale: An empirical reassessment. American Psychological Review, 37, 109–114. Permission to use figure has been granted by Sage Publications.
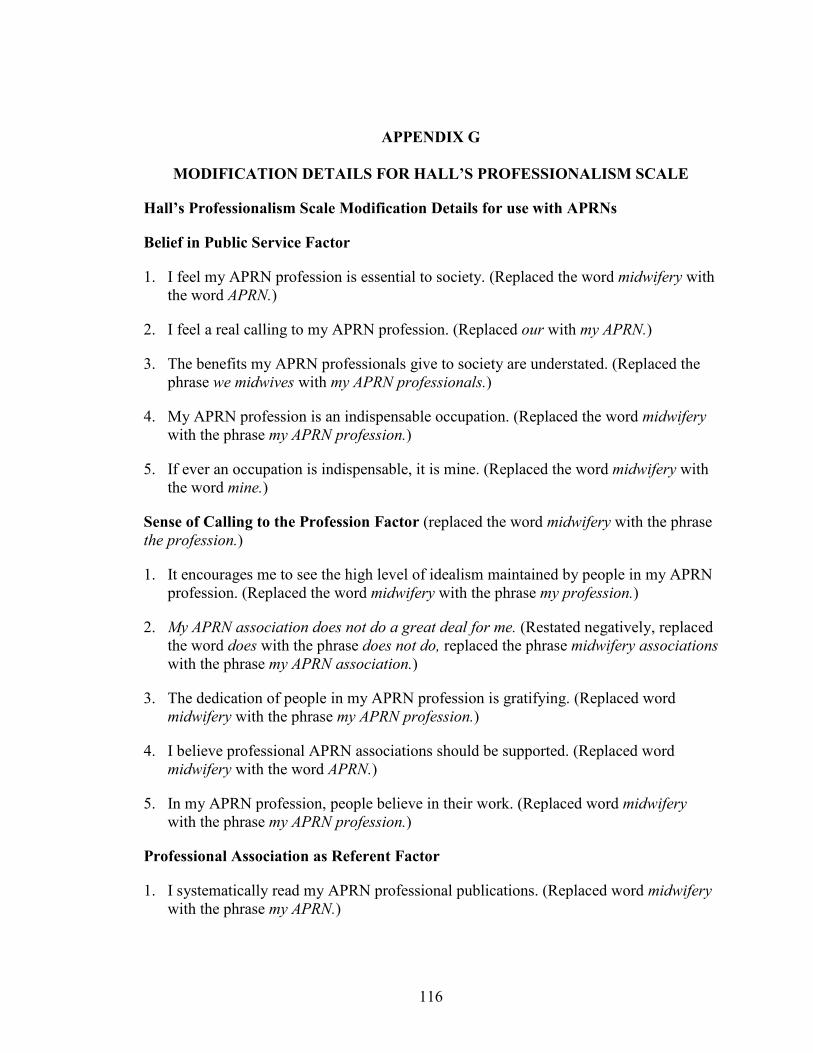
116
APPENDIX G
MODIFICATION DETAILS FOR HALL’S PROFESSIONALISM SCALE
Hall’s Professionalism Scale Modification Details for use with APRNs
Belief in Public Service Factor
1. I feel my APRN profession is essential to society. (Replaced the word midwifery with the word APRN.)
2. I feel a real calling to my APRN profession. (Replaced our with my APRN.)
3. The benefits my APRN professionals give to society are understated. (Replaced the phrase we midwives with my APRN professionals.)
4. My APRN profession is an indispensable occupation. (Replaced the word midwifery with the phrase my APRN profession.)
5. If ever an occupation is indispensable, it is mine. (Replaced the word midwifery with the word mine.)
Sense of Calling to the Profession Factor (replaced the word midwifery with the phrase the profession.)
1. It encourages me to see the high level of idealism maintained by people in my APRN profession. (Replaced the word midwifery with the phrase my profession.)
2. My APRN association does not do a great deal for me. (Restated negatively, replaced the word does with the phrase does not do, replaced the phrase midwifery associations with the phrase my APRN association.)
3. The dedication of people in my APRN profession is gratifying. (Replaced word midwifery with the phrase my APRN profession.)
4. I believe professional APRN associations should be supported. (Replaced word midwifery with the word APRN.)
5. In my APRN profession, people believe in their work. (Replaced word midwifery with the phrase my APRN profession.)
Professional Association as Referent Factor
1. I systematically read my APRN professional publications. (Replaced word midwifery with the phrase my APRN.)

117
2. I try to attend my APRN conferences at least annually. (Replaced word midwifery with the phrase my APRN professional.)
3. Although I try, I do not read APRN journals often (Restated negatively, added the word although and replaced word midwifery with the word APRN.)
Autonomy Factor
1. I make my own decisions regarding my work.
2. I do not have opportunities to exercise my own judgment. (Restated negatively, added the word not.)
3. My decisions are subject to review. (Restated negatively, removed the word not.)
4. My enthusiasm for my APRN profession is not easy to maintain since there is not much autonomy. (Restated negatively, added the word not, replaced word midwifery with the phrase my APRN profession.)
5. Most of my decisions are reviewed. (Restated negatively, removed the word not.)
Belief in Self-Regulation Factor
1. I have ample opportunity to judge how other APRNs in my profession do their jobs. (Replaced the word midwives with the phrase APRNs in my profession.)
2. I have a good idea how well others do their job.
3. We APRNs have a good idea about each other’s competence. (Replaced the word midwives with the word APRNs.)
4. We APRNs do not have ways to judge each other’s competence. (Restated negatively, added the word not, replaced the word midwives with the word APRNs.)
5. APRNs do not know what APRN colleagues are doing. (Restated negatively, added the word not, replaced the word midwives with the word APRNs, and added the word APRN.)
Italicized items have been negatively worded (Hampton & Hampton, 2000; Snizek, 1972).
Hampton, D. L., & Hampton, G. M. (2000, June). Professionalism and the nurse-midwife
practitioner: An exploratory study. Journal of the American Academy of Nurse
Practitioners, 12(6), 218–225.

118
Snizek, W. E. (1972, February). Hall’s professionalism Scale: An empirical reassessment.
American Psychological Review, 37, 109–114.
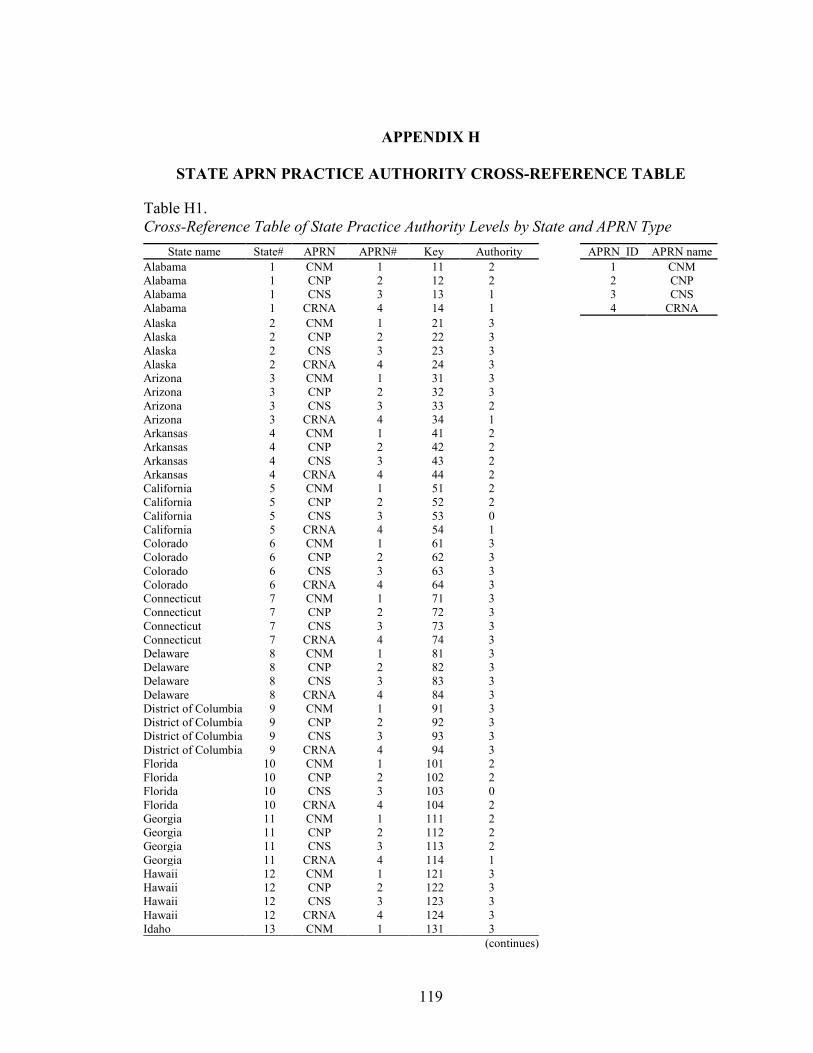
119
APPENDIX H
STATE APRN PRACTICE AUTHORITY CROSS-REFERENCE TABLE
Table H1. Cross-Reference Table of State Practice Authority Levels by State and APRN Type
State name State# APRN APRN# Key Authority APRN_ID APRN name Alabama 1 CNM 1 11 2 1 CNM Alabama 1 CNP 2 12 2 2 CNP Alabama 1 CNS 3 13 1 3 CNS Alabama 1 CRNA 4 14 1 4 CRNA Alaska 2 CNM 1 21 3
Alaska 2 CNP 2 22 3
Alaska 2 CNS 3 23 3
Alaska 2 CRNA 4 24 3
Arizona 3 CNM 1 31 3
Arizona 3 CNP 2 32 3
Arizona 3 CNS 3 33 2
Arizona 3 CRNA 4 34 1
Arkansas 4 CNM 1 41 2
Arkansas 4 CNP 2 42 2
Arkansas 4 CNS 3 43 2
Arkansas 4 CRNA 4 44 2
California 5 CNM 1 51 2
California 5 CNP 2 52 2
California 5 CNS 3 53 0
California 5 CRNA 4 54 1
Colorado 6 CNM 1 61 3
Colorado 6 CNP 2 62 3
Colorado 6 CNS 3 63 3
Colorado 6 CRNA 4 64 3
Connecticut 7 CNM 1 71 3
Connecticut 7 CNP 2 72 3
Connecticut 7 CNS 3 73 3
Connecticut 7 CRNA 4 74 3
Delaware 8 CNM 1 81 3
Delaware 8 CNP 2 82 3
Delaware 8 CNS 3 83 3
Delaware 8 CRNA 4 84 3
District of Columbia 9 CNM 1 91 3
District of Columbia 9 CNP 2 92 3
District of Columbia 9 CNS 3 93 3
District of Columbia 9 CRNA 4 94 3
Florida 10 CNM 1 101 2
Florida 10 CNP 2 102 2
Florida 10 CNS 3 103 0
Florida 10 CRNA 4 104 2
Georgia 11 CNM 1 111 2
Georgia 11 CNP 2 112 2
Georgia 11 CNS 3 113 2
Georgia 11 CRNA 4 114 1
Hawaii 12 CNM 1 121 3
Hawaii 12 CNP 2 122 3
Hawaii 12 CNS 3 123 3
Hawaii 12 CRNA 4 124 3
Idaho 13 CNM 1 131 3
(continues)
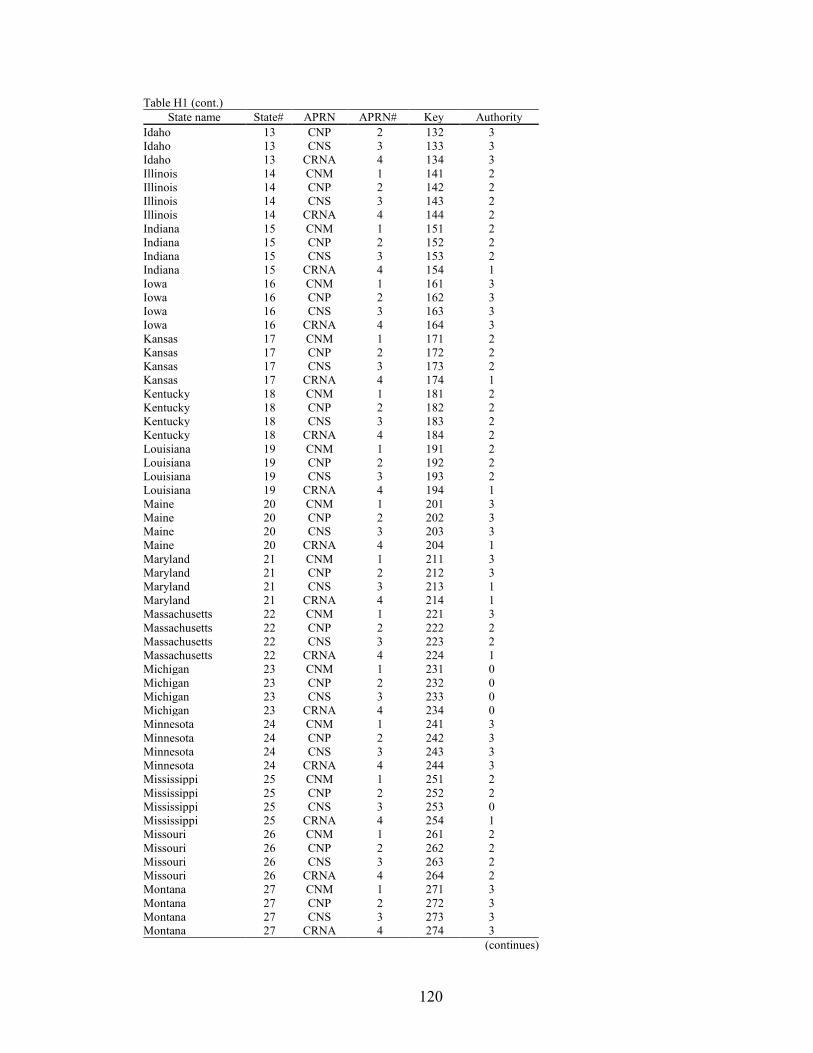
120
Table H1 (cont.) State name State# APRN APRN# Key Authority
Idaho 13 CNP 2 132 3 Idaho 13 CNS 3 133 3 Idaho 13 CRNA 4 134 3 Illinois 14 CNM 1 141 2 Illinois 14 CNP 2 142 2 Illinois 14 CNS 3 143 2 Illinois 14 CRNA 4 144 2 Indiana 15 CNM 1 151 2 Indiana 15 CNP 2 152 2 Indiana 15 CNS 3 153 2 Indiana 15 CRNA 4 154 1 Iowa 16 CNM 1 161 3 Iowa 16 CNP 2 162 3 Iowa 16 CNS 3 163 3 Iowa 16 CRNA 4 164 3 Kansas 17 CNM 1 171 2 Kansas 17 CNP 2 172 2 Kansas 17 CNS 3 173 2 Kansas 17 CRNA 4 174 1 Kentucky 18 CNM 1 181 2 Kentucky 18 CNP 2 182 2 Kentucky 18 CNS 3 183 2 Kentucky 18 CRNA 4 184 2 Louisiana 19 CNM 1 191 2 Louisiana 19 CNP 2 192 2 Louisiana 19 CNS 3 193 2 Louisiana 19 CRNA 4 194 1 Maine 20 CNM 1 201 3 Maine 20 CNP 2 202 3 Maine 20 CNS 3 203 3 Maine 20 CRNA 4 204 1 Maryland 21 CNM 1 211 3 Maryland 21 CNP 2 212 3 Maryland 21 CNS 3 213 1 Maryland 21 CRNA 4 214 1 Massachusetts 22 CNM 1 221 3 Massachusetts 22 CNP 2 222 2 Massachusetts 22 CNS 3 223 2 Massachusetts 22 CRNA 4 224 1 Michigan 23 CNM 1 231 0 Michigan 23 CNP 2 232 0 Michigan 23 CNS 3 233 0 Michigan 23 CRNA 4 234 0 Minnesota 24 CNM 1 241 3 Minnesota 24 CNP 2 242 3 Minnesota 24 CNS 3 243 3 Minnesota 24 CRNA 4 244 3 Mississippi 25 CNM 1 251 2 Mississippi 25 CNP 2 252 2 Mississippi 25 CNS 3 253 0 Mississippi 25 CRNA 4 254 1 Missouri 26 CNM 1 261 2 Missouri 26 CNP 2 262 2 Missouri 26 CNS 3 263 2 Missouri 26 CRNA 4 264 2 Montana 27 CNM 1 271 3 Montana 27 CNP 2 272 3 Montana 27 CNS 3 273 3 Montana 27 CRNA 4 274 3
(continues)

121
Table H1 (cont.) State name State# APRN APRN# Key Authority
Nebraska 28 CNM 1 281 2 Nebraska 28 CNP 2 282 3 Nebraska 28 CNS 3 283 1 Nebraska 28 CRNA 4 284 3 Nevada 29 CNM 1 291 3 Nevada 29 CNP 2 292 3 Nevada 29 CNS 3 293 3 Nevada 29 CRNA 4 294 3 New Hampshire 30 CNM 1 301 3 New Hampshire 30 CNP 2 302 3 New Hampshire 30 CNS 3 303 0 New Hampshire 30 CRNA 4 304 3 New Jersey 31 CNM 1 311 2 New Jersey 31 CNP 2 312 2 New Jersey 31 CNS 3 313 2 New Jersey 31 CRNA 4 314 1 New Mexico 32 CNM 1 321 3 New Mexico 32 CNP 2 322 3 New Mexico 32 CNS 3 323 3 New Mexico 32 CRNA 4 324 3 New York 33 CNM 1 331 2 New York 33 CNP 2 332 0 New York 33 CNS 3 333 0 New York 33 CRNA 4 334 0 North Carolina 34 CNM 1 341 2 North Carolina 34 CNP 2 342 2 North Carolina 34 CNS 3 343 1 North Carolina 34 CRNA 4 344 1 North Dakota 35 CNM 1 351 3 North Dakota 35 CNP 2 352 3 North Dakota 35 CNS 3 353 3 North Dakota 35 CRNA 4 354 3 Ohio 36 CNM 1 361 2 Ohio 36 CNP 2 362 2 Ohio 36 CNS 3 363 2 Ohio 36 CRNA 4 364 1 Oklahoma 37 CNM 1 371 1 Oklahoma 37 CNP 2 372 1 Oklahoma 37 CNS 3 373 1 Oklahoma 37 CRNA 4 374 1 Oregon 38 CNM 1 381 3 Oregon 38 CNP 2 382 3 Oregon 38 CNS 3 383 3 Oregon 38 CRNA 4 384 3 Pennsylvania 39 CNM 1 391 0 Pennsylvania 39 CNP 2 392 2 Pennsylvania 39 CNS 3 393 0 Pennsylvania 39 CRNA 4 394 0 Rhode Island 40 CNM 1 401 3 Rhode Island 40 CNP 2 402 3 Rhode Island 40 CNS 3 403 3 Rhode Island 40 CRNA 4 404 3 South Carolina 41 CNM 1 411 2 South Carolina 41 CNP 2 412 2 South Carolina 41 CNS 3 413 2 South Carolina 41 CRNA 4 414 2 South Dakota 42 CNM 1 421 3 South Dakota 42 CNP 2 422 3 South Dakota 42 CNS 3 423 1
(continues)
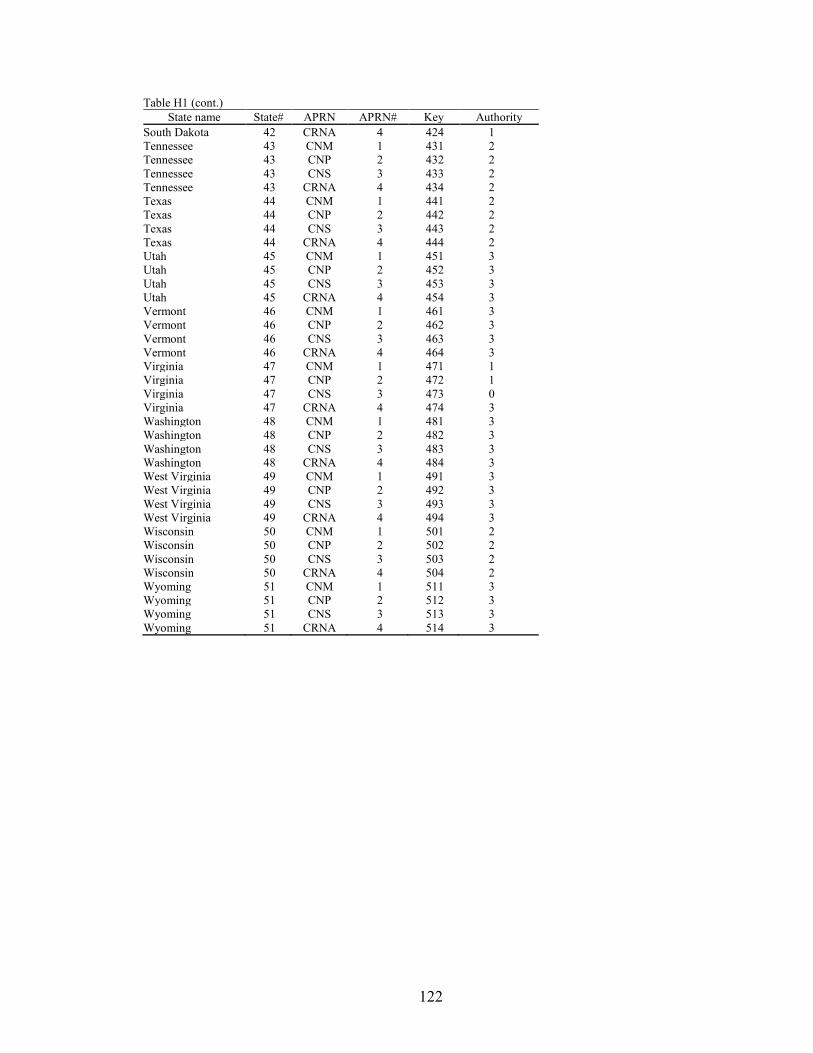
122
Table H1 (cont.) State name State# APRN APRN# Key Authority
South Dakota 42 CRNA 4 424 1 Tennessee 43 CNM 1 431 2 Tennessee 43 CNP 2 432 2 Tennessee 43 CNS 3 433 2 Tennessee 43 CRNA 4 434 2 Texas 44 CNM 1 441 2 Texas 44 CNP 2 442 2 Texas 44 CNS 3 443 2 Texas 44 CRNA 4 444 2 Utah 45 CNM 1 451 3 Utah 45 CNP 2 452 3 Utah 45 CNS 3 453 3 Utah 45 CRNA 4 454 3 Vermont 46 CNM 1 461 3 Vermont 46 CNP 2 462 3 Vermont 46 CNS 3 463 3 Vermont 46 CRNA 4 464 3 Virginia 47 CNM 1 471 1 Virginia 47 CNP 2 472 1 Virginia 47 CNS 3 473 0 Virginia 47 CRNA 4 474 3 Washington 48 CNM 1 481 3 Washington 48 CNP 2 482 3 Washington 48 CNS 3 483 3 Washington 48 CRNA 4 484 3 West Virginia 49 CNM 1 491 3 West Virginia 49 CNP 2 492 3 West Virginia 49 CNS 3 493 3 West Virginia 49 CRNA 4 494 3 Wisconsin 50 CNM 1 501 2 Wisconsin 50 CNP 2 502 2 Wisconsin 50 CNS 3 503 2 Wisconsin 50 CRNA 4 504 2 Wyoming 51 CNM 1 511 3 Wyoming 51 CNP 2 512 3 Wyoming 51 CNS 3 513 3 Wyoming 51 CRNA 4 514 3
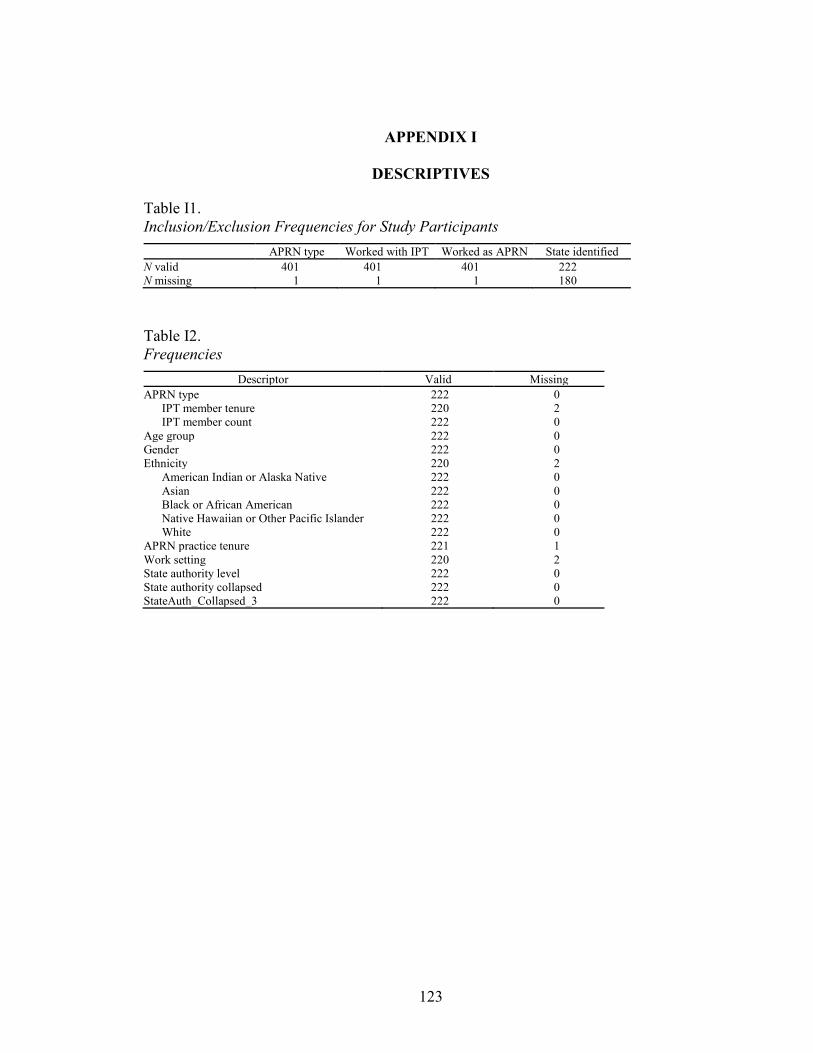
123
APPENDIX I
DESCRIPTIVES
Table I1. Inclusion/Exclusion Frequencies for Study Participants
APRN type Worked with IPT Worked as APRN State identified N valid 401 401 401 222 N missing 1 1 1 180
Table I2. Frequencies
Descriptor Valid Missing APRN type 222 0
IPT member tenure 220 2 IPT member count 222 0
Age group 222 0 Gender 222 0 Ethnicity 220 2
American Indian or Alaska Native 222 0 Asian 222 0 Black or African American 222 0 Native Hawaiian or Other Pacific Islander 222 0 White 222 0
APRN practice tenure 221 1 Work setting 220 2 State authority level 222 0 State authority collapsed 222 0 StateAuth_Collapsed_3 222 0

124
Table I3. Descriptives Frequency Table
Frequency Percent Valid percent Cumulative percent APRN type
1 CNM 40 18.0 18.0 18.0 2 CNP 131 59.0 59.0 77.0 3 CNS 40 18.0 18.0 95.0 4 CRNA 11 5.0 5.0 100.0 Total 222 100.0 100.0
IPT member tenure 1 Less than 1 year 4 1.8 1.8 1.8 2 1 year or more, but less than 5 years 32 14.4 14.5 16.4 3 5–10 years 53 23.9 24.1 40.5 4 More than 10 years 131 59.0 59.5 100.0 Total 220 99.1 100.0
Missing System 2 0.9
Total 222 100.0
IPT member count 1 2–3 40 18.0 18.0 18.0 2 4–5 89 40.1 40.1 58.1 3 More than 5 93 41.9 41.9 100.0 Total 222 100.0 100.0
Age group 2 25–35 20 9.0 9.0 9.0 3 36–45 46 20.7 20.7 29.7 4 46–55 56 25.2 25.2 55.0 5 56–65 84 37.8 37.8 92.8 6 Over 65 16 7.2 7.2 100.0 Total 222 100.0 100.0
Gender 1 Female 200 90.1 90.1 90.1 2 Male 22 9.9 9.9 100.0 Total 222 100.0 100.0
Ethnicity 0 No (not Latino) 217 97.7 98.6 98.6 1 Yes (Latino) 3 1.4 1.4 100.0 Total 220 99.1 100.0
Missing System 2 0.9
Total 222 100.0
American Indian or Alaska Native 0 222 100.0 100.0 100.0
Asian 0 220 99.1 99.1 99.1 1 2 0.9 0.9 100.0 Total 222 100.0 100.0
Black or African American 0 212 95.5 95.5 95.5 1 10 4.5 4.5 100.0 Total 222 100.0 100.0
Native Hawaiian or other Pacific Islander 0 222 100.0 100.0 100.0
White 0 14 6.3 6.3 6.3 1 208 93.7 93.7 100.0 Total 222 100.0 100.0
(continues)

125
Table I3 (cont.) Frequency Percent Valid percent Cumulative percent
APRN practice tenure 1 1–5 38 17.1 17.2 17.2 2 6–10 47 21.2 21.3 38.5 3 11–15 30 13.5 13.6 52.0 4 16–20 39 17.6 17.6 69.7 5 21–30 44 19.8 19.9 89.6 6 More than 30 years 23 10.4 10.4 100.0 Total 221 99.5 100.0
Missing System 1 0.5
Total 222 100.0
Work setting 1 Dept of VA 3 1.4 1.4 1.4 2 public or private acute care hospital 91 41.0 41.4 42.7 3 LTC facility 7 3.2 3.2 45.9 4 clinic 108 48.6 49.1 95.0 5 other 11 5.0 5.0 100.0 Total 220 99.1 100.0
Missing System 2 0.9
Total 222 100.0
State authority level 0 not identified or not specified 24 10.8 10.8 10.8 1 Restricted 13 5.9 5.9 16.7 2 Reduced 115 51.8 51.8 68.5 3 Full 70 31.5 31.5 100.0 Total 222 100.0 100.0
StateAuth_Collapsed_3 1 Restricted 37 16.7 16.7 16.7 2 Reduced 115 51.8 51.8 68.5 3 Full 70 31.5 31.5 100.0 Total 222 100.0 100.0
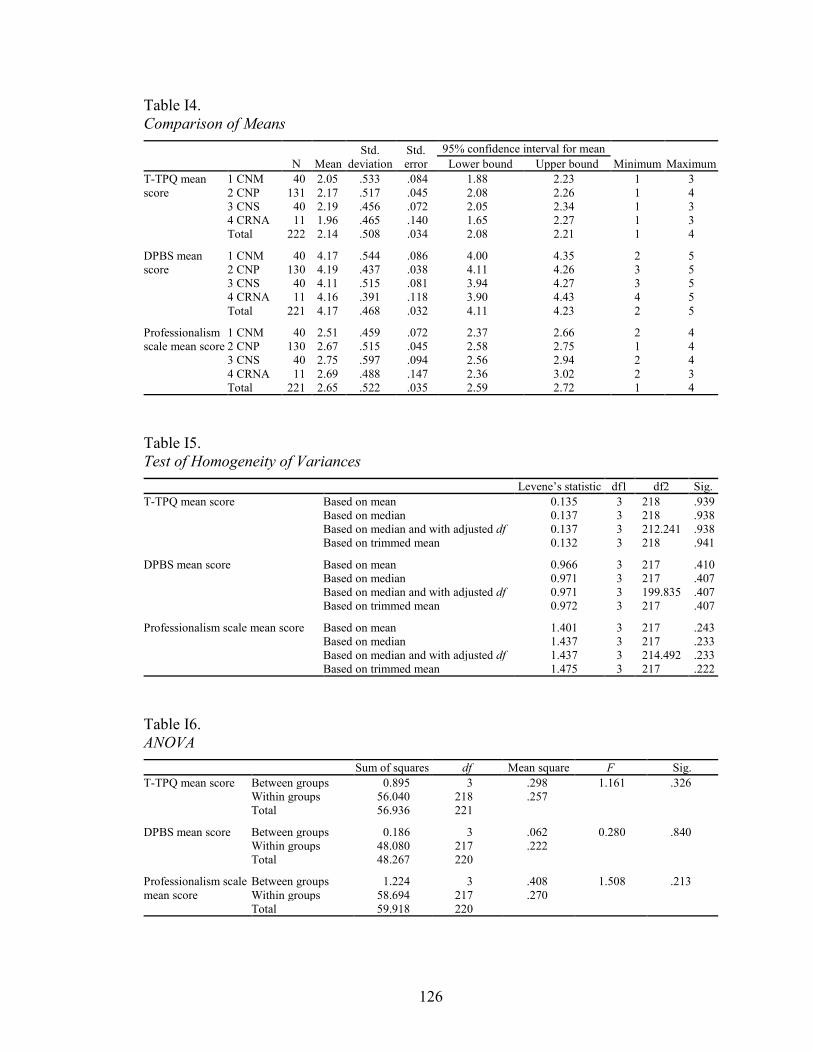
126
Table I4. Comparison of Means
N Mean Std.
deviation Std. error
95% confidence interval for mean Minimum Maximum Lower bound Upper bound
T-TPQ mean score
1 CNM 40 2.05 .533 .084 1.88 2.23 1 3 2 CNP 131 2.17 .517 .045 2.08 2.26 1 4 3 CNS 40 2.19 .456 .072 2.05 2.34 1 3 4 CRNA 11 1.96 .465 .140 1.65 2.27 1 3 Total 222 2.14 .508 .034 2.08 2.21 1 4
DPBS mean score
1 CNM 40 4.17 .544 .086 4.00 4.35 2 5 2 CNP 130 4.19 .437 .038 4.11 4.26 3 5 3 CNS 40 4.11 .515 .081 3.94 4.27 3 5 4 CRNA 11 4.16 .391 .118 3.90 4.43 4 5 Total 221 4.17 .468 .032 4.11 4.23 2 5
Professionalism scale mean score
1 CNM 40 2.51 .459 .072 2.37 2.66 2 4 2 CNP 130 2.67 .515 .045 2.58 2.75 1 4 3 CNS 40 2.75 .597 .094 2.56 2.94 2 4 4 CRNA 11 2.69 .488 .147 2.36 3.02 2 3 Total 221 2.65 .522 .035 2.59 2.72 1 4
Table I5. Test of Homogeneity of Variances
Levene’s statistic df1 df2 Sig. T-TPQ mean score Based on mean 0.135 3 218 .939
Based on median 0.137 3 218 .938 Based on median and with adjusted df 0.137 3 212.241 .938 Based on trimmed mean 0.132 3 218 .941
DPBS mean score Based on mean 0.966 3 217 .410 Based on median 0.971 3 217 .407 Based on median and with adjusted df 0.971 3 199.835 .407 Based on trimmed mean 0.972 3 217 .407
Professionalism scale mean score Based on mean 1.401 3 217 .243 Based on median 1.437 3 217 .233 Based on median and with adjusted df 1.437 3 214.492 .233 Based on trimmed mean 1.475 3 217 .222
Table I6. ANOVA
Sum of squares df Mean square F Sig. T-TPQ mean score Between groups 0.895 3 .298 1.161 .326
Within groups 56.040 218 .257 Total 56.936 221
DPBS mean score Between groups 0.186 3 .062 0.280 .840 Within groups 48.080 217 .222 Total 48.267 220
Professionalism scale mean score
Between groups 1.224 3 .408 1.508 .213 Within groups 58.694 217 .270 Total 59.918 220
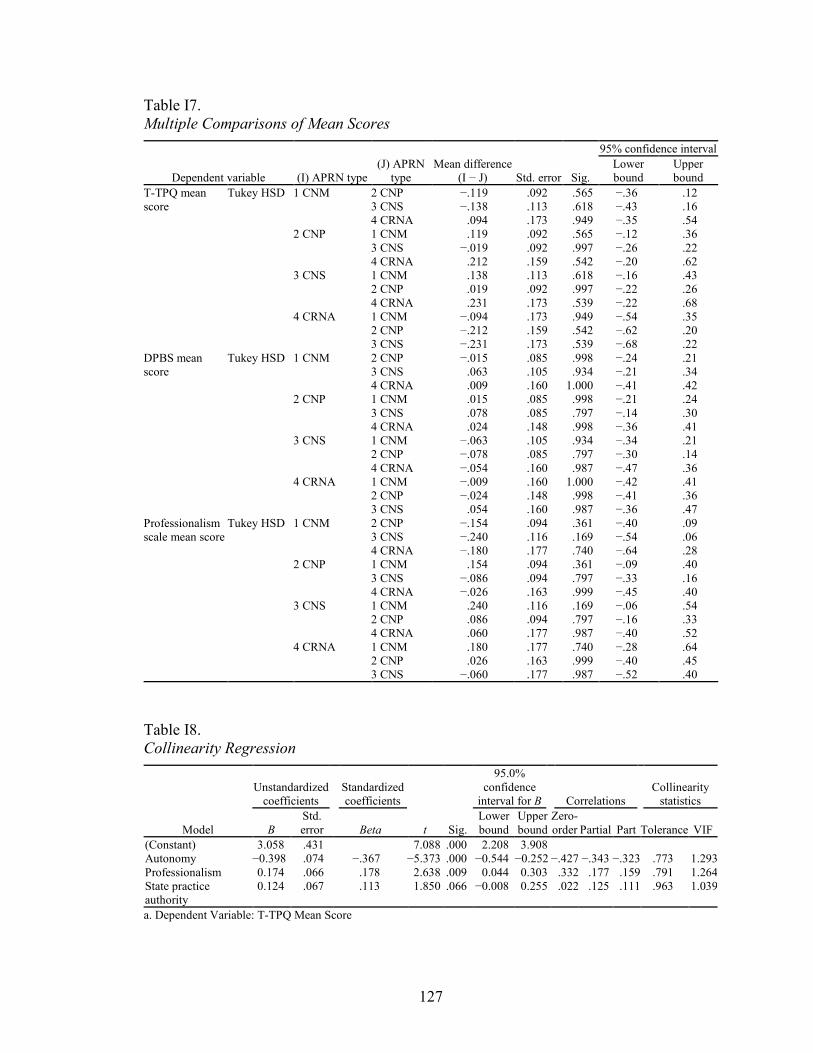
127
Table I7. Multiple Comparisons of Mean Scores
Dependent variable (I) APRN type (J) APRN
type Mean difference
(I − J) Std. error Sig.
95% confidence interval Lower bound
Upper bound
T-TPQ mean score
Tukey HSD 1 CNM 2 CNP −.119 .092 .565 −.36 .12 3 CNS −.138 .113 .618 −.43 .16 4 CRNA .094 .173 .949 −.35 .54
2 CNP 1 CNM .119 .092 .565 −.12 .36 3 CNS −.019 .092 .997 −.26 .22 4 CRNA .212 .159 .542 −.20 .62
3 CNS 1 CNM .138 .113 .618 −.16 .43 2 CNP .019 .092 .997 −.22 .26 4 CRNA .231 .173 .539 −.22 .68
4 CRNA 1 CNM −.094 .173 .949 −.54 .35 2 CNP −.212 .159 .542 −.62 .20 3 CNS −.231 .173 .539 −.68 .22
DPBS mean score
Tukey HSD 1 CNM 2 CNP −.015 .085 .998 −.24 .21 3 CNS .063 .105 .934 −.21 .34 4 CRNA .009 .160 1.000 −.41 .42
2 CNP 1 CNM .015 .085 .998 −.21 .24 3 CNS .078 .085 .797 −.14 .30 4 CRNA .024 .148 .998 −.36 .41
3 CNS 1 CNM −.063 .105 .934 −.34 .21 2 CNP −.078 .085 .797 −.30 .14 4 CRNA −.054 .160 .987 −.47 .36
4 CRNA 1 CNM −.009 .160 1.000 −.42 .41 2 CNP −.024 .148 .998 −.41 .36 3 CNS .054 .160 .987 −.36 .47
Professionalism scale mean score
Tukey HSD 1 CNM 2 CNP −.154 .094 .361 −.40 .09 3 CNS −.240 .116 .169 −.54 .06 4 CRNA −.180 .177 .740 −.64 .28
2 CNP 1 CNM .154 .094 .361 −.09 .40 3 CNS −.086 .094 .797 −.33 .16 4 CRNA −.026 .163 .999 −.45 .40
3 CNS 1 CNM .240 .116 .169 −.06 .54 2 CNP .086 .094 .797 −.16 .33 4 CRNA .060 .177 .987 −.40 .52
4 CRNA 1 CNM .180 .177 .740 −.28 .64 2 CNP .026 .163 .999 −.40 .45 3 CNS −.060 .177 .987 −.52 .40
Table I8. Collinearity Regression
Model
Unstandardized coefficients
Standardized coefficients
t Sig.
95.0% confidence
interval for B Correlations Collinearity
statistics
B Std. error Beta
Lower bound
Upper bound
Zero-order Partial Part Tolerance VIF
(Constant) 3.058 .431 7.088 .000 2.208 3.908 Autonomy −0.398 .074 −.367 −5.373 .000 −0.544 −0.252 −.427 −.343 −.323 .773 1.293 Professionalism 0.174 .066 .178 2.638 .009 0.044 0.303 .332 .177 .159 .791 1.264 State practice authority
0.124 .067 .113 1.850 .066 −0.008 0.255 .022 .125 .111 .963 1.039
a. Dependent Variable: T-TPQ Mean Score

128
APPENDIX J
PRELIMINARY DATA ANALYSIS
J1. TeamSTEPPS T-TPQ® Plots and Histogram
Figure J1.1. Q-Q plot of distribution of T-TPQ mean scores. Score range 1-5. Lower T-TPQ scores = higher IPT function.

129
Figure J1.2. P–P plot of distribution of T-TPQ mean scores.
Figure J1.3. Box plot for distribution of T-TPQ mean scores.

130
Figure J1.4. Histogram for distribution of T-TPQ mean scores.
J2. Dempster Practice Behavior Scale (DPBS) Plots and Histogram
Figure J2.1. Q-Q plot for distribution of DPBS mean scores. Score range 1-5. Higher DPBS scores = higher perceived autonomy.
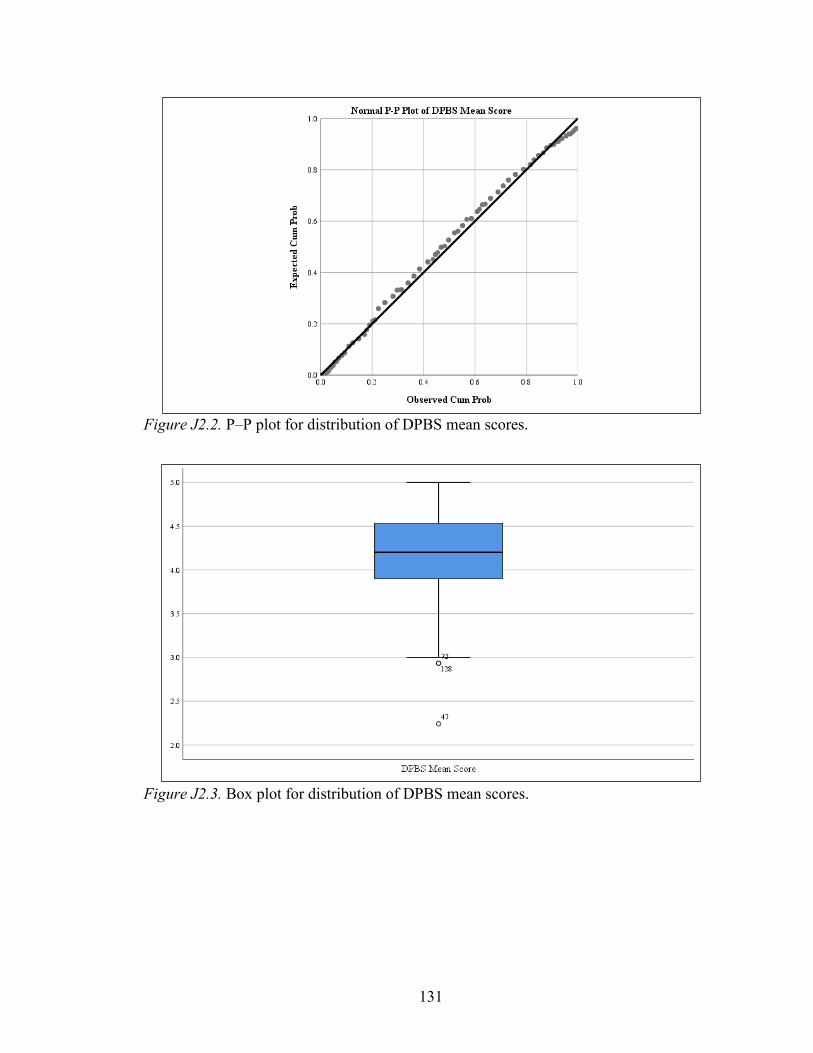
131
Figure J2.2. P–P plot for distribution of DPBS mean scores.
Figure J2.3. Box plot for distribution of DPBS mean scores.
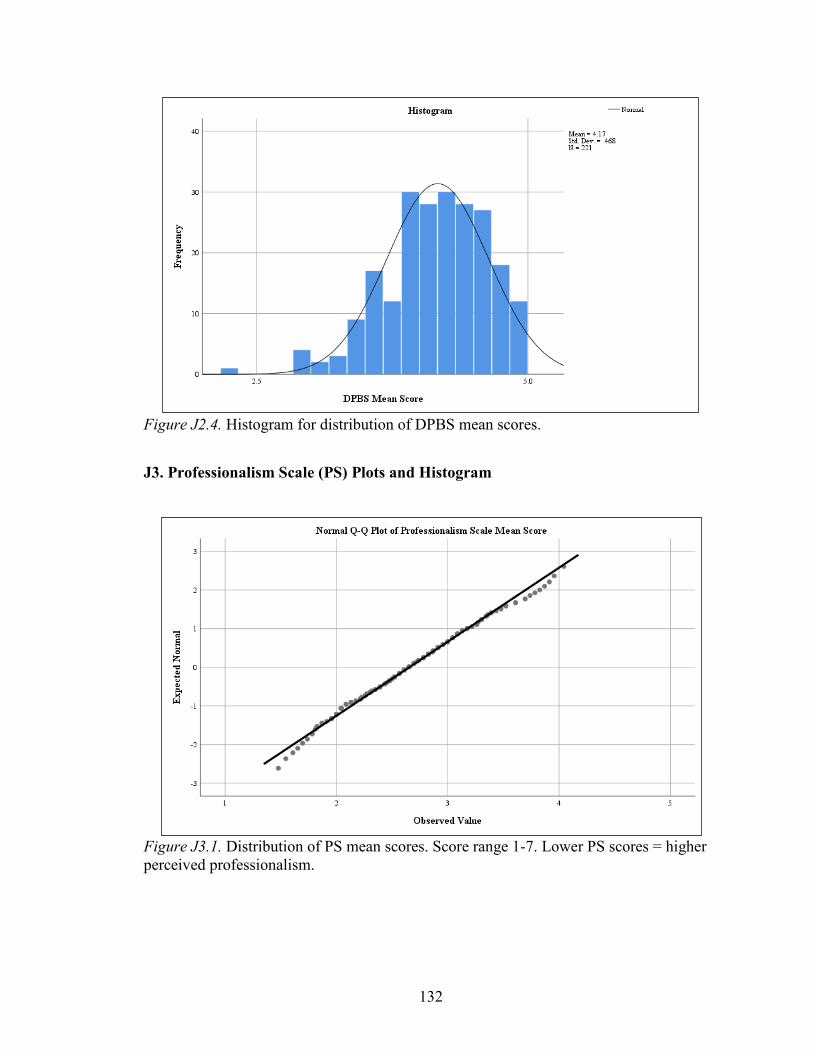
132
Figure J2.4. Histogram for distribution of DPBS mean scores.
J3. Professionalism Scale (PS) Plots and Histogram
Figure J3.1. Distribution of PS mean scores. Score range 1-7. Lower PS scores = higher perceived professionalism.

133
Figure J3.2. P–P plot for distribution of PS mean scores.
Figure J3.3. Box plot for distribution of PS mean scores.
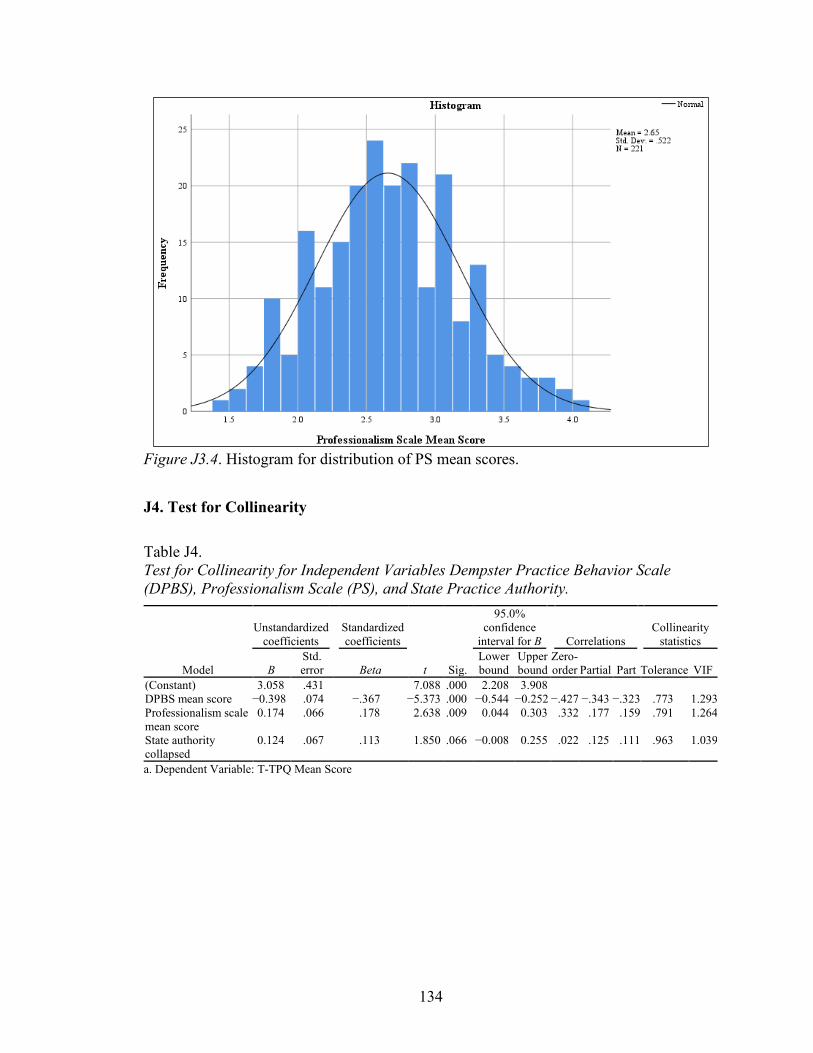
134
Figure J3.4. Histogram for distribution of PS mean scores.
J4. Test for Collinearity
Table J4. Test for Collinearity for Independent Variables Dempster Practice Behavior Scale (DPBS), Professionalism Scale (PS), and State Practice Authority.
Model
Unstandardized coefficients
Standardized coefficients
t Sig.
95.0% confidence
interval for B Correlations Collinearity
statistics
B Std. error Beta
Lower bound
Upper bound
Zero-order Partial Part Tolerance VIF
(Constant) 3.058 .431 7.088 .000 2.208 3.908 DPBS mean score −0.398 .074 −.367 −5.373 .000 −0.544 −0.252 −.427 −.343 −.323 .773 1.293 Professionalism scale mean score
0.174 .066 .178 2.638 .009 0.044 0.303 .332 .177 .159 .791 1.264
State authority collapsed
0.124 .067 .113 1.850 .066 −0.008 0.255 .022 .125 .111 .963 1.039
a. Dependent Variable: T-TPQ Mean Score
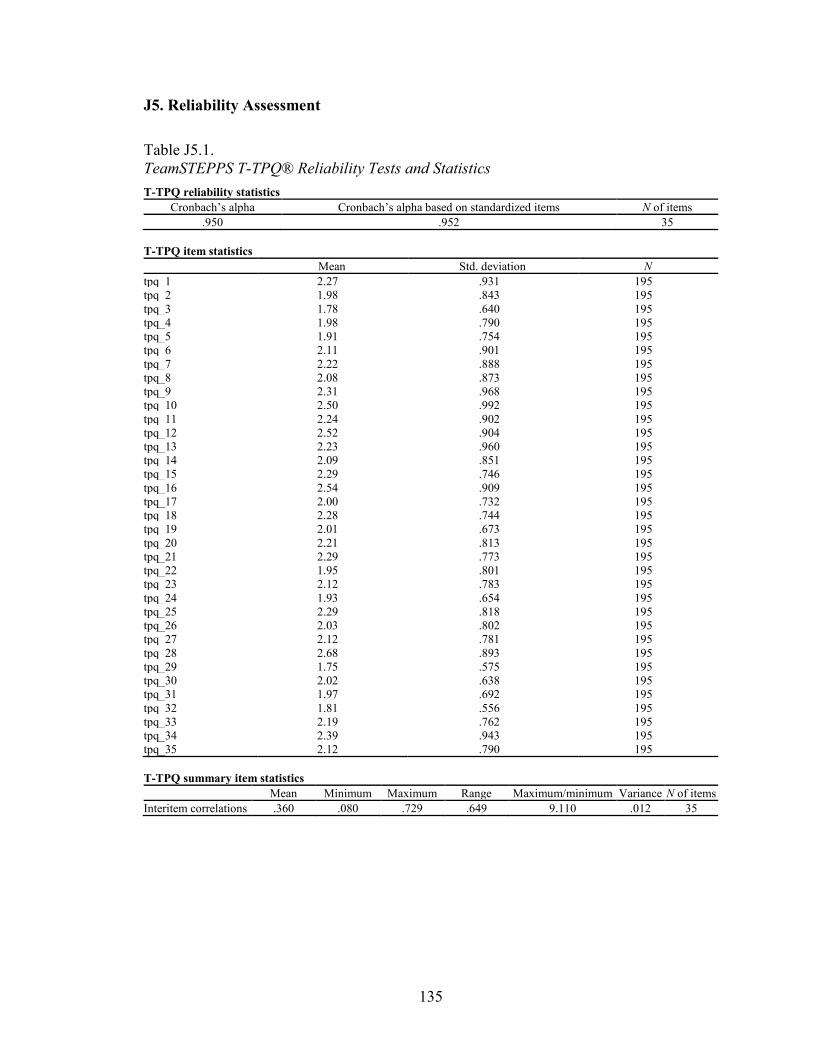
135
J5. Reliability Assessment
Table J5.1. TeamSTEPPS T-TPQ® Reliability Tests and Statistics T-TPQ reliability statistics
Cronbach’s alpha Cronbach’s alpha based on standardized items N of items .950 .952 35
T-TPQ item statistics
Mean Std. deviation N tpq_1 2.27 .931 195 tpq_2 1.98 .843 195 tpq_3 1.78 .640 195 tpq_4 1.98 .790 195 tpq_5 1.91 .754 195 tpq_6 2.11 .901 195 tpq_7 2.22 .888 195 tpq_8 2.08 .873 195 tpq_9 2.31 .968 195 tpq_10 2.50 .992 195 tpq_11 2.24 .902 195 tpq_12 2.52 .904 195 tpq_13 2.23 .960 195 tpq_14 2.09 .851 195 tpq_15 2.29 .746 195 tpq_16 2.54 .909 195 tpq_17 2.00 .732 195 tpq_18 2.28 .744 195 tpq_19 2.01 .673 195 tpq_20 2.21 .813 195 tpq_21 2.29 .773 195 tpq_22 1.95 .801 195 tpq_23 2.12 .783 195 tpq_24 1.93 .654 195 tpq_25 2.29 .818 195 tpq_26 2.03 .802 195 tpq_27 2.12 .781 195 tpq_28 2.68 .893 195 tpq_29 1.75 .575 195 tpq_30 2.02 .638 195 tpq_31 1.97 .692 195 tpq_32 1.81 .556 195 tpq_33 2.19 .762 195 tpq_34 2.39 .943 195 tpq_35 2.12 .790 195 T-TPQ summary item statistics
Mean Minimum Maximum Range Maximum/minimum Variance N of items Interitem correlations .360 .080 .729 .649 9.110 .012 35

136
Table J5.1 (cont.) Item-total statistics
Item deleted Corrected item-total
correlation Squared multiple
correlation Cronbach’s alpha if item
deleted Scale mean Scale variance tpq_1 72.94 287.497 .294 . .951 tpq_2 73.23 281.467 .547 . .949 tpq_3 73.43 284.989 .567 . .949 tpq_4 73.23 279.557 .662 . .948 tpq_5 73.30 280.057 .674 . .948 tpq_6 73.10 276.006 .696 . .948 tpq_7 72.99 276.675 .683 . .948 tpq_8 73.13 278.817 .620 . .948 tpq_9 72.90 277.051 .610 . .948 tpq_10 72.71 277.793 .571 . .949 tpq_11 72.97 279.051 .591 . .949 tpq_12 72.69 280.606 .536 . .949 tpq_13 72.98 278.618 .565 . .949 tpq_14 73.12 279.867 .600 . .948 tpq_15 72.92 281.597 .619 . .948 tpq_16 72.67 280.304 .542 . .949 tpq_17 73.21 281.146 .650 . .948 tpq_18 72.93 280.015 .686 . .948 tpq_19 73.20 282.357 .656 . .948 tpq_20 73.00 280.031 .623 . .948 tpq_21 72.92 281.638 .594 . .949 tpq_22 73.26 281.625 .572 . .949 tpq_23 73.09 280.585 .627 . .948 tpq_24 73.28 282.884 .652 . .948 tpq_25 72.92 278.504 .676 . .948 tpq_26 73.18 283.502 .500 . .949 tpq_27 73.09 281.641 .588 . .949 tpq_28 72.53 280.827 .536 . .949 tpq_29 73.46 288.270 .463 . .949 tpq_30 73.19 283.240 .652 . .948 tpq_31 73.24 287.326 .420 . .950 tpq_32 73.40 287.736 .509 . .949 tpq_33 73.02 283.943 .511 . .949 tpq_34 72.82 279.749 .539 . .949 tpq_35 73.09 280.472 .626 . .948 T-TPQ scale statistics
Mean Variance Std. deviation N of items 75.21 297.651 17.253 35
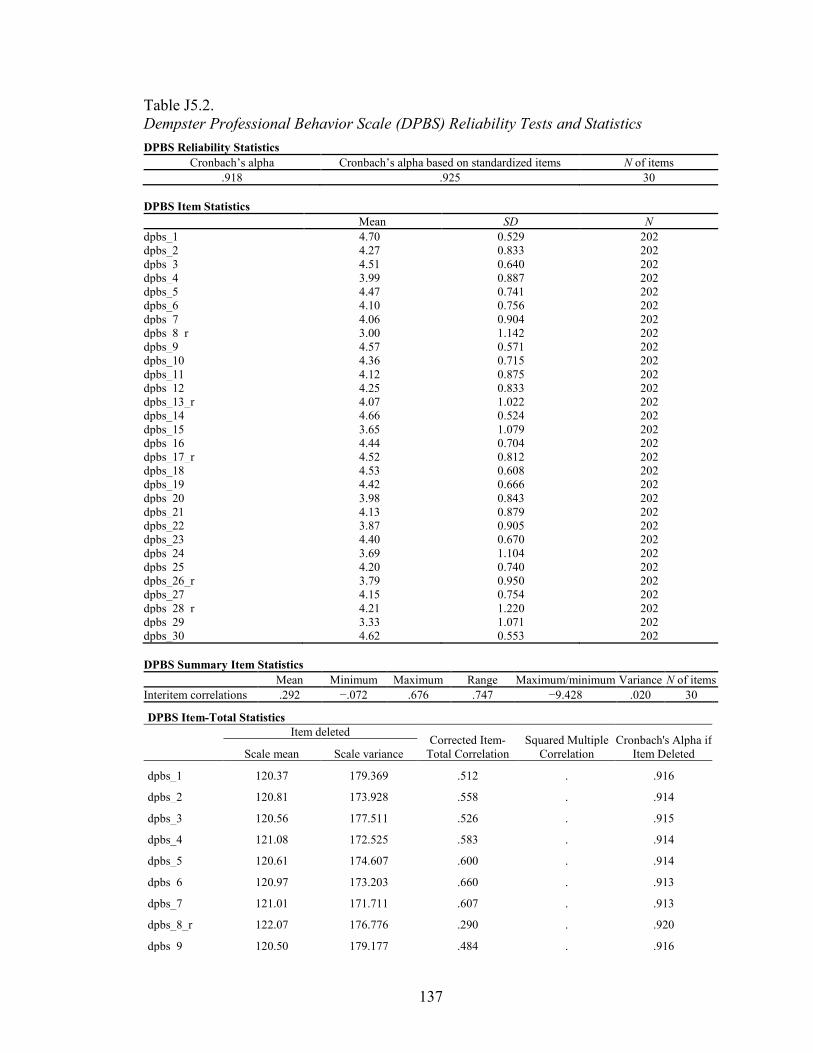
137
Table J5.2. Dempster Professional Behavior Scale (DPBS) Reliability Tests and Statistics DPBS Reliability Statistics
Cronbach’s alpha Cronbach’s alpha based on standardized items N of items .918 .925 30
DPBS Item Statistics
Mean SD N dpbs_1 4.70 0.529 202 dpbs_2 4.27 0.833 202 dpbs_3 4.51 0.640 202 dpbs_4 3.99 0.887 202 dpbs_5 4.47 0.741 202 dpbs_6 4.10 0.756 202 dpbs_7 4.06 0.904 202 dpbs_8_r 3.00 1.142 202 dpbs_9 4.57 0.571 202 dpbs_10 4.36 0.715 202 dpbs_11 4.12 0.875 202 dpbs_12 4.25 0.833 202 dpbs_13_r 4.07 1.022 202 dpbs_14 4.66 0.524 202 dpbs_15 3.65 1.079 202 dpbs_16 4.44 0.704 202 dpbs_17_r 4.52 0.812 202 dpbs_18 4.53 0.608 202 dpbs_19 4.42 0.666 202 dpbs_20 3.98 0.843 202 dpbs_21 4.13 0.879 202 dpbs_22 3.87 0.905 202 dpbs_23 4.40 0.670 202 dpbs_24 3.69 1.104 202 dpbs_25 4.20 0.740 202 dpbs_26_r 3.79 0.950 202 dpbs_27 4.15 0.754 202 dpbs_28_r 4.21 1.220 202 dpbs_29 3.33 1.071 202 dpbs_30 4.62 0.553 202 DPBS Summary Item Statistics
Mean Minimum Maximum Range Maximum/minimum Variance N of items Interitem correlations .292 −.072 .676 .747 −9.428 .020 30
DPBS Item-Total Statistics
Item deleted Corrected Item-
Total Correlation Squared Multiple
Correlation Cronbach's Alpha if
Item Deleted Scale mean Scale variance
dpbs_1 120.37 179.369 .512 . .916
dpbs_2 120.81 173.928 .558 . .914
dpbs_3 120.56 177.511 .526 . .915
dpbs_4 121.08 172.525 .583 . .914
dpbs_5 120.61 174.607 .600 . .914
dpbs_6 120.97 173.203 .660 . .913
dpbs_7 121.01 171.711 .607 . .913
dpbs_8_r 122.07 176.776 .290 . .920
dpbs_9 120.50 179.177 .484 . .916
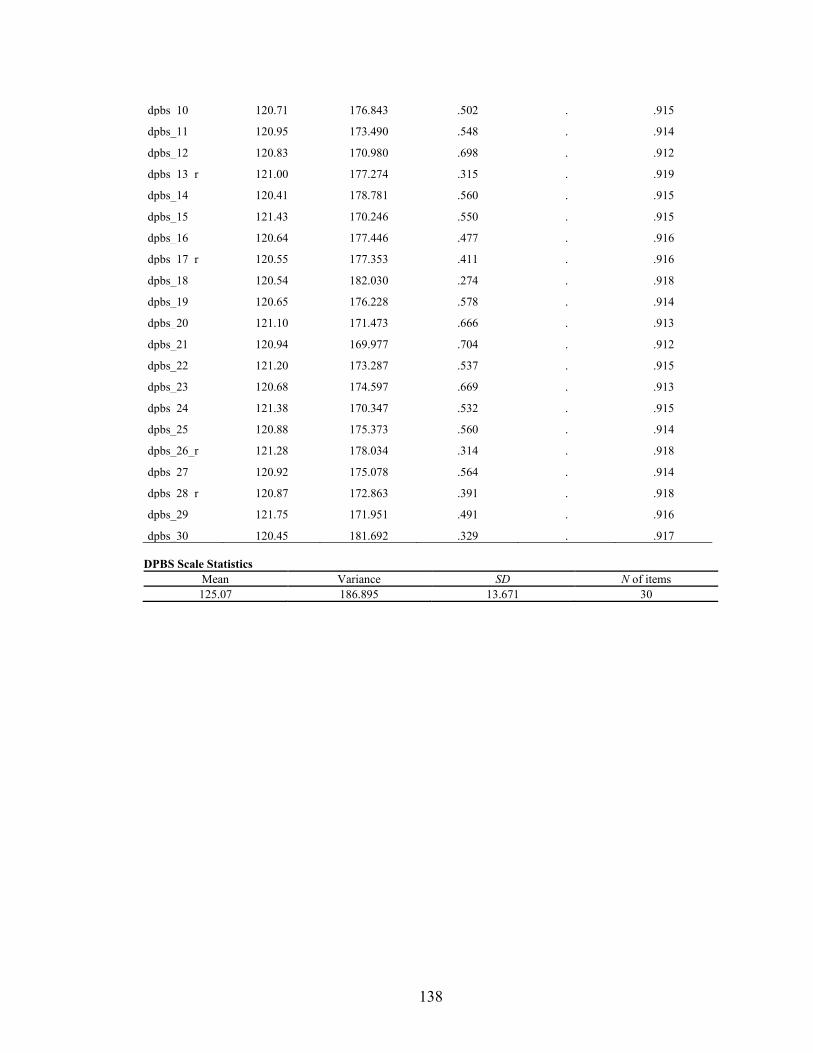
138
dpbs_10 120.71 176.843 .502 . .915
dpbs_11 120.95 173.490 .548 . .914
dpbs_12 120.83 170.980 .698 . .912
dpbs_13_r 121.00 177.274 .315 . .919
dpbs_14 120.41 178.781 .560 . .915
dpbs_15 121.43 170.246 .550 . .915
dpbs_16 120.64 177.446 .477 . .916
dpbs_17_r 120.55 177.353 .411 . .916
dpbs_18 120.54 182.030 .274 . .918
dpbs_19 120.65 176.228 .578 . .914
dpbs_20 121.10 171.473 .666 . .913
dpbs_21 120.94 169.977 .704 . .912
dpbs_22 121.20 173.287 .537 . .915
dpbs_23 120.68 174.597 .669 . .913
dpbs_24 121.38 170.347 .532 . .915
dpbs_25 120.88 175.373 .560 . .914
dpbs_26_r 121.28 178.034 .314 . .918
dpbs_27 120.92 175.078 .564 . .914
dpbs_28_r 120.87 172.863 .391 . .918
dpbs_29 121.75 171.951 .491 . .916
dpbs_30 120.45 181.692 .329 . .917 DPBS Scale Statistics
Mean Variance SD N of items 125.07 186.895 13.671 30
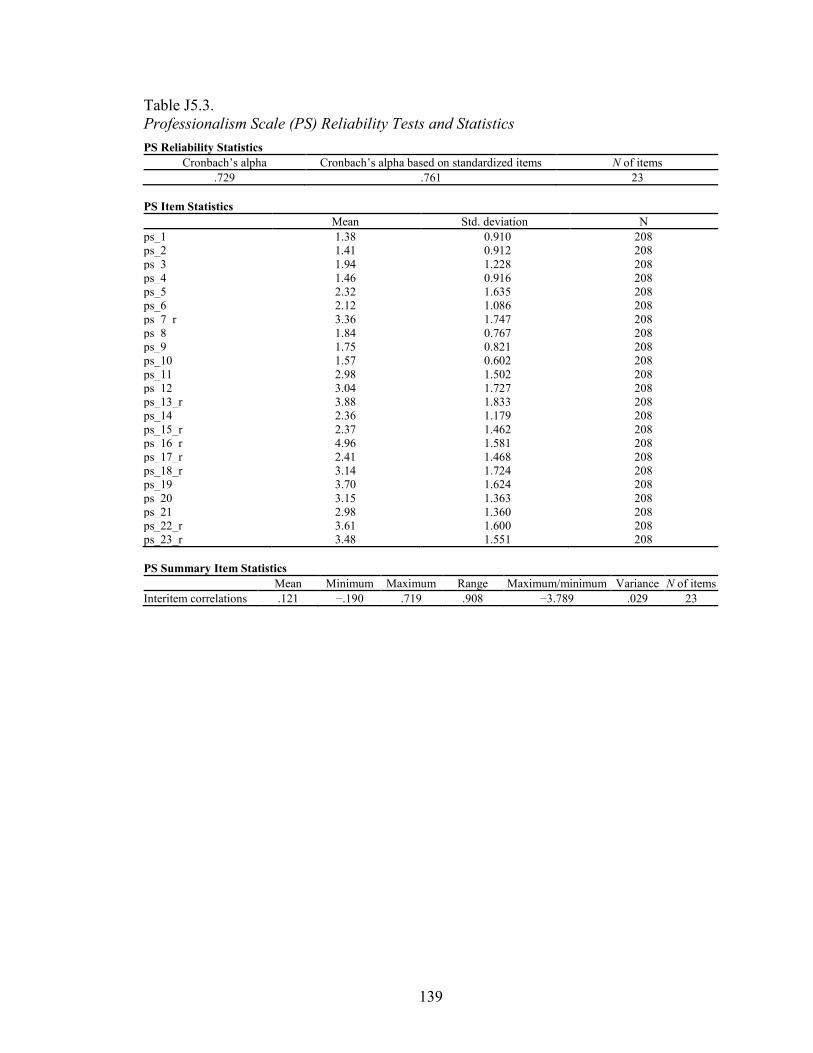
139
Table J5.3. Professionalism Scale (PS) Reliability Tests and Statistics PS Reliability Statistics
Cronbach’s alpha Cronbach’s alpha based on standardized items N of items .729 .761 23
PS Item Statistics
Mean Std. deviation N ps_1 1.38 0.910 208 ps_2 1.41 0.912 208 ps_3 1.94 1.228 208 ps_4 1.46 0.916 208 ps_5 2.32 1.635 208 ps_6 2.12 1.086 208 ps_7_r 3.36 1.747 208 ps_8 1.84 0.767 208 ps_9 1.75 0.821 208 ps_10 1.57 0.602 208 ps_11 2.98 1.502 208 ps_12 3.04 1.727 208 ps_13_r 3.88 1.833 208 ps_14 2.36 1.179 208 ps_15_r 2.37 1.462 208 ps_16_r 4.96 1.581 208 ps_17_r 2.41 1.468 208 ps_18_r 3.14 1.724 208 ps_19 3.70 1.624 208 ps_20 3.15 1.363 208 ps_21 2.98 1.360 208 ps_22_r 3.61 1.600 208 ps_23_r 3.48 1.551 208 PS Summary Item Statistics
Mean Minimum Maximum Range Maximum/minimum Variance N of items Interitem correlations .121 −.190 .719 .908 −3.789 .029 23
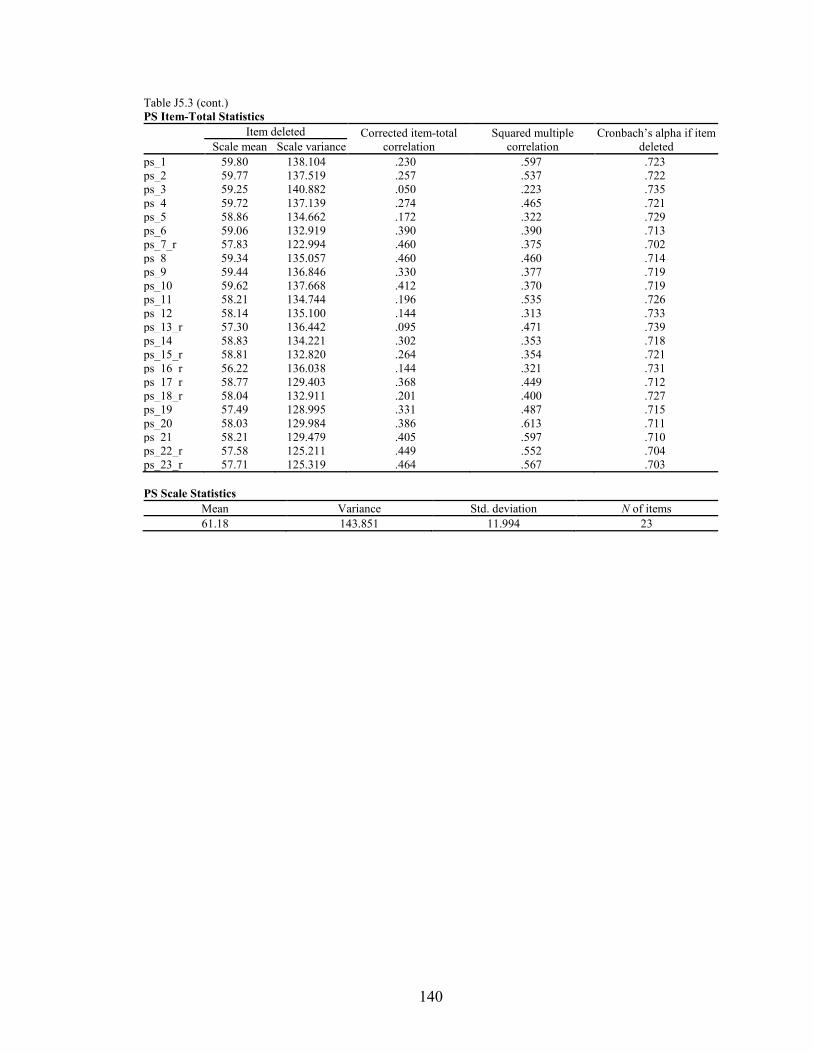
140
Table J5.3 (cont.) PS Item-Total Statistics
Item deleted Corrected item-total
correlation Squared multiple
correlation Cronbach’s alpha if item
deleted Scale mean Scale variance ps_1 59.80 138.104 .230 .597 .723 ps_2 59.77 137.519 .257 .537 .722 ps_3 59.25 140.882 .050 .223 .735 ps_4 59.72 137.139 .274 .465 .721 ps_5 58.86 134.662 .172 .322 .729 ps_6 59.06 132.919 .390 .390 .713 ps_7_r 57.83 122.994 .460 .375 .702 ps_8 59.34 135.057 .460 .460 .714 ps_9 59.44 136.846 .330 .377 .719 ps_10 59.62 137.668 .412 .370 .719 ps_11 58.21 134.744 .196 .535 .726 ps_12 58.14 135.100 .144 .313 .733 ps_13_r 57.30 136.442 .095 .471 .739 ps_14 58.83 134.221 .302 .353 .718 ps_15_r 58.81 132.820 .264 .354 .721 ps_16_r 56.22 136.038 .144 .321 .731 ps_17_r 58.77 129.403 .368 .449 .712 ps_18_r 58.04 132.911 .201 .400 .727 ps_19 57.49 128.995 .331 .487 .715 ps_20 58.03 129.984 .386 .613 .711 ps_21 58.21 129.479 .405 .597 .710 ps_22_r 57.58 125.211 .449 .552 .704 ps_23_r 57.71 125.319 .464 .567 .703 PS Scale Statistics
Mean Variance Std. deviation N of items 61.18 143.851 11.994 23
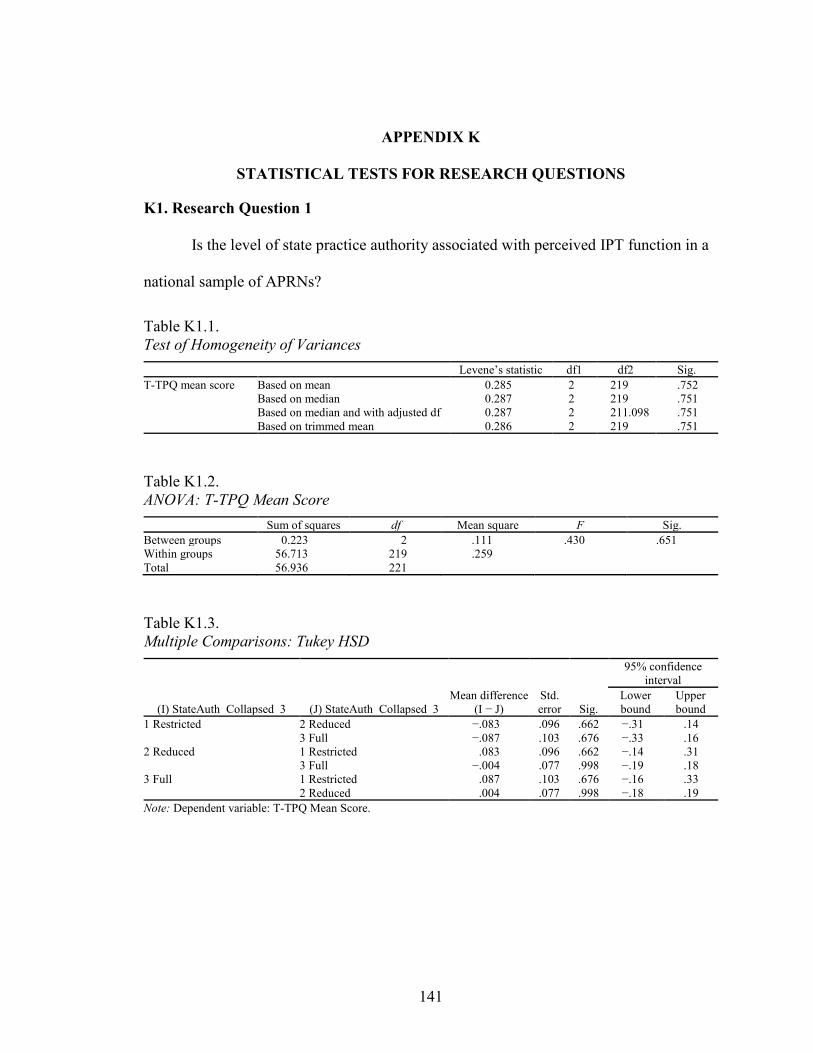
141
APPENDIX K
STATISTICAL TESTS FOR RESEARCH QUESTIONS
K1. Research Question 1
Is the level of state practice authority associated with perceived IPT function in a
national sample of APRNs?
Table K1.1. Test of Homogeneity of Variances
Levene’s statistic df1 df2 Sig. T-TPQ mean score Based on mean 0.285 2 219 .752
Based on median 0.287 2 219 .751 Based on median and with adjusted df 0.287 2 211.098 .751 Based on trimmed mean 0.286 2 219 .751
Table K1.2. ANOVA: T-TPQ Mean Score
Sum of squares df Mean square F Sig. Between groups 0.223 2 .111 .430 .651 Within groups 56.713 219 .259 Total 56.936 221
Table K1.3. Multiple Comparisons: Tukey HSD
(I) StateAuth_Collapsed_3 (J) StateAuth_Collapsed_3 Mean difference
(I − J) Std. error Sig.
95% confidence interval
Lower bound
Upper bound
1 Restricted 2 Reduced −.083 .096 .662 −.31 .14 3 Full −.087 .103 .676 −.33 .16
2 Reduced 1 Restricted .083 .096 .662 −.14 .31 3 Full −.004 .077 .998 −.19 .18
3 Full 1 Restricted .087 .103 .676 −.16 .33 2 Reduced .004 .077 .998 −.18 .19
Note: Dependent variable: T-TPQ Mean Score.
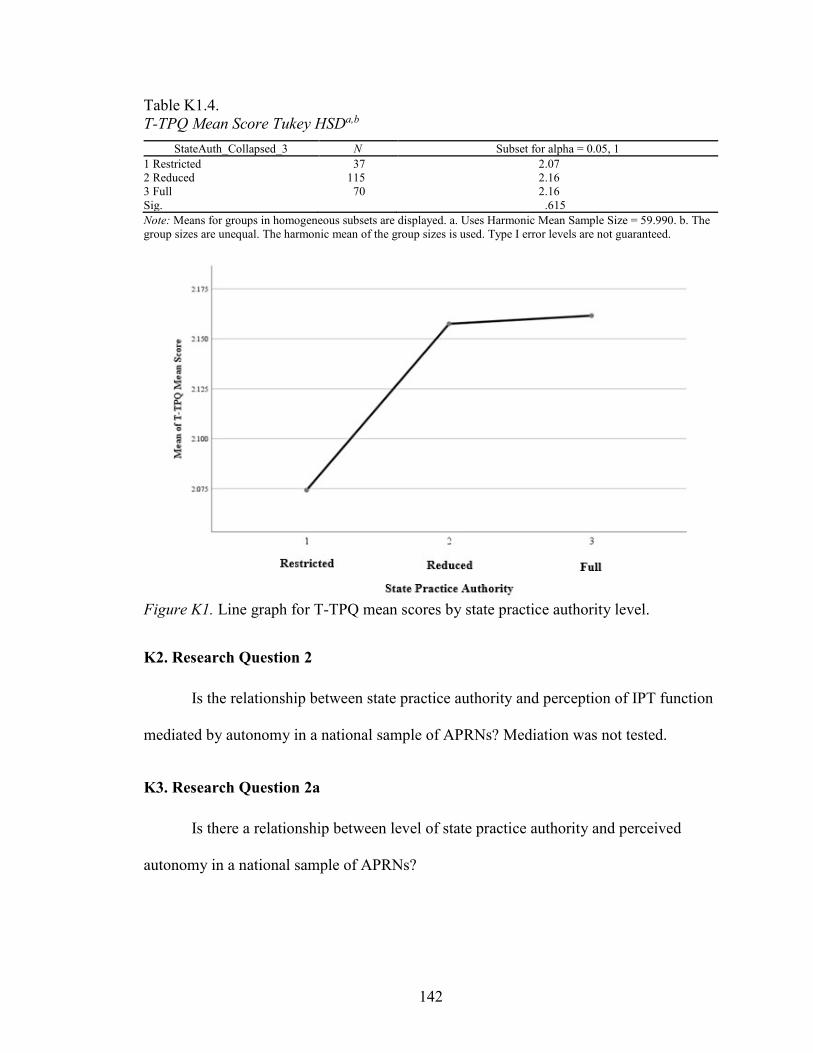
142
Table K1.4. T-TPQ Mean Score Tukey HSDa,b
StateAuth_Collapsed_3 N Subset for alpha = 0.05, 1 1 Restricted 37 2.07 2 Reduced 115 2.16 3 Full 70 2.16 Sig. .615 Note: Means for groups in homogeneous subsets are displayed. a. Uses Harmonic Mean Sample Size = 59.990. b. The group sizes are unequal. The harmonic mean of the group sizes is used. Type I error levels are not guaranteed.
Figure K1. Line graph for T-TPQ mean scores by state practice authority level.
K2. Research Question 2
Is the relationship between state practice authority and perception of IPT function
mediated by autonomy in a national sample of APRNs? Mediation was not tested.
K3. Research Question 2a
Is there a relationship between level of state practice authority and perceived
autonomy in a national sample of APRNs?
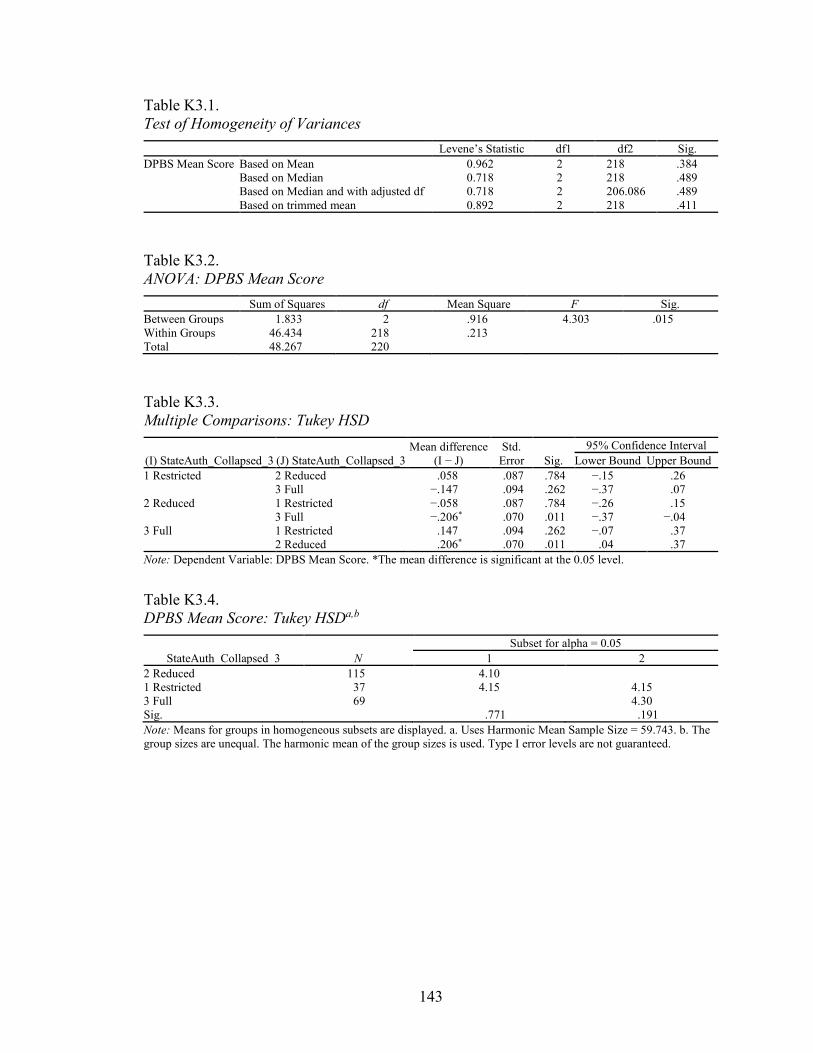
143
Table K3.1. Test of Homogeneity of Variances
Levene’s Statistic df1 df2 Sig. DPBS Mean Score Based on Mean 0.962 2 218 .384
Based on Median 0.718 2 218 .489 Based on Median and with adjusted df 0.718 2 206.086 .489 Based on trimmed mean 0.892 2 218 .411
Table K3.2. ANOVA: DPBS Mean Score
Sum of Squares df Mean Square F Sig. Between Groups 1.833 2 .916 4.303 .015 Within Groups 46.434 218 .213 Total 48.267 220
Table K3.3. Multiple Comparisons: Tukey HSD
(I) StateAuth_Collapsed_3 (J) StateAuth_Collapsed_3 Mean difference
(I − J) Std.
Error Sig. 95% Confidence Interval
Lower Bound Upper Bound 1 Restricted 2 Reduced .058 .087 .784 −.15 .26
3 Full −.147 .094 .262 −.37 .07 2 Reduced 1 Restricted −.058 .087 .784 −.26 .15
3 Full −.206* .070 .011 −.37 −.04 3 Full 1 Restricted .147 .094 .262 −.07 .37
2 Reduced .206* .070 .011 .04 .37 Note: Dependent Variable: DPBS Mean Score. *The mean difference is significant at the 0.05 level.
Table K3.4. DPBS Mean Score: Tukey HSDa,b
StateAuth_Collapsed_3 N Subset for alpha = 0.05
1 2 2 Reduced 115 4.10 1 Restricted 37 4.15 4.15 3 Full 69 4.30 Sig. .771 .191 Note: Means for groups in homogeneous subsets are displayed. a. Uses Harmonic Mean Sample Size = 59.743. b. The group sizes are unequal. The harmonic mean of the group sizes is used. Type I error levels are not guaranteed.
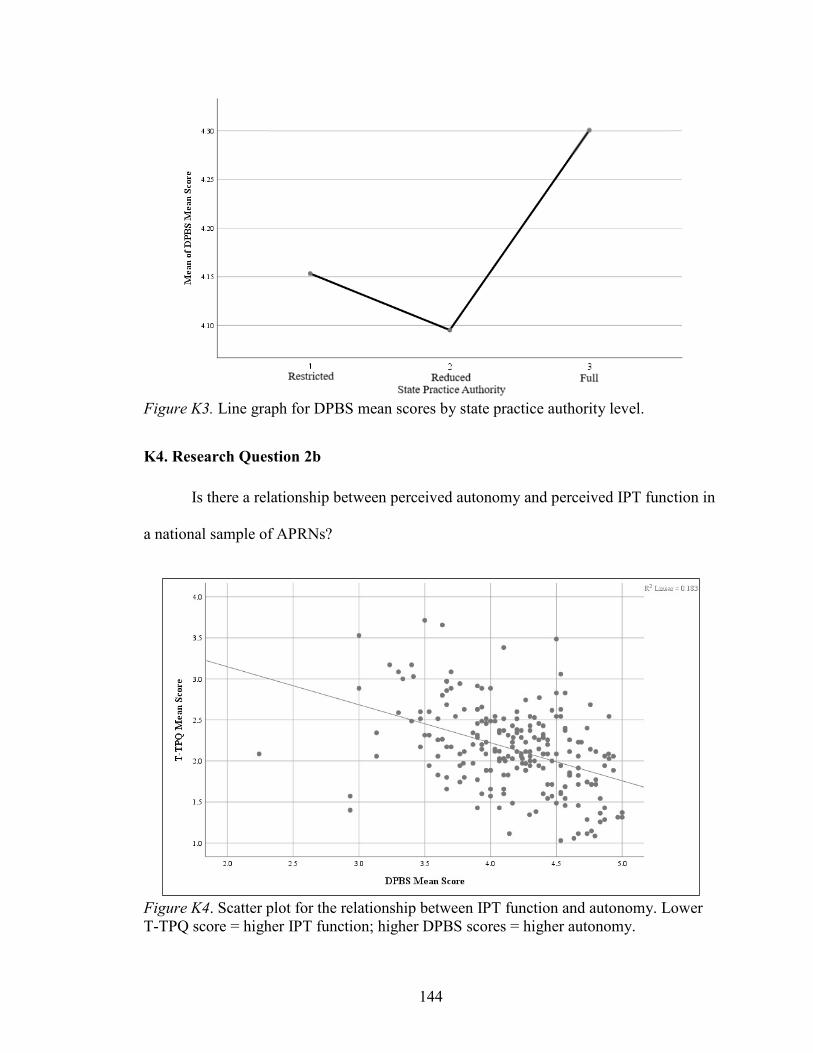
144
Figure K3. Line graph for DPBS mean scores by state practice authority level.
K4. Research Question 2b
Is there a relationship between perceived autonomy and perceived IPT function in
a national sample of APRNs?
Figure K4. Scatter plot for the relationship between IPT function and autonomy. Lower T-TPQ score = higher IPT function; higher DPBS scores = higher autonomy.

145
Table K4.1. Correlations
T-TPQ Mean Score DPBS Mean Score T-TPQ mean score Pearson correlation 1 −.427**
Sig. (2-tailed) .000 N 222 221
DPBS mean score Pearson correlation −.427** 1 Sig. (2-tailed) .000 N 221 221
Note: **Correlation is significant at the 0.01 level (2-tailed).
K5. Research Question 3
Is professionalism associated with perception of IPT function in a national sample
of APRNs?
Figure K5. Scatter plot for the relationship between IPT function and professionalism. Lower PS scores = higher professionalism; higher T-TPQ scores = higher IPT function.
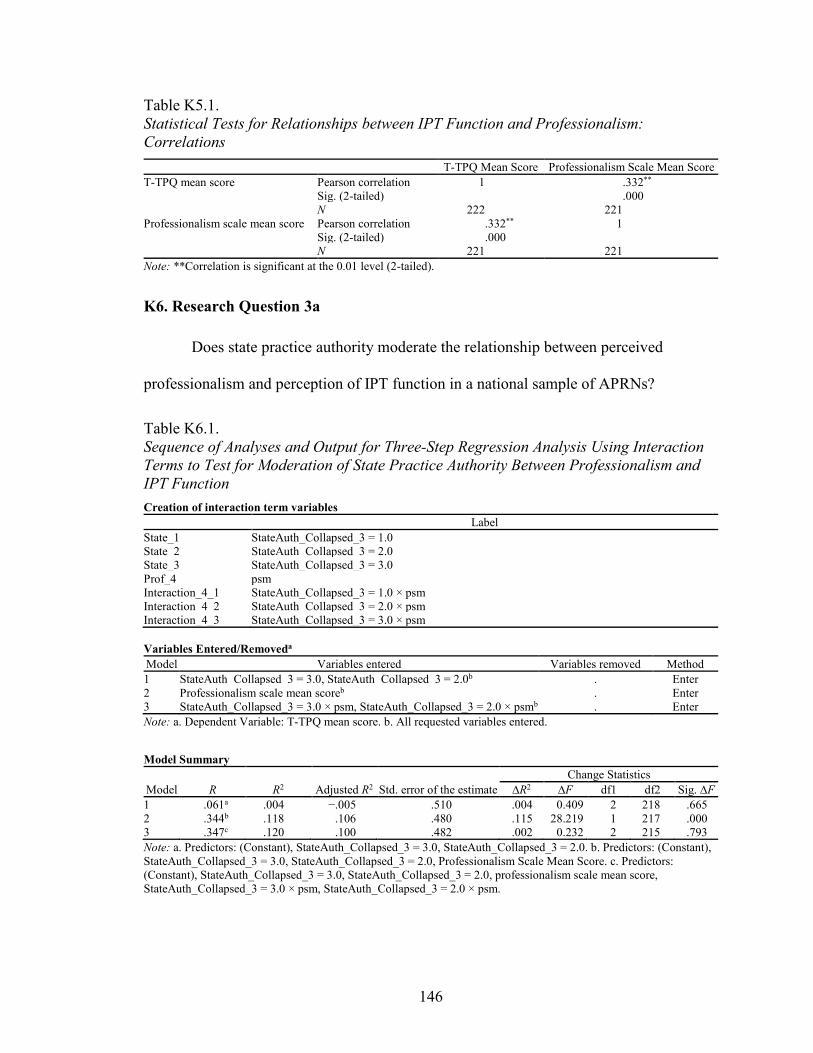
146
Table K5.1. Statistical Tests for Relationships between IPT Function and Professionalism: Correlations
T-TPQ Mean Score Professionalism Scale Mean Score T-TPQ mean score Pearson correlation 1 .332**
Sig. (2-tailed) .000 N 222 221
Professionalism scale mean score Pearson correlation .332** 1 Sig. (2-tailed) .000 N 221 221
Note: **Correlation is significant at the 0.01 level (2-tailed).
K6. Research Question 3a
Does state practice authority moderate the relationship between perceived
professionalism and perception of IPT function in a national sample of APRNs?
Table K6.1. Sequence of Analyses and Output for Three-Step Regression Analysis Using Interaction Terms to Test for Moderation of State Practice Authority Between Professionalism and IPT Function Creation of interaction term variables
Label State_1 StateAuth_Collapsed_3 = 1.0 State_2 StateAuth_Collapsed_3 = 2.0 State_3 StateAuth_Collapsed_3 = 3.0 Prof_4 psm Interaction_4_1 StateAuth_Collapsed_3 = 1.0 × psm Interaction_4_2 StateAuth_Collapsed_3 = 2.0 × psm Interaction_4_3 StateAuth_Collapsed_3 = 3.0 × psm Variables Entered/Removeda Model Variables entered Variables removed Method 1 StateAuth_Collapsed_3 = 3.0, StateAuth_Collapsed_3 = 2.0b . Enter 2 Professionalism scale mean scoreb . Enter 3 StateAuth_Collapsed_3 = 3.0 × psm, StateAuth_Collapsed_3 = 2.0 × psmb . Enter Note: a. Dependent Variable: T-TPQ mean score. b. All requested variables entered.
Model Summary
Model R R2 Adjusted R2 Std. error of the estimate Change Statistics
∆R2 ∆F df1 df2 Sig. ∆F 1 .061a .004 −.005 .510 .004 0.409 2 218 .665 2 .344b .118 .106 .480 .115 28.219 1 217 .000 3 .347c .120 .100 .482 .002 0.232 2 215 .793 Note: a. Predictors: (Constant), StateAuth_Collapsed_3 = 3.0, StateAuth_Collapsed_3 = 2.0. b. Predictors: (Constant), StateAuth_Collapsed_3 = 3.0, StateAuth_Collapsed_3 = 2.0, Professionalism Scale Mean Score. c. Predictors: (Constant), StateAuth_Collapsed_3 = 3.0, StateAuth_Collapsed_3 = 2.0, professionalism scale mean score, StateAuth_Collapsed_3 = 3.0 × psm, StateAuth_Collapsed_3 = 2.0 × psm.
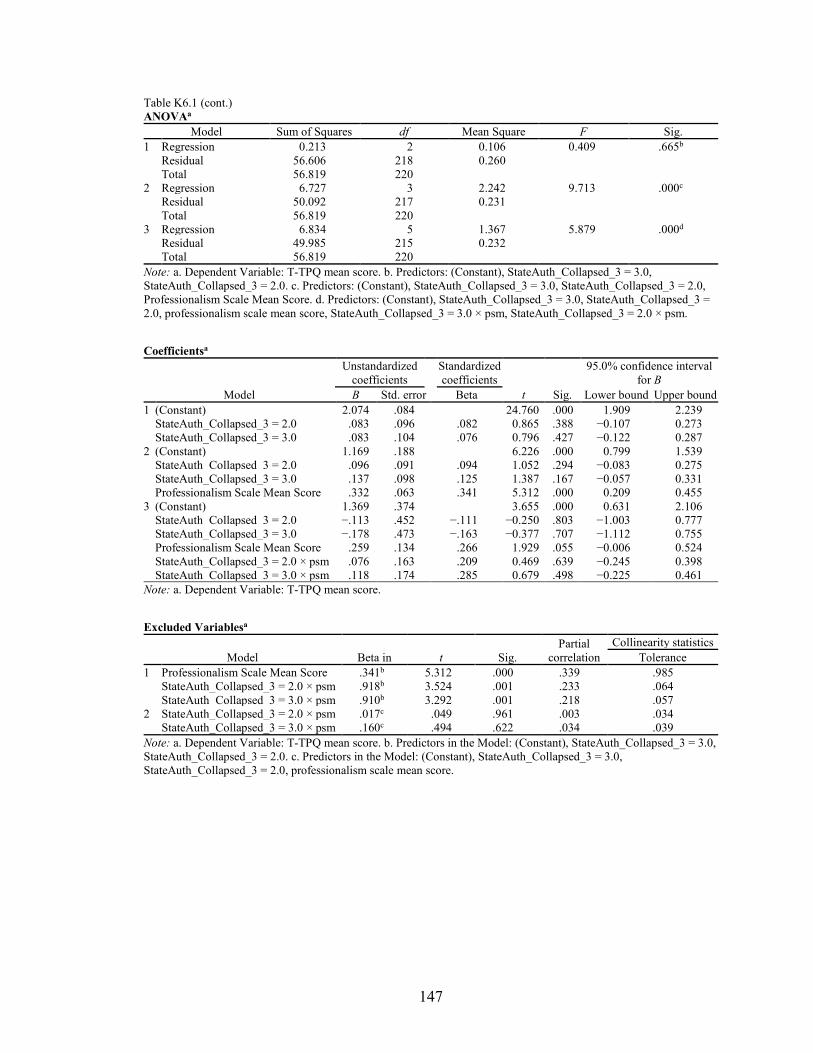
147
Table K6.1 (cont.) ANOVAa
Model Sum of Squares df Mean Square F Sig. 1 Regression 0.213 2 0.106 0.409 .665b
Residual 56.606 218 0.260 Total 56.819 220
2 Regression 6.727 3 2.242 9.713 .000c Residual 50.092 217 0.231 Total 56.819 220
3 Regression 6.834 5 1.367 5.879 .000d Residual 49.985 215 0.232 Total 56.819 220
Note: a. Dependent Variable: T-TPQ mean score. b. Predictors: (Constant), StateAuth_Collapsed_3 = 3.0, StateAuth_Collapsed_3 = 2.0. c. Predictors: (Constant), StateAuth_Collapsed_3 = 3.0, StateAuth_Collapsed_3 = 2.0, Professionalism Scale Mean Score. d. Predictors: (Constant), StateAuth_Collapsed_3 = 3.0, StateAuth_Collapsed_3 = 2.0, professionalism scale mean score, StateAuth_Collapsed_3 = 3.0 × psm, StateAuth_Collapsed_3 = 2.0 × psm.
Coefficientsa
Model
Unstandardized coefficients
Standardized coefficients
95.0% confidence interval for B
B Std. error Beta t Sig. Lower bound Upper bound 1 (Constant) 2.074 .084 24.760 .000 1.909 2.239
StateAuth_Collapsed_3 = 2.0 .083 .096 .082 0.865 .388 −0.107 0.273 StateAuth_Collapsed_3 = 3.0 .083 .104 .076 0.796 .427 −0.122 0.287
2 (Constant) 1.169 .188 6.226 .000 0.799 1.539 StateAuth_Collapsed_3 = 2.0 .096 .091 .094 1.052 .294 −0.083 0.275 StateAuth_Collapsed_3 = 3.0 .137 .098 .125 1.387 .167 −0.057 0.331 Professionalism Scale Mean Score .332 .063 .341 5.312 .000 0.209 0.455
3 (Constant) 1.369 .374 3.655 .000 0.631 2.106 StateAuth_Collapsed_3 = 2.0 −.113 .452 −.111 −0.250 .803 −1.003 0.777 StateAuth_Collapsed_3 = 3.0 −.178 .473 −.163 −0.377 .707 −1.112 0.755 Professionalism Scale Mean Score .259 .134 .266 1.929 .055 −0.006 0.524 StateAuth_Collapsed_3 = 2.0 × psm .076 .163 .209 0.469 .639 −0.245 0.398 StateAuth_Collapsed_3 = 3.0 × psm .118 .174 .285 0.679 .498 −0.225 0.461
Note: a. Dependent Variable: T-TPQ mean score.
Excluded Variablesa
Model Beta in t Sig. Partial
correlation Collinearity statistics
Tolerance 1 Professionalism Scale Mean Score .341b 5.312 .000 .339 .985
StateAuth_Collapsed_3 = 2.0 × psm .918b 3.524 .001 .233 .064 StateAuth_Collapsed_3 = 3.0 × psm .910b 3.292 .001 .218 .057
2 StateAuth_Collapsed_3 = 2.0 × psm .017c .049 .961 .003 .034 StateAuth_Collapsed_3 = 3.0 × psm .160c .494 .622 .034 .039
Note: a. Dependent Variable: T-TPQ mean score. b. Predictors in the Model: (Constant), StateAuth_Collapsed_3 = 3.0, StateAuth_Collapsed_3 = 2.0. c. Predictors in the Model: (Constant), StateAuth_Collapsed_3 = 3.0, StateAuth_Collapsed_3 = 2.0, professionalism scale mean score.
148
REFERENCES
Adams, D., & Miller, B. K. (2001, July-August). Professionalism in nursing behaviors of
nurse practitioners. Journal of Professional Nursing, 17(4), 203–210.
Agency for Healthcare Research and Quality (2015). Teamwork Perceptions
Questionnaire (T-TPQ) for Office-Based Care [Measurement instrument].
Published instrument. Retrieved from http://www.ahrq.gov/teamstepps
/officebasedcare/handouts/teamperceptions.html
Agency for Healthcare Research and Quality. (n.d.). Team-based primary care measures
database: Construct definitions. Retrieved February 24, 2016, from https://
primarycaremeasures.ahrq.gov/team-based-care/Home/Framework?TopicId=17
Akhtar-Danesh, N., Baumann, A., Kolotylo, C., Lawlor, Y., Tompkins, C., & Lee, R.
(2013). Perceptions of professionalism among nursing faculty and nursing
students. Western Journal of Nursing Research, 35(2), 248–271.
Almost, J., & Laschinger, H. K. (2002). Workplace empowerment, collaborative work
environments, and job strain in nurse practitioners. Journal of the American
Academy of Nurse Practitioners, 14(9), 408–420.
American Institutes for Research. (2010). TeamSTEPPS® Teamwork Perceptions
Questionnaire (T-TPQ) manual. Retrieved from Agency for Healthcare Research
and Quality: https://www.ahrq.gov/teamstepps/instructor/reference
/teamperceptionsmanual.html
149
American Institutes for Research (2010). TeamSTEPPS® Teamwork Perceptions
Questionnaire (T-TPQ®) [Measurement instrument]. Published instrument.
Retrieved from http://teamstepps.ahrq.gov/teamwork_perception_questionnaire
American Nurses Association. (2015). Code of ethics for nurses with interpretive
statements. doi:978-1-55810-600-0
American Nurses Association. (2015). Nursing: Scope and standards of practice (3rd ed.).
Silver Spring, MD: Author.
Anonson, J. M., Fergfuson, L., Macdonald, M. B., Murray, B. L., Fowler-Kerry, S., &
Bally, J. M. (2009). The anatomy of interprofessional leadership: An investigation
of leadership behaviors in team-based health care. Journal of Leadership Studies,
3(3), 17–25.
Apker, J., Propp, K. M., & Zabava Ford, W. S. (2005, May). Negotiating status and
identity tensions in healthcare team interactions: An exploration of nurse role
dialectics. Journal of Applied Communication Research, 33(2), 93–115.
Ashforth, B. E., Harrison, S. H., & Corley, K. G. (2008, June). Identification in
organizations: An examination of four fundamental questions. Journal of
Management, 34(3), 325–374.
Bahadori, A., & Fitzpatrick, J. J. (2009). Level of autonomy of primary care nurse
practitioners. Journal of the American Academy of Nurse Practitioners, 21, 513–
519.

150
Baron, R. M., & Kenny, D. A. (1986). The moderator-mediator variable distinction in
social psychological research: Conceptual, strategic, and statistical considerations.
Journal of Personality and Social Psychology, 51(6), 1173–1182.
Batey, M. V., & Lewis, F. M. (1982, September). Clarifying autonomy and
accountability in nursing service: Part I. Journal of Nursing Administration, 12(9),
13–18.
Baumann, A., & Kolotylo, C. (2009). The Professionalism and Environmental Factors in
the Workplace Questionnaire®: Development and psychometric evaluation.
Journal of Advanced Nursing, 65(10), 2216–2228.
Bothma, F. C., Lloyd, S., & Khapova, S. (2015). Work identity: Clarifying the concept.
In P. G. Jansen & G. Roodt (Eds.), Conceptualizing and measuring work identity:
South-African perspectives and findings (pp. 23–51). New York, NY: Springer.
Bower, P., Campbell, S., Bojke, C., & Sibbald, B. (2003). Team structure, team climate
and the quality of care in primary care: an observational study. Qual Saf Health
Care, 12, 273–279.
Cajulis, C. B., & Fitzpatrick, J. J. (2007). Levels of autonomy of nurse practitioners in an
acute care setting. Journal of the American Academy of Nurse Practitioners, 19,
1–8.
Cardoso, I., Batista, P., & Graça, A. (2014). Professional identity in analysis: A
systematic review of the literature. The Open Sports Science Journal, 7(Suppl-2,
M2), 83–97.
151
Caza, B. B., & Creary, S. J. (2016). The construction of professional identity. In A.
Wilkinson, D. Hislop, & C. Coupland (Eds.), Perspectives on contemporary
professional work: Challenges and experiences (pp. 259–285). Cheltenham, UK:
Edward Elgar.
Cohen, J. (1988). Statistical power analysis for the behavioral sciences (2nd ed.).
Hillsdale, NJ: Lawrence Erlbaum.
Crigger, N., & Godfrey, N. (2014, September/October). Approach to teaching
professional identity formation and professional ethics. Journal of Professional
Nursing, 30(5), 367–382.
DeKeyser Ganz, F., Toren, O., & Faldon, Y. (2016). Factors associated with full
implementation of scope of practice. Journal of Nursing Scholarship, 43(3), 285–
293.
Dempster, J. S. (1990). Conceptualization, construction, and psychometric evaluation of
an empirical instrument. Dissertations Abstracts International: Section A.
Humanities and Social Sciences, 50(3320A).
Dempster, J. S. (1990). Dempster Practice Behaviors Scale [Measurement instrument].
Unpublished instrument. Phoenix, AZ.
Dillman, D. A., Smyth, J. D., & Christian, L. M. (2014). Internet, phone, mail, and
mixed-mode surveys: The tailored design method (4th ed.). Hoboken, NJ: Wiley
& Sons.
Drost, E. A. (2011). Validity and reliability in social science research. Education
Research and Perspectives, 38(1), 105-121.
152
Erikson, E. H. (1963). Childhood and society. New York, NY: W. W. Norton.
Erikson, E. H. (1968). Identity: Youth and crisis. New York, NY: W. W. Norton.
Exact Data. (2017). How our Business Database is compiled. Retrieved November 15,
2017, from https://www.exactdata.com/business-mailing-lists/healthcare.html
Fagermoen, M. S. (1997). Professional identity: values embedded in meaningful nursing
practice. Journal of Advanced Nursing, 25, 434–441.
Faul, F., Erdfelder, E., Lane, A., & Buchner, A. (2007). G*Power (3.1) [Measurement
instrument]. Retrieved from http://www.gpower.hhu.de/en.html
Godfrey, N., & Crigger, N. (2017). Professional identity. In J. F. Giddens (Ed.), Concepts
for nursing practice (2nd ed., pp. 379–385). St. Louis, MO: Elsevier.
Hampton, D. L., & Hampton, G. M. (2000, June). Professionalism and the nurse-midwife
practitioner: An exploratory study. Journal of the American Academy of Nurse
Practitioners, 12(6), 218–225.
Harris, P. A., Taylor, R., Thielke, R., Payne, J., Gonzalez, N., & Conde, J. G. (2009,
April). Research electronic data capture (REDCap): A metadata-driven
methodology and workflow process for providing translational research
informatics support. Journal of Biomedical Information, 42(2), 377–381.
Institute of Medicine Committee on Quality Health Care in America. (2001). Crossing
the quality chasm: A new health system for the 21st century. Washington, DC:
National Academy Press.
Institute of Medicine of the National Academies. (2003). Health professions education: A
bridge to quality. Retrieved from www. nap.edu
153
Institute of Medicine of the National Academies. (2011). The future of nursing: Leading
change, advancing health. Washington, DC: National Academy of Sciences.
Interprofessional Education Collaborative Expert Panel. (2011). Core competencies for
interprofessional collaborative practice: Report of an expert panel. Washington,
DC: Interprofessional Education Collaborative.
Johnson, M., Cowin, L. S., Wilson, I., & Young, H. (2012). Professional identity and
nursing: Contemporary theoretical developments and future research challenges.
International Nursing Review, 59, 562–569.
Keebler, J. R., Dietz, A. S., Lazzara, E. H., Benishek, L. E., Almeida, S. A., Toor, P. A.,
… Salas, E. (2014). Validation of a teamwork perceptions measure to increase
patient safety. BMJ Qual Saf, 23, 718–726.
Keenan, J. (1999, March). A concept analysis of autonomy. Journal Advanced Nursing,
29(3), 556–562.
Machin, A. I., Machin, T., & Pearson, P. (2012). Maintaining equilibrium in professional
role identity: a grounded theory study of health visitors’ perceptions of their
changing professional practice context. Journal of Advanced Nursing.
MacIntosh, J. (2003). Reworking professional nursing identity. Western Journal of
Nursing, 25(6), 725–741.
Makary, M. A., Sexton, B., Freischlag, J. A., Holzmueller, C. G., Millman, E. A., Rowen,
L., & Pronovost, P. J. (2006, May). Operating room teamwork among physicians
and nurses: Teamwork in the eye of the beholder. Journal of the American
College of Surgeons, 202(5), 746–752.

154
Mansfield, E. R., & Helms, B. P. (1982). Detecting multicollinearity. The American
Statistician, 36(3a), 158–160.
Maylone, M. M., Ranieri, L., Quinn Griffin, M. T., McNulty, R., & Fitzpatrick, J. (2011).
Collaboration and autonomy: Perceptions among nurse practitioners. Journal of
the American Academy of Nurse Practitioners, 23, 51–57.
Mitchell, R., & Boyle, B. (2015). Professional diversity, identity salience and team
innovation: The moderating role of openmindedness. Journal of Organizational
Behavior, 36, 873–894.
Mitchell, R. J., Parker, V., & Giles, M. (2011). When do interprofessional teams
succeed? Investigating the moderating roles of team and professional identity in
interprofessional effectiveness. Human Relations, 64(10), 1321–1343.
National Council of State Boards of Nursing APRN Advisory Committee. (2008).
Consensus model for APRN regulation, licensure, accreditation, certification &
education. Washington, DC: National Council of State Boards of Nursing.
National Council of State Boards of Nursing website. (2017). https://www.ncsbn.org
/2017Septmapwithpoints.pdf
National Governor’s Association. (2012). The role of nurse practitioners in meeting
increasing demand for primary care. Washington, DC: Author.
Newhouse, R. P., Stanik-Hutt, J., White, K. M., Johantgen, M., Bass, E. B., Zangaro, G.,
… Weiner, J. P. (2011). Advance practice nurse outcomes 1990–2008: A
systematic review. Nursing Economics, 29(5), 1–21.
Pallant, J. (2013). SPSS survival manual (5th ed.). New York, NY: McGraw-Hill.

155
Pan, S., Straub, L. A., & Geller, J. N. (1997, January). Restrictive practice environment
and nurse practitioners’ prescriptive authority. Journal of the American Academy
of Nurse Practitioners, 9(1).
Petersen, P. A., Keller, T., Way, S. M., & Borges, W. J. (2015). Autonomy and
empowerment in advanced practice registered nurses: Lessons from New Mexico.
Journal of the American Association of Nurse Practitioners, 27, 363–370.
Piil, K., Kolbaek, R., Ottmann, G., & Rasmussen, B. (2012, November/December). The
impact of the expanded nursing practice on professional identity in Denmark.
Clinical Nurse Specialist, 329–335.
Poghosyan, L., & Liu, J. (2016). Nurse practitioner autonomy and relationships with
leadership affect teamwork in primary care practices: a cross-sectional survey. J
of Gen Intern Med, 31(7), 771–777.
Proshansky, H. M., Fabian, A. K., & Kaminoff, R. (1983). Place-identity: Physical world
socialization of the self. Journal of Environmental Psychology, 3, 57–83.
Regan, S., Laschinger, H. K., & Wong, C. A. (2016). The influence of empowerment,
authentic leadership, and professional practice on nurses’ perceived
interprofessional collaboration. Journal of Nursing Management, 24, E54–E61.
Roblin, D. W., Howard, D. H., Ren, J., & Becker, E. R. (2011). An evaluation of the
influence of primary care team functioning on the health of Medicare
beneficiaries. Medical Care Research and Review, 68(2), 177–201.
Rudner Lugo, N., O’Grady, E. T., Hodnicki, D., & Hanson, C. (2010, January-February).
Are regulations more consumer-friendly when boards of nursing are the sole
regulators of nurse practitioners? Journal of Professional Nursing, 26(1), 29–34.

156
Schwartz, S. J., Zamboanga, B. L., Luyckx, K., Meca, A., & Ritchie, R. A. (2013).
Identity in emerging adulthood: Reviewing the field and looking forward.
Emerging Adulthood, 1(2), 96–113.
Scotten, M., Manos, E. L., Malicoat, A., & Paolo, A. M. (2015). Minding the gap:
Interprofessional communication during inpatient and post discharge chasm care.
Patient Education and Counseling, 98, 895–900.
Settersten, L. (1991). Professionalism of nurse practitioners. Journal of the American
Academy of Nurse Practitioners, 3(4), 145–151.
Shadish, W. R., Cook, T. D., & Campbell, D. T. (2001). Experimental and quasi-
experimental evaluation. New York: Houghton Mifflin.
Siebert, D. C., & Siebert, C. F. (2005, May). The Caregiver Role Identity Scale: A
validation study. Research on Social Work Practice, 15(3), 204–212.
Skorikov, V. B., & Vondracek, F. W. (2011). Occupational identity. In S. J. Schwartz, K.
Luyckx, & V. L. Vignoles (Eds.), Handbook of identity theory and research (Vol.
1 ed., pp. 693–714). New York, NY: Springer.
Snizek, W. E. (1972, February). Hall’s professionalism Scale: An empirical reassessment.
American Psychological Review, 37, 109–114.
Strasser, D. C., Falconer, J. A., Herrin, J. S., Bowen, S. E., Stevens, A. B., & Uomoto, J.
(2005). Team functioning and patient outcomes in stroke rehabilitation. Arch Phys
Med Rehabil, 86, 403–409.
Tajfel, H., & Turner, J. C. (1979). An integrative theory of intergroup conflict. In W. G.
Austin & S. Worchel (Eds.), The social psychology of intergroup relations.
Monterey, CA: Brooks/Cole.

157
Turner, J. C. (1982). Towards a cognitive redefinition of the social group. In H. Tajfel
(Ed.), Social identity and intergroup relations (pp. 15–40). New York: Cambridge
University Press.
U.S. Office of Management and Budget: Revisions to the Standards for the Classification
of Federal Data on Race and Ethnicity, Statistical Policy Directive No. 15, Race
and Ethnic Standards for Federal Statistics and Administrative Reporting Office
of Management and Budget § (1997).
Weiland, S. A. (2015). Understanding nurse practitioner autonomy. Journal of the
American Association of Nurse Practitioners, 27, 95–104.
Weston, M. J. (2010, January 31). Strategies for enhancing autonomy and control over
nursing practice. The Online Journal of Issues in Nursing, 15(1). doi:10.3912
/OJIN.Vol15No01Man02
Young, A. (2010). Professionalism and ethical issues in nurse prescribing. Nurse
Prescribing, 8(6), 284–290.