relationships among 81 durum genotypes based on …ressources.ciheam.org/om/pdf/a22/95605377.pdf ·...
TRANSCRIPT

Relationships among 81 durum genotypes based on RRLPs, gliadins,parentage, and quality traits
Sorrells M.E., Barbosa J., Nachit M., Ketata H., Autrique E.
in
Di Fonzo N. (ed.), Kaan F. (ed.), Nachit M. (ed.). Durum wheat quality in the Mediterranean region
Zaragoza : CIHEAMOptions Méditerranéennes : Série A. Séminaires Méditerranéens; n. 22
1995pages 249-262
Article available on line / Article disponible en ligne à l’adresse :
--------------------------------------------------------------------------------------------------------------------------------------------------------------------------
http://om.ciheam.org/article.php?IDPDF=95605377
--------------------------------------------------------------------------------------------------------------------------------------------------------------------------
To cite th is article / Pour citer cet article
--------------------------------------------------------------------------------------------------------------------------------------------------------------------------
Sorrells M.E., Barbosa J., Nachit M., Ketata H., Autrique E. Relationships among 81 durum
genotypes based on RRLPs, gliadins, parentage, and quality traits. In : Di Fonzo N. (ed.), Kaan
F. (ed.), Nachit M. (ed.). Durum wheat quality in the Mediterranean region . Zaragoza : CIHEAM, 1995. p.
249-262 (Options Méditerranéennes : Série A. Séminaires Méditerranéens; n. 22)
--------------------------------------------------------------------------------------------------------------------------------------------------------------------------
http://www.ciheam.org/http://om.ciheam.org/

Relationships among 81 durum genotypes based RFLPs, gliadins, parentage, and quality traits
M.E. SORRELLS J. BARBOSA DEPARTMENT OF PLANT BREEDING AND BIOMETRY CORNELL UNIVERSITY, NY USA
M.M. NACHIT H. KETATA DURUM WHEAT BREEDING PROJECT CIMMYTACARDA SYRIA
E. AUTRIQUE DURUM WHEAT BREEDING PROJECT CIMMYT MEXICO
SUMMARY - Efficient use of durum germplasm is enhanced by understanding the patterns of genetic variation for the traits of interest. RFLP, gliadin components, abd grain quality traits, and coefficients of parentage data were recorded and compared to assess the correspondence between similarity matrices based on these different traits. Individual gliadin and RFLP bands were analyzed for association with quality traits. Quantification of genetic variation between parental material used for hybridization could enhance the level of variation in breeding populations.
Key words: RFLP, gliadin, coefficient of parentage, grain quality, correspondence analysis, genetic variation.
RESUME - "Relations entre 81 génotipes de blé dur basés sur RFLP, gliadines, parenté et caractères de qualité". Une utilisation efficace du germosplasme de blé dur est accrue par la compréhension des mécanismes de variation génétique des caractères d'intérêt. Les RFLP, les composantes gliadine, les caractères de qualité du grain, et les coefficients concernant les données de parenté ont été enregistrés et comparés afin d'évaluer la correspondance entre matrices de similarité basées sur ces différents types de caractères. Les bandes individuelles de gliadine et de RFLP ont éfé analysées en recherchant leur association avec des caractères de qualité. La quantification de la variation génétique chez le matériel apparenté utilisé pour l'hybridation a permis d'augmenter le niveau de variation dans les populations améliorées.
: RFLP, gliadine, coefficient de parenté, qualité du grain, analyse de correspondance, variation génétique.
Introduction
Efficient utilization of a germplasm collection is enhanced by knowledge of patterns of genetic variation within the collection for traits of interest. If the geographic distribution of variation for a trait is known, accessions can be sampled from the region where the desired characteristic frequently occurs. Sampling also can be based on patterns of genetic relationship among accessions from different regions. These patterns of genetic relationship may be based on geographic proximity, several qualitative or quantitative morphological traits, isozymes, RFLPs, flavonoids, or other traits.
Genetic variation in gene pools of self-pollinated crops has been analyzed by studying the pedigree relationship between cultivars released over a period of time. Coefficient of parentage estimation of cultivars of oats (Souza and Sorrells, 1988), soybean (Cox et al., 1985a), winter wheat (Cox et al.,
249
CIHEAM - Options Mediterraneennes
Serie A: Seminaires mediterraneens

as well as other crops has shown that a restricted number of ancestral genotypes account for a large proportion of the variation present in released cultivars. In barley, the hybridization of different gene pools was traditionally restricted to two-row and six row barley cultivars (Martin et al.,
Durum wheat germplasm collections from the USA and Italy were evaluated for morphological traits (Jain et al., Porceddu, flag leaf characteristics (Spagnoletti Zeuli and Qualset, physiological and morphological traits (Clarke et al., ; Yang et al., Based on a diversity index, greater variation was found for some of the countries that are believed to be the centres of diversity and diversification. Total variation was reported to be significantly different among the characters but not among the countries (Porceddu, Low genetic diversity in Ethiopia was reported by Yang et al. while another study of landraces collected in Ethiopia showed great diversity for many traits (Srivastava et al.,
Morphological traits often do not reliably portray genetic relationships because of environmental interactions, epistatic interactions and because the genetic control of the traits is often unknown. Genetic markers such as restriction fragment length polymorphism (RFLP) represent genetic variation at the DNA level, allowing an estimation of the degree of relatedness between individuals without the influence of environmental variation.
Protein content and composition are the most important factors affecting pasta quality. Known relationships exist between gliadin banding patterns separated by polyacrylamide gel electrophoresis (PAGE) and the gluten quality of the endosperm proteins (Kosmolak et al., In particular, the presence of gliadin band and the absence of has been shown to be associated with strong gluten (Damidaux et al., Yupsanis and Moustakis, Pogna et al., Joppa et al. used Langdon durum aneuploids with chromosomes substituted from the strong gluten variety Edmore to show that chromosome contained the gene(s) responsible for these gliadin bands and the resultant effect on gluten strength and SDS sedimentation. Leisle et al. found a strong association between chaff colour, gliadin bands and and gluten strength with white chaff varieties having strong gluten and band while those with bronze chaff had weak gluten and band
In this study, RFLP, gliadin, quality traits, and pedigree data recorded on durum accessions were compared to assess the correspondence between similarity matrices based on these different types of traits. In addition, individual gliadin and RFLP bands were analyzed for association with quality traits. Quantification of genetic variation between individual genotypes used for hybridization could enhance the level of variation in breeding populations.
and methods
Accessions and
A sample of durum accessions from Algeria, Canada, Cyprus, Ethiopia, Italy, Jordan, Lebanon, Morocco, Syria, Turkey, USA, and improved lines from CIMMYTACARDA breeding program were obtained from the ICARDA germplasm collection. RFLP, gliadin, SDS sedimentation, protein content, vitreousness, thousand kernel weight and semolina colour (yellow pigment) data were collected for all of these accessions; however, one accession was not included in the RFLP survey. SDS sedimentation index (SDSI) was calculated by dividing SDS sedimentation volume (ml) by percent protein content.
For RFLP analysis, ten grams of fresh leaf tissue from eight to ten day old plants were frozen in liquid nitrogen, ground and used for DNA extraction. Extraction buffer and procedure used were based on Tai and Tanksley using one to one volume of chloroformlisoamyl instead of potassium acetate and omitting the second DNA precipitation. DNA was cut with the restriction enzyme EcoRl (AAB, Aurora, CO) using the appropriate buffer and conditions specified by the manufacturer. Approximately pg of digested DNA were loaded into a agarose gel, electrophoresed and transferred to a Hybond N+ membrane (Amersham International plc). Probes were labelled using [32P]dCTP by random priming method (Feinberg and Vogelstein, Filters were washed as described in Anderson et al. and filters were exposed over X-ray film for 5 to 7 days.
CIHEAM - Options Mediterraneennes
Serie A: Seminaires mediterraneens

Thirty-nine probes from oat and barley cDNA libraries and a wheat genomic library, described in Heun et al. (1991), were used. Probes were selected based on their chromosomal location (Anderson et al., 1992). These clones showed hybridization to fragments of the A and B genomes, based on Chinese Spring aneuploids, and were distributed across the 7 chromosome groups.
Gliadins were extracted from seeds, electrophoresed, and assayed as described in the ICARDA technical manual for Crop Quality Evaluation Methods and Guidelines (Williams et al., 1988). A total of 145 distinct electrophoretic bands were present in the sample of 81 accessions, and 127 of these were polymorphic. As with the RFLPs, each distinct band was scored as present or absent in each accession. Allelic relationships were not determined for gliadins or restriction fragments.
SDS sedimentation volume, protein content, thousand kernel weight, percent vitreous kernels, and semolina flour colour, referred to collectively as quality traits, were scored for samples from a three-replicate trial at Tel Hadya, Syria under rainfed conditions (230 mm annual rainfall). Genotypic values for these traits were estimated from least squares means, derived from analysis of variance for each trait.
Coefficient of parentage
The coefficient of parentage (COP) between two individuals is defined as the probability that a random allele at a locus in one individual is identical by descent to a random allele at the same locus in the other individual. COP values (r) were estimated as described by Cox et al. (1 985b). Assumptions for this estimation were: (i) each parent contributes equally to the genetic composition of the cultivar, (i¡) selection is neutral through the generations of selfing, (iii) reselection of a previous cultivar or landrace has assigned relationship of r=0.75 with the parental genotype, and (¡v) the relationship of a cultivar with itself r=l. Cultivars without known common parentage were assumed to be unrelated.
Ancestral lines from 37 improved varieties were traced back using several sources of information about genealogies and pedigrees (Zeven and Zeven-Hissink, 1976; Brajcich et al., 1986; Zeven and Reiner, 1991). Additional information was provided by Dr. Elias Elias (North Dakota State University), Dr. Victor Vallega (Istituto Sperimentale per la Cerealicoltora, Rome), and by Dr. Osman Abdalla (CIMMYT, Mexico). The COP values were calculated using a FORTRAN program developed at Kansas State University (Cox and Murphy, 1990). Cultivars were grouped based on COP to ancestral varieties using the unweighted-pair-group-mean with arithmetic (UPGMA) method.
Data analysis
Autoradiographs were scored based on the presence or absence of bands, generating a matrix of 1 and O. Informative bands were used to generate a genetic distance matrix using the SIMGEND
Subroutine SAHN and the UPGMA clustering method were used to determine groups of similar genotypes based on the generated genetic distance matrix. The method used for clustering was UPGMA.
The quality trait data were transformed using the STAND procedure from NTSYS-pc (Rohlf, 1990) to reduce the effect of different scales of measurement. In this transformation, the mean is subtracted from the individual value and the result divided by the standard deviation. The standardized values were used in the SlMlNT subroutine of NTSYS-pc (Rohlf, 1990) to compute a matrix of similarities among all pairs of genotypes using the average taxonomic distance. Standard taxonomic distances were used rather than other measures of relationship as they showed greater correlation with measures of similarity based on RFLP and isozyme data (Beer et al., 1993).
Matrix comparisons
traits were compared by using the
25 1
CIHEAM - Options Mediterraneennes
Serie A: Seminaires mediterraneens

MXCOMP routine of NTSYS-pc (Rohlf, 1990) that uses the normalized Mantel Z statistic (Mantel, 1967). The statistical considerations for these analyses were discussed by Beer et al. (1993).
Similarities among accessions
Restriction fragment length polymorphisms
Thirty-six probes were polymorphic on at least one of the accessions surveyed. A total of 232 fragments were detected resulting in a mean of 5.7 fragments per clone and 4.3 polymorphic bands. From the total number of fragments detected, 165 were polymorphic and were used to estimate the genetic relationships between all possible pairs of genotypes.
Clustering of genotypes based on Nei's genetic distance matrix computed from RFLPs resulted in seven distinctive groups, namely clusters A to G (Fig. 1). Clusters A, B, and C were composed of mostly improved lines but several of the Jordan and Morocco landraces were related to them. In contrast, clusters D, E, F, and G were relatively diverse and the majority were landraces. Cluster D included 12 landraces and one improved line. The landraces of this cluster were collected in Greece ( 3 , Syria (3), Italy Algeria (l) , and Cyprus (1). Cluster E consisted of landraces and lines related to Haurani that originated in Jordan Syria (5), Italy (2), and Canada. ND86-10, Akbash, Baladia Hamra, 1293 (Cyprus), and Tripolino, were least related to the rest of the accessions in this study. Unique alleles for the landraces and improved germplasm in this study represented 13% and 2% of the total, respectively.
0.4 0.2 0.1 O I I I I
AinArous, Aric 31708.70. GrlBoy. Hazar, Khabur-l, Sajur. Zud-l
Guerou-l. Loukos-l , Sabil-l , Sebou
Bicre. Chahba88. Lahn. M11. MlOSO. Tensift - l A Daki, Deraa. Furat-l
Cham-l, Gedfla. JordanColl6-21, JordanCo1186-42, JordanCo1186-80. M3, M13.
Siliana, T.DurEthiopialC8373 M15, M20, M21. M1086, M1150. Quadalete.
H.0-FAO25918
OuedZenati368.
Geo'ralir. Local-Iraklion. Moundros-2, Romanou-2
- - ' Iraklion 1 lBl(An76-30). Atsiki-3. Hedba3. Mamgani-
HamariAhmar. Haurani. Haurani27. Haur&iNaw&. Jord~Co1186-53,. JordanColKIG-174. NormalHaurani. E Senatorecappelli. Sicilialutri, Wakoorna
ND86-10 u Akbash, BaladiaHamra F 1293(Ari76-14ZTripino G
Fig. 1
I I I l
0.4 0.2 0.1 O
Relationships based on RFLPs for 81 durum accessions.
CIHEAM - Options Mediterraneennes
Serie A: Seminaires mediterraneens

In general, similarities among accessions from individual countries was low although landraces from the same region or known to have common origins were closely related as expected.
Coefficient of parentage
Coefficient of parentage was calculated for 37 cultivars with known pedigrees. Fifty ancestral lines were related to the improved lines and included seven different bread wheat parents (primarily NorinlO/Brevor as a source of dwarfing genes), seven accessions corresponding to four subspecies of Tritcurn turgidurn, twenty four landraces with origin in twelve different countries, and twelve lines with unknown pedigrees.
Fifteen ancestral lines were present in at least 80% of the cultivars. Five of them were present in all pedigrees. These lines included Vernal Emmer, Mindum, Eiti, Norin 10 and Brevor. Overall, the average contribution of these 15 ancestral parents accounted for 72% of the total variation of these cultivars and ranged from 23.5% to 95.7%. The rest of the ancestral varieties contributed to less than 50% of the varieties and the contribution to the improved lines ranged from <0.1% to 50%.
Clustering of genotypes based on the COP value to ancestral lines resulted four distinctive clusters (Table 1). In cluster A, three ancestrals namely S179 (20%) and Dur6 (7%), and Haurani (12%) showed a large contribution. In Cluster B, lines included small contributions from many of the ancestrals but were largely related to Mindum (21%). Improved cultivars in cluster C were largely related to Jennah Khetifa (23%), Mindum (22%), Caravaca (8%) and Barrigon Yaqui (8%). In cluster the largest contributors to the pedigrees were Mindum (35%) and Eiti (1 1
Gliadin relative mobilities
A total of 127 gliadin bands with relative mobilities ranging from 20 to 90 were polymorphic for the 81 durums in this study. Clustering based on gliadin bands resulted in 2 large groups and several smaller groups designated A through (Fig. 2). Group A included 9 landraces, mostly from North Africa and Italy, and 12 improved lines. Cluster E was entirely composed of improved lines while B, C, D, F, G, and H were mostly landraces.
Quality traits
SDSl ranged from 0.9 to 3.6, protein from 8.5 to 14.7, vitreous kernel percentage from 70 to 100, thousand kernel weight from 37.9 to 55.6 and flour colour from 2.0 to 6.5. Standard taxonomic distances based on SDSI, protein content, vitreous kernel count, kernel weight, and flour colour were clustered in groups A through H with two varieties ungrouped (Fig. 3). Cluster A was intermediate for all of the traits and included mostly improved lines along with Haurani and some related landraces (Fig. 4). Cluster G represented those with the best overall quality and included Senatore Cappelli. Cluster H had the poorest quality followed by B. Deraa and Baladia Hamra were not grouped with other genotypes because of unusual combinations of quality traits. Both had low with above average protein and vitreousness but Deraa had high kernel weight and flour colour while Baladia Hamra was low.
Linearity of relationship between similarity measures
Correlations between matrices derived from the three different types of traits were low and non-significant. The highest correlation (k.06, pe0.82) was between average taxonomic distance based on quality traits. Correlation coefficient between genetic distance was 0.23.
Because of the large number of analyses used for detecting associations, only those F-tests resulting in probabilities of less than 0.01 were considered significant. Four RFLPs were significantly associated with SDSI, 3 with protein content, 4 with vitreousness, none with kernel weight, and 5 with flour colour (Table 2). Those probes hybridize to fragments located on chromosomes 1, 3, 4, 5, and
with 5 being the most common.
253
CIHEAM - Options Mediterraneennes
Serie A: Seminaires mediterraneens
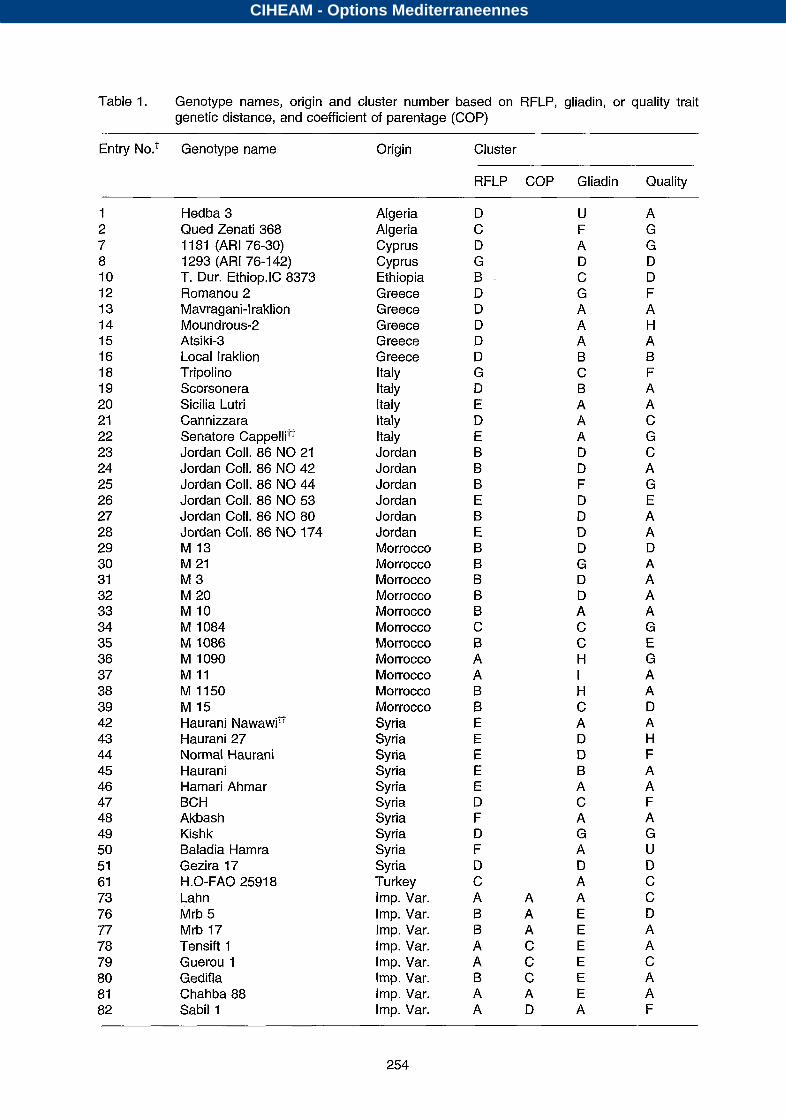
Table 1. Genotype names, origin and cluster number based on RFLP, gliadin, or quality trait genetic distance, and coefficient of parentage (COP)
Entry NO.^ Genotype name Origin Cluster
RFLP COP Gliadin Quality
1 2 7 8 10 12 13 14 15 16 18 19 20 21 22 23 24 25 26 27 28 29 30 31 32 33 34 35 36 37 38 39 42 43 44 45 46 47 48 49 50 51 61 73 76 77 78 79 80 81 82
Hedba 3 Qued Zenati 368 11 81 (ARI 76-30) 1293 (ARI 76-1 42) T. Dur. Ethiop.lC 8373 Romanou 2 Mavragani-Iraklion Moundrous-2
Local Iraklion Tripolino Scorsonera Sicilia Lutri Cannizzara Senatore Cappellitt Jordan Coll. 86 NO 21 Jordan Coll. 86 42 Jordan Coll. 86 NO 44 Jordan Coll. 86 NO 53 Jordan Coll. 86 80 Jordan Coll. 86 NO 174 M 13 M 21 M 3 M 20 M M 1084 M 1086 M 1090 M 11 M 1150 M 15 Haurani Nawawit? Haurani 27 Normal Haurani Haurani Hamari Ahmar BCH Akbash Kishk Baladia Hamra Gezira 17
Lah n Mrb 5 Mrb 17 Tensift 1 Guerou 1 Gedifla Chahba 88 Sabil 1
Atsiki-3
H.0-FAO 2591 8
Algeria Algeria Cyprus Cyprus Ethiopia Greece Greece Greece Greece Greece Italy Italy Italy Italy Italy Jordan Jordan Jordan Jordan Jordan Jordan Morrocco Morrocco Morrocco Morrocco Morrocco Morrocco Morrocco Morrocco Morrocco Morrocco Morrocco Syria Syria Syria Syria Syria Syria Syria Syria Syria Syria Turkey Imp. Var. Imp. Var. Imp. Var. Imp. Var. Imp. Var. Imp. Var. Imp. Var. Imp. Var.
D C D G B D D D D D G D E D E B B B E B E B B B B B C B A A B B E E E E E D F D F D C A B B A A B A A
U F A D C G A A A B C B A A A D D F D D
D G D D A C C H I H C A D
B A C A G A D A
A A A E A E C E C E C E A E D A
A G G D D F A H A B F A A C G C A G E A A D A A A A G E G A A D A H F A A F A G U D C C D A A C A A F
254
CIHEAM - Options Mediterraneennes
Serie A: Seminaires mediterraneens

Table 1. (Continued). Genotype names, origin and cluster number based on RFLP, gliadin, or quality trait genetic distance, and coefficient of parentage (COP)
Entry No? Genotype name Origin Cluster
RFLP COP Gliadin Quality
83 84 85 86 87 88 89 90 91 92 93 94 95 96 97 98 99 1 O0 1 o1 102 103 104 105 106 107 108 110 111 112 113
Loukos 1 Bicre Furat 1 Nile Zud 1 Khabur 1 Po Hazar Deraa Om Rabi 14 Kabir 1 Oronte Daki = Ceyhan Karasu G r/Boy Sajur Ain Arous Sebou Quadalete Jordan Korifla Belikh 2 Cham 1 Siliana Awali Heider = Marjawi Aric31708.70=1C-78
Wakooma DT 369
N. DAK 86-10
Imp. Var. Imp. Var. Imp. Var. Imp. Var. Imp. Var. Imp. Var. Imp. Var. Imp. Var. Imp. Var. Imp. Var. Imp. Var. Imp. Var. Imp. Var. Imp. Var. Imp. Var. Imp. Var. Imp. Var. Imp. Var. Imp. Var. Imp. Var. Imp. Var. Imp. Var. Imp. Var. Imp. Var. Imp. Var. Imp. Var. USA USA Canada Canada
A A B
A A C A B B C C B B A A A A B C B B B
B D A E
C
C C B B B B C B B A C A B B B B B B
C B B B C B B D D D D
E E E C D D A A U A H c H A A A A A D D A
A A E A D E
A
A A G A A A F A U E B A C D H A A A A B D A D D D C B C A G
?Entries numbers are from the Regional Durum Yield Trial - Low Rainfall (RDYT-LR) 1988 distributed by CIMMYT/ICARDA; entries from 1 to 61 represent landraces ffAncestral lines based on pedigree information of all improved varieties
Although they were only significant at the 5% level, gliadins with relative mobilities of 42, 43, and 45 are included in the table because of previous reports of association with SDSI. Only 1 gliadin band was associated with protein content and one with flour colour. other associations were significant at the 1% level.
Effect of type of trait on relationship estimates
There are a great number of possible combinations of transformations and proximity coefficients
255
CIHEAM - Options Mediterraneennes
Serie A: Seminaires mediterraneens

(Sneath and Sokal, 1973) from which to choose. Beer et a/. (1993) tested several coefficients for a sample of Avena sterilis accessions and concluded that the results using different coefficients were similar for both RFLPs and allozymes so the same analyses were used for this study. For morphological traits, they found that standard taxonomic distance using z-transformed data gave the best correlations with RFLPs and allozymes. For this sample of durum accessions, similarity values based on one type of data were not predictive of any similarity values based on another type of trait. Therefore, an RFLP-derived similarity value for any pair of accessions provided little information about the similarity of that pair relative to others when it was based on gliadins, COP, or quality traits.
I O
1181(Ari7630), AinArous. Akbash. Atsiki-3, Belikfiz DT369. GrlBoy. HauraniNawawi. Hazar. Heider=Marjawi. Korifla. Lahnm. M10. Mavragmi-
Sebou, Senatorecappelli. SiciliaLutri. Siliana, Iraldon. Mwndros-2,OmRabil.l. Sabil-l, Sajur,
Baladialiama Canniuara. Cham-l. HamariAhmar m.
H.0-FAO 25918
Haurani. Local Iraklion. Scorsonera B Nile, Tripolino
T.DurEthiopialC8373 ,_
BCH. M1084. M1086. M15. Oronte, c I
A
1293(Afl76-142, Aric31708.70 ..., Gezira-17.
NonnalHaurani. Zud-l Haurani-27, Khabut-l, M13, &O,
Jordan, JordanCo1186N0174. JordanColl86N021. JordanCdl86N042, JordanColl86NO53, JordanCd186N080. Quadalete
Awali. Mrbl7, Mrb5, Tensift
Bicre, Chahba-88. Furat. Gediila. Guerou-l. Loukos- E 1. ND86-10
OuedZenati368
I JordanColl86NW IF Kishk. M21. G Dalädeyhan, Kabir-l. M1090. M1150
M11, Wakooma 1 Deraa U
I I I I I I 1.5 0.6 O
Fig. 2. Relationships based on gliadin banding patterns of 81 durum accessions.
When sampling germplasm for incorporation into a breeding program, if the goal is to maximize be the most reliable measure
to use. Neither RFLP nor gliadin relationship was sufficiently correlated with the quality relationships to warrant the use of quality traits for measuring genetic diversity. Therefore, selection of germplasm pools for genetic diversity should be based on RFLPs or other traits rather than quality traits. Distance matrices derived from certain morphological or quality traits may be strongly influenced by environmental conditions under which the material is evaluated and single genes can have major effects on those estimates. Also, the effects of quality genes from one variety may be expressed differently in a different background. If the primary goal is improving end-use quality, the breeder may wish to select a pool of germplasm for quality traits first, then, using RFLP-based relationship
256
CIHEAM - Options Mediterraneennes
Serie A: Seminaires mediterraneens

coefficients, select the least related set of lines for crossing to elite breeding lines and varieties. Several of the RFLPs observed are strong candidates for mapping and gene tagging loci controlling quality traits.
- Belikh-2, HauraniNawawi. Haurani. Mrbl7, Sajur, Hedba3. Wakooma, Nile, Hamari Ahrnar. GMIHla, M l 150. Chahba88, Quadalele. AWash, Tensift.
M l 1. JordanColl86N0174
Bicre. Atsild-3.Zud-l. M21
Scorsonera
Jordan, Local Iraldion. Kabir-l. Aric31708.70 ... B
JordanCdl86NOPl. DaM=Ceyhan. M n , c ND 85-10. Cannizara, H.0-FAOZ5918.
Heider=Marjawi. Guerou-l
Cham-1. KoAa. Awali. M15 Gmkal7, Karasu, 1293, h76-142, T.DurEthopia lC8373. M13.
Siliana
Om Rabil4, JordanColl86NÒ53, M1086 E Deraa
Po. NormalHaurani. WH. Sabil-l. Tripolino
Romanou2
SenatoreCappelli. OuedZenati368, M1090, Furat- 1, M1084. ffishk
DT369. JordanColl86N044.1181(Ari76-30)
Gr/Boy, Haurani27, Moundros-2 H EaladiaHamra u
F
I 4 1 O
Fig. 3. Relationships based on quality traits for 81 durum accessions.
A 2.2 10.9 94 B 1.7 9.9 87 C .j-& 11.3 98 D 2.3 10.1 98 E 2.3 12.0 99
90 G 2.5 H 2.7 93 Deraa 1.4 12.4 100 BalHa 0.9 11.4 95
2.2 11.0 94
48 4.1 50 5.3 43 5.4
5.2 48 4.3 5 l 4.0 47 3 2 53 ' 6.0 43 2.0 47 4.5
Fig. 4. Quality based cluster means for quality traits. Associations between quality traits and gliadin or RFLP bands
257
CIHEAM - Options Mediterraneennes
Serie A: Seminaires mediterraneens

Table 2. Mean difference between those accessions possessing and those missing the indicated band for SDSI, protein content, vitreous seed percentage, thousand kernel weight, and kernel colour
Band SDSI Protein Vitreousness Kernel wt Colour
~~ ~
BCD809.24b(3)+ -0.38*** CD0669.31 e(4) -0.27** 3.6** BCD1355.13f(7) 0.35*** WG583.5a(5) -0.27** BCD1355.13d(7) CDO405.15~(2) -0.70** BCD21.37~(5,6) 0.80** CD071 8.1 1 d(3) BCD926.8b(5) CD0393.27f(l) BCD1095.36h(2) BCD21.37e(5,6)
Gliadins 42 43 45 78 76
-0.23* 0.23* 0.29*
-0.96**
0.69"" 0.64**
-0.90"" -4.2**
3.8** 6.8***
0.60** -0.69** -0.85***
-0.68**
*Significant at the 0.05 probability level **Significant at the 0.01 probability level ***Significant at the 0.001 probability level ?Numbers in parenthesis indicate probable chromosome location
RFLPs vs gliadins estimating genetic
Based on the results of previous studies, nuclear RFLPs are among the most effective traits for investigating genetic relationships among plants at the intraspecific level (Wang and Tanksley, 1989; Beer et al., 1993). Because it is likely that much of the RFLP is attributable to insertions and deletions (eg Wang and Tanksley, 1989), the probability of two such mutations producing fragment patterns which are indistinguishable (¡e convergent evolution) is small. Compared to RFLPs, there is greater likelihood that gliadin electrophoretic patterns that appear identical could have resulted from independent mutations. Any survey that uses seed proteins, isozymes, or DNA probes samples a very small fraction of the total genome; thus, each instance of convergent evolution at a sampled locus leads to an underestimation of mutation at numerous unsampled loci. Also, it is likely that gliadins are subject to selection in breeding programs. This would lead to over-estimation of genetic similarity of lines selected in breeding programs. All of these factors may have contributed to the low correlation between RFLP and gliadin based relationship estimates.
The low correlation between RFLP relationship and COP could result from violation of one of one or more of the assumptions necessary for accurate calculation of COP. Several of the ancestors that were assumed to be unrelated for calculating COP, in fact are known to have a strong relationship based on RFLPs. Using RFLP information one might devise a statistical method for adjusting the COP for ancestors to reflect their known relationship. When we introduced such'an adjustment into our
258
CIHEAM - Options Mediterraneennes
Serie A: Seminaires mediterraneens

calculations, the correlation did not improve significantly. Selection or drift might also affect the accuracy of the COP values. Finally, while the pedigrees of crosses may be accurate, occasional natural outcrossing in the breeding nursery could result in different RFLP patterns that would not reflect the ancestry.
Associations between quality traits and gliadin bands or RFLPs
Selectable markers for quality traits could be used in a breeding program to facilitate early generation selection with improved heritability. The associations between a particular band or fragment and a quality trait identified in this study do not demonstrate genetic linkage; however, rather than randomly choosing markers distributed over the entire genome one can test these markers for linkage first in populations segregating for both the marker and the trait. In this study, a loose association was observed between and the absence of gliadin 42 and the presence of 45 as reported by others (Damidaux et al., 1978; Yupsanis and Moustakis, 1988; Pogna et al., 1990); however, there was much variation unaccounted for by the gliadin patterns observed. Most of the significant RFLPs observed for SDSl were located on chromosome 5, but there were also significant markers located on chromosomes 1 and 6, known locations of gliadin and glutenin genes affecting SDS sedimentation (Jackson et al., 1983; Metovsky et al., 1990; Rogers et al., 1990).
Implications for germplasm conservation
Neither RFLP nor gliadin distances were highly correlated with distances based on quality traits. Advantages to using RFLPs to estimate relationship include the larger number of loci that can be sampled relative to gliadins and the reduced likelihood of being subject to selection in a breeding program. Because RFLPs provide a better estimate of genetic relationship, the intermating of genotypes with low RFLP-based similarity values would create more genetic variability than would the intermating of dissimilar genotypes based on gliadins. Breeders must weigh this advantage against the considerable expense of generating RFLP data. Other methods such as the random amplified polymorphic DNA (RAPD) method have been developed (Williams et al., 1990) that may be less costly. Preliminary results with these accessions suggest that relationships based on RAPDs and RFLPs are correlated (E. Autrique, pers. comm.). Germplasm managers and breeders need not use one type of data exclusively. One potential strategy is to select genotypes initially on the basis of useful agronomic characteristics or quality traits, and then select from those genotypes, a subset which are mutually dissimilar, on the basis of RFLP or RAPD data. This could maximize opportunities for transgressive segregation because there is a higher probability that unrelated genotypes will contribute unique desirable alleles at different loci.
A future goal of this project is to develop an information base for this germplasm pool consisting of agronomic and quality trait data as well as molecular and biochemical markers, their chromosome location, and their linkage to loci affecting those traits. This information can then be used to identify appropriate gene or marker combinations and relationship parameters that optimize parental selection for hybridization in combined conventional and marker-assisted-selection breeding programs.
Acknowledgements
The authors express their sincere thanks to CARDA, Aleppo, Syria and CIMMYT, Mexico for support for this research and to the coordinators of the seminar on Durum Wheat Quality in the Mediterranean Region for their assistance.
259
CIHEAM - Options Mediterraneennes
Serie A: Seminaires mediterraneens
References
Anderson, J.A., Ogihara, Y., Sorrells, M.E. and Tanksley, S.D. (1992). Development of a chromosomal arm map for wheat based on RFLP markers. Theor. Appl. Genet., 83: 1035-1043.
Beer, S.C., Goffreda, J., Phillips, T.D., Murphy, J.P., and Sorrells, M.E. (1993). Assessment of genetic variation in Avena sterilis using morphological traits, isozymes, and RFLPs. Crop Sci., (in press).
Brajcich, P., Pfeiffer, W. and Autrique, E. (1986). Durum Wheat: Names, Parentages, Pedigrees and Origins. International Maize and Wheat Improvement Center (CIMMYT), Mexico DF.
Clarke, J.M., Romagosa, I. and DePauw, R.M. (1991). Screening durum wheat germplasm for dry growing conditions: Morphological and physiological criteria. Crop Sci., 31 : 770-775.
Cox, T.S. and Murphy, J.P. (1990). The effect of parental divergence on F, heterosis in winter wheat crosses. Theor. Appl. Genet., 79: 241-250.
Cox, T.S., Kiang, Y.T., Gorman, M.B. and Rodgers, D.M. (1985a). Relationship between coefficient of parentage and genetic similarity indices in the soybean. Crop Sci., 25: 529-532.
Cox, T.S., Lookhart, G.L., Walker, D.E., Harrell, L.G., Albers, L.D. and Rodgers, D.M. (1 985b). Genetic relationships among hard red winter wheat cultivars as evaluated by pedigree analysis and gliadin polyacrylamide gel electrophoretic patterns. Crop Sci., 25: 1058-1 062.
Damidaux, R., Autran, J.C., Grignac, P. and Feillet, P. (1978). Mise en évidence de relations
gluten de Triticum durum Desf. Compte Rendu Acad. Sci. Paris, Sér. 287: 701-704.
Feinberg, A.P. and Vogelstein, B. (1983). A technique for radiolabelling DNA restriction endonuclease fragments to high specific activity. Anal. Biochem., 132: 6-13.
Heun, M., Kennedy, A.E., Anderson, J.A., Lapitan, N.L.V., Sorrells, M.E. and Tanksley, S.D. (1991). Construction of a restriction fragment length polymorphism map for barley (Hordeurn vulgare). Genome, 34: 437-447.
Jackson, E.A., Holt, L.M. and Payne, (1983). Characterization of high molecular weight gliadin and low endosperm by two-dimensional electrophoresis and the chromosomal localisation of their controlling genes. Theor. Appl. Genet., 66: 24-37.
Jain, S.K., Qualset, C.O., Bhatt, G.M. and Wu, K.K. (1975). Geographical patterns of phenotypic diversity in a world collection of durum wheats. Crop Sci., 15: 700-704.
Joppa, L.R., Khan, K. and Williams, (1983). Chromosomal location of genes for gliadin polypeptides in durum wheat Triticum turgidum L. Theor. Appl. Genet., 64: 289-293.
Kosmolak, F.G., Dexter, JE., Matsuo, R.R., Leisle, D. and Marchylo, B.A. (1980). A relationship between durum wheat quality and gliadin electrophoregrams. Can. J. Plant Sci., 60: 427-432.
Leisle, D., Kosmolak, G. and Kovacs, M. (1981). Association of glume colour with gluten strength and gliadin proteins in durum wheat. Can. J. Plant Sci., 61: 149-151.
Mantel, N. (1967). The detection of disease clustering and a generalized regression approach. Cancer 27: 209-220.
260
CIHEAM - Options Mediterraneennes
Serie A: Seminaires mediterraneens

Martin, J.M., Blake, T.K. and Hockett, E.A. (1991). Diversity among North American spring barley cultivars based on coefficient of parentage. Crop Sci., 31 : 1131-1 137.
Metovsky, E.V., Wrigley, C.W., Bekes, F. and Gupta, R.B. (1990). Gluten polypeptides as useful genetic markes of dough quality in Australian wheats. Aust. J. 41: 289-306.
Nei, M. and Li, W.-H. (1979). Mathematical model for studying genetic variation in terms of restriction endonucleases. Proc. Natl. Acad. Sci. USA, 76: 5269-5273.
Pogna, N.E., Autran, J.C., Mellini, F., Lafiandra, D. and Feillet, P. (1990). Crhomosome 1B-encoded gliadins and glutenin subunits in durum wheat genetics and relationship to gluten strength. J. Cereal Sci., 1 1 : 15-34.
Porceddu, E. 1976. Variation for agronomical traits in a world collection of durum wheat. Z. Pflanzenzucht, 77: 31 4-327.
Rogers, W.J., Rickatson, J.M., Sayers, E.J. and Law, C.N. (1990). Bread making quality in hexaploid wheat. Theor. Appl. Genet., 80: 281-287.
Rohlf, F.J. (1990). NTSYS-pc manual. Exeter Software, Setauket, NY.
Sneath, P.H.A. and Sokal, R.R. (1 973). Numerical Taxonomy: The Principles and Practice of Numerical Classification. W.H. Freeman and Co., San Francisco.
Souza, E. and Sorrells, M.E. (1989). Pedigree analysis of North American oat cultivars released from 1951 to 1985. Crop Sci., 29: 595-601.
Spagnoletti Zeuli, P.L. and Qualset, C.O. (1990). Flag leaf variation and the analysis of diversity in durum wheat. Plant Breed., 105: 189-202.
Srivastava, J.P., Damania, A.B. and Pecetti, L. (1988). Landraces, primitive forms and wild progenitors of macaroni wheat, Triticum durum: their use in dryland agriculture. ln: Proc. 7th /nt. Wheat Genetics Symp., Miller, T.E., and Koebner, R.M.D. (eds) Cambridge, pp. 153-158.
Tai, H.T. and Tanksley, S.D. (1990). A rapid and inexpensive method for isolation of total DNA from dehydrated plant tissue. Plant Mol. Biol. Rep., 8: 297-303.
Wang, Z.Y. and Tanksley, S.D. (1989). Restriction fragment length polymorphism in Oyza sativa L. Genome, 32: 1 1 13-1 1 18.
Williams, J.G.K., Kubelik, A.R., Livak, K.J., Rafalski, J.A. and Tingey, S.V. (1990). DNA polymorphisms amplified by arbitrary primers are useful as genetic markers. NUC. Acid 18: 6532-6535.
Williams, P., El-Haramein, F.J., Nakkoul, H. and Rihawi, S. (1988). Crop qualityevaluation methodsand guidelines. ICARDA Tech. Manual, 14 (rev. 1).
Yang, R.C., Jana, S. and Clarke, J.M. (1991). Phenotypic diversity and association of some potentially drought responsive characters in durum wheat. Crop Sci., 31: 1484-1491.
Yupsanis, T. and Moustakis, (1988). Relationship between quality, colour of glume, and gliadin electrophoregrams in durum wheat. Plant Breed., 101: 30-35.
Zeven, A.C. and Reiner, L. (1991). Genealogies of Wheat Varieties. Verlag Eugen Ulmer, Stuttgart.
261
CIHEAM - Options Mediterraneennes
Serie A: Seminaires mediterraneens

Zeven, A.C. and Zeven-Hissink, (1976). Genealogies of Wheat Varieties. The Netherlands Cereal Centre, Wageningen.
262
CIHEAM - Options Mediterraneennes
Serie A: Seminaires mediterraneens