relationship between commercial paper financing and
TRANSCRIPT

RELATIONSHIP BETWEEN COMMERCIAL PAPER FINANCING AND WORKING
CAPITAL COMPONENTS IN KENYA
BY
MUSYOKA JOSEPHINE MWIKALI
A MANAGEMENT RESEARCH PROJECT SUBMITTED IN PARTIAL
FULFILLMENT OF THE REQUIREMENT FOR THE AWARD OF THE DEGREE OF
MASTER OF BUSINESS ADMINISTRATION, UNIVERSITY OF NAIROBI
NOVEMBER 2012

ii
DECLARATION
I declare that this research project is my original work and has not been presented for a degree in
any other university.
MUSYOKA JOSEPHINE MWIKALI
D61/61456/2010
Signed---------------------------------------------- Date---------------------------------
This research project has been submitted for examination with my approval as the University
Supervisor.
Signed---------------------------------------------- Date---------------------------------
DR. JOSIAH O.ADUDA
Senior Lecturer and Chairman
Department of Finance and Accounting
School of Business
University of Nairobi

iii
ACKNOWLEDGEMENT
First and foremost, I would like to thank the Almighty God for giving me the strength, good
health, and sound mind during my period of study. This project would not have been completed
without support of some people. My appreciation goes to my supervisor Dr Josiah Aduda for the
guidance throughout the project.
I extend my gratitude to the MBA class of 2010. I may not be able to mention all of you by your
names but your support is greatly appreciated.
I would like to extend my appreciation to my colleagues Peter Wanjau Njogu for giving me the
idea and guidance on the topic, Jeff Ngotho for his help in getting the relevant journals.
I am also grateful to my friends Caroline Kithinji and Jackline Adongo for the support and
encouragement.

iv
DEDICATION
I dedicate this project work to The Almighty God; My late dad Mr. Benjamin Musyoka Mweu
and the rest of my entire Family, Mum, brothers and sister for their encouragement and moral
support during the course.

v
ABSTRACT
The objective of the study was to establish the relationship between Commercial Paper financing
and working capital components in Kenya. A casual research design was adopted. Population
consisted of all the twenty seven companies that have issued commercial paper in Kenya since
the first issue by Brooke bond in 1994.Twenty two companies that have been in the market for at
least two years were analysed.
Secondary source of data was used to help the researcher measure both aspects of the variables
which are Commercial Paper and working capital components - Inventory, Accounts receivable
and Cash. Period of study was from 1994 when the first paper was issued in Kenya to 2011. The
Source data included NSE database, Capital Markets Authority (CMA) and Annual Audited
Financial Statements of selected companies. Data was analyzed using Statistical Packages for
Social Sciences (SPSS) version 11. Regression and correlation analysis was used to determine
the nature and the strength of the relationship between the independent and dependent variables.
Based on the regression and correlation analysis of each of the companies, the findings indicated
that in the majority of the companies there is a strong positive correlation between commercial
paper borrowings and working capital components. This means that variation in commercial
paper borrowings is fully explained by working capital components that are assets in these
companies. The study also showed that for a unit change in commercial paper outstanding
overally in all the companies, the working capital component that showed a huge variation is
cash followed by accounts receivable and Inventory respectively. The overall regression results
of the 22 companies showed that CP borrowings have a negative relationship with cash holding
in most firms. This means that as the level of cash holding decrease, CP borrowing increase. On
the other hand CP borrowings showed a positive relationship to inventory accumulation and
accounts receivable in most of the firms hence providing evidence that the firms that issue CP in
Kenya use it to finance increases in inventories and accounts receivable.

vi
TABLE OF CONTENTS
DECLARATION ....................................................................................................................... ii
ACKNOWLEDGEMENT ......................................................................................................... iii
DEDICATION ........................................................................................................................... iv
TABLE OF CONTENTS ........................................................................................................... vi
LIST OF TABLES.......................................................................................................................viii
LIST OF ABBREVIATIONS……………………………………………………………………ix
CHAPTER ONE ......................................................................................................................... 1
1.0 INTRODUCTION ................................................................................................................. 1
1.1 Background to the Study .................................................................................................... 1
1.2 Statement of the Problem ................................................................................................... 6
1.3 Objective of the Study. ...................................................................................................... 7
1.4 Significance of the Study ................................................................................................... 7
CHAPTER TWO ........................................................................................................................ 8
2.0 LITERATURE REVIEW ...................................................................................................... 8
2.1 Introduction ....................................................................................................................... 8
2.2. Key Theories Guiding this Study. ..................................................................................... 8
2.3 Review of Empirical Studies Related to the Study. .......................................................... 10
2.4 General Literature Review. .............................................................................................. 17
2.5 Chapter Summary. ........................................................................................................... 18
3.0 RESEARCH METHODOLOGY ......................................................................................... 19
3.1 Introduction .................................................................................................................... 19
3.2 Research Design .............................................................................................................. 19
3.3 Population of the study .................................................................................................... 19
3.4 Sample selection ............................................................................................................. 20

vii
3.5 Data Collection. .............................................................................................................. 20
3.6 Data analysis.................................................................................................................... 20
CHAPTER FOUR ..................................................................................................................... 24
4.0. DATA ANALYSIS AND FINDINGS ................................................................................ 24
4.1. Introduction .................................................................................................................... 24
4.2 Data Presentation ............................................................................................................. 24
4.3 Summary and Interpretation of Findings. ......................................................................... 52
5.0. SUMMARY, CONCLUSIONS AND RECOMMENDATIONS ......................................... 58
5.1. Summary ........................................................................................................................ 58
5.2. Conclusions ................................................................................................................... 59
5.3. Policy Recommendations. .............................................................................................. 60
5.4. Limitations of the Study .................................................................................................. 61
5.5. Suggestions for Further Studies. ...................................................................................... 62
REFERENCES ......................................................................................................................... 63
APPENDICES .......................................................................................................................... 68
Appendix I: companies which have issued CP. ..................................................................... 68
Appendix II: Analysis of companies that have issued CP by Years. ....................................... 69
Appendix III: Growth of commercial paper market. ............................................................... 70
Appendix IV: Data Collection Form. ..................................................................................... 71

viii
LIST OF TABLES
Table 4.1:Model summary,ANOVA,Regression results of Davis & shirtliff Ltd............24
Table 4.2:Model summary,ANOVA,Regression results of TPS Serena..........................26
Table 4.3:Model summary,ANOVA,Regression results of Crown Berger......................27
Table 4.4:Model summary,ANOVA,Regression results of CMC....................................28
Table 4.5:Model summary,ANOVA,Regression results of Kenol...................................29
Table 4.6:Model summary,ANOVA,Regression results of Athiriver Mining.................30
Table 4.7:Model summary,ANOVA,Regression results of Nation Media......................32
Table 4.8:Model summary,ANOVA,Regression results of Total....................................33
Table 4.9:Model summary,ANOVA,Regression results of Express Kenya.....................34
Table 4.10:Model summary,ANOVA,Regression results of KPLC.................................35
Table 4.11:Model summary,ANOVA,Regression results of ECTA Kenya.....................36
Table 4.12:Model summary,ANOVA,Regression results of Cooper Kenya....................37
Table 4.13:Model summary,ANOVA,Regression results of Mabati rolling mills...........39
Table 4.14:Model summary,ANOVA,Regression results of Kenya Shell......................,.40
Table 4.15:Model summary,ANOVA,Regression results of Synergy Industrial............,.41
Table 4.16:Model summary,ANOVA,Regression results of Kenya Hotel Properties......42
Table 4.17:Model summary,ANOVA,Regression results of EAI.....................................44
Table 4.18:Model summary,ANOVA,Regression results of Pan Paper Mills..................45
Table 4.19:Model summary,ANOVA,Regression results of General motors...................46
Table 4.20:Model summary,ANOVA,Regression results of Caltex.................................47
Table 4.21:Model summary,ANOVA,Regression results of IPS......................................49
Table 4.22:Model summary,ANOVA,Regression results of Agip Kenya........................50
Table 4.23:Summary of Regression Results.......................................................................51
Table 4.24:Model summary for the companies...................................................................54
Table 4.25:ANOVA of Regression.....................................................................................55

ix
LIST OF ABBREVIATIONS
ACCPAY - Accounts Payable
ACCREC - Accounts Receivable
CA - Current Assets
CL - Current Liabilities
CMA - Capital Markets Authority
CP - Commercial Paper
EAI - East Africa Industries
INV - Inventory
IPS - Industrial Promotion Services
LIBOR - Latest Inter Bank Lending Rate
LTD - Limited
LWC - Liquid Working Capital
NSE - Nairobi Securities Exchange
OD - Overdraft
SPSS - Statistical Package of Social Sciences
TB - Treasury Bills
USA - United States of America
WC - Working Capital
WCM - Working Capital Management

1
CHAPTER ONE
1.0 INTRODUCTION
1.1 Background to the Study
Short term finance is typically defined as debt provided for periods of one year or less. It is
usually easier to obtain and less expensive than longer term finance. It can be provided by banks
who prepare to make short term lending arrangements with clients since it roughly corresponds
to the maturities of deposits in their banks. Alternatively, large well established companies have
the option of going directly to the market place to raise short term funds. This borrowing may be
in the form of Commercial paper (Graham and Harvey, 2001).
Commercial paper (CP) is a short term unsecured promissory note issued by major corporations
to fund working capital requirements. It is a short-term publicly traded, unsecured debt that has
an average maturity of about 45 days. Due to its short maturity, outstanding CP is typically rolled
over when it matures.
To issue CP, firms establish a CP program that authorizes borrowing up to a pre-specified
maximum. Once the program is established, a firm can borrow under it without any regulatory
approval or disclosure. Establishing these programs typically entails meaningful costs. These
include fees to credit rating agencies for obtaining and maintaining a short-term credit rating,
fees to banks for backup credit facilities, and fees paid to dealers. (Post 1992).
According to Pedro and Pedro (2007) the investments that firms make in short term assets and
the resources used with maturities of under one year like CP represent the main share of items on
a firm‟s balance sheet. A prevailing view is that it is used primarily to finance working capital
needs. For example, Ross et al. (2008) discuss CP in the context of working capital management.
Calomiris et al. (1995) provide evidence that CP is used to finance working capital.
1.1.1. Working Capital.
A business requires different types of capital in order to operate. Working capital is often
considered to be the most significant types of capital. It is claimed that the amount of this can
determine the success of the company. Working capital (WC) is how much in liquid assets that a
company has on hand that is used to build the business. Working capital is also viewed as the
amount of current assets that a business has left after all the liabilities have been subtracted.

2
These liabilities usually involve any money that needs to be paid during the fiscal year. It can
include all the money that needs to be paid to those providing services and materials.
The main components of working capital include inventory, cash, accounts receivable, short term
investments and accounts payables. WC can be positive or negative depending on how much
debt the company is carrying. In general, companies that have a lot of working capital will be
more successful since they can expand and improve their operations. Companies with negative
working capital may lack the funds necessary for growth. The more that assets are in the form of
cash, the lower the amount of “liquid” working capital needed. (Brigham and Houston, 2007).
Whenever a need of working capital arises due to the increasing level of business activity
financing arrangements should be sought quickly. Similarly if surplus funds arise they should be
invested in short term securities. In order to continue trading, an organization should be in a
position to meet its immediate obligations and therefore sufficient cash must be generated by the
organization. Even the most profitable business can quickly go under if it does not have
sufficient liquid resources. This means, working capital is essential for the organization‟s long
term success and development. The greater the extent to which current assets cover the current
liabilities, the more solvent the organization. (Panday 2008).
Working Capital Management (WCM) refers to choosing the levels of mix of cash, marketable
securities receivables, inventories and short term financing.A finance manager devotes more
time to working capital management than any other activity because current assets by their
nature are changing daily and managerial decisions must be made. Questions relating to how
much inventory is to be carried and whether there are funds to pay for it are often asked. Unlike
long term decisions there can be no deferrals of actions relating to working capital. While long
term decisions determine the success of the firm, short term decisions on working capital
determine whether firms get to the long term (Block 1992).
One reason why firms may employ CP as a short term source of financing to meet their WC
needs is because it is very cheap and cost efficient and also its borrowing amounts can be
adjusted very easily by issuing a new paper or retiring it at maturity. This can be particularly
valuable for new investment where the exact funding needs are not known at the inception of the
project.CP issuance does not require underwriting services and has lower transaction costs.
Consistent with this idea, survey evidence suggests that firms issue short-term debt until

3
sufficient debt has been accumulated to justify issuing long-term debt (Graham and Harvey,
2001).
1.1.2.. Theoretical Expected Relationship between CP and WC.
According to Calomiris et al. (1995) Increased commercial paper issuance may also occur to
finance the accumulation of inventories by the issuer especially around a business-cycle peak.
Firms with a strong financial position issue commercial paper more so during downturns in order
for them to be able to extend credit to other firms. They act as financial intermediaries to other
firms.
Calomiris et al. (1995) found that commercial paper is strongly correlated with increases in
accounts receivable, suggesting the possibility of a causal link. Reductions in the supply of bank
credit increase the demand for inter-firm financing, thus leading indirectly to an increase in
aggregate commercial paper via those firms in the economy with the strongest balance sheets.
The study also showed that increased commercial paper issuance is used to finance inventories.
Since business-cycle peaks are often characterized by unplanned inventory accumulation, the
inventory cycle helps explain the behavior of commercial paper. This is mainly due to shifts in
the demand for firm intermediated credit, and shifts in the need to finance inventories.
Commercial paper issuers have lower ratios to debt of inventories, and payables. The
components of liquid working capital that differ most across classes are cash assets and short-
term debt; neither accounts receivable nor accounts payable fully explain the low average
working capital ratios of CP issuers. (Calomiris et al., 1995).
The positive effect of inventories and accounts receivable in the commercial paper probits is also
interesting, given that on average commercial paper issuers hold smaller amounts of inventories
and liquid working capital. Firms with large inventories and accounts receivable use the
commercial paper market to give them greater flexibility in their short-term financing. Short-
term creditworthiness requires more stringent standards than long-term creditworthiness because
commercial paper serves as a money-market instrument. Thus part of the price of admission to
the commercial paper market is the maintenance of more liquid assets (Gorton and Pennacchi,
1990).

4
According to Calomiris et al.(1995) correlations suggest that commercial paper is used to finance
changes in inventories and net accounts receivable, and support the notion that commercial paper
provides flexibility for the financing of volatile short-term assets. The study provided evidence
that firms use commercial paper to finance increases in inventories and accounts receivable.
Gertler and Gilchrist (1993) find that large firms show substantial increases in inventories and
short-term debt around cyclical peaks, suggesting that commercial paper may be financing the
movements of inventories. Another explanation for the movements of commercial paper is the
need to finance trade credit. As the economy weakens, customers pay their bills more slowly and
firms may extend more trade credit as a means of financing their customers' short-term credit
needs. Because high quality firms have easy access to short-term debt through the commercial
paper market, they in particular may serve as "intermediaries" for other firms experiencing
liquidity problems during business-cycle downturns. Such high quality firms may allow their
customers who are experiencing contractions in earnings or increases in unanticipated
inventories to expand accounts payable, effectively providing a "pass through" of commercial
paper financing to the customers of commercial paper issuers.
1.1.3. The Kenyan Commercial Paper Market.
Commercial paper market in Kenya is very recent compared to major and developed economies
like the United States of America (USA) and European countries. The first issue was in 1994 and
it was not until 1997 that activity increased. Prior to this, the Central Bank of Kenya limited the
issuance to companies listed in the Nairobi Securities Exchange.(NSE).In the absence of credit
rating agencies in Kenya, the Central Bank of Kenya undoubtedly reasoned that investors could
access the creditworthiness of the issuers themselves as those listed published their financial
statements periodically. Capital Markets Authority (CMA) issued revised rules in April 1997 that
allowed a wider range of companies to issue commercial papers irrespective of their listing status
subject to meeting rules and regulations laid out in the CMA guidelines. As a regulator, CMA
prescribes the minimum conditions that are considered protective to investors in CP market.
Issuers of CP in Kenya use dealers who are called placement agents or arrangers. There is no
organized secondary market that has been developed for CP in Kenya.
As a short-term money market instrument, CP is primarily used for financing short term needs –
paying quarterly tax assessments, and funding inventory and accounts receivable. In recent years

5
many firms have also used CP to finance major construction undertakings. Kidwell (1990).In
Kenya, it can be issued for periods from 1-365 days, although its most popular maturities are 30
and 91 days. Since CP is an unsecured promissory note, any company in Kenya issuing the paper
must represent a good credit risk. The market in Kenya has relatively gone down since its
inception with total outstanding issues as high as Ksh11.6 billion between 1997 and 1999 now
down to Ksh 1.2 billion in 2011 (Appendix III).
Many firms have voluntarily exited the market within this period due to various reasons. Despite
the free fall in the shilling in late 2011, there was no significant change in this market with the
normal companies having their issue renewed by CMA. Since 1994, the numbers of companies
that have issued CP are only 27 (Appendix 1).

6
1.2 Statement of the Problem
Today‟s business environment is very competitive and firms must strategize in order to remain
competitive and profitable. Cost cutting measure is the language in today‟s business circles and
hence it has become inevitable for companies to source for cheaper source of finance. As at now,
commercial banks in Kenya are charging very high interest rates on borrowing currently at
almost 25%.CP therefore offers a more attractive financing option than bank loans and overdraft
(OD) and also their interest rates are reasonable at +1% above treasury bill rate. CP borrowing
therefore substitutes for cash holdings and bank credit lines.
Several studies have been conducted both locally and abroad on commercial paper as a short
term source of financing and its main uses. Matthias et al. (2008) studied the relationship
between commercial paper and firm‟s financial flexibility and found that CP represents a flexible
source of financing because it allows firms to borrow only if good investment opportunities or a
shortage of internal cash flow used for meeting their working capital requirements arise.
Matthias et al. (2010) concluded CP borrowings are positively correlated with any short and
long-term investment unlike other forms of debt. Firms choose to access the CP market in
anticipation of changes in Investment opportunities and that CP access has a causal effect on
Investment behavior. Calomiris et al. (1995) focused on the role of CP in working capital
management and concluded that CP issuance is positively correlated with sales and earnings and
argued that companies issue CP to finance unplanned need of increase in Inventory as the level
of business activity increases. Issuers also act as financial intermediaries by financing increases
in accounts receivables of their non-CP issuing customers. High quality firms increase the level
of accounts receivable and finance these with commercial paper.
Kinyua (2006) looked at factors hindering CP market development in Kenya and recommended
that further studies should be done to determine effectiveness of commercial paper in managing
short term cash flows at a low cost. Nganga (1999) who did a similar research highlighted that
volatility of interest rates have hindered deepening of the market in Kenya. Njogu (2003) did a
paper on Price impacts of CP issue announcements concluded that companies that have taken the
bold step of substituting bank loans with CP experience significant interest savings.

7
Studies have not been done in Kenya to explain the prevailing view that CP is primarily used to
finance working capital requirements of firms specifically inventories and accounts receivables.
Despite the importance of CP as a short term financing mechanism, very little is known about
why firms use this market in Kenya and how it affects firms‟ investment and capital structure
decisions. This study therefore seeks to bridge the knowledge gap on the relationship between
commercial paper financing and components of working capital with respect to firms that have
issued the paper in Kenya.
1.3 Objective of the Study.
The objective of the study is to establish the relationship between Commercial Paper financing
and working capital components in Kenya.
1.4 Significance of the Study
The study will be of importance to all the players in the CP market i.e. Investors/lenders, Credit
borrowers, Agents/dealers, and scholars/Academicians.
Investors. The findings will provide valuable information to investors for them to appreciate the
investment needs of the issuers in more detail.
Credit borrowers. The paper will give credit borrowers information to explore cheaper financing
options instead of depending on the traditional bank loan and overdraft.
Researchers and Academicians. The paper will contributes to the literature on CP and encourage
scholars to conduct further research on the topic. Commercial paper knowledge is also
significance for students of commercial banking.
The study is also important to management and employees of companies as it gives insights into
opportunities of financing their working capital expenditure cheaply through commercial paper
issues, which would translate to more profits.

8
CHAPTER TWO
2.0 LITERATURE REVIEW
2.1 Introduction
This chapter reviews the literature that forms the basis of this study. It will highlight the
theoretical framework where theories/hypothesis and models relating to the study are discussed.
This will be followed by a review of empirical literature where past studies by various scholars
locally and globally on commercial paper and working capital are discussed. A review of other
literature on commercial paper financing will then follow. Lastly a summary of literature wraps
up the chapter by pointing out the gap in literature that the present study seeks to bridge.
2.2. Key Theories Guiding this Study.
2.2.1. Keynesian Theory of Money.
The level of cash and marketable securities held by firms is determined by the motives of
holding them. There is need of holding substantial amounts of money given that money market
instruments are liquid and hence firms need to have liquid working capital like cash so as to
settle bills and any other recurrent expenditure like payments of salaries, trade debts, taxes and
dividends. The borrowing ability of firms from the market like issuing CP and marketable
securities can be used to satisfy speculative motives. Commercial paper provides flexibility for
financing of volatile short term assets and hence providing the need for firms to hold substantial
amounts of money given that money market instruments are liquid (Keynes, 1956).
2.2.2. Baumol model.
Firms attempt to minimize the cost of holding liquid working capital and the cost of converting
marketable securities like CP into cash. The firms‟ cash payments occur uniformly over a period
of time, the opportunity cost of holding cash is known and it does not change over time, and the
firm will incur the same transaction cost whenever it converts CP into to cash (Baumol, 1952).
2.2.3 The miller Orr model.
In practice firms do not use their liquid working capital for example, cash uniformly nor are they
able to predict cash inflows and outflows. The model allows for daily cash flow variations and

9
provides for two control limits –the upper and lower limit. Companies buy or sell marketable
securities like CP only if the cash balance is equal to any one of these. The model therefore
assumes that the distribution of liquid working capital (cash flows) is normal (Miller et.al.,
1996).
2.2.4 The Seasonality Hypothesis.
Matthias et al., (2008) tested the hypothesis which posits that firms use CP to accommodate
seasonal fluctuations in working capital which are more prevalent for firms with stronger
seasonality in sales.The model implies that firms that anticipate an increase in seasonality in
sales are more likely to establish a CP program. which then allows them to accommodate the
seasonal fluctuations in working capital.The model implies that firms experience stronger
seasonality in sales after they enter the CP market and a decline after exiting the market because
their ability to accommodate seasonal fluctuations in working capital is lower.
2.2.5 The Investment Hypothesis.
The hypotheisis posits that firms use CP to fund both short term working capital requirements
and long term needs.It was tested to find out why CP may be preferred to alternative forms of
financing for certain types of investment needs whether short term or long term. The empirical
implications of the hypothesis was that firms enter the CP market when they have greater
funding needs for investment or better investment opportunities and when their investment
outlays are higher hence showing that CP borrowing amounts should be positively correlated
with short and long term investments (Matthias et al.,2010).
2.2.6 The Liquidity Hypothesis.
CP serves as a source of liquidity for firms and can act as a substitute for other forms of
corporate liquidity such as liquid working capital in form of cash and bank lines of credit, both of
which could also be used to finance new investments at short notice or to finance investment
until a cost efficient bond issuance size is reached.The hypothesis suggests that entry into the CP
market may be precipitated by a decline in liquid working capital already held by the firm as
they seek to increase their liquidity by entering the CP market and increase the level of liquid
working capital held after exiting the CP market (Matthias et al., 2010).

10
2.2.7 The Market Timing Hypothesis.The hypotheisis suggests that
The hypotheisis suggests that firms attempt to time the use of fixed versus floating rate debt
based on the spread between short and long term interest rate.Floating rate debt, such as CP is
used to finance their shorterm working capital needs and take advantage of favorable short-term
interest rates.Hence firms enter the CP market when short-term interest rates are low and also
increase their borrowing amounts in the CP market at this point.Faulkender (2005) provides
support for the hypothesis by showing that firms use more floating rate debt like CP when the
term structure is steeper. Since the interest cost of CP is linked to the latest interbank lending rate
(LIBOR), market timing considerations may drive CP issuance decisions.
2.2.8 The Financial Flexibility Hypothesis
In the hypothesis,Matthias et al.,(2008) shows that flexibility is valuable for firms that face a
high degree of uncertainty about their investment opportunities.CP provides firms with flexibility
in their short term investment and financing decisions like flexibility in the decision to
borrow,amount of borrowing, and length of the borrowing period.Uncertainty regarding the
potential arrival of investment projects means that flexibility with respect to the decision to
borrow allows firms to observe the arrival of projects before raising capital.Flexibility with
respect to the amount of borrowing allows firms to match borrowing amounts to investment
needs more closely.Flexibility in the length of the borrowing period is expected to be valuable to
issuers when the length of the project is uncertain.
2.3 Review of Empirical Studies Related to the Study.
Calomiris et al, (1995) did a study on Commercial paper, corporate finance and the business
cycle: A microeconomic perspective. In the paper, they shed some light on the direction of
causality in the relationship between commercial paper and working capital requirements of
firms. They show that commercial paper issuance is restricted to firms with strong balance sheets
and high cash flows. Their evidence was consistent with the hypothesis that that increased
commercial paper issuance may occur to finance the accumulation of inventories by the issuer
around a business cycle peaks. This peaks are often characterized by unplanned inventory
accumulation, hence the inventory cycle may help explain the countercyclical behavior of
commercial paper.

11
Correlations suggest that commercial paper is used to finance changes in inventories and net
accounts receivable, and support the notion that commercial paper provides flexibility for the
financing of volatile short-term assets. To test these propositions, regressions of inventories and
liquid working capital were run on several lags, estimating separate regressions for two subsets
of firms that issue commercial paper. By classifying firms according to their access to
commercial paper markets, the researcher was able to identify the movements in inventories and
working capital. The model used to undertake the regressions was CP as the dependent variable
against components of WC. Separate regressions were run between CP as a proportion of total
debt CPit and components of WC inventory (INV),accounts receivable (ACCREC), and CASH
as shown below:-
CPit = βo + β2 INV
CPit = βo + β3 ACCREC
CPit = βo + β3 CASH
Their data set was based on quarterly and annual data on commercial paper outstanding and
ratings for issuers rated by Moody's (rating agency) for the period 1985 through1992.This data
was merged with financial data from Standard and Poor's Compustat. This unique panel of data
allowed them to relate the movements in working capital to the macro facts about CP.
According to the broad predictions of the model, CP issuers should have a lower cost of short-
term funds, and therefore should display lower sensitivity of inventory and liquid working capital
investment to cash flow. The regressions used annual data to estimate the sensitivity of
inventories and liquid working capital to three lags each of CP-to-overall debt. These regressions
control for firm fixed effects by differencing the specification and instrumenting using lagged
regressors. Comparisons revealed much less cash flow sensitivity of inventory investment among
firms with access to commercial paper markets showing that CP issuing firms' inventories are
relatively sensitive to their lagged stock of liquid working capital paper.
The regressions further provided support for the view that commercial paper issued is used to
finance inventory accumulation. The firm-level correlation between the growth rate of
inventories and commercial paper was 0.095 using one quarter differences and 0.281 using four-
quarter (annual) differences. The correlation between the four-quarter growth rate of inventories

12
and the ratio of commercial paper to total debt (0.157) provided additional evidence that for
firms that have the option to issue the paper CP becomes the marginal source of finance for
inventory accumulation.
The regressions provided further evidence that commercial paper is used to finance trade credit.
The one-quarter and four-quarter correlations of commercial paper with accounts receivable
were 0.108 and 0.182, respectively. It is also the case that the ratio of commercial paper to total
debt is positively correlated with accounts receivable (0.088 and 0.133, respectively), providing
evidence that commercial paper is the marginal debt instrument for financing accounts
receivable. It is interesting to note that the correlation between inventory changes and accounts
payable is relatively high for firms without access to public-debt markets (0.13), but is
essentially zero (-0.004) for commercial paper issuers.
These results extend the results of Carpenter, Fazzari, and Petersen (1994) and Kashyap,
Lamont, and Stein (1994) by demonstrating that access to commercial paper markets can be used
to identify firms for whom the short-term cost of funds is relatively low. These regressions
together with the research of others who have found similar effects are viewed as a suggestive
first step, not as conclusive evidence for the existence of excess buffer stocks of working capital
for finance-constrained firms. Nevertheless, these preliminary findings suggest that commercial
paper issuers enjoy a lower shadow cost of short-term funds than a simple inspection of observed
interest rates would reveal.
Kashyap, Stein, and Wilcox (1993) find that the ratio of bank OD to bank OD plus commercial
paper (the "mix") is positively associated with various measures of economic activity. They
interpret this as evidence that firms substitute away from bank OD into commercial paper during
bank credit squeezes.
They also found that stocks of inventories and liquid working capital relax financing constraints
in two ways. First, both are preferred forms of collateral for bank loans. Inventories (particularly
in the form of raw materials, which constitute the bulk of inventories) are easily appraised and
easily liquidated. Second, firms with high costs of external finance may use liquid working
capital as a "self-insurance" device. If a firm knows that it will have trouble raising funds, it may
choose to accumulate liquid working capital during high earnings periods so that it can draw
down its war chest during low earnings periods.

13
Empirical studies have confirmed the role of liquid working capital as a self insuring device for
finance constrained firms. Kashyap, Lamont, and Stein (1994) find that sensitivity of inventories
to liquid working capital is only apparent in firms without bond ratings.
Carpenter, Fazzari, and Petersen (1994) find that inventory responses to earnings are larger for
small firms than for large firms, which they interpret as evidence that finance constrained firms
use inventories to offset fluctuations in earnings, and thus maintain smooth fixed capital
investment.
Calomiris and Hubbard (1994) find that firms facing high costs of external finance display the
greatest earnings sensitivity of working capital to earnings, and that the elasticity of working
capital with respect to earnings is much higher than that of fixed capital.
Calomiris et al. (1995) conducted an empirical study on commercial paper, corporate finance,
and the business cycle: microeconomic perspective to show the relationships between
commercial paper, inventory and account receivable. As industrial production slowed prior to its
peak in the first quarter of 1989, inventories, net accounts receivable, and commercial paper of
the firms in the panel rose sharply as sales growth came to a halt.
During the recovery of 1991-1992, commercial paper fell as issuers' inventories remained flat
and their net accounts receivable declined. Their data set provided support to explain the paradox
between the behavior of commercial paper issuers and the macroeconomic data. They also
provided evidence that this select group of firms uses commercial paper to finance increases in
inventories and accounts receivable. In particular, the movements of commercial paper and bank
debt may in fact reflect: (i) an increase in commercial paper to finance accounts receivable
among large, high-credit quality firms acting as intermediaries for other firms, and in turn (ii) the
substitution of accounts payable for bank loans among smaller "credit-constrained" firms.
Firms of high credit quality behave differently than other firms. In particular, they display excess
sensitivity of inventory investment to fluctuations in cash flow, suggesting that lack of access to
commercial paper markets is an indicator of costly external finance due to capital market
imperfections. Consistent with this interpretation, they found that firms of high credit quality
maintain much lower stocks of liquid working capital, and exhibit much less responsiveness of
liquid working capital to earnings. High credit quality permits these firms to avoid excessive
holdings of "buffer stocks" of liquid working capital. The combined evidence on the behavior of

14
inventory and liquid working capital investment indicates that the shadow costs of funds
attributable to capital market imperfections appear to be much lower for high quality firms. This
implies that the cost of short term funds for commercial paper issuers is more favorable than the
low interest rates on paper would indicate (Calomiris et al.1995).
From a macroeconomic perspective, Commercial paper increases as a downturn begins because
firms need to finance unplanned increases in inventories. Second, firms that can issue
commercial paper act as intermediaries for other firms that may be credit constrained. Evidence
from their study indicated that high quality firms increase their accounts receivable during a
downturn and finance these with commercial paper. Finally, commercial paper issuance
increases during a downturn due to an increase in aggregate portfolio demand toward safe, liquid
assets (Calomiris et al.1995).
Matthias et al. (2010) conducted an empirical study to show why firms use CP and how its use is
related to firms‟ investment policies and their capital structure decisions. This evidence indicates
a causal link between CP access and investment policy and suggests that CP access led to
changes in investment behaviour. They analyzed a comprehensive panel data set of all U.S.A
non CP issuers since the inception of CP ratings in the early 1970s and found that firms‟
participation in the CP market is driven by a trade-off between funding needs for investment and
the rollover risk associated with CP financing. CP borrowings are positively correlated with
investment unlike other forms of debt. This suggests that CP is an important funding source for
contemporaneous investment.
They concluded that CP is used as bridge financing for investment and is often refinanced in the
bond market and provides a substitute for cash holdings. Firms tend to access the CP market
after cash holdings have declined and increase their cash holdings when they involuntarily exit
the CP market. They also show that firms choose the amount of borrowing from CP and bank
lines of credit based on a trade off between rollover risk considerations and the possibility of
expropriation by banks. Their results indicate that firms choose to access the CP market in
anticipation of changes in investment opportunities and that CP access affects investment
behaviour. CP issuers have lower investment cash flow sensitivities while they have access to the
CP market than when they do not. Overall, they provided the first systematic evidence that CP is
not limited to working capital financing but plays a much broader role in firms‟ investment
policies and financing decisions. Their analysis suggested that understanding the macroeconomic

15
consequences of the effect of CP access on investment is a useful avenue for future research
(Matthias et al.2010).
Matthias et al. (2008) proposed a new explanation for why firms issue CP and argued that firms
use CP to enhance their financial flexibility. CP provides a flexible source of financing because it
allows firms to borrow only if good investment opportunities or a shortage of internal cash flow
arise. They tested this proposition by constructing a comprehensive panel data set of all U.S.A
non CP issuers from the inception of CP ratings in 1971 to 2005.They showed that firms enter
the CP market when they face increased uncertainty about their operating cash flow or
investment. Moreover, after the exit from the CP market, investment and performance variability
decline. They also show that CP borrowings are positively correlated with investment
expenditures and negatively correlated with cash holdings, but similar relations do not hold for
other corporate debt.
Their results indicate that firms choose to access the CP market in anticipation of changes in
investment opportunities and that CP market access affects investment behaviour. Their analysis
also raises several questions like how firms choose between alternative sources of financial
flexibility, such as CP and bank credit lines. These questions represent interesting avenues for
future research.
They also reported the mean and the median of the individual firms‟ time-series correlations. CP
borrowing (as a percentage of assets) is positively correlated with investment, as suggested by
the financial flexibility hypothesis. CP borrowing is negatively correlated with cash holdings.
Finally, CP borrowings are positively correlated with operating cash flows, but this correlation is
not statistically significant. This suggests that CP is more positively correlated with investment
and more negatively correlated with cash holdings than other sources of debt. Overally, their
results supported the financial flexibility hypothesis.
Kinyua (2006) conducted a study on factors hindering CP market development in Kenya. A
sample of 100 companies quoted and unquoted was picked. Included here were 24 companies
that have issued CP as they were deemed to have more information given that they had
experienced the issuing process. The results showed that factors hindering development of CP

16
market in Kenya include:-Approval time by CMA and NSE, lack of information, Competition
from lenders, Costs of issuance and Management lack of enthusiasm. She concluded that
concerted efforts by the policy makers, NSE, CMA, stock broker‟s investment advisors and
commercial banks will be the only solution to realize a vibrant commercial paper market in
Kenya. She further recommended that further studies should be done to determine effectiveness
of commercial paper in managing short term cash flows at a low cost.
Nganga (1999) conducted a study on Commercial Paper as a source of Finance for Kenyan
Companies. He concluded that funds sourced from CP issuance have been mainly limited to the
financing of working capital needs of firms. This was within the expectations of the research
considering CP is a short term source of funds. The study also determined that there is a demand
for a secondary market for CP so as to offer flexibility to both lenders and borrowers.
Njogu (2003) conducted a study on Price impacts of CP issue announcements: A case of quoted
companies which have issued CP in Kenya. Her objectives being to determine whether stock
prices adjust to commercial paper issues announcements and the direction of stock price
adjustment. Her study was justified because of the slow development of the market in Kenya,
there was need to assess investors reactions to the market so that any company considering
issuing the paper can predict the reaction of investors and its impact on its share prices. The
population of the study consisted of all quoted companies that have issued commercial paper
from 1994 to 2001.
The findings of the study concluded that companies that have taken the bold step of substituting
the commercial short-term bank loans with CP experienced some significant interest savings of
between 2.85% and 13.85% with an average of 5.85% leading to an increase in the firm‟s net
cash flow. The study also confirmed the expectation of the study that abnormal returns
surrounding the commercial paper issue announcements should be significantly positive.
Companies in the NSE that substituted a bank overdraft with a commercial paper experienced
positive abnormal returns due to interest savings which increased the firm‟s net cashflows.
Hence CP issue announcement is interpreted as good news by investors.

17
Munywoki (2000) conducted a study on Commercial paper as a short term source of finance for
quoted companies and observed that company cash flows, interest on bank overdraft (OD) and
Treasury bill rate (T.B) significantly affect the demand for CP and that bank OD rate has a
negative relationship with demand of CP
2.4 General Literature Review.
2.4.1 Approaches in Working Capital Management.
According to Panday (2010) a firm can adopt an approach depending on the mix of short term
and long term financing they use. The three approaches are:-
1. The Matching Approach.
The firm can adopt a financial plan which matches the expected life of assets with expected
source of funds raised to finance assets. Stock of thirty days may be financed with a thirty day
bank loan. The justification for the exact matching is that since the purpose of financing is to pay
the assets, the source of financing and the asset should be relinquished simultaneously (Panday
2010).
2. Conservative Approach.
In this approach the firm depends more on long term funds for financing needs. The firm
finances fixed and part of temporary current assets with long term funds. The firm therefore
relies heavily on long term funds and has less risk of facing the problem of shortage of funds
(Panday 2010).
3. Aggressive Approach.
This is when the firm uses more short term financing like CP than warranted by the matching
plan. The firm finances part of the permanent current assets with short term financing. Some
even finance a part of their fixed assets with short term financing. The relatively use of short
term financing makes the firm more risky (Pandey 2010).
2.4.2 Internet based Commercial Paper Issuance.
Trauten and Langer (2007) did a survey of 54 corporate Commercial Paper (CP) issuers from
eleven European countries in order to analyze the perceived benefits and obstacles of internet
platforms for issuing CP in Europe. The lack of a joint initiative of large CP issuers, close
relations to banks and the fact that liquidity is scattered over separate domestic CP markets were
felt to be the main obstacles to the establishment of a European CP platform. Responses revealed
consensus that an internet platform would increase flexibility but show divergent opinions about

18
the effect on other criteria. Corporate issuers expect their own issuance activity as well as the
overall market volume to increase within the next five years. The establishment of an internet
based issuance platform is considered to be likely.
2.5 Chapter Summary.
The literature review show that most of the studies carried out concern the developed world.
There is however much consistency in the studies that Commercial paper financing is primarily
used to finance short term investments. Further the local studies have not adequately addressed
any relationship between Commercial Paper Financing and any other variable apart from
Njogu‟s paper in 2003.Further these studies have not incorporated the missing link where CP is
viewed to be primarily used to finance working capital needs of firms specifically inventories
and accounts receivable and also used as a bridge to long term Investment options.
This study therefore seeks to bridge this gap in literature by using secondary data to show the
relationship between commercial paper financing as a short term source of finance and the main
components of working capital. The researcher‟s intention is to study the relationship in an effort
to filling this gap in knowledge in the commercial paper market in Kenya.

19
CHAPTER THREE
3.0 RESEARCH METHODOLOGY
3.1 Introduction
This chapter describes the research design, population, sampling design, the data collection
method, research procedures and data analysis methods that will be used in the course of the
research. This section also indicates the research tools that will be employed to collect data and
carrying out the data analysis.
3.2 Research Design
The main purpose of this research is to determine the relationship between commercial paper
financing and components of working capital in firms that have issued CP in Kenya. The design
used for the study was therefore causal research design. A causal research was conducted to
identify the cause and effect relationships among variables when the research problem has been
narrowly defined. It explains the effect of one variable on another and has the potential to
illustrate how a change in one variable causes some predictable change in another variable. The
design is accurate and possesses the aspect of comparison of data over a long period of time and
involves investigation of what causes the other among different variables.The method was
selected as it will enable the researcher meet the objectives of the study.
The design was also used by Calomiris et al, (1995) to show the cause and effect relationship
between commercial paper and liquid working capital around business cycle peaks. Matthias et
al. (2010) helped shed light on the direction of causality in the relationship between CP access
and investment behavior.
3.3 Population of the study
According to Cooper and Schindler (2003) a population is the subject such as a person,
organization, customer database or amount of quantitative data on which measurement is being
taken. The population of the study was all companies that have issued CP. According to the
CMA annual reports and CBK statistics, there are 27 companies that have issued CP since the
first issue in 1994(Appendix 1).

20
3.4 Sample selection
Given the low number of companies that have issued CP, with some companies entering the
market only once, twenty two companies that have been in the market for at least two years were
used to conduct the study (Appendix 11).Thirteen of these firms are listed at the NSE hence their
financial statements were readily available and reliable (Appendix 1).Financial statements of the
remaining companies were obtained from the financial managers of these companies.
3.5 Data Collection.
The data collected was quantitative. The research study used secondary sources of data which
helped the researcher measure both aspects of the variables. Secondary data involves the
collection and analysis of published material and information from other sources like annual
reports and published data. According to Saunders, Lewis and Thornhill (1997) one of the
advantages of using secondary data was the enormous savings in resources especially researchers
time and money. Commercial paper outstanding amounts and components of working capital
that are assets were extracted from the balance sheet of the audited financial statements of all
firms that have issued CP. The period of data collection was based on the number of years the
company has been in the market. Only companies that have been in the market for one year only
were excluded from the study,
The specific data collected in each of the firms for the analysis of the independent variable was
data on working capital components that are assets i.e. inventories, trade and other receivables
and cash balance. This aided in performing regressions to show their movements when the firm
has a CP program.
Data on other financing aspects was collected including total debt/borrowings from the balance
sheet of these firms. All these data assisted to show the breakdown of financing of current
assets into long term financing and short term financing.
3.6 Data analysis
To determine the relationship between CP financing and components of working capital that are
assets in these firms, the data was analyzed through the use of simple and multiple regression
analysis. Correlation analysis was used to access the strength of the relationship between the
independent and dependent variable.

21
3.6.1 Variables and Variable Measurement
The data collection procedure was achieved by developing a similar framework used by
Weinraub et al. (1998), Afza and Nazir (2004), Raheman and Nasr (2007). The following data
was used to come up with the required variables. The commercial paper outstanding at the end of
each year; Trade and other receivables; Inventories; and Cash at bank and in hand.
Dependent variables
The dependent variable was CP outstanding amounts as at the end of their financial year in all
the companies denoted as CPit.
Independent variables
The independent variables were inventory (INV), trade and other receivables (ACCREC), Cash
holding (CASH). Working capital is computed by subtracting current liabilities from current
assets.
The variables were arrived at by looking at the amount of current assets that a business has left
after all the liabilities have been subtracted. Since there is no ideal working capital requirement
that is universally applicable to all firms, the selected variables were based on the liquid assets
that are common in any trading organization as they need to hold inventory, give credit to
customers and hold liquid cash to meet recurrent expenditures.
3.6.2 Quantitative Analysis
Quantitative analysis was applied in the study. Simple and multiple linear regression analysis
that estimates the causal relationships between CP and the chosen variables.
Statistical Package for Social Sciences (SPSS) version 11 software was used for analysis of the
different variables in the study. The package helped in organizing and summarizing data by use
of descriptive statistics like tables. Data presentation was done through graphs, percentages and
frequency tables to ensure that gathered information is clearly understood.
The study adopted a model similar to the one used by Calomiris et al,.(1995) where they did
separate regressions on CP as a proportion of total debt and components of working capital –
Inventory (INV),accounts receivable (ACCREC) and CASH as shown below:-

22
CPit = βo + β2 INV
CPit = βo + β3 ACCREC
CPit = βo + β3 CASH
Separate regressions were not done as in Calomiris et.,al (1995) but instead the independent
variables were combined and the regeression equation below was used to analyse the relationship
between commercial paper financing and the components of working capital of the firms.
CPit = βo + β1 INV + β2 ACCREC+ β3 CASH + ε
Where:-
CPit = Commercial Paper outstanding of a firm at time t for i=1, 2…….22 firms
βo, = The intercepts of equation. Estimated value of CP when all the other variables are zero
β1, β2, and β3, = Coefficients of variables. Change in estimated value of CP.
t: = Time = 1, 2, ……, 3 years.
ε: = The error term
Commercial paper outstanding (CPit) is net balance of CP at the end of each financial year the
sampled firms have been in the market.
βo is a constant that represents the unit change in CP outstanding when there is no change in the
independent variables – Inventory, accounts receivable and cash.
β1, β2, and β3 shows by how much CP will vary with a unit change in inventory, accounts
receivable and cash respectively.
Inventory is the largest current asset of a business and its can be measured through perpetual or
periodic inventory systems. For this study, the inventory balance at the end of the financial year
in the sampled firms was used in the model.
Accounts receivable is reported as a current asset and is considered part of an organization's
working capital. A number of methods are used to measure accounts-receivable balances and the
effectiveness of collection policies and procedures. Some of the more frequently used methods to

23
analyze accounts receivable and collections include: AR at Year End as a Percentage of Total
Sales, Average Collection Period, AR Aging Schedule. For this study the AR balance at the end
of the financial year in the sampled firms was used in the model.
Cash is considered to be the most liquid current asset and is also considered to be part of the
organization working capital. The bottom line of a cash flow statement reveals how much money
(as in real cash) a company has on hand to successfully run its operations, cover its liabilities and
expand and this is the cash balance used in the study from the balance sheet portion of the
financial statements of the sampled firms.
Diagnostic tests done are as listed below:-
1) Coefficient of determination (R square) – Its used to measure how well the regression
equation fits the data or the proportion of variability in a data set that is accounted for by
a statistical model. It‟s the sum of squares explained by the model i.e. Regression sum of
squares /Total sum of squares. It helps to decide whether the line obtained will be useful
for estimation and prediction. The value ranges from 0 to 1.The better the fit the closer
the sum of squares explained by the model is to 1.
2) F statistic – It will be used to test whether there is a linear relationship between the
predictor and response variables taken together i.e. to test if the regression model fits
well.
3) T test – It‟s used when the population sample size is small and population standard
deviation is unknown. This test will help determine whether any predictor variable have
any influence on the response variable over and above the other predictor variables. It‟s a
more accurate test as it has a wider spread.
4) Analysis of Variance (ANOVA) – It‟s used to measure the variability of the independent
variables and hence show whether the model accounts for most of the variation on the
dependent variable.

24
CHAPTER FOUR
4.0. DATA ANALYSIS AND FINDINGS
4.1. Introduction
This section represents the data presentation, analysis and findings of the study. The chapter
commences with descriptive statistics which gives the exploration of the variables used in the
analysis. Descriptive statistics, correlation and regression analysis were used to assess the
relationship between commercial paper financing and components of working capital that are
assets in each of the sampled 22 firms. These enabled the researcher make an overall conclusion
on the relationship between CP financing and components of working capital in Kenya.
4.2 Data Presentation
4.2.1. Regression results for Davis and Shirtliff Limited.
Table 4. 1: Model Summary, ANOVA, Regression results of Davis and Shirtliff Limited
Model R
R
Square
Adjusted
R Square
Std.
Error of
the
Estimate
Change Statistics
R Square
Change
F
Change df1 df2
Sig. F
Change
1 1.000a
1.000 1.000 .00000 1.000 .0 3 70 .0
Model
Sum of
Squares df Mean Square F Sig.
ANOVA Regression 201.041 3 67.014 .0 0.0a
Residual .000 70 .000 Total 201.041 73
Model
Unstandardized
Coefficients
Standardized
Coefficients
t Sig. B Std. Error Beta
Coefficients (Constant) -.833 .000 .0 .0
Inventory .500 .000 .394 .0 .0
Trade and other
receivables
-3.802E-15 .000 .000 .0 .0
Cash at bank and in
hand
.833 .000 .663 .0 .0
a. Predictors: (Constant), Cash at bank and in hand, Trade and other receivables, Inventory

25
b. Dependent Variable: CP Outstanding
From table 4.1, the study explains 100% variations in commercial papers issued at Davis and
Shirtliff Ltd. This means that commercial papers issued at Davis and Shirtliff Ltd wholly relied
on the size of the inventory, trade and other receivables and cash at bank and in hand
respectively. This indicates that there is a strong relationship between CP and these components
at Davis and Shirtliff Ltd.
The regression equation for Davis and Shirtliff Ltd is thus:-
CPi4 = -0.833 + 0.500 INV + (-3.802E-15) ACCREC+ 0.833CASH + ε
This therefore means that, holding all other factors constant, the Commercial Paper outstanding
of Davis and Shirtliff Ltd at time t=4, will be -0.833. A unit increase in inventory will lead to a
0.500 change in Commercial Paper outstanding; a unit increase in trade and other receivables
will lead to a (-3.802E-15) change in Commercial Paper outstanding while a unit increase in
Cash at bank and in hand will lead to a 0.833 increase in Commercial Paper outstanding of Davis
and Shirtliff Ltd at time t=4. This therefore means that for Davis and Shirtliff, the most
significant variable affecting CPit is Cash at bank and in hand followed by inventory.

26
4.2.2 Regression results for TPS Serena
Table 4. 2: Model Summary, ANOVA, Regression results of TPS Serena
Model R R Square
Adjusted
R
Square
Std.
Error of
the
Estimate
Change Statistics
R
Square
Change
F
Change df1 df2
Sig. F
Change
1 .593a
.352 -.296 .60858 .352 .543 3 3 .686
Model Sum of Squares df
Mean
Square F Sig.
ANOVA Regression .603 3 .201 .543 .686a
Residual 1.111 3 .370
Total 1.714 6
Model
Unstandardized Coefficients
Standardized
Coefficients
t Sig. B
Std.
Error Beta
Coefficients (Constant) .333 1.291 .258 .813
Inventory .000 .430 .000 .000 1.000
Trade and
other
receivables
-.111 .227 -.236 -.490 .658
Cash at bank
and in hand
.667 .680 .609 .980 .399
a. Predictors: (Constant), Cash at bank and in hand, Trade and other receivables, Inventory
b. Dependent Variable: CP Outstanding
From table 4.2 the study explains 35.2% of commercial papers outstanding at TPS Serena. This
means that 64.8% commercial papers outstanding at TPS Serena are explained by other factors
other than, Inventory, trade and other receivables and cash at bank and in hand respectively. This
indicates that there is a weak relationship between CP and inventory, CP and trade and
receivables and CP and cash at bank and in hand at TPS Serena Ltd.
The regression equation for TPS Serena Ltd is thus:-
CPi7 = 0.333 + 0.000 INV – 0.111ACCREC+ .667CASH + ε
This therefore means that, holding all other factors constant, the Commercial Paper outstanding
of TPS Serena Ltd at time t=7, will be 0.333. A unit increase in inventory will lead to a 0.000

27
change in Commercial Paper outstanding; a unit increase in trade and other receivables will lead
to a 0.111decrease in Commercial Paper outstanding while a unit increase in Cash at bank and in
hand will lead to a 0.667 increase in Commercial Paper outstanding of TPS Serena Ltd at time
t=7. This therefore means that the most significant variable affecting CPit is Cash at bank and in
hand followed by trade and other receivables.
4.2.3 Regression results for Crown Berger Ltd
Table 4. 3: Model Summary, ANOVA, Regression results of Crown Berger.
Model R R Squared
Adjusted R
Square
Std. Error
of the
Estimate
1 .624a
.390 .161 .47835
Model Sum of Squares df
Mean
Square F Sig.
ANOVA Regression 1.169 3 .390 1.704 .243a
Residual 1.831 8 .229
Total 3.000 11
Model
Unstandardized Coefficients
Standardized
Coefficients
t Sig. B
Std.
Error Beta
Coefficients (Constant) 1.079 1.298 .831 .430
Inventory .396 .324 .506 1.219 .257
Trade and
other
receivables
.080 .191 .202 .422 .684
Cash at bank
and in hand
-.268 .271 -.368 -.991 .351
a. Predictors: (Constant), Cash at bank and in hand, Trade and other receivables, Inventory
b. Dependent Variable: CP Outstanding.
From the tables 4.3 the study explains 39% of commercial papers outstanding at Crown Berger
Ltd. This means that 61% commercial papers outstanding at Crown Berger are explained by
other factors other than, Inventory, trade and other receivables and cash at bank and in hand
respectively. This indicates that there is a weak relationship between CP and the WC
components at Crown Berger Ltd.
The regression equation for Crown Berger Ltd is thus:-

28
CPi12 = 1.079 + 0.396INV + 0.080ACCREC- 0.268CASH + ε
This therefore means that, holding all other factors constant, the Commercial Paper outstanding
of Crown Berger Ltd at time t=12, is 1.079. A unit increase in inventory will lead to a 0.396
increase in Commercial Paper outstanding; a unit increase in trade and other receivables will lead
to a 0.080 increase in Commercial Paper outstanding while a unit increase in Cash at bank and in
hand will lead to a 0.268 decrease in Commercial Paper outstanding of Crown Berger Ltd at time
t=12. This therefore means that the most significant variable affecting CPit is Inventory,
followed by Cash at bank and in hand.
4.2.4 Regression results for CMC Holdings Ltd
Table 4. 4: Model Summary, ANOVA, Regression results of CMC.
Model R
R
Squared
Adjusted
R
Square
Std.
Error of
the
Estimate
Change Statistics
R
Square
Change
F
Change df1 df2
Sig. F
Change
1 0.204 0.042 -0.318 1.65694 0.042 0.116 3 8 0.948
Model Sum of Squares df
Mean
Square F Sig.
ANOVA Regression 0.953 3 0.318 0.116 0.948
Residual 21.964 8 2.745
Total 22.917 11
Model
Unstandardized
Coefficients
Standardized
Coefficients
t Sig. B
Std.
Error Beta
Coefficients (Constant) 3.018 1.521 1.985 0.082
Inventory 0.464 1.939 0.444 0.239 0.817
Trade and
other
receivables
0.141 0.461 0.153 0.306 0.767
Cash at bank
and in hand -0.695 1.912 -0.632 -0.364 0.726
a. Predictors: (Constant), Cash at bank and in hand, Trade and other receivables, Inventory
b. Dependent Variable: CP Outstanding
From table 4.4, the study explains 4.2% of commercial papers outstanding at CMC Holdings.
This means that 95.8% commercial papers outstanding at CMC Holdings are explained by other
factors other than, Inventory, trade and other receivables and cash at bank and in hand

29
respectively. This indicates that there is a very weak relationship between CP and WC
components at CMC Holdings Ltd.
The regression equation for CMC Holdings Ltd is thus:-
CPi12 = 3.018+ 0.464NV + 0.141ACCREC- 0.695CASH + ε
This therefore means that, holding all other factors constant, the Commercial Paper outstanding
of CMC Holdings Ltd at time t=12, is 3.018. A unit increase in inventory will lead to a 0.464
increase in Commercial Paper outstanding; a unit increase in trade and other receivables will lead
to a 0.141 increase in Commercial Paper outstanding while a unit increase in Cash at bank and in
hand will lead to a 0.695 decrease in Commercial Paper outstanding of CMC Holdings Ltd at
time t=12. This therefore means that the most significant variable affecting CPit is Cash at bank
and in hand, followed by inventory.
4.2.5 Regression results for KenolKobil Ltd.
Table 4. 5: Model Summary, ANOVA, Regression results of KenolKobil Ltd
Model R R Square
Adjusted
R
Square
Std.
Error of
the
Estimate
Change Statistics
R
Square
Change
F
Change df1 df2
Sig. F
Change
1 1.000a
1.000 1.000 .00000 1.000 .0 3 4 .0
Model Sum of Squares df
Mean
Square F Sig.
ANOVA Regression 21.500 3 7.167 .0 .0a
Residual .000 4 .000
Total 21.500 7
Model
Unstandardized Coefficients
Standardized
Coefficients
T Sig. B
Std.
Error Beta
Coefficients (Constant) -.833 1.890 .0 .0
Inventory .500 .124 .396 .0 .0
Trade and other
receivables
.000 .001 .000 .0 .0
Cash at bank
and in hand
-.833 .034 .660 .0 .0
a. Predictors: (Constant), Cash at bank and in hand, Trade and other receivables, Inventory
b. Dependent Variable: CP Outstanding

30
From table 4.5, the study explains 100% of commercial papers outstanding at KenolKobil. This
means that commercial papers outstanding at KenolKobil Ltd are wholly explained by,
Inventory, trade and other receivables and cash at bank and in hand respectively. This indicates
that there is a very strong relationship between CP and WC components at KenolKobil Ltd.
The regression equation for KenolKobil Ltd is thus:-
CPi11 = 0.833+ 0.500INV +0.000ACCREC- 0.833CASH + ε
This therefore means that, holding all other factors constant, the Commercial Paper outstanding
of KenolKobil Ltd at time t=11, will be -0.833. A unit increase in inventory will lead to a 0.500
increase in Commercial Paper outstanding; a unit increase in trade and other receivables will lead
to no change in Commercial Paper outstanding while a unit increase in Cash at bank and in hand
will lead to a 0.833 decrease in Commercial Paper outstanding of KenolKobil Ltd at time t=11.
This therefore means that for KenolKobil, the most significant variable affecting CPit is Cash at
bank and in hand, followed by inventory.
4.2.6 Regression results for Athi River Mining Ltd
Table 4. 6: Model Summary, ANOVA, Regression results of Athi River Mining
Model R R Square
Adjusted R
Square
Std. Error of
the Estimate
1 1.000a
1.000 1.000 .00000
Model Sum of Squares df
Mean
Square F Sig.
1 Regression 28.500 3 9.500 .0 .0a
Residual .000 6 .000
Total 28.500 9
Model
Unstandardized Coefficients
Standardized
Coefficients
t Sig. B
Std.
Error Beta
1 (Constant) 0.746 .000 -12576761.001 .000
Inventory 0.466 .000 .380 76003605.037 .000
Trade and
other
receivables
.000 .000 .000 .000 1.000
Cash at bank
and in hand
.955 .000 .679 143633312.623 .000
a. Predictors: (Constant), Cash at bank and in hand, Trade and other receivables, Inventory

31
b. Dependent Variable: CP Outstanding
From table 4.6, the study explains 100% of commercial papers outstanding at Athi River Mining
Ltd. This means that commercial papers outstanding at Athi River Mining Ltd are wholly
explained by, Inventory, trade and other receivables and cash at bank and in hand respectively.
This indicates that there is a very strong relationship between CP and WC components at Athi
River Mining Ltd.
The regression equation for Athi River Mining Ltd is thus:-
CPi8 = 0.746+ 0.466INV + 0.000ACCREC- 0.955CASH + ε
This therefore means that, holding all other factors constant, the Commercial Paper outstanding
of Athi River Mining Ltd at time t=8, is 0.746. A unit increase in inventory will lead to a 0.500
increase in Commercial Paper outstanding; a unit increase in trade and other receivables will lead
to nil change in Commercial Paper outstanding while a unit increase in Cash at bank and in hand
will lead to a 0.955 decrease in Commercial Paper outstanding of Athi River Mining Ltd at time
t=8. This therefore means that for Athi River Mining Ltd, the most significant variable affecting
CPit is Cash at bank and in hand, followed by inventory.

32
4.2.7 Regression results for Nation Media Ltd
Table 4. 7: Model Summary, ANOVA, Regression results of Nation media
Model R R
Square
Adjusted
R Square
Std.
Error of
the
Estimate
Change Statistics
R
Square
Change
F
Change df1 df2
Sig. F
Change
1 .702a
.493 .469 .5681 1 0 1 0 0
Model Sum of Squares df Mean
Square F Sig.
ANOVA
Regression 26.958 1 6.739 20.880 .000a
Residual 27.758 0 .323
Total 54.716 1
Model
Unstandardized
Coefficients
Standardized
Coefficients t Sig.
B Std.
Error Beta
Coefficients
(Constant) 1.502 .087 .202 1.897 .061
Inventory .164 .083 .362 3.552 .001
Trade and other
receivables
.293 .036 .094 1.021 .310
Cash at bank and
in hand
-.037 .040 .229 2.647 .010
a. Predictors: (Constant), Cash at bank and in hand, Trade and other receivables, Inventory
b. Dependent Variable: CP Outstanding
From table 4.7, the study explains 49.3% of variations in commercial papers outstanding at
Nation Media. This means that 50.7% of variations in commercial papers outstanding at Nation
Media Ltd can only be explained by factors outside this study. This indicates that there is a
relatively strong relationship between CP and inventory, CP and trade and receivables and CP
and cash at bank and in hand at Nation Media Ltd.
The regression equation for Nation Media Ltd is thus:-
CPi2 = 1.502+ .164INV + .293ACCREC - .037CASH + ε
This therefore means that, holding all other factors constant, the Commercial Papers outstanding
of Nation Media Ltd at time t=2, is 1.502. A unit increase in inventory will lead to a 0.164
increase in Commercial Papers outstanding; a unit increase in trade and other receivables will
lead to a 0. 293 increase in Commercial Paper outstanding while a unit increase in Cash at bank

33
and in hand will lead to a 0.037 decrease in Commercial Papers outstanding at time t=2. This
therefore means that for Nation Media, the most significant variable affecting CPit is trade and
other receivables followed by Inventory.
4.2.8 Regression results for Total Kenya Ltd
Table 4. 8: Model Summary, ANOVA, Regression results of Total Kenya
Model R R Square
Adjusted
R
Square
Std.
Error of
the
Estimate
Change Statistics
R
Square
Change
F
Change df1 df2
Sig. F
Change
1 1.000 1.000 1.000 . 1.000 . 1 0 .
Model Sum of Squares df
Mean
Square F Sig.
ANOVA Regression 2.000 1 2.000 . .(a)
Residual 0.000 0 .
Total 2.000 1
Model
Unstandardized
Coefficients
Standardized
Coefficients
t Sig. B Std.
Error Beta
Coefficients (Constant) 9.000 .202 .831 .430
Inventory -2.000 .362 -1.000 1.219 .257
Trade and other
receivables
0.000 .094 0.000 .422 .684
Cash at bank and
in hand
0.000 .229 0.000 -.991 .351
a. Predictors: (Constant), Cash at bank and in hand, Trade and other receivables, Inventory
b. Dependent Variable: CP Outstanding
From table 4.8, the study explains 100% of commercial papers outstanding at Total Kenya. This
means that commercial papers outstanding at Total Kenya Ltd are wholly explained by,
Inventory, trade and other receivables and cash at bank and in hand respectively. This indicates
that there is a very strong relationship between CP and inventory, CP and trade and receivables
and CP and cash at bank and in hand at Total Kenya Ltd.
The regression equation for Total Kenya Ltd is thus:-
CPi2 = 9 - 2INV + 0.000ACCREC+ 0.000CASH + ε

34
This therefore means that, holding all other factors constant, the Commercial Papers outstanding
of Total Kenya Ltd at time t=2, is 9. A unit increase in Inventory will lead to a double increase in
Commercial Papers outstanding; a unit increase in trade and other receivables will lead to no
change in Commercial Paper outstanding, same applies to cash. This therefore means that for
Total Kenya, the most significant variable affecting CPit is inventory.
4.2.9 Regression results for Express Kenya Ltd
Table 4. 9: Model Summary, ANOVA, Regression results of Express Kenya Ltd
Model R R Square
Adjusted R
Square
Std. Error of
the Estimate
1 .897a
.880 .133 .3195
Model Sum of Squares df
Mean
Square F Sig.
Regression 11.534 5 2.878 52.400 .0073
Residual 186.555 27 2.129
Total 198.089 32
Unstandardized
Coefficients
Standardize
d
Coefficients
t Sig.
Coefficients
B
Std.
Error Beta
(Constant) 3.657 1.033 0.787 0.255
Inventory 1.654 0.107 0.159 1.091 0.002
Trade and
other
receivables
0.988 0.139 0.085 0.687 0.005
Cash at
bank and in
hand
-0.568 0.097 0.145 0.97 0.013
a. Predictors: (Constant), Cash at bank and in hand, Trade and other receivables, Inventory
b. Dependent Variable: CP Outstanding
From table 4.9, the study explains 89.7% of variations in commercial papers outstanding at
Express Kenya Ltd. This means that 11.3% of variations in commercial papers outstanding at
Express Kenya Ltd is explained by other factors other than, Inventory, trade and other

35
receivables and cash at bank and in hand. However, there is a very strong relationship between
CP and inventory, CP and trade and receivables and CP and cash at bank and in hand at Express
Kenya Ltd.
The regression equation for Express Kenya Ltd is thus:-
CPi2 = 3.657+1.654INV + 0.988ACCREC- 0.568CASH + ε
This therefore means that, holding all other factors constant, the Commercial Papers outstanding
of Express Kenya Ltd at time t=2, is 3.657. A unit increase in Inventory will lead to a 1.654I
increase in Commercial Papers outstanding; a unit increase in trade and other receivables will
lead to a 0.988 change in Commercial Paper outstanding, and a unit increase in cash will lead to
a 0.568 change in Commercial Paper outstanding. This therefore means that for Express Kenya
Ltd, the most significant variable affecting CPit is inventory.
4.2.10 Regression results for Kenya Power Ltd
Table 4. 10: Model Summary, ANOVA, Regression results of Kenya Power Ltd
Model R R Square
Adjusted
R
Square
Std.
Error of
the
Estimate
Change Statistics
R
Square
Change
F
Change df1 df2
Sig. F
Change
1 0.64 0.41 0. .00000 1.000 . 3 3 .
Model Sum of Squares df
Mean
Square F Sig.
ANOVA Regression 26.958 1 6.739 20.880 .000a
Residual 27.758 0 .323
Total 54.716 1
Model
Unstandardized Coefficients
Standardized
Coefficients
t Sig. B
Std.
Error Beta
Coefficients (Constant) 0.836 .000 61.001 .000
Inventory .000 .000 .000 5.037 6.23
Trade and
other
receivables
.000 .000 .000 5.000 56.3
Cash at bank
and in hand
-1.345 .033 .710 7.98 .002
a. Predictors: (Constant), Cash at bank and in hand, Trade and other receivables, Inventory

36
b. Dependent Variable: CP Outstanding
From table 4.10, the study explains 64% of commercial papers outstanding at Kenya Power Ltd.
This means that 36% of variations in commercial papers outstanding at Kenya Power Ltd is
explained by other factors other than, Inventory, trade and other receivables and cash at bank and
in hand. However, there is a very strong relationship between CP and cash at bank and in hand at
Kenya Power Ltd.
The regression equation for Kenya Power Ltd is thus:-
CPi10 = 0.836+ .000INV + .000ACCREC - 1.345CASH + ε
This therefore means that, holding all other factors constant, the Commercial Papers outstanding
of Kenya Power Ltd at time t=2, will be 0.836. a unit increase in inventory will lead to no change
in Commercial Paper outstanding; a unit increase in trade and other receivables will lead to no
change in Commercial Paper outstanding while a unit increase in Cash at bank and in hand will
lead to a -1.345 decrease in Commercial Papers outstanding of Kenya Power Ltd at time t=2.
This therefore means that the most significant variable affecting CPit is Cash at bank and in
hand, followed by inventory.
4.2.11 Regression results for ECTA Kenya ltd
Table 4. 11: Model Summary, ANOVA, Regression results of ECTA Kenya
Model R R Square
Adjusted
R Square
Std. Error
of the
Estimate
1 1.000a
1.000 1.000 .00000
Model Sum of Squares df
Mean
Square F Sig.
ANOVA Regression 28.500 3 9.500 . .a
Residual .000 6 .000
Total 28.500 9
Model
Unstandardized Coefficients
Standardized
Coefficients
t Sig. B
Std.
Error Beta
Coefficients (Constant) 4.783 .000 61.001 .000
Inventory .204 .000 .380 5.037 .000

37
Trade and
other
receivables
.164 .000 .000 5.000 1.000
Cash at bank
and in hand
.745 .000 .679 12.623 .000
a. Predictors: (Constant), Cash at bank and in hand, Trade and other receivables, Inventory
b. Dependent Variable: CP Outstanding
From table 4.11, the study explains 100% of commercial papers outstanding at ECTA Kenya.
This means that commercial papers outstanding at ECTA Kenya Ltd are wholly explained by,
Inventory, trade and other receivables and cash at bank and in hand respectively. This indicates
that there is a very strong relationship between CP and WC components at ECTA Kenya Ltd.
The regression equation for ECTA Kenya Ltd is thus:-
CPi10 = 4.783+ 0. 204INV + 0.164ACCREC- 0.745CASH + ε
This therefore means that, holding all other factors constant, the Commercial Papers outstanding
of ECTA Kenya Ltd at time t=10, will be 4.783. A unit increase in inventory will lead to a 0.
204 increase in Commercial Papers outstanding; a unit increase in trade and other receivables
will lead to a 0.164 increase in Commercial Paper outstanding while a unit increase in Cash at
bank and in hand will lead to a 0.745 increase in Commercial Papers outstanding of ECTA
Kenya Ltd at time t=10. This therefore means that the most significant variable affecting CPit is
Cash at bank and in hand, followed by inventory.
4.2.12 Regression results for Cooper Kenya Ltd
Table 4. 12: Model Summary, ANOVA, Regression results of Cooper Kenya.
Model R R Square
Adjusted
R
Square
Std.
Error of
the
Estimate
Change Statistics
R
Square
Change
F
Change df1 df2
Sig. F
Change
1 1.000a
1.000 1.000 .00000 1.000 . 3 3 .
Model Sum of Squares df
Mean
Square F Sig.
ANOVA Regression 17.714 3 5.905 . .a
Residual .000 3 .000
Total 17.714 6

38
Model
Unstandardized Coefficients
Standardized
Coefficients
t Sig. B
Std.
Error Beta
Coefficients (Constant) 3.454 .000 61.001 .000
Inventory .213 .000 .365 5.037 .000
Trade and
other
receivables
.362 .000 .000 5.000 1.000
Cash at bank
and in hand
-.977 .000 .710 12.623 .000
a. Predictors: (Constant), Cash at bank and in hand, Trade and other receivables, Inventory
b. Dependent Variable: CP Outstanding
From table 4.12, the study explains 100% of commercial papers outstanding at Cooper Kenya.
This means that commercial papers outstanding at Cooper Kenya Ltd are wholly explained by,
Inventory, trade and other receivables and cash at bank and in hand respectively. This indicates
that there is a very strong relationship between CP and WC components at Cooper Kenya Ltd.
a. Dependent Variable: CP Outstanding
The regression equation for Cooper Kenya Ltd is thus:-
CPi7 = 3.454+ 0. 213INV + 0.362ACCREC- 0.977CASH + ε
This therefore means that, holding all other factors constant, the Commercial Papers outstanding
of Cooper Kenya Ltd at time t=7, is 3.454. A unit increase in inventory will lead to a 0. 213
increase in Commercial Papers outstanding; a unit increase in trade and other receivables will
lead to a 0.362 increase in Commercial Paper outstanding while a unit increase in Cash at bank
and in hand will lead to a 0.977 decrease in Commercial Papers outstanding of Cooper Kenya
Ltd at time t=7. This therefore means that for Cooper Kenya, the most significant variable
affecting CPit is Cash at bank and in hand, followed by trade and other receivables.

39
4.2.13 Regression results for Mabati Rolling Mills Ltd
Table 4. 13: Model Summary, ANOVA, Regression results of Mabati Rolling Mills Ltd
Model R R Squared
Adjusted R
Square
Std. Error
of the
Estimate
1 1.000 1.000 .161 .47835
Model Sum of Squares df
Mean
Square F Sig.
ANOVA Regression 1.169 2 .390 1.704 .243a
Residual 1.219 1 .229
Total 3.000 3
Model
Unstandardized Coefficients
Standardized
Coefficients
t Sig. B
Std.
Error Beta
Coefficients (Constant) 3.896 1.298 .831 .430
Inventory 0.463 .324 .506 .987 .257
Trade and
other
receivables
1.831 .191 .202 .422 .035
Cash at bank
and in hand
-0.845 .271 -.368 -.991 .351
a. Predictors: (Constant), Cash at bank and in hand, Trade and other receivables, Inventory
b. Dependent Variable: CP Outstanding
From table 4.13, the study explains 100% of commercial papers outstanding at Mabati Rolling
Mills Ltd. This means that commercial papers outstanding at Mabati Rolling Mills Ltd are
wholly explained by, Inventory, trade and other receivables and cash at bank and in hand
respectively. This indicates that there is a very strong relationship between CP and inventory, CP
and trade and receivables and CP and cash at bank and in hand at Mabati Rolling Mills Ltd.
The regression equation for Mabati Rolling Mills Ltd was thus:-
CPi3 = 3.896+ 0.463INV + 1.831ACCREC-0.845CASH + ε
This therefore means that, holding all other factors constant, the Commercial Papers outstanding
of Mabati Rolling Mills Ltd at time t=3, will be 3.896; a unit increase in inventory will lead to a
0.453 increase in Commercial Papers outstanding; a unit increase in trade and other receivables

40
will lead to a 1.831 increase in Commercial Paper outstanding while a unit increase in Cash at
bank and in hand will lead to a 0.845 decrease in Commercial Papers outstanding of Kenya Shell
Ltd at time t=3. This therefore means that for Mabati Rolling Mills Ltd, the most significant
variable affecting CPit is trade and other receivables followed by Cash at bank and in hand.
4.2.14 Regression results for Kenya Shell Ltd
Table 4. 14: Model Summary, ANOVA, Regression results of Kenya Shell
Model R
R
Square
Adjusted
R
Square
Std.
Error of
the
Estimate
Change Statistics
R
Square
Change
F
Change df1 df2
Sig. F
Change
1 1.000 1.000 1.000 0.00000 1.000 . 1 1 .
Model Sum of Squares Df
Mean
Square F Sig.
ANOVA Regression 6.000 1 6.000 . .(a)
Residual 0.000 1 0.000
Total 6.000 2
Model
Unstandardized
Coefficients
Standardized
Coefficients
t Sig. B
Std.
Error Beta
Coefficients (Constant) 3.888 0.306 1.985 0.082
Trade and
other
receivables
0.453 -
0.364 -1.000 0.239 0.817
Inventory 0.258 0.000 0.000 0.306 0.767
Cash at bank
and in hand 0.966 0.239 0.000 -0.364 0.726
a. Predictors: (Constant), Cash at bank and in hand, Trade and other receivables, Inventory
b. Dependent Variable: CP Outstanding
From table 4.14, the study explains 100% of commercial papers outstanding at Kenya Shell. This
means that commercial papers outstanding at Kenya Shell Ltd are wholly explained by,
Inventory, trade and other receivables and cash at bank and in hand respectively. This indicates
that there is a very strong relationship between CP and inventory, CP and trade and receivables
and CP and cash at bank and in hand at Kenya Shell Ltd.
The regression equation for Kenya Shell Ltd was thus:-

41
CPi3 = 3.888 + 0.453INV + 0.258ACCREC+ 0.966CASH + ε
This therefore means that, holding all other factors constant, the Commercial Papers outstanding
of Kenya Shell Ltd at time t=3, will be 3.888; a unit increase in inventory will lead to a 0.453
increase in Commercial Papers outstanding; a unit increase in trade and other receivables will
lead to a 0.258 increase in Commercial Paper outstanding while a unit increase in Cash at bank
and in hand will lead to a 0.966 increase in Commercial Papers outstanding of Kenya Shell Ltd
at time t=3. This therefore means that for Kenya Shell, the most significant variable affecting
CPit is Cash at bank and in hand followed by Inventory.
4.2.15 Regression results for Synergy Industrial Ltd
Table 4. 15: Model Summary, ANOVA, Regression results of Synergy Industrial Ltd
Model R
R
Square
Adjusted
R
Square
Std.
Error of
the
Estimate
Change Statistics
R
Square
Change
F
Change df1 df2
Sig. F
Change
1 1 0.657a) 0.423 0.866 3.3333 0.0027 0.0027 1 1
Model Sum of Squares Df
Mean
Square F Sig.
ANOVA Regression 22.900 3 7.633 . .a
Residual .000 6 .000
Total 22.900 9
Model
Unstandardized
Coefficients
Standardized
Coefficients
t Sig. B
Std.
Error Beta
Coefficients (Constant) 1.584 3.111 1.825 .00012
Inventory 0.0495 .058 .099 .096 .005
Trade and
other
receivables
0.2050 .045 .099 .093 .004
Cash at
bank and
in hand
0.3660 .499 .095 .095 .007
a. Predictors: (Constant), Cash at bank and in hand, Trade and other receivables, Inventory
b. Dependent Variable: CP Outstanding

42
From table 4.15, the study explains 65.7% of commercial papers outstanding at Synergy
Industrial. This means that other factors not studied in this research project contribute to 34.3%
of variation in CP at Synergy Industrial limited, and should hence be studied. This indicates that
there is a very strong relationship between CP and WC components at Synergy Industrial Ltd.
The regression equation for Synergy Industrial Ltd is thus:-
CPi4 = 1.584+ 0.0495INV + 0.2050ACCREC +0.3660CASH + ε
This therefore means that, holding all other factors constant, the Commercial Papers outstanding
of Synergy Industrial Ltd at time t=3, is 1.584. A unit increase in inventory will lead to a
0.0495 increase in Commercial Papers outstanding; a unit increase in trade and other receivables
will lead to 0.2050 increase in Commercial Paper outstanding while a unit increase in Cash at
bank and in hand will lead to a 0.3660 increase in Commercial Papers outstanding of Synergy
Industrial Ltd at time t=4. This therefore means that for Synergy Industrial, the most significant
variable affecting CPit is Cash at bank and in hand, followed by accounts receivable.
4.2.16 Regression results for Kenya Hotel Properties Ltd
Table 4. 16: Model Summary, ANOVA, Regression results of Kenya Hotel Properties.
Model R R Square
Adjusted
R
Square
Std.
Error of
the
Estimate
Change Statistics
R
Square
Change
F
Change df1 df2
Sig. F
Change
1 1.000a
1.000 1.000 .00000 1.000 0 3 6 .000
Model Sum of Squares Df
Mean
Square F Sig.
ANOVA Regression 22.900 3 7.633 . .a
Residual .000 6 .000
Total 22.900 9
Model
Unstandardized
Coefficients
Standardized
Coefficients
t Sig. B
Std.
Error Beta
Coefficients (Constant) 0.744 .000 .506 .000
Inventory .500 .344 .413 .202 .000
Trade and
other
receivables
.083 .859 .000 -.368 1.000
Cash at
bank and
in hand
.749 .534 .661 .506 .000

43
a. Predictors: (Constant), Cash at bank and in hand, Trade and other receivables, Inventory
b. Dependent Variable: CP Outstanding
From table 4.16, the study explains 100% of commercial papers outstanding at Kenya Hotel
Properties. This means that commercial papers outstanding at Kenya Hotel Properties Ltd are
wholly explained by, Inventory, trade and other receivables and cash at bank and in hand
respectively. This indicates that there is a very strong relationship between CP and inventory, CP
and trade and receivables and CP and cash at bank and in hand at Kenya Hotel Properties Ltd.
The regression equation for Kenya hotel properties Ltd is thus:-
CPi10 = 0.744+ 0.500INV + 0.083ACCREC-+0.749CASH + ε
This therefore means that, holding all other factors constant, the Commercial Papers outstanding
of Kenya Hotel Properties Ltd at time t=10, is -0.744. A unit increase in inventory will lead to a
0.500 increase in Commercial Papers outstanding; a unit increase in trade and other receivables
will lead to 0.083 increase in Commercial Paper outstanding while a unit increase in Cash at
bank and in hand will lead to a 0.749 increase in Commercial Papers outstanding of Kenya Hotel
Properties Ltd at time t=10. This therefore means that for Kenya Hotel Properties, the most
significant variable affecting CPit is Cash at bank and in hand, followed by inventory.

44
4.2.17 Regression results for East Africa industries (EAI) Ltd
Table 4. 17: Model Summary, ANOVA, Regression results of EAI
Model R R Square
Adjusted
R
Square
Std.
Error of
the
Estimate
Change Statistics
R
Square
Change
F
Change df1 df2
Sig. F
Change
1 1.000a
1.000 1.000 .00000 1.000 0 3 6 .000
Model Sum of Squares df
Mean
Square F Sig.
ANOVA Regression 10.750 3 3.583 . .a
Residual .000 0 .
Total 10.750 3
Model
Unstandardized
Coefficients
Standardized
Coefficients
t Sig. B
Std.
Error Beta
Coefficients (Constant) 3.246 .000 .506 .000
Inventory .500 .344 .413 .202 .000
Trade and
other
receivables
.647 .859 .000 -.368 1.000
Cash at
bank and
in hand
.749 .534 .661 .506 .000
a. Predictors: (Constant), Cash at bank and in hand, Trade and other receivables, Inventory
b. Dependent Variable: CP Outstanding
From table 4.17, the study explains 100% of commercial papers outstanding at EAI (Unilever).
This means that commercial papers outstanding at EAI (Unilever) are wholly explained by,
Inventory, trade and other receivables and cash at bank and in hand respectively. This indicates
that there is a very strong relationship between CP and WC components at EAI (Unilever) Ltd.
The regression equation for EAI (Unilever) Ltd was thus:-
CPi4 = 3.246+ 0.500INV + .647ACCREC+.749CASH + ε
This therefore means that, holding all other factors constant, the Commercial Papers outstanding
of EAI (Unilever) Ltd at time t=4, will be 3.246. A unit increase in inventory will lead to a .500

45
increase in Commercial Papers outstanding; a unit increase in trade and other receivables will
lead to a .647 increase in Commercial Paper outstanding while a unit increase in Cash at bank
and in hand will lead to a .749 increase in Commercial Papers outstanding of EAI (Unilever) Ltd
at time t=4. This therefore means that for EAI (Unilever), the most significant variable affecting
CPit is Cash at bank and in hand, followed by trade and other receivables.
4.2.18 Regression results for Pan Paper Mills Ltd
Table 4. 18: Model Summary, ANOVA, Regression results of Pan Paper Mills
Model R R Square
Adjusted
R
Square
Std.
Error of
the
Estimate
Change Statistics
R
Square
Change
F
Change df1 df2
Sig. F
Change
1 1.000a
1.000 1.000 .00000 1.000 0 3 6 .000
Model Sum of Squares df
Mean
Square F Sig.
ANOVA Regression 10.750 3 3.583 . .a
Residual .000 0 .
Total 10.750 3
Model
Unstandardized Coefficients
Standardized
Coefficients
t Sig. B Std.
Error Beta
Coefficients (Constant) 1.035 .000 1.985 0.082
Inventory .523 .000 .396 0.239 0.817
Trade and
other
receivables
.102 .000 .000 0.306 0.767
Cash at bank
and in hand
-.953 .000 .660 -
0.364 0.726
a. Predictors: (Constant), Cash at bank and in hand, Trade and other receivables, Inventory
b. Dependent Variable: CP Outstanding
From table 4.18, the study explains 100% of commercial papers outstanding at Pan Paper Mills.
This means that commercial papers outstanding at Pan Paper Mills Ltd are wholly explained by,
Inventory, trade and other receivables and cash at bank and in hand respectively. This indicates
that there is a very strong relationship between CP and inventory, CP and trade and receivables
and CP and cash at bank and in hand at Pan Paper Mills Ltd.
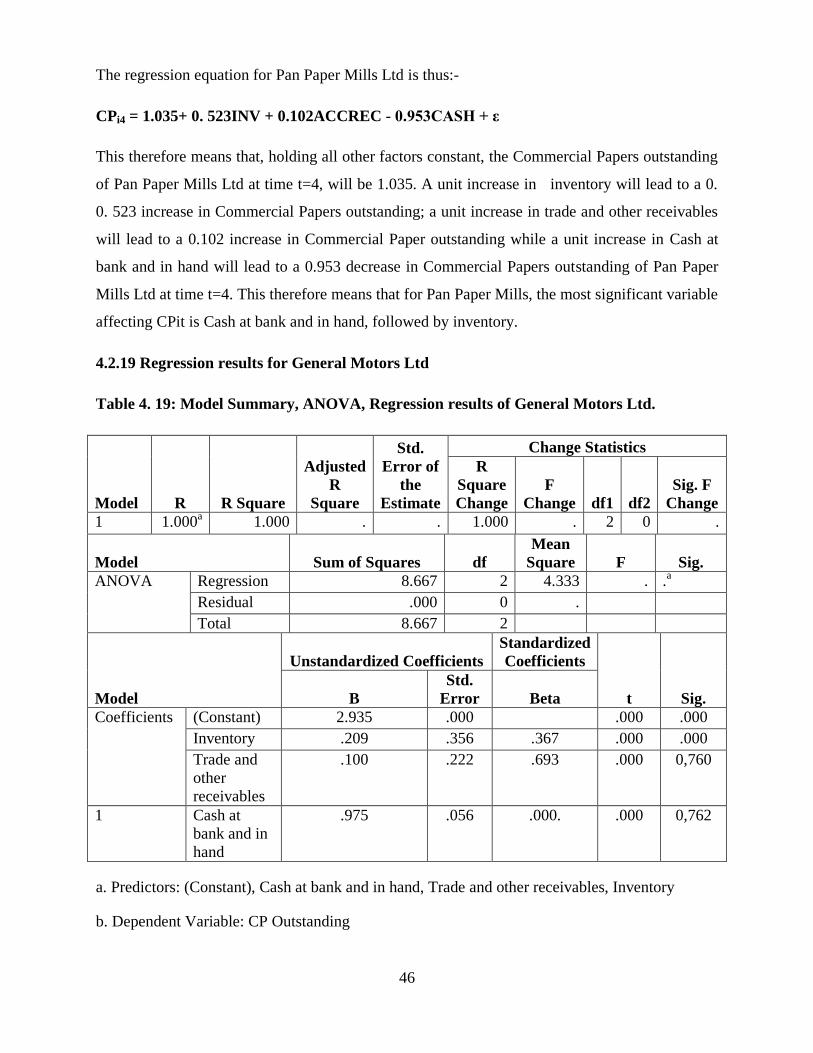
46
The regression equation for Pan Paper Mills Ltd is thus:-
CPi4 = 1.035+ 0. 523INV + 0.102ACCREC - 0.953CASH + ε
This therefore means that, holding all other factors constant, the Commercial Papers outstanding
of Pan Paper Mills Ltd at time t=4, will be 1.035. A unit increase in inventory will lead to a 0.
0. 523 increase in Commercial Papers outstanding; a unit increase in trade and other receivables
will lead to a 0.102 increase in Commercial Paper outstanding while a unit increase in Cash at
bank and in hand will lead to a 0.953 decrease in Commercial Papers outstanding of Pan Paper
Mills Ltd at time t=4. This therefore means that for Pan Paper Mills, the most significant variable
affecting CPit is Cash at bank and in hand, followed by inventory.
4.2.19 Regression results for General Motors Ltd
Table 4. 19: Model Summary, ANOVA, Regression results of General Motors Ltd.
Model R R Square
Adjusted
R
Square
Std.
Error of
the
Estimate
Change Statistics
R
Square
Change
F
Change df1 df2
Sig. F
Change
1 1.000a
1.000 . . 1.000 . 2 0 .
Model Sum of Squares df
Mean
Square F Sig.
ANOVA Regression 8.667 2 4.333 . .a
Residual .000 0 .
Total 8.667 2
Model
Unstandardized Coefficients
Standardized
Coefficients
t Sig. B
Std.
Error Beta
Coefficients (Constant) 2.935 .000 .000 .000
Inventory .209 .356 .367 .000 .000
Trade and
other
receivables
.100 .222 .693 .000 0,760
1 Cash at
bank and in
hand
.975 .056 .000. .000 0,762
a. Predictors: (Constant), Cash at bank and in hand, Trade and other receivables, Inventory
b. Dependent Variable: CP Outstanding

47
From table 4.19, the study explains 100% of commercial papers outstanding at General Motors.
This means that commercial papers outstanding at General Motors are wholly explained by,
Inventory, trade and other receivables and cash at bank and in hand respectively. This indicates
that there is a very strong relationship between CP and WC at General Motors Ltd.
The regression equation for General Motors Ltd was thus:-
CPi4 = 2.935+ .209INV + .100ACCREC+ .975CASH + ε
This therefore means that, holding all other factors constant, the Commercial Papers outstanding
of General Motors Ltd at time t=3, will be 2.935. A unit increase in inventory will lead to a .209
increase in Commercial Papers outstanding; a unit increase in trade and other receivables will
lead to a .100 increase in Commercial Paper outstanding while a unit increase in Cash at bank
and in hand will lead to a .975 increase in Commercial Papers outstanding of General Motors Ltd
at time t=3. This therefore means that for General Motors, the most significant variable affecting
CPit is Cash at bank and in hand, followed by inventory.
4.2.20 Regression results for Caltex Oil Ltd
Table 4. 20: Model Summary, ANOVA, Regression results of Caltex Oil
Model R R Square
Adjusted
R Square
Std. Error
of the
Estimate
1 1.000a
1.000 . .
Model Sum of Squares df
Mean
Square F Sig.
ANOVA Regression 10.667 2 5.333 . .a
Residual .000 0 .
Total 10.667 2
Model
Unstandardized Coefficients
Standardized
Coefficients
T Sig. B
Std.
Error Beta
Coefficients (Constant) 4.364 .000 4.765 1.985
Trade and other
receivables .765 6.765 7.765 3.76 0.239
Inventory .765 3.76 0,761 3.00 0.306
Cash at bank
and in hand -.648 2.648 3.648 3.76 -0.364
a. Predictors: (Constant), Cash at bank and in hand, Trade and other receivables, Inventory

48
b. Dependent Variable: CP Outstanding
From table 4.20, the study explains 100% of commercial papers outstanding at Caltex Oil. This
means that commercial papers outstanding at Caltex Oil Ltd are wholly explained by, Inventory,
trade and other receivables and cash at bank and in hand respectively. This indicates that there is
a very strong relationship between CP and WC components at Caltex Oil Ltd.
The regression equation for Caltex Oil Ltd was thus:-
CPi3 = 4.364+ .765INV + .765ACCREC- .648CASH + ε
This therefore means that, holding all other factors constant, the Commercial Papers outstanding
of Caltex Oil Ltd at time t=3, will be 4.364. A unit increase in inventory will lead to a .765
increase in Commercial Papers outstanding; a unit increase in trade and other receivables will
lead to a .765 increase in Commercial Paper outstanding while a unit increase in Cash at bank
and in hand will lead to a .648 decrease in Commercial Papers outstanding of Caltex Oil Ltd at
time t=3. This therefore means that for Caltex Oil, the most significant variables affecting CPit
are trade and other receivables and inventory.

49
4.2.21 Regression results for Industrial Promotion Services (IPS) Ltd
Table 4. 21: Model Summary, ANOVA, Regression results of Industrial Promotion
Services
Model R R Square
Adjusted
R
Square
Std.
Error of
the
Estimate
Change Statistics
R
Square
Change
F
Change df1 df2
Sig. F
Change
1 1.000a
1.000 1.000 .00000 1.000 0 3 6 .000
Model Sum of Squares df
Mean
Square F Sig.
ANOVA Regression 9.777 1 3.635 . .a
Residual 8.099 1 .
Total 3.465 2
Model
Unstandardized
Coefficients
Standardized
Coefficients
t Sig. B
Std.
Error Beta
Coefficients (Constant) 2.212 .000 .506 .000
Inventory 1.000 .344 .413 .202 .001
Trade and
other
receivables
.356 .859 .000 -.368 .006
Cash at
bank and
in hand
-.963 .534 .661 .506 .003
a. Predictors: (Constant), Cash at bank and in hand, Trade and other receivables, Inventory
b. Dependent Variable: CP Outstanding
From table 4.21, the study explains 100% of commercial papers outstanding at Industrial
Promotion Services (IPS) Ltd. This means that commercial papers outstanding at Industrial
Promotion Services (IPS) Ltd are wholly explained by, Inventory, trade and other receivables
and cash at bank and in hand respectively. This indicates that there is a very strong relationship
between CP and WC components at Industrial Promotion Services (IPS) Ltd.
The regression equation for Industrial Promotion Services (IPS) Ltd was thus:-
CPi2 = 2.212+ 1.000INV +.356ACCREC -.963CASH + ε

50
This therefore means that, holding all other factors constant, the Commercial Paper outstanding
of Industrial Promotion Services (IPS) Ltd at time t=2, will be 2.212. A unit increase in
inventory will lead to a unit increase in Commercial Paper outstanding; a unit increase in trade
and other receivables will lead to a 0.356 increase in Commercial Paper outstanding while a unit
increase in Cash at bank and in hand will lead to a .963 decrease in Commercial Paper
outstanding of Industrial Promotion Services (IPS) Ltd at time t=2. This therefore means that, the
most significant variable affecting CPit is inventory, followed by trade and other receivables.
4.2.22 Regression results for Agip Kenya Ltd
Table 4. 22; Model Summary, ANOVA, Regression results of Agip Kenya
Model R R Square
Adjusted
R
Square
Std.
Error of
the
Estimate
Change Statistics
R
Square
Change
F
Change df1 df2
Sig. F
Change
1 1.000a
1.000 1.000 .00000 1.000 .0 3 4 .0
Model Sum of Squares df
Mean
Square F Sig.
ANOVA Regression 23.2 3 7.167 .0 .0a
Residual .000 4 .000
Total 21.500 7
Model
Unstandardized Coefficients
Standardized
Coefficients
T Sig. B
Std.
Error Beta
Coefficients (Constant) 0.322 1.890 .0 .0
Inventory 0.265 .124 .396 .0 .0
Trade and
other
receivables
0.980 .001 .000 .0 .0
Cash at bank
and in hand
1.132 .034 .660 .0 .0
a. Predictors: (Constant), Cash at bank and in hand, Trade and other receivables, Inventory
b. Dependent Variable: CP Outstanding
From table 4.22, the study explains 100% of commercial papers outstanding at Agip Kenya. This
means that commercial papers outstanding at Agip Kenya are wholly explained by, Inventory,
trade and other receivables and cash at bank and in hand respectively. This indicates that there is
a very strong relationship between CP and WC components at Agip Kenya.

51
The regression equation for Agip Kenya was thus:-
CPi2 = 0.322+ 0.265INV +.980ACCREC +1.132CASH + ε
This therefore means that, holding all other factors constant, the Commercial Paper outstanding
of AGIP Kenya at time t=2, will be 0.322. A unit increase in inventory will lead to a 0.265
increase in Commercial Paper outstanding; a unit increase in trade and other receivables will lead
to a 0.980 increase in Commercial Paper outstanding while a unit increase in Cash at bank and in
hand will lead to a 1.132 increase in Commercial Paper outstanding of Agip Kenya at time t=2.
This therefore means that, the most significant variable affecting CPit is Cash at bank and in
hand, followed by trade and other receivables.
Table 4. 23; Summary of Regression Results.
COMPANIES INV. Interpretation ACCREC. Interpretation CASH. Interpretation
1 K P L C 0
Unit increase in
Inventory leads to
no change in CP.
0
Unit increase
in debtors
leads to no
change in CP.
-1.345
Unit increase in
cash leads to a
1.345 decrease
in CP.
2 Cooper Kenya
limited. 0.21
Unit increase in
inventory leads to
a 0.21 increase in
CP.
0.362
Unit increase
in debtors
leads to a
0.362 increase
in CP.
-0.977
Unit increase in
cash leads to a
0.977 decrease
in CP.
3 IPS 1
Unit increase in
inventory leads to
a single increase
in CP.
0.356
Unit increase
in debtors
leads to a
0.356 increase
in CP.
-0.963
Unit increase in
cash leads to a
0.963 decrease
in CP.
4 Athi River
Mining 0.47
Unit increase in
inventory leads to
a 0.47 increase in
CP.
0
Unit increase
in debtors
leads to no
change in CP.
-0.955
Unit increase in
cash leads to a
0.955 decrease
in CP.
5 Pan Africa Paper
Mills. 0.52
Unit increase in
inventory leads to
a 0.52 increase in
CP.
0.102
Unit increase
in debtors
leads to a
0.102 increase
in CP.
-0.953
Unit increase in
cash leads to a
0.953 decrease
in CP.
6 Mabati Rolling
Mills. 0.46
Unit increase in
inventory leads to
a 0.46 increase in
CP.
1.831
Unit increase
in debtors
leads to a
1.831 increase
in CP.
-0.845
Unit increase in
cash leads to a
0.845 decrease
in CP.

52
7 Kenya Oil
Company. 0.5
Unit increase in
inventory leads to
a 0.5 increase in
CP.
0
Unit increase
in debtors
leads to no
change in CP.
-0.833
Unit increase in
cash leads to a
0.833 decrease
in CP.
8 Ecta Kenya. 0.2
Unit increase in
inventory leads to
a 0.2 increase in
CP.
0.164
Unit increase
in debtors
leads to a
0.164 increase
in CP.
-0.745
Unit increase in
cash leads to a
0.745 decrease
in CP.
9 CMC holdings 0.46
Unit increase in
inventory leads to
a 0.46 increase in
CP.
0.141
Unit increase
in debtors
leads to a
0.141 increase
in CP.
-0.695
Unit increase in
cash leads to a
0.695 decrease
in CP.
10 Caltex Oil. 0.77
Unit increase in
inventory leads to
a 0.77 increase in
CP.
0.765
Unit increase
in debtors
leads to a
0.765 increase
in CP.
-0.648
Unit increase in
cash leads to a
0.648 decrease
in CP.
11 Express Kenya. 1.65
Unit increase in
debtors leads to a
0.362 increase in
CP.
0.988
Unit increase
in debtors
leads to a
0.988 increase
in CP.
-0.568
Unit increase in
cash leads to a
0.568 decrease
in CP.
12 Crown Berger
Limited. 0.4
Unit increase in
inventory leads to
a 0.4 increase in
CP.
0.08
Unit increase
in debtors
leads to a 0.08
increase in CP.
-0.268
Unit increase in
cash leads to a
0.268 decrease
in CP.
13 Nation Media
Group. 0.16
Unit increase in
inventory leads to
a 0.16 increase in
CP.
0.293
Unit increase
in debtors
leads to a
0.293 increase
in CP.
-0.037
Unit increase in
cash leads to a
0.037 decrease
in CP.
14 Total Kenya
Limited. 2
Unit increase in
debtors leads to a
double increase in
CP.
0
Unit increase
in debtors
leads to no
change in CP.
0
Unit increase in
cash leads to no
change in CP.
15 Synergy
Industrial 0.05
Unit increase in
inventory leads to
a 0.05 increase in
CP.
0.205
Unit increase
in debtors
leads to a
0.205 increase
in CP.
0.366
Unit increase in
cash leads to a
0.366 increase
in CP.
16 TPS Serena. 0
Unit increase in
Inventory leads to
no change in CP.
-0.111
Unit increase
in debtors
leads to a 0.11
decrease in
CP.
0.667
Unit increase in
cash leads to a
0.667 increase
in CP.
17 Kenya Hotel
Properties. 0.5
Unit increase in
inventory leads to
a 0.5 increase in CP.
0.083
Unit increase
in debtors
leads to a
0.083 increase
in CP.
0.749
Unit increase in
cash leads to a
0.749 increase in CP.

53
18 East Africa
Industries 0.5
Unit increase in
debtors leads to a
0.5 increase in
CP.
0.647
Unit increase in
debtors leads to a
0.647 increase in
CP.
0.749
Unit increase in
cash leads to a
0.749 increase in
CP.
19 Davis & Shirtliff
Limited. 0.5
Unit increase in
inventory leads to
a 0.5 increase in
CP.
-3.802
Unit increase
in debtors
leads to a 3.8
decrease in
CP.
0.833
Unit increase in
cash leads to a
0.833 increase
in CP.
20 Kenya Shell. 0.45
Unit increase in
inventory leads to
a 0.45 increase in
CP.
0.258
Unit increase
in debtors
leads to a
0.258 increase
in CP.
0.966
Unit increase in
cash leads to a
0.966 increase
in CP.
21 General Motors
Kenya. 0.21
Unit increase in
inventory leads to
a 0.21 increase in
CP.
0.1
Unit increase
in debtors
leads to a 0.1
increase in CP.
0.975
Unit increase in
cash leads to a
0.975 increase
in CP.
22 Agip Kenya. 0.27
Unit increase in
inventory leads to
a 0.27 increase in
CP.
0.98
Unit increase
in debtors
leads to a 0.98
increase in CP.
1.132
Unit increase in
cash leads to a
1.132 increase
in CP.
Table 4.23 shows that 13 out of the 22 firms studied have a negative relationship between CP
and Cash holding, this are KPLC,(with the highest change of -1.345 in CP amount outstanding
for a unit change in cash) Cooper Kenya, IPS, Athi river mining, Pan paper, Mabati rolling,
Kenol, Ecta, CMC, Caltex, Express Kenya, Crown Berger and Nation. This means as the level of
Cash holding decreases, these companies resort to commercial paper financing to enable them
meet their cash requirements.
The results also indicate that in 16 companies there is a positive relationship between CP and
accounts receivable. This means as the level of accounts receivable increase these companies
resort to commercial paper financing. KPLC, Athi river mining, Kenol and Total debt holding
have no influence on CP. Serena and D&s show a negative relationship between CP amounts
outstanding and a unit change in accounts receivable held.
The results also indicate that apart from KPLC and Serena which show no change in inventory
holding and CP. The results of 20 companies show that as the level of inventory holding
increase, there is a positive increase in CP amount outstanding which means commercial paper
financing is being used by companies to finance inventory accumulation as the level of business
increase.

54
Table 4. 24; Model Summary for the Companies.
COMPANIES R
R
Square
Adjuste
d R
Square
Standard
Error
1 Kenya Oil Company. 100% 100% 1 0
2 Athi River Mining 100% 100% 1 0
3 Total Kenya Limited. 100% 100% 1 0
4 Kenya Hotel Properties. 100% 100% 1 0
5 Ecta Kenya. 100% 100% 1 0
6 East Africa Industries 100% 100% 1 0
7 Pan Africa Paper Mills. 100% 100% 1 0
8 Davis & Shirtliff Limited. 100% 100% 1 0
9 Kenya Shell. 100% 100% 1 0
10 Agip Kenya. 100% 100% 1 0
11 IPS 100% 100% 1 0
12 Cooper Kenya limited. 100% 100% 0 0
13 General Motors Kenya. 100% 100% 0 0
14 Caltex Oil. 100% 100% 0 0
15 Mabati Rolling Mills. 100% 100% 0.161 0.478
16 K P L C 64% 41% 0 0
16 Express Kenya. 90% 88% 0.133 0.32
17 Synergy Industrial 81% 66% 0.423 0.866
18 Nation Media Group. 70% 49% 0.469 0.568
19 Crown Berger Limited. 62% 39% 0.161 0.478
20 TPS Serena. 59% 35% -0.296 0.609
21 CMC holdings 2% 4% -0.318 1.657
Table 4.24 shows that in 15 out of the 22 firms studied there is very strong relationship between
Commercial paper borrowings and the working capital components used in the study. These
firms showed a coefficient of determination of 100% meaning that variations in Commercial
paper borrowings in these companies are explained by changes in working capital components
used in the study – Inventory, accounts receivable and cash.
Companies with a coefficient of determination of less than 100% mean that their CP outstanding
amounts are explained by other factors other than Inventory, debtors and cash which were the
working capital components used in this study. The best example is CMC holding with a R

55
square of 4% which means their issues are not majorly influenced by the working capital
components used in this study.
Table 4. 25; Analysis of Variance (ANOVA) of Regression for the Companies.
COMPANIES Sum of Squares F
Statistic Sig.
Regression Residual Total
Davis & Shirtliff Ltd. 201.041 0.000 201.041 0.000 0.000
Athi River Mining 28.500 0.000 28.500 0.000 0.000
Ecta Kenya. 28.500 0.000 28.500 0.000 0.000
Nation Media Group. 26.958 27.758 54.716 20.880 0.000
Agip Kenya. 23.200 0.000 23.200 0.000 0.000
Kenya Hotel Properties. 22.900 0.000 22.900 0.000 0.000
Synergy Industrial 22.900 0.000 22.900 0.000 0.000
Kenya Oil Company. 21.500 0.000 21.500 0.000 0.000
Cooper Kenya limited. 17.714 0.000 17.714 0.000 0.000
East Africa Industries 10.750 0.000 10.750 0.000 0.000
Pan Africa Paper Mills. 10.750 0.000 10.750 0.000 0.000
Caltex Oil. 10.667 0.000 10.667 0.000 0.000
General Motors Kenya. 8.667 0.000 8.667 0.000 0.000
Kenya Shell. 6.000 0.000 6.000 0.000 0.000
Total Kenya Limited. 2.000 0.000 2.000 0.000 0.000
K P L C 26.958 27.758 54.716 20.880 0.000
IPS 9.777 8.099 17.876 0.000 0.000
Express Kenya. 11.534 11.534 23.068 52.400 0.007
Crown Berger Limited. 1.169 1.831 3.000 1.704 0.243
Mabati Rolling Mills. 1.169 1.219 2.388 1.704 0.243
TPS Serena. 0.603 1.111 1.714 0.543 0.686
CMC holdings 0.953 21.964 22.917 0.116 0.948
Table 4.25 above indicates that given the various regression models the sum of squares, is larger
than residual in 15 out of the 22 sampled firms. In these companies we can therefore conclude
that the model accounts for most of the variation on the dependent variable, which is
Commercial paper borrowings.
The study showed that in 17 out of the 22 sampled firms, the F statistic ranges from 0 to 1 with a
low f critical values hence we reject the null hypothesis that there is no relationship between
working capital components and CP borrowings.

56
4.3 Summary and Interpretation of Findings.
The researcher conducted a multiple linear regression analysis so as to determine the relationship
between CP and the independent variables; Inventory, Accounts receivable and Cash for the
number of years each company has been in the market since the first CP issue in 1994.The model
CPit = βo + β1 INV + β2 ACCREC+ β3 CASH + ε was applied in each of the sampled 22
companies.
In13 out of the 22 firms studie,the results revealed that there is a negative relationship between
CP and Cash holding,This therefore means that as the level of Cash holding decreases, these
companies resort to commercial paper financing to enable them meet their cash requirements.
The results also indicate that in 16 companies there is a positive relationship between CP and
accounts receivable.As the level of accounts receivable increase, these companies resort to
commercial paper financing.
The results of 20 companies show that as the level of inventory holding increase, there is a
positive increase in CP amount outstanding which means commercial paper financing is being
used by companies to finance inventory accumulation as the level of business increase.
The coefficient of determination (R square) measures the proportion of variability in a data set
that is accounted for by a statistical model. In 15 out of the 22 firms studied there is very strong
relationship between Commercial paper borrowings and the working capital components used in
the study. These firms showed a coefficient of determination of 100% meaning that variations in
Commercial paper borrowings in these companies are explained by changes in working capital
components used in the study – Inventory, accounts receivable and cash.Companies with a
coefficient of determination of less than 100% means that their CP outstanding amounts are
explained by other factors other than Inventory, debtors and cash which were the working capital
components used in this study.
Adjusted R squared attempts to correct R square to more closely reflect the goodness of fit of the
model in the population but since we used only one model for each of the companies, we can
only rely on R square.

57
Standard error is a measure of variability and as such measures the variability that a constant
would be expected to show. The results showed that for companies whose borrowings are wholly
explained by changes in WC components, this are the 15 companies with a coefficient of
determination of 100%, there is no variability. This is evidenced by these companies having a nil
standard error as shown in the summary table above. Companies whose borrowings are
influenced by other factors other than WC,this are the ones with a very low coefficient of
determination showed some level of variability in the model.
Analysis of variance (ANOVA) is a method of testing the null hypothesis that several group
means are equal in the population. This is done by comparing the sample variance estimated
from the group means to that estimated within the groups.
Sum of squares measures the variability of a data set. From the summary table above,the study
indicated that given the various regression models the sum of squares, is larger than residual in
15 out of the 22 sampled firms. In these companies we can therefore conclude that the model
accounts for most of the variation on the dependent variable, which is Commercial paper
borrowings.
The F statistic to measure if the regression model fits well. The study showed that in 17 out of
the 22 sampled firms, the F statistic ranges from 0 to 1 with a low f critical values hence we
reject the null hypothesis that there is no relationship between working capital components and
CP borrowings. This is confirmed by the low significance values in these companies which are
less than 0.005 meaning CP borrowings are influenced by variations in working capital
components.
The results concurs with studies by Calomiris et al. (1995) who concluded that commercial paper
is strongly correlated with variations in cash suggesting a causal link. Their study also showed
that increased commercial paper issuance is used to finance inventory accumulation and also CP
is strongly correlated with increases in accounts receivable.
Gorton and Pennacchi, (1990) who did a similar study concluded that firms with large
inventories and accounts receivable use the commercial paper market to give them greater
flexibility in their short-term financing. A similar study by Gertler and Gilchrist (1993) showed
that large firms show substantial increases in inventories and short-term debt around cyclical
peaks, suggesting that commercial paper is used to finance the movements of inventories.

58
CHAPTER FIVE
5.0. SUMMARY, CONCLUSIONS AND RECOMMENDATIONS
5.1. Summary
This section of the study provides a summary of findings of the study, conclusion, suggestions,
recommendations, limitations and suggestions for further research. The main objective of the
study was to establish the relationship between commercial paper financing and working capital
components in Kenya.
The casual research design was adopted for the study to explore the effect of independent
variable to dependent variables. Inventory, accounts receivable and cash were taken as the
independent variables. The dependent variable was Commercial paper outstanding. Population
comprised of the twenty seven companies that have issued CP since the first issue in 1994.
Secondary data collection method was used and data collected of twenty two companies that
have been in the market for more than two years. Source of data included NSE database, (CMA)
and Annual audited financial statements of these companies. Data collected were the financial
statistics which enabled the calculations of the variables used. Data was analyzed using SPSS
version 11. Cross-sectional time series fixed models were used with regression and correlation
analysis to determine the nature and strength of the relationship between the independent and
dependent variables.
The findings of this study were as follows; that in the majority of the companies there is a
negative relationship between CP and Cash holding and a positive relationship between CP and
Inventory and CP and accounts receivable. The coefficient of determination (R square) showed
that in a majority of the companies there is very strong relationship between Commercial paper
borrowings and working capital components. This means that variations in Commercial paper
borrowings in most companies that have issued the paper in Kenya are wholly explained by
changes in working capital and not by any other factors.

59
5.2. Conclusions
The study aimed to establish the relationship between commercial paper financing and working
capital components in Kenya. The casual research design was adopted for the study which
explores the effect of one variable on another. The key variables of the study were Commercial
paper, Inventory, Accounts receivable and Cash in hand and at bank. Commercial paper was the
dependent variable while Inventory, Accounts receivable and Cash were the Independent
variables.
Simple and multiple linear regression models were used to estimate the causal relationship
between CP and the chosen variables. Based on the regression and correlations analysis, the
study showed that there is a negative relationship between CP and the level of cash holding
meaning that as the level of Cash holding decrease, companies enter the commercial paper
market to enable them meet their cash requirements.
The study also revealed that there is a positive relationship between CP and Inventory and a
positive relationship also between CP and accounts receivable. This means commercial paper
financing is used by companies to finance these working capital components as their level of
business increase. This portrayed that Commercial paper borrowings in most companies that
have issued the paper in Kenya are wholly explained by changes in working capital and not by
any other factors.
The study expected a strong relationship between commercial paper borrowings and components
of working capital that are assets. From the above, it is seen that in all the cases, the effect of
commercial paper is directly related to working capital and because of the strong relationship;
the researcher concluded that there are no other factors that could have strong effect on the
dependent variable, commercial paper outstanding.

60
5.3. Policy Recommendations.
The firms financing strategy determines the capital structure of the firm. A business requires
different types of capital in order to operate. Working capital is often considered to be the most
significant types of capital. It is claimed that the amount of this can determine the success of the
company. Whenever a need of working capital arises due to the increasing level of business
activity financing arrangements should be sought quickly. It is very important for firms to
manage working capital efficiently. This is important from the point of view of both liquidity and
profitability. When there is a poor management of working capital, funds may be unnecessarily
tied up in idle assets. This will reduce liquidity of the company.
A finance manager devotes more time to working capital management than any other activity
because current assets by their nature are changing daily and managerial decisions must be made.
Questions relating to how much inventory is to be carried and whether there are funds to pay for
it are often asked. Unlike long term decisions there can be no deferrals of actions relating to
working capital. While long term decisions determine the success of the firm, short term
decisions on working capital determine whether firms get to the long term
From the findings of the study above, there is a direct relationship between Commercial paper
financing and components of working capital in some firms in Kenya. CP is cheap and cost
efficient and also its borrowing amounts can be adjusted very easily by issuing a new paper or
retiring it at maturity. It is therefore recommended for other companies as it can also be
particularly valuable for new investment where the exact funding needs are not known at the
inception of a project. It is also a recommended form of financing for companies as it assists in
managing increased working capital requirements while reducing costs of financing as a
company needs to be always properly financially resourced. CP financing also provide
flexibility by allowing firms facing un-certain funding needs to make borrowing decisions only
when their financing needs become known.
CP is also recommended as a substitute for other forms of corporate liquidity such as cash and
bank overdrafts, both of which could also be used to finance new investments and working
capital requirements at short notice or to finance investment until a cost-efficient bond issuance
size is reached. It‟s also recommended over cash holdings because financing costs are incurred

61
only in the event that financing is actually needed and are determined only by the actual amounts
that are borrowed.
5.4. Limitations of the Study
The companies that have issued CP since the first issue by Brooke bond in 1994 are only 27,
with the companies issuing decreasing in recent years. This limited the study as data used was
for earlier years in order to determine the relationship between the variables. Five companies that
have been in the market for only one year were excluded from the study.
The period of the study was not defined as the different companies have been in the market for
different periods. The study was thus done based on the number of years the company has been
in the market which made the analysis quite lengthy and time consuming.
The study relied on secondary data which were collected from Annual audited financial
statements of the companies, NSE database and CMA library. In as much as there are general
guiding principles for the preparations and reporting of the financial statements which are
Generally Accepted Accounting Principles and International Financial Reporting Standard, these
companies being in various types of activities use different accounting policies and therefore
reliability and quality of data was not 100%.
Twelve companies in the population were not listed, information from these companies was not
100% reliable as some shared the financial information verbally and were not ready to provide
hard copies of their accounts to the researcher for verification.

62
5.5. Suggestions for Further Studies.
The study showed in some companies CP is not limited to working capital financing alone as
there were no correlations between the variables. An avenue of further research will be finding
out the other uses of CP financing to show that CP is not limited to not only financing of short
term investments but also long term investment needs of companies.
A useful avenue for further research will be to find out if CP influences firms‟ investment
policies and financing decisions; how firms in Kenya choose between alternative sources of
funds to enhance their financial flexibility and if CP affects investment behavior of firms.
The objective of the study was to establish relationship between CP financing and working
capital in Kenya. Findings showed that there is a decrease in the number of companies raising
funds by way of CP. Further research can be done to find the reasons for the deterioration of the
market in Kenya despite the CP being a cheap source of financing or to find out whether there
are restrictions preventing companies from issuing CP in Kenya. Would issuers in Kenya prefer
having notes traded in the secondary market like NSE.
The study focused mainly on CP financing in relation to working capital in Kenya, this is more
on the use of CP funds, further research can be done to find out if there are similarities amongst
these companies that have issued CP with respect to size, industry and ownership. How effective
is CP in managing short term cash flow at a low cost. The cost of borrowing has a significant
impact on profitability of companies in the current challenging economic environment.
To come up with a classification of Kenyan investors on CP and what specific considerations
influence them to invest on CP as opposed to alternative investments. What factors influence
these companies to invest will be useful to managers as well as dealers. This will provide
information to the corporate sector about the specific considerations of dealers in deciding which
CP issue to place.

63
REFERENCES
Afza, T., and Nazir, M. S. (2007). “Working Capital Management Practices of Firms:
Empirical Evidence from Pakistan” in the Proceedings of 9th South Asian management
Brigham & Houston, J.F (2007).Fundamentals of Financial Management.
(10th
Edition) India:Saurabh.
Baumol, J.W (1952).”The Transactions Demand for Cash: An Inventory
Theoretical approach‟‟, Quarterly Journal of Economics, Vol 52, pp 545-546.
Block, S.B.and Hirt G.A. (1992).Foundation of Financial Reporting. (6th
Edition).Homewood,
Irvin.
Capital Markets Authority:‟ Guidelines for the Issue of Corporate Bonds and
Commercial Paper‟‟, April 1997 pp 9-11.
Calomiris, C. W., Himmelberg, C. P., and Wachtel, P. (1995).Commercial paper,
Corporate finance and the business cycle: A perspective, Carnegie-
Rochester Conference Series on Public Policy 42, 203-250.
Calomiris, C.W. and Hubbard, R.G., (1994). Internal Finance and Investment:
Evidence from the Undistributed Profits Tax of 1936-1937. NBER
Working Paper, 4288.
Carpenter, R.E., Fazzari, S.M., Petersen, B.C., (1994). Inventory (Dis)
Investment, Internal Finance Fluctuations, and the Business Cycle. Brookings Papers
on Economic Activity, 2:75 123.
Cooper, D.R. and Schindler, P.S. (2003).Business Research Methods (8th
Edition)
Irwin: McGraw Hill.

64
Diamond, D.W., (1991a). Debt Maturity Structure and Liquidity Risk.Quarterly Journal of
Economics, 106:709 38.
Downing, C. & Oliner S. (2007). The term structure of commercial paper
rates, Journal of Financial Economics 83, 59-86.
Eljelly, A.M.A (2004) “Liquidity Profitability Trade Off: An Empirical Investigation in
An Emerging Market‟‟.International Journal of Commerce and Management
Vol.14, pp.46-51.
Fazzari, S.M., and Petersen, B.C., (1993). Investment Smoothing with Working
Capital: New Evidence on Financing Constraints. Rand Journal of Economics,
24:328 42.
Faulkender, M. (2005). Hedging or Market Timing? Selecting the Interest Rate Exposure
of Corporate Debt, Journal of Finance 60, 931-962.
Fidelity Brokerage Services; Fidelity Investment Guidelines (2000) Edition.
Forum (SAMF) held on February 24-25, pp. 334-343, North South University,
Dhaka, Bangladesh.
Gertler, M. and Gilchrist, S., (1993). The Role of Credit Market Imperfections
in the Monetary Transmission Mechanism: Arguments and Evidence.
Scandinavian Journal of Economics, 95:43 64.
Gorton, G. and Pennacchi, G., (1990). Financial Intermediaries and Liquidity
Creation. Journal of Finance, 54: 49-72.

65
Gorton, Gary, and George Pennacchi, (1990). Financial Intermediaries and Liquidity
Creation, Journal of Finance 45, 49-71.
Graham, J. R., and Campbell R. H., (2001). The Theory and Practice of Corporate
Finance: Evidence from the Field, Journal of Financial Economics 60, 187-243.
Kashyap, A. K., Stein, J.C, & Wilcox, D.W. (1993). Monetary Policy and
Credit Conditions: Evidence from the Composition of External Finance, American
Economic Review 83, 78-98.
Kashyap, A., Lamont, O., and Stein, J., (1994). Credit Conditions and the
Cyclical Behaviour of Inventories. Quarterly Journal of Economics, 109: 565-92.
Keynes, J.M (1956). The treatise on money. London: John Wiley.
Kidwell, D.S., & Peterson, R.L (1990)‟‟Financial Instruments markets and money.‟‟
Dryden Press, USA 4th
Edition 1990.
Kinyua, H.W. (2006) An Investigation into the Factors hindering the Development
of Commercial Paper Market in Kenya. Unpublished MBA Project University
of Nairobi.
Leland, C. and Mitchell, A., (1994). The Effect of a Rating Downgrade on
Outstanding Commercial Paper. Journal of Finance, 49 (1): 39-56.
Matthias, k., Shivdasani, A & Wang, Y. (2008).Do Firms use Commercial Paper to
Enhance financial Flexibility.
Matthias, k., Shivdasani, A & Wang, Y. (2010).Why Do Firms Use Commercial Paper.
Miller, H.M., & Orr, D. (1996). A model of Demand for money by firms Quarterly Journal of

66
Economics vol 80 (3) pp 413 -435
Munywoki, J.M, (2000). The Factors affecting demand for Commercial Paper as a
Short term Source of Finance for Publicly Quoted Companies.
Unpublished MBAProject Kenyatta University.
Mugenda, O., & Mugenda, G. (2003) Research Methods: Quantitative and
Qualitative approaches. ACTS, Nairobi Kenya.
Nganga, A.K. (1999). Commercial Paper as a Source of Finance for Kenyan
Companies. Unpublished MBA Project, University of Nairobi.
Njogu, L.W, (2003). Price Impacts of Commercial Paper Announcements. A case
of quoted companies which have issued Commercial Paper in Kenya. Unpublished
MBA Project university of Nairobi.
Pandey, IM., (2008): Financial Management, 9th
Edition, Vikas Publishing House. New
Delhi.
Pandey, IM., (2010): Financial Management, 10th
Edition, Vikas Publishing House. New
Delhi.
Pedro, J., and Pedro M. (2007).‟‟Effects of Working Capital Management on
SME profitability‟‟, International Journal of Managerial Finance, 3(2), 164-177.
Petersen, M.A. and Rajan, R., (1994). The Benefits of Lending Relationships:
Evidence from Small Business Data. Journal of Finance, 49: 3-38.
Post, M. A. (1992). The Evolution of the U.S. Commercial Paper Market Since
1980, Federal Reserve Bulletin 78, 879-891.

67
Raheman A, Nasr M, (2007). „Working capital management and profitability – case of
Pakistani Firms. International Review of Business Research Papers, 3: 279-296.
Ross, Stephen A., Randolph W. Westerfield, and Jeffrey Jaffe, (2008). Corporate
Finance (McGraw-Hill/Irwin, New York, NY).
Saunders, M., Lewis, P., & Thornhill, A. (2009)‟‟Research Methods for Business
Students‟‟5th
Edition, Pearson Education Limited prentice Hall.
Trautena, A and Langerb, T., (2007). The benefits and obstacles of internet-based
Commercial Paper issuance in Europe – A survey.
Weinraub H. J., and Visscher S. (1998), “Industry Practice Relating to Aggressive
Conservative Working Capital Policies”, Journal of Financial and Strategic Decision,
Vol. 11, No. 2, pp. 11-18
Yasuda, A., (2005). Do Bank Relationships Affect the Firm's Underwriter Choice in
the Corporate-Bond Underwriting Market? Journal of Finance 60, 1259-1292., Financial

68
APPENDICES
Appendix I: companies which have issued CP.
POPULATION OF THE STUDY KEY
1 Crown Berger Limited. listed
2 Kenya Oil Company.(Kenol kobil)
3 Athi River Mining Company Limited. Not studied
4 TPS Serena.
5 Total Kenya Limited. Not listed
6 Kenya Power and Lighting Company Limited.
7 Nation Media Group.
8 Express Kenya.
9 CMC holdings
10 Kenya Hotel Properties.
11 Ecta Kenya.
12 Mabati Rolling Mills.
13 Cooper Kenya limited.
14 East Africa Industries (Unilever).
15 Pan Africa Paper Mills.(Pan papermills ltd)
16 Davis & Shirtliff Limited.
17 Kenya Shell.
18 Industrial Promotion Services.
19 Agip Kenya.
20 General Motors Kenya.
21 Synergy Industrial
22 Caltex Oil.
23 K REP Bank
24 Kenya Kazi Limited.
25 Brooke Bond.
26 Lonrho Motors.
27 Bidco Oil Company.

69
Appendix II: Analysis of companies that have issued CP by Years.
POPULATION OF
THE STUDY PERIOD
YEARS IN
THE
MARKET
Crown Berger Limited. 2000 to 2011 12
CMC Holdings. 1999 to 2010 12
Kenya Oil Company. 2001 to 2011 11
Ecta Kenya. 2000 to 2009 10
Kenya Hotel Properties. 2000 to 2009 10
Athi River Mining 1998 to 2000,2003,2005 to 2008 8
Cooper Kenya limited. 2004 to2010 7
TPS Serena. 1999 to 2003,2005 to 2006 7
Mabati Rolling Mills. 1997,1999 to 2003 6
East Africa Industries 1999 to 2002 4
Pan Africa Paper Mills. 2000 to 2003 4
Davis & Shirtliff 2008 to 2011 4
Synergy Industrial 2006 to 2009 3
Total Kenya Limited. 1999 to 2001 3
General Motors Kenya. 1999 to 2001 3
Kenya Shell. 1999 to 2001 3
Caltex Oil. 1999 to 2001 3
K P L C 1999 to 2000 2
IPS 1999 to 2000 2
Nation Media Group. 1998 and 2001 2
Agip Kenya. 1998 to 1999 2
Express Kenya. 1999 to 2000 2
Brooke Bond. 1994 1
Lonrho Motors. 1999 1
Bidco Oil Company. 1999 1
Kenya Kazi Limited. 2011 1
K Rep Bank 2008 1

70
Appendix III: Growth of commercial paper market.
YEAR CP OUTSTANDING AMOUNT (KSH Billions)
1997-9 11,600,000,000
2000 8,150,000,000
2001 7,550,000,000
2002 2,850,000,000
2003 2,900,000,000
2004 1,820,000,000
2005 1,640,000,000
2006 2,132,420,000
2007 2,939,780,000
2008 2,535,580,000
2009 2,131,980,000
2010 1,915,900,000
2011 1,094,755,492

71
Appendix IV: Data Collection Form.
Name of the Company-----------------------------------------------
Description Years
CP Outstanding
Inventory
Trade and other receivables
Cash at bank and in hand
Total Debt/Borrowings