relationship between bilirubin and auditory function …
TRANSCRIPT

RELATIONSHIP BETWEEN BILIRUBIN AND
AUDITORY FUNCTION IN PREMATURE NEONATES
BY
Gabriel Anne Bargen
Submitted to the graduate degree program in Audiology
and the Graduate Faculty of the University of Kansas
in partial fulfillment of the requirements for the degree of
Doctor of Philosophy.
Committee:
_______________________________
Chairperson
_______________________________
_______________________________
_______________________________
_______________________________
Date approved:_______________________

ii
The Dissertation Committee for Gabriel Anne Bargen certifies
that this is the approved version of the following dissertation:
RELATIONSHIP BETWEEN BILIRUBIN AND
AUDITORY FUNCTION IN PREMATURE NEONATES
Committee:
_______________________________
Chairperson
_______________________________
_______________________________
_______________________________
_______________________________
Date approved:_______________________

iii
To the four individuals that love me unconditionally,
Jason, Peyton and my parents

iv
ABSTRACT
Research has shown hyperbilirubinemia in preterm infants is more prevalent and its
course more protracted than in term neonates. High levels of bilirubin have been documented to
be toxic to the central nervous system and may cause neurological impairments in newborns.
Impairment of auditory function is the most consistent abnormality, especially in premature
infants. Hyperbilirubinemia is a risk factor for sensorineural hearing loss according the Joint
Committee on Infant Hearing. If premature infants are at a greater risk for hyperbilirubinemia it
can be assumed that they will be at a greater risk of having auditory dysfunction caused, or
contributed to, by hyperbilirubinemia.
Currently, national guidelines are needed which address when treatment options should
be considered and implemented regarding bilirubin levels in premature infants. The need for
these guidelines is a necessity, as preterm infants require much closer follow-up and more
aggressive therapy than full term infants. The objective for this research project was to
determine the relationship between bilirubin levels and auditory function in preterm infants. The
auditory brainstem response (ABR) and distortion product otoacoustic emission (DPOAE) tests
were prospectively investigated in premature infants while monitoring total serum bilirubin
(TSB) levels.
Ten subjects with a mean gestational age of 31.5 weeks participated in the study. The
mean peak TSB was 7.91 mg/dL. Based on the peak TSB to birth weight ratio all subjects were
assigned to the control group. Spearman’s correlation coefficient indicated no significant
correlation between peak TSB levels and auditory function. This study provided baseline data
for further research evaluating auditory function in preterm hyperbilirubinemic subjects.

v
TABLE OF CONTENTS
ABSTRACT ................................................................................................................................... iv
LIST OF TABLES ......................................................................................................................... vi
LIST OF FIGURES ...................................................................................................................... vii
CHAPTER 1 INTRODUCTION .....................................................................................................1
CHAPTER 2 REVIEW OF THE LITERATURE ...........................................................................6
CHAPTER 3 METHODS ..............................................................................................................37
CHAPTER 4 RESULTS ................................................................................................................46
CHAPTER 5 DISCUSSION ..........................................................................................................54
CHAPTER 6 CONCLUSIONS .....................................................................................................62
APPENDIX A TABLES ................................................................................................................63
APPENDIX B FIGURES ..............................................................................................................73
APPENDIX C HUMAN SUBJECTS COMMITTEE DOCUMENTATION ...............................85
APPENDIX D RAW DATA FIGURES AND TABLES ..............................................................89
REFERENCES ............................................................................................................................118
vi
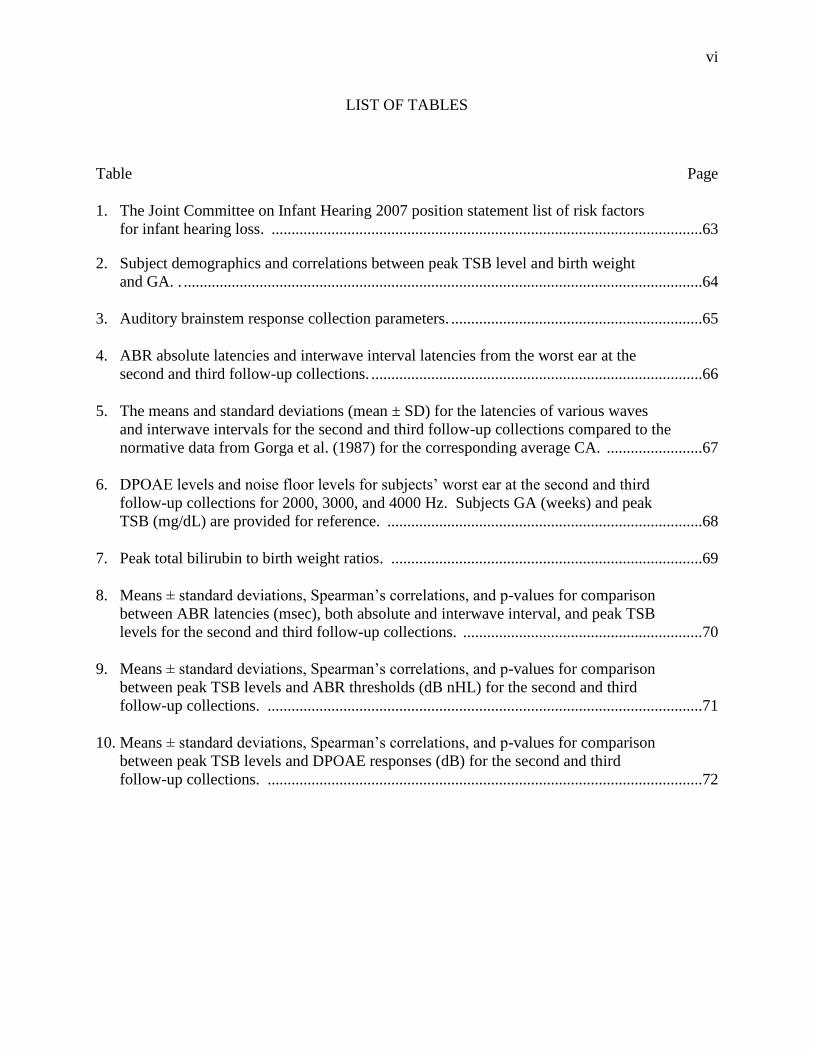
LIST OF TABLES
Table Page
1. The Joint Committee on Infant Hearing 2007 position statement list of risk factors
for infant hearing loss. ............................................................................................................63
2. Subject demographics and correlations between peak TSB level and birth weight
and GA. . ..................................................................................................................................64
3. Auditory brainstem response collection parameters. ...............................................................65
4. ABR absolute latencies and interwave interval latencies from the worst ear at the
second and third follow-up collections. ...................................................................................66
5. The means and standard deviations (mean ± SD) for the latencies of various waves
and interwave intervals for the second and third follow-up collections compared to the
normative data from Gorga et al. (1987) for the corresponding average CA. ........................67
6. DPOAE levels and noise floor levels for subjects’ worst ear at the second and third
follow-up collections for 2000, 3000, and 4000 Hz. Subjects GA (weeks) and peak
TSB (mg/dL) are provided for reference. ...............................................................................68
7. Peak total bilirubin to birth weight ratios. ..............................................................................69
8. Means ± standard deviations, Spearman’s correlations, and p-values for comparison
between ABR latencies (msec), both absolute and interwave interval, and peak TSB
levels for the second and third follow-up collections. ............................................................70
9. Means ± standard deviations, Spearman’s correlations, and p-values for comparison
between peak TSB levels and ABR thresholds (dB nHL) for the second and third
follow-up collections. .............................................................................................................71
10. Means ± standard deviations, Spearman’s correlations, and p-values for comparison
between peak TSB levels and DPOAE responses (dB) for the second and third
follow-up collections. .............................................................................................................72

vii
LIST OF FIGURES
Figure Page
1. Sample ABR waveforms from subject 1, a normal hearing infant, in response to a
click stimulus recorded during the second follow-up collection. ...........................................73
2. Sample ABR waveforms from subject 1, a normal hearing infant, in response to a
click stimulus recorded during the third follow-up collection. ...............................................74
3. Sample DP-gram recorded at the baseline collection from the right ear of subject 1. ...........75
4. Sample DP-gram recorded at the second follow-up collection from the right ear of
subject 1. .................................................................................................................................76
5. Scatter plot of peak TSB levels to birth weight ratio for all subjects. ....................................77
6. Scatter plots of peak TSB levels and ABR wave III latencies. ...............................................78
7. Scatter plots of peak TSB levels and ABR wave V latencies. ................................................79
8. Scatter plots of peak TSB levels and ABR interwave interval III-V latencies. ......................80
9. Scatter plots of peak TSB levels and ABR interwave interval I-V latencies. .........................81
10. Scatter plots of peak TSB levels and ABR thresholds. ...........................................................82
11. Scatter plots of peak TSB levels and DPOAE responses from the second follow-up
collection. ................................................................................................................................83
12. Scatter plots of peak TSB levels and DPOAE responses from the third follow-up
collection. ................................................................................................................................84

1
CHAPTER 1
INTRODUCTION
The Joint Committee on Infant Hearing (JCIH) (2007) identifies hyperbilirubinemia, at a
serum level requiring exchange transfusion, as a risk factor for progressive or delayed-onset
sensorineural hearing loss (SNHL). Impairment of auditory function is the most consistent
abnormality that is associated with permanent damage from hyperbilirubinemia, especially in
premature infants (Volpe, 2001). Over the past five decades, research has shown that
hyperbilirubinemia in pre-term infants is more prevalent, more severe, and its course more
protracted than in term neonates (Billings, Cole, & Lathe, 1954; Harris, 1961; Watchko, 2000).
Unfortunately, a reliable protocol for the consideration and initiation of treatment for
hyperbilirubinemia in premature neonates is lacking.
In 1994, the American Academy of Pediatrics (AAP) published practice parameters for
the management of hyperbilirubinemia in healthy term newborns. These parameters addressed
babies born at 37 weeks gestational age (GA) or more. Ten years later (AAP 2004), clinical
practice guidelines were extended to include newborn infants born at 35 weeks GA or later.
Neither the practice parameters from 1994 nor the clinical practice guidelines from 2004 address
the specific levels at which bilirubin becomes toxic to premature infants born prior to 35 weeks
GA. Currently, there are no nationally recognized guidelines for premature infants that address
the bilirubin levels at which treatment options should be considered and/or implemented.
Bilirubin can be evaluated by measuring total serum bilirubin (TSB), bilirubin/albumin
(B/A) ratio, and unbound bilirubin, with the gold standard being measurement of TSB. Several
researchers have made recommendations on guidelines for treatment intervention using varying

2
levels of TSB or other form of measuring bilirubin that address low-birth weight and premature
infants (Cashore, 2000; Newman & Maisels, 1992; Maisels, 1999; Maisels, 2001; Watchko,
2000). However, none of these suggestions has led to standards that are accepted nationally or
internationally. Institutions within the United States and around the world use different values
and measurements to decide when to initiate treatment for hyperbilirubinemia in the premature
population (Bhutani & Johnson, 2004; Gartner, Herrarias, & Sebring, 1998; Hansen, 1996;
Wennberg et al., 2006). The majority of health care providers for premature infants in the
United States have been using the AAP 1994 practice parameters for hyperbilirubinemia
management, the AAP 2004 clinical practice guidelines, and other suggestions from
hyperbilirubinemia research to determine the level of TSB to initiate treatment of
hyperbilirubinemia in the premature neonate population. The lack of guidelines for bilirubin
regarding when to intervene in premature neonates indicates the need for data to precisely define
sensitivity and specificity of either TSB or free bilirubin concentration in determining risk for
acute bilirubin neurotoxicity or chronic sequelae (kernicterus) (Wennberg et al., 2006). The need
for accurate bilirubin level guidelines for treatment implementation in premature infants is a
necessity (Bhutani & Johnson, 2004; Wennberg et al., 2006).
Several studies have shown that the primary site of lesion in the auditory system in the
presences of hyperbilirubinemia is in the central auditory pathways (Conlee & Shapiro, 1991;
Dublin, 1951; Gerrard, 1952; Kelemen, 1956; Oysu, Aslan, Ulubil, & Baserer, 2002; Shapiro &
Conlee, 1991; Shapiro & Hecox, 1988; Shapiro & Hecox, 1989). However, controversy
regarding the site of lesion stems from other studies that also have indicated damage to the
peripheral auditory structures at the level of the hair cells and the auditory (VIIIth) nerve (Chisin,
Perlman, & Sohmer, 1979; Kaga, Kitazumi, & Kodama, 1979; Matkin & Carhart, 1966;
3
Nakamura et al., 1985). Thus, the assessment of hearing function in this population should
include tests of both the peripheral and central auditory systems.
The auditory brainstem response (ABR) can be used with any infant, premature or full-
term, to determine if bilirubin is affecting auditory function. Multiple investigators have
reported that the ABR can vary as a function of bilirubin level and is a sensitive tool for
detecting bilirubin-induced auditory toxicity (Chisin et al., 1979; Funato, Tamai, Shimada, &
Nakamura, 1994; Kaga, Kitazumi, & Kodama, 1979; Nakamura, Takada, Shimabuku, Matsuo,
Matsuo, and Negishi, 1985; Perlman, Fainmesser, Sohmer, Tamari, Wax, & Pevsmer, 1983).
ABR measurements in infants born at or near term with TSB values of less than 20 mg/dl have
shown prolonged absolute latencies and interwave intervals, with documented reversible damage
to auditory function (Agrawal, Shukla, Misra, Kapoor, and Malik, 1998; Tan, Skurr, & Yip,
1992; Wong, Chen, & Wong, 2005). Non-reversible changes in auditory function in the form of
prolonged absolute latencies and interwave intervals, absent ABR and/or significantly elevated
ABR thresholds were found in children born at or near term with TSB values above 20 mg/dl
(Madden, Rutter, Hilbert, Greinwald, & Choo, 2002; Shapiro, Rosen, & Dixon, 2002).
Otoacoustic emission (OAE) testing is an objective indirect measure of cochlear outer
hair cell function. Similar to the ABR, OAEs can be measured in infants to assess auditory
function separating normal from impaired ears (Gorga, Neely, Bergman, Beauchaine, Kaminski,
Peters et al., 1993, 1997; Gorga, Norton, Sininger, Cone-Wesson, Folsom, Vohr et al., 2000;
Norton, Widen, Gorga, Folsom, Sininger, Cone-Wesson et al., 2000). Evoked OAEs are
byproducts of the normally functioning outer hair cells of the cochlea and they are pre-neural
(Prieve & Fitzgerald, 2002). OAEs are usually absent in ears with SNHL that exceed 30 to 50
dB HL. One type of evoked OAEs is distortion product otoacoustic emissions (DPOAEs).

4
DPOAEs are intermodulation distortion tones that the cochlea generates in response to a close
pair of stimulus tones with different frequencies, f1 and f2 (f2 > f1), and with levels, L1 and L2, that
may be equal or different (Lonsbury-Martin & Martin, 2007). DPOAEs have been used in
studies involving neonatal hyperbilirubinemia in attempts to clarify the main site of audiological
lesion (Oysu et al., 2002; Stein, Tremblay, Pasternak, Banerjee, Lindemann, & Kraus, 1996).
Stein et al. (1996) found DPOAEs to be present in seven of eight ears tested and ABR to be
abnormal in all ears tested in four pre-term infants with elevated bilirubin requiring phototherapy
and/or exchange transfusion. Oysu et al. (2002) found definite cochlear involvement based on
absent DPOAEs and ABRs in 26 of 30 subjects who had neonatal hyperbilirubinemia as a single
risk factor for SNHL according to their medical chart. The other four subjects had postsynaptic
auditory damage based on present DPOAEs with absent ABRs.
Using both ABR and DPOAEs to evaluate auditory function could assist with
determining where hyperbilirubinemia affects the auditory pathway. Additionally, multiple
researchers recommend dual evaluation with ABR and OAE in hyperbilirubinemic newborns to
ensure proper diagnosis (Oysu et al., 2002; Rhee, Park, and Jang, 1999; Stein et al., 1996).
Paradoxical findings, like those associated with auditory neuropathy (AN), lead to significant
risk of undiagnosed or misdiagnosed auditory dysfunction or inappropriate audiological
intervention if only ABR or OAE testing is used when completing auditory evaluation of
newborns with jaundice. Since the introduction of AN as a clinical entity by Starr, Picton,
Sininger, Hood, and Berlin in 1996, case studies of children with hyperbilirubinemia who
demonstrate audiological findings which support the definition of AN have been described in the
literature (Stein et al., 1996; Deltenre, Mansbach, Bozet, Clercx, & Hecox, 1997; Simmons &
Beauchaine, 2000). Research has found a correlation between hyperbilirubinemia and

5
prematurity indicating they are both significant risk factors for AN (Rance, Beer, Cone-Wesson,
Shepherd, Dowell, King et al., 1999; Madden et al., 2002). The dual use of ABR and OAE to
evaluate auditory function of hyperbilirubinemic newborns, especially with the premature
population, is a necessity and therefore both measurements were used for this study.
Given the lack of data related to TSB levels and auditory function in pre-term infants, the
long-term objective for this research project is to determine this relationship. Such information
can provide criteria for initiating intervention aimed at ameliorating the effects of high bilirubin
levels on auditory function in this population. The present study initiated this goal by
prospectively investigating premature infants 28 to 34 weeks GA admitted to the University of
Kansas Hospital NICU. Auditory function was evaluated using ABR and DPOAE testing while
monitoring TSB levels in an attempt to determine the level at which TSB begins to affect the
auditory system. The knowledge gained from monitoring auditory function and TSB levels over
time, in turn, can be used as a guide for initiating treatment to potentially prevent permanent
damage to auditory function associated with high TSB levels.
It is hypothesized that as peak TSB levels worsen the ABR will indicate an increase in
absolute latency of wave III and/or wave V and interwave latency of III-V and/or I-V in
premature neonates. It is also hypothesized that as peak TSB levels improve the ABR threshold
will improve in premature neonates. Finally, it is hypothesized that DPOAE responses will be
unaffected by the improvement or deterioration of peak TSB levels in premature neonates.

6
CHAPTER 2
REVIEW OF THE LITERATURE
The previous section summarized the general question this study addresses and stated the
hypotheses to be tested. This section expands that discussion and provides detailed information
about bilirubin and the relationship between hyperbilirubinemia, the auditory system, the
Auditory Brainstem Response (ABR), Otoacoustic Emissions (OAE), and how premature infants
differ from full-term infants with regard to hyperbilirubinemia. The relationship between
hyperbilirubinemia and auditory neuropathy/ dys-synchrony is also discussed.
Bilirubin
Bilirubin is produced from the break down of aged or dysfunctional red blood cells
(Hass, 1999). Under normal processes, red blood cells are broken down into heme and globin,
then heme is further broken down into iron and biliverdin. Biliverdin is reduced into
unconjugated bilirubin by the liver, spleen, and bone marrow and transported to the liver by
binding to albumin in the blood stream. Unconjugated bilirubin is lipid soluble, water insoluble,
and neurotoxic (Shapiro, 2003). Albumin releases the unconjugated bilirubin in the liver where
it is bound by the protein uridine diphosphoglucuronosyl transferase (UDPGT) to a water-
soluble, non-toxic glucuronide becoming conjugated bilirubin (also known as direct bilirubin)
which can be excreted in bile (Maisels, 1999; Hass, 1999; Shapiro, 2003).
Neonatal hyperbilirubinemia results from excessive production of bilirubin and the
limited ability to excrete it (Dennery, Seidman, & Stevenson, 2001; Hass, 1999; Kaplan, Muraca,
Hammerman, Rubaltelli, Vilei, Vreman et al., 2002; Maisels & Kring, 2006). Dennery et al.

7
(2001) and Shapiro (2003) report that newborn infants have several factors that increase their
risk of developing physiologic jaundice or high serum bilirubin concentrations in the first days of
life. First, unconjugated bilirubin is not readily excreted in newborn infants and the ability to
conjugate bilirubin is limited (Dennery et al., 2001). Infants, more so in the premature
population, have immature UDPGT which causes an increase in unconjugated bilirubin. Second,
newborn infants have red blood cells with a decreased life span causing an increase in
hemoglobin which produces bilirubin at a higher rate than adults (Brouillard, 1974, Shapiro,
2003). The immature UDPGT and increased hemoglobin are responsible for physiologic
jaundice of the neonate (Dennery et al., 2001; Shapiro, 2003).
Total serum bilirubin (TSB) is a combination of conjugated and unconjugated bilirubin,
which in neonates consists almost completely of unconjugated bilirubin (Shapiro, 2003). The
unconjugated bilirubin in neonates typically binds to protein, mainly albumin, in the blood and
once the blood binding capacity is exceeded, the unconjugated bilirubin enters the brain,
interstitial fluid, and cerebrospinal fluid by crossing over the blood-brain barrier (Bratlid, 1990;
Shapiro, 2003). Unconjugated or unbound bilirubin that readily crosses the blood-brain barrier
causes cellular injury by inhibiting mitochondrial enzymes and interfering with DNA synthesis
which induces DNA-strand breakage and inhibits protein synthesis and phosphorylation
(Chuniaud, Dcssantc, Chantoux, Blondeau, Francon, & Trivin, 1996). Bilirubin also inhibits the
uptake of tyrosine, a marker of synaptic transmission (Amato, Kilguss, Gelardi, & Cashore,
1994). Additionally, bilirubin has been found to inhibit the function of N-methyl-D-aspartate-
receptor ion channels which indicates bilirubin can interfere with neuroexcitatory signals and
impair nerve conduction specifically in the auditory nerve (Bratlid, 1990; Hoffmann, Zanelli,
Kubin, Mishra, & Delivoria-Papadopoulos, 1996).

8
Cellular damage from bilirubin can cause neuronal damage in the central nervous system
(CNS) when levels of bilirubin become pathologic, known as bilirubin encephalopathy or
kernicterus (AlOtaibi, Blaser, MacGregor, 2005; Amin, Ahlfors, Orlando, Dalzell, Merle, &
Guillet, 2001; Dennery et al., 2001; Shapiro & Nakamura, 2001). Kernicterus is specifically
yellow staining of the basal ganglia (Amin et al., 2001; Dennery et al., 2001; Hansen, 1994).
According to Dennery et al. (2001), normal levels of peak TSB are from 5 to 6 mg/dL. Once
levels reach 7 to 17 mg/dL, exaggerated physiologic jaundice or hyperbilirubinemia occurs and
at peak TSB levels above 17 mg/dL pathologic jaundice can be identified (Dennery et al., 2001).
Damage in the CNS includes pathologic lesions in the globus pallidus and subthalamic nucleus,
auditory and oculomotor brainstem nuclei, cerebellum, and hippocampus (Dublin, 1951; Ahdab-
Barmada & Moossy, 1984; Shapiro, 2003). The corresponding sequelae of excessive neonatal
hyperbilirubinemia or kernicterus comprise a tetrad including athetoid cerebral palsy,
dysfunction of the auditory system, impairment of upward gaze (hypotonia oculomotor
disturbances), and dental enamel hypoplasia of primary teeth (Shapiro & Nakamura, 2001).
Further detail of how hyperbilirubinemia damages the auditory system is provided later in this
chapter.
Treatment of Hyperbilirubinemia
Current interventions make the severe sequelae of hyperbilirubinemia rare (Maisels &
McDonagh, 2008). Exchange transfusions and phototherapy are the staples of intervention for
the jaundiced newborn. The goal of therapy, regardless of technique used, is to lower the
concentration of circulating bilirubin or keep it from increasing (Maisels & McDonagh, 2008).

9
Pharmacologic treatment options have been used and are described along with exchange
transfusion and phototherapy in the following section.
Exchange Transfusion
Exchange transfusion was used to treat severe hyperbilirubinemia beginning in the 1940s
(Allen, Diamond, & Watrous, 1949; Allen, Diamond, & Vaughan, 1950; Diamond, 1948;
Diamond, Allen, & Thomas, 1951). The technique rapidly eliminates bilirubin and circulating
antibodies that can increase bilirubin from circulation by removing blood from the infant and
replacing it with similar amounts of red blood cells and plasma (Dennery et al., 2001). Dennery
and colleagues (2001) reported that the procedure is repeated until twice the blood volume has
been replaced.
Many complications of exchange transfusions have been reported, including
thrombocytopenia, portalvein thrombosis, necrotizing enterocolitis, electrolyte imbalance, graft-
versus-host disease, apnea, bradycardia, cyanosis, vasospasm, hypoxic-ischemic encephalopathy,
acquired immunodeficiency syndrome, and infection (Jackson, 1997; Keenan, Novak,
Sutherland, Bryla, & Fetterly, 1985; Lauer, Githens, Hayward, Conrad, Yanagihara, & Tubergen,
1982; Maisels & Newman, 1995; Wallgren, & Faxelius, 1974; Watchko, 2000). Death
associated with exchange transfusion has been reported in approximately 3 in 1000 procedures
(Hovi & Siimes, 1985; Jackson, 1997; Keenan, Novak, Sutherland, Bryla, & Fetterly, 1985).
Because of these complications and the improvement of phototherapy, which is a less invasive
treatment, the use of exchange transfusion has decreased (Gartner, Herrarias, & Sebring, 1998;
Maisels, 2001). The decrease in the frequency with which exchange transfusions are used to
treat hyperbilirubinemia includes its use with infants with birth weights less than 1500 grams.

10
O’Shea, Dillard, Klinepeter, & Goldstein, (1992) found only two infants underwent exchange
transfusion in a cohort of 833 infants weighing less than 1500 grams at birth born in North
Carolina between 1985 and 1989. Maisels (2001) reported no exchange transfusions were
performed in 1213 live births of infants weighing less than 1500 grams between 1988 and 1997
at William Beaumont hospital in Michigan.
Watchko and Claassen (1994) completed a retrospective review of postmortem and
clinical records to determine the current prevalence of kernicterus. They also examined the
relationship between the occurrence of kernicterus and the infants “at risk” status for exchange
transfusion criteria. The records of 81 infants who were less than 34 weeks GA were reviewed.
All the study infants received phototherapy and four received exchange transfusions.
Kernicterus was observed in 3 of the infants with peak TSB levels of 26 mg/dL, 11.3 mg/dL, and
18.5 mg/dL. Of the other 78 subjects, peak TSB levels ranged from 3.6 to 22.5 mg/dL and only
three were treated with exchange transfusion. Watchko and Claassen (1994) stated that even
when TSB levels rise above those previously thought to place the infant at risk, kernicterus is
unlikely to occur.
Guidelines for the use of exchange transfusion vary depending on GA, birth weight, and
medical condition of the infant. Pearlman, Gartner, Lee, Morecki, & Horoupian (1978)
published a set of widely used exchange transfusion criteria based on birth weight and serum
bilirubin concentration (mg/dL) as criteria for exchange transfusion. Based on Pearlman et al.
data, for full-term neonates with no other health concerns, exchange transfusion is recommended
at TSB concentrations between 25 and 29 mg/dL (Newman & Maisels, 1992). The AAP
published clinical practice guidelines in 2004 for the management of hyperbilirubinemia in
newborn infants of 35 or more weeks GA. This document based the need for exchange

11
transfusion on Ahlfors’ (1994) study using a bilirubin/albumin (B/A) ratio. According to Ahlfors
(1994), exchange transfusion is recommended for infants of 35 or more weeks GA with no other
health concerns at a B/A ratio of 7.2 mg/dL.
The guidelines for consideration and initiation of treatment with exchange transfusion
vary as previously indicated. Additionally, these guidelines do not include pre-term infants.
Physicians use unverified research on pre-term infants and estimate from the full-term infant
guidelines to determine if exchange transfusion is needed when treating hyperbilirubinemic
premature infants. Research based guidelines are needed in order to determine if exchange
transfusion is the best course of treatment for pre-term infants especially given the complications
associated with to use of this treatment.
Phototherapy
Phototherapy has been used to treat hyperbilirubinemia since its introduction in 1958 by
Cremer, Perryman, & Richards. Phototherapy uses light energy to change the shape and
structure of bilirubin, converting it to molecules that can be excreted even when normal
conjugation is deficient (Lightner & McDonagh, 1984). There is no standardized method for
delivering phototherapy according to the AAP (2004). Commonly used phototherapy units
contain daylight, cool white, blue or “special blue” fluorescent tubes, tungsten-halogen lamps, or
high-intensity gallium nitride light-emitting diodes and can be delivered via free-standing lamps
or as part of a radiant warming device (AAP, 2004; Dennery et al., 2001; Seidman, Moise,
Ergaz, Laor, Vreman, Stevenson et al., 2000; Vreman, Wong, Stevenson, Route, Reader, Fejer et
al., 1998). According to Dennery et al. (2001), fluorescent white light is the most common form
of phototherapy.

12
The spectral irradiance or dose delivered to the infant depends on the distance of the light
source from the infant and the power of the light (Maisels, 1996; Lucey, Ferriero, & Hewitt,
1968). According to Maisels (1996) and Lucey et al. (1968), the lights should be placed as close
to the infant as possible. The infant should also have as much skin exposed as possible to allow
exposure of maximum surface area (Dennery et al., 2001). Phototherapy can be provided above
and below the infant to increase exposure (Garg, Prasad, & Hifzi, 1995; Tan, 1991).
Many experts have provided guidelines for the use of phototherapy based on birth weight,
GA, and different measurements of bilirubin (i.e., TSB vs B/A ratio) (Ahlfors, 1994; Ives, 1999;
Maisels, 1999). According to the AAP (1994), phototherapy is generally recommended for an
infant of 35 or more weeks GA with no other health concerns at 25 to 48 hours of life if the total
bilirubin concentration reaches 15 mg/dL; 18 mg/dL at 49 to 72 hours; and 20 mg/dL at 72 hours
or more.
Hulzebos, Van Imhoff, Bos, Ahlfors, Verkade, and Dijk (2008) published standard risk
and high risk TSB level treatment thresholds for infants based on birth weight. The treatment
thresholds were adapted from Ahlfors (1994) and Maisels & Watchko (2003) data regarding
criteria for exchange transfusion in low birth weight newborns with elevated bilirubin. Hulzebos
et al. (2008) based the treatment thresholds on infants with a GA less than 32 weeks who did not
have chromosomal or syndromal abnormalities. The phototherapy treatment thresholds of TSB
(μmol/L) and B/A ratio (μmol/g) for groups based on birth weight developed by Hulzebos et al.
(2008) were used in this study to assign subjects into the control group (standard risk) or the
study group (increased risk).
Bhutani et al. (1999) looked at the hour-specific TSB levels of 2840 healthy term or near-
term infants to determine the accuracy of TSB levels prior to discharge as a predictor of

13
developing hyperbilirubinemia. Near term was defined by birth weight ≥2000 grams for GA ≥36
weeks or birth weight ≥2500 grams for ≥35 weeks GA (Bhutani et al., 1999). Bhutani et al.
charted TSB as a function of age in hours when the bilirubin test was completed and assigned the
data to four risk zones ranging from high to low risk. Infants falling above the 95th
percentile
were considered to be in the High Risk Zone. They found 68 of the 172 term or near-term
infants that were designated to the High Risk Zone continued to have subsequent significant
hyperbilirubinemia (Bhutani et al., 1999). When compared to the 1994 AAP guidelines, these
findings correlated well with the TSB levels at which treatment options should be considered and
implemented at ≤24 hours and at ≥48 hours of age. Bhutani et al. did place the time frame
between 24 to 48 hours at a greater risk at lower TSB levels than the AAP guidelines.
Phototherapy guidelines, including those recommended by the AAP, are not based on
large prospective studies and may not apply to all infants (Dennery et al., 2001). The AAP
(2004) specifically states that the guidelines are based on limited evidence and the levels used
are approximations. The concentration and duration of exposure at which bilirubin is neurotoxic
are not known and estimations cannot be generalized to all infants (Dennery et al., 2001).
Premature infants, those who are sick, and those who have hemolytic disease are at greater risk
for neurotoxic effects and the subsequent development of kernicterus (Billings, Cole, & Lathe,
1954; Gartner, Snyder, Chaban, & Bernstein, 1970; Maisels & Watchko, 2003; Watchko &
Claassen, 1994).
Pharmacologic Therapy
Various metalloporphyrins, including Sn-mesoporphyrin (SnMP), a potent inhibitor of
heme oxygenase, have been successfully used to decrease the production of bilirubin in neonates

14
(Reddy, Naundaswamy, Mehta, Petrova, & Hegyi, 2003; Martinez, Garcia, Otheguy,
Drummond, & Kappas, 2001). Suresh, Martin, and Soll (2003) reported metalloporphyrins act
by competitively inhibiting the enzyme microsomal heme oxygenase, the rate limiting enzyme in
the catabolism of heme to bilirubin. In this manner, metalloporphyrins decrease the production of
bilirubin. This is in contrast to all other current methods of therapy for unconjugated
hyperbilirubinemia, which act by increasing the excretion of bilirubin after it is formed (Suresh,
Martin, & Soll, 2003).
Reddy et al., (2003) reported on a case involving a 32 GA pre-term infant with severe
hyperbilirubinemia. After 10 hours of intense phototherapy, levels of bilirubin remained high
and based upon existing guidelines from Maisels (1999) an exchange transfusion was necessary.
However, the blood type needed for the transfusion was not readily available so, once United
States Food and Drug Administration (FDA) approval was received they substituted the use of
exchange transfusion with a single injection of SnMP. The TSB levels reduced 10 hours after
the SnMP injection and TSB levels did not elevate again. This case demonstrated a single-dose
of SnMP avoids the need for an exchange transfusion (Reddy et al., 2003).
Martinez et al. (2001) completed a clinical trial with healthy neonates with GA between
38 to 41 weeks investigating the effect of SnMP. They found that the administration of a single
dose of SnMP at the time when hyperbilirubinemia is becoming severe (15 to 18 mg/dL) entirely
eliminated the need for phototherapy in the SnMP-treated group. No side effects were observed
and the SnMP-treated group also had a significantly reduced length of time they were under
clinical care for hyperbilirubinemia compared to the control group (Martinez et al., 2001).
Tin-mesoporphyrin and other metalloporphyrin drugs are not approved by the US FDA
for treatment of hyperbilirubinemia (AAP, 2004). Suresh, Martin, and Soll (2003) reported

15
further studies evaluating safety and efficacy of metalloporphyrins are necessary before
pharmacologic treatment of hyperbilirubinemia can be considered for routine use. They point
out that larger sample sizes in controlled randomized trials are needed to rule out an increased
risk of adverse events with SnMP and similar metalloporphyrin treatments. Additionally, the
authors report the need for identification of reliable risk factors for severe hyperbilirubinemia
and kernicterus in order to target high-risk neonates (Suresh, Martin, & Soll, 2003).
Initiation of Treatment for Hyperbilirubinemia
Methods currently used to measure bilirubin levels are not precise. Laboratory
measurement of direct bilirubin values can vary widely between laboratories (AAP, 2004).
Additionally, published normative values for TSB levels have a wide variance (AAP, 1994).
Different suggestions using varying levels of TSB or other forms of measuring bilirubin in
infants are used in the United States and globally (Bhutani & Johnson, 2004; Gartner, Herrarias,
& Sebring, 1998; Hansen, 1996; Wennberg, Ahlfors, Bhutani, Johnson, & Shapiro, 2006). As
recently as 2006, Wennberg et al. reported there are insufficient published data to precisely
define sensitivity and specificity of either TSB or free bilirubin concentration in determining risk
for acute bilirubin neurotoxicity or chronic sequelae (kernicterus). As indicated by the studies
reviewed in this section, national guidelines for the premature population do not exist that
address bilirubin levels at which treatment options should be considered and/or implemented.
The need for accurate bilirubin level guidelines for treatment implementation in full-term infants,
let alone premature infants, are a necessity (Bhutani & Johnson, 2004; Wennberg et al., 2006).

16
Hyperbilirubinemia in Premature Neonates
Kernicterus often occurs at lower bilirubin concentrations in premature newborns as
compared with term newborns (Watchko & Maisels, 2003). Gartner et al. (1970) reported nine
of fourteen very low birth weight, premature infants studied post mortem had signs of
kernicterus with peak TSB levels of 9.4 to 15.6 mg/dL which is below the TSB levels where
exchange transfusion is recommended (>20 mg/dL) for term infants (AAP, 1994). van de Bor,
van Zeben-van der Aa, Verloove-Vanhorick, Brand, and Ruys (1989) investigated the
relationship between maximal TSB concentration and neurodevelopmental outcome in infants
born prematurely at the corrected age of two years. Of 831 children, the mean peak TSB level
was 10.4 mg/dL with a range of 2-3 to 20.2 mg/dL. The mean peak TSB level for children with
normal neurodevelopment was 10.3 mg/dL while the mean peak TSB level for those with a
minor handicap was 10.7 mg/dL and for those with major handicap was 11.4 mg/dL (van de Bor
et al., 1989). Similar to Gartner et al., these levels found by van de Bor et al. are clearly below
the AAP (1994) exchange transfusion level recommendations.
Research has been completed to evaluate the diagnosis of kernicterus in premature infants
with low levels of bilirubin. Ahdab-Barmada and Moossy (1984) completed a seven year
retrospective study evaluating the brain at autopsy of premature infants who were diagnosed with
kernicterus to clarify the differences in interpretation of yellow staining. Yellow staining of
nuclei of the CNS is one identifier used to confirm kernicterus postmortem. Yellow staining of
the CNS nuclei occurred in premature infants at lower TSB levels than in full term infants which
Ahdab-Barmada and Moossy (1984) reported was a major diagnostic problem. Kernicterus
occurred in 97 of 630 (15.4%) autopsied neonates and the level of peak TSB decreased as GA
decreased (Ahdab-Barmada & Moossy, 1984). The authors found more pronounced yellow

17
discoloration of brain stem cranial nerve nuclei in the premature group and limited staining of
cerebellar dentate nuclei and medullary olivary nuclei at lower levels of TSB in premature
infants younger than 29 weeks GA (Ahdab-Barmada & Moossy, 1984).
Watchko and Maisels (2003) reported the major cause of damage from
hyperbilirubinemia at lower TSB levels were exaggerated neonatal red blood cells, hepatic, and
gastrointestinal immaturity in premature infants when compared to full term infants. Turkel,
Miller, Guttenberg, Moynes, and Hodgman (1982) evaluated the clinical and pathologic
implications of kernicterus by comparing the histologic changes in the brains of 64 infants whose
clinical histories had previously been compared. They found, on autopsy, physical findings of
bilirubin staining associated with kernicterus were found more frequently than when compared to
the clinical diagnosis of kernicterus prior to death. Essentially, kernicterus could be diagnosed
postmortem despite the infant not having the clinical diagnosis of kernicterus prior to death.
Turkel et al. (1982) reported that postmortem diagnosis of kernicterus in infants that have low
levels of bilirubin may be due to nonspecific microscopic damage causing kernicterus to
potentially be over diagnosed postmortem in this population.
Low-birth weight infants are more vulnerable than term infants to bilirubin-mediated
CNS injury (Cashore, 2000). Cashore (2000) reported the postnatal maturation of hepatic
bilirubin uptake and conjugation may be slower in premature infants due to accelerated red cell
breakdown and lingering hepatic immaturity. With the increasing survival of infants born
prematurely, it is difficult to specify what circulating concentrations of indirect bilirubin are too
high. Because of this, no single recommendation may serve the needs of all nurseries and their
low-birth weight patients. Cashore (2000) stated the established protocols giving weight-related
criteria for exchange transfusion in pre-term infants have been informally modified to include

18
weight-related criteria for the early initiation of phototherapy. These weight-related standards
for treatment by either phototherapy or exchange transfusion have not been validated according
to Cashore (2000). Criteria based on bilirubin, birth weight and gestation have not been
established for extremely low-birth weight infants or infants who are premature (Cashore, 2000).
Cashore (2000) provided recommendations for phototherapy and exchange transfusion for
premature infants of low-birth weight but these are not nationally accepted.
Institutional variations in the levels of bilirubin at which phototherapy and exchange
transfusions are initiated in jaundiced premature newborns indicate that the current management
of hyperbilirubinemia in pre-term infants is not evidence-based (Hansen, 1996; AAP, 1994).
Amin, Ahlfors, Orlando, Dalzell, Merle, and Guillet (2001) studied pre-term infants to determine
if bilirubin-albumin (B:A) molar ratio (MR) and unbound bilirubin (UB) are useful in predicting
bilirubin encephalopathy compared to the gold standard TSB measurement. Amin et al. (2001)
used ABR on 5 of the first 7 days of life to assess the 126 infants for bilirubin encephalopathy.
This study found UB to be a more sensitive predictor of bilirubin-induced auditory toxicity as
evaluated by ABR changes than either B:A MR or TSB levels in pre-term newborns (Amin et al.,
2001). Their findings were similar to Nakamura et al. (1985) study findings and to a study
completed by Cashore and Oh (1982).
Bhutani and Johnson (2004) reported TSB concentrations were known to be poor
predictors of bilirubin toxicity in the sick or pre-term infant. They reported a more appropriate
predictor of neurotoxicity for this population to be a measure of unbound or “free” bilirubin, but
no such tests had been validated or were widely used at the time the article was written. Instead,
Bhutani and Johnson (2004) stated lower TSB thresholds for intervention in infants in NICUs are
commonly used as defined by neonatologists in the field.

19
Measuring Auditory Function in the Presence of Hyperbilirubinemia
Both ABR and OAE measurements have been used to assess auditory function in
individuals with hyperbilirubinemia. The use of both evaluation tools along with other objective
and subjective tests can assist with determining the site of lesion in the auditory pathway. The
section below reviews ABR and OAE testing and the studies that have used these methods to
evaluate hyperbilirubin and auditory function of neonates.
ABR
The ABR is a series of scalp-recorded electrical potentials generated in the auditory nerve
and brainstem during the first 10 to 20 msec after onset of a transient stimulus (Møller, 1994).
The ABR tracing is a series of peaks and troughs representing far-field synchronous activity of
the auditory nerve and auditory brainstem pathway (Stegeman, Van Oosterom, & Colon, 1987).
ABR testing goes beyond the cochlea of the inner ear and assesses the lower auditory pathways.
Generator sites for the various ABR components have been suggested by several studies. Wave I
is generated in the distal portion of the nerve within the cochlea; wave II is generated in the
proximal portion of the nerve, most likely at the junction between the nerve and the brainstem;
wave III is generated within the cochlear nucleus, either from neuronal elements or from VIIIth
nerve fibers within the structure (Møller, 1994). Møller, Jho, Yokota, and Jannetta (1995) found
indications from ABR latency studies that wave IV is generated by structures close to the
midline at the level of the superior olivary complex in the brainstem. Møller, Jannetta, and Jho
(1994) suggested wave V may be generated by the lateral lemniscus as it leaves the cochlear
nucleus.

20
The major measures of the ABR are the latency and amplitude of its peaks, and the
differences (i.e., interwave intervals) between peaks I-III, III-V, and I-V (Don & Kwong, 2002).
In addition, the threshold of the ABR is a good predictor for the behavioral threshold of hearing
(Sininger & Cone-Wesson, 2002; Sininger, 1993). Given that the majority of previous research
regarding ABR and hyperbilirubinemia utilizes latency and threshold measurements, this study
also utilized latency and threshold. Therefore amplitude, although an important ABR
measurement as indicated by previous ABR research, is not defined by this paper.
ABR peak latency is the time after stimulus onset that a given peak occurs (Don &
Kwong, 2002). Latencies are used clinically as they are robust measures which are nearly
unaffected by variations in electrode placement (Don & Kwong, 2002). ABR peak latencies are
affected by the age of the patient and the level of stimulation (Don & Kwong, 2002;
Ballachanda, Crawford, Ferraro, & Griffiths, 2004). As age increases from infant to adult peak
latencies decrease (shorten) and as stimulus level increases peak latencies decrease (shorten).
Essentially, the latencies of the ABR waveform components are longer in neonates compared
with adults (Arnold, 2000; Ballachanda et al., 2004).
Premature infants will have even more prolonged ABR component latencies compared to
full term infants and adults (Arnold, 2000; Ballachanda et al., 2004). Amin, Orlando, Dalzell,
Merle, and Guillet (1999) determined morphological changes in ABRs during the first postnatal
week of life in premature infants ≤32 weeks GA. They found the frequency of detection of
waves improves over the first week of life. Additionally, absolute wave latencies and interwave
intervals progressively decreased during the first postnatal week (Amin, 1999).
Gorga, Reiland, Beauchaine, Worthington, and Jesteadt (1987) evaluated ABR
recordings from 585 babies having presumably normal hearing who graduated from a NICU.

21
The study group had conceptional ages (GA plus chronological age) from 33 weeks to 44 weeks.
They found latencies, both absolute and interwave intervals, decreased as conceptional age
increased. Rotteveel, de Graaf, Colon, Stegeman, and Yisco (1987) evaluated ABR recordings
from 65 pre-term infants with conceptional ages from 25 weeks to 52 weeks. Similar to Gorga et
al. (1987), they found latencies, both absolute and interwave intervals, decreased as conceptional
age increased. Given the findings of these studies, ABR latencies for premature population
should be compared to an appropriate set of age-dependent norms based on conceptional age.
The lowest level at which repeatable components of the ABR waveform can be detected
provides information about the threshold of hearing (Arnold, 2000; Sininger & Cone-Wesson,
2002). The threshold of the ABR is a good predictor for hearing threshold as the threshold
correlates with the threshold of hearing sensitivity. Specifically, the click threshold reportedly
correlates best with hearing sensitivity between 1 and 4 kHz (Hyde, 1985; Jerger & Mauldin,
1978). According to Arnold (2000), normal hearing individuals along with those with
conductive hearing loss have a click threshold approximately 10- to 20-dB higher than the best
audiometric threshold. Those individuals with cochlear losses may have a difference of only 5
dB above the best behavioral threshold (Arnold, 2000).
ABR and Hyperbilirubinemia
The ABR has been proposed as an objective tool to evaluate acute bilirubin
encephalopathy not only because it is technically feasible to use at the bedside but also because
the auditory system is probably the most sensitive neural system to clinically-evident bilirubin
injury (Johnston, Angara, Baumal, Hawke, Johnson, Keet et al., 1967; Chisin et al., 1979; Volpe,
2001). Multiple investigators have reported the use of ABR as a sensitive measure for detecting

22
bilirubin-induced auditory toxicity and have shown ABR to vary as a function of bilirubin
(Chisin et al., 1979; Funato, Tamai, Shimada, & Nakamura, 1994; Kaga, Kitazumi, & Kodama,
1979; Nakamura et al., 1985; Perlman, Fainmesser, Sohmer, Tamari, Wax, & Pevsmer, 1983).
ABR measurements in children born at or near term with TSB values of less than 20
mg/dl have shown prolonged latencies, with documented reversible damage to auditory function
(Agrawal, Shukla, Misra, Kapoor, and Malik, 1998; Tan, Skurr, & Yip, 1992; Wong, Chen, &
Wong, 2005). Non-reversible changes in auditory function in the form of significantly elevated
ABR thresholds were found in children born at or near term with TSB values above 20 mg/dl
(Madden, Rutter, Hilbert, Greinwald, & Choo, 2002; Shapiro, Rosen, & Dixon, 2002).
Perlman et al. (1983) evaluated pathophysiologic changes in the auditory pathway during
the period of hyperbilirubinemia in term infants by recording ABR when TSB levels were
elevated and when TSB levels were reduced following treatment. They found a significant loss
of waves IV and V and the ABR interwave intervals I-III and III-IV/V to be significantly
prolonged in infants with increased bilirubin levels. Additionally, of 13 jaundiced subjects that
had repeated recordings over a period of several days, nine showed apparent improvement in the
ABR recordings with appearance of waves that were initially absent or by shortening of initially
prolonged latencies. The changes noted in the loss of waves IV and V and the prolonged
latencies indicated abnormal lower and upper brainstem functioning. As the subjects were free
of pathologic processes other than hyperbilirubinemia, Perlman et al. state it is probable that the
observed abnormal brainstem function was due to an acute toxic encephalopathy caused by the
bilirubin. As the ABRs showed improvement when the TSB levels decreased back to a level of
standard risk this statement was reinforced.

23
Tan, Skurr, and Yip (1992) assessed changes in ABR before, during and after
phototherapy in 30 full-term hyperbilirubinemic neonates. Study subjects had significantly
prolonged latency of wave V and interwave intervals III-V and I-V prior to and during
phototherapy when compared to a control group. The differences in the latencies were not
significant between the groups after phototherapy treatment was completed. Findings from this
study supported previous research reporting phototherapy effectively reduces TSB values and by
doing so reverses the effects of bilirubin on the ABR.
Vohr, Kapr, O-Dea, Darrow, Coll, Lester et al. (1990) evaluated 50 full-term infants with
moderate hyperbilirubinemia (TSB of 10 to 20 mg/dL) and found the latency of brainstem
auditory evoked responses was longer in infants with moderate TSB levels than in those with
low TSB levels. They found the ABR abnormality to be more pronounced in infants with higher
bilirubin concentrations.
When recording ABRs in neonates with hyperbilirubinemia the measurements that appear
to have the most clinical relevance according to previous research are absolute latency of wave V
and the interwave intervals III-V and I-V. The ABR latency difference in the premature
population needs to be considered when evaluating ABR recordings in the presence of
hyperbilirubinemia. It may be difficult to determine if latency differences between control group
and study group subjects are due to conceptional age or effects from increased bilirubin. To
elevate this problem, subjects from the same conceptional age groups should be compared based
on the findings by Gorga et al. (1987) and Rotteveel et al. (1987).

24
DPOAEs
Kemp first described OAEs in 1978 as sounds generated in the inner ear that can be
recorded in the ear canal. OAEs are believed to be the byproducts of the preneural mechanisms
of the cochlear amplifier and to be linked to the normal functioning of the outer hair cells of the
cochlea (Oysu et. al., 2002; Prieve & Fitzgerald, 2002). OAE testing is an objective indirect
measure of cochlear function. OAEs are usually reduced in level or absent in ears with SNHL
that exceed 30 to 50 dB HL (Gorga, Neely, Bergman, Beauchaine, Kaminski, Peters et al.,
1993b; Gorga, Neely, Ohlrich, Hoover, Redner, & Peters, 1997; Gorga, Norton, Sininger, Cone-
Wesson, Folsom, Vohr et al., 2000; Kemp, 1978; Prieve & Fitzgerald, 2002; Robinette, 1992;
Stevens, 1988).
DPOAEs are intermodulation distortion products that undergo reverse transduction
through the middle ear and are converted to acoustic energy that can be measured in the ear canal
(Prieve & Fitzgerald, 2002). DPOAEs are a result of the nonlinear behaviors of the cochlea.
The intermodulation distortion tones are generated by the cochlea in response to a close pair of
stimulus tones. The stimulus tones have frequencies of the primaries, f1 and f2 (f2 > f1), and have
levels of the primaries, L1 and L2, that may be equal or different (Lonsbury-Martin & Martin,
2007). DPOAEs occur at predictable frequencies that are mathematically related to the
frequencies of the primaries which make them measurable using a narrowband filtering centered
at the frequency of interest (Prieve & Fitzgerald, 2002).
Several studies have investigated the accuracy of DPOAEs to separate normal from
impaired ears (Gorga et al., 1993b, 1997; Gorga, Norton, Sininger, Cone-Wesson, Folson, Vohr
et al., 2000; Norton, Widen, Gorga, Folsom, Sininger, Cone-Wesson et al., 2000). These studies
suggested DPOAEs accurately identify auditory status for middle and high frequencies, most

25
accurately from 2 to 4 kHz, but perform more poorly as the frequency decreases due to problems
with noise below 2 kHz. DPOAEs perform well in the presence of minimal low frequency
environmental noise (Prieve & Fitzgerald, 2002). DPOAE testing should be completed while
patients are quiet or sleeping to reduce environmental noise.
Differences in DPOAEs have been found between the ears of full-term and premature
infants. Smurzynski, Jung, Lafreniere, Kim, Kamath, Rowe et al. (1993) reported that
approximately 20% of pre-term infant ears had OAEs greater than the 90th
percentiles of full-
term newborns, mostly in the 2.8- to 4-kHz region. Again in 1994, Smurzynski found pre-term
infant ears to be greater than the 90th percentile of the full-term normal range in the 2.8- and 5.6-
kHz bands (31%) and in the 4.0-kHz region (69%). Smurzynski et al. (1993) and Smurzynski
(1994) also found the DPOAE level in premature infants to increase as the conceptional age
increases especially in the 2.8 and 4.0 kHz bands. Smurzynski (1994) reported based on
previous research by Keefe, Bulen, Arehart, and Burns (1993) that developmental changes
occurring in the external and middle ear influence the signal transfer from the probe inserted in
the ear canal to the cochlea take part in this age effected growth of the DPOAE level.
Abdala, Oba, and Ramanathan (2008) described and defined changes in the pre-term
infant DP-gram through the first 6 months of postnatal life in order to provide normative
guidelines to monitor infant hearing status. Abdala et al. (2008) found the infant DPOAE
amplitude to be larger than adult at all ages tested which was similar to the findings of Brown
(2000) and Smurzynski (1994). Abdala et al. (2008) found that baseline DPOAE levels of
premature neonates are lower than those observed one month later by 3 to 5 dB. The DPOAE
level increased during the pre-term period as a function of conceptional age. Infants born after a
term-birth did not show this increase in DPOAE with age. Keefe and Abdala (2007) evaluated

26
the enlarged DPOAE input/output functions found in newborns to six months of age by looking
at forward and reverse transfer function of the immature ear canal and middle ear components.
They found DPOAE levels were larger in infants primarily due to the reverse middle ear
transmittance level varied with ear canal area. This differed between term infants and adults by
more than a factor of seven.
OAEs and Hyperbilirubinemia
OAE tests have been used in studies involving neonatal hyperbilirubinemia to attempt to
clarify the main site of lesion in the auditory pathway. Additionally, OAE tests have been used
in research of neonates with hyperbilirubinemia to assess the tools reliability in the presences of
bilirubin. Rhee et al. (1999) used transient evoked OAEs to clarify the auditory pathway lesion
site and to test the reliability of transient evoked OAEs (TEOAEs) in hearing screening of
hyperbilirubinemic neonates. The results found the site of lesion in the auditory pathway caused
by hyperbilirubinemia to be retrocochlear with the cochlea remaining intact. The authors
suggested the TEOAEs to have limitations in evaluation of hearing in the neonates with
hyperbilirubinemia as all eleven subjects passed the TEOAE screen but four had abnormal
results with ABR thresholds above 40 dB nHL. Stein, Tremblay, Pasternak, Banerjee,
Lindemann, and Kraus (1996) found hyperbilirubin to be a common characteristic in four
patients they evaluated who were diagnosed with AN (present OAEs and absent or abnormal
ABR). All four had elevated bilirubin levels warranting phototherapy treatment and one subject
had an exchange transfusion. OAEs were found to be present indicating normal function of the
cochlea and site of lesion to be retrocochlear. Stein et al. (1996) found DPOAEs to be present in
seven of eight ears tested and ABR to be abnormal in all ears tested in four pre-term infants with

27
elevated bilirubin requiring phototherapy and/or exchange transfusion. Oysu and colleagues
(2002) used DPOAEs and ABR to determine the incidence of cochlear impairment in a large
group of patients with hyperbilirubinemia as a single risk factor for auditory dysfunction. They
found four of 30 patients (13%) to have DPOAEs within the normal range in the presence of
absent ABR waveforms and the rest of the patients to have definite cochlear involvement based
on absent DPOAEs. Oysu et al. reported using only OAE testing or only ABR testing when
completing auditory screening of newborns with jaundice carries a significant risk of
undiagnosed or misdiagnosed auditory dysfunction or recommendation of inappropriate use of
hearing aids. They recommended dual screening with ABR and OAE testing in
hyperbilirubinemic newborns.
Auditory Damage from Hyperbilirubinemia
Impairment of auditory function is the most consistent abnormality that is associated with
chronic post-kernicteric bilirubin encephalopathy, especially in premature infants (Volpe, 2001).
Shapiro, Bhutani and Johnson (2006) reported seeing hyperbilirubinemia patients with impaired
auditory function without athetosis or an associated movement disorder, the other problems
associated with hyperbilirubinemia.
The nature and location of hearing loss contributed to by neonatal hyperbilirubinemia
remain controversial and in most cases is not obvious (Billings & Kenna, 1999; Chisin et al.,
1979; Oysu et al., 2002). This problem may relate to the comorbidity of hearing loss risk factors.
Current research summarized in the following section points to different levels of the peripheral
and central auditory pathways as the site of impairment. Use of the ABR in conjunction with
OAE testing may help to define the site of impairment in infants with elevated TSB.
28
Animal Studies
Studies measuring ABRs on hyperbilirubinemic jj Gunn rats with deficient liver enzymes
found functional abnormalities of the CNS (Shapiro & Hecox, 1988; Shapiro & Hecox, 1989).
The ABRs of these hyperbilirubinemic jj Gun rats show prolongation of interwave intervals and
the loss of all waves in severely affected animals similar to human studies (Conlee & Shapiro,
1991; Shapiro & Conlee, 1991; Shapiro & Hecox, 1988; Shapiro & Hecox, 1989). Shapiro and
Nakamura (2001) completed autopsies of the hyperbilirubinemic jj Gunn rats and found damage
to the auditory system which correlates with the known sites of bilirubin damage in the auditory
brainstem pathways of humans specifically the brainstem ventral cochlear nucleus, lateral
superior olivary nuclei, superior paraolivary nuclei, lateral lemnisci, the trapezoid bodies, and the
cell bodies of the auditory nerve in the spiral ganglia of the cochlea. The inner ears of these
animals were normal even with severely abnormal or absent ABRs (Shapiro & Nakamura, 2001).
In 1993, Shapiro also reported ABR abnormalities found in hyperbilirubinemic jj Gunn rats have
improved post treatment, similar to human studies.
Human Studies
Dublin (1951) was first to document that the main site of pathology in the presence of
hyperbilirubinemia in humans is in the central auditory pathways. Autopsy studies by
Haymaker, Margles, and Pentschew (1961), Dublin (1951), and Dublin (1976) of infants with
classic kernicterus and one by Ahdab-Barmada and Moossy (1984) of premature infants who had
low-bilirubin kernicterus showed central auditory pathology involving the brainstem auditory
structures. Damaged brainstem auditory structures included dorsal and ventral cochlear nuclei,
superior olivary complex and nuclei of the lateral lemniscus and inferior colliculus. Dublin

29
(1951) specifically noted the absence of significant abnormalities of the VIIIth nerve. Additional
autopsy studies by Gerrard (1952) and Kelemen (1956) found no significant abnormalities of the
inner ear structures.
Matkin and Carhart (1966) completed an audiological study on 22 subjects from eight to
ten years of age who had a diagnosis of neonatal jaundice due to Rh incompatibility. The battery
of audiological tests administered included conventional pure-tone threshold audiometry,
monaural bifrequency loudness balancing test, short increment sensitivity index (SISI) test, the
tone decay test, and the simultaneous binaural median-plane localization test to attempt to find
the site of the auditory lesion. Results indicated lesions in the cochlear nuclei based on subjects
not achieving binaural fusion during the simultaneous median-plane localization task. Responses
from nineteen subjects suggested cochlear lesions on at least three of the tests completed.
Additionally, the authors propose dual dysfunctions of the auditory system in both the cochlea
and the central auditory pathways, but the existence of the central lesion might not be apparent or
appeared as cochlear lesions due to the type of stimulus used by investigators (Matkin & Carhart,
1966).
Chisin et al. (1979) attempted to localize the auditory system lesion using conventional
pure-tone threshold audiometry, ABR, and electrophysiological test measuring cochlear
microphonic potential (CM). Thirteen patients with histories of neonatal hyperbilirubinemia and
a positive diagnosis of sensorineural hearing loss took part in this study. Nine of the subjects had
absent ABR and present CM. Results found functional evidence of auditory nerve damage with
normal functioning hair cells in patients with hearing loss following neonatal hyperbilirubinemia
(Chisin et al., 1979).

30
Nakamura et al. (1985) recorded ABR measurement before and after treatment to
investigate the effects of bilirubin concentration in hyperbilirubinemic term infants. They found
the absolute latencies of wave I and V to be prolonged in the study group and to improve
following exchange transfusion; however, the interwave latencies did not change after treatment
and the latencies were not significantly different between the control infants and
hyperbilirubinemic infants. Nakamura et al. (1985) stated the lack of difference of the interwave
latency of wave I-V between the groups indicated the auditory pathology to be outside the
brainstem in either the cochlea or auditory nerve.
Kaga, Kitazumi, and Kodama (1979) evaluated ABRs and behavioral audiometry of 25
infants with kernicterus to determine the level of the lesion causing their hearing disorder. They
reported 88% had ABR threshold elevation compared to age-matched normal subjects showed
ABR abnormalities associated with peripheral hearing loss and 84% of these had behavioral
threshold elevation. Abnormalities in the ABR included wave V threshold elevation, prolonged
latency of wave I and V, and the absence of ABRs (Kaga et al., 1979). The authors stated that
their results indicated at least some lesions which produce hearing disorders in kernicterus occur
in the cochlea or auditory nerve.
Rhee, Park, and Jang (1999) evaluated auditory function of eleven patients with severe
hyperbilirubinemia (mean peak TSB 29.2 ± 3.1 mg/dL) following exchange transfusion every
three months up to one year by measuring TEOAEs and ABR threshold. TEOAEs were found to
be normal in all patients while ABR responses were abnormal or absent in four patients. Of the
four patients with abnormal ABRs, two showed improvement in auditory function, evident in
improved ABR threshold responses at follow up tests. Rhee et al. (1999) found the
hyperbilirubinemia-induced auditory dysfunction site of lesion to be retrocochlear.

31
Sheykholeslami and Kaga (2000) evaluated three patients with confirmed hearing loss
using ABRs, OAEs, and traditional audiometry in attempts to localize the pathologic changes in
auditory function in individuals who were diagnosed with severe hyperbilirubinemia as neonates.
Their findings suggested some lesions which produced hearing loss in severe hyperbilirubinemia
were in the cochlea, specifically the outer hair cells. As the peak TSB levels of the three patients
were 16.2 mg/dL, 17.4 mg/dL, and 19 mg/dL, the authors also concluded that moderate elevation
of TSB levels (<20 mg/dL) may contribute to the development of sensorineural hearing loss
(Sheykholeslami & Kaga, 2000). This study is the only study I found to indicate damage to the
outer hair cells from hyperbilirubinemia but it does add speculation to the auditory site of lesion
from hyperbilirubinemia.
Oysu et al. (2002) attempted to determine the amount of cochlear involvement in 30
subjects (mean ± SD age of 32 ± 9.3 months) who had severe hyperbilirubinemia (mean ± SD
peak TSB level of 24.4 ± 8.8 mg/dL in the neonatal period) as a single risk factor for
sensorineural hearing loss from a group of 1,032 pediatric patients. Audiological tests performed
for this study were otoscopy, tympanometry, DPOAEs and ABR. Results of this study indicated
four subjects to have purely postsynaptic deafness with present DPOAEs and no measureable
ABR waveforms. The other 26 cases showed obvious cochlear impairment documented by
absent DPOAEs. The authors noted that based on the definition of auditory neuropathy (AN)
being present OAEs and absent ABRs with poor speech discrimination, a diagnosis of AN is
possible for the four patients with present OAEs and abnormal ABRs (Oysu et al., 2002).
The majority of research points to hyperbilirubinemia causing central auditory pathway
lesion(s). However, with the introduction of AN, it has caused auditory researchers to speculate

32
on the loci of damage given the present OAEs and absent or abnormal ABR results in individuals
with kernicterus. In the next section AN and hyperbilirubinemia is discussed further.
Auditory Neuropathy and Hyperbilirubinemia
The term auditory neuropathy (AN) was introduced in 1996 by Starr, Picton, Sininger,
Hood, and Berlin. AN has been described as abnormal or absent ABR with normal outer hair
cell function as tested by cochlear microphonic responses or OAE (Starr et al., 1996; Stein et al.,
1996; Shapiro & Nakamura, 2001; Madden et al., 2002). Starr et al. (1996) indicated AN could
be at the level of the inner hair cells, the synapse between inner hair cells and VIII nerve fibers,
the ganglion neurons, the nerve fibers or any combination of the above. Based on the finding of
normal otoacoustic emissions, the outer hair cells in the cochlea are presumed to be normal (Starr
et al., 1996). Individuals with SNHL will typically have absent OAEs with absent ABR or
elevated ABR threshold and prolonged latencies. However, in the presence of neural pathway
damage or AN, outer hair cell function in the cochlea may be normal as indicated by present
OAEs and an abnormal or absent ABR will indicate damage to the inner hair cells or the neural
pathways beyond the inner hair cells (Shapiro & Nakamura, 2001).
AN was often observed in individuals with peak TSB values over 20 mg/dl (Shapiro &
Nakamura, 2001; Shapiro, et al., 2002; Shapiro & Daymond, 2003). Shapiro & Nakamura
(2001) reported frequent observation (33-50%) of hyperbilirubinemia in children diagnosed with
AN. Case studies of children with hyperbilirubinemia who demonstrate audiological findings
which support the definition of AN have been described in the literature (Stein et al., 1996;
Deltenre, Mansbach, Bozet, Clercx, & Hecox, 1997; Simmons & Beauchaine, 2000). Similarly,
studies of children diagnosed with AN and not having hyperbilirubinemia have also been

33
described (Buchman, Roush, Teagle, Brown, Zdanski, & Grose, 2006). Buchman et al. (2006)
state AN is a generic diagnostic term that describes any condition in which gross discrepancy
exists between measures of cochlear and neural function in the auditory system. Because AN
appears to be used as a catch all term for normal OAEs and absent or abnormal ABR it leaves
room for speculation and confusion.
Chisin et al. (1979) reported electrophysiologic study of children with deafness and
children with hearing loss resulting from hyperbilirubinemia showed normal cochlear
microphonic responses and abnormal or absent ABR. In a study by Kraus, Ozdamar, Stein, &
Reed (1984), seven of 48 patients with no known brainstem damage were found to have no
responses by ABR or absent waves III and V with pure tone sensitivity ranging from normal
hearing to moderate impairment. Stein et al. (1996) evaluated four patients diagnosed with AN
and found all four had elevated bilirubin levels warranting phototherapy treatment and one
subject had an exchange transfusion.
Kraus et al. (1984) reported that several risk factors for hearing loss were present in the
seven patients with paradoxical OAE and ABR findings including 50% had histories positive for
perinatal asphyxia, 40% had hyperbilirubinemia, and 33% had head trauma. Shapiro &
Nakamura (2001) surveyed parents of children diagnosed with classic kernicterus and found that
ten of twelve children met clinical criteria for AN. Madden et al. (2002) evaluated 22 patients
diagnosed with AN and found eleven of those patients had a history of hyperbilirubinemia plus
several other risk factors for hearing loss including prematurity. Rance, Beer, Cone-Wesson,
Shepherd, Dowell, King et al. (1999) evaluated 32 patients diagnosed with AN and found 16
patients to have a history positive for jaundice plus several other risk factors for hearing loss.

34
The combination of risk factors for hearing loss again makes it difficult to determine if
hyperbilirubin is actually the cause of AN in these studies.
Amatuzzi, Northrop, Liberman, Thornton, Halpin, Herrmann et al. (2001) stated that the
extent of damage to the hair cells and spiral ganglion neurons in neonatal hyperbilirubinemia
remains controversial because of the dearth of pathologic material in infants without other
potential risk factors for hearing loss; even where hyperbilirubinemia is not the suspect, the
diagnosis of AN in infants is problematic. The term neuropathy means disease due to pathology
in peripheral nerves and according to Rapin and Gravel (2006) in many cases the diagnosis of
AN has been made without attempt to differentiate pathology in the VIIIth nerve from pathology
in the other peripheral and central portions of the auditory pathway. As with many disorders,
factors that cause hearing loss may be concomitant so there may be central damage from
hyperbilirubinemia and peripheral damage from a different factor allowing AN to be diagnosed
in the presence of hyperbilirubinemia. Hyperbilirubinemia is clearly a central disorder and AN
is a peripheral disorder but the two can impact each other and they can co-exist (Musiek, 2010).
However, hyperbilirubinemia is not a cause of AN unless there is retrograde degeneration of the
cochlear nuclei to the auditory nerve (Rapin & Gravel, 2003; Musiek, 2010).
As indicated in this discussion, research has found a correlation between
hyperbilirubinemia and prematurity indicating they are both significant risk factors for AN
(Rance et al., 1999; Madden et al., 2002). Amin (2004) and Wennberg et al. (2006) stated that
although the relationship between TSB and AN in the premature population is not firmly
established, AN seems to be an important component of the bilirubin-induced brain-injury
spectrum involving auditory pathways. AN must be considered when evaluating the auditory
function of premature infants with hyperbilirubinemia.

35
Determining a Single Etiology of SNHL
It is difficult to determine if hyperbilirubinemia is the sole cause of SNHL when
comorbidity of hearing loss risk factors often exist, more so in premature infants than full-term
infants (Vohr, Widen, Cone-Wesson, Sininger, Gorga, Folsom et al., 2000). Amin (2004)
indicated that because of the proximity of the auditory neural system to the cardio-respiratory
center, ABR results may correlate with other brainstem functions such as control of heart rate
and breathing. Correlations like this and others may skew research attempting to determine
etiology of auditory dysfunction.
Hyperbilirubinemia has been proven to be a significant risk factor for auditory
dysfunction in infants. Madden et al. (2002) evaluated the medical history of 22 patients
diagnosed with auditory neuropathy and found a history of hyperbilirubinemia (50%),
prematurity (45%), ototoxic drug exposure (41%), family history of hearing loss (36%), and
neonatal ventilator dependence (36%). Billings and Kenna (1999) completed a retrospective
chart review of 301 patients diagnosed with SNHL between the age of one month to 13 years of
age. Birth factors including prematurity (8.5%), prolonged NICU stay (3.8%), and elevated
bilirubin level (3.3%) were the most common etiologic factors for SNHL. De Vries, Lary, and
Dubowitz (1985) retrospectively investigated premature infants <34 weeks of GA with peak TSB
> 14 mg/dL and reported that hyperbilirubinemia carries approximately 30% risk of sensory
hearing loss in high risk infants with birth weight < 1500 gm. Bergman, Hirsch, Fria, Shapiro,
Holzman, and Painter (1985) evaluated 55 high-risk pre-term (≤36 weeks GA) infants and found
hyperbilirubinemia (mean peak TSB 12 mg/dL) to be a significant predictor of sensory hearing
loss along with number of days of respirator therapy and lowest serum sodium values.

36
The JCIH (2007) identified eleven risk indicators including those that are present during
pregnancy and birth (congenital) and those that are acquired post-birth as a result of specific
medical conditions or as a side affect of necessary medical interventions when treating an ill
child. These risk indicators can be found in Table 1. Hyperbilirubinemia requiring exchange
transfusion is one of those risk indicators. Additionally, the JCIH listed the following as risk
factors to be considered when evaluating for neonatal hearing loss: chemotherapy and an illness
or condition requiring admission of 5 days or greater to a NICU or any of the following
regardless of length of stay: ECMO, assisted ventilation, exposure to ototoxic medications
(gentimycin and tobramycin) or loop diuretics (furosemide/Lasix).
In several of the studies reviewed in this section, not all current risk factors for
progressive or delayed onset of sensorineural hearing loss listed by the JCIH 2007 position
statement were ruled out. This indicates that concomitant risk factors could be present which
affect the auditory system. For instances, Sheykholeslami and Kaga (1999) only reported a
review of the medical charts of the patients as neonates. It is unknown if risk factors for
progressive or delayed onset hearing loss which may have been present between the neonate
period and the age at which testing was completed (i.e., 4, 15, and 25 years of age) were
evaluated.

37
CHAPTER 3
METHODS
The study was initiated following Human Subjects Committee (HSC) approval at
University of Kansas Medical Center (KUMC). Refer to Appendix C for information regarding
HSC approval. This prospective study was conducted by the Department of Hearing and Speech
at KUMC in the KU Hospital NICU in Kansas City, Kansas under the direction of John A.
Ferraro, Ph.D., the study’s primary investigator. Assistance with subject recruitment was
provided from Prabhu Parimi, M.D., the Neonatology Department Chair. The clinical
investigator, Gabriel Bargen, completed all audiological testing, collected all data, and analyzed
all data for the study.
Study Eligibility
To be study eligible, infants needed a GA of 28 to 34 weeks and/or normalized birth
weight within the 95th percentile for infants 28 to 34 weeks GA (1559 to 3150 kgm).
Normalized birth weight for the target GA range was included to account for the possibility of
incorrectly estimated GA. All infants meeting these criteria that were made known to the clinical
investigator were screened for study eligibility. To be considered for study eligibility, the infant
had to be less than 72 hours old and be medically stable. Patients with elevated TSB levels and
normal TSB levels were included in the study. The study group comprised premature infants in
the target GA range with elevated TSB levels. The control group comprised premature infants in
the same GA range who had normal levels of TSB. Study and control groups were determined
post hoc to keep the clinical investigator blind to the bilirubin status.

38
Patients were excluded from the study if they were known to have: a family history of
childhood hearing loss, a postnatal infection associated with SNHL (i.e., bacterial and viral
meningitis), in utero infection such as cytomegalovirus, herpes, rubella, syphilis, and
toxoplasmosis, a syndrome associated with hearing loss including Trisomy 21, CHARGE
syndrome, atresia, Usher’s syndrome, and a congenital defect associated with hearing loss
including craniofacial anomalies (JCIH, 2007). Patients who had received or were receiving
aminoglycoside therapy were included in the study provided that their trough levels were within
the normal range of 0.6 – 2.0 (mcg/ml).
Once eligibility for the study was established the parent(s) was asked to sign an informed
consent prior to testing. A Spanish interpreter was used to obtain informed parental consent
from those subjects’ parents whose primary language was Spanish.
Subjects
Subjects were enrolled in the study between December 2008 and August 2009. Ten
preterm neonates, 5 male and 5 female, participated in this study. The subjects’ mean GA was
31.5 weeks (SD = 2.07 weeks) with a range of 28 to 34 weeks. The mean birth weight was
1656.3 g (SD = 333.39 g) with a range of 1060 g to 2113 g. The racial demographic data
indicated 7 Caucasian, 2 Hispanic, and 1 African American subjects. Table 2 summarizes the
demographic characteristics of the subjects.

39
Auditory Brainstem Response Recordings
Equipment
A Biologic Systems Corporation NavigatorPRO (Natus Medical Incorporated,
Mundelein, IL) unit, utilizing Auditory Evoked Potential program, version 6.2.0, was used to
record and analyze the ABR.
Stimuli
A broadband click with 100 μsec electrical pulse that was alternating in polarity was
utilized. The stimuli were presented at a rate of 33.3 clicks per second via EARtone-3A tubal
insert earphones. Stimuli at each collection began at 80 dB nHL (using reference of 0 dB nHL as
audiometric zero) and were reduced by approximately 20 dB for each subsequent recording until
all ABR components disappeared into the noise floor. Once the components disappeared, the
stimulus was increased by 5 dB until a repeatable ABR component, specifically wave V, was
visible once again. Table 3 lists the ABR stimuli used for this study as well as the recording
parameters described below.
Recording Parameters
Single-channel ABR was recorded with the use of three self-adhesive, disposable
electrodes. Responses were recorded with the non-inverting (positive) electrode placed on the
high forehead, inverting (negative) electrode placed on the ipsilateral-mastoid (test ear), and
ground electrode placed on the contralateral-mastoid (non-test ear) or on the nape of the neck.
The area of skin was prepared for electrode placement by exfoliating the skin using NuPrep Gel
(D. O. Weaver and Company, Aurora, CO, USA) and a cotton swab to reduce skin impedance.

40
Impedance was measured prior to recording the ABR. Individual electrode impedance was
required to be below 10,000 ohms and inter-eletrode impedance values were balanced to within
2000 ohms across electrodes.
This study used the collection parameters typically used by the KUMC Hearing and
Speech Department Audiology Clinic. The EEG activity was band-pass filtered from 100 to
3000 Hz (6 dB/octave). A time window of 15 msec was used. Approximately 2000 stimulus
presentations were averaged and the response was replicated at least twice at each level. Artifact
rejection (±23.80 µV) was used to avoid contamination of the response by excessive myogenic
activity. Additionally, testing was completed when infants were asleep to decrease myogenic
artifact. Masking was not used during testing. As previously indicated, Table 3 lists the ABR
recording parameters along with the ABR stimuli used for this study.
ABR Latencies
ABR absolute latencies and interwave intervals for waves I, III, and V were measured at
80 dB nHL using the cursor from the screen. Normative data have been determined for infant
ABR peak latencies and interwave intervals (latency between two peaks) at various levels of
stimulation (Cox, 1985; Gorga, Reiland, Beauchaine, Worthington, & Jesteadt; 1987). Data
from this study were compared using conceptional age, which is the sum of GA and
chronological age at the time of testing. The normative data from Gorga et al. (1987) were used
to determine if latencies and interwave intervals were within normal limits. Normalized data
could not be found for conceptional age less than 33 weeks. When the conceptional age was less
than 33 weeks the normalized data from the 33-34 week group defined by Gorga et al. (1987)

41
were used. Latencies and interwave intervals for the ABR waveforms were verified by a blind
observer experienced in the interpretation of evoked-potential responses.
Example response waveforms indicating the absolute latencies for the ABR are shown in
Figures 1 and 2. The results in Figures 1 and 2 are for, subject 1, an infant born at 33 weeks GA
with normal hearing. The results in Figures 1 and 2 were recorded during the second and third
follow-up collections respectively. The stimulation level is indicated for each set of waveforms,
beginning at 80 dB nHL. Waveforms where a response of wave I, III or V was judged to be
present by the clinical investigator and the blind observer are indicated with coordinating wave I,
III, or V markers.
ABR Thresholds
The procedures for finding ABR threshold in infants have been well documented
(Elberling & Don, 1987; Ferraro, 1997; Sininger & Cone-Wesson, 2002). For this study the
procedure for finding ABR threshold followed that defined by Ferraro in 1997. The averaging
process began at 80 dB nHL, a level where all components of the response should be visualized.
Two recordings were completed at this level to verify the response was repeatable. The stimulus
level was then reduced by 20 dB for each subsequent recording until all ABR components
disappeared into the noise floor. Once the ABR components disappeared, the stimulus was
increased by 5 dB until a repeatable ABR component was visible once again. This component
was wave V in all of the subjects. At least two recordings were completed at the last level where
a repeatable wave V was visually observable and additionally at the next lowest level where it
was not. The ABR threshold was estimated by wave V and defined as midway between the last
repeatable and non-repeatable waveforms. Thresholds for the ABR tracings were verified by a

42
blind observer experienced in the interpretation of evoked-potential responses. There was 100%
agreement between the clinical investigator and the blind observer.
Example response waveforms for the ABR are shown in Figures 1 and 2. As previously
indicated, the results in Figures 1 and 2 are from subject 1, an infant born at 33 weeks GA with
normal hearing. The results in Figures 1 and 2 were recorded during the second and third
follow–up collections respectively. The ABR threshold was found to be 12.5 dB nHL for both
Figures 1 and 2 as the last measurable wave V was found at 15 dB nHL and no replicable
response was recorded at 10 dB nHL in both example responses.
Distortion Product Otoacoustic Emission Recordings
Equipment
A Biologic Systems Corporation NavigatorPRO (Natus Medical Incorporated,
Mundelein, IL) unit, utilizing SCOUT OAE version 3.45.00, was used to record and analyze
DPOAEs. DPOAE data were collected as DPgrams.
Stimulus Parameters
DPOAE data were collected in response to pairs of primary tones (f1, f2; f2 > f1) with f2
stimulus presented at 2343 Hz (~2 kHz), 3046 Hz (~3 kHz), and 3749 Hz (~4 kHz) with an f2/ f1
ratio of 1.2. The primaries L1 and L2 were presented at 65 dB SPL and 55 dB SPL respectively.
For each f2 stimulus, a minimum of 40 samples were collected. Measurement-based stopping
rules were used during data collection. For each f2 stimulus, averaging continued until a
minimum DP level of -5 dB SPL and a minimum DP-noise floor (NF) level of 8 dB SPL was
reached. If a NF of -17 dB SPL was reached averaging stopped. Additionally, averaging

43
stopped if a time out of 15 seconds, above 3 kHZ, or 20 seconds, at 3 kHz or below, had elapsed,
whichever occurred first. Emission levels and noise floor levels at each f2 stimulus were
determined. A minimum DP-NF amplitude of 6 dB was required in order to use the recorded
emission in the data analysis.
Example DP-grams are shown in Figures 3 and 4. The DP-grams in Figures 3 and 4 are
recorded from the right ear of an infant born at 33 weeks GA, subject 1. The results for Figures
3 and 4 were recorded during baseline and the second follow-up collections respectively.
Testing conditions when measuring the DP-grams from Figures 3 and 4 were identical except for
the level of environmental noise. Figure 3 shows an increased noise floor when compared to
Figure 4. In Figure 3, the DP response is greater than 6 dB above the noise floor only at 4000
Hz. In Figure 4, the DP response is greater than 6 dB above the noise floor at 2000, 3000, and
4000 Hz. As auditory function was found to be normal in this subject, the absent DPOAEs
during baseline testing probably were not an indication of auditory dysfunction but more likely a
result of poor testing environment.
DPOAE Procedure
A probe was placed into the outer ear canal and sealed snugly using a removable soft-
rubber ear tip. The probe contained two speakers to produce the stimuli and a microphone to
record the elicited emissions.
Bilirubin Monitoring
Bilirubin levels were measured per routine clinical practice by the KU Hospital NICU
staff. Direct bilirubin levels and TSB levels were measured from blood samples. Bilirubin data

44
were collected by the clinical investigator from the electronic medical chart from each patient.
TSB levels were documented until levels reached a plateau within the normal risk range.
Procedures
ABR and OAE evaluations were attempted four times on each subject and measurements
were obtained from both ears if possible. However, due to the medical condition of the neonates
(i.e., ventilation, head braces, etc.) at the time of data collection, testing could only be completed
on one ear or not completed at all for several subjects. ABR and DPOAE data were collected
while the infant was asleep.
Baseline testing was completed on approximately the 3rd
postnatal day as TSB levels
typically peak three to five days after birth. The first follow-up collection was attempted on
approximately the 5th
postnatal day. Third measurements were obtained once the bilirubin level
had reached a plateau, indicating they had decreased to a level where bilirubin was no longer a
risk, and phototherapy had been discontinued in those subjects who underwent phototherapy
treatment. Finally, a fourth follow-up collection was completed two weeks after the third follow-
up collection, to examine the sequelae of hyperbilirubinemia. Data regarding TSB levels were
collected after all ABR and DPOAE tests were completed which kept the clinical investigator
blind to subjects’ bilirubin status.
Statistical Analysis
All analyses were performed with a type I error of 5%. Spearman’s correlation
coefficient (Johnson & Kuby, 2004) was used to investigate the first hypothesis for comparing
the linear relationship of peak TSB levels and ABR absolute and interwave intervals latencies

45
globally. Spearman’s correlation coefficient was used again to investigate the second hypothesis
for comparing the linear relationship of peak TSB levels and ABR thresholds globally.
Spearman’s correlation coefficient was also used to investigate the third hypothesis for
comparing the linear relationship of peak TSB levels and DPOAE responses globally.

46
CHAPTER 4
RESULTS
The general goal of this study was to determine the relationship between TSB levels and
auditory function in pre-term infants. ABR absolute latencies, interwave intervals and thresholds
were obtained along with DPOAE measurements to evaluate auditory function. These
measurements were compared to the peak TSB levels of each subject.
Auditory Function Measurements
ABR and DPOAE measurements were attempted on each patient four separate times:
baseline and three follow-up collections. Due to the medical condition of the subject, the level of
environmental noise, or the elevated electrical artifact, testing of ABR and/or DPOAE could not
be completed at all attempts. Refer to Appendix D for all raw ABR data listed in Tables D1, D2,
and D3. Additionally, refer to Appendix D for all raw DPOAE data listed in Tables D4 and D5.
ABR tracings from baseline and all follow-up collections are provided in Figures D1 through D4
in Appendix D. DP-grams from baseline and all follow-up collections are also provided in
Figures D5 through D8 in Appendix D. The majority of the missing data occurred during the
baseline and first follow-up collections. Based on the location of the missing data, analysis was
completed using values collected from the second and third follow-up collections. Additionally,
data from only the poorer ear was used in the analysis. The poorer ear was defined as that
having the highest ABR threshold or, if the ABR threshold was equal between ears, the ear with

47
the most prolonged absolute latencies when the stimulus was presented at 80 dB HL. Using the
poorer ear allowed for fewer missing data points.
ABR
To evaluate latency measurements ABRs were recorded at a stimulus level of 80 dB
nHL. ABRs at this stimulus level were obtained from 9 of 10 ears in both the second and third
follow-up collections. Table 4 lists the ABR absolute and interwave interval latencies from the
worst ear recorded during the second and third follow-up collections. When subjects’ individual
latencies were compared to the normative data published by Gorga et al. (1987), 5 of 9 ears had
prolonged absolute latency of wave V during the second follow-up. For the third follow-up
collection, 2 of 9 ears had prolonged absolute latency of wave V. Additionally, during the
second follow-up collection, 6 of 9 ears had prolonged III-V and I-V interwave intervals when
compared to Gorga et al. (1987). For the third follow-up, 4 of 9 ears had prolonged III-V
interwave intervals and 3 of 9 ears had prolonged I-V interwave intervals. When comparing the
subjects’ individual latencies the CA group that was closes to the infants CA was used. In
several cases the CA of the individual was below that of the normative data CA group.
The average CA for the infants at the second follow-up collection was 33.5 weeks. The
average CA for the infants at the third follow-up collection was 35.5 weeks. When the averages
from the second follow-up collection were compared to the Gorga et al. (1987) normative data
for infants in the 33-34 CA group no significant differences were found. Similarly, when the
averages from the third follow-up collection were compared to the normative data for infants in
the 35-36 CA group no significant differences were found. Table 5 lists means and standard
deviations of wave I and V absolute latencies and the I-III, III-V, and I-V interwave interval

48
latencies for the study group and the corresponding normative data CA groups from Gorga et al.
(1987).
DPOAE
DPOAE responses were obtained from 9 of 10 subjects at both the second and third
follow-up collections. The DPOAE responses from the second and third follow-up that were
used in the analysis coordinated with the ear that was determined to be the poorer ear according
to the ABR recording. These DPOAE levels and NF levels recorded from the poorer ear are
shown in Table 6. The recordings where the DP was found to be less than 6 dB above the noise
floor are shown in bold print. Those recordings were not used in the data analysis as the
emission was absent or the noise floor could have been obscuring the response.
TSB Monitoring
The medical chart of each subject was reviewed for bilirubin data after the collection of
all audiological data. Peak TSB levels ranged from 4.9 to 10.9 mg/dl with a mean peak TSB of
7.91 mg/dL (standard deviation (SD) = 2.03 mg/dL). Among the subjects’, total bilirubin levels
peaked on 3, 4, 8, and 13 days of life with an average of 5.8 days. Peak TSB levels did not
significantly correlate with either GA or infant birth weight. The correlations between peak TSB
levels, GA and birth weight are listed in Table 2 along with the patient demographics previously
described.
The phototherapy treatment thresholds of TSB (μmol/L) and B/A ratio (μmol/g) for
groups based on birth weight developed by Hulzebos et al. (2008) were used in this study to
assign subjects into the control group (standard risk) or the study group (increased risk). To

49
determine if subjects were in the control group or the study group, the total bilirubin to birth
weight ratio was calculated using the peak TSB levels of each subject. These values are shown
in Table 7.
According to the criteria established (i.e., that subjects with TSB level to weight ratio
lower than 1mgm/100gm will be considered in the standard risk or control group), all 10 subjects
were in the standard risk or control group. Figure 5 shows the scatter plot of the peak TSB levels
to birth weight ratio for the subjects. The original intention of this study was to compare
auditory function and peak TSB levels between the study group and the control group. However,
as all subjects fell in the control group, auditory function and peak TSB levels were compared
between all subjects.
Statistics
Spearman’s correlation coefficient was used to investigate the first hypothesis which
compared the linear association of peak TSB levels and ABR latencies. Nine patients had ABR
absolute latencies and interwave interval latencies found to be present at 80 dB nHL during both
the second and third follow-up collections. The poorer ear sample failed to prove a linear
association between peak TSB levels and ABR absolute latencies and interwave interval for both
the second and third follow-up collections. There was not a significant correlation between the
peak TSB levels and any of the absolute or interwave interval latencies. Table 8 lists the means
±standard deviations along with the correlations and p-values calculated when comparing the
linear association of peak TSB levels and ABR absolute and interwave interval latencies for the
second and third follow-up collections. Figures 6a-b, 7a-b, 8a-b, and 9a-b show the scatter plots

50
of the peak TSB correlation with the latencies of wave III, V, I-V interwave interval, and III-V
interwave interval respectively.
Spearman’s correlation coefficient was also used to investigate the second hypothesis
which compared the linear association of peak TSB levels and ABR thresholds. As with the
previous investigation, thresholds were determined for 9 patients in both the second and third
follow-up collections. The poorer ear sample failed to prove a linear association between peak
TSB levels and ABR thresholds for both the second and third follow-up collections. There was
not a significant correlation between the peak TSB levels and the ABR thresholds at either
collection. Table 9 lists the means ±standard deviations along with the correlations and p-values
calculated when comparing the linear association of peak TSB levels and ABR thresholds for
this analysis. Figure 10a-b shows the scatter plot of the peak TSB and ABR thresholds for the
second and third follow-up collections.
Spearman’s correlation coefficient was also used to investigate the third hypothesis
which compared the linear association of peak TSB levels and DPOAE responses globally.
Frequencies used for calculations were 2000 Hz, 3000 Hz, and 4000 Hz. Those measurements in
which the noise floor was at a level that would interfere with the distortion product emission
(signal to noise ratio ≤ 6 dB) were not included in the calculations. Refer to Table 6 for the data
used in the analysis. During the second follow-up collection, DPOAE responses were measured
for 5 of 10 subjects at 2 kHz, 8 of10 subjects at 3 kHz, and 9 of 10 subjects at 4 kHz. During the
third follow-up collection, DPOAE responses were measured for 9 of 10 subjects at all
frequencies analyzed. The poorer ear sample failed to prove a linear association between peak
TSB levels and DPOAE responses for both the second and third follow-up collections. There
was not a significant correlation between the peak TSB levels and the DPOAE responses at

51
either measurement. Table 10 lists the means ±standard deviations along with the Spearman’s
correlations and p-values calculated when comparing the linear association of peak TSB levels
and DPOAE responses for the second and third follow-up collections. Figure 11a-c shows the
scatter plot of the peak TSB and DPOAE responses for the second follow-up collection. Figure
12a-c shows the scatter plot of the peak TSB and DPOAE responses for the third follow-up
collection.
Case Report
Subject 6
When reviewing newborn hearing screening documents for the study subjects it was
noted that all subjects passed the newborn hearing screening except subject 6. Subject 6 had
normal auditory findings based on both ABR and OAE measurements during the study but failed
the newborn hearing screening shortly following the study’s final data collection. Because of
this unusual occurrence the case report for this particular subject is described below.
Subject 6 was a female infant born at 30 weeks’ GA. Birth weight was 1210 g which was
below average for her age. She met all the eligibility requirements for the study, indicating she
had no risk factors for congenital hearing loss or progressive or delayed on-set hearing loss
except those being targeted by the study (i.e., prematurity, being in the NICU,
hyperbilirubinemia). Serum bilirubin levels were 4.2 mg/dL on the second day of life, 4.9
mg/dL on the third day of life and peaking at 5.3 mg/dL on the fourth day of life. TSB levels of
subject 6 were within the standard risk level and below the mean peak TSB for the group (7.91
mg/dL).

52
ABR measurements were obtained at baseline and the first follow-up session in the left
ear and in both ears at the second and third follow-up collections. When compared to normative
data from Gorga et al. (1987) the ABR absolute latencies and interwave intervals were
essentially normal except for the second follow-up collection. At this session, wave V latency
was prolonged along with III-V and I-V interwave intervals. However, the CA of subject 6 at
the second follow-up session was 32 weeks and the CA of the normative data group was 33-34
weeks. This could have accounted for the prolongation of the latencies found during this
session. Thresholds for all ABR measurements were found to be less than 25 dB nHL at all
collections with the final ABR measurement thresholds of 7.5 dB nHL and 17.5 dB nHL in the
left and right ear respectively.
DPOAE recordings were attempted in the left ear at baseline and the first follow-up
collection but were not elicited. At the second follow-up collection, DPOAEs were measured at
4 kHz in the right ear but could not be elicited below 4 kHz in the right ear or at all in the left
ear. At the third follow-up collection, DPOAEs were elicited in both ears at all frequencies
evaluated at a signal to noise ratio greater than 6 dB. Auditory function was deemed to be within
normal limits throughout the study for subject 6 when ABR and DPOAE data were reviewed.
The newborn hearing screening consisted of an ABR screen with the pass/refer criteria
set at 30 dB nHL. The ABR screening responses for subject 6 indicated wave V was present at
60 dB nHL in both ears but absent at the 30 dB nHL screening level. The screening was
completed 13 days after the final follow-up session for this study.
Subject 6 returned to the outpatient audiology clinic for a rescreening 20 days following
the failed initial newborn hearing screen. Results reported the rescreen was passed. TEOAEs
were elicited in both ears at a signal to noise ratio greater than 6 dB in at least 3 of 5 frequencies

53
screened. DPOAEs were also elicited in the left ear at a signal to noise ratio greater than 6 dB in
5 of 6 frequencies screened. DPOAEs were not attempted in the right ear. Results indicated
subject 6 passed the ABR screen with wave V present at the 30 dB nHL screening level in both
ears.
As described above, even though the subject 6 was found to have normal auditory
function during the study, she failed the newborn hearing screening. One explanation for this
finding is that the reliability of the study’s auditory function evaluations was poor or the
reliability of the auditory screening was poor. However, a more likely reason is that the subject
may have had temporary auditory dysfunction at the time of the newborn hearing screening that
dissipated prior to the newborn hearing rescreen.

54
CHAPTER 5
DISCUSSION
The current study had one main goal: to determine the relationship between peak TSB
levels and auditory function in preterm neonates. Three hypotheses were tested to meet this
goal: 1) as peak TSB levels worsen the ABR will indicate an increase in absolute latency of
wave III and/or wave V and interwave latency of III-V and/or I-V in premature neonates, 2) as
peak TSB levels improve the ABR threshold will improve in premature neonates, and 3) DPOAE
responses will be unaffected by the improvement or deterioration of peak TSB levels in
premature neonates.
Results from the Present Study
The study used the currently accepted peak TSB level to birth weight ratio to determine
which subjects’ bilirubin levels were within the range of standard risk as opposed to those
determine to be at an increased risk. The cutoff placed those subjects with ratios lower than
1mgm/100gm in the control group, which for this study included all the subjects. All subjects
were found to have normal auditory function as well. This demonstrated that the ratio cutoff of
1mgm/100gm was appropriate as the auditory function of all subjects below this level was not
negatively affected by bilirubin as expected.
The first hypothesis of this study was that as peak TSB levels worsened the ABR
indicated an increase in absolute latency of wave III and/or wave V and interwave latency of III-
V and/or I-V in premature neonates. Results pertaining to this hypothesis are shown in Table 8
and Figures 6a-b, 7a-b, 8a-b, and 9a-b. This correlation did not reach statistical significance

55
suggesting that there was no evidence to support the hypothesis that ABR latencies would be
prolonged as peak TSB levels worsen. When the average latencies of wave V and the interwave
intervals were compared to the normative data from Gorga et al. (1987) as a group, all data fell
within one standard deviation of the mean. This finding indicated that the ABR absolute latency
and interwave interval measurements as a group were representative of normative responses.
Examination of the individual data revealed a prolonged wave V in 5 of the 9 ears
analyzed from the second follow-up collection and in 2 of the 9 ears analyzed from the third
follow-up collection. Additionally, the III-V and I-V interwave intervals were prolonged in 6 of
the 9 ears analyzed from the second follow-up collection. From the third follow-up, 4 of 9 ears
had prolonged III-V interwave intervals and 3 of 9 had prolonged I-V interwave intervals. Three
of the ten subjects were below the conceptional age of the normative data during the second
collection and one was still below during the third collection. These subjects account for the
majority of the prolonged data. The latencies from these subjects may not have been considered
prolonged if they could have been compared to normative data from a more similar conceptional
age group; however, these data are not available.
The second hypothesis of the study was that as peak TSB levels improved/worsened in
premature neonates the ABR threshold followed suit. Results pertaining to this hypothesis are
shown in Table 9 and Figures 10a-b. This correlation did not reach statistical significance
suggesting that there was no evidence to support the hypothesis that ABR thresholds would
worsen as peak TSB levels worsen.
Examination of the individual data revealed all ABR thresholds from the baseline data
collection and the three follow-up collections were below 30 dB nHL except one. Subject 9 had
a threshold of 37.5 dB nHL at baseline collection. This subject did have present DPOAEs at 3

56
kHz and 4 kHz at baseline collection in the same ear. Subject 9 had a peak TSB level of 6.9
mg/dL which was below the group average of 7.91 mg/dL. The TSB level for subject 9 peaked
on day 4 of life; one day after baseline data was collected. The first follow-up collection took
place 3 days after baseline collection. ABR threshold was found to be 17.5 dB nHL at the first
follow-up collection in the same ear for subject 9. Subsequent follow-up ABR testing in that ear
continued to estimate threshold to be below 30 dB nHL. Whatever had caused the threshold to
worsen during baseline measurements did not appear to effect follow-up measurements.
The third hypothesis of the study was that DPOAE responses were unaffected by the
improvement or deterioration of peak TSB levels in premature neonates. Results pertaining to
this hypothesis are shown in Table 10 and Figures 11a-c and 12a-c. This correlation did not
reach statistical significance suggesting that there was no evidence to support the hypothesis that
DPOAE responses were unaffected by peak TSB level changes.
Comparison to Previously Published Literature
Research has shown that hyperbilirubinemia in pre-term infants is more prevalent, more
severe, and its course more protracted than in term neonates (Billings, Cole, & Lathe, 1954;
Harris, 1961; Watchko, 2000). The threshold at which bilirubin begins to affect auditory
function in preterm neonates is unclear. Unfortunately, due to the limited study sample and lack
of enrollment of infants with elevated bilirubin levels this study failed to shed light on this issue.
Research has indicated that preterm infants are affected by lower peak TSB levels than
when compared to full term infants. A study by van de Bor, van Zeben-van der Aa, Verloove-
Vanhorick, Brand, and Ruys (1989) investigated the relationship between maximal TSB
concentration and neurodevelopmental outcome. The mean peak TSB level for children with
57
normal neurodevelopment was 10.3 mg/dL while the mean peak TSB level for those with a
minor handicap was 10.7 mg/dL and for those with major handicap was 11.4 mg/dL (van de Bor
et al., 1989). The results of the present study had a mean peak TSB of 7.91 mg/dL with a range
of 4.9 to 10.9 mg/dL. Two subjects had peak TSB levels above the 10.3 mg/dL threshold for
children with normal neurodevelopment reported by van de Bor et al. (1989). Future studies
may be warranted that evaluate neurodevelopment in these preterm infants with elevated peak
TSB levels.
The peak TSB to birth weight ratio used to determine whether study participates were in
the control group or study group is one of the tools used to determine if infants need
phototherapy in the KUMC NICU (Parimi, 2009). When the peak TSB to birth weight ratios
were determined for the present study all subjects fell below the 1.0 cut off which placed all
subjects in the control group. However, all babies in the study received some amount of
phototherapy. Other determinates aside from peak TSB to birth weight ratio appear to be used
for the initiation of phototherapy in the KUMC NICU. Using lower TSB thresholds for
hyperbilirubin intervention in infants in NICUs is common (Bhutani and Johnson, 2004). With
the increasing survival of infants born prematurely, Cashore (2000) stated it is difficult to specify
what concentrations of TSB are too high. Therefore no single recommendation may serve the
needs of all nurseries and their premature patients. The KUMC NICU appears to be using
phototherapy to treat increased bilirubin liberally but properly when compared to management of
bilirubin by other NICUs described by the literature.

58
Study Strengths
One of the strengths of this study included a standardized assessment method to ensure
reliable evaluations across all subjects and for all evaluations on each subject. The same clinical
investigator, Gabriel Bargen, completed all the evaluations on every subject. The clinical
investigator made all attempts to use the same protocol for each evaluation of auditory function.
A second strength of this study included the enrollment rate. Study enrollment occurred
between January 2009 and August 2009. During this time 62 infants with GA of 28 to 34 weeks
were admitted to the KU Hospital NICU. The medical status and knowledge of concomitant risk
factors for hearing loss for all 62 infants were unknown. Therefore, all 62 infants may not have
been eligible for the study. However, based solely on the GA criteria, 10 of 62 infants eligible
for the study were enrolled. This gave the study a 16% enrollment rate.
Grundmeier, Swietlik, and Bell (2007) evaluated subject enrollment when patients were
informed of studies by their clinician using electronic health records. They found that eleven
studies with a potential subjects ranging from 17 to 1,162 only had a small portion of the subjects
actually enroll in the studies. The enrollment rate ranged from 3% to 25% with a median of
11%. Mosis, Deileman, Stricker, van der Lei, and Sturkenboom (2006) assessed patient
recruitment when physicians were informed of eligible subjects in their database automatically.
They found that of 170 eligible study subjects only 20 were enrolled yielding an 11.8%
enrollment rate. In 1999, CenterWatch, a source for clinical trials information, reported that 2.8
million individuals completed initial screening for industry-sponsored clinical trials. An
estimated 21% of those who responded to these recruitment promotions showed up for initial
screening, and only 7% were enrolled in studies (Kroll, 2001). When compared to these studies,
the 16% enrollment rate of the current study would be considered high.

59
The high follow-up rate of 97.5% was also a strength of this study. Baseline and two
follow-up collections of auditory function were attempted on all subjects. One subject, subject 3,
was discharged before the final follow-up measurements could be completed.
An additional strength of this study included blinding of the clinical investigator to
increase study validity. The TSB levels of each subject were unknown to the clinical
investigator until the completion of all auditory function evaluations. This decreased potential
bias that could have occurred if the clinical investigator was aware of the subjects’ bilirubin
status during the measurement of auditory function.
Study Limitations
There were several limitations to this study that need to be taken into account when
interpreting the data. First of all, the number of subjects was limited. Although the enrollment
rate was relatively good (16%) when compared with other clinical studies, the target enrollment
of 45 subjects was not met. This factor could have been partially due to reduced admissions of
patients eligible for the study based on GA range. Active enrollment began in January. Two
subjects were enrolled in February, one subject was enrolled in April, two patients were enrolled
in both June and July, and three subjects were enrolled in August. Additionally, the
communication between the clinical investigator enrolling subjects and the doctors and nurses
informing the clinical investigator when eligible subjects were admitted to the NICU was
limited. A potential reason for this was the clinical investigator was only on campus three days a
week to physically check NICU admissions. The other four days of the week the clinical
investigator relied on the attending physician (co-primary investigator), to make known eligible
admissions. Given the physician’s demanding schedule, many eligible patients were not made

60
known to the primary investigator until they were older than 72 hours of life. Contact was made
with the nurses in the NICU and a presentation was provided indicating the limited enrollment
timeline; however, no eligible admissions were made known by the unit nurses. Because of the
limited amount of time to enroll patients (i.e., prior to 72 hours of life) this line of
communication needed to be open with contact being made daily or more by the investigating
clinician and both the physicians and the nurses involved with KUMC NICU admissions.
Incomplete data for both ears at baseline and follow-up sessions also was a limitation to
this study. The medical condition of the subjects contributed to this condition. Several babies
required assistance breathing via a ventilator and therefore testing could only be completed on
one ear as the infant could not be turned. Most babies were receiving phototherapy treatment
during one or more of the auditory function evaluations. Phototherapy treatment produces
cyclical energy which interferes with ABR testing. The location of the babies was also a
contributing factor. All babies were in incubators or radiant warmers for baseline and several
follow-up evaluations. Incubators and radiant warmers contain a high level of cyclical energy
(i.e., overhead electric heating elements, warming blanket, warm moistened air) which as
previously mentioned interferes with ABR testing.
Another limitation is the environment in which auditory tests were completed. The
NICU environment along with incubators and respiratory support equipment in the NICU
combine to create a high level of environmental noise which can interfere with OAE and ABR
testing. It has been well documented that the acoustic environment in the average NICU can
often fluctuate between 40 and 90 dB(A) with impulses as high as 140 dB(A) (Darcy, Hancock,
& Ware, 2008; Goldson, 1999; Kreuger, Wall, Parker, & Nealis, 2005; Walsh, McCullough, &
White, 2006). Additionally, the sound level of the incubator as well as the method of respiratory

61
support can raise the level of noise in the testing environment for preterm infants. Lasky &
Williams (2009) reported the noise levels of incubators and respiratory support exceeded noise
recommendations of the American Academy of Pediatrics (AAP). They found that only 5.51%
of the time were the sound levels within the recommendations made by the AAP in 1997 (i.e.,
noise levels <45 dB(A). If the sound levels in the NICU environment outside and within the
incubators is elevated it will in turn increase the level of the noise floor during testing. Having
an increased noise floor can interfere with both OAE and ABR testing.
Future Studies
Further research into the pre-term population regarding the effect of increased bilirubin
on auditory function is warranted. This study provided no evidence of significant correlation
between ABR measurements and peak TSB levels or DPOAE measurements and peak TSB
levels in preterm infants with normal auditory function and peak TSB levels within the range of
standard risk. Continuing the study with preterm infants that have confirmed elevated TSB
levels would be needed to determine if a trend between the ABR measurements or DPOAE
responses and TSB levels is present. Clearly, further research is needed to determine the
relationship between bilirubin levels and auditory function in preterm infants.

62
CHAPTER 6
CONCLUSION
The present investigation was undertaken because the available evidence
regarding the level at which bilirubin affects the auditory system in premature neonates is
lacking. The present study addressed this need by evaluating the relationship between TSB
levels and auditory function in pre-term infants. Auditory function was evaluated using ABR
and DPOAE measurements. Ten infants born with a GA between 28 to 34 weeks were included
in this study. All ten subjects had bilirubin levels falling in a standard risk group according to
peak TSB levels to birth weight ratios. The ten subjects were found to have normal auditory
function. In this study there was no evidence to support the hypothesis that as peak TSB levels
worsen the ABR will indicate an increase in absolute latency of wave III and/or wave V and
interwave latency of III-V and/or I-V in premature neonates. Additionally, there was no
evidence to support the hypothesis that as peak TSB levels improve the ABR threshold will
improve in premature neonates. Finally, in this study there was no evidence to support the
hypothesis that DPOAE responses will be unaffected by the improvement or deterioration of
peak TSB levels in premature neonates. The study did provide baseline data that can be used in
future research evaluating auditory function in preterm infants with confirmed
hyperbilirubinemia. No assumptions can be made regarding criteria for initiating intervention
aimed at ameliorating the effects of high bilirubin levels on auditory function in preterm infants
from the results of this study. Further research including subjects with increased bilirubin is
needed to determine if and when auditory function of preterm infants is affected by elevated
bilirubin.

63
APPENDIX A
TABLES
Table 1: The Joint Committee on Infant Hearing 2007 position statement’s risk factors for infant
hearing loss.
1. Parental or caregiver concern regarding hearing, speech, language, and/or
developmental delay.
2. Family history of permanent childhood hearing loss.
3. Stigmata or other findings associated with a syndrome know to include a
sensorineural or conductive hearing loss or eustachian tube dysfunction (i.e.,
Trisomy 21; Pierre Robin syndrome; CHARGE syndrome; atresia; Rubinstein-
Taybi syndrome; Stickler syndrome; Goldenhar syndrome).
4. Craniofacial anomalies, including those that involve the pinna, ear canal, ear
tags, ear pits, and temporal bone anomalies.
5. Postnatal infections associated with SNHL (i.e., bacterial and viral meningitis).
6. In utero infection such as cytomegalovirus, herpes, rubella, syphilis, and
toxoplasmosis.
7. Neonatal indicators (i.e., hyperbilirubinemia at a serum level requiring exchange
transfusion; persistent pulmonary hypertension associated with mechanical
ventilation; use of extracorporeal membrane oxygenation).
8. Syndromes associated with progressive hearing loss (i.e., neurofibromatosis;
osteopetrosis; Usher’s syndrome).
9. Neurodegenerative disorders (i.e., Hunter syndrome; Friedreich’s ataxia;
Charcot-Marie-Tooth syndrome).
10. Head trauma
11. Recurrent or persistent otitis media externus for at least 3 months.

64
Table 2: Subject demographics (mean ± standard deviation) and Spearman’s correlation between
peak TSB level and birth weight and GA.
Mean ± SD
Correlation to
peak TSB p-value
Subjects (Male/Female) n=10 (5/5)
Birth weight (grams) 1656.3 ± 333.40 0.322 0.364
Gestation (weeks) 31.5 ± 2.07 0.257 0.474
Peak total serum bilirubin (mg/dL) 7.91 ± 2.03

65
Table 3: Auditory brainstem response collection parameters used for this study.
Recording
parameters Stimuli
Channel 1 Type Broadband click (100 μs electrical
pulse)
# Averages 2000 Transducer Tubal insert (EARtone – 3A)
Timebase 15 msec Polarity Alternating
Filter
(bandpass)
0.1–3.0 kHz,
6 dB/octave Level
Begin at 80 dB nHL then decrease
level by 20 dB until no discernable
wave V identifiable, then up 5-10 dB
to estimate threshold
Artifact reject ±23.80 µV Rate 33.3/second
Masking none

66
Table 4: ABR absolute latencies and interwave interval latencies from the worst ear at the second
and third follow-up collections. Mean and standard deviation for each absolute latency and
interwave interval is also provided. Stimulus level was presented at 80 dB nHL.
Latency
2nd
Follow-up 3rd
Follow-up
I III V I-III III-V I-V I III V I-III III-V I-V
Subject
1 1.95 5.01 7.82 3.12 3.00 6.13 1.76 4.64 7.51 2.87 2.88 5.75
2 1.70 4.14 6.82 2.44 2.69 5.13
3 1.95 4.51 6.95 2.56 2.44 5.00
4 2.20 4.64 6.82 2.44 2.19 4.63 1.64 4.39 6.64 2.75 2.25 5.00
5 1.76 4.89 7.82 3.12 2.94 6.06 1.89 4.64 7.26 2.75 2.63 5.38
6 1.64 4.45 7.64 2.81 3.19 6.00 1.95 4.32 7.20 2.37 2.88 5.25
7 1.89 4.76 7.82 2.87 3.06 5.93 1.51 4.14 7.20 2.62 3.06 5.69
8 1.58 4.20 7.39 2.62 3.19 5.81 1.85 4.51 6.95 2.66 2.44 5.10
9 1.76 4.70 7.82 2.94 3.13 6.06 1.64 4.76 7.32 3.12 2.56 5.69
10 1.89 4.39 6.95 2.50 2.56 5.06 2.85 5.39 7.57 2.54 2.19 4.72
Mean 1.85 4.62 7.45 2.78 2.86 5.63 1.87 4.55 7.16 2.68 2.62 5.30
SD ±0.19 ±0.26 ±0.43 ±0.26 ±0.37 ±0.57 ±0.39 ±0.38 ±0.31 ±0.23 ±0.29 ±0.36

67
Table 5: The means and standard deviations (mean ± SD) for the latencies of various waves and
interwave intervals for the second and third follow-up collections compared to the normative
data from Gorga et al. (1987) for the corresponding average CA. Stimulus level is 80 dB nHL
for all latencies and latencies are given in msec.
Gorga et
al. (1987)
2nd
Follow-up
Gorga et
al. (1987)
3rd
Follow-up
CA=33-34 CA = 33.5 CA=35-36 CA = 35.5
n=38 n=9 n=144-150 n=9
Absolute Latency
I 1.779 1.85 1.781 1.87
±0.304 ±0.19 ±0.261 ±0.39
V 7.054 7.45 7.019 7.16
±0.394 ±0.43 ±0.375 ±0.31
Interwave Intervals
I-III 2.863 2.78 2.848 2.68
±0.283 ±0.26 ±0.269 ±0.23
III-V 2.411 2.86 2.39 2.62
±0.259 ±0.37 ±0.25 ±0.29
I-V 5.274 5.63 5.24 5.30
±0.356 ±0.57 ±0.357 ±0.36

68
Table 6: DPOAE levels (dB SPL) and noise floor levels (dB SPL) for subjects’ worst ear at the
second and third follow-up collections for 2000, 3000, and 4000 Hz. Subjects GA (weeks) and
peak TSB (mg/dL) are provided for reference.
2nd
Follow-up 3rd
Follow-up
Subject GA
Peak
TSB
2kHz 3kHz 4kHz 2kHz 3kHz 4kHz
DP NF DP NF DP NF DP NF DP NF DP NF
1 33 10.9 2.3 -6.2 6.3 -8.7 2.4 -8.1 11.5 2.0 10.9 1.4 12.3 -3.8
2 33 9.0 12.9 2.0 10.8 -4.3 10.9 -6.1 15.4 1.4 18.6 3.1 16.2 0.3
3 34 8.9 13.0 -7.8 9.7 -11.4 12.3 -17.2
4 34 4.9 -3.9 -7.6 -1.3 -11.1 -1.9 -10.5 4.1 -2.8 8.1 -1.3 8.0 -1.6
5 28 8.6 7.3 10.5 8.6 -1.0 3.6 -6.5 24.8 16.2 9.0 -4.5 7.0 -1.6
6 30 5.3 2.5 0.8 8.7 1.3 1.9 -6.9 11.4 2.1
7 29 6.7 6.3 3.1 -0.5 -6.0 10.1 2.0 12.7 4.1 12.3 2.1 15.4 4.8
8 32 10.5 9.6 -2.7 10.9 -5.9 14.4 -9.9 13.0 -0.9 18.0 -9.9 16.6 -7.3
9 31 6.9 11.6 -5.7 15.9 -7.2 11.0 -6.8 14.2 0.6 12.9 2.7 4.5 -9.6
10 31 7.4 7.9 8.6 5.1 -3.6 5.5 -5.0 7.0 -2.0 12.6 4.4 11.3 -2.0
*Bold = SNR < 6 dB SPL (measurement not used in analysis)

69
Table 7: Peak total bilirubin (mg/dL) to birth weight (g) ratios.
Subject
Birth
Weight Peak TSB bw/100 TB/(bw/100)
1 1830 10.9 18.3 0.596
2 1610 9.0 16.1 0.559
3 1930 8.9 19.3 0.461
4 1930 4.9 19.3 0.254
5 1060 8.6 10.6 0.811
6 1210 5.3 12.1 0.438
7 1600 6.7 16.0 0.419
8 2113 10.5 21.13 0.497
9 1800 6.9 18 0.383
10 1480 7.4 14.8 0.500
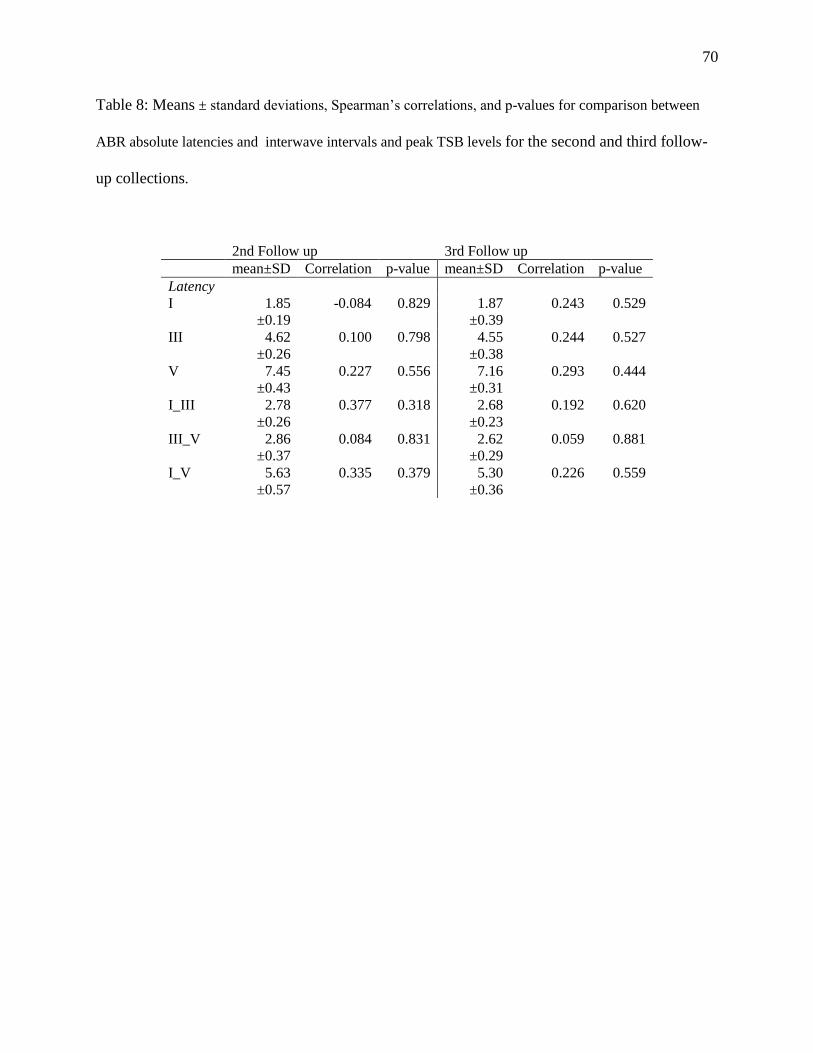
70
Table 8: Means ± standard deviations, Spearman’s correlations, and p-values for comparison between
ABR absolute latencies and interwave intervals and peak TSB levels for the second and third follow-
up collections.
2nd Follow up 3rd Follow up
mean±SD Correlation p-value mean±SD Correlation p-value
Latency
I 1.85 -0.084 0.829 1.87 0.243 0.529
±0.19 ±0.39
III 4.62 0.100 0.798 4.55 0.244 0.527
±0.26 ±0.38
V 7.45 0.227 0.556 7.16 0.293 0.444
±0.43 ±0.31
I_III 2.78 0.377 0.318 2.68 0.192 0.620
±0.26 ±0.23
III_V 2.86 0.084 0.831 2.62 0.059 0.881
±0.37 ±0.29
I_V 5.63 0.335 0.379 5.30 0.226 0.559
±0.57 ±0.36

71
Table 9: Means ± standard deviations, Spearman’s correlations, and p-values for comparison between
peak TSB levels and ABR thresholds (dB nHL) for the second and third follow-up collections.
2nd Follow up 3rd Follow up
mean±SD Correlation p-value mean±SD Correlation p-value
Threshold
18.05 -0.208 0.591 19.44 -0.201 0.604
±5.27
±4.64

72
Table 10: Means ± standard deviations, Spearman’s correlations, and p-values for comparison
between peak TSB levels and DPOAE responses for the second and third follow-up collections.
2nd Follow up 3rd Follow up
mean±SD Correlation p-value mean±SD Correlation p-value
Frequency
2 kHz 9.88 -0.700 0.188 12.38 0.483 0.187
±4.45 ±5.91
3 kHz 8.25 0.262 0.531 11.59 0.550 0.125
±5.06 ±5.08
4 kHz 7.59 0.300 0.433 11.41 0.450 0.224
±5.42 ±4.26

73
APPENDIX B
FIGURES
Figure 1: Sample ABR waveforms from subject 1, a normal hearing infant, in response to a click
stimulus recorded during the second follow-up collection. The infant had a peak TSB level of
10.9 mg/dL. The stimulation level is indicated to the left of each waveform group: 80 dB nHL,
60 dB nHL, 40 dB nHL, 20 dB nHL, 15 dB nHL, and 10 dB nHL. Waveforms where a response
of wave I, III or V was judged to be present by the clinical investigator and the blind observer are
indicated with coordinating wave I, III, or V markers.
80 dBnHL
60 dBnHL
40 dBnHL
20 dBnHL
15 dBnHL
10 dBnHL

74
Figure 2: Sample ABR waveforms from subject 1, a normal hearing infant, in response to a click
stimulus recorded during the third follow-up collection. The infant had a peak TSB level of 10.9
mg/dL. The stimulation level is indicated to the left of each waveform group: 80 dB nHL, 60 dB
nHL, 40 dB nHL, 20 dB nHL, 15 dB nHL, and 10 dB nHL. Waveforms where a response of
wave I, III, or V was judged to be present by the clinical investigator and the blind observer are
indicated with coordinating wave I, III, or V markers.
80 dBnHL
60 dBnHL
40 dBnHL
20 dBnHL
15 dBnHL
10 dBnHL

75
Figure 3: Sample DP-gram from the right ear of an infant born at 33 weeks GA, subject 1. The
DP-gram was recorded at baseline testing. The infant had a peak TSB level of 10.9 mg/dL.
Robust emissions with the DP more than 6 dB above the noise floor were detected at only 4000
Hz. An ABR recorded at the same time found the infant to have normal hearing. As described
in the document, since auditory function was found to be normal in this subject, the absent
DPOAEs found at this testing probably were not an indication of auditory dysfunction but more
likely an indication of poor testing environment.

76
Figure 4: Sample DP-gram from the right ear of an infant born at 33 weeks GA, subject 1. The
DP-gram was recorded at the second follow-up collection. The infant had a peak TSB level of
10.9 mg/dL. Robust emissions with the DP more than 6 dB above the noise floor were detected
at 2000, 3000, and 4000 Hz. An ABR recorded at the same time found the infant to have normal
hearing.

77
Figure 5: Scatter plot of peak TSB levels to birth weight ratio for all subjects. The 1
mgm/100gm threshold for group determination is highlighted.
00.20.40.60.8
11.21.41.61.8
2
1 3 5 7 9
TSB
/BW
Rat
io (
mgm
/g)
Subject
TSB/Birth weight Ratio
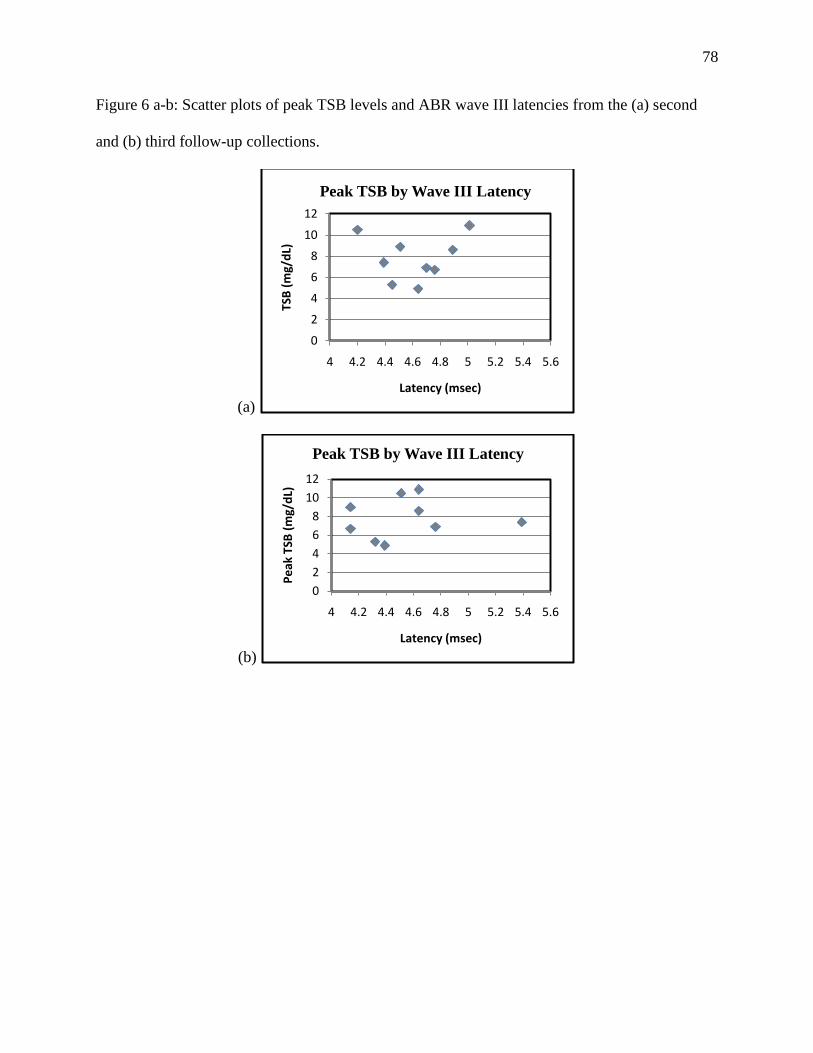
78
Figure 6 a-b: Scatter plots of peak TSB levels and ABR wave III latencies from the (a) second
and (b) third follow-up collections.
(a)
(b)
0
2
4
6
8
10
12
4 4.2 4.4 4.6 4.8 5 5.2 5.4 5.6
TSB
(m
g/d
L)
Latency (msec)
Peak TSB by Wave III Latency
0
2
4
6
8
10
12
4 4.2 4.4 4.6 4.8 5 5.2 5.4 5.6
Pe
ak T
SB (
mg/
dL)
Latency (msec)
Peak TSB by Wave III Latency
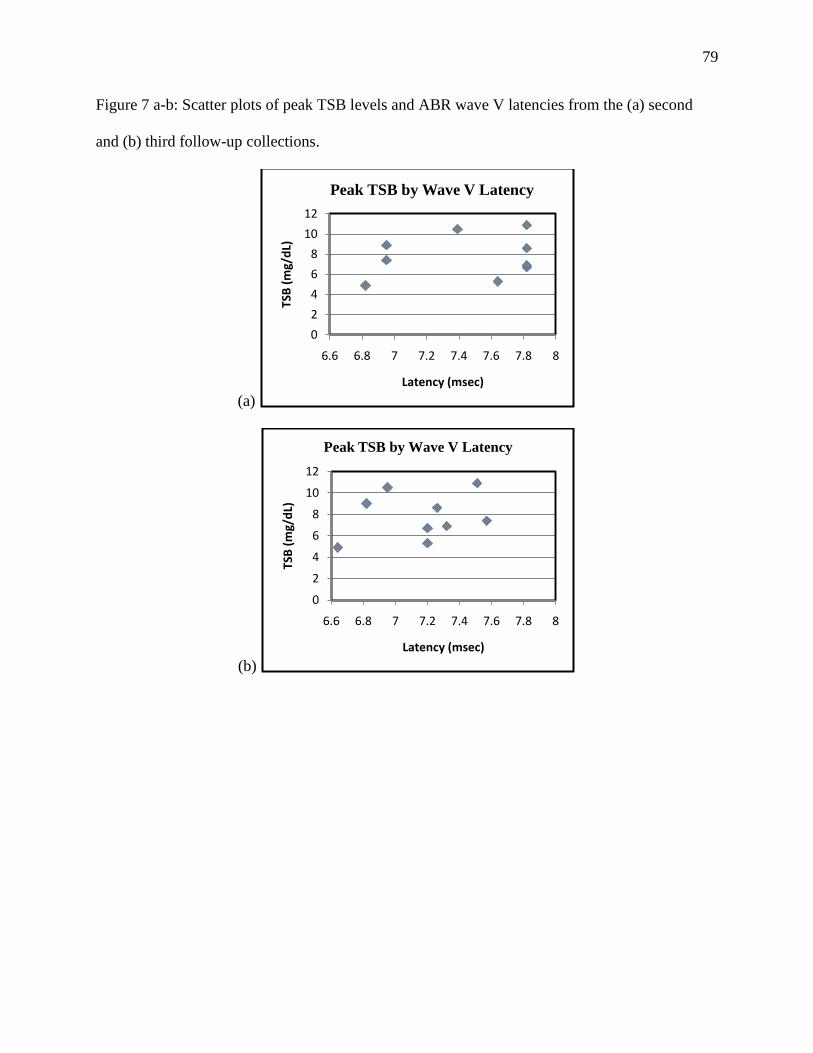
79
Figure 7 a-b: Scatter plots of peak TSB levels and ABR wave V latencies from the (a) second
and (b) third follow-up collections.
(a)
(b)
0
2
4
6
8
10
12
6.6 6.8 7 7.2 7.4 7.6 7.8 8
TSB
(m
g/d
L)
Latency (msec)
Peak TSB by Wave V Latency
0
2
4
6
8
10
12
6.6 6.8 7 7.2 7.4 7.6 7.8 8
TSB
(m
g/d
L)
Latency (msec)
Peak TSB by Wave V Latency

80
Figure 8 a-b: Scatter plots of peak TSB levels and ABR interwave interval III-V latencies from
the (a) second and (b) third follow-up collections.
(a)
(b)
0
2
4
6
8
10
12
2 2.2 2.4 2.6 2.8 3 3.2 3.4
TSB
(m
g/d
L)
Latency (msec)
Peak TSB by III-V Interwave Interval
0
2
4
6
8
10
12
2 2.2 2.4 2.6 2.8 3 3.2 3.4
Pe
ak T
SB (
mg/
dL)
Latency (msec)
Peak TSB by III-V Interwave Interval

81
Figure 9 a-b: Scatter plots of peak TSB levels and ABR interwave interval I-V latencies from the
(a) second and (b) third follow-up collections.
(a)
(b)
0
2
4
6
8
10
12
4.6 4.8 5 5.2 5.4 5.6 5.8 6 6.2
TSB
(m
g/d
L)
Latency (msec)
Peak TSB by Interwavel Interval I-V
0
2
4
6
8
10
12
4.6 4.8 5 5.2 5.4 5.6 5.8 6 6.2
Pe
ak T
SB (
mg/
dL)
Latency (msec)
Peak TSB by Interwave Interval I-V

82
Figure 10 a-b: Scatter plots of peak TSB levels and ABR thresholds from the (a) second and (b)
third follow-up collections.
(a)
(b)
0
2
4
6
8
10
12
10 15 20 25 30
TSB
(m
g/d
L)
Threshold (dB nHL)
Peak TSB by ABR Threshold
0
2
4
6
8
10
12
10 15 20 25 30
TSB
(m
g/d
L)
Threshold (dB nHL)
Peak TSB by ABR Threshold

83
Figure 11 a-c: Scatter plot of peak TSB levels and DPOAE responses from the second follow-up
collection for (a) 2 kHz, (b) 3 kHz, and (c) 4 kHz.
(a)
(b)
(c)
0
2
4
6
8
10
12
0 2 4 6 8 10 12 14 16
TSB
(m
g/d
L)
DPOAE Response (dB SPL)
Peak TSB by DPOAE 2 kHz
0
2
4
6
8
10
12
-4 -2 0 2 4 6 8 10 12 14 16
TSB
(m
g/d
L)
DPOAE Response (dB SPL)
Peak TSB by DPOAE 3 kHz
0
2
4
6
8
10
12
-4 -2 0 2 4 6 8 10 12 14 16
TSB
(m
g/d
L)
DPOAE Response (dB SPL)
Peak TSB by DPOAE 4 kHz

84
Figure 12 a-c: Scatter plots of peak TSB levels and DPOAE responses from the third follow-up
collection for (a) 2 kHz, (b) 3 kHz, and (c) 4 kHz.
(a)
(b)
(c)
0
2
4
6
8
10
12
0 2 4 6 8 10 12 14 16 18 20 22 24 26
TSB
(m
g/d
L)
DPOAE Response (dB SPL)
Peak TSB by DPOAE 2 kHz
0
2
4
6
8
10
12
0 2 4 6 8 10 12 14 16 18 20
TSB
(m
g/d
L)
DPOAE Response (dB SPL)
Peak TSB by DPOAE 3 kHz
0
2
4
6
8
10
12
0 2 4 6 8 10 12 14 16 18 20
TSB
(m
g/d
L)
DPOAE Response (dB SPL)
Peak TSB by DPOAE 4 kHz

85
APPENDIX C
HUMAN SUBJECTS COMMITTEE APPROVAL DOCUMENTATION
Recruitment of Patients
The study protocol and informed consent form were submitted to the KUMC Human
Subjects Committee (HSC) for review and approval prior to initiation of the study. Recruitment
took place from the University of Kansas Hospital NICU. Treating physicians at the KUMC
NICU under the direction of Dr. Parimi, co-primary investigator for the study, made referrals.
Patients were referred to the Department of Hearing and Speech at KUMC under the direction of
Dr. Ferraro, co-primary investigator for the study. Gabriel Bargen, lead clinical investigator for
the study, in the KUMC Department of Hearing and Speech, completed subject enrollment into
the study, ABR and OAE evaluations, and collected TSB level data. TSB level data was
collected following the completion of the ABR/OAE evaluations so the examiner was not biased
during the ABR/OAE testing. All ABR tracings and OAE responses were analyzed by the
clinical investigator and a blind observer to insure data was as accurate as possible and assessed
in a consistent manner to eliminate examiner bias.
Determination of Sample Size
Select previous studies involving hearing loss associated with elevated bilirubin levels have
included a wide range of study subjects from eleven to 143 with an average of 62.3 subjects.
Rhee, Park, and Jang (1999) included eleven neonates with severe hyperbilirubinemia in their
research to clarify the auditory lesion site of hyperbilirubinemic neonates. Kaga, Kitazumi, and
Kodama (1979) included 25 babies in their study to show ABRs effectiveness of assessing the

86
neurotoxic effects of bilirubin on the nervous system. Agrawal et al., (1998) included 30
neonates with and 25 without hyperbilirubinemia in their study to determine the initial ABR
abnormalities in babies and the research the possibility of abnormality reversal after therapy.
Tan et al. (1992) included 61 children in research to evaluate and compare the factors related to
the hearing of 30 neonates with severe hyperbilirubinemia to an age-matched control group of
31. Nakamura and colleagues (1985) included 80 infants in their study to understand the
neurotoxicity of neonatal hyperbilirubinemia using ABR. Amin et al (2001) included 143 infants
in their study to determine the usefulness of the bilirubin-albumin molar ratio and unbound
bilirubin in predicting bilirubin encephalopathy as assessed by ABR. According to a report by
Prabhu Parimi (2008), director of the KUMC NICU, approximately 220 infants are admitted
annually; of which about 70 are within the 28 to 34 weeks GA range. Based on this information,
a sample size of 30 patients was targeted for the study group and 15 patients were targeted for
the control group. By having 45 subjects overall we would have had 80% Power to detect a
correlation of .41 or larger in magnitude with a type I error rate of 5%.
Informed Consent
Gabriel Bargen, the lead clinical investigator, identifyied potential patients referred by
the treating NICU physicians and discussed the advantages, disadvantages, and the amount of
time involved for participation in the study with the patient’s parent(s). Potential risks and
benefits were discussed. If the patient’s parent(s) agreed to allow their child to participate in the
study then the HSC approved informed consent form was read, discussed and presented for
signature by the patient’s parent(s) and the principal investigator. The patient’s parent(s)
received a copy of the signed consent form.

87
Data Management
Internal monitoring concerning data management and quality control of data were carried
out by the clinical investigator and the principal investigators. Data protection was accomplished
by KUMC regulations. The KUMC network provides both a network firewall and virus
scanning protection from external threats.
Patient confidentiality was ensured by password protected files and patient charts where
applicable. Case Report Forms (CRF) and study-specific source documents (not to include the
official Kansas University Hospital Medical Record) for each subject were stored in a study
folder located in the Department of Hearing and Speech Audiology Clinic. The study folder was
stored in locked file cabinet. An ID number identified all subjects’ paper records and all other
applicable files.
The clinical investigator and principal investigators had access to the locked cabinets.
Subjects’ study numbers and associated demographic data were available in the medical record,
which included: sex, race, date of birth, date of study visits, and study number.
All patients assigned to the study were entered into a logbook. The logbook was kept by
the clinical investigator in the Hearing and Speech Department. After study inclusion, each
patient was entered into their own CRF. Data entered into the CRF included demographic
information, TBS levels, and any adverse events. Any corrections to the CRF were made in ink
by drawing a single line through the incorrect data, making the correction, dating the correction,
and providing initials of the person making the change. Every possible effort was made to
maintain confidentiality of study data in any form. Given that resources were used to support
this investigation, the data were subject to audit by the HSC.

88
At each follow-up data collection the investigator reported on the occurrance of any
adverse events since the last visit as reported by the patients medical record and bedside chart.
Information collected for the study was demographic information including risk factors for
hearing loss, TBS levels, and results from the ABR and OAE evaluations. The data were
obtained specifically for research purposes.
Protocol Deviations
No protocol deviations occurred during the completion of this research project. To
account for the majority of missing data during data analysis, an independent consulting
statistician used methods warranted to account for missing data. One subject was discharged
prior to completing data collection for the study. No additional data were collected post
discharge. Data collected up until the point of subject discharge and subsequent withdrawl from
the study were used in data analysis for the study.

89
APPENDIX D
RAW DATA
Table D1: ABR absolute latencies (msec) of waves I, III, and V at 80 dB nHL. Means ±
standard deviations are provided at bottom of table. GA, birth weight, and peak TSB are
included for reference.
Subje
ct
GA
Bir
th
wei
ght
Pea
k T
SB
Ear
Baseline 1st Follow up 2nd Follow up 3rd Follow up
Absolute Latency (ms) I III V I III V I III V I III V
1 33 1830 10.9 R 1.83 5.26 8.64 1.95 5.01 7.82 1.76 4.64 7.51
L 1.76 5.14 8.45 1.70 4.82 7.82 1.70 4.45 7.14
2 33 1610 9 R 1.70 4.14 6.82
L 1.70 5.01 8.14 1.70 4.39 6.70
3 34 1930 8.9 R 4.51 6.95 1.80 4.45 6.76
L 1.89 4.82 7.32 1.95 4.51 6.95
4 34 1930 4.9 R 1.76 4.51 7.01 4.26 6.76 1.64 4.39 6.64
L 2.00 4.45 6.70 2.20 4.64 6.82 1.51 4.26 6.51
5 28 1060 8.6 R 2.01 4.76 8.82 2.08 5.14 8.32 1.89 4.57 7.39
L 1.76 4.89 7.82 1.89 4.64 7.26
6 30 1210 5.3 R 1.89 4.64 7.64 1.95 4.32 7.20
L 2.02 5.20 7.07 2.08 4.95 6.70 1.64 4.45 7.64 1.70 4.26 7.14
7 29 1600 6.7 R 1.76 4.95 6.76 1.89 4.76 7.82 1.64 4.26 7.70
L 1.76 4.80 6.32 1.64 4.39 6.26 1.51 4.14 7.20
8 32 2113 10.5 R 1.70 4.51 7.76
L 1.58 4.20 7.39 1.85 4.51 6.95
9 31 1800 6.9 R 2.01 5.07 8.45 1.83 4.57 7.39 1.89 4.57 7.57
L 1.95 5.20 8.70 1.95 5.01 6.95 1.76 4.70 7.82 1.64 4.76 7.32
10 31 1480 7.4 R 1.76 4.32 7.07 2.85 5.39 7.57
L 1.83 4.51 7.07 1.83 4.51 7.45 1.89 4.39 6.95 1.58 4.51 6.82
m 31.5 1656.3 7.91 1.87 4.86 7.75 1.88 4.80 7.21 1.84 4.61 7.37 1.78 4.48 7.18
SD 2.07 333.40 2.03 0.12 0.31 0.81 0.13 0.30 0.77 0.17 0.26 0.56 0.30 0.29 0.37

90
Table D2: ABR latencies (msec) for I-III, III-V, and I-V interwave intervals measured at 80 dB
nHL. Means ± standard deviations are provided at the bottom of the table. GA, birth weight, and
peak TSB are included for reference.
Subje
ct
GA
Bir
th
wei
ght
Pea
k T
SB
Ear
Baseline 1st Follow up 2nd Follow up 3rd Follow up
Interwave Interval (ms) I-III III-V I-V I-III III-V I-V I-III III-V I-V I-III III-V I-V
1 33 1830 10.9 R 3.44 3.38 6.81 3.12 3.00 6.13 2.87 2.88 5.75
L 3.38 3.31 6.69 3.06 2.81 5.88 2.75 2.69 5.44
2 33 1610 9 R 2.44 2.69 5.13
L 3.31 3.13 6.44 2.69 2.31 5.00
3 34 1930 8.9 R 2.44 2.65 2.31 4.96
L 2.94 2.50 5.44 2.56 2.44 5.00
4 34 1930 4.9 R 2.75 2.50 5.25 2.50 2.75 2.25 5.00
L 2.45 2.25 4.70 2.44 2.19 4.63 2.75 2.25 5.00
5 28 1060 8.6 R 2.75 4.06 6.81 3.06 3.19 6.25 2.69 2.81 5.50
L 3.12 2.94 6.06 2.75 2.63 5.38
6 30 1210 5.3 R 2.75 3.00 5.75 2.37 2.88 5.25
L 3.18 1.88 5.05 2.87 1.75 4.63 2.81 3.19 6.00 2.56 2.88 5.44
7 29 1600 6.7 R 3.19 1.81 5.00 2.87 3.06 5.93 2.62 3.44 6.06
L 3.04 1.52 4.56 2.75 1.88 4.63 2.62 3.06 5.69
8 32 2113 10.5 R 2.81 3.25 6.06
L 2.62 3.19 5.81 2.66 2.44 5.10
9 31 1800 6.9 R 3.06 3.38 6.44 2.75 2.81 5.56 2.69 3.00 5.69
L 3.25 3.50 6.75 3.06 1.94 5.00 2.94 3.13 6.06 3.12 2.56 5.69
10 31 1480 7.4 R 2.56 2.75 5.31 2.54 2.19 4.72
L 2.69 2.56 5.25 2.69 2.94 5.63 2.50 2.56 5.06 2.93 2.31 5.24
m 31.5 1656.3 7.91 3.04 2.88 5.98 2.92 2.41 5.33 2.80 2.76 5.58 2.70 2.70 5.40
SD 2.07 333.40 2.03 0.29 0.68 0.79 0.30 0.71 0.78 0.22 0.40 0.57 0.17 0.36 0.38

91
Table D3: ABR thresholds (dB nHL) at each data collection. Means ± standard deviations are
provided at the bottom of the table. GA and peak TSB are included for reference.
Subje
ct
GA
Pea
k T
SB
Ear
Bas
elin
e
Thre
shold
1st F
ollow
-up
Thre
shold
2n
d F
ollow
-up
Thre
shold
3rd
Follow
-up
Thre
shold
1 33 10.9 R 18 23 17.5 12.5
L 23 12.5 12.5
2 33 9.0 R 17.5
L 22.5 17.5
3 34 8.9 R 12.5
L 17.5 12.5
4 34 4.9 R 17.5 12.5 17.5
L 17.5 12.5 17.5
5 28 8.6 R 12.5 7.5
L 17.5 17.5
6 30 5.3 R 17.5 17.5
L 17.5 17.5 22.5 7.5
7 29 6.7 R 17.5 27.5 17.5
L 17.5 17.5 22.5
8 32 10.5 R 17.5
L 17.5 25
9 31 6.9 R 17.5 12.5 22.5
L 37.5 17.5 22.5 27.5
10 31 7.4 R 22.5 17.5
L 17.5 17.5 12.5 17.5
M 31.5 7.91 21.07 19.10 16.25 17.36
SD 2.07 2.03 7.48 2.58 4.65 5.18

92
Table D4: DPOAE level and level of the noise floor in dB SPL from the baseline and first
follow-up collections. GA and peak TSB are included for reference.
Su
bje
ct
GA
Peak T
SB
Ear
Baseline 1st Follow up
2kHz 3kHz 4kHz 2kHz 3kHz 4kHz
DP NF DP NF DP NF DP NF DP NF DP NF
1 33 10.9 R 7.8 9.9 6.0 8.3 11.6 4.9 9.5 -5.7 7.9 -.8 6.2 -2
L 3.4 3.6 14.7 1.8 13 2.9 13.4 5.2 13.1 3.1 2 33 9 R 9.6 -.2 8.8 -.7 9.3 -.1 12.6 4.5 5.4 -6
L 7.8 -.7 8.8 -.2 10.3 -2.6 7.1 -1.8 5.4 -2.9 3 34 8.9 R 7.6 1.3 6.6 6 1.3 -3.4 7.5 -.8 3.3 -7 -2.8 -6.9
L 1.2 -7.4 4.5 -12.4 7.8 -15.2 8 -11.6 7.6 -6 8.7 -10.9
4 34 4.9 R 6.3 2.4 8.5 -.9 -2.7 -4.2 11.9 2.5 11.8 3.8 9.5 1.4 L .3 -1.3 6.1 2.7 8.6 -1.2 3.3 -14.4 -1.69 -12.4 .3 -10.7
5 28 8.6 R 8.5 -5 -6.8 -.7 -4.7 -4.8 14.7 9.7 23.3 12.8 -2.1 -1.1 L 17 7.7 5.9 7 11.3 10.6
6 30 5.3 R L
7 29 6.7 R 11.6 8.6 5.4 -4.7 11.9 .8 5.8 -3.1 5.9 -3.4 8.7 -4.5 L 5.1 -7.5 5.5 -10.6 10.3 -10 4.1 -11 5.2 -5.6 8.7 -2.2
8 32 10.5 R L 4.5 -8.6 10.5 -8.8 9.3 -10.8
9 31 6.9 R 13 3.5 7.9 -2.3 7.2 -5 L 8.5 6.9 14.4 5.3 5.9 -4 10.9 -3.4 7.5 -5 -.7 -12.6
10 31 7.4 R 12.3 3.1 9 -7.2 18.1 -4.5 L 4.7 -5 -5.1 -12.9 -2.4 -8.7 6.1 -2.4 8.6 .5 5.9 -6
Bold = SNR < 6 dB therefore the measurement not used in the analysis

93
Table D5: DPOAE level and level of the noise floor in dB SPL from the second and third follow-
up collections. GA and peak TSB are included for reference.
Su
bje
ct
GA
Peak T
SB
Ear
2nd
Follow up 3rd
Follow up
2kHz 3kHz 4kHz 2kHz 3kHz 4kHz
DP NF DP NF DP NF DP NF DP NF DP NF
1 33 10.9 R 2.3 -6.2 6.3 -8.7 2.4 -8.1 11.5 2 10.9 1.4 12.3 -3.8
L 8.3 -.3 8.8 -4.8 6.5 -4 6.1 -4.5 9.5 1.3 7.7 -4.4
2 33 9 R 15.4 1.4 18.6 3.1 16.2 .3 L 12.9 2 10.8 -4.3 10.9 -6.1 12.6 3.8 12.5 1.6 8.6 -1.5
3 34 8.9 R 8.4 0 5.1 -2.7 17.4 6 L 13 -7.8 9.7 -11.4 12.3 -17.2
4 34 4.9 R 2.2 -9.7 3.4 -8.7 3.8 -7.3 4.1 -2.8 8.1 -1.3 8 -1.6 L -3.9 -7.6 -1.3 -11.1 -1.9 -10.5 .8 -15.4 4.2 -14.6 5.5 -7.8
5 28 8.6 R 5 -2.2 .3 -5.3 4.5 -4.3 5.7 3.4 3.3 3 12.1 3.2 L 7.3 10.5 8.6 -1 3.6 -6.5 24.8 16.2 9 -4.5 7 -1.6
6 30 5.3 R 11.5 8.6 4.7 12.7 10.4 -.5 8.7 1.3 1.9 -6.9 11.4 2.1 L 2.5 .8 7.9 -3.4 4.1 -4.2 8.8 -5
7 29 6.7 R 6.3 3.1 -.5 -6 10.1 2 12.6 1.1 12.1 1.9 14.7 -.3 L 12.5 5.7 9 2.2 12.1 -3.5 12.7 4.1 12.3 2.1 15.4 4.8
8 32 10.5 R 11.7 3.4 9.4 .5 13.9 -5.8 18.1 -6.7 16.9 -9 17.7 -8 L 9.6 -2.7 10.9 -5.9 14.4 -9.9 13 -.9 18 -9.9 16.6 -7.3
9 31 6.9 R 15 6.2 12.4 0 10.3 -2.8 2.5 -6.5 14.1 5.8 18.9 .3
L 11.6 -5.7 15.9 -7.2 11 -6.8 14.2 .6 12.9 2.7 4.5 -9.6 10 31 7.4 R 3.8 -5.2 7.7 -4.2 16.5 -9.5 7 -2 12.6 4.4 11.3 -2
L 7.9 8.6 5.1 -3.6 5.5 -5 20.3 12.0 9.1 -0.1 11.8 2.1
Bold = SNR < 6 dB therefore measurement was not used in the analysis

94
Figure D1 a-h: ABR tracings from baseline collection. ABR response (dB nHL) as a function of
time (msec).
(a) Subject 1 – right ear
(b) Subject 2 – left ear
(c) Subject 3 – left and right ear

95
(d) Subject 4 – right ear
(e) Subject 5 - right ear
(f) Subject 6 – left ear

96
(g) Subject 9 – left ear
(h) Subject 10 – left ear

97
Figure D2 a- f: ABR tracings from first follow-up collection. ABR response (dB nHL) as a
function of time (msec).
(a) Subject 1 – left and right ear
(b) Subject 4 – left ear
(c) Subject 6 – left ear

98
(d) Subject 7 – left and right ear
(e) Subject 9 – left and right ear
(f) Subject 10 – left and right ear

99
Figure D3 a- i: ABR tracings from second follow-up collection. ABR response (dB nHL) as a
function of time (msec).
(a) Subject 1 – left and right ear
(b) Subject 3 – left and right ear
(c) Subject 4 – left and right ear

100
(d) Subject 5 – left and right ear
(e) Subject 6 – left and right ear
(f) Subject 7 – left and right ear

101
(g) Subject 8 – left ear
(h) Subject 9 – left and right ear
(i) Subject 10 – left ear

102
Figure D4 a- i: ABR tracings from third follow-up collection. ABR response (dB nHL) as a
function of time (msec).
(a) Subject 1 – left and right ear
(b) Subject 2 – left and right ear
(c) Subject 4 – left and right ear

103
(d) Subject 5 – left and right ear
(e) Subject 6 – left and right ear
(f) Subject 7 – left and right ear

104
(g) Subject 8 – left and right ear
(h) Subject 9 – left and right ear
(i) Subject 10 – left and right ear

105
Figure D5 a- i: DP-grams from baseline collection. DPOAE level (dB SPL) as a function of f2
frequency (Hz).
(a) Subject 1 – left and right ear
(b) Subject 2 – left and right ear
(c) Subject 3 – left and right ear

106
(d) Subject 4 – left and right ear
(e) Subject 5 – right ear
(f) Subject 7 – left and right ear

107
(g) Subject 8 – left ear
(h) Subject 9 – left ear
(i) Subject 10 – left ear

108
Figure D6 a-h: DP-grams from first follow-up collection. DPOAE level (dB SPL) as a function
of f2 frequency (Hz).
(a) Subject 1 – left and right ear
(b) Subject 2 – left and right ear
(c) Subject 3 – left and right ear

109
(d) Subject 4 – left and right ear
(e) Subject 5 – left and right ear
(f) Subject 7 – left and right ear

110
(g) Subject 9 – left and right ear
(h) Subject 10 – left and right ear

111
Figure D7 a-j: DP-grams from second follow-up collection. DPOAE level (dB SPL) as a
function of f2 frequency (Hz).
(a) Subject 1 – left and right ear
(b) Subject 2 – left ear
(c) Subject 3 – left and right ear

112
(d) Subject 4 – left and right ear
(e) Subject 5 – left and right ear
(f) Subject 6 – left ear

113
(g) Subject 7 – left and right ear
(h) Subject 8 – left and right ear
(i) Subject 9 – left and right ear (superimposed)

114
(j)Subject 10 – left and right ear

115
Figure D8 a- i: DP-grams from third follow-up collection. DPOAE level (dB SPL) as a function
of f2 frequency (Hz).
(a) Subject 1 – left and right ear
(b) Subject 2 – left and right ear
(c) Subject 4 – left and right ear

116
(d) Subject 5 – left and right ear
(e) Subject 6 – left and right ear
(f) Subject 7 – left and right ear

117
(g) Subject 8 – left and right ear
(h) Subject 9 – left and right ear
(i) Subject 10 – left and right ear

118
REFERENCES
Abdala, C., Oba, S., & Ramanathan, R. (2008). Changes in the DP-gram during the preterm and
early postnatal period. Ear & Hearing; 29(4): 512-523.
doi: 10.1097/AUD.0b013e31816c40bb.
Agrawal, V.K., Shukla, R., Misra, P.K., Kapoor, R.K., & Malik, G.K. (1998). Brainstem
auditory evoked response in newborns with hyperbilirubinemia. Indian Journal of
Pediatrics; 35(6): 513-8.
Ahdab-Barmada, M. & Moossy, J. (1984). The neuropathology of kernicterus in the premature
neonate: diagnostic problems. Journal of Neuropathology & Experimental Neurology;
43: 45–56.
Ahlfors, C.E. (1994). Criteria for exchange transfusion in jaundiced newborns. Pediatrics; 93(3):
488-94.
Allen, F. H., Diamond, L. K., & Vaughan, V. C. (1950). Erythroblastosis fetalis. VI. Prevention
of kernicterus. American Medical Association American Journal of Diseases in Children;
80(5): 779-791.
Allen, F. H., Diamond, L. K., & Watrous, J. B. (1949). Erythroblastosis fetalis; the value of
blood from female donors for exchange transfusion. New England Journal of Medicine;
241(21): 799-806.
Amato, M. M., Kilguss, N. V., Gelardi, N. L., & Cashore, W. J. (1994). Dose-effect relationship
of bilirubin on striatal synaptosomes in rats. Biol Neonate; 66: 288-93.
Amatuzzi, M., Northrop, C., Liberman, M., Thornton, A., Halpin, C., Herrmann, B., Pinto, L. E.,
Saenz, A., Carranza, A., Eavey, R. D. (2001). Selective inner hair cell loss in premature
infants and cochlea pathological patterns from neonatal intensive care unit autopsies.
Achieves of Otolaryngology - Head & Neck Surgery; 127: 629-636.
American Academy of Pediatrics. (1994). Practice parameters: management of
hyperbilirubinemia in the healthy term newborn. Pediatrics; 94: 558-565.
American Academy of Pediatrics. (2004). Clinical practice guidelines: management of
hyperbilirubinemia in the newborn infant 35 or more weeks of gestation. Pediatrics; 114:
297-316.
American Academy of Pediatrics, Committee of Environmental Health. (1997). Noise: a hazard
for the fetus and newborn. Pediatrics; 100(4): 724-727.
Amin, S. B. (2004). Clinical assessment of bilirubin-induced neurotoxicity in premature infants.
Seminars in Perinatology; 28(5): 340-347. doi: 10.1053/j.semperi.2004.09.005
119
Amin, S. B., Ahlfors, C., Orlando, M. S., Dalzell, L. E., Merle, K. S., & Guillet, R. (2001).
Bilirubin and serial auditory brainstem responses in premature infants. Pediatrics; 107:
664-670.
Amin, S. B., Orlando, M. S., Dalzell, L. E., Merle, K. S., & Guillet, R. (1999). Morphological
changes in serial auditory brain stem responses in 24 to 32 weeks’ gestational age infants
during the first week of life. Ear & Hearing; 20: 410-418.
Arnold, S. (2000). The auditory brain stem response. In R. Roeser, M. Valente, & H. Hosford-
Dunn (Ed.): Audiology: Diagnosis. New York, NY: Medical Publishers, Inc.; 451-470.
Ballachanda, B., Crawford, M., Ferraro, J., & Griffiths, S. (2003). Auditory evoked potentials.
American Speech-Language-Hearing Association. Retrieved from the internet on
February 16, 2007 from http://www.asha.org/NR/rdonlyres/CA4789BD-54B5-4A00-
92E5-E4E4786CB30B/0/AEPtutorial.pdf .
Bergman, I., Hirsch, R. P., Fria, T. J., Shapiro, S. M., Holzman, I., & Painter, M. J. (1985).
Cause of hearing loss in the high-risk premature infant. The Journal of Pediatrics;
106(1): 95-101.
Bhutani, V.K. & Johnson, L.H. (2004). Urgent clinical need for accurate and precise bilirubin
measurements in the United States to prevent kernicterus. Clinical Chemistry; 50: 477-
480.
Bhutani, V.K., Johnson, L.H., & Sivieri, E.M. (1999). Predictive ability of a predischarge hour-
specific serum bilirubin for subsequent significant hyperbilirubinemia in healthy term and
near-term newborns. Pediatrics; 103: 6-14.
Billings, B.H., Cole, P.G., & Lathe, G.H. (1954). Increased plasma bilirubin in newborn infants
in relation to birth weight. British Medical Journal; 2: 1263-5.
Billings, K.R. & Kenna, M.A. (1999). Causes of pediatric sensorineural hearing loss. Archives
of Otolaryngology-Head & Neck Surgery; 125: 517-521.
Bratlid, D. (1990). How bilirubin gets into the brain. Clinics in Perinatology; 17: 449-65.
Brouillard, R. (1974). Measurement of red blood cell life-span. Journal of the American Medical
Association; 230: 1304-1305.
Brown, D. K., Bowman, D. M., & Kimberley, B. P. (2000). The effects of maturation and
stimulus parameters on the optimal f2/f1 ratio of the 2f1-f2 distortion product otoacoustic
emission in neonates. Hearing Research; 145: 17-24.
Buchman, C. A., Roush, P. A., Teagle, H. F., Brown, C. J., Zdanski, C. J., & Grose, J. H. (2006).
Auditory neuropathy characteristics in children with cochlear nerve deficiency. Ear &
Hearing; 27: 399-408.
120
Burkard, R. F. & Secor, C. (2002). Overview of auditory evoked potentials. In J. Katz (Ed.):
Handbook of Clinical Audiology. 5th
ed. Baltimore, Maryland: Lippincott Williams &
Wilkins; 233-248.
Cashore, W. J. (2000). Bilirubin and jaundice in the micropremie. Clinics in Perinatology; 27:
171-179.
Cashore, W. J. & Oh, W. (1982). Unbound bilirubin and kernicterus in low birth weight infants.
Pediatrics; 69: 481-485.
Chisin, R., Perlman, M., & Sohmer, H. (1979). Cochlear and brain stem responses in hearing
loss following neonatal hyperbilirubinemia. The Annals of Otology, Rhinology &
Laryngology; 88: 352-357.
Chuniaud, L., Dcssantc, M., Chantoux, F., Blondeau, J. P., Francon, J., & Trivin, E. (1996).
Cytotoxicity of bilirubin for human fibroblasts and rat astrocytes in culture: effect of the
ratio of bilirubin to serum albumin. Clinica chimica acta; International Journal of
Clinical Chemistry; 256: 103-114.
Conlee, J. W. & Shapiro, S. M. (1991). Morphological changes in the cochlear nucleus and
nucleus of the trapezoid body in Gunn rat pups. Hearing Research; 57(1): 23-30.
Cox, L. C. (1985). Infant assessment: developmental and age related considerations. In J.
Jacobson (Ed): The Auditory Brainstem Response. San Diego: College-Hill Press.; 301.
Cremer, R. J., Perryman, P. W., & Richards, D. H. (1958). Influence of light on the
hyperbilirunbinemia of infants. Lancet; 1: 1094-1017.
Darcy, A., Hancock, L., & Ware, E. (2008). A descriptive study of noise in the neonatal
intensive care unit. Advances in Neonatal Care; 8(3): 165-175.
Deltenre, P., Mansbach, A. L., Bozet, C., Clercx, A., & Hecox, K. E. (1997). Auditory
neuropathy: a report on three cases with early onsets and major neonatal illnesses.
Electroencephalography and clinical neurophysiology; 104(1): 17-22.
Dennery, P.A., Seidman, D.S., and Stevenson, D.K. (2001). Neonatal hyperbilirubinemia. The
New England Journal of Medicine; 344: 581-590.
de Vries, L. S., Lary, S., & Dubowitz, L. M. S. (1985). Relationship of serum bilirubin levels to
ototoxicity and deafness in high-risk low birth weight infants. Pediatrics; 76: 351-354.
Diamond, L. K. (1948). Replacement transfusion as a treatment for erythroblastosis fetalis.
Pediatrics; 2(5): 520-524.
Diamond, L. K., Allen, F. H. Jr., & Thomas, W. O. (1951). Erythroblastosis fetalis. VII.
Treatment with exchange transfusion. New England Journal of Medicine; 244: 39-49.

121
Don, M. & Kwong, B. (2002). Auditory Brainstem Response: differential diagnosis. In J. Katz
(Ed.): Handbook of Clinical Audiology. 5th
ed. Baltimore, Maryland: Lippincott,
Williams & Wilkins 274-297.
Dublin, W. (1951). Neurological lesions in erythroblastosis fetalis in relation to nuclear deafness.
American Journal of Clinical Pathology; 21: 935–9.
Dublin, W. (1976). Fundamentals of Sensorineural Auditory Pathology. Springfield (IL):
Charles C. Thomas.
Elberling, C., & Don, M. (1987). Threshold characteristics of the human auditory brain stem
response. Journal of the Acoustical Society of America; 81: 115-121.
Ferraro, J. (1997). Laboratory exercises in auditory evoked potentials. San Diego, CA: Singular
Publishing Group, Inc.
Funato, M., Tamai, H., Shimada, S., & Nakamura, H. (1994). Vigintiphobia, unbound bilirubin,
and auditory brainstem responses. Pediatrics; 93: 50-53.
Garg, A. K., Prasad, R. S., & Hifzi, I. A. (1995). A controlled trial of high-intensity double-
surface phototherapy on a fluid bed versus convertional phototherapy in neonatal
jaundice. Pediatrics; 95: 914-916.
Gartner, L. M., Herrarias, C. T., & Sebring, R. H. (1998). Practice patterns in neonatal
hyperbilirubinemia. Pediatrics; 101(1): 25-31.
Gartner, L. M., Snyder, R. N., Chaban, R. S., & Bernstein, J. (1970). Kernicterus: high incidence
in premature infants with low serum bilirubin concentrations. Pediatrics; 45: 906-917.
Gerrard J. (1952). Nuclear jaundice and deafness. Journal of Laryngology & Otology; 66: 39-46.
Goldson, E. (1999). Nurturing the Premature Infant: Developmental Interventions in the
Neonatal Intensive Care Nursery. New York: Oxford University Press.
Gorga, M. P., Kaminski, J. R., Beuachaine, K. L., & Bergman, B. M. (1993a). A comparison of
auditory brain stem response thresholds and latencies elicited by air- and bone-conducted
stimuli. Ear & Hearing; 14(2): 85-94.
Gorga, M. P., Neely, S. T., Bergman, B., Beauchaine, K. L., Kaminski, J. R., Peters, J., &
Jesteadt, W. (1993b). Otoacoustic emissions from normal-hearing and hearing-impaired
subjects: distortion product responses. Journal of the Acoustical Society of America; 93(4
Pt 1): 2050-2060.
Gorga, M. P., Neely, S. T., Ohlrich, B., Hoover, B., Redner, J., & Peters, J. (1997). From
laboratory to clinic: a large scale study of distortion product otoacoustic emissions in ears
with normal hearing and ears with hearing loss. Ear & Hearing; 18(6): 440-455.

122
Gorga, M. P., Norton, S. J., Sininger, Y. S., Cone-Wesson, B., Folsom, R. C., Vohr, B. R.,
Widen, J. E., & Neely, S. T. (2000). Identification of neonatal hearing impairment:
distortion product otoacoustic emissions during the perinatal period. Ear & Hearing;
21(5): 400-424.
Gorga, M. P., Reiland, J. K., Beauchaine, K. A., Worthington, D. W., & Jesteadt, W. (1987).
Auditory brainstem responses from graduates of an intensive care nursery: normal
patterns of response. Journal of Speech and Hearing Research; 30: 311-318.
Grundmeier, R. W., Swietlik, M., & Bell, L. M. (2007). Research subject enrollment by primary
care pediatricians using an electronic health record. AMIA Annual Symposium
Proceedings. October 11: 289-293.
Hansen, T. W. (1996). Therapeutic approaches to neonatal jaundice. An international survey.
Clinical Pediatrics; 35: 309-316.
Harris, R.C. (1961). Peak levels of serum bilirubin in normal premature infants. In A. Sass-
Kortsak (Ed.): Kernicterus. Toronto, Canada: University of Toronto Press; 10-12.
Hass, P. (1999). Differentiation and diagnosis of jaundice. American Association of Critical-
Care Nurses Clinical Issues Advanced Practice in Acute Critical Care; 10(4): 433-441.
Haymaker, W. Margles, C., & Pentschew, A. (1961). Pathology of kernicterus and posticteric
encephalopathy. In C. A. Swinyard (ed.): Kernicterus and Its Importance in Cerebral
Palsy. Springfield (IL): Charles C. Thomas: 21-229.
Hoffman, D. H., Zanelli, S. A., Kubin, J., Mishra, O. P., & Delivoria-Papadopoulos, M. (1996).
The in vivo effect of bilirubin on the N-methyl-D-aspartate receptor/ ion channel
complex in the brains of newborn piglets. Pediatric Research; 40: 804-808.
Hovi, L. & Siimes, M. A. (1985). Exchange transfusion with fresh heparinized blood is a safe
procedure: Experiences from 1069 newborns. Acta Paediatr Scand; 74: 360-365.
Hulzebos, C.V., van Imhoff, D.E., Bos, A.F., Ahlfors, C.E., Verkade, H.J., & Dijk, P.H. (2008).
Usefulness of bilirubin/albumin ratio for predicting bilirubin-induced neurotoxicity in
premature infants. Archives of Disease in Childhood-Fetal and Neonatal Edition;
doi:10.1136/adc.2007.134056.
Hyde, M. L. (1985). The effect of cochlear lesions on the ABR. In J.T. Jacobson (Ed.):
Auditory Brainstem Response. San Diego, CA: College-Hill Press; 133-146.
Ives, N. K. (1999). Neonatal jaundice. In J. M. Rennie & N. R. C. Roberton (Eds.): Textbook of
neonatology. New York: Churchill Livingston: 715-732.

123
Jackson, J. C. (1997). Adverse events associated with exchange transfusion in healthy and ill
newborns. Pediatrics; 99(5):e7. Available at:
www.pediatrics.org/cgi/content/full/99/5/e7
Jerger, J., & Mauldin, L. (1978). Prediction of sensorineural hearing level from the brain stem
evoked response. Archives of Otolaryngology; 104: 456-461.
Johnson, R. & Kuby, P. (2004). Elementary Statistics. 9th
ed. Belmont, CA: Brooks/Cole,
Thompson Learning Inc.; 654-707.
Joint Committee on Infant Hearing (2007). Year 2007 Position Statement: Principles and
guidelines for early hearing detection and intervention programs. Pediatrics; 120: 898-
921.
Kaga, K., Kitazumi, E., & Kodama, K. (1979). Auditory brain stem responses of kernicterus
infants. International Journal of Pediatric Otorhinolaryngology; 1: 255-264.
Kaplan, M., Muraca, M., Hammerman, C., Rubaltelli, F., Vilei, M. T., Vreman, H. J., &
Stevenson, D. K. (2002). Imbalance between production and conjugation of bilirubin: a
fundamental concept in the mechanism of neonatal jauncide. Pediatrics; 110(4): e47.
Keefe, D. H. & Abdala, C. (2007). Theory of forward and reverse middle-ear transmission
applied to otoacoustic emissions in infants and adult ears. Journal of the Acoustical
Society of America; 121(2): 978-993.
Keefe, D. H., Bulen, J. C., Arehart, K. H., & Burns, E. M. (1993). Ear-canal impedance and
reflection coefficient in human infants and adults. The Journal of the Acoustical Society
of America; 94(5): 2617-2638.
Keenan, W. J., Novak, K. K., Sutherland, J. M., Bryla, D. A., & Fetterly, K. L. (1985). Morbidity
and mortality associated with exchange transfusion. Pediatrics; 75: 417-421.
Kelemen, G. (1956). Erythroblastosis fetalis. Pathologic report on the hearing organs of the
newborn infant. American Medical Association – Archives of Otolaryngology; 63: 392-
398.
Kemp, D. T. (1978). Stimulated acoustic emissions from within the human auditory system.
Journal of Acoustical Society of America; 64: 1386-1391.
Kraus, N., Ozdamar, O., Stein, L., & Reed, N. (1984). Absent auditory brain stem response:
peripheral hearing loss or brain stem dysfunction? Laryngoscope; 94:400-6.
Kreuger, C., Wall, S., Parker, L., & Nealis, R. (2005). Elevated sound levels within a busy
NICU. Neonatal Netw; 24(6): 33-37.
Kroll, J. A. (editor). (2001). An Industry in Evolution. Boston, Mass: CenterWatch.
124
Lasky, R. & Williams, A. (2009). Noise and light exposures for extremely low birth weight
newborns during their stay in the neonatal intensive care unit. Pediatrics; 123: 540-546.
Lauer, B. A., Githens, J. H., Hayward, A. R., Conrad, P. D., Yanagihara, R. T., & Tubergen, D.
G. (1982). Probable graft-vs-graft reaction in an infant after exchange transfusions.
Pediatrics; 70: 43-47.
Lightner, D. A. & McDonagh, A. F. (1984). Molecular mechanisms of phototherapy for neonatal
jaundice. Accounts of Chemical Research; 17: 417-424.
Livaditis, A., Wallgren, G., & Faxeluis, G. (1974). Necrotizing enterocolitis after catheterization
of the umbilical vessels. Acta Paediatr Scand; 63: 277-282.
Lonsbury-Martin, B. & Martin, G. (2007). In M. Robinette & T. Glattke (Eds.): Otoacoustic
Emissions: Clinical Applications. 3rd
ed. New York: Thieme Medical Publishers; 107-
130.
Lucey, J., Ferriero, M., & Hewitt, J. (1968). Prevention of hyperbilirubinemia of prematurity by
phototherapy. Pediatrics; 41: 1047-1054.
Madden, C., Rutter, M., Hilbert, L., Greinwald, J. H. Jr., & Choo, D. I. (2002). Clinical and
audiological features in auditory neuropathy. Archives of Otolaryngology-Head & Neck
Surgery; 128: 1026-1030.
Maisels, M. J. (2001). Neonatal hyperbilirubinemia. In M. H. Klaus & A. A. Fanaroff (Eds.):
Care of the High Risk Neonate. Philadelphia: WB Saunders, Co.; 324-362.
Maisels, M. J. (2001). Phototherapy: traditional and nontraditional. Journal of Perinatology; 21:
S93-S97.
Maisels, M. J. (1999). Jaundice. In G. B. Avery, M. A. Fletcher, & M. G. McDonald (Eds.):
Neonatology: pathophysiology and management of the newborn. Philadelphia: JB
Lippincott, Co; 765-819.
Maisels, M. J. (1996). Why use homeopathic doses of phototherapy? Pediatrics; 98: 283-287.
Maisels, M. J. & Kring, E. (2006). The contribution of hemolysis to early jaundice in normal
newborns. Pediatrics; 118: 276-279.
Maisels, M. J. & McDonagh, A. F. (2008). Phototherapy for neonatal jaundice. New England
Journal of Medicine; 358: 920-928.
Maisels, M. J. & Newman, T. B. (1995). Kernicterus in otherwise healthy, breast-fed term
newborns. Pediatrics; 96: 730-733.

125
Maisels, M.J. & Watchko, J.F. (2003). Treatment of jaundice in low birthweight infants.
Archives of Disease in Childhood-Fetal and Neonatal Edition; 88(6): F459-F463.
Martinez, J. C., & Garcia, H. O., Otheguy, L. E., Drummond, G. S., & Kappas, A. (2001).
Treatment of hyperbilirubinemia pharmacologic approach SnMP (tin-mesoporphyrin).
Journal of Perinatology; 21: S101-S103.
Matkin, N. D. & Carhart, R. (1966). Auditory profiles associated with Rh incompatibility.
Archives of Otolaryngology; 84: 56-67.
Mosis, G., Dieleman, J. P., Stricker, B. Ch., van der Lei, J., & Sturkenboom, M. C. (2006). A
randomized database study in general practice yielded quality data but patient recruitment
in routine consultation was not practical. Journal of Clinical Epidemiology, 59(5): 497-
502.
Møller, A. R. (1994). Neural generators of auditory evoked potentials. In J. Jacobson(Ed.):
Principles and Applications in Auditory Evoked Potentials. Boston: Allyn & Bacon; 23-
46.
Møller, A. R., Jannnetta, P. J., & Jho, H. D. (1994). Click-evoked responses from the cochlear
nucleus: a study in human. Electroencephalography and clinical neurophysiology; 92(3):
215-224.
Møller, A. R., Jho, H. D., Yokota, M., & Jannetta, P. J. (1995). Contribution from crossed and
uncrossed brainstem structures to the brainstem auditory evoked potentials: a study in
humans. Laryngoscope; 105(6): 596-605.
Musiek, F. (2010, January 19). Hyperbilirubinemia and auditory neuropathy/auditory dys-
synchrony: interview with Frank Musiek, PhD. Retrieved February 3, 2010, from
American Academy of Audiology website:
http://www.audiology.org/news/Pages/20100119.aspx
Nakamura, H., Takada, S., Shimabuku, R., Matsuo, M., Matsuo, T., & Negishi, H. (1985).
Auditory nerve and brainstem responses in newborn infants with hyperbilirubinemia.
Pediatrics; 75(4): 703-708.
National Institutes of Health (NIH). (1993). Consensus statement: early identification of
hearing impairment in infants and young children. Online Mar 1-3; 11(1): 1-24.
Newman, T. B. & Maisels, M. J. (1992). Evaluation and treatment of jaundice in the term
newborn: a kinder, gentler approach. Pediatrics; 89: 809-818.

126
Norton, S. J., Widen, J. E., Gorga, M. P., Folsom, R. C., Sininger, Y., Cone-Wesson, B., Vohr,
B. R., Mascher, K., & Fletcher, K. (2000). Identification of neonatal hearing impairment
evaluation of transient evoked otoacoustic emission, distortion product otoacoustic
emission, and auditory brain stem response test performance. Ear & Hearing; 21(5):
508-528.
Ogun, B., Serbetcioglu, B., Duman, N., Ozkan, H., & Kirkim, G. (2003). Long-term outcomes
of neonatal hyperbilirubinemia: subjective and objective audiological measures. Clinical
Otolaryngology; 28: 507-13.
O’Shea, T. M., Dillard, R. G., Klinepeter, K. D., & Goldstein, D. J. (1992). Serum bilirubin
levels, intracranial hemorrhage, and the risk of developmental problems in very low birth
weight infants. Pediatrics; 90: 888-892.
Oysu, C., Ulubil, A., Aslan, I., & Baserer, N. (2002). Incidence of cochlear involvement in
hyperbilirubinemic deafness. The Annals of Otology, Rhinology & Laryngology; 111:
1021-1025.
Parimi, P. (2008, December 3). Associate Professor of Neonatology, University of Kansas
Medical Center. Personal communication.
Perlman, M., Fainmesser, P., Sohmer, H., Tamari, H., Wax, Y., & Pevsmer, B. (1983). Auditory
nerve-brainstem evoked responses in hyperbilirubinemic neonates. Pediatrics; 72(5):
658-664.
Prieve, B. A. & Fitzgerald, T. S. (2002). Otoacoustic Emissions. In J. Katz (Ed.): Handbook of
Clinical Audiology. 5th
ed. Baltimore: Baltimore, Maryland: Lippincott Williams &
Wilkins; 440-466.
Rance, G., Beer, D. E., Cone-Wesson, B., Shepherd, R. K., Dowell, R. C., King, A. M.,
Rickards, F. W., & Clark, G. M. (1999). Clinical findings for a group of infants and
young children with auditory neuropathy. Ear & Hearing; 20(3): 238-252.
Rapin, I. & Gravel, J. (2006). Auditory neuropathy: a biologically inappropriate label unless
acoustic nerve involvement is documented. Journal of American Academy of Audiology;
17: 147-150.
Reddy, P., Najundaswamy, S., Mehta, R., Petrova, A., & Hegyi, T. (2003). Tin-mesoporphyrin in
the treatment of severe hyperbilirubinemia in a very-low-birth-weight infant. Journal of
Perinatology; 23: 507-508. DOI: 10.1038/sj.jp7210943
Rhee, C., Park, H., & Jang, Y. (1999). Audiologic evaluation of neonates with severe
hyperbilirubinemia using transiently evoked otoacoustic emissions and auditory
brainstem responses. The Laryngoscope.; 109(12): 2005-2008.

127
Robinette, M. S. (1992). Clinical observations with transient evoked otoacoustic emissions with
adults. Seminars in Hearing; 13: 23-36.
Rotteveel, J. J., de Graaf, R., Colon, E. J., Stegeman, D. F., & Visco, Y. M. (1987). The
maturation of the central auditory conduction in preterm infants until three months post
term. II. The auditory brainstem responses (ABRs). Hearing Research; 26: 21-35.
Seidman, D. S., Moise, J, Ergaz, Z., Laor, A., Vreman, H. J., Stevenson, D. K., & Gale, R.
(2000). A new blue light-emitting phototherapy device: a prospective randomized
controlled study. Journal of Pediatrics; 136: 771-774.
Shapiro, S. M. (1993). Reversible brainstem auditory evoked potential abnormalities in
jaundiced Gunn rats given sulfonamide. Pediatric Research; 34(5): 629-633.
Shapiro, S. M. & Conlee, J. W. (1991). Brainstem auditory evoked potentials correlate with
morphological changes in Gunn rat pups. Hearing Research; 57(1): 16-22.
Shapiro, S. M. & Daymond, M. J. (2003). Patterns of kernicterus related to neonatal
hyperbilirubinemia and gestational age. Pediatric Research; 53-54(Part 2): 398A-399A.
Shapiro, S. M. & Hecox, K. E. (1988). Developmental studies of brainstem auditory evoked
potentials in jaundiced Gunn rats. Brain Research; 469(1-2): 147-157.
Shapiro, S. M. & Hecox, K. E. (1989). Brain stem auditory evoked potentials in jaundiced Gunn
rats. Annals of Otology, Rhinology & Laryngology; 98(4 Pt 1): 308-317.
Shapiro, S. M. & Nakamura, H. (2001). Bilirubin and the auditory system. Journal of
Perinatology; 21: S52-S55.
Shapiro, S. M., Rosen, J. R., & Dixon, K. T. (2002). Auditory brainstem responses and auditory
neuropathy abnormalities in children with neonatal hyperbilirubinemia who subsequently
develop kernicterus. Pediatric Research; 51(Part 2): 340A
Sheykholeslami, K. & Kaga, K. (2000). Otoacoustic emissions and auditory brainstem responses
after neonatal hyperbilirubinemia. International Journal of Pediatric
Otorhinolaryngology; 52(1):65-73.
Sininger, Y. (1993). Auditory brain stem response for objective measures of hearing. Ear &
Hearing; 14: 23-30.
Sininger, Y. (1995). Filtering and spectral characteristics of averaged auditory brain-stem
response and background noise in infants. Journal of the Acoustical Society of America;
98(4): 2048-2055.

128
Sininger, Y. & Cone-Wesson, B. (2002). Threshold prediction using auditory brainstem
response and steady-state evoked potentials with infants and young children. In J. Katz
(Ed.): Handbook of Clinical Audiology. 5th
ed. Baltimore, Maryland: Lippincott,
Williams & Wilkins; 298-322.
Smurzynski, J. (1994). Longitudinal measurements of distortion-producet and click-evoked
Otoacoustic emissions of preterm infants: preliminary results. Ear & Hearing; 15(3):
210-223.
Smurzynski, J., Jung, M., Lafreniere, D., Kim, D., Kamath, M.V., Rowe, J., Holman, M., &
Leonard, G. (1993). Distortion-product and click-evoked otoacoustic emissions of
preterm and full-term infants. Ear & Hearing; 14(4): 258-274.
Stegeman, D. F., Van Oosterom, A., Colon, E. J. (1987). Far-field evoked potential components
induced by a propagating generator: computational evidence. Electroencephalogram
Clinical Neurophysiology; 67: 176-187.
Stein, L.K., Tremblay, K., Pasternak, J., Banerjee, S., Lindemann, K., & Kraus, N. (1996).
Brainstem abnormalities in neonates with normal otoacoustic emissions. Seminars in
Hearing. 17:2, 197-213.
Stevens, J. C. (1988). Click-evoked oto-acoustic emissions in normal and hearing-impaired
adults. British Journal of Audiology; 2: 45-49.
Suresh, G., Martin, C. L., & Soll, R. (2003). Metalloporphyrins for treatment of unconjugated
hyperbilirubinemia in neonates. Cochrane Database Systematic Reviews; 1: CD004207.
doi: 10.1002/14651858.CD004207
Tan, K. L. (1991). Phototherapy for neonatal jaundice. Clinical Perinatology; 18: 423-439.
Tan, K. L., Skurr, B. A., & Yip, Y. Y. (1992). Phototherapy and the brainstem auditory evoked
response in neonatal hyperbilirubinemia. Journal of Pediatrics; 120: 306-308.
Turkel, S. B., Miller, C. A., Guttenberg, M. E., Moynes, D. R., & Hodgman, J. E. (1982). A
clinical pathologic reappraisal of kernicterus. Pediatrics; 69: 267-272.
van de Bor, M., van Zeben-van der Aa, T. M., Verloove-Vanhorick, S. P., Brand, R., & Ruys, J.
H. (1989). Hyperbilirubinemia in preterm infants and neurodevelopmental outcome at
two years of age: results of a national collaborative survey. Pediatrics; 83: 915-920.
Vreman, H. J., Wong, R. J., Stevenson, D. K., Route, R. K., Reader, S. D., Fejer, M. M., Gale,
R., & Seidman, D.S. (1998). Light-emitting diodes: a novel fight source for phototherapy.
Pediatric Research; 44:804-809.

129
Vohr, B.R., Widen, J.E., Cone-Wesson, B., Sininger, Y.S., Gorga, M.P., Folsom, R.C., &
Norton, S.J. (2000). Identification of neonatal hearing impairment: characteristics of
infants in the neonatal intensive care unit and well-baby nursery. Ear & Hearing; 21(5):
373-382.
Vohr, B. R., Karp, D., O'Dea, C., Darrow, D., Coll, C. G., Lester, B. M., Brown, L, Oh, W., &
Cashore, W. (1990). Behavioral changes correlated with brain-stem auditory evoked
responses in term infants with moderate hyperbilirubinemia. Journal of Pediatrics; 117(2
Pt 1): 288-291.
Walsh, W., McCullough, K., & White, R. (2006). Room for improvement: nurses’ perceptions of
providing care in a single room newborn intensive care setting. Advances in Neonatal
Care; 6: 261-270.
Watchko, J.F. (2000). The clinical sequelae of hyperbilirubinemia. In M. J. Maisels & J. F.
Watchko, (eds.): Neonatal Jaundice. Amsterdam: Harwood Academic Publishers;
115-135.
Watchko, J. F. (2000). Exchange transfusion in the management of neonatal hyperbilirubinemia.
In M. J. Maisels & J. F. Watchko (eds.): Neonatal Jaundice. Amsterdam: Harwood
Academic Publishers; 169-176.
Watchko, J. F. & Maisels, M. J. (2003). Jaundice in low birthweight infants: pathobiology and
outcome. Archives of Disease in Childhood-Fetal and Neonatal Edition; 88:F455-F458.
Wennberg, R. P., Ahlfors, C. E., Bhutani, V. K., Johnson, L. H., & Shapiro, S. M. (2006).
Toward understanding kernicterus: a challenge to improve the management of jaundiced
newborns. Pediatrics; 117(2): 474-485. doi: 10.1542/peds.2005-0395
Wong, V., Chen, W. X., & Wong, K. Y. (2005). Short- and long-term outcome of severe
neonatal nonhemolytic hyperbilirubinemia. Journal of Child Neurology; 21: 309-315.