relationship between acculturation status and …
TRANSCRIPT

i
RELATIONSHIP BETWEEN ACCULTURATION STATUS AND DIABETES
PREVALENCE IN HISPANIC IMMIGRANTS
By
Sandra Garcia
A Dissertation Submitted in Partial Fulfillment of the Requirements for the Degree of Doctor of Philosophy in Biomedical Informatics
Department of Health Informatics
School of Health Related Professions
Rutgers, the State University of New Jersey
April 8, 2016
Relationship Between Acculturation And Diabetes Prevalence
In Hispanic Immigrants
Sandra Garcia
Shankar Srinivasan PhD
Frederick Coffman PhD
Samer Kottiech MD
Final Dissertation Defense Approval Form
BY
Dissertation Committee:
Approved by the Dissertation Committee:
______________________________________________ Date: __________________
______________________________________________
______________________________________________
______________________________________________
______________________________________________
Date: __________________
Date: __________________
Date: __________________
Date: __________________
iii
Abstract
The purpose of the study was to explore the relationship between acculturation
status and diabetes prevalence in U.S. Hispanics. Thus, the study goal was to determine
if acculturation status predicts diabetes prevalence in Hispanics in the U.S. The main
hypothesis for this study is: Acculturation status significantly predicts diabetes prevalence
in Hispanic adults. This main hypothesis is based on the main research question: How
does acculturation status relate to diabetes prevalence in adult Hispanics in the U.S.? In
addition, the study included an investigation into covariates that might influence the
relationship between acculturation status and diabetes prevalence. Thus, the relationships
between age, gender, occupation, income, health insurance, physical activity and fitness,
alcohol use, smoking and tobacco use, weight history, anyone on a special diet, types of
food available at home, and types of food prepared-eaten and diabetes prevalence were
explored. This study was therefore driven by the following research questions and
associated statistical hypotheses:
Research Question #1: How does acculturation status relate to diabetes
prevalence in adult Hispanics in the U.S.?
Research Question #2: How does age relate to diabetes prevalence in adult
Hispanics in the U.S.?
Research Question #3: How does gender relate to diabetes prevalence in adult
Hispanics in the U.S.?
Research Question #4: How does occupation relate to diabetes prevalence in
adult Hispanics in the U.S.?
iv
Research Question #5: How does income relate to diabetes prevalence in adult
Hispanics in the U.S.?
Research Question #6: How does health insurance relate to diabetes prevalence
in adult Hispanics in the U.S.?
Research Question #7: How does physical activity and fitness relate to diabetes
prevalence in adult Hispanics in the U.S.?
Research Question #8: How does alcohol use relate to diabetes prevalence in
adult Hispanics in the U.S.?
Research Question #9: How does smoking and tobacco use relate to diabetes
prevalence in adult Hispanics in the U.S.?
Research Question #10: How does weight history relate to diabetes prevalence
in adult Hispanics in the U.S.?
Research Question #11: How do acculturation status, age, gender, occupation,
income, health insurance, physical activity and fitness, alcohol use, smoking and tobacco
use, and weight history relate to diabetes prevalence in adult Hispanics in the U.S.?
Research Question #11b: How do acculturation status, age, gender, occupation,
income, health insurance, physical activity and fitness, alcohol use, smoking and tobacco
use, weight history, anyone on a special diet, types of food available at home, and types
of food prepared-eaten relate to diabetes prevalence in adult Hispanics in the U.S.?
Research Question #12: How does anyone on a special diet (any family member)
relate to diabetes prevalence in adult Hispanics in the U.S.?
Research Question #13: How does types of food available at home relate to
diabetes prevalence in adult Hispanics in the U.S.?

v
Research Question #14: How does types of food prepared-eaten relate to
diabetes prevalence in adult Hispanics in the U.S.?
Quantitative archival research was used to gather data. Findings demonstrated that none
of these factors significantly predicted diabetes prevalence.

vi
ACKNOWLEDGEMENT
Firstly, I would like to express my deepest gratitude to Dr. Shankar Srinivasan for
his continuous support of my PhD study and related research, for his encouragement and
motivation. His constant guidance helped me throughout this thesis. I could not have
imagined having a better advisor and mentor for my PhD study.
Also, would like to thank the rest of my thesis committee members Dr. Frederick
Coffman, and Dr. Samer Kottiech for their insightful comments which encouraged me to
widen my research from various perspectives.
Lastly, I would like to thank my children Steven, Anthony, and Cassandra for always
making feel proud as a mother, and special thanks to my husband Wing Chu, for being
my backbone and number one supporter.
vii
TABLE OF CONTENTS
Page
APPROVAL PAGE ................................................................................................. ii
ABSTRACT ........................................................................................................ iii
ACKNOWLEDGEMENT ..................................................................................... vi
LIST OF TABLES ................................................................................................. ix
CHAPTER I INTRODUCTION ............................................................................1
Goals and Objectives ...................................................................................2 Statement of the Problem .................................................................2 Background of the Problem .............................................................2 Research Questions & Hypotheses ..................................................6 Significance of the Study .................................................................9 CHAPTER II REVIEW OF THE LITERATURE ............................................... 11
Literature Search Strategy .......................................................................... 11 Theoretical Foundation ..............................................................................12 Literature Review Related to Key Variables ..............................................12 Diabetes and Prevalence ................................................................13 Diabetes and Hispanics ..................................................................16 Studies of Race/Ethnicity and Diabetes .........................................19 Studies of Race/Ethnicity and Diabetes Related Complications ...22 Studies of Factors that Impact Diabetes .........................................25 Summary and Conclusion ..............................................................35 CHAPTER III METHODOLOGY ......................................................................37
Subjects ..........................................................................................42 Instruments .........................................................................42 Reliability ...........................................................................44 Validity ...............................................................................44 Procedures ..........................................................................44 Data Analysis .................................................................................46 Conclusion .....................................................................................49 CHAPTER IV PRELIMINARY RESULTS ........................................................50
CHAPTER V RESULTS ......................................................................................53
viii
CHAPTER VI DISCUSSION, CONCLUSION, NEXT STEPS ..........................68
References ........................................................................................................81
Appendices .............................................................................................................86
A: POWER ANALYSIS .......................................................................................86
B: OPERATIONALIZATION OF VARIABLES OF STUDY .............................87
C: TABLES AND CHARTS FOR PRELIMINARY RESULTS ..........................89

ix
LIST OF TABLES
Table 1 Chi Square: Acculturation Status and Diabetes ........................................57
Table 2 Regression: Age and Diabetes ...................................................................58
Table 3 Chi Square: Gender and Diabetes .............................................................59
Table 4 Regression: All Incomes and Diabetes ......................................................60
Table 5 Chi Square: Specific Incomes and Diabetes .............................................60
Table 6 Chi Square: Health Insurance and Diabetes .............................................61
Table 7 Regression: Physical Activity and Diabetes .............................................62
Table 8 Regression: Alcohol Use and Diabetes ....................................................62
Table 9 Chi Square: Smoking and Diabetes .........................................................63
Table 10 Regression: Weight and Diabetes ............................................................63
Table11a Regression: Original Variables and Diabetes ........................................64
Table 11b Regression: New and Multiple Variables and Diabetes .......................65
Table 12 Regression: Anyone on a Special Diet and Diabetes .............................65
Table 13 Regression: Types of Food Available at Home & Diabetes ...................66
Table 14 Regression: Types of Food Prepared-Eaten and Diabetes .................... 67
1
CHAPTER I
INTRODUCTION
1.1 Introduction
The topic for this study is the relationship between acculturation status and
diabetes prevalence in Hispanic immigrants. Thus, the study goal is to determine if
diabetes prevalence in Hispanic Immigrants in the U.S. is correlated with acculturation
status. Around 100 years ago, Jewish peoples were believed to be most at risk to develop
type 2 diabetes and today, it is the ethnic minorities to include the Hispanics/Latinos,
Blacks, and Native Americans that are at the most risk (Chow, Foster, Gonzalez, &
McIver,2012; Tuchman, 2011). Diabetes is a serious health problem for the
Hispanic/Latino population (OMH, 2014). While there is some information about the
tendency for time in the U.S. to increase prevalence rates of diabetes in Hispanics
(Afable-Munsuz, Mayeda, Perez-Stable, & Haan, 2013), more is needed since these
authors also found that acculturation was negatively related to diabetes prevalence. Since
diabetes rates for Hispanics are higher than for other populations, this does not support
the conclusion that increased acculturation reduces diabetes prevalence. Afable-Munsuz
et al. did find however, that time in the U.S. was related to increased diabetes prevalence.
A study is needed to help deal with inconsistent findings and determine if acculturation
status is related to diabetes in the Hispanic population.

2
1.2 Goals and Objectives
The overall goal of this research is to determine the relationship between
acculturation status and diabetes prevalence in Hispanics. Thus, the study goal is to
determine if acculturation status predicts diabetes prevalence in Hispanics in the U.S.
1.3 Statement of the Problem
This dissertation is about determining if acculturation status of Hispanics predicts
higher or lower prevalence of diabetes. Thus, the goal is to determine if these factors are
related. The general problem is that rates of diabetes prevalence in Hispanics are
disproportionately high. The specific problem for this study is that there is a lack of
information relative to whether acculturation status of Hispanics living in the U.S.
predicts diabetes prevalence. The general purpose of the study is therefore to explore the
relationship between acculturation status and diabetes prevalence in U.S. Hispanics.
This problem can be explained by the theory of acculturation and assimilation
(Kim, 2001; Wichert, 1996). This theory posits that foreign immigrants go from one
culture to another and must adapt to the new culture. Acculturation describes this process
of adopting new cultural norms and values of the host society. This assimilation process
is dependent on the extent that immigrants actually change (Afable-Munsuz, Mayeda,
Perez-Stable, & Haan, 2013). Since each generation of Hispanics would be exposed to a
different level of acculturation and assimilation, it may be that this process explains
diabetes prevalence rates.
1.4 Background of the Problem
Findings from the literature support the goals of this study. For example, studies
show that Hispanics have higher rates of diabetes than other populations (Chow, Foster,

3
Gonzalez, & McIver, 2012; OMH, 2014; Tuchman, 2011), indicating the need to study
this problem. Diabetes mellitus is considered a serious health problem for Hispanics as
well as Latinos in the United States. In fact, diabetes mellitus is the sixth cause of death
within the Hispanic community. The Hispanic population faces two times the risk of
developing and dying from diabetes and they are also more likely to experience related
complications (OMH, 2014, p. 1). More information is needed to help find solutions to
reduce diabetes prevalence in U.S.-born Hispanics.
There is a lack of studies exploring the generational influence on diabetes
prevalence in Hispanics. Results of one study demonstrated that length of time in the
U.S. is related to increased prevalence rates of diabetes in Hispanics (Afable-Munsuz et
al., 2013). However, this study included one group who had been born and raised in
Mexico. Afable-Munsuz et al. concluded that acculturation was not related to diabetes
prevalence since more time in the U.S. was related to increased rates of diabetes.
However, it may be that acculturation is in fact related to diabetes and this is because
assimilation into the American culture does lead to higher rates of diabetes. Afable-
Munsuz et al. did find however, that time in the U.S. was related to increased diabetes
prevalence and a study is needed to determine if this is true when all generations studied
are born and raised in the U.S.
Braun, Huebschmann, Kim, Lezotte, Shupe, and Dabelea (2011) had also studied
diabetes in Hispanics, with a focus on gestational diabetes, maternal country of birth, and
Hispanic infant health outcomes. These authors found that GDM rates increased in US-
born and Mexico-born Hispanics, but Mexico-born Hispanics had higher risks for this

4
disease, compared to U.S.-born Hispanics. This author concluded that education level
was an influential factor (Braun et al., 2011). While Braun et al. did not examine diabetes
in adults, these authors did show that Mexican-born Hispanics were at a greater risk for
gestational diabetes. Thus, while Braun et al. demonstrated a decrease in risk for a type
of diabetes for U.S.-born Hispanics, Afable-Munsuz et al. found that the risk for diabetes
increases as Hispanics spend more time in the U.S. These studies examined different
types of diabetes, but the authors presented inconsistent findings. A study is needed to
further the work of Afable-Munsuz et al. and determine if acculturation status predicts
diabetes prevalence in U.S. Hispanics.
There have been many studies of the impact of race/ethnicity on diabetes and
related complications. Findings from these studies consistently reported that
ethnicity/race is a factor related to diabetes (Choi, Liu, Palaniappan, Wang, & Wong,
2013; Chow et al., 2012). Ethnicity/race is also a factor related to diabetes complications
such as kidney disease and depression (Bhalla, Zhao, Azar, Wang, Choi, Wong, &
Palaniappan, 2013; Colon, Giachello, McIver, Pacheco, & Vela, 2013). However, studies
also show that race/ethnicity is not related to other issues such as diabetic retinopathy
(Bower, Brancati, & Selvin, 2013).
There have also been studies of factors that impact diabetes and these support
conclusions that race/ethnicity is a factor, as is poverty (Gaskin, Thorpe, McGinty,
Bower, Rohde, Young, & Dubay, 2014; Holmes, Hossain, Ward, & Opara, 2012). There
are also factors such as glycemic control and overweight and obesity that are related to
diabetes prevalence (Kim, Saraiva, Curtis, Wilson, Troyan, England, & Sharma, 2013;
5
Otiniano, Al Snih, Goodwin, Ray, AlGhatrif, & Markides, 2012; Pérez, Sánchez, & Ortiz,
2013; Suh, Choi, Plauschinat, Kwon, & Baron, 2010; The, Richardson, & Gordon-
Larsen, 2013).
Literature findings are that Hispanic and other minorities have higher rates of all
types of diabetes (Bentley-Lewis, Powe, Ankers, Wenger, Ecker, & Thadhani, 2014;
Hedderson, Ehrlich, Sridhar, Darbinian, Moore, & Ferrara, 2012; Ma, Hébert, Manson,
Balasubramanian, Liu, Lamonte, & Howard, 2012). Race/ethnicity is a factor related to
this disease and while country of origin may have an impact of diabetes prevalence
(Pabon-Nau, Cohen, Meigs, & Grant, 2010), it remains unclear whether spending more
time in the United States as with first, second, and third generations, leads to increased
diabetes prevalence.
There are multiple factors besides ethnicity/race that are linked to diabetes
prevalence such as poverty and education (Braun et al., 2011; Gaskin et al., 2014;
Holmes et al., 2012). However, the current study is focused on acculturation and
assimilation which are also related to diabetes prevalence, but findings are inconsistent
(Afable-Munsuz et al., 2013; Braun et al., 2011). Thus, it remains unclear whether time
spent in the U.S., as demonstrated by different generations of U.S.-born Hispanics, is
related to increased diabetes prevalence rates in this population.
In conclusion, while literature findings reveal some mixed results, consistent
themes support the finding that race/ethnicity is related to diabetes prevalence and
Hispanics have high rates of this disease. This supports the need to further study related
issues such as the relationship between time spent in the United States, defined as
acculturation status, and diabetes prevalence. This study would fill related gaps in the
6
literature and would extend knowledge in the discipline regarding impacts of length of
acculturation time, which may or may not influence rates of diabetes in Hispanics.
1.5 Research Questions and Hypotheses
Hypothesis. The main hypothesis for this study is: Acculturation status
significantly predicts diabetes prevalence in Hispanic adults. This main hypothesis is
based on the main research question: How does acculturation status relate to diabetes
prevalence in adult Hispanics in the U.S.? Research questions and sub hypotheses are as
follows:
Research Question #1: How does acculturation status relate to diabetes
prevalence in adult Hispanics in the U.S.?
Hypothesis #1: Acculturation status significantly predicts diabetes prevalence in
adult Hispanics in the U.S.
Research Question #2: How does age relate to diabetes prevalence in adult
Hispanics in the U.S.?
Hypothesis 2: Age significantly predicts diabetes prevalence in adult Hispanics in
the U.S.
Research Question #3: How does gender relate to diabetes prevalence in adult
Hispanics in the U.S.?
Hypothesis 3: Gender significantly predicts diabetes prevalence in adult
Hispanics in the U.S.
Research Question #4: How does occupation relate to diabetes prevalence in
adult Hispanics in the U.S.?

7
Hypothesis 4: Occupation significantly predicts diabetes prevalence in adult
Hispanics in the U.S.
Research Question #5: How does income relate to diabetes prevalence in adult
Hispanics in the U.S.?
Hypothesis 5: Income significantly predicts diabetes prevalence in adult
Hispanics in the U.S.
Research Question #6: How does health insurance relate to diabetes prevalence
in adult Hispanics in the U.S.?
Hypothesis 6: Health insurance significantly predicts diabetes prevalence in adult
Hispanics in the U.S.
Research Question #7: How does physical activity and fitness relate to diabetes
prevalence in adult Hispanics in the U.S.?
Hypothesis 7: Physical activity and fitness significantly predicts diabetes
prevalence in adult Hispanics in the U.S.
Research Question #8: How does alcohol use relate to diabetes prevalence in
adult Hispanics in the U.S.?
Hypothesis 8: Alcohol use significantly predicts diabetes prevalence in adult
Hispanics in the U.S.
Research Question #9: How does smoking and tobacco use relate to diabetes
prevalence in adult Hispanics in the U.S.?
Hypothesis 9: Smoking and tobacco use significantly predicts diabetes
prevalence in adult Hispanics in the U.S.
8
Research Question #10: How does weight history relate to diabetes prevalence
in adult Hispanics in the U.S.?
Hypothesis 10: Weight history significantly predicts diabetes prevalence in adult
Hispanics in the U.S.
Research Question #11: How do acculturation status, age, gender, occupation,
income, health insurance, physical activity and fitness, alcohol use, smoking and tobacco
use, and weight history relate to diabetes prevalence in adult Hispanics in the U.S.?
Hypothesis 11a: Acculturation status, age, gender, occupation, income, health
insurance, physical activity and fitness, alcohol use, smoking and tobacco use, and weight
history significantly predict diabetes prevalence in adult Hispanics in the U.S.
Research Question #11b: How do acculturation status, age, gender, occupation,
income, health insurance, physical activity and fitness, alcohol use, smoking and tobacco
use, weight history, anyone on a special diet, types of food available at home, and types
of food prepared-eaten relate to diabetes prevalence in adult Hispanics in the U.S.?
Hypothesis 11b: Acculturation status, age, gender, occupation, income, health
insurance, physical activity and fitness, alcohol use, smoking and tobacco use, weight
history, anyone on a special diet, types of food available at home, and types of food
prepared-eaten significantly predict diabetes prevalence in adult Hispanics in the U.S.
Research Question #12: How does anyone on a special diet (any family member)
relate to diabetes prevalence in adult Hispanics in the U.S.?
Hypothesis 12: Anyone on a special diet significantly predicts diabetes
prevalence in adult Hispanics in the U.S.

9
Research Question #13: How does types of food available at home relate to
diabetes prevalence in adult Hispanics in the U.S.?
Hypothesis 13: Types of food available at home significantly predicts diabetes
prevalence in adult Hispanics in the U.S.
Research Question #14: How does types of food prepared-eaten relate to
diabetes prevalence in adult Hispanics in the U.S.?
Hypothesis 14: Types of food prepared-eaten significantly predicts diabetes
prevalence in adult Hispanics in the U.S.
Since later generations of Hispanics are assumed to have higher rates of
accommodation and assimilation, it is predicted that acculturation status is related to
diabetes outcomes and predicts diabetes outcomes. However, whether this acculturation
status, with different acculturation and assimilation levels, is related to higher or lower
levels of diabetes prevalence remains unclear, which supports the need for the current
study.
1.6 Significance of the Study
Determining the relationship between acculturation status and diabetes prevalence
in U.S. Hispanics is important since diabetes remains prevalent in this population (OMH,
2014). It is important to understand if acculturation of Hispanics living in the U.S. is a
risk factor for diabetes. Further it is important to understand reasons for this
phenomenon. The first step in understanding the problem is determining if the problem
of high rates of diabetes prevalence exists, based on U.S. length of residence defined as
acculturation status. The theory of accommodation and assimilation may help to explain
findings. Results of this study provided information needed for further study of the
10
problem of high rates of diabetes in the U.S. Hispanic population. Study findings will
benefit the health care industry since this information will help to understand and resolve
the issue of high rates of diabetes in the Hispanic population. Findings will also
contribute to my professional development since this information will provide an
increased understanding of the potential for accommodation and assimilation to a host
culture, to have an impact on disease outcomes.

11
CHAPTER II
LITERATURE REVIEW
2.1 Introduction
The overall goal of this research is to determine the relationship between
acculturation status and diabetes prevalence in Hispanics. Thus, the study goal is to
determine if acculturation status predicts diabetes prevalence in Hispanics in the U.S.
The following presents the literature search strategy, theoretical foundation, and a
synopsis of the current literature regarding topics of diabetes and prevalence, diabetes in
Hispanics, studies of race/ethnicity and diabetes, studies of race/ethnicity and diabetes
related complications, and studies of factors that impact diabetes. This is followed by a
summary and conclusions.
2.2 Literature Search Strategy
The literature search strategy included gathering articles mostly within the last
five years from databases that included peer-reviewed journals such as ProQuest and
online resources. Key words used for the search included: diabetes and prevalence,
diabetes in Hispanics, studies of race/ethnicity and diabetes, studies of race/ethnicity and
diabetes related complications, and studies of factors that impact diabetes. The scope of
literature review included an initial search with dates from 2010 onward, followed by a
search of all years to further explore the issues. CINAHL, MedLine, PubMed, British
Nursing Index, JSTOR Archive, Web of Science, and Google Scholar from 1985-2010.

12
2.3 Theoretical Foundation
The theoretical foundation for this study is based on the acculturation and
assimilation theory. Y. Y. Kim's theory of acculturation (Kim, 2001; Wichert, 1996)
posits that foreign immigrants go from one culture to another and they need to adapt to
the new culture. Acculturation describes this process of the immigrant becoming more
and more able to understand and adopt new cultural norms and values of the host society.
As this process takes place, the immigrant develops an intercultural identity and the
ability to live comfortably in the new culture. With this theory, as the immigrant takes
part in interpersonal communications with those in the new culture, this increases
acculturation. More recent views of the acculturation process view this as a reciprocal
interaction where everyone is impacted (Kim, 2001; Wichert, 1996).
The assimilation process that takes place among United States immigrants is a
result of increased exposure to U.S. social and cultural norms (Afable-Munsuz, Mayeda,
Perez-Stable, & Haan, 2013). This assimilation process is also dependent on the extent
that immigrants achieve social and economic equality with the host population (Afable-
Munsuz et al., 2013). While Afable-Munsuz et al. found that acculturation was not
related to diabetes increases, they also found that time spend in the U.S. was related to
increased diabetes prevalence. Thus, acculturation theory can be used to help explain
inconsistent findings.
2.4 Literature Review Related to Key Variables
The following provides a review of the current literature that includes studies
related to the study constructs. The topics presented are consistent with the study
variables of diabetes and prevalence, diabetes in Hispanics, studies of race/ethnicity and
13
diabetes, studies of race/ethnicity and diabetes related complications, and studies of
factors that impact diabetes. This discussion is followed by a summary and conclusions.
2.5 Diabetes and Prevalence
Diabetes descriptions. Diabetes is a condition that involves too high levels of
blood sugar or glucose (NIDDK, 2014). Blood glucose is the primary sugar found in the
blood which is the major energy source. This blood glucose is made in the liver and
muscles and comes from foods eaten. The glucose is carried by the blood to all cells for
energy. The pancreas releases insulin into the blood and this hormone helps to carry the
glucose to the cells. If the body does not make enough insulin, the glucose does not
reach the cells and blood glucose levels increase to a level that can cause prediabetes or
diabetes. This accumulation of blood glucose can result in health conditions (NIDDK,
2014).
Prediabetes is a state where glucose levels are high in the blood but not high
enough to result in diabetes. Prediabetes is a risk factor for type 2 diabetes, stroke, and
heart disease. Diet and exercise activities can change this glucose level and help prevent
type 2 diabetes. Diabetes symptoms include excessive thirst and urination, hunger and
tiredness, weight loss, slow healing sores, dry and itchy skin, blurry eyesight, and
changes in feelings in feet (loss of feeling, pins feeling). While these signs may be
present, in some people they are lacking. A blood test is needed to diagnose diabetes
(NIDDK, 2014).
There are three main types of diabetes: type 1, type 2, and gestational (NIDDK,
2014). Any age and gender can develop diabetes. Type 1 diabetes (also called juvenile
diabetes) tends to develops in young people but can also develop in adults. With this type

14
of diabetes, the body is not able to make insulin at all or enough. With this type of
diabetes, injections of insulin are needed as well as the right diet and exercise program.
Type 2 diabetes (also called adult-onset diabetes) is found in all ages but tends to develop
in those middle-aged or older. Overweight and inactivity are related to this type. Type 2
diabetes tends to start with an insulin resistance where the pancreas cannot keep up with
the demands of the body. Treatment for type 2 diabetes may include taking diabetes
medicines, and it also includes changes in diet and exercise. Gestational diabetes
develops in a pregnant female when insulin resistance takes place and typically ends
when the baby is born. Overweight is a risk factor for this condition. Women with
gestational diabetes are at a greater risk to develop type 2 diabetes later in life and babies
born to these mothers are also at risk to develop obesity as well as type 2 diabetes
(NIDDK, 2014).
Prevalence of diabetes. According to the CDC (2014a), there are 29.1 million
people with diabetes in the United States, which is 9.3% of the population. It is estimated
that 27.8% of the population remain undiagnosed. Further, of those 20 years or older,
28.9 million or 12.3% have diabetes. By age 20 years to 44 years, 4.3 million (4.1%)
have diabetes, by age 45 years to 64 years, 13.4 million (16.2%) have diabetes, and by
age 65 years+, 11.2 million (25.9%) have diabetes. This breaks down to 15.5 million
men (13.6%) and 13.4 million women (11.2%) (CDC, 2014a).
Diabetes complications. Gregg, Li, Wang, Rios Burrows, Ali, Rolka, and Geiss
(2014) explored diabetes complications using data from the National Health Interview
Survey, the National Hospital Discharge Survey, the U.S. Renal Data System, and the
U.S. National Vital Statistics System. Changes in complications due to diabetes from

15
1990 to 2010 in the United States were determined. Findings were that preventive care
for adult diabetics improved. Results also showed that rates of stroke, acute myocardial
infarction, lower-extremity amputation, end-stage renal disease, and death from
hyperglycemic crisis declined with largest declines in acute myocardial infarction and
death, followed by stroke and amputations, and end-stage renal disease. The greatest
decline was in acute myocardial infarction and the smallest decline was in the number of
deaths. These decreased rates were higher for diabetic adults than for non-diabetic adults.
The authors concluded that there has been a decline in rates of diabetes-related
complications, but the disease continues. Figure 1 shows the changes in complications
due to diabetes from 1990 to 2010 in the U.S.
Figure 1: Trends in Age-Standardized Rates of Diabetes-Related Complications among
U.S. Adults with and without Diagnosed Diabetes, 1990-2010, NEJM, 2014

16
2.6 Diabetes in Hispanics
Hispanic diabetes prevalence. Diabetes mellitus is a serious health problem for
Hispanics and Latinos. In the United States, this condition is the sixth cause of death
within the Hispanic and Latino community and it is the fourth leading cause of death for
Hispanic females and Hispanic elderly. The Hispanic and Latino populations face twice
the risk of developing and dying from diabetes, compared to other populations and they
are more likely to experience complications of diabetes to include high blood pressure,
heart disease, kidney disease, blindness, nerve damage, and amputations. In Hispanic
and Latino populations, diabetes may have an earlier onset compared to other
populations. Age of onset for Puerto Ricans and Mexican Americans, is 30 years to 50
years. Over 11% of Mexican Americans, ages 20 years or older suffer from diabetes.
Diabetes prevalence rates for those 20 years and older, are: "13.3% for Mexican
Americans, 13.8% for Puerto Ricans, 7.6% for Cuban Americans, and 7.1% for non-
Hispanic whites" (OMH, 2014, p. 1).
Figures 2: Hispanic Diabetes Prevalence (OMH, 2014, p.1)

17
Generational diabetes in Hispanics. Afable-Munsuz, Mayeda, Perez-Stable, and
Haan (2013) examined the process of acculturation and assimilation in Mexican
immigrants to determine impacts on diabetes found in generations of Mexicans. These
authors studied data from 1789 adults who were part of the Sacramento Area Latino
Study on Aging (SALSA). Participants were ages 60 years to 101 years. Type 2 diabetes
information was gathered from self-reports regarding a diagnosis by a physician, diabetic
medication use, or a fasting glucose of 126 milligrams/deciliter or greater. Findings from
logistic regression showed, after adjusting for age and gender, there were significant links
between immigrant generation, acculturation, and diabetes risk. First-generation adults
compared to second-generation, and third-generation adults had different rates of
diabetes. There was a significant relationship between generation and diabetes, but not
acculturation. The authors concluded that assimilation was not necessarily linked with an
increased risk for diabetes in Mexican immigrants.
Afable-Munsuz et al. (2013) discussed study limitations. These authors used
cross-sectional data which did not establish a causal link. The specific relationship
between assimilation and diabetes risk was implied but the use of cross-sectional data did
not allow individual immigration aspects to be studied that may have impacted outcomes.
Despite limitations, study findings were that immigrant generation is significantly related
to diabetes risk in aging adults of Mexican origin. Diabetes risk was even higher in U.S.-
born second- and third-generation individuals as compared with these immigrants. These
relationships were not significantly influenced by acculturation or other lifestyle and
socioeconomic status (SES) factors assessed. While immigrant generation was positively
associated with diabetes risk, and U.S.-born generations were linked to increased diabetic

18
risks, relationship between immigrant generation and diabetes risk remained after
adjusting for other factors, except acculturation. Longer U.S. residence based on
generation status, was therefore linked to increased risk of diabetes. While the finding
related to acculturation was not consistent with overall findings, this may be explained by
the complexity of the adaptation and assimilation process that immigrants to the United
States experience. For this study, the first-generation participants migrated to the U.S. as
adults, which implies that they were raised in a different culture, that later generations.
This brings up the issue of culture and cultural beliefs as related to diabetes risk.
Braun, Huebschmann, Kim, Lezotte, Shupe, and Dabelea (2011) reported that
maternal country of birth impacts Hispanic infant health outcomes. In fact, better birth
outcomes have been found even though there is less prenatal care for Hispanic women
born in Mexico. The impact of maternal birthplace on outcomes of gestational diabetes
mellitus (GDM) is less clear and findings are inconsistent. Thus, Braun et al. explored
the impact of maternal birthplace on the prevalence of gestational diabetes mellitus
(GDM) in Colorado Hispanics. The authors conducted a retrospective population-based
study using birth certificate data from 1995 to 2004. Findings were that GDM rates
found in 154,957 births increased in both US-born (USWH) and Mexico-born (MWH),
white Hispanic Colorado women. MWH had higher odds for GDM development,
compared to USWH over the years. Maternal age and maternal education were factors
that reduced GDM risk by birth country. GDM rates increased in USWH and MWH,
white Hispanic Colorado women.
Mexico-born immigrant women have an increased risk for GDM compared with
U.S. born counterparts and lower education attainment may be a related factor (Braun et

19
al., 2011). While the study was limited by the use of data from birth certificates and
lacked individual details, the authors did provide support for their conclusion since
findings were that Mexican-born Hispanic women had 30% higher odds for developing
GDM, compared to Hispanic women born in the United States (Braun et al., 2011). Both
Braun et al. and Afable-Munsuz et al. (2013) provided evidence to support the notion that
country of birth and time spent in the United States, impacts diabetes prevalence. While
education was shown to be a factor, cultural beliefs may also impact outcomes.
Beliefs and risk of diabetes in Hispanics. Santos, Hurtado-Ortiz, and Sneed
(2009) presented an early study of the impact of cultural illness beliefs as a cause of
diabetes. These authors examined the validity of the Klonoff and Landrine (1994)
illness-belief scale with a sample of 156 Latino college students (34% male and 66%
female). All participants were at high-risk for diabetes onset. Findings were that
emotional, folk-beliefs, punitive, and gene/hereditary were perceived as predicting
diabetes. The authors also found that age impacted emotional and folk illness factors,
and there was a negative relationship between assimilation and views about the emotional
factor. Santos et al. demonstrated that there are multiple ethnic/race factors that impact
health outcomes.
2.7 Studies of Race/Ethnicity and Diabetes
Chow, Foster, Gonzalez, and McIver (2012) explored the impact of diabetes on
different racial/ethnic minority groups. These authors reported findings that compared to
whites, blacks or African Americans, Hispanics or Latinos, American Indians and Alaska
Natives, and Pacific Islanders, Asian Americans, and Native Hawaiians, all have higher
prevalence rates and more related burdens and complications. The American Diabetes

20
Association strives to deal with this impact of diabetes on ethnic minorities, with the help
of the African American Diabetes Action Council, Asian Pacific American Diabetes
Action Council, and Latino Diabetes Action Council. The finding that minority groups
have higher diabetes prevalence rates has led to the study of this phenomenon.
Choi, Liu, Palaniappan, Wang, and Wong (2013) explored gender and ethnic
differences with regard to type 2 diabetes. Differences between California Asian
subgroups and other ethnic groups to include Filipino, South Asian, Japanese, Korean,
Vietnamese, Mexican, Other Hispanic, African-American, Caucasian, and Native
American groups were explored. The prevalence of diabetes mellitus (DM) and
associated risk factors were explored in a group of 46,091 participants from an earlier
survey. The authors found that age-adjusted DM prevalence was found at the following
rates among men: 32.4% of Native Americans, 15.8% of Filipinos, and 11.8% of
Japanese. In women, rates were 16.0% in Native Americans and 13.3% in African-
Americans. Findings also revealed higher rates for Caucasian and Mexican men
compared to women. When age and risk factors were adjusted, DM was more prevalent
in female Koreans, Native Americans, and Other Hispanics, compared to Caucasians.
For men, DM was more prevalent in Filipinos, South Asians, and Native Americans.
Thus the authors concluded that there are ethnic and gender differences in DM which
implies the need for different treatment approaches.
Ma, Hébert, Manson, Balasubramanian, Liu, Lamonte, and Howard (2012)
explored differences in diabetes in postmenopausal women from different racial/ethnic
groups in the United States. These women took part in the Women's Health Initiative.
Data were collected for baseline prevalence of diabetes and incident diabetes for 158,833
21
women, an average of age 63 years at baseline. The women were gathered from 1993-
1998 and followed until August 2009. The racial/ethnic distribution for the women
included: non-Hispanic white (84.1%), non-Hispanic black (9.2%), Hispanic (4.1%), and
Asian (2.6%). Whites, blacks, and Hispanics had 60%, 69%, and 63% lower risk for
incident diabetes. While risk factors varied most findings were similar for all groups, and
women with a healthy weight had the most physical activity, with less than one-third the
diabetes risk, compared to obese and inactive women. Thus, while there were large
racial/ethnic differences, most variability was attributed to lifestyle factors. The authors
concluded that most of the diabetes was preventable with lifestyle changes, for all
racial/ethnic groups.
Hedderson, Ehrlich, Sridhar, Darbinian, Moore, and Ferrara (2012) explored
racial/ethnic differences in gestational diabetes mellitus rates by BMI. Data were from a
cohort of 123,040 women without recognized pregravid diabetes. Each delivered a baby
between 1995 and 2006. Findings were that for all racial/ethnic groups, the age-adjusted
rates of GDM increased with higher BMI. Asian and Filipina women had a GDM rate of
9.9% and 8.5%, at a BMI of 22.0-24.9 kg/m2. Hispanic, non-Hispanic white, and African
American women had a GDM rate of >8.0% at a higher BMI. Findings imply that GDM
rates could be lowered if pregnant women were normal weight since BMI thresholds are
related to increased risk of GDM. However, this varies by racial/ethnic group.
Studies of race/ethnicity and diabetes continually support the conclusion that
diabetes prevalence is higher for minority populations (Choi et al., 2013; Chow et al.,
2012). Hispanic and other minority groups have higher rates of diabetes to include type 1
and 2 and gestational diabetes (Hedderson et al., 2012; Ma et al., 2012). This supports

22
the need to further study issues such as the relationship between time spent in the United
States and diabetes prevalence.
2.8 Studies of Race/Ethnicity and Diabetes Related Complications
Diabetes and hypertension. Bentley-Lewis, Powe, Ankers, Wenger, Ecker, and
Thadhani (2014) studied the impact of race/ethnicity on hypertension risk as related to
gestational diabetes mellitus (GDM). These authors noted that this condition is more
prevalent in racially/ethnically diverse groups as compared to non-Hispanic white
populations. The study sample included 4,010 women who delivered at Massachusetts
General Hospital from 1998 to 2007. Findings showed that GDM was more prevalent in
nonwhite participants and it was linked to hypertension subsequent to delivery. The
authors concluded that Hispanic women had a greater risk of hypertension compared to
white women.
Pabon-Nau, Cohen, Meigs, and Grant (2010) studied diabetes and hypertension in
U.S. Hispanics, exploring these issues by country of origin. These authors noted that
since Hispanics come from many different cultural backgrounds, it is important to study
this group based on their country of origin. It is also important to study the impact of
socioeconomic status and acculturation on diabetes prevalence in these different
subgroups. Data were from the National Health Interview Survey and findings were used
to compare characteristics of Mexican-Americans with Hispanics who were from:
Central/South America, Cuba, Dominican Republic, Mexico, and Puerto Rico. The
sample included 31,240 participants. Findings were that these Hispanic subgroups were
significantly diverse with regard to all variables. Foreign-born Puerto Ricans reported
the highest prevalence rates of hypertension (32%) and diabetes (15%). Foreign-born

23
Hispanics, Puerto Ricans, and Dominicans had higher hypertension rates than Mexican-
Americans after adjusting for age, socioeconomic status, acculturation, BMI, and
smoking. Diabetes prevalence for foreign-born Hispanics was half that found in Cubans,
Dominicans, and Central/South Americans, compared to Mexican-Americans. For the
US-born Hispanic subgroups, the Cubans reported lower hypertension levels and
Mexicans reported lower diabetes rates compared to Mexican-Americans. Thus, country
of origin impacted the prevalence of hypertension and diabetes for Hispanics.
Diabetes and kidney disease. Bhalla, Zhao, Azar, Wang, Choi, Wong, and
Palaniappan (2013) explored racial/ethnic differences with regard to the prevalence of
proteinuric and nonproteinuric diabetic kidney disease (DKD). The authors analyzed
electronic health records from 2008 to 2010, for 15,683 persons of Hispanic, non-
Hispanic white (NHW), Asian (Asian Indian, Chinese, and Filipino), and non-Hispanic
black (NHB) persons with type 2 diabetes and no history of kidney disease. Findings
were that racial/ethnic minorities had higher rates of proteinuric DKD compared to
NHWs and lower rates of nonproteinuric DKD. Chinese, Filipinos, Hispanics, and NHBs
had significantly higher odds of proteinuric DKD compared to NHWs. Hispanic men and
women, and Chinese and NHB women had significantly lower odds of having
nonproteinuric DKD compared to NHWs.
Diabetes and retinopathy. Alternatively, Bower, Brancati, and Selvin (2013)
reported findings that there were no ethnic differences regarding the link between
glycated hemoglobin and retinopathy. These authors used data from the national health
and nutrition examination survey 2005-2008. This study included data from ethnic
groups representing a sample of 2,945 non-Hispanic white, 1,046 non-Hispanic black,

24
and 1,231 Hispanic American U.S. adults aged ≥40 years. Findings were that non-
Hispanic blacks had the highest rates of retinopathy. HbA1c clinical categories were
related to prevalence of retinopathy but this relationship did not differ by ethnic group.
Diabetes and depression. Colon, Giachello, McIver, Pacheco, and Vela (2013)
explored the impact of diabetes on depression in the Hispanic/Latino population. Colon
et al. noted that diabetes diagnosis ranges in prevalence among subgroups, from 7.6% for
Cubans to 13.3% and 13.8% for Puerto Rican and Mexican Americans. Rates of
complications also vary by subgroup but are higher for Hispanics than non-Hispanic
whites. Depression rates are twice as high for adults with type 1 or 2 diabetes compared
to those without diabetes. This depression is found in 15-30% of all diabetic adults and
depression is positively related to worse glycémie control, poorer self-management,
increased complications, lower quality of life, and mortality. Less than 25% of diabetics
are adequately treated for this depression. Depression in Hispanic females is linked to
number of psychosocial and environmental stressors (poverty, single parenting, lack of
education, gender roles, social isolation, language barriers, migration, and acculturation
and adaptation). Since Hispanics have strong family ties (familialismo) it may help
protect them from depression and assimilation of other values may result in less
protection against depression and other mental health problems.
Literature findings support the conclusion that race/ethnicity is related to
hypertension and diabetes, and in particular Hispanic women are at greater risk for
hypertension and gestational diabetes mellitus (Bentley-Lewis et al., 2014). Country of
origin was shown to impact these outcomes as well (Pabon-Nau et al., 2010). Racial
minority groups also have higher rates of complications related to diabetes such as kidney

25
disease (Bhalla et al., 2013) and depression (Colon et al., 2013). Alternatively, ethnicity
was not found to be linked to diabetic retinopathy (Bower et al., 2013).
2.9 Studies of Factors that Impact Diabetes
Race/ethnicity and poverty predicts diabetes. Holmes, Hossain, Ward, and
Opara (2012) studied risk factors related to racial/ethnic variability in diabetes mellitus
rates in the United States. Prevalence and mortality rates differ across minority groups
and reasons are not explained by lifestyle, sociodemographics, and prognostic factors.
The authors used a large cross-sectional survey of 30,852 residents. Findings revealed
statistically significant differences for ethnic/racial groups, regarding age, education,
marital status, income, smoking, alcohol, body mass index, and physical activities.
However, despite differences in these factors, race/ethnicity predicted diabetes mellitus.
African Americans were more likely to be diagnosed for diabetes mellitus than non-
Hispanic whites and Hispanics.
Gaskin, Thorpe, McGinty, Bower, Rohde, Young, and Dubay (2014) investigated
factors that might impact diabetes rates and outcomes. Specifically, the authors examined
factors of race, poverty, and place (neighborhood poverty and racial composition). Data
used were from the 1999-2004 National Health and Nutrition Examination Survey and
the 2000 U.S. Census. This data was used to determine impacts of race, poverty, and
neighborhood racial composition on diabetes odds. Findings revealed a race-poverty-
place relationship for Blacks and poor Whites, with diabetes odds being higher for Blacks
compared to Whites. Individual poverty and living in a poor neighborhood led to an
increase in diabetes for Blacks and Whites. More information is needed to determine if

26
these factors are related to higher diabetes prevalence in other minority groups such as
the Hispanic/Latio population.
Glycemic control and diabetes. Suh, Choi, Plauschinat, Kwon, and Baron
(2010) studied glycemic control among those with type 2 diabetes with consideration for
comorbid conditions and race/ethnicity. Data were gathered from the National Health
and Nutrition Examination Surveys (1988-1994 and 1999-2004) which included a sample
of adults aged 30 years or older who had a diagnosis of type 2 diabetes. Findings were
that type 2 diabetes prevalence increased from 5.8% to 7.1% and rates of treatment also
improved, from 72.3% to 82.2%. Blood pressure and cholesterol level also improved.
However, from 1999-2004, non-Hispanic blacks and Mexican Americans were 0.43 times
as likely and 0.47 times as likely, respectively, to have A1C <7%, compared to non-
Hispanic whites. Most type 2 diabetics also had obesity, hypertension, and or
hyperlipidemia, and glycemic control rates were lowest when all three conditions were
present. Non-Hispanic blacks and Mexican Americans were less likely to have glycemic
control, compared to non-Hispanic whites.
Otiniano, Al Snih, Goodwin, Ray, AlGhatrif, and Markides (2012) explored
prevalence of and factors related to poor glycemic control in Mexican American
diabetics. The study sample included 2,069 adults aged 75 years and older. The authors
used data from the 5th wave of the Epidemiological Study of the Elderly (H-EPESE),
using the Hispanic Established Population data. Of this sample, 689 (33.5%) reported a
diagnosis of diabetes and 209 (30.3%) agreed to having a blood test of HbA1c levels. Of
those tested, 73 (34.9%) had good glycemic control and 136 (65.1%) had poor glycemic
control. Those with poor control reported longer disease duration. This group also

27
reported lower education levels, more frequent use of the glucometer, and they reported
more diabetes-related complications. Factors related to poor glycemic control included
foreign-born, lower education levels (<8 years), obesity, smoking, longer disease
duration, daily glucometer use, and macro-complications. The authors concluded that
poor glycemic control is high in this Mexican American population as is the rising
prevalence of diabetes in this group.
Overweight, obesity, and diabetes. Kim, Saraiva, Curtis, Wilson, Troyan,
England, and Sharma (2013) studied gestational diabetes mellitus (GMD) to determine its
relationship with overweight and obesity by race/ethnicity. Data were from 1,228,265
records of women aged 20 years or older who had at least one child in California from
2007 to 2009. Findings were that percentages of GDM deliveries due to overweight and
obesity were: 17.8% for Asians/Pacific Islanders, 41.2% for Caucasians, 44.2% for
Hispanics, 51.2% for Blacks, and 57.8% for American Indians. For all groups, elevated
prepregnancy body mass index led to GDM. Thus, the authors concluded that decreased
overweight and obesity has the potential to decrease GDM and related delivery
complications, as well as future risk of diabetes in the mother and baby.
Pérez, Sánchez, and Ortiz (2013) explored the prevalence of overweight and
obesity and related cardiometabolic comorbidities. The study sample included Hispanic
adults ages 21-79 years, residing in Puerto Rico. Data were from a household survey that
took place from 2005 and 2007 and included a sample of 840 adults. Data regarding
BMI classified as normal weight, overweight, and obese were gathered. Findings showed
that overweight and obesity prevalence was 35.9% and 41.5%, and findings were more
than the combined U.S. adult population rates of 68.8%, but less than mainland Hispanics
28
rates of 78.8%. Cardiometabolic comorbidities were found significantly more often in
overweight and obese adults. This tendency for overweight and obesity results in health
outcomes such as diabetes.
The, Richardson, and Gordon-Larsen (2013) studied obesity as it relates to
diabetes in an ethnically diverse sample. Researchers, The et al. used data from the U.S.
National Longitudinal Study of Adolescent Health (1996), which included a sample of
10,481 individuals aged 12-21 years. This group was followed with two visits during 18-
27 years (2001-2002) and 24-33 years of age (2007-2009). Findings were that for 24- to
33-year-old participants, 4.4% reported having diabetes and half remained undiagnosed;
there were more blacks and Hispanics reporting this diagnosis, compared to whites.
Women who were obese prior to age 16 years were more likely to report diabetes
compared to those who became obese at or after age 18 years. Persistent rather than adult
onset of obesity was related to increased likelihood of diabetes in men and women. The
risk for diabetes is higher in obese adolescents compared to those with obesity that begins
in adulthood.
Studies of factors that impact diabetes show that race/ethnicity and poverty
predict diabetes (Gaskin et al., 2014; Holmes et al., 2012). Factors such as glycemic
control and overweight and obesity also impact diabetes prevalence (Kim et al., 2013;
Otiniano et al., 2012; Pérez et al., 2013; Suh et al., 2010; The et al., 2013). Findings
reveal this tendency in Hispanic and other individuals. While more Hispanics than
whites have diabetes, obesity is found to be related to diabetes across groups (The et al.,
2013).
29
Consumer behavior and dietary data predict diabetes. Yannakoulia (2006)
reported on the need to understand consumer behaviors and dietary data since these
factors are an important component of diabetes care. This author focused on type 2
diabetes and issues of dietary management. As noted by Yannakoulia, dietary
management of diabetes requires changes in eating behaviors and changes in the planning
of meals, the selection of foods and food preparation, changes in food portions and
changes in behaviors such as dinning out. Patients must respond appropriately to eating
challenges and this can be a problem for some. Diabetic patients face difficulties when
attempting to comply with a new dietary regime. This can result in restrictive eating
behaviors and feelings of dietary deprivation. Patients view rigid dietary control as the
only way to have a proper diet and control their weight. This pressure to conform to
strict nutritional guidelines may result in dietary under-reporting, accompanied with
binge eating, eating restraint, and body dissatisfaction. Health professionals need to
understand and help patients to overcome the problems faced when trying to
accommodate diet and behavior changes needed to manage diabetes.
Oster (2014) reported that people with obesity issues may be reluctant to change
their diets. This author reported that there is a lack of detailed data on behavior responses,
necessary to evaluate the reasons for this reluctance. The author used data from the
Nielson HomeScan panel. This is a household scanner dataset used in economics and
marketing. Data are gathered by household participants on a panel, who scan the UPC
codes of all grocery and drug store item purchases. Each household records quantity and
the prices of items. The household panelists participate for varying periods, but they
serve for at least one year. This data was used to estimate food purchase responses to a
30
diabetes diagnosis. This diagnosis was inferred within the scanner data based on new
purchases of glucose testing products and the household engaging in small calorie
reductions following diagnosis. The changes were shown to be enough to lose up to 10
pounds in the first year, but these changes were only 20% of doctor's suggestions. The
first month following diagnosis resulted in changes by food line up that were consistent
with doctor's advice. This included increases in fruits and vegetables and fewer
unhealthy foods. While the tendency to purchase less unhealthy foods lasted awhile this
was not true for the purchases of increases in healthy foods.
Agborsangaya, Gee, Johnson, Dunbar, Langlois, Leiter, Pelletier, and Johnson
(2013) reported that lifestyle behavior modification is a critical part of self-management
of type 2 diabetes. Therefore, these authors evaluated the prevalence of changing these
lifestyle behaviors for diabetes management and the impact of healthcare professional
support on the changing of these behaviors. Data were from 2682 adult respondents to
the 2011 Survey on Living with Chronic Diseases in Canada’s diabetes component.
Participants were age 20 years or older. binomial regression models were used to analyze
associations with "never engaging in and not sustaining self-management behaviors" (p.
451). These included "dietary change, weight control, exercise, and smoking cessation"
(p. 451). The authors reported prevalence findings as follows: 89.7% for dietary change,
72.1% for weight control/loss, 69.5% for increased exercise, and 30.6%, for smoking
cessation (among those who smoked since being diagnosed). Participants who reported
not receiving health professional advice in the previous 12 months were also more likely
to report never engaging in dietary change, exercise, or weight control/loss. Living with
diabetes for over six years was related to not sustaining dietary change, weight loss and
31
smoking cessation. Thus, while health professionals' advice may support individual
actions, patients living with diabetes for more than six years may require more to sustain
recommended behaviors.
According to the Diabetes Research and Action Education Foundation (2016), the
"adoption of a healthy lifestyle, especially good nutrition, is the cornerstone of diabetes
treatment in type 1 and type 2 diabetes" (p. 1). However, changing to a healthy lifestyle
with good nutrition can be a challenge to start and to maintain. The following of doctor's
advice regarding this self-management can be difficult for many. People find it difficult
to make changes due to emotional responses and a desire to maintain their way of living.
Thus, emotions play a more important role than knowledge when it comes to making
changes. People report their experience of psychosocial obstacles due to: "(1) stress,
emotional states, and limitations in quality of their life; (2) disordered eating behaviors
tied to underlying emotional disturbances, such as binge eating and night-eating
syndrome; (3) restrictive diets that aim to control blood glucose, but may result in feeling
deprived and may create an unhealthful attitude towards food" (p. 1). These behaviors
are related to poor feelings of well-being, increased body weight, and failure to follow
diet and exercise programs designed to manage blood sugar control. When people feel
deprived, they resort to disordered eating such as binging. Around 13% of women with
type 2 diabetes also report a binge eating disorder. When people feel deprived, they also
feel out-of-control and this can result in restrictive eating. Seven eating styles were
presented by Scherwitz and Kesten (2005).
Scherwitz and Kesten (2005) conducted a study to further understand the causes
of overeating, overweight, and obesity. These authors used an 80-item questionnaire that
32
was designed to assess food, nutrition, and eating themes. The questionnaire was given
to 5,256 participants who had registered for a Web-based integrative nutrition e-course.
Factor analysis of the 80 items revealed seven factors or eating styles. A multiple
regression analysis was used to demonstrate the ability of these eating styles to predict
overeating frequency and body mass index (BMI). Findings were that each of the eating
styles was independently related to self-reports of overeating frequency. In addition, five
factors were significantly related to overweight and obesity. The eating styles included
the following (Scherwitz & Kesten, 2005):
(1) "Emotional Eating" (eating to manage feelings);
(2) "Fresh Food, Fast Food" (eating mostly processed, high-calorie food);
(3) "Food Fretting" (judgmental thoughts and over concern about food);
(4) "Task Snacking" (eating while doing other activities);
(5) "Sensory, Spiritual Nourishment" ("flavoring" food with meaning);
(6) "Eating Atmosphere" (dining aesthetics and surroundings);
(7) "Social Fare" (eating alone versus with others). (p. 342)
Scherwitz and Kesten concluded that future research needs to explore eating behaviors as
they relate to overeating, overweight, and obesity. As further noted by the Diabetes
Research and Action Education Foundation (2016), people with diabetes, with anxiety
and depression, who engage in emotional eating, have poorer diabetes control. The
Diabetes Research and Action Education Foundation (2016) provided a further discussion
of the eating styles.
Eating Style 1: Emotional Eating. The Diabetes Research and Action Education
Foundation (2016) reported that emotional eating includes eating behaviors that take

33
place as a response to emotional cues rather than due to hunger. When a diabetic engages
in emotional eating, he or she has poorer diabetes control. Psychosocial symptoms of
anger, depression, worry, sadness, loneliness, or being upset are related to risk for
abnormal eating patterns such as emotional eating. Strict dietary regimens, food
restriction, and ideals of thinness all also factors faced by diabetics that may contribute to
lowered self-esteem and body satisfaction, which leads to restrained eating and binging
(Diabetes Research and Action Education Foundation, 2016).
Eating Style 2: Fresh Food vs. Fast Food. The eating style of fresh food, fast
food, refers to the choice of fresh, whole food rather than the choice of processed
convenience foods. Diabetes prevalence and obesity in America are related to an
increased consumption of energy-dense convenience foods with larger portion
sizes. In addition, consumer behaviors such as eating at fast-food, buffets, or large-
chain restaurants, with choices of foods with high-fat sources of protein and high-
fat menu selections lead to poorer metabolic control in type 2 diabetes, with higher
HbA1c over a two- to three-month time span (Diabetes Research and Action
Education Foundation, 2016).
Eating Style 3: Food Fretting. Food fretting is another eating style with includes
the presence of judgmental thoughts about food and an over-concern about food.
When a diabetic worried about food, this can lead to binge eating, restraint, and
body dissatisfaction, which is a particular problem for those with type 2 diabetes.
When a diabetic learns about dietary management this can lead to worrying about
meal planning, and how to select and prepare foods. They may worry about portion
controls and behaviors such as dining out. These worries lead to feelings of dietary

34
deprivation. A disregard for food choices due to this worry, leads to unhealthy
eating behaviors to include choices for processed, convenience foods (Diabetes
Research and Action Education Foundation, 2016).
Eating Style 4: Task Snacking. Task Snacking, refers to eating while doing other
activities. With this type of eating, meals are skipped or eaten at inappropriate
times. These types of eating behaviors are linked to higher HbA1c (Diabetes
Research and Action Education Foundation, 2016).
Eating Style 5: Sensory-Spiritual Nourishment. Sensory-spiritual nourishment
refers to savoring the sensory components of foods. For example, the color,
texture, and aroma of the food would be savored. Even the preparation and eating
of the food would be savored and appreciated with meditative consciousness.
While this tendency may be less in Western cultures, increased enjoyment of food
is linked to decreased HbA1c rates in adults with type 2 diabetes. Since the
adherence to a strict dietary guideline can decrease mindful eating, this can result in
food deprivation and related psychological deprivation and stress. This cycle can
also result in hormonal changes and negative biochemical metabolism changes.
Since type 2 diabetics may be counseled to monitor all foods, this can lead to risk
for deprivation and disordered eating styles. A focus on the spiritual aspects of
eating may help improve these psychological and physiological outcomes (Diabetes
Research and Action Education Foundation, 2016).
Eating Style 6: Eating Atmosphere. The sixth style is eating atmosphere, which
refers to the aesthetics and peacefulness or the mealtime rather than the
stressfulness of the mealtime, which can influence metabolic control. For example,

35
a stressful mealtime can impact insulin resistance by activating stress hormones
(fight or flight response) (Diabetes Research and Action Education Foundation,
2016).
Eating Style 7: Social Faire. Social faire, refers to eating alone versus eating with
others. This eating style is important to consider since social support has been
linked to helping those with type 2 diabetes to increase glycemic control. Social
support improves quality of life in those with type 2 diabetes. Those with type 2
diabetes who live alone are less likely to be act appropriately and maintain a
healthy diet. Eating alone serves as a barrier to healthy food preparation and
healthy eating.
2.10 Summary and Conclusion
Major themes in the literature were that diabetes prevalence is higher for minority
populations (Choi et al., 2013; Chow et al., 2012). In fact, Hispanic and other minority
groups have higher rates of all diabetes types (Hedderson et al., 2012; Ma et al., 2012).
Literature findings are also that race/ethnicity is related to hypertension and diabetes, and
in particular Hispanic women are at greater risk for hypertension and gestational diabetes
mellitus (Bentley-Lewis et al., 2014). While country of origin impacted these outcomes
(Pabon-Nau et al., 2010), outcomes of spending more time in the United States remain
unclear.
Literature themes were also that racial minority groups have higher rates of
diabetes-related complications such as kidney disease and depression (Bhalla et al., 2013;
36
Colon et al., 2013). However, there are also findings that race/ethnicity is not related to
other diabetes-related complications such as diabetic retinopathy (Bower et al., 2013).
Thus, findings regarding race/ethnicity and complications are inconsistent. Literature
themes regard factors that impact diabetes such as race/ethnicity and poverty (Gaskin et
al., 2014; Holmes et al., 2012). Glycemic control and overweight and obesity were also
factors noted in the literature that impact diabetes prevalence. While these factors impact
diabetes rates across populations, Hispanics demonstrate stronger relationships between
variables (Kim et al., 2013; Otiniano et al., 2012; Pérez et al., 2013; Suh et al., 2010; The
et al., 2013). Consumer behaviors and dietary practices also impact diabetic outcomes
(Agborsangaya et al., 2013; Diabetes Research and Action Education Foundation, 2016;
Oster, 2014; Scherwitz & Kesten, 2005; Yannakoulia, 2006).
While literature findings reveal some mixed results, consistent themes support the
conclusion that race/ethnicity is related to diabetes prevalence and Hispanics have high
rates of this disease. This supports the need to further study issues such as the
relationship between time spent in the United States and diabetes prevalence. This study
would fill related gaps in the literature and would extend knowledge in the discipline
regarding impacts of length of time spent in the United States, which may or may not
influence rates of diabetes in Hispanics.
37
CHAPTER III
METHODOLOGY
3.1 Research Overview
The purpose of the study is to determine the relationship between acculturation
status and diabetes prevalence in Hispanics. Thus, the study goal is to determine if
diabetes prevalence in Hispanic adults is correlated with length of time in the country.
Specific objectives of the proposed study include to determine if acculturation status
predicts diabetes prevalence in Hispanics whose family was originally from Mexico. In
addition, the study included an investigation into covariates that might influence the
relationship between acculturation status and diabetes prevalence. Thus, the relationships
between age, gender, occupation, income, health insurance, physical activity and fitness,
alcohol use, smoking and tobacco use, weight history, anyone on a special diet, types of
food available at home, and types of food prepared-eaten and diabetes prevalence were
explored. Findings demonstrated which factors most predict diabetes prevalence. Since
literature regarding the acculturation effects on diabetes in Hispanic's, and related factors
is lacking, this research study is designed to investigate these variables. This chapter
presents a detailed description of the methodology and procedures used for this study.
The research questions and hypotheses for the study are noted. This chapter discusses the
subjects, instruments, reliability, validity, procedures, and data analysis.
3.2 Research Design
For the purpose of this study, quantitative archival research was used.
Quantitative research methods yield a numeric or quantitative description of a

38
predetermined sample of a population. Quantitative research was chosen for this study
since Afable-Munsuz, Mayeda, Perez-Stable, and Haan (2013) used quantitative research
and found that acculturation was not related to diabetes prevalence since more time in the
U.S. was related to increased rates of diabetes. As noted by Afable-Munsuz et al.
however, time in the U.S. was related to increased diabetes prevalence. Thus, a study is
needed to further understand if acculturation predicts diabetes prevalence. Quantitative
methodology provided for this exploration of variables.
Specifically, quantitative archival research will be used for this study. The
archival research design is appropriate for this proposed study since existing data can be
used to examine issues such as relationships among variables. Descriptive findings will
provide information regarding the relationship between the independent variable of
acculturation status and the dependent variable of diabetes prevalence. Descriptive
findings will provide information regarding the influence of covariates (age, gender,
occupation, income, health insurance, physical activity and fitness, alcohol use, smoking
and tobacco use, weight history, anyone on a special diet, types of food available at
home, and types of food prepared-eaten) on the relationship between acculturation status
and diabetes prevalence. For this study data from the National Health and Nutrition
Examination Survey, 1999-2014 will be used and statistically analyzed to test the
hypotheses.
3.3 Research Questions and Hypotheses
The main hypothesis for this study is: Acculturation status significantly predicts
diabetes prevalence in Hispanic adults. This main hypothesis is based on the main
39
research question: How does acculturation status relate to diabetes prevalence in adult
Hispanics in the U.S.? Research questions and sub hypotheses are as follows:
Research Question #1: How does acculturation status relate to diabetes
prevalence in adult Hispanics in the U.S.?
Hypothesis #1: Acculturation status significantly predicts diabetes prevalence in
adult Hispanics in the U.S.
Research Question #2: How does age relate to diabetes prevalence in adult
Hispanics in the U.S.?
Hypothesis 2: Age significantly predicts diabetes prevalence in adult Hispanics in
the U.S.
Research Question #3: How does gender relate to diabetes prevalence in adult
Hispanics in the U.S.?
Hypothesis 3: Gender significantly predicts diabetes prevalence in adult
Hispanics in the U.S.
Research Question #4: How does occupation relate to diabetes prevalence in
adult Hispanics in the U.S.?
Hypothesis 4: Occupation significantly predicts diabetes prevalence in adult
Hispanics in the U.S.
Research Question #5: How does income relate to diabetes prevalence in adult
Hispanics in the U.S.?
Hypothesis 5: Income significantly predicts diabetes prevalence in adult
Hispanics in the U.S.

40
Research Question #6: How does health insurance relate to diabetes prevalence
in adult Hispanics in the U.S.?
Hypothesis 6: Health insurance significantly predicts diabetes prevalence in adult
Hispanics in the U.S.
Research Question #7: How does physical activity and fitness relate to diabetes
prevalence in adult Hispanics in the U.S.?
Hypothesis 7: Physical activity and fitness significantly predicts diabetes
prevalence in adult Hispanics in the U.S.
Research Question #8: How does alcohol use relate to diabetes prevalence in
adult Hispanics in the U.S.?
Hypothesis 8: Alcohol use significantly predicts diabetes prevalence in adult
Hispanics in the U.S.
Research Question #9: How does smoking and tobacco use relate to diabetes
prevalence in adult Hispanics in the U.S.?
Hypothesis 9: Smoking and tobacco use significantly predicts diabetes
prevalence in adult Hispanics in the U.S.
Research Question #10: How does weight history relate to diabetes prevalence
in adult Hispanics in the U.S.?
Hypothesis 10: Weight history significantly predicts diabetes prevalence in adult
Hispanics in the U.S.
Research Question #11: How do acculturation status, age, gender, occupation,
income, health insurance, physical activity and fitness, alcohol use, smoking and tobacco
use, and weight history relate to diabetes prevalence in adult Hispanics in the U.S.?

41
Hypothesis 11a: Acculturation status, age, gender, occupation, income, health
insurance, physical activity and fitness, alcohol use, smoking and tobacco use, and weight
history significantly predict diabetes prevalence in adult Hispanics in the U.S.
Research Question #11b: How do acculturation status, age, gender, occupation,
income, health insurance, physical activity and fitness, alcohol use, smoking and tobacco
use, weight history, anyone on a special diet, types of food available at home, and types
of food prepared-eaten relate to diabetes prevalence in adult Hispanics in the U.S.?
Hypothesis 11b: Acculturation status, age, gender, occupation, income, health
insurance, physical activity and fitness, alcohol use, smoking and tobacco use, weight
history, anyone on a special diet, types of food available at home, and types of food
prepared-eaten significantly predict diabetes prevalence in adult Hispanics in the U.S.
Research Question #12: How does anyone on a special diet (any family member)
relate to diabetes prevalence in adult Hispanics in the U.S.?
Hypothesis 12: Anyone on a special diet significantly predicts diabetes
prevalence in adult Hispanics in the U.S.
Research Question #13: How does types of food available at home relate to
diabetes prevalence in adult Hispanics in the U.S.?
Hypothesis 13: Types of food available at home significantly predicts diabetes
prevalence in adult Hispanics in the U.S.
Research Question #14: How does types of food prepared-eaten relate to
diabetes prevalence in adult Hispanics in the U.S.?
Hypothesis 14: Types of food prepared-eaten significantly predicts diabetes
prevalence in adult Hispanics in the U.S.

42
3.4 Subjects
The study population is Hispanic adults residing in the United States. The study
sample included data from a minimum of 217 male and female adults ages 18 years and
older, chosen from the National Health and Nutrition Examination Survey, 1999-2014
data base. Data were from those subjects who qualify due to their status of being
Hispanic adults who reside in the Unites States.
Specifically, the study subjects included those who are Hispanic, whose family
was originally from Mexico, and who reside in the U.S. A power analysis was conducted
to determine the sample size necessary to accurately reject a null hypothesis for a
regression analysis with a power level of .95, a medium effect size and 19 predictor
variables. The power analysis was calculated with the alpha level set at .05. As
recommended by Cohen’s (1977), with 19 independent variables, for a medium effect, a
sample of about 217 yields a power of around 0.95 in testing hypotheses (Cohen, 1977).
The actual sample far exceeded this estimate (Appendix A).
3.5 Instruments
The variables for this study include the dependent variable of diabetes prevalence,
the independent variable of acculturation status, and the covariates: age, gender,
occupation, income, health insurance, physical activity and fitness, alcohol use, smoking
and tobacco use, weight history, anyone on a special diet, types of food available at
home, and types of food prepared-eaten. Each of these covariates have been linked to
diabetes prevalence (Afable-Munsuz et al., 2013) and require further study to determine
their influence on the relationship between acculturation status and diabetes prevalence.
43
Each of the variables are assessed on the National Health and Nutrition Examination
Survey, 1999-2014.
National Health and Nutrition Examination Survey, 1999-2014 (NHANES).
The National Health and Nutrition Examination Survey (NHANES) is a program with
multiple studies that assess the health and nutritional status of adults and children who
reside in the United States. The survey includes data gathered from interviews and
physical examinations. The NHANES is a foremost program of the National Center for
Health Statistics (NCHS), which is part of the Centers for Disease Control and Prevention
(CDC). The NCHS is responsible for providing vital and health statistics for the Nation
(CDC, 2014b).
The NHANES program has been conducted since the 1960s and as of 1999, the
survey was conducted continuously. Each year, the survey assesses a nationally
representative sample of around 5,000 individuals from counties nation-wide (15 counties
are assessed each year). The NHANES interview is designed to assess "demographic,
socioeconomic, dietary, and health-related questions" and the examination component
includes "medical, dental, and physiological measurements, as well as laboratory tests
administered by highly trained medical personnel" (p. 1). Survey findings reveal disease
prevalence and related risk factors. NHANES data are used: to assess nutritional status
and related health promotion and disease prevention; to set national standards regarding
height, weight, and blood pressure; and for epidemiological studies and health sciences
research (CDC, 2014b).
44
3.6 Reliability
Data from the NHANES are reliable. This survey is considered reliable and valid
since it combines three sources of data from interviews, physical examinations, and
laboratory studies. Use of these three data collection methods is considered effective to
"maximize the efficiency, quality, and accuracy of data collected" (CDC, 2013).
3.7 Validity
Threats to internal validity include events outside the laboratory, maturation,
testing effects, selection, and mortality. Maturation, selection, and mortality were not
threats to the internal validity of this study since the study took place at one point in time
and include the use of existing archival data. Events outside the laboratory and effects of
testing were not an issue for this study due to the use of archival data. Threats to
construct validity were not a threat since the data were reliable and reflected the variables
studied with the use of existing valid data. External validity regards how well the
findings can be generalized to other situations or populations. It is concluded that this
study produced valid findings that can be generalized to other similar populations only.
Limitations of methodology. This proposed study was limited by the use of
archival data, which means that the findings may generalize only to like populations.
3.8 Procedures
Following study approval, all data were gathered from the NHANES data. This
data was chosen due availability and appropriateness of the data to explore the study
variables and reach study goals. Procedures for the NHANES data gathering included
that participants signed consent forms regarding their participation in the interview and
physical examination (CDC, 2013).

45
NHANES data gathering included a large staff of trained interviewers and
bilingual interviewers, who conducted the interviews in homes of the participants. All
participants completed an interviewer-administered questionnaire (Computer-Assisted
Personal Interview). Participants then took part in a physical examination within one to
two weeks after their interview. All physical examinations were performed in specially-
designed and equipped, traveling Mobile Examination Centers. The survey team
included dietary and health interviewers, a physician, and medical and health technicians.
This team ensures the standardized collection of all physical examination and lab data
(CDC, 2013).
Standardized, environment, equipment, and specimen collection were ensured
with the use of state-of-the-art exam equipment. All participants were assured privacy
regarding exams and interviews. A full examination took approximately three to four
hours, depending on age of the participant. Exam data was automatically transmitted into
databases with digital scales and stadiometers. For the laboratory assessments, biological
and environmental specimens such as blood (participants one year and older) and urine
(six years and older) were collected. Pregnant women were excluded from examination
components such as those involving "DEXA, BIA, and cardiovascular fitness testing"
(CDC, 2013, p. 1).
Complete Blood Counts were performed and three medical technologists conduct
laboratory tests on "biological and environmental specimens, record the results of the
tests, and prepare and ship specimens to various laboratories" all on-site (CDC, 2013, p.
1). Federal, private, and university-based laboratories under contract to NCHS performed
all other specimen testing. Participants completed additional interviewer-administered

46
survey questionnaires during their physical exam (dietary questionnaire, and
questionnaires on selected special topics). Selected groups of participants completed
questionnaires on other topics, such as sexual behaviors or illicit drug use. Participants
filled out these sensitive material questionnaires themselves, with an Audio Computer-
Assisted Self Interview. Follow-up nutrition questionnaires were conducted by telephone
interviews with survey staff, using a Computer-Assisted Telephone Interview and
participants were asked to fill out a food frequency questionnaire (CDC, 2013). The
researcher used this data to compute the statistical results and test study hypotheses.
Since data were from an archival and existing public source, ethical issues
regarding the subjects are not an issue. Specifically, since data are public record, and
subjects are not identified, issues of anonymity, confidentiality, privacy, and consent of
the participant are not a concern for the current study. Since archival data were used
there is no expected risk for the use of subject's data.
3.9 Data Analysis
The independent variable for this study is acculturation status and the dependent
variable is diabetes prevalence. The covariates for the study include: age, gender,
occupation, income, health insurance, physical activity and fitness, alcohol use, smoking
and tobacco use, weight history, anyone on a special diet, types of food available at
home, and types of food prepared-eaten.
Descriptive statistics, including frequencies and distributions were used to
describe the sample and the data related to the research questions. In this case the
frequencies and distributions were provided to show the percentages for participants
regarding all variables studied. Tables also demonstrated results.
47
Chi square and logistic regression models were used to calculate acculturation and
other factors that predict diabetes prevalence. Chi square allows for the examination of
two categorical variables and to assess whether they are grouped in non-random patterns.
Chi square was used to assess hypotheses 1, 3, 5, 6 and 9; the remainder were analyzed
using logistic regression, a version of multiple regression used when the dependent
variable is a dichotomous categorical variable. Multiple regression allows for one
response variable and several explanatory variables and their predicted relationship. For
example, the presence acculturation status can be used to predict diabetes outcomes.
Assumptions are the same as for bivariate regression: the underlying relationship is
linear. Dots in the scatterplot tend to be dispersed equally about all parts of the prediction
line referred to the assumption of homoscedasticity (Moore & McCabe, 2006).
Specifically, logistic regression was used for this study since the dependent variable is
categorical or dichotomous. For this study, the effect of acculturation status on diabetes
outcomes were analyzed. All demographic measures and lifestyle factors were added
separately to determine influences on the relationship between acculturation status and
diabetes. A full logistic regression model examined impacts of all covariates. Thus,
logistic regression models were used to calculate acculturation and other factors that
predict diabetes prevalence and test the hypotheses. Specifically, a hierarchical
regression allowed for the testing of all variables to determine relationships among
variables. Hierarchical regression helps to evaluate the contribution of predictors in the
regression equation. This sequential process allows the researcher to examine individual
contributions of factors studied. Factors are entered into the regression analysis based on
theory of related importance. Thus, multiple analyses were conducted to determine the

48
predictive ability of acculturation status and which factors are most influential in this
outcome, as follows:
Chi square was used to test Hypothesis 1: Acculturation status significantly
predicts diabetes prevalence in adult Hispanics in the U.S.
Logistic regression was used to test Hypothesis 2: Age significantly predicts
diabetes prevalence in adult Hispanics in the U.S.
Chi square was used to test Hypothesis 3: Gender significantly predicts diabetes
prevalence in adult Hispanics in the U.S.
Chi square was used to test Hypothesis 5: Income significantly predicts diabetes
prevalence in adult Hispanics in the U.S.
Chi square was used to test Hypothesis 6: Health insurance significantly predicts
diabetes prevalence in adult Hispanics in the U.S.
Logistic regression was used to test Hypothesis 7: Physical activity and fitness
significantly predicts diabetes prevalence in adult Hispanics in the U.S.
Logistic regression was used to test Hypothesis 8: Alcohol use significantly
predicts diabetes prevalence in adult Hispanics in the U.S.
Chi square was used to test Hypothesis 9: Smoking and tobacco use significantly
predicts diabetes prevalence in adult Hispanics in the U.S.
Logistic regression was used to test Hypothesis 10: Weight history significantly
predicts diabetes prevalence in adult Hispanics in the U.S.
Hierarchical logistic regression was used to test Hypothesis 11a: Acculturation
status, age, gender, occupation, income, health insurance, physical activity and fitness,
49
alcohol use, smoking and tobacco use, and weight history significantly predict diabetes
prevalence in adult Hispanics in the U.S.
Hierarchical logistic regression was used to test Hypothesis 11b: Acculturation
status, age, gender, occupation, income, health insurance, physical activity and fitness,
alcohol use, smoking and tobacco use, weight history, anyone on a special diet, types of
food available at home, and types of food prepared-eaten significantly predict diabetes
prevalence in adult Hispanics in the U.S.
Logistic regression was used to test Hypothesis 12: Anyone on a special diet
significantly predicts diabetes prevalence in adult Hispanics in the U.S.
Logistic regression was used to test Hypothesis 13: Types of food available at
home significantly predicts diabetes prevalence in adult Hispanics in the U.S.
Logistic regression was used to test Hypothesis 14: Types of food prepared-eaten
significantly predicts diabetes prevalence in adult Hispanics in the U.S.
3.10 Conclusion
The proposed study attempted to show whether acculturation status predicts
diabetes prevalence. In addition, the study demonstrated which covariate factors
influence this relationship most. NHANES data were used for the analysis of factors and
testing of the hypotheses. It is expected that this analysis demonstrated whether
acculturation status, age, gender, occupation, income, health insurance, physical activity
and fitness, alcohol use, smoking and tobacco use, weight history, anyone on a special
diet, types of food available at home, and types of food prepared-eaten significantly
predict diabetes prevalence in adult Hispanics in the U.S., and which of these factors was
most influential in this outcome.

50
CHAPTER IV
PRELIMINARY RESULTS
In this chapter, preliminary results are presented. These include a summary of the
operationalization of variables of the study (Appendix B). This is followed by a
summary of tables and charts for preliminary results (Appendix C).
4.1 Operationalization of Variables of Study
The variables for this study included: Diabetes Prevalence (Doctor told you you
had diabetes, Dichotomous); Acculturation Status (Language spoken at home,
Categorical); Age (Age in years, Continuous); Gender (Gender, Dichotomous); Income 1
(Annual Household Income, Categorical); Income 2 (Annual Household Income,
Dichotomous); Health Insurance (Covered by Health Insurance, Dichotomous); Physical
Activity and Fitness (Days physically active at least 60 minutes in a typical week,
Continuous); Alcohol Use (Avg number of alcoholic drinks per day over the past 12
months, Continuous); Weight History (Self-reported greatest weight, in pounds);
Smoking and tobacco use (Smoked at least 100 cigarettes in life, Dichotomous;
Consumer Behavior: Diet (Anyone in the family on a special diet?, Dichotomous);
Consumer Behavior: Fruits (Fruits available at home, Categorical); Consumer Behavior:
Dark Green Vegetables (Dark Green Vegetables available at home, Categorical);
Consumer Behavior: Salty Snacks (Salty Snacks available at home, Categorical);
Consumer Behavior: Fat Free/Low Fat Milk (Fat Free/Low Fat Milk available at home,
Categorical); Consumer Behavior: Soft Drinks (Soft Drinks available at home,
Categorical); Dietary Behavior: # of meals not at home (# of meals not at home, past 30

51
days, Continuous); Dietary Behavior: # of meals from fast food or pizza (# of meals
from fast food or pizza, past 30 days, Continuous); Dietary Behavior: # of ready-to-eat
foods (# of ready-to-eat foods, past 30 days, Continuous); and Dietary Behavior: # of
frozen meals/pizza
(# of frozen meals/pizza, past 30 days, Continuous) (Appendix B).
4.2 Tables and Charts for Preliminary Results
In summary, for Diabetes Prevalence, 86.9% reported no. For Acculturation
Status percentages were as follows: for Only Spanish (6.9%); for More Spanish than
English (2.9%); for Both Equally (3.5%); for More English than Spanish (3.1%); and for
Only English (2.8%). For Age at Screening, the mean age was 26.86. For Gender, 50.4%
were female. For Household Income 1 percents were as follows: $25,000 to $34,999
(14.2%), followed by $35,000 to $44,999 (10.0%), and $20,000 to (9.5%); for Household
Income 2 percentages were as follows: for Under $20,000 a year (27.9%) and for Over
$20,000 a year (64.3%). For Health Insurance, most responded yes (71.5%). For Physical
Activity and Fitness, the mean was 6.17. For Alcohol Use, the mean was 2.87. For
Smoking and Tobacco Use, No was the most common response (32.1%). For Highest
Self-Reported Weight, the mean was 192.39. For Consumer Behavior - Diet, No was the
most common response (49.7%). For Consumer Behavior - Fruits, the most common
response was Always (40.8%). For Consumer Behavior - Dark Green Vegetables, the
most common response was Always (33.9%). For Consumer Behavior - Fat free/low fat
milk, the most common response was Never (37.9%). For Consumer Behavior - Salty
Snacks, the most common response was Always (19.6%) followed by Sometimes (17%).
For Consumer Behavior - Soft Drinks, the most common response was Always (19%)

52
followed by Sometimes (14.9%). For Dietary Behavior: Meals not prepared at home, the
mean was 2.45. For Dietary Behavior - Meals from fast food or pizza, the mean was 1.89.
For Dietary Behavior - number of ready to eat foods, past 30 days, the mean was 1.35.
For Dietary Behavior - number of frozen meals/pizza, past 30 days, the mean was 1.63
(Appendix C).

53
CHAPTER V
RESULTS
5.1 Introduction
The purpose of the study was to determine the relationship between acculturation
status and diabetes prevalence in Hispanics. Thus, the study goal is to determine if
acculturation status predicts diabetes prevalence in Hispanics in the U.S. This chapter
describes the research findings of the study as follows: description of the analysis; and
the results of the data relating to the research questions and hypotheses.
5.2 Analysis Description
Two cycles analyzed included a total N = 5948. Of that, 3517 are from the 2009-
10 collection cycle and 2431 are from 2011-12. The N in each individual hypothesis is
different because it depends on the number of people who answered each question. The
household income variable included response categories for 12 levels of income, plus two
other for Under $20,000 per year and Over $20,000 per year. The single variable was re-
coded into two variables. Income 1 is the 12 level one, Income 2 is the other. Neither
one was significant. For the regression (hypothesis 11), only the 12 level variable was
used. Of the variables analyzed in Hypotheses 12 and 13: CBQ010 through CBQ060
were only collected in the 2009-10 cycle. An analysis of those variables alone was
included, but they were not included in the regression because it would have dropped all
2011-12 respondents. CSFII REC.340 and REC345 were interview questions with verbal
answers, which were too hard to code and also only was from the 09-10 cycle, so it was

54
not included. DBD895-DBD910 were included both as stand-alone analysis and also in a
2nd version of the regression, but none were significant.
5.3 Research Questions and Hypotheses
Hypothesis. The main hypothesis for this study is: Acculturation status
significantly predicts diabetes prevalence in Hispanic adults. This main hypothesis is
based on the main research question: How does acculturation status relate to diabetes
prevalence in adult Hispanics in the U.S.? Research questions and sub hypotheses are as
follows:
Research Question #1: How does acculturation status relate to diabetes
prevalence in adult Hispanics in the U.S.?
Hypothesis #1: Acculturation status significantly predicts diabetes prevalence in
adult Hispanics in the U.S.
Research Question #2: How does age relate to diabetes prevalence in adult
Hispanics in the U.S.?
Hypothesis 2: Age significantly predicts diabetes prevalence in adult Hispanics in
the U.S.
Research Question #3: How does gender relate to diabetes prevalence in adult
Hispanics in the U.S.?
Hypothesis 3: Gender significantly predicts diabetes prevalence in adult
Hispanics in the U.S.
Research Question #4: How does occupation relate to diabetes prevalence in
adult Hispanics in the U.S.?
55
Hypothesis 4: Occupation significantly predicts diabetes prevalence in adult
Hispanics in the U.S.
Research Question #5: How does income relate to diabetes prevalence in adult
Hispanics in the U.S.?
Hypothesis 5: Income significantly predicts diabetes prevalence in adult
Hispanics in the U.S.
Research Question #6: How does health insurance relate to diabetes prevalence
in adult Hispanics in the U.S.?
Hypothesis 6: Health insurance significantly predicts diabetes prevalence in adult
Hispanics in the U.S.
Research Question #7: How does physical activity and fitness relate to diabetes
prevalence in adult Hispanics in the U.S.?
Hypothesis 7: Physical activity and fitness significantly predicts diabetes
prevalence in adult Hispanics in the U.S.
Research Question #8: How does alcohol use relate to diabetes prevalence in
adult Hispanics in the U.S.?
Hypothesis 8: Alcohol use significantly predicts diabetes prevalence in adult
Hispanics in the U.S.
Research Question #9: How does smoking and tobacco use relate to diabetes
prevalence in adult Hispanics in the U.S.?
Hypothesis 9: Smoking and tobacco use significantly predicts diabetes
prevalence in adult Hispanics in the U.S.

56
Research Question #10: How does weight history relate to diabetes prevalence
in adult Hispanics in the U.S.?
Hypothesis 10: Weight history significantly predicts diabetes prevalence in adult
Hispanics in the U.S.
Research Question #11: How do acculturation status, age, gender, occupation,
income, health insurance, physical activity and fitness, alcohol use, smoking and tobacco
use, and weight history relate to diabetes prevalence in adult Hispanics in the U.S.?
Hypothesis 11a: Acculturation status, age, gender, occupation, income, health
insurance, physical activity and fitness, alcohol use, smoking and tobacco use, and weight
history significantly predict diabetes prevalence in adult Hispanics in the U.S.
Research Question #11b: How do acculturation status, age, gender, occupation,
income, health insurance, physical activity and fitness, alcohol use, smoking and tobacco
use, weight history, anyone on a special diet, types of food available at home, and types
of food prepared-eaten relate to diabetes prevalence in adult Hispanics in the U.S.?
Hypothesis 11b: Acculturation status, age, gender, occupation, income, health
insurance, physical activity and fitness, alcohol use, smoking and tobacco use, weight
history, anyone on a special diet, types of food available at home, and types of food
prepared-eaten significantly predict diabetes prevalence in adult Hispanics in the U.S.
Research Question #12: How does anyone on a special diet (any family member)
relate to diabetes prevalence in adult Hispanics in the U.S.?
Hypothesis 12: Anyone on a special diet significantly predicts diabetes
prevalence in adult Hispanics in the U.S.
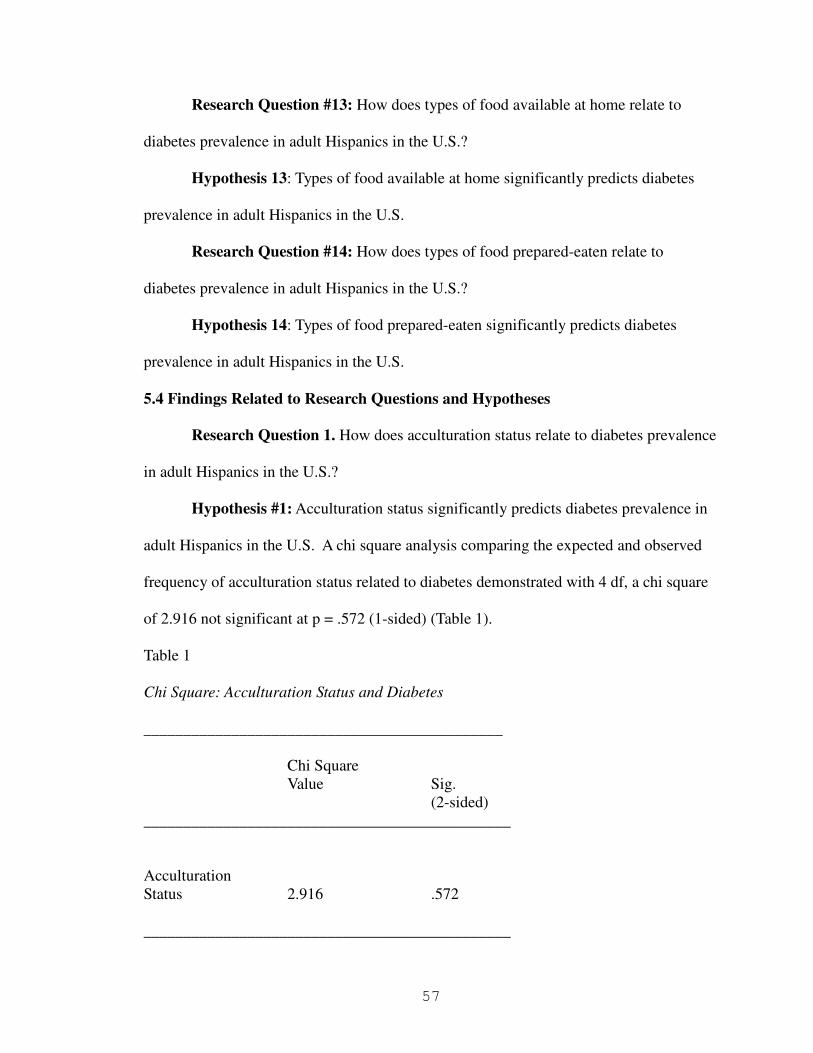
57
Research Question #13: How does types of food available at home relate to
diabetes prevalence in adult Hispanics in the U.S.?
Hypothesis 13: Types of food available at home significantly predicts diabetes
prevalence in adult Hispanics in the U.S.
Research Question #14: How does types of food prepared-eaten relate to
diabetes prevalence in adult Hispanics in the U.S.?
Hypothesis 14: Types of food prepared-eaten significantly predicts diabetes
prevalence in adult Hispanics in the U.S.
5.4 Findings Related to Research Questions and Hypotheses
Research Question 1. How does acculturation status relate to diabetes prevalence
in adult Hispanics in the U.S.?
Hypothesis #1: Acculturation status significantly predicts diabetes prevalence in
adult Hispanics in the U.S. A chi square analysis comparing the expected and observed
frequency of acculturation status related to diabetes demonstrated with 4 df, a chi square
of 2.916 not significant at p = .572 (1-sided) (Table 1).
Table 1
Chi Square: Acculturation Status and Diabetes _____________________________________________
Chi Square Value Sig. (2-sided) ______________________________________________
Acculturation Status 2.916 .572
______________________________________________
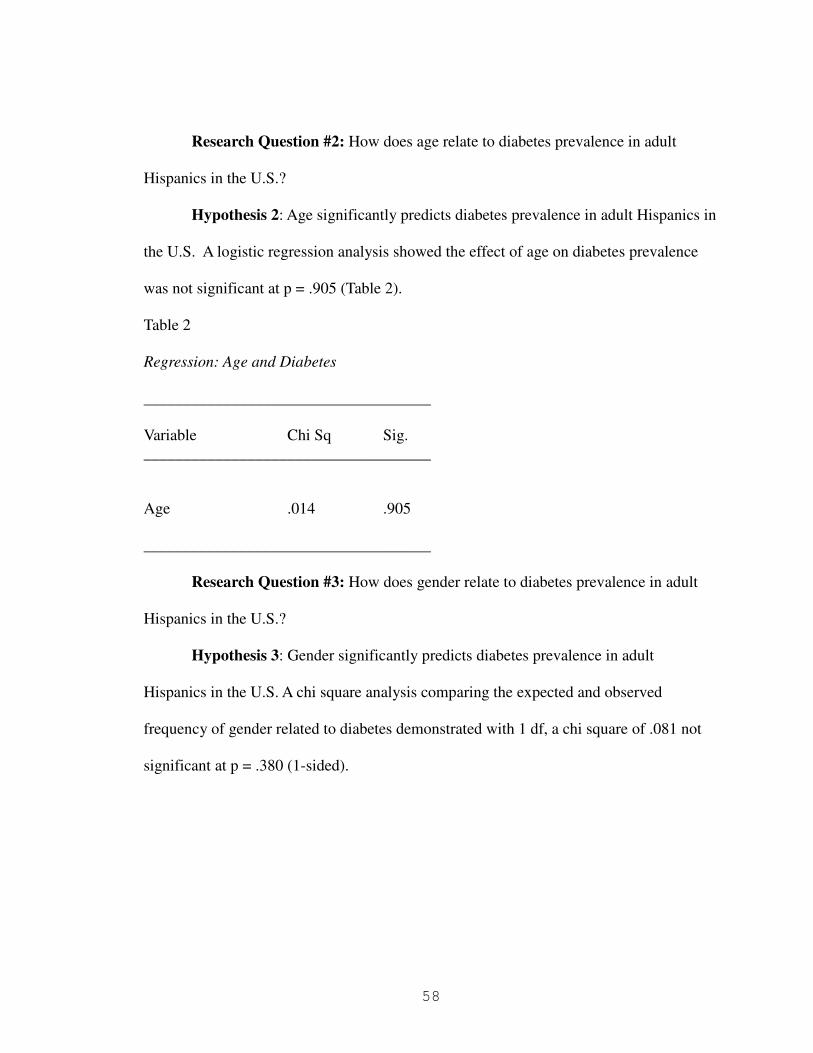
58
Research Question #2: How does age relate to diabetes prevalence in adult
Hispanics in the U.S.?
Hypothesis 2: Age significantly predicts diabetes prevalence in adult Hispanics in
the U.S. A logistic regression analysis showed the effect of age on diabetes prevalence
was not significant at p = .905 (Table 2).
Table 2
Regression: Age and Diabetes ____________________________________
Variable Chi Sq Sig. ____________________________________
Age .014 .905
____________________________________
Research Question #3: How does gender relate to diabetes prevalence in adult
Hispanics in the U.S.?
Hypothesis 3: Gender significantly predicts diabetes prevalence in adult
Hispanics in the U.S. A chi square analysis comparing the expected and observed
frequency of gender related to diabetes demonstrated with 1 df, a chi square of .081 not
significant at p = .380 (1-sided).

59
Table 3
Chi Square: Gender and Diabetes ________________________________________________________
Chi Square Value Sig. Sig. (2-sided) (1-sided) ________________________________________________________ Gender .126 .726 .380
________________________________________________________
Hypothesis 4: Occupation significantly predicts diabetes prevalence in adult
Hispanics in the U.S. Hypothesis 4 was dropped from the final analysis because the
coding used in the NHANES data set were found to be unworkable.
Research Question #5: How does income relate to diabetes prevalence in adult
Hispanics in the U.S.?
Hypothesis 5: Income significantly predicts diabetes prevalence in adult
Hispanics in the U.S. The income categories for the analysis were: 1) under $5,000; 2)
$5,000 to $9,999; 3) $10,000 to $14,999; 4) $15,000 to $19,999; 5) $20,000 to $24,999;
6) $25,000 to $34,999; 7) $35,000 to $44,999; 8) $45,000 to $54,999; 9) $55,000 to
$64,999; 10) $65,000 to $74,999; 14) $75,000 to $99,999; and 15) Over $100,000. For
the first analysis, 12 and 13 were dropped because they were different variables: 12 was
"under $20,000" and 13 was "over $20,000." For the second analysis, these two values
were tested separately.
For the first analysis, a logistic regression analysis showed the effect of income on
diabetes prevalence was not significant at p = .481 (Table 4).

60
Table 4
Regression: All Incomes and Diabetes ____________________________________
Variable Chi Sq Sig. ____________________________________
Income 10.562 .481
____________________________________
For the second analysis, a chi square analysis comparing two levels of income
demonstrated with 1 df, a chi square of .006 not significant at p = .493 (1-sided) (Table
5).
Table 5
Chi Square: Specific Incomes and Diabetes ______________________________________________________
Chi Square Value Sig. Sig. (2-sided) (1-sided) _______________________________________________________
Income .006 .955 .493
_______________________________________________________
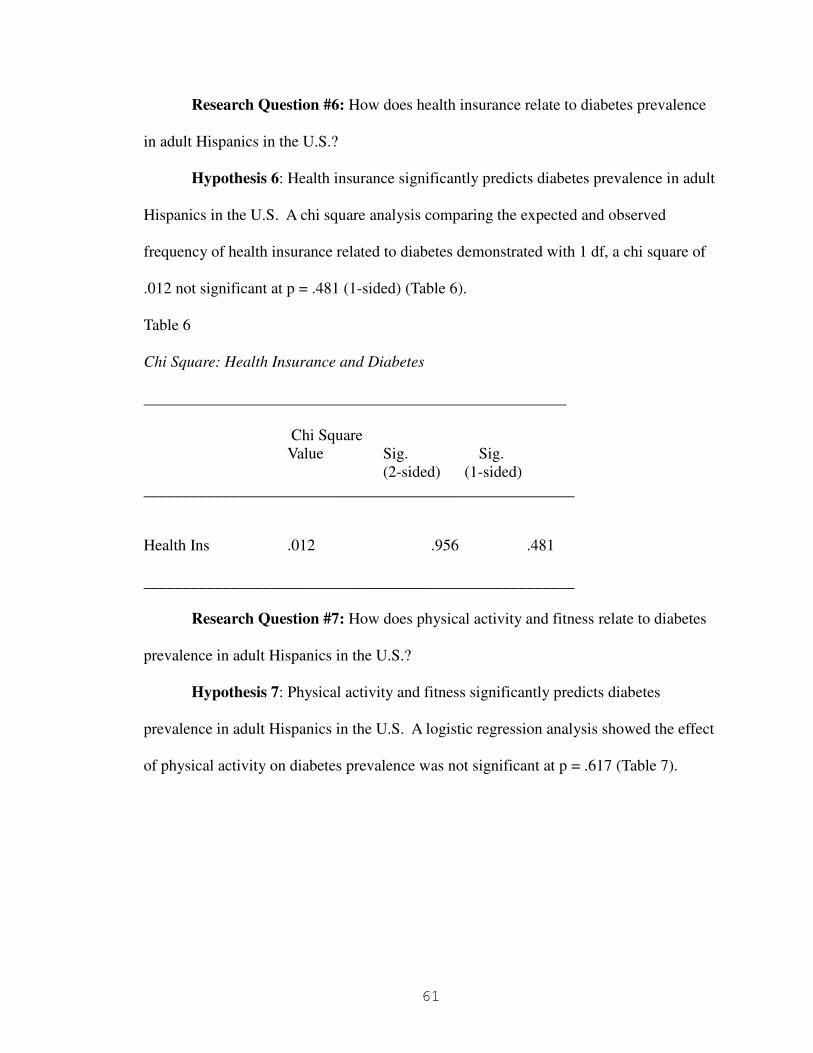
61
Research Question #6: How does health insurance relate to diabetes prevalence
in adult Hispanics in the U.S.?
Hypothesis 6: Health insurance significantly predicts diabetes prevalence in adult
Hispanics in the U.S. A chi square analysis comparing the expected and observed
frequency of health insurance related to diabetes demonstrated with 1 df, a chi square of
.012 not significant at p = .481 (1-sided) (Table 6).
Table 6
Chi Square: Health Insurance and Diabetes _____________________________________________________
Chi Square Value Sig. Sig. (2-sided) (1-sided) ______________________________________________________
Health Ins .012 .956 .481
______________________________________________________
Research Question #7: How does physical activity and fitness relate to diabetes
prevalence in adult Hispanics in the U.S.?
Hypothesis 7: Physical activity and fitness significantly predicts diabetes
prevalence in adult Hispanics in the U.S. A logistic regression analysis showed the effect
of physical activity on diabetes prevalence was not significant at p = .617 (Table 7).
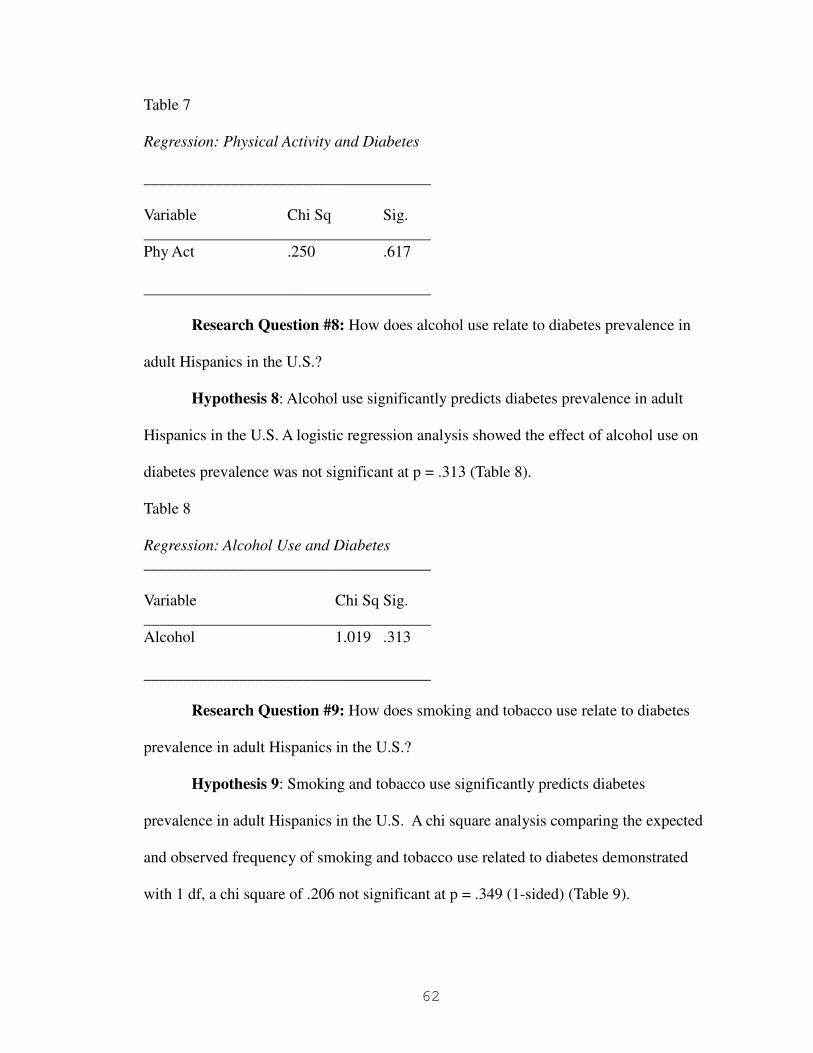
62
Table 7
Regression: Physical Activity and Diabetes ____________________________________
Variable Chi Sq Sig. ____________________________________ Phy Act .250 .617
____________________________________
Research Question #8: How does alcohol use relate to diabetes prevalence in
adult Hispanics in the U.S.?
Hypothesis 8: Alcohol use significantly predicts diabetes prevalence in adult
Hispanics in the U.S. A logistic regression analysis showed the effect of alcohol use on
diabetes prevalence was not significant at p = .313 (Table 8).
Table 8
Regression: Alcohol Use and Diabetes ____________________________________
Variable Chi Sq Sig. ____________________________________ Alcohol 1.019 .313
____________________________________
Research Question #9: How does smoking and tobacco use relate to diabetes
prevalence in adult Hispanics in the U.S.?
Hypothesis 9: Smoking and tobacco use significantly predicts diabetes
prevalence in adult Hispanics in the U.S. A chi square analysis comparing the expected
and observed frequency of smoking and tobacco use related to diabetes demonstrated
with 1 df, a chi square of .206 not significant at p = .349 (1-sided) (Table 9).

63
Table 9
Chi Square: Smoking and Diabetes ____________________________________________________
Chi Square Value Sig. Sig. (2-sided) (1-sided) _______________________________________________________ Smoking .206 .699 .349
_______________________________________________________
Research Question #10: How does weight history relate to diabetes prevalence
in adult Hispanics in the U.S.?
Hypothesis 10: Initial analysis indicated that weight history did not predict
diabetes prevalence. The measure was changed to Body Mass Index, as measured at time
of survey. BMI did not significantly predict diabetes prevalence at p = .383 (Table 10).
Table 10
Regression: Body Mass Index and Diabetes ____________________________________
Variable Chi Sq Sig. ____________________________________
BMI .762 .383
____________________________________
Research Question #11a: How do acculturation status, age, gender, income,
health insurance, physical activity and fitness, alcohol use, smoking and tobacco use, and
weight history relate to diabetes prevalence in adult Hispanics in the U.S.?
Hypothesis 11a: Acculturation status, age, gender, income, health insurance,
physical activity and fitness, alcohol use, smoking and tobacco use, and weight history

64
significantly predict diabetes prevalence in adult Hispanics in the U.S. A logistic
regression analysis showed the effect of these variables taken together on diabetes
prevalence was not significant at p = .438 (Table 11a).
Table 11a
Regression: Original Variables and Diabetes ____________________________________________
Variable Chi Sq Sig. ___________________________________________
Variables .022 .438
____________________________________________
Research Question #11b: How do acculturation status, age, gender, occupation,
income, health insurance, physical activity and fitness, alcohol use, smoking and tobacco
use, weight history, anyone on a special diet, types of food available at home, and types
of food prepared-eaten relate to diabetes prevalence in adult Hispanics in the U.S.?
Hypothesis 11b: Acculturation status, age, gender, occupation, income, health
insurance, physical activity and fitness, alcohol use, smoking and tobacco use, weight
history, anyone on a special diet, types of food available at home, and types of food
prepared-eaten significantly predict diabetes prevalence in adult Hispanics in the U.S. A
logistic regression analysis showed the effect of these variables taken together on
diabetes prevalence was not significant at p = .235 (Table 11b).

65
Table 11b
Regression: New and Multiple Variables and Diabetes ___________________________________________________
Variable Sig. ___________________________________________________
Variables .235
___________________________________________________
Research Question #12: How does anyone on a special diet (any family member)
relate to diabetes prevalence in adult Hispanics in the U.S.?
Hypothesis 12: Anyone on a special diet significantly predicts diabetes
prevalence in adult Hispanics in the U.S.
Anyone on a special diet was not found to predict diabetes prevalence at p = .479 (1-
sided), at a statistically significant level (Table 12).
Table 12
Regression: Anyone on a Special Diet and Diabetes _________________________________________________
Variable Chi Sq Sig. Sig. (2-sided) (1-sided) _________________________________________________
Anyone on a Special
Diet .030 .920 .479
_________________________________________________

66
Research Question #13: How does types of food available at home relate to
diabetes prevalence in adult Hispanics in the U.S.?
Hypothesis 13: Types of food available at home significantly predicts diabetes
prevalence in adult Hispanics in the U.S. Types of food available at home was not found
to predict diabetes prevalence at p = .622 (2-sided), at a statistically significant level
(Table 13).
Table 13
Regression: Types of Food Available at Home and Diabetes ________________________________________________________
Variable Chi Sq Sig. (2-sided) ________________________________________________________
Types of Food Available at Home 2.627 .622
________________________________________________________
Research Question #14: How does types of food prepared-eaten relate to
diabetes prevalence in adult Hispanics in the U.S.?
Hypothesis 14: Types of food prepared-eaten significantly predicts diabetes
prevalence in adult Hispanics in the U.S. Types of food available at home was not found
to predict diabetes prevalence at p = .381, at a statistically significant level (Table 14).

67
Table 14
Regression: Types of Food Prepared-Eaten and Diabetes _____________________________________________________
Variable Chi Sq Sig. _____________________________________________________
Types of Food
Prepared-Eaten 4.192 .381
_____________________________________________________
In summary, none of the variables for the study: age, gender, occupation, income,
health insurance, physical activity and fitness, alcohol use, smoking and tobacco use,
weight history, anyone on a special diet, types of food available at home, and types of
food prepared-eaten significantly predicted diabetes prevalence in adult Hispanics in the
U.S., which did not support the hypotheses.

68
CHAPTER VI
DISCUSSION, CONCLUSIONS, NEXT STEPS
6.1 Introduction
The purpose of the study was to explore the relationship between acculturation
status and diabetes prevalence in U.S. Hispanics. Thus, the study goal was to determine
if acculturation status predicts diabetes prevalence in Hispanics in the U.S. The main
hypothesis for this study is: Acculturation status significantly predicts diabetes prevalence
in Hispanic adults. This main hypothesis is based on the main research question: How
does acculturation status relate to diabetes prevalence in adult Hispanics in the U.S.? In
addition, the study included an investigation into covariates that might influence the
relationship between acculturation status and diabetes prevalence. Thus, the relationships
between age, gender, occupation, income, health insurance, physical activity and fitness,
alcohol use, smoking and tobacco use, weight history, anyone on a special diet, types of
food available at home, and types of food prepared-eaten and diabetes prevalence were
explored. This section presents a discussion of findings with a summary of research
objectives and findings related to research questions and hypotheses. The discussion also
includes an interpretation of the findings and explains the significance of the findings and
their relevance to previous research. Following this study conclusions, study limitations,
and recommendations are presented.

69
6.1. Interpretation of the Findings
Research Question #1: How does acculturation status relate to diabetes
prevalence in adult Hispanics in the U.S.?
Null Hypothesis #1: Acculturation status significantly does not predict diabetes
prevalence in adult Hispanics in the U.S.
Hypothesis #1: Acculturation status significantly predicts diabetes prevalence in
adult Hispanics in the U.S.
In the present study, findings from a chi square analysis were that acculturation
status did not significantly predict diabetes prevalence in adult Hispanics in the U.S. (p =
.572). Thus, findings do not support the hypothesis. Findings are in line with mixed
results from the literature. For example, there is a tendency for time spent in the U.S. to
increase prevalence rates of diabetes in Hispanics (Afable-Munsuz et al., 2013), but these
authors also found that acculturation was negatively related to diabetes prevalence.
Research Question #2: How does age relate to diabetes prevalence in adult
Hispanics in the U.S.?
Null Hypothesis 2: Age does not significantly predict diabetes prevalence in adult
Hispanics in the U.S.
Hypothesis 2: Age significantly predicts diabetes prevalence in adult Hispanics in
the U.S.
In the present study, findings from a logistic regression showed that age did not
significantly predict diabetes prevalence in adult Hispanics in the U.S. (p = .905). Thus,
findings do not support the hypothesis. Findings are somewhat consistent with literature
findings. As noted by NIDDK (2014), there are three main types of diabetes: type 1, type
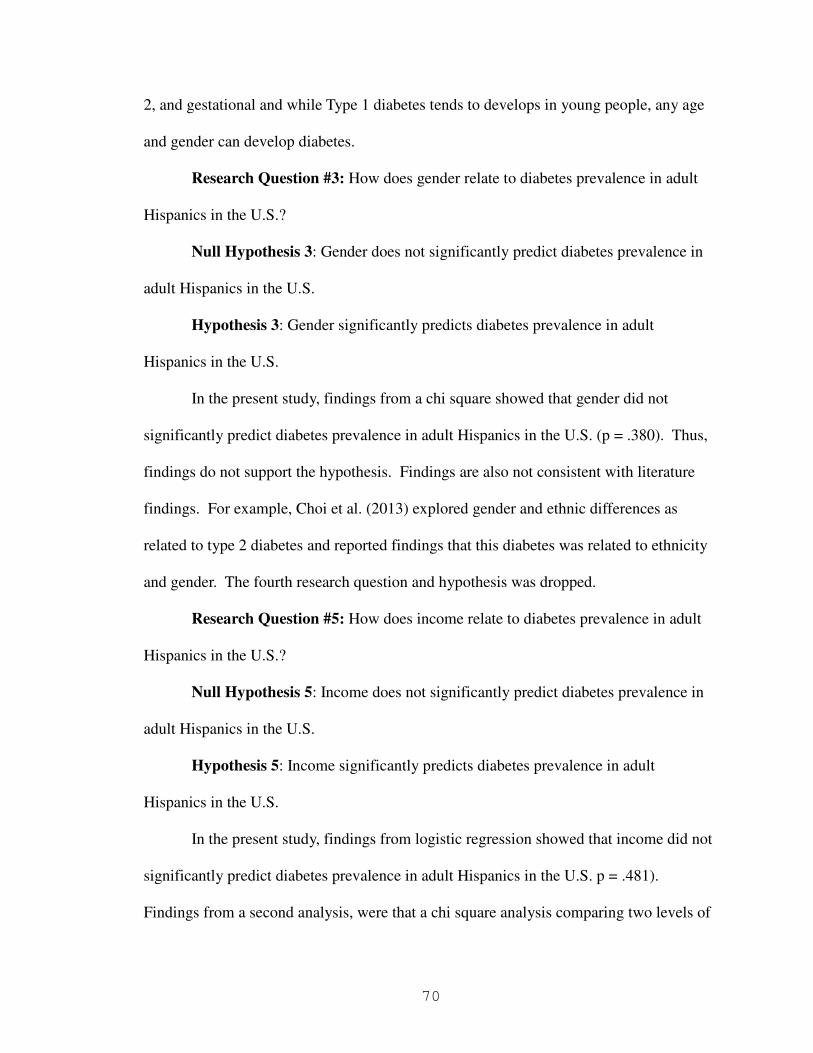
70
2, and gestational and while Type 1 diabetes tends to develops in young people, any age
and gender can develop diabetes.
Research Question #3: How does gender relate to diabetes prevalence in adult
Hispanics in the U.S.?
Null Hypothesis 3: Gender does not significantly predict diabetes prevalence in
adult Hispanics in the U.S.
Hypothesis 3: Gender significantly predicts diabetes prevalence in adult
Hispanics in the U.S.
In the present study, findings from a chi square showed that gender did not
significantly predict diabetes prevalence in adult Hispanics in the U.S. (p = .380). Thus,
findings do not support the hypothesis. Findings are also not consistent with literature
findings. For example, Choi et al. (2013) explored gender and ethnic differences as
related to type 2 diabetes and reported findings that this diabetes was related to ethnicity
and gender. The fourth research question and hypothesis was dropped.
Research Question #5: How does income relate to diabetes prevalence in adult
Hispanics in the U.S.?
Null Hypothesis 5: Income does not significantly predict diabetes prevalence in
adult Hispanics in the U.S.
Hypothesis 5: Income significantly predicts diabetes prevalence in adult
Hispanics in the U.S.
In the present study, findings from logistic regression showed that income did not
significantly predict diabetes prevalence in adult Hispanics in the U.S. p = .481).
Findings from a second analysis, were that a chi square analysis comparing two levels of

71
income demonstrated not significant results (p = .493). Thus, findings do not support the
hypothesis. Findings are also not consistent with literature findings. For example,
Gaskin et al. (2014) investigated factors that might impact diabetes rates and outcomes
and reported findings that individual poverty and living in a poor neighborhood led to an
increase in diabetes for Blacks and Whites.
Research Question #6: How does health insurance relate to diabetes prevalence
in adult Hispanics in the U.S.?
Null Hypothesis 6: Health insurance does not significantly predict diabetes
prevalence in adult Hispanics in the U.S.
Hypothesis 6: Health insurance significantly predicts diabetes prevalence in adult
Hispanics in the U.S.
In the present study, findings from a chi square showed that health insurance did
not significantly predict diabetes prevalence in adult Hispanics in the U.S. (p = .481).
Thus, findings do not support the hypothesis but provided new insights.
Research Question #7: How does physical activity and fitness relate to diabetes
prevalence in adult Hispanics in the U.S.?
Null Hypothesis 7: Physical activity and fitness does not significantly predict
diabetes prevalence in adult Hispanics in the U.S.
Hypothesis 7: Physical activity and fitness significantly predicts diabetes
prevalence in adult Hispanics in the U.S.
In the present study, findings from a logistic regression showed that physical
activity and fitness did not significantly predict diabetes prevalence in adult Hispanics in
the U.S. (p = .617). Thus, findings do not support the hypothesis. Findings are also not

72
consistent with literature findings. For example, Holmes et al. (2012) studied risk factors
related to racial/ethnic variability in diabetes mellitus rates in the United States and found
that there were statistically significant differences for ethnic/racial groups, regarding age,
education, marital status, income, smoking, alcohol, body mass index, and physical
activities. Ma et al. (2012) reported findings that risk for diabetes was related weight and
physical activity.
Research Question #8: How does alcohol use relate to diabetes prevalence in
adult Hispanics in the U.S.?
Null Hypothesis 8: Alcohol use does not significantly predict diabetes prevalence
in adult Hispanics in the U.S.
Hypothesis 8: Alcohol use significantly predicts diabetes prevalence in adult
Hispanics in the U.S.
In the present study, findings from a logistic regression showed that alcohol use
did not significantly predict diabetes prevalence in adult Hispanics in the U.S. (p = .313).
Thus, findings do not support the hypothesis. Findings are also not consistent with
literature findings. For example, Holmes et al. (2012) studied risk factors related to
racial/ethnic variability in diabetes mellitus rates in the United States and found that there
were statistically significant differences for ethnic/racial groups, regarding alcohol and
other factors.
Research Question #9: How does smoking and tobacco use relate to diabetes
prevalence in adult Hispanics in the U.S.?
Null Hypothesis 9: Smoking and tobacco use does not significantly predict
diabetes prevalence in adult Hispanics in the U.S.

73
Hypothesis 9: Smoking and tobacco use significantly predicts diabetes
prevalence in adult Hispanics in the U.S.
In the present study, findings from a chi square showed that smoking and tobacco
use did not significantly predict diabetes prevalence in adult Hispanics in the U.S. (p =
.349). Thus, findings do not support the hypothesis. Findings are also not consistent
with literature findings. For example, Holmes et al. (2012) studied risk factors related to
racial/ethnic variability in diabetes mellitus rates in the United States and found that there
were statistically significant differences for ethnic/racial groups, regarding smoking and
other factors. Otiniano et al. (2012) reported factors related to poor glycemic control in
Mexican American diabetics included foreign-born, lower education levels (<8 years),
obesity, smoking, longer disease duration, daily glucometer use, and macro-
complications.
Research Question #10: How does weight history relate to diabetes prevalence
in adult Hispanics in the U.S.?
Null Hypothesis 10: Weight history does not significantly predict diabetes
prevalence in adult Hispanics in the U.S.
Hypothesis 10: Weight history significantly predicts diabetes prevalence in adult
Hispanics in the U.S.
In the present study, findings from a logistic regression showed that BMI did not
significantly predict diabetes prevalence (p = .383). Thus, findings do not support the
hypothesis. Findings are also not consistent with literature findings. For example,
Researchers, The et al. (2013) reported findings from the U.S. National Longitudinal
Study of Adolescent Health (1996) data, which included a sample of 10,481 individuals
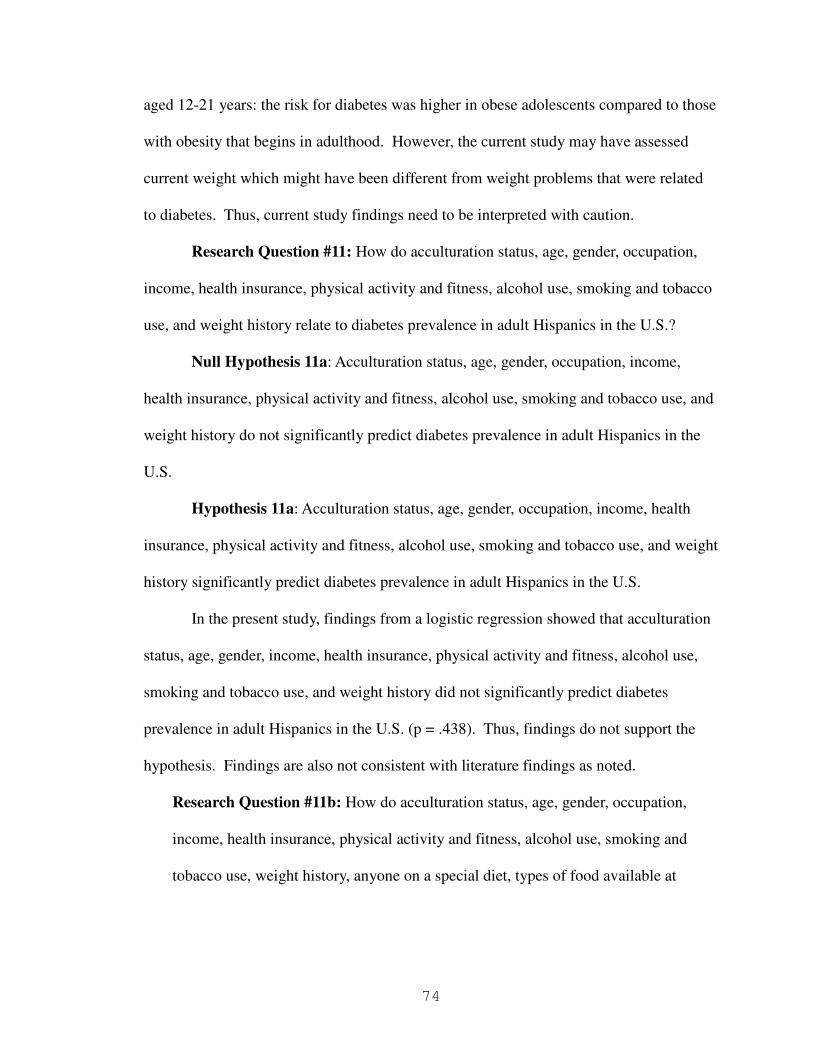
74
aged 12-21 years: the risk for diabetes was higher in obese adolescents compared to those
with obesity that begins in adulthood. However, the current study may have assessed
current weight which might have been different from weight problems that were related
to diabetes. Thus, current study findings need to be interpreted with caution.
Research Question #11: How do acculturation status, age, gender, occupation,
income, health insurance, physical activity and fitness, alcohol use, smoking and tobacco
use, and weight history relate to diabetes prevalence in adult Hispanics in the U.S.?
Null Hypothesis 11a: Acculturation status, age, gender, occupation, income,
health insurance, physical activity and fitness, alcohol use, smoking and tobacco use, and
weight history do not significantly predict diabetes prevalence in adult Hispanics in the
U.S.
Hypothesis 11a: Acculturation status, age, gender, occupation, income, health
insurance, physical activity and fitness, alcohol use, smoking and tobacco use, and weight
history significantly predict diabetes prevalence in adult Hispanics in the U.S.
In the present study, findings from a logistic regression showed that acculturation
status, age, gender, income, health insurance, physical activity and fitness, alcohol use,
smoking and tobacco use, and weight history did not significantly predict diabetes
prevalence in adult Hispanics in the U.S. (p = .438). Thus, findings do not support the
hypothesis. Findings are also not consistent with literature findings as noted.
Research Question #11b: How do acculturation status, age, gender, occupation,
income, health insurance, physical activity and fitness, alcohol use, smoking and
tobacco use, weight history, anyone on a special diet, types of food available at

75
home, and types of food prepared-eaten relate to diabetes prevalence in adult
Hispanics in the U.S.?
Null Hypothesis 11b: Acculturation status, age, gender, occupation, income, health
insurance, physical activity and fitness, alcohol use, smoking and tobacco use,
weight history, anyone on a special diet, types of food available at home, and types
of food prepared-eaten do not significantly predict diabetes prevalence in adult
Hispanics in the U.S.
Hypothesis 11b: Acculturation status, age, gender, occupation, income, health
insurance, physical activity and fitness, alcohol use, smoking and tobacco use,
weight history, anyone on a special diet, types of food available at home, and types
of food prepared-eaten significantly predict diabetes prevalence in adult Hispanics in
the U.S.
In the present study, findings from a logistic regression showed that acculturation
status, age, gender, occupation, income, health insurance, physical activity and
fitness, alcohol use, smoking and tobacco use, weight history, anyone on a special
diet, types of food available at home, and types of food prepared-eaten did not
significantly predict diabetes prevalence in adult Hispanics in the U.S. (p = .235).
This regression was run since new factors were added to the analysis as reflected in
research questions and hypotheses 12-14. Study findings did not support the
hypothesis. Findings are also not consistent with literature findings as noted.

76
Research Question #12: How does anyone on a special diet (any family member)
relate to diabetes prevalence in adult Hispanics in the U.S.?
Null Hypothesis 12: Anyone on a special diet does not significantly predict diabetes
prevalence in adult Hispanics in the U.S.
Hypothesis 12: Anyone on a special diet significantly predicts diabetes
prevalence in adult Hispanics in the U.S.
In the present study, findings from a logistic regression showed that anyone on a
special diet did not significantly predict diabetes prevalence in adult Hispanics in the U.S.
(p = .479). Thus, findings do not support the hypothesis. Findings are also not consistent
with literature findings.
Research Question #13: How does types of food available at home relate to
diabetes prevalence in adult Hispanics in the U.S.?
Null Hypothesis 13: Types of food available at home does not significantly
predict diabetes prevalence in adult Hispanics in the U.S.
Hypothesis 13: Types of food available at home significantly predicts diabetes
prevalence in adult Hispanics in the U.S.
In the present study, findings from a logistic regression showed that types of food
available at home did not significantly predict diabetes prevalence in adult Hispanics in
the U.S. (p = .622). Thus, findings do not support the hypothesis. Findings are also not
consistent with literature findings.
Research Question #14: How does types of food prepared-eaten relate to diabetes
prevalence in adult Hispanics in the U.S.?

77
Null Hypothesis 14: Types of food prepared-eaten does not significantly predict
diabetes prevalence in adult Hispanics in the U.S.
Hypothesis 14: Types of food prepared-eaten significantly predicts diabetes
prevalence in adult Hispanics in the U.S.
In the present study, findings from a logistic regression showed that types of food
prepared-eaten did not significantly predict diabetes prevalence in adult Hispanics in the
U.S. (p = .381). Thus, findings do not support the hypothesis. Findings are also not
consistent with literature findings.
Research questions 12, 13, and 14 and hypotheses 12, 13, and 14 are related to
eating and diet behaviors. Non-significant findings from the current study were not
consistent with literature findings. For example, Yannakoulia (2006) reported that
consumer behaviors and dietary practices are an important component of diabetes care.
Agborsangaya et al. (2013) reported that lifestyle behavior modification is a critical part
of self-management of type 2 diabetes. According to the Diabetes Research and Action
Education Foundation (2016), the "adoption of a healthy lifestyle, especially good
nutrition, is the cornerstone of diabetes treatment in type 1 and type 2 diabetes" (p. 1).
However, while these authors noted the importance of diet and eating behaviors to
control diabetes, this may help explain current study findings. It is possible that the
current study assessed changed behaviors and did not measure the actual diet and eating
behaviors that were related to diabetes. In summary, none of the variables significantly
predicted diabetes prevalence in adult Hispanics in the U.S., which did not support the
hypotheses.

78
6.2 Limitations
Study limitations regard the design, sample, and data instrument. Since the study
variables were not directly manipulated and archival data were from existing groups,
findings are descriptive. The use of the NHANES for data gathering limited findings. In
summary, none of the variables significantly predicted diabetes prevalence in adult
Hispanics in the U.S., which did not support the hypotheses. The fact that no individual
variables were found to be significant may be due in part to the conceptualization of the
variables which may be a study limitation. For example, Language Spoken at Home
might be a good proxy for acculturation in many circumstances, but it may not be the best
proxy when considering health issues. Also, most of the data was concerned with current
practices and for diabetes, it may be more important to look at behaviors when growing
up rather than right now, which is another study limitation. If someone has received a
diagnosis of diabetes, it is likely that they have changed their lifestyle already, which is
why none of the variables were found to be significantly predictive. A retrospective
questionnaire, asking about previous behaviors, should find stronger relationships.

79
6.3 Conclusions
Conclusions for the study are as follows: none of the variables significantly
predicted diabetes prevalence in adult Hispanics in the U.S. Therefore, acculturation
status, age, gender, occupation, income, health insurance, physical activity and fitness,
alcohol use, smoking and tobacco use, weight history, anyone on a special diet, types of
food available at home, and types of food prepared-eaten did not significantly predict
diabetes prevalence. None of the hypotheses were supported.
Implications. Implications of findings are that acculturation status, age, gender,
occupation, income, health insurance, physical activity and fitness, alcohol use, smoking
and tobacco use, weight history, anyone on a special diet, types of food available at
home, and types of food prepared-eaten may not be significant predictor of diabetes
prevalence. However, these conclusions must be considered with caution due to study
limitations.
6.4 Next Steps: Recommendations
Recommendations for future research. Since there are study limitations due to the
sample, instrument, and design it is recommended that it be replicated in a future study
that includes a random sample selected from multiple geographic locations and different
instruments. Since conceptualization of the variables may also have limited findings it is
recommended that the factors studied be assessed with different instruments. For
example, rather than Language Spoken at Home, acculturation status needs to be assessed
with a more specific question directly assessing this status. In addition, data gathered for
the variables needs to measure behaviors when growing up rather than current behaviors.
Since the study is limited by its design, it is recommended that a future study explore the

80
study variables using a mixed survey and quasi experimental design. In this manner,
while the sample is likely to be smaller, it can include generational family members and
data regarding early eating behaviors that led to diabetes.
While this study provided important and useful information regarding factors that
did not predict diabetes, due to the study limitations all findings must be viewed with
caution. Initial attempts for a large sample to explore variables led to severe study
limitations. A more comprehensive understanding of the topic is needed to fully
understand the predictive ability of factors explored. It is therefore recommended that a
future study further investigate the variables and findings from this study. For example, a
study is needed to investigate the ability of acculturation status, age, gender, occupation,
income, health insurance, physical activity and fitness, alcohol use, smoking and tobacco
use, weight history, anyone on a special diet, types of food available at home, and types
of food prepared-eaten to predict diabetes prevalence and reasons for these outcomes. A
mixed study design would allow for the gathering of qualitative information to help
explain quantitative findings.

81
References
Afable-Munsuz, A., Mayeda, E. R., Perez-Stable, E., & Haan, M. N. (2013). Immigrant generation and diabetes risk among Mexican Americans: The Sacramento area Latino study on aging. American Journal of Public Health, 103(5), e45-e52. doi: 10.2105/AJPH.2012.300969. Retrieved from http://www.ncbi.nlm.nih.gov/pmc/articles/PMC3686633/
Agborsangaya, C. B., Gee, M. E., Johnson, S. T., Dunbar, P., Langlois, M. F., Leiter, L. A., Pelletier, C., & Johnson, J. A. (2013). Determinants of lifestyle behavior in type 2 diabetes: Results of the 2011 cross-sectional survey on living with chronic diseases in Canada. BMC Public Health, 13, 451. DOI: 10.1186/1471-2458-13-451. Retrieved from http://bmcpublichealth.biomedcentral.com/articles/10.1186/1471-2458-13-451
Bentley-Lewis, R., Powe, C., Ankers, E., Wenger, J., Ecker, J., & Thadhani, R. (2014). Effect of Race/Ethnicity on hypertension risk subsequent to gestational diabetes mellitus. The American Journal of Cardiology, 113(8), 1364-1370. doi:http://dx.doi.org/10.1016/j.amjcard.2014.01.411
Bhalla, V., Zhao, B., Azar, K., Wang, E. J., Choi, S., Wong, E. C., & Palaniappan, L.
(2013). Racial/Ethnic differences in the prevalence of proteinuric and nonproteinuric diabetic kidney disease. Diabetes Care, 36(5), 1215-21. Retrieved from http://ezproxy.lapl.org/login?url=http://search.proquest.com/docview/1353342876?accountid=6749
Bower, J., Brancati, F., & Selvin, E. (2013). No ethnic differences in the association of
glycated hemoglobin with retinopathy: The national health and nutrition examination survey 2005-2008. Diabetes Care, 36(3), 569-73. Retrieved from http://ezproxy.lapl.org/login?url=http://search.proquest.com/docview/1318734545?accountid=6749
Braun, P. A., Huebschmann, A. G., Kim, C. A., Lezotte, D. C., Shupe, A., & Dabelea, D.
(2011). Effect of maternal birthplace on gestational diabetes prevalence in colorado Hispanics. Journal of Immigrant and Minority Health, 13(3), 426-33. doi:http://dx.doi.org/10.1007/s10903-010-9370-4
Centers for Disease Control and Prevention (CDC). (2013). Survey overview. Retrieved
from http://www.cdc.gov/nchs/tutorials/nhanes/SurveyOrientation/SurveyOverview/intro.htm

82
Centers for Disease Control and Prevention (CDC). (2014a). National Diabetes statistics report, 2014. 2009–2012 National health and nutrition examination survey and 2012 U.S. census data. Retrieved from http://www.cdc.gov/diabetes/pubs/statsreport14/national-diabetes-report-web.pdf
Centers for Disease Control and Prevention (CDC). (2014b). National Health and
Nutrition Examination Survey. Retrieved from http://www.cdc.gov/nchs/nhanes/about_nhanes.htm
Choi, S. E., Liu, M., Palaniappan, L. P., Wang, E. J., & Wong, N. D. (2013). Gender and
ethnic differences in the prevalence of type 2 diabetes among Asian subgroups in California. Journal of Diabetes and its Complications, 27(5), 429-35. doi:http://dx.doi.org/10.1016/j.jdiacomp.2013.01.002
Chow, E. A., Foster, H., Gonzalez, V., & McIver, L. (2012). The disparate impact of
diabetes on Racial/Ethnic minority populations. Clinical Diabetes, 30(3), 130-133. Retrieved from http://ezproxy.lapl.org/login?url=http://search.proquest.com/docview/1033045289?accountid=6749
Cohen J. (1977). Statistical power analysis for the behavioral sciences (Rev. ed.). New
York, NY: Academic Press. Colon, E., Giachello, A., McIver, L., Pacheco, G., & Vela, L. (2013). Diabetes and
depression in the Hispanic/Latino community. Clinical Diabetes, 31(1), 43-45. Retrieved from http://ezproxy.lapl.org/login?url=http://search.proquest.com/docview/1287026516?accountid=6749
Diabetes Research and Action Education Foundation (2016). Your eating style profile.
Seven styles of eating behavior - understanding the emotional and social dimensions of eating and nutrition. Retrieved from http://www.diabetesaction.org/site/PageServer?pagename=complementaryEatingStyles
Gaskin, D. J., Thorpe, R. J., McGinty, E. E., Bower, K., Rohde, C., Young, J. H., &
Dubay, L. (2014). Disparities in diabetes: The nexus of race, poverty, and place. American Journal of Public Health, 104(11), 2147-55. Retrieved from http://ezproxy.lapl.org/login?url=http://search.proquest.com/docview/1619996382?accountid=6749
Gregg, E. W., Li, Y., Wang, J., Rios Burrows, N., Ali, M. K., Rolka, D., & Geiss, L.
(2014). Changes in diabetes-related complications in the united states, 1990-2010. The New England Journal of Medicine, 370(16), 1514-23. Retrieved from http://ezproxy.lapl.org/login?url=http://search.proquest.com/docview/1517454207?accountid=6749

83
Hedderson, M., Ehrlich, S., Sridhar, S., Darbinian, J., Moore, S., & Ferrara, A. (2012).
Racial/Ethnic disparities in the prevalence of gestational diabetes mellitus by BMI. Diabetes Care, 35(7), 1492-8. Retrieved from http://ezproxy.lapl.org/login?url=http://search.proquest.com/docview/1024828594?accountid=6749
Holmes, L., Hossain, J., Ward, D., & Opara, F. (2012). Racial/Ethnic variability in
diabetes mellitus among united states residents is unexplained by lifestyle, sociodemographics and prognostic factors. ISRN Public Health, Retrieved from http://ezproxy.lapl.org/login?url=http://search.proquest.com/docview/1038934081?accountid=6749
Kim, Y. Y. (2001). Becoming intercultural: An integrative theory of communication and
cross-cultural adaptation. Thousand Oaks, CA: SAGE Publications. doi: http://dx.doi.org/10.4135/9781452233253
Kim, S. Y., Saraiva, C., Curtis, M., Wilson, H. G., Troyan, J., England, L., & Sharma, A.
(2013). Fraction of gestational diabetes mellitus attributable to overweight and obesity by Race/Ethnicity, California, 2007-2009. American Journal of Public
Health, 103(10), e65-72. Retrieved from http://ezproxy.lapl.org/login?url=http://search.proquest.com/docview/1441294623?accountid=6749
Ma, Y., Hébert, J.,R., Manson, J. E., Balasubramanian, R., Liu, S., Lamonte, M. J., &
Howard, B. V. (2012). Determinants of Racial/Ethnic disparities in incidence of diabetes in postmenopausal women in the U.S.: The women's health initiative 1993-2009. Diabetes Care, 35(11), 2226-34. Retrieved from http://ezproxy.lapl.org/login?url=http://search.proquest.com/docview/1223844356?accountid=6749
National Institute of Diabetes and Digestive and Kidney Diseases (NIDDK). (2014).
Diabetes. National Institutes of Health (NIH). Retrieved from http://diabetes.niddk.nih.gov/dm/pubs/type1and2/index.aspx
Office of Minority Health (OMH). (2014). 2012 National Healthcare Disparities Report.
Table T2_4_1_3-2b. U.S. Department of Health and Human Services. Retrieved from http://minorityhealth.hhs.gov/omh/browse.aspx?lvl=4&lvlID=63
Oster, E. (2014). Diabetes and diet: Behavioral response and the value of health.
University of Chicago Booth School of Business and NBER, 1-42. Retrieved from http://faculty.chicagobooth.edu/emily.oster/papers/diabetes.pdf
84
Otiniano, M. E., Al Snih, S., Goodwin, J. S., Ray, L., AlGhatrif, M., & Markides, K. S. (2012). Factors associated with poor glycemic control in older Mexican American diabetics aged 75 years and older. Journal of Diabetes and its Complications,
26(3), 181-6. doi:http://dx.doi.org/10.1016/j.jdiacomp.2012.03.010 Pabon-nau, L., Cohen, A., Meigs, J. B., & Grant, R. W. (2010). Hypertension and
diabetes prevalence among U.S. Hispanics by country of origin: The national health interview survey 2000-2005. Journal of General Internal Medicine, 25(8), 847-52. doi:http://dx.doi.org/10.1007/s11606-010-1335-8
Pérez, C.,M., Sánchez, H., & Ortiz, A. P. (2013). Prevalence of overweight and obesity
and their cardiometabolic comorbidities in Hispanic adults living in Puerto Rico. Journal of Community Health, 38(6), 1140-6. doi:http://dx.doi.org/10.1007/s10900-013-9726-5
Santos, S. J., Hurtado-Ortiz, M. T., & Sneed, C. D. (2009). (2009). Illness beliefs
regarding the causes of diabetes among Latino college students. Hispanic Journal
Behavioral Science, 31(3), 395–412. doi: 10.1177/0739986309339911. Retrieved from http://www.ncbi.nlm.nih.gov/pmc/articles/PMC2827852/
Scherwitz, L., & Kesten, D. (2005). Seven eating styles linked to overeating, overweight,
and obesity. Explore (NY), 1(5), 342-359. Retrieved from
http://www.ncbi.nlm.nih.gov/pubmed/16781565
Suh, D., Choi, I., Plauschinat, C., Kwon, J., & Baron, M. (2010). Impact of comorbid
conditions and race/ethnicity on glycemic control among the US population with type 2 diabetes, 1988-1994 to 1999-2004. Journal of Diabetes and its
Complications, 24(6), 382-91. doi:http://dx.doi.org/10.1016/j.jdiacomp.2009.07.001
The, N. S., Richardson, A. S., & Gordon-Larsen, P. (2013). Timing and duration of
obesity in relation to diabetes: Findings from an ethnically diverse, nationally representative sample. Diabetes Care, 36(4), 865-72. Retrieved from http://ezproxy.lapl.org/login?url=http://search.proquest.com/docview/1332740371?accountid=6749
Tuchman, A. M. (2011). Diabetes and RACE: A historical perspective. American Journal
of Public Health, 101(1), 24-33. Retrieved from http://ezproxy.lapl.org/login?url=http://search.proquest.com/docview/822931998?accountid=6749
Wichert, R. (1996). Acculturation and intercultural identity in the post-modern world.
Retrieved from http://www.wichert.org/icid.html

85
Yannakoulia, M. (2006). Eating behavior among type 2 diabetic patients: A poorly recognized aspect in a poorly controlled disease. Review of Diabetic Studies, 3(1), 11–16. doi: 10.1900/RDS.2006.3.11. Retrieved from http://www.ncbi.nlm.nih.gov/pmc/articles/PMC1783576/

86
Appendix A
Power Analysis

87
Appendix B
Operationalization of Variables of Study
Operationalization of Variables of Study
Variable
Name
Description
Type
Coding
NHANES
Variable
Diabetes Prevalence
Doctor told you you had diabetes
Dichotomous 0, no 1, yes
DIQ010
Acculturation Status
Language spoken at home Categorical 1, Only Spanish 2, More Spanish than English 3, English and Spanish Equally 4, More English than Spanish 5, Only English
Age
Age in years Continuous 01/01/50 RIDAGEYR
Gender Gender Dichotomous 1, Male 2, Female
RIAGENDR
Income 1 Annual Household Income
Categorical 1-15 INCOME1
Income 2 Annual Household Income Dichotomous 1, Under $20,000 2, Over $20,000
INCOME2
Health Insurance
Covered by Health Insurance
Dichotomous 1, yes 2, no
HIQ011
Physical Activity and Fitness
Days physically active at least 60 minutes in a typical week
Continuous 0-7 PAQ706
Alcohol Use Avg number of alcoholic drinks per day over the past 12 months
Continuous 0-24 ALQ130
Smoking and tobacco use
Smoked at least 100 cigarettes in life
Dichotomous 1, yes 2, no
SMQ020
Weight History Self-reported greatest weight, in pounds
Continous 85-585 WHD140
Consumer Behavior: Diet
Anyone in the family on a special diet?
Dichotomous 1, yes 2, no
CBD010
Consumer Behavior: Fruits
Fruits available at home Categorical 1, Always 2, Most of the Time 3, Sometimes 4, Rarely 5, Never
CBD020
Consumer Behavior: Dark Green Vegetables
Dark Green Vegetables available at home
Categorical 1, Always 2, Most of the Time 3, Sometimes 4, Rarely 5, Never
CBD030

88
Variable
Name
Description
Type
Coding
NHANES
Variable
Consumer Behavior: Fat Free/Low Fat Milk
Fat Free/Low Fat Milk available at home
Categorical 1, Always 2, Most of the Time 3, Sometimes 4, Rarely 5, Never
CBD050
Consumer Behavior: Soft Drinks
Soft Drinks available at home
Categorical 1, Always 2, Most of the Time 3, Sometimes 4, Rarely 5, Never
CBD060
Dietary Behavior: # of meals not at home
# of meals not at home, past 30 days
Continuous 0-21 DBD895
Dietary Behavior: # of meals from fast food or pizza
# of meals from fast food or pizza, past 30 days
Continuous 0-21 DBD900
Dietary Behavior: # of ready-to-eat foods
# of ready-to-eat foods, past 30 days
Continuous 0-150 DBD905
Dietary Behavior: # of frozen meals/pizza
# of frozen meals/pizza , past 30 days
Continuous 0-180 DBD910
______________________________________________________
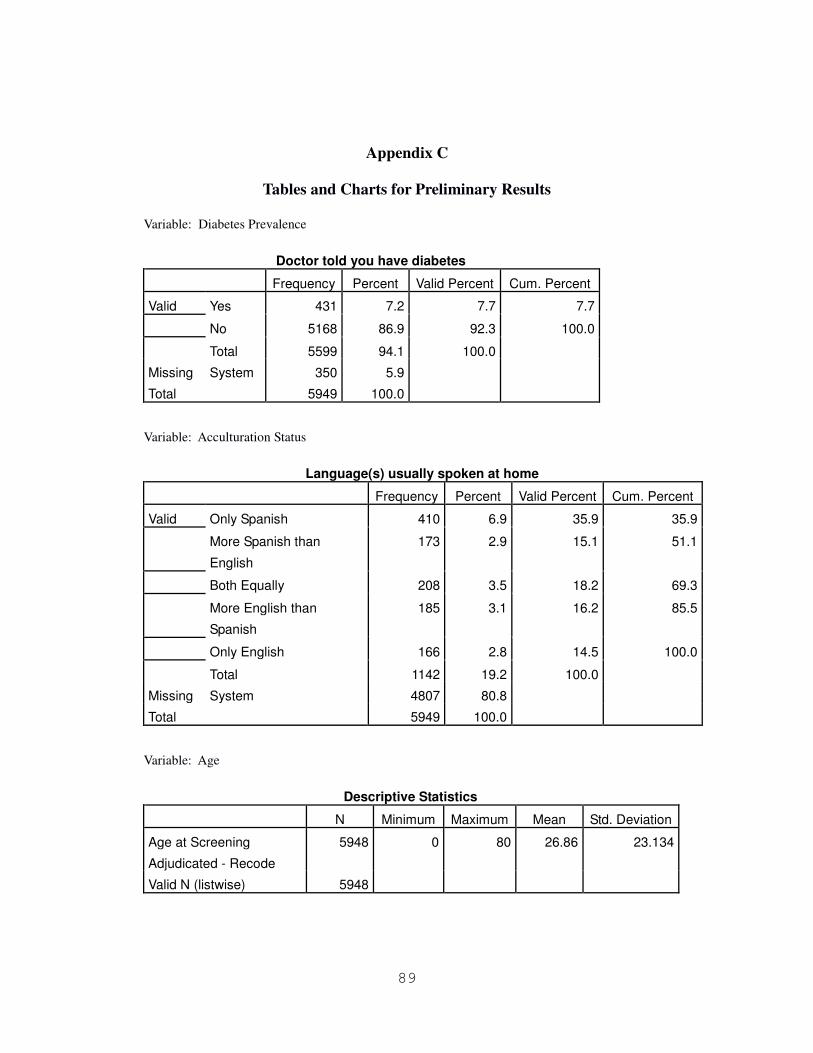
89
Appendix C
Tables and Charts for Preliminary Results
Variable: Diabetes Prevalence
Doctor told you have diabetes
Frequency Percent Valid Percent Cum. Percent
Valid Yes 431 7.2 7.7 7.7
No 5168 86.9 92.3 100.0
Total 5599 94.1 100.0
Missing System 350 5.9
Total 5949 100.0
Variable: Acculturation Status
Language(s) usually spoken at home
Frequency Percent Valid Percent Cum. Percent
Valid Only Spanish 410 6.9 35.9 35.9
More Spanish than
English
173 2.9 15.1 51.1
Both Equally 208 3.5 18.2 69.3
More English than
Spanish
185 3.1 16.2 85.5
Only English 166 2.8 14.5 100.0
Total 1142 19.2 100.0
Missing System 4807 80.8
Total 5949 100.0
Variable: Age
Descriptive Statistics
N Minimum Maximum Mean Std. Deviation
Age at Screening
Adjudicated - Recode
5948 0 80 26.86 23.134
Valid N (listwise) 5948

90
Variable: Gender
Gender
Frequency Percent Valid Percent Cum. Percent
Valid Male 2952 49.6 49.6 49.6
Female 2996 50.4 50.4 100.0
Total 5948 100.0 100.0
Missing System 1 .0
Total 5949 100.0
Variable: Household Income 1
Household Income 1
Frequency Percent Valid Percent Cum. Percent
Valid $0 to $4,999 152 2.6 3.0 3.0
$ 5,000 to $ 9,999 272 4.6 5.3 8.3
$10,000 to $14,999 433 7.3 8.5 16.8
$15,000 to $19,999 532 8.9 10.4 27.3
$20,000 to $24,999 568 9.5 11.2 38.4
$25,000 to $34,999 845 14.2 16.6 55.0
$35,000 to $44,999 595 10.0 11.7 66.7
$45,000 to $54,999 430 7.2 8.4 75.1
$55,000 to $64,999 258 4.3 5.1 80.2
$65,000 to $74,999 214 3.6 4.2 84.4
$75,000 to $99,999 380 6.4 7.5 91.9
$100,000 and Over 415 7.0 8.1 100.0
Total 5094 85.6 100.0
Missing System 855 14.4
Total 5949 100.0

91
Variable: Household Income 2
Household Income 2
Frequency Percent Valid Percent Cum. Percent
Valid Under $20,000 a year 1657 27.9 30.2 30.2
Over $20,000 a year 3828 64.3 69.8 100.0
Total 5485 92.2 100.0
Missing System 464 7.8
Total 5949 100.0
Variable: Health Insurance
Covered by health insurance
Frequency Percent Valid Percent Cum. Percent
Valid yes 4251 71.5 71.6 71.6
no 1687 28.4 28.4 100.0
Total 5938 99.8 100.0
Missing System 11 .2
Total 5949 100.0
Variable: Physical Activity and Fitness
Descriptive Statistics
N Minimum Maximum Mean Std. Deviation
Days physically active at
least 60 min
1283 0 7 6.17 1.825
Valid N (listwise) 1283
Variable: Alcohol Use
Descriptive Statistics
N Minimum Maximum Mean Std. Deviation
Avg # alcoholic
drinks/day -past 12 mos
2014 1 64 2.87 2.946
Valid N (listwise) 2014

92
Variable: Smoking and Tobacco Use
Smoked at least 100 cigarettes in life
Frequency Percent Valid Percent Cum. Percent
Valid Yes 1536 25.8 44.6 44.6
No 1910 32.1 55.4 100.0
Total 3446 57.9 100.0
Missing System 2503 42.1
Total 5949 100.0
Variable: Highest Self Reported Weight
Descriptive Statistics
N Minimum Maximum Mean Std. Deviation
Self-reported greatest
weight (pounds)
3535 85 585 192.39 52.937
Valid N (listwise) 3535
Variable: Consumer Behavior - Diet
Anyone in the family on a special diet
Frequency Percent Valid Percent Cum. Percent
Valid Yes 468 7.9 13.7 13.7
No 2956 49.7 86.3 100.0
Total 3424 57.6 100.0
Missing System 2525 42.4
Total 5949 100.0

93
Variable: Consumer Behavior - Fruits
Fruits available at home
Frequency Percent Valid Percent Cum. Percent
Valid Always 2428 40.8 70.1 70.1
Most of the time 605 10.2 17.5 87.6
Sometimes 347 5.8 10.0 97.6
Rarely 75 1.3 2.2 99.8
Never 7 .1 .2 100.0
Total 3462 58.2 100.0
Missing System 2487 41.8
Total 5949 100.0
Variable: Consumer Behavior - Dark Green Vegetables
Dark green vegetables available at home
Frequency Percent Valid Percent Cumulative
Percent
Valid Always 2014 33.9 58.2 58.2
Most of the time 638 10.7 18.4 76.6
Sometimes 625 10.5 18.1 94.7
Rarely 126 2.1 3.6 98.3
Never 58 1.0 1.7 100.0
Total 3461 58.2 100.0
Missing System 2488 41.8
Total 5949 100.0

94
Variable: Consumer Behavior - Fat free/low fat milk
Fat-free/low fat milk available at home
Frequency Percent Valid Percent Cumulative
Percent
Valid Always 760 12.8 22.0 22.0
Most of the time 94 1.6 2.7 24.7
Sometimes 164 2.8 4.7 29.4
Rarely 186 3.1 5.4 34.8
Never 2256 37.9 65.2 100.0
Total 3460 58.2 100.0
Missing System 2489 41.8
Total 5949 100
Variable: Consumer Behavior - Salty Snacks
Salty snacks available at home
Frequency Percent Valid Percent Cumulative
Percent
Valid Always 1166 19.6 33.7 33.7
Most of the time 499 8.4 14.4 48.1
Sometimes 1013 17.0 29.3 77.4
Rarely 581 9.8 16.8 94.2
Never 202 3.4 5.8 100.0
Total 3461 58.2 100.0
Missing System 2488 41.8
Total 5949 100.0

95
Variable: Consumer Behavior - Soft Drinks
Soft drinks available at home
Frequency Percent Valid Percent Cumulative
Percent
Valid Always 1132 19.0 32.7 32.7
Most of the time 469 7.9 13.6 46.3
Sometimes 886 14.9 25.6 71.9
Rarely 495 8.3 14.3 86.2
Never 476 8.0 13.8 100.0
Total 3458 58.1 100.0
Missing System 2491 41.9
Total 5949 100.0
Variable: Dietary Behavior: Meals not prepared at home
Descriptive Statistics
N Minimum Maximum Mean Std. Deviation
# of meals not home
prepared
5565 0 21 2.45 3.357
Valid N (listwise) 5565
Variable: Dietary Behavior - Meals from fast food or pizza
Descriptive Statistics
N Minimum Maximum Mean Std. Deviation
# of meals from fast food or
pizza place
3856 0 21 1.89 2.455
Valid N (listwise) 3856
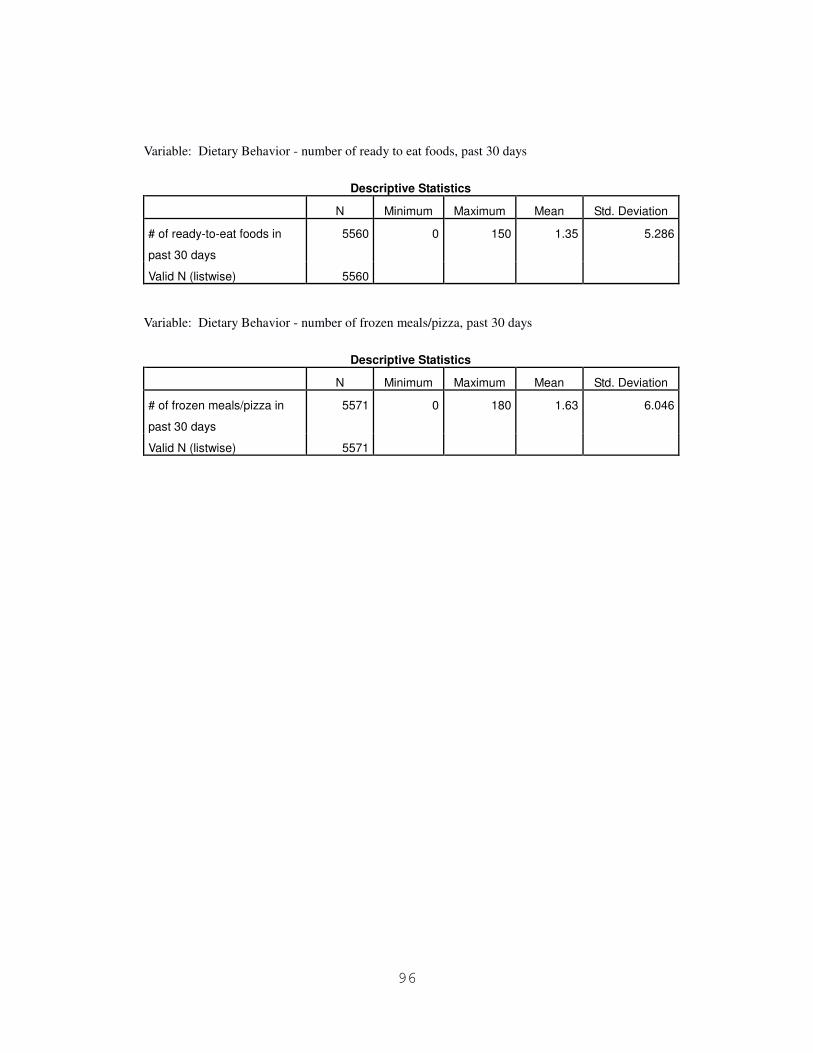
96
Variable: Dietary Behavior - number of ready to eat foods, past 30 days
Descriptive Statistics
N Minimum Maximum Mean Std. Deviation
# of ready-to-eat foods in
past 30 days
5560 0 150 1.35 5.286
Valid N (listwise) 5560
Variable: Dietary Behavior - number of frozen meals/pizza, past 30 days
Descriptive Statistics
N Minimum Maximum Mean Std. Deviation
# of frozen meals/pizza in
past 30 days
5571 0 180 1.63 6.046
Valid N (listwise) 5571