relations between trophic state indicators and plant biomass in
TRANSCRIPT
Hydrobiologia 470: 219–234, 2002.© 2002 Kluwer Academic Publishers. Printed in the Netherlands.
219
Relations between trophic state indicators and plant biomass inFlorida lakes
Roger W. Bachmann, Christine A. Horsburgh, Mark V. Hoyer, Laura K. Mataraza &Daniel E. Canfield, Jr.Department of Fisheries and Aquatic Sciences, University of Florida, 7922 NW 71st Street Gainesville,FL, 32653 U.S.A.Tel: 352-392-9617. Fax: 352-392-3672. E-mail: [email protected]
Received 27 July 2001; in revsied form 16 January 2002; accepted 26 January 2002
Key words: macrophytes, periphyton, plant biomass, alternative stable states
Abstract
We collected quantitative data on macrophyte abundance and water quality in 319 mostly shallow, polymictic,Florida lakes to look for relationships between trophic state indicators and the biomasses of plankton algae,periphyton, and macrophytes. The lakes ranged from oligotrophic to hypereutrophic with total algal chlorophyllsranging from 1 to 241 mg m−3. There were strong positive correlations between planktonic chlorophylls andtotal phosphorus and total nitrogen, but there were weak inverse relationships between the densities of periphytonand the trophic state indicators total phosphorus, total nitrogen and algal chlorophyll and a positive relationshipwith Secchi depth. There was no predictable relationship between the abundance of emergent, floating-leaved,and submersed aquatic vegetation and the trophic state indicators. It was only at the highest levels of nutrientconcentrations that submersed macrophytes were predictably absent and the lakes were algal dominated. Belowthese levels, macrophyte abundance could be high or low. The phosphorus–chlorophyll and phosphorus–Secchidepth relationships were not influenced by the amounts of aquatic vegetation present indicating that the role ofmacrophytes in clearing lakes may be primarily to reduce nutrient concentrations for a given level of loading.Rather than nutrient concentrations controlling macrophyte abundance, it seems that macrophytes acted to modifynutrient concentrations.
Introduction
We have assembled a database on 319 Florida lakescontaining information on quantitative estimates ofmacrophyte biomass, plankton chlorophyll, morpho-metry, and water quality. Since most of these lakes areshallow, these data provide us with an opportunity toexamine current theories about shallow lakes that havebeen summarized in several new books on the subject(Moss et al., 1996; Scheffer, 1998; Jeppesen et al.,1998). For example, the theory of alternative stablestates as outlined by Scheffer (1998), states in partthat shallow lakes can shift from a clear, macrophyte-dominated state to a turbid, algal-dominated state withno change in nutrient loading. Such shifts have beenobserved in individual Florida lakes such as Lake
Baldwin, Florida, where grass carp (Ctenopharyn-godon idella Val.) were used to reduce submersedvegetation from 69% to 0% between 1978 and 1980(Shireman et al., 1985). At the same time, the concen-tration of total phosphorus increased 3 times, planktonchlorophyll increased 5 times, and the Secchi depthdecreased from 5 m to 1.5 m. We evaluated whetherprocesses that lead to such changes in an individuallake would be apparent as patterns in the relation-ships between nutrients, plankton, periphyton, mac-rophytes, and morphometry among lakes of varyingtrophic states. We know of no similar study coveringsuch a large number of lakes that looks at the factorsthat might influence the biomass of plants in shallow,polymictic, subtropical lakes. The objectives of thisanalysis are to summarize basic standing crop inform-
220
ation on macrophytes in several Florida lakes, to lookfor relationships among trophic state indicators andthe biomass of plants in Florida lakes, and to examinesome of the assumptions used to develop the theory ofalternative stable states.
Methods
Macrophyte sampling
A total of 319 lakes were sampled between 1983 and1999 with 230 lakes sampled once, 71 lakes twice, 13lakes three times, 2 four times, and 3 were sampledfive times. Most of these lakes are regularly sampledfor water quality as a part of a citizens volunteer mon-itoring program, Florida LAKEWATCH, however 60lakes were included in a research study (Canfield &Hoyer, 1992) where lakes were selected to representa broad range of trophic states from oligotrophic toheteroeutrophic. Each separate macrophyte samplingdate was treated individually yielding a total of 434lake-years of observations. Aquatic macrophytes weresampled once during the growing season followingthe protocol established by Canfield et al. (1990).Transects were run across the lake with a RaytheonDE-719 recording fathometer, and the percent volumeinhabited (PVI) and percent area covered (PAC) weredetermined from the fathometer charts (Maceina &Shireman, 1980). We also calculated a potential PACin each lake by noting the maximum depth that sub-mersed macrophytes were found at and determiningthe per cent of the lake area that was at that depthor less. The submersed, emergent, and floating-leavedplant zones were determined by the criteria of Wetzel(1983), and the width of the combined floating-leavedand emergent plant zones was measured along 5–30transects. The average width was multiplied timesthe shoreline length to estimate the area covered byemergent and floating-leaved plants, and this was ex-pressed as a per cent of the lake surface area (PACFE).On each transect, a single 0.25 m2sample of veget-ation (when present) was taken in each plant zoneand each species present was recorded. The sampledvegetation was placed into nylon mesh bags,spun toremove excess water, and weighed to the nearest 0.1kg. The average aboveground wet weights of emer-gent, floating-leaved, and submersed plants (kg m−2)were determined for each lake. No attempt was madeto rinse epiphytic algae from the plants, so all biomassestimates can be considered to be an assemblage ofboth macrophytes and epiphytes.
Periphyton sampling
In 60 of the lakes, periphyton biomass as mg chloro-phyll kg−1 wet weight of host plant was estimated onthe most common plants sampled along ten transects.Approximately 100 g wet weight of each macrophytesampled was cut from 0.1 to 0.5 m below the surfaceof the water and placed into 500 ml of tap water ina plastic bottle and placed on ice. Periphyton was re-moved by shaking each bottle by hand within 7 h ofsampling. Each sample was shaken manually for 30 sand the supernatant poured through a 1.0-mm screento remove large particles. The procedure was repeatedthree times for each plant sample, adding 500 ml of tapwater for each shaking. The supernatant water (1500ml) was analyzed for chlorophyll spectrophotometric-ally following pigment extraction with 90% ethanol(Sartory & Grobbelaar, 1984). The total amount ofchlorophyll was then divided by the wet weight of themacrophyte sample.
Plankton chlorophyll and water quality sampling
Water quality measurements for 60 of the lakes havebeen published previously (Bachmann et al., 1996).For the other lakes, we used averages of monthlysamples collected by citizen volunteers as a part ofthe Florida LAKEWATCH program. In the field vo-lunteers collected surface (0.5 m) water samples fortotal phosphorus (TP), total nitrogen (TN), and totalchlorophyll (CHL) analyses and measured Secchi disktransparency (SD) from 1 to 6 evenly distributed loca-tions on each lake. Water for the TP and TN analyseswas collected in acid-washed, triple-rinsed, 250-mlNalgene bottles while water for CHL analyses wasplaced into 4-l, tap water rinsed plastic bottles. Onshore measured volumes of lake water from the 4-l bottles were filtered through Gelman Type A–Eglass fiber filters. The filters and water samples werethen frozen and sent to the water quality laborat-ory at the Department of Fisheries and Aquatic Sci-ences. TP concentrations (µg·l−1) were determinedby the procedures of Murphy & Riley (1962) with apersulfate digestion (Menzel & Corwin, 1965). TNconcentrations (µg·l−1) were determined by oxidiz-ing water samples with persulfate and determiningnitrate-nitrogen with second derivative spectroscopy(Bachmann & Canfield, 1996). CHL concentrations(µg·l−1) were determined spectrophotometrically fol-lowing pigment extraction with 90% ethanol (Sartory& Grobbelaar, 1984). Most of these data have beenreported in Florida LAKEWATCH (1999). In addition
221
our laboratory has collected color data (Pt-Co units)on 140 of the lakes during related studies. We usedpublished values for lake mean depth and lake surfacearea (Bachmann et al., 1996; LAKEWATCH, 1999).
Statistical procedures
To account for heterogeneity of variance, the variousmeasures of plant abundance, TP, TN, CHL, Secchidepth, lake area and mean depth were transformed totheir base-10 logarithms prior to most analyses. Priorto taking logarithms 1 was added to zero values ofPAC and PVI and 0.01 was added to zero values formacrophyte densities. JMP� , a statistical softwarepackage of the SAS Institute (1994), was used to com-pute all statistics. Stepwise multiple regression wasused to look for possible relationships between plantabundance and TP, TN, CHL, Secchi depth, lake area,and lake mean depth. We also used stepwise multipleregression to see how various measures of plant abund-ance affected relationships between both chlorophylland Secchi disk depths and plant nutrients. A prob-ability level of 5% was used to determine statisticalsignificance.
Comparisons of plant communities
In some cases, we used appropriate conversion factorsto convert the biomasses of plankton, periphyton andsubmersed macrophytes into units of dry weight. ThePAC was divided by 100 and multiplied by the av-erage wet weight of submersed macrophytes to getan average biomass density for the lake. Dry weightsof macrophytes were determined by multiplying wetweights by 0.08, a factor that represents the averageratio of dry to wet weight of submersed plants in Flor-ida lakes (Canfield & Hoyer, 1992). Plankton and algalchlorophylls were converted to dry weights of algae bymultiplying chlorophyll values by 70, a factor whichhas been used in other studies (Scheffer, 1998). Plank-ton concentrations were multiplied by the lake meandepth to get standing crops on an areal basis.
Water column phosphorus
To determine the concentration of phosphorus con-tained in the submersed macrophyte community, wemultiplied the average dry weights per square metertimes 1.41 mg TP g−1dry weight, a number that rep-resents the mean phosphorus (mg) content of driedplant material measured in 750 samples from 60 Flor-ida lakes (University of Florida, unpublished data).
This areal concentration was divided by the meandepth to get an average concentration of macrophytephosphorus per unit volume. To find the water column,phosphorus concentration as defined by Canfield et al.(1983), the macrophyte phosphorus concentration wasadded to the total phosphorus concentration measuredin water samples.
Comparisons between lakes
We compared the trophic indicators of lakes with sub-mersed plants present to those where submersed plantswere absent (e.g. the measured biomass was zero)and also made comparisons between macrophyte-dominated and algal-dominated lakes. Since we couldfind no generally accepted operational definition forthese lake types, we devised our own. Macrophyte-dominated lakes were considered as those where theratio of the dry weight of submersed macrophytes tothe dry weight of plankton algae was 100 or greater.Algal-dominated lakes were those where the ratio ofsubmersed macrophytes to plankton algae was 1 orless, and the remaining lakes were placed into an in-termediate group. We also tried defining macrophyte-dominated lakes as those with a PVI >80% and algal-dominated lakes as those with a PVI <20% and foundthat either definition gave practically the same results.We used one-way ANOVA to determine if there weresignificant differences among the means of the trophicstate indicators for the lake groups. Differences amongtrophic indicators for macrophyte-dominated, inter-mediate, and algal-dominated lakes were examinedby performing a Tukey–Kramer HSD test at the 0.05level of significance. To compare the groups visu-ally with respect to the four trophic state indicators,we made frequency distributions for logarithms of TP,TN, CHL, and Secchi disk depths by forming groupsbased on 0.25 of a logarithmic unit. For example inthe range of 10–100 mg m−3 TP the groupings in theuntransformed units would be 10–17.9, 17.91–31.8,31.81–53.7, and 53.71–100 mg m−3.
Results
Characteristics of study lakes
Average values for several physical and chemical vari-ables measured in our study lakes are presented inTable 1. The water quality variables include repeatmeasurements made in different years for some of the
222
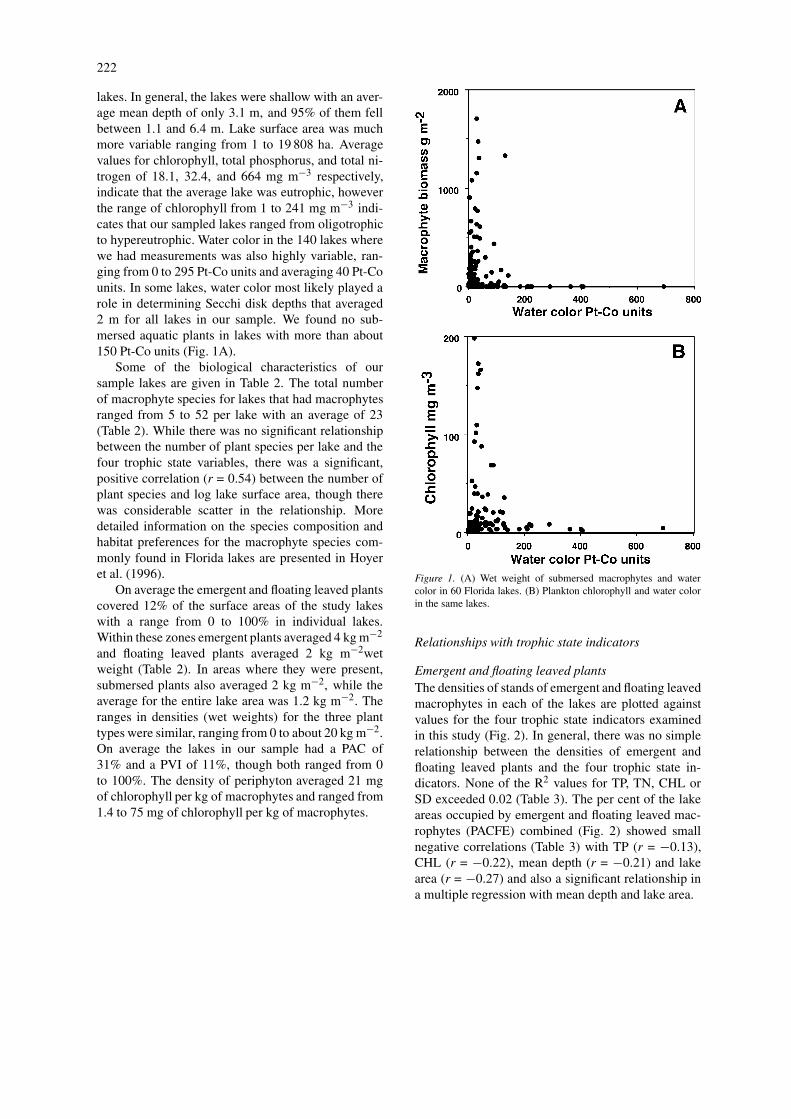
lakes. In general, the lakes were shallow with an aver-age mean depth of only 3.1 m, and 95% of them fellbetween 1.1 and 6.4 m. Lake surface area was muchmore variable ranging from 1 to 19 808 ha. Averagevalues for chlorophyll, total phosphorus, and total ni-trogen of 18.1, 32.4, and 664 mg m−3 respectively,indicate that the average lake was eutrophic, howeverthe range of chlorophyll from 1 to 241 mg m−3 indi-cates that our sampled lakes ranged from oligotrophicto hypereutrophic. Water color in the 140 lakes wherewe had measurements was also highly variable, ran-ging from 0 to 295 Pt-Co units and averaging 40 Pt-Counits. In some lakes, water color most likely played arole in determining Secchi disk depths that averaged2 m for all lakes in our sample. We found no sub-mersed aquatic plants in lakes with more than about150 Pt-Co units (Fig. 1A).
Some of the biological characteristics of oursample lakes are given in Table 2. The total numberof macrophyte species for lakes that had macrophytesranged from 5 to 52 per lake with an average of 23(Table 2). While there was no significant relationshipbetween the number of plant species per lake and thefour trophic state variables, there was a significant,positive correlation (r = 0.54) between the number ofplant species and log lake surface area, though therewas considerable scatter in the relationship. Moredetailed information on the species composition andhabitat preferences for the macrophyte species com-monly found in Florida lakes are presented in Hoyeret al. (1996).
On average the emergent and floating leaved plantscovered 12% of the surface areas of the study lakeswith a range from 0 to 100% in individual lakes.Within these zones emergent plants averaged 4 kg m−2
and floating leaved plants averaged 2 kg m−2wetweight (Table 2). In areas where they were present,submersed plants also averaged 2 kg m−2, while theaverage for the entire lake area was 1.2 kg m−2. Theranges in densities (wet weights) for the three planttypes were similar, ranging from 0 to about 20 kg m−2.On average the lakes in our sample had a PAC of31% and a PVI of 11%, though both ranged from 0to 100%. The density of periphyton averaged 21 mgof chlorophyll per kg of macrophytes and ranged from1.4 to 75 mg of chlorophyll per kg of macrophytes.
Figure 1. (A) Wet weight of submersed macrophytes and watercolor in 60 Florida lakes. (B) Plankton chlorophyll and water colorin the same lakes.
Relationships with trophic state indicators
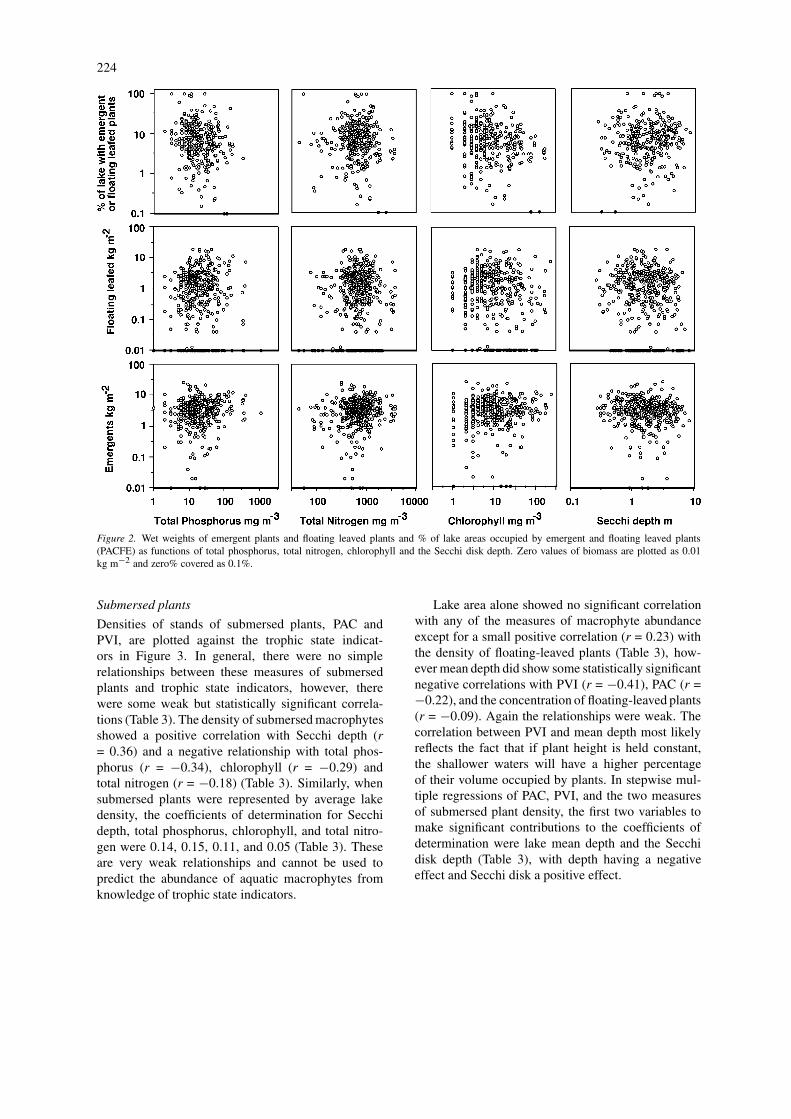
Emergent and floating leaved plantsThe densities of stands of emergent and floating leavedmacrophytes in each of the lakes are plotted againstvalues for the four trophic state indicators examinedin this study (Fig. 2). In general, there was no simplerelationship between the densities of emergent andfloating leaved plants and the four trophic state in-dicators. None of the R2 values for TP, TN, CHL orSD exceeded 0.02 (Table 3). The per cent of the lakeareas occupied by emergent and floating leaved mac-rophytes (PACFE) combined (Fig. 2) showed smallnegative correlations (Table 3) with TP (r = −0.13),CHL (r = −0.22), mean depth (r = −0.21) and lakearea (r = −0.27) and also a significant relationship ina multiple regression with mean depth and lake area.

223
Table 1. Limnological characteristics of Florida lakes sampled in this study
Variable N Median Mean Geometric Standard Minimum Maximum
mean deviation
Surface area (ha) 275 70 473 75 1736 1 19808
Mean depth (m) 318 2.7 3.1 2.7 1.4 0.4 9.9
Secchi depth (m) 417 1.7 2.0 1.6 1.4 0.3 8.1
Color (Pt-Co units) 140 21.1 40 20 54 0 295
Total phosphorus (mg m−3) 433 16 32 18.4 68 1 1043
Total nitrogen (mg m−3) 433 664 806 645 598 43 3789
Chlorophyll (mg m−3) 434 8 18 8.6 29 1 241
Table 2. Measures of macrophyte abundance in Florida lakes sampled in this study. The densities of the three macrophytecommunities are based on wet weights
Variable N Median Mean Geometric Standard Minimum Maximum
mean deviation
Number of species 362 23 23 21 9 5 52
Density emergent (kg m−2) 434 3.3 4 2.6 3.4 0 27
Density floating leaved (kg m−2) 434 1.1 2 0.6 2.9 0 19
Density submersed (kg m−2) 434 0.9 2 0.4 3.2 0 22
PACFE 325 7.2 11.6 6.3 17.4 0 159
PAC 434 22 31 15 29z 0 100
PVI 434 3.5 10.7 3.6 18.2 0 100
Periphyton mg Chl kg−1 plants 65 16.1 20.7 13.2 16.6 1.42 74.7
Average dry wt submersed plants 434 12.5 92.1 3.8 218 0 1731
(g m−2)
Dry wt plankton algae (g m−2) 434 1.5 3.7 1.8 5.7 0.1 51
Table 3. Coefficients of determination (R2) between various measures of plant abundance and sev-eral trophic state indicators and lake morphometric values for 434 lake-years. The last columnrepresents the R2 value for a multiple regression with both mean depth and Secchi depth asindependent variables
TP TN CHL Secchi Mean Area Depth &
depth Secchi
Emergent 0.01 0.02∗∗ 0.00 0.00 0.00 0.00 –
Floating leaved 0.00 0.01∗∗ 0.01 0.00 0.01∗ 0.05∗∗ –
Submersed density 0.12∗∗ 0.03∗∗ 0.09∗∗ 0.13∗∗ 0.00 0.00 0.18∗∗Average sub density 0.15∗∗ 0.05∗∗ 0.11∗∗ 0.14∗∗ 0.00 0.00 0.21∗∗PAC 0.05∗∗ 0.02∗∗ 0.05∗∗ 0.07∗∗ 0.05∗∗ 0.00 0.21∗∗PVI 0.01∗ 0.00 0.02∗∗ 0.01∗ 0.17∗∗ 0.00 0.25∗∗PACFE 0.02∗∗ 0.00 0.05∗∗ 0.00 0.05∗∗ 0.07∗∗ 0.09∗∗Algal chlorophyll 0.68∗∗ 0.50∗∗ – 0.58∗∗ 0.04∗∗ 0.01 –
∗∗Significant at the 0.01 level. ∗Significant at the 0.05 level.
224
Figure 2. Wet weights of emergent plants and floating leaved plants and % of lake areas occupied by emergent and floating leaved plants(PACFE) as functions of total phosphorus, total nitrogen, chlorophyll and the Secchi disk depth. Zero values of biomass are plotted as 0.01kg m−2 and zero% covered as 0.1%.
Submersed plants
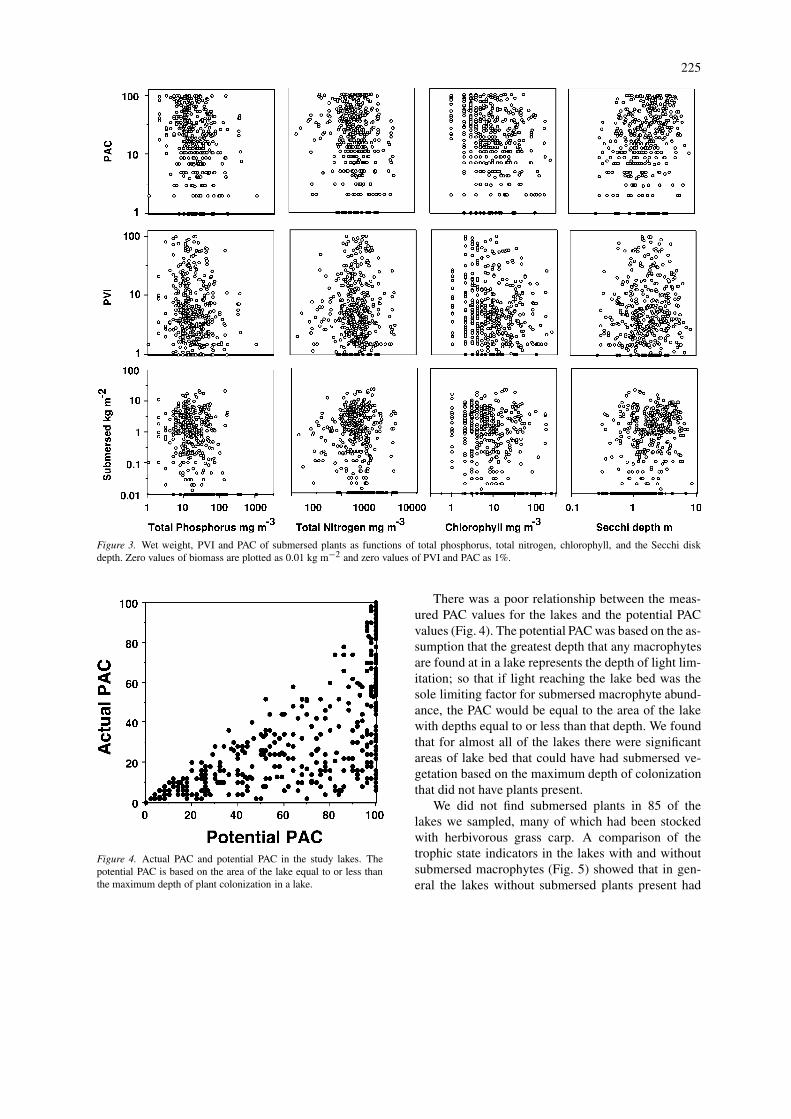
Densities of stands of submersed plants, PAC andPVI, are plotted against the trophic state indicat-ors in Figure 3. In general, there were no simplerelationships between these measures of submersedplants and trophic state indicators, however, therewere some weak but statistically significant correla-tions (Table 3). The density of submersed macrophytesshowed a positive correlation with Secchi depth (r= 0.36) and a negative relationship with total phos-phorus (r = −0.34), chlorophyll (r = −0.29) andtotal nitrogen (r = −0.18) (Table 3). Similarly, whensubmersed plants were represented by average lakedensity, the coefficients of determination for Secchidepth, total phosphorus, chlorophyll, and total nitro-gen were 0.14, 0.15, 0.11, and 0.05 (Table 3). Theseare very weak relationships and cannot be used topredict the abundance of aquatic macrophytes fromknowledge of trophic state indicators.
Lake area alone showed no significant correlationwith any of the measures of macrophyte abundanceexcept for a small positive correlation (r = 0.23) withthe density of floating-leaved plants (Table 3), how-ever mean depth did show some statistically significantnegative correlations with PVI (r = −0.41), PAC (r =−0.22), and the concentration of floating-leaved plants(r = −0.09). Again the relationships were weak. Thecorrelation between PVI and mean depth most likelyreflects the fact that if plant height is held constant,the shallower waters will have a higher percentageof their volume occupied by plants. In stepwise mul-tiple regressions of PAC, PVI, and the two measuresof submersed plant density, the first two variables tomake significant contributions to the coefficients ofdetermination were lake mean depth and the Secchidisk depth (Table 3), with depth having a negativeeffect and Secchi disk a positive effect.
225
Figure 3. Wet weight, PVI and PAC of submersed plants as functions of total phosphorus, total nitrogen, chlorophyll, and the Secchi diskdepth. Zero values of biomass are plotted as 0.01 kg m−2 and zero values of PVI and PAC as 1%.
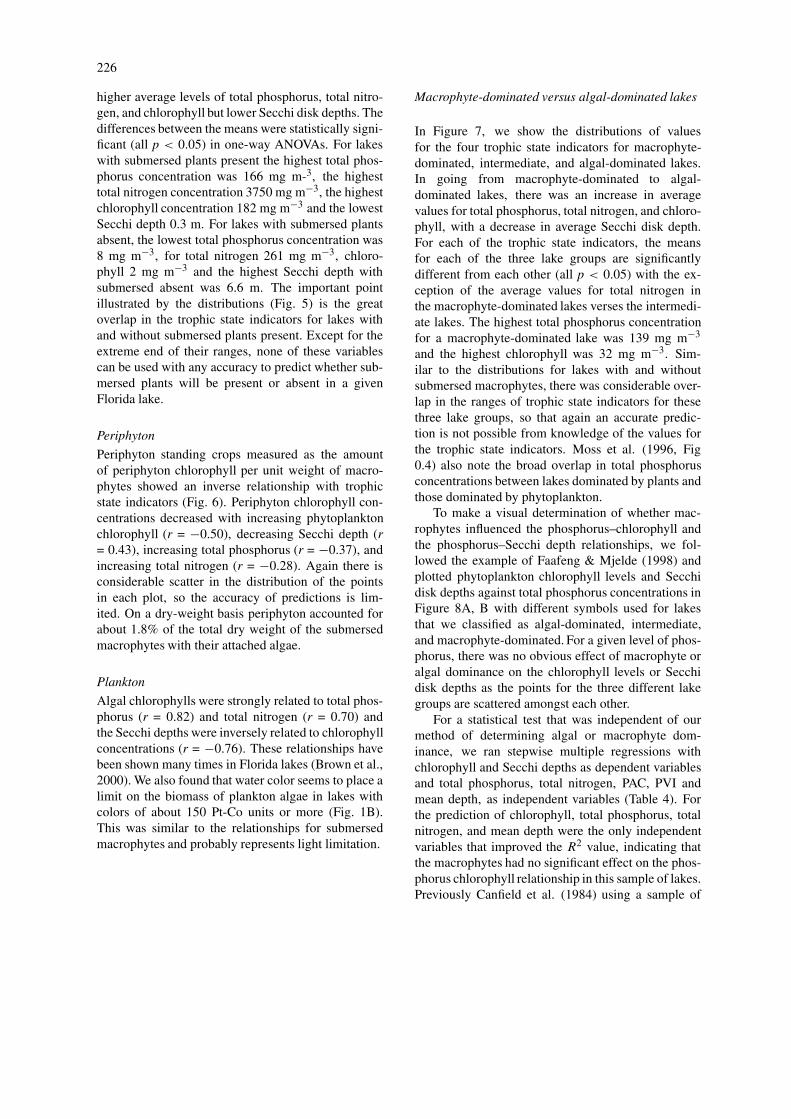
Figure 4. Actual PAC and potential PAC in the study lakes. Thepotential PAC is based on the area of the lake equal to or less thanthe maximum depth of plant colonization in a lake.
There was a poor relationship between the meas-ured PAC values for the lakes and the potential PACvalues (Fig. 4). The potential PAC was based on the as-sumption that the greatest depth that any macrophytesare found at in a lake represents the depth of light lim-itation; so that if light reaching the lake bed was thesole limiting factor for submersed macrophyte abund-ance, the PAC would be equal to the area of the lakewith depths equal to or less than that depth. We foundthat for almost all of the lakes there were significantareas of lake bed that could have had submersed ve-getation based on the maximum depth of colonizationthat did not have plants present.
We did not find submersed plants in 85 of thelakes we sampled, many of which had been stockedwith herbivorous grass carp. A comparison of thetrophic state indicators in the lakes with and withoutsubmersed macrophytes (Fig. 5) showed that in gen-eral the lakes without submersed plants present had
226
higher average levels of total phosphorus, total nitro-gen, and chlorophyll but lower Secchi disk depths. Thedifferences between the means were statistically signi-ficant (all p < 0.05) in one-way ANOVAs. For lakeswith submersed plants present the highest total phos-phorus concentration was 166 mg m-3, the highesttotal nitrogen concentration 3750 mg m−3, the highestchlorophyll concentration 182 mg m−3 and the lowestSecchi depth 0.3 m. For lakes with submersed plantsabsent, the lowest total phosphorus concentration was8 mg m−3, for total nitrogen 261 mg m−3, chloro-phyll 2 mg m−3 and the highest Secchi depth withsubmersed absent was 6.6 m. The important pointillustrated by the distributions (Fig. 5) is the greatoverlap in the trophic state indicators for lakes withand without submersed plants present. Except for theextreme end of their ranges, none of these variablescan be used with any accuracy to predict whether sub-mersed plants will be present or absent in a givenFlorida lake.
Periphyton
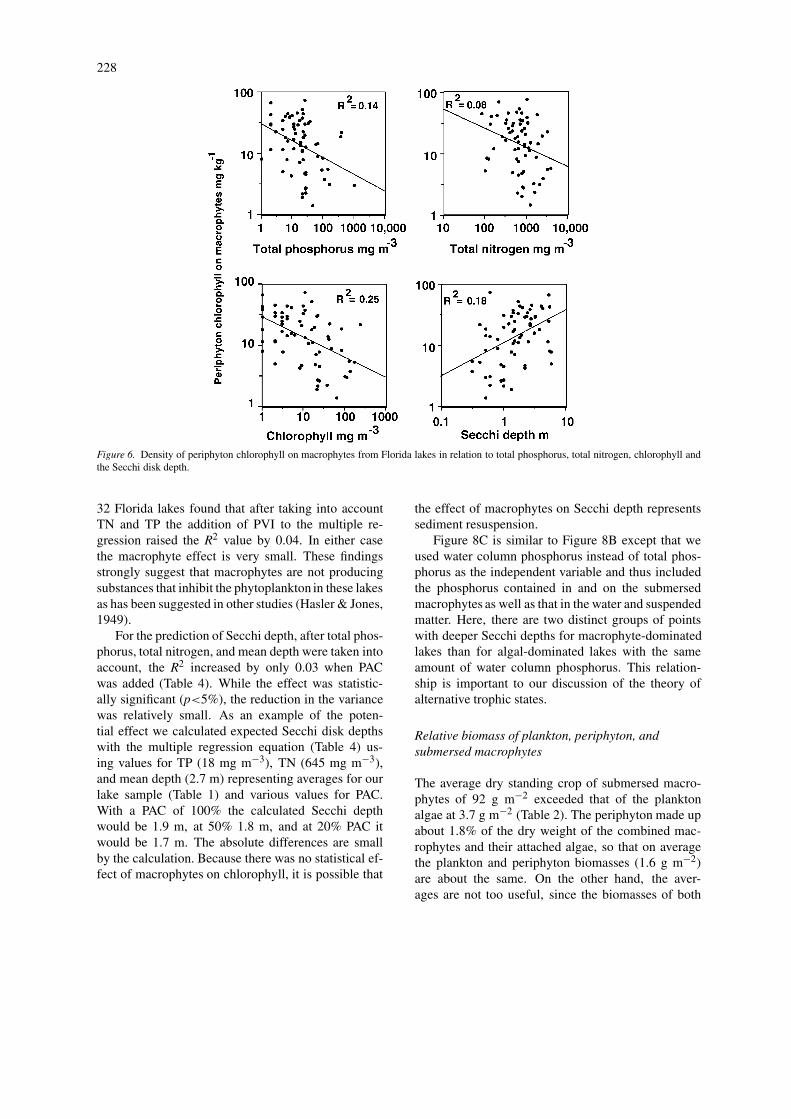
Periphyton standing crops measured as the amountof periphyton chlorophyll per unit weight of macro-phytes showed an inverse relationship with trophicstate indicators (Fig. 6). Periphyton chlorophyll con-centrations decreased with increasing phytoplanktonchlorophyll (r = −0.50), decreasing Secchi depth (r= 0.43), increasing total phosphorus (r = −0.37), andincreasing total nitrogen (r = −0.28). Again there isconsiderable scatter in the distribution of the pointsin each plot, so the accuracy of predictions is lim-ited. On a dry-weight basis periphyton accounted forabout 1.8% of the total dry weight of the submersedmacrophytes with their attached algae.
Plankton
Algal chlorophylls were strongly related to total phos-phorus (r = 0.82) and total nitrogen (r = 0.70) andthe Secchi depths were inversely related to chlorophyllconcentrations (r = −0.76). These relationships havebeen shown many times in Florida lakes (Brown et al.,2000). We also found that water color seems to place alimit on the biomass of plankton algae in lakes withcolors of about 150 Pt-Co units or more (Fig. 1B).This was similar to the relationships for submersedmacrophytes and probably represents light limitation.
Macrophyte-dominated versus algal-dominated lakes
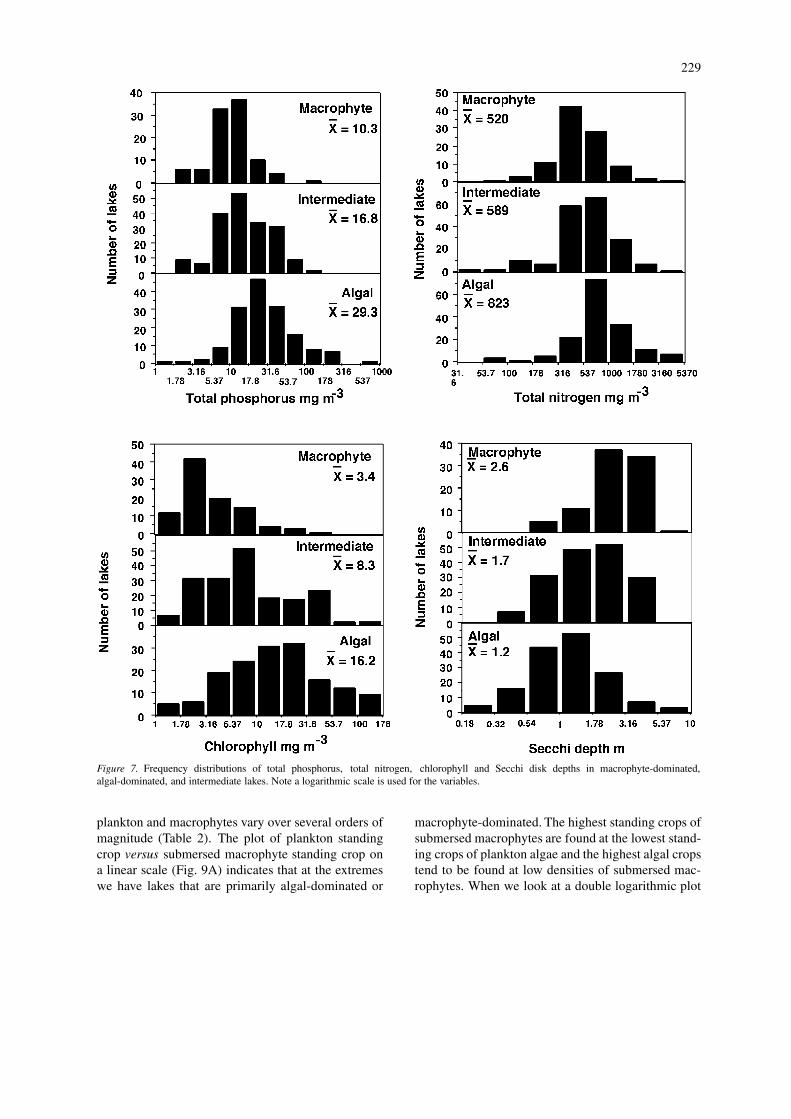
In Figure 7, we show the distributions of valuesfor the four trophic state indicators for macrophyte-dominated, intermediate, and algal-dominated lakes.In going from macrophyte-dominated to algal-dominated lakes, there was an increase in averagevalues for total phosphorus, total nitrogen, and chloro-phyll, with a decrease in average Secchi disk depth.For each of the trophic state indicators, the meansfor each of the three lake groups are significantlydifferent from each other (all p < 0.05) with the ex-ception of the average values for total nitrogen inthe macrophyte-dominated lakes verses the intermedi-ate lakes. The highest total phosphorus concentrationfor a macrophyte-dominated lake was 139 mg m−3
and the highest chlorophyll was 32 mg m−3. Sim-ilar to the distributions for lakes with and withoutsubmersed macrophytes, there was considerable over-lap in the ranges of trophic state indicators for thesethree lake groups, so that again an accurate predic-tion is not possible from knowledge of the values forthe trophic state indicators. Moss et al. (1996, Fig0.4) also note the broad overlap in total phosphorusconcentrations between lakes dominated by plants andthose dominated by phytoplankton.
To make a visual determination of whether mac-rophytes influenced the phosphorus–chlorophyll andthe phosphorus–Secchi depth relationships, we fol-lowed the example of Faafeng & Mjelde (1998) andplotted phytoplankton chlorophyll levels and Secchidisk depths against total phosphorus concentrations inFigure 8A, B with different symbols used for lakesthat we classified as algal-dominated, intermediate,and macrophyte-dominated. For a given level of phos-phorus, there was no obvious effect of macrophyte oralgal dominance on the chlorophyll levels or Secchidisk depths as the points for the three different lakegroups are scattered amongst each other.
For a statistical test that was independent of ourmethod of determining algal or macrophyte dom-inance, we ran stepwise multiple regressions withchlorophyll and Secchi depths as dependent variablesand total phosphorus, total nitrogen, PAC, PVI andmean depth, as independent variables (Table 4). Forthe prediction of chlorophyll, total phosphorus, totalnitrogen, and mean depth were the only independentvariables that improved the R2 value, indicating thatthe macrophytes had no significant effect on the phos-phorus chlorophyll relationship in this sample of lakes.Previously Canfield et al. (1984) using a sample of
227
Table 4. Results of stepwise multiple regressions for chlorophyll and Secchi depth versus logar-ithms of total phosphorus, total nitrogen, PAC, PVI, and lake mean depth using data from 432lake-years. Numbers in table represent coefficients of determination (R2). Only variables thatmade a statistically significant (p<5%) reduction in R2 are listed. Depths are in units of m andconcentrations in mg m−3
Dependent variable Independent variable(s) R2
Log chlorophyll TP 0.68
TP, TN 0.70
TP, TN, mean depth 0.72aLog CHL = −1.47 + 0.852 Log TP + 0.425 Log TN + 0.300 Log MD
Log Secchi depth TP 0.65
TP, mean depth 0.70
TP, mean depth, TN 0.73
TP, mean depth, TN, PAC 0.76
Log SD = 1.13 − 0.355 Log TP − 0.274 Log TN + 0.407 Log MD+ 0.098 Log PAC
aFor comparison (Canfield et al. 1984) previously found with 32 lakesLog CHL = −2.08 + 0.28 Log TP + 1.02 Log TN – 0.005 Log PVI.
Figure 5. Frequency distributions of total phosphorus, total nitrogen, chlorophyll and Secchi disk depths in lakes with and without submersedmacrophytes present. Note a logarithmic scale is used for the variables.
228
Figure 6. Density of periphyton chlorophyll on macrophytes from Florida lakes in relation to total phosphorus, total nitrogen, chlorophyll andthe Secchi disk depth.
32 Florida lakes found that after taking into accountTN and TP the addition of PVI to the multiple re-gression raised the R2 value by 0.04. In either casethe macrophyte effect is very small. These findingsstrongly suggest that macrophytes are not producingsubstances that inhibit the phytoplankton in these lakesas has been suggested in other studies (Hasler & Jones,1949).
For the prediction of Secchi depth, after total phos-phorus, total nitrogen, and mean depth were taken intoaccount, the R2 increased by only 0.03 when PACwas added (Table 4). While the effect was statistic-ally significant (p<5%), the reduction in the variancewas relatively small. As an example of the poten-tial effect we calculated expected Secchi disk depthswith the multiple regression equation (Table 4) us-ing values for TP (18 mg m−3), TN (645 mg m−3),and mean depth (2.7 m) representing averages for ourlake sample (Table 1) and various values for PAC.With a PAC of 100% the calculated Secchi depthwould be 1.9 m, at 50% 1.8 m, and at 20% PAC itwould be 1.7 m. The absolute differences are smallby the calculation. Because there was no statistical ef-fect of macrophytes on chlorophyll, it is possible that
the effect of macrophytes on Secchi depth representssediment resuspension.
Figure 8C is similar to Figure 8B except that weused water column phosphorus instead of total phos-phorus as the independent variable and thus includedthe phosphorus contained in and on the submersedmacrophytes as well as that in the water and suspendedmatter. Here, there are two distinct groups of pointswith deeper Secchi depths for macrophyte-dominatedlakes than for algal-dominated lakes with the sameamount of water column phosphorus. This relation-ship is important to our discussion of the theory ofalternative trophic states.
Relative biomass of plankton, periphyton, andsubmersed macrophytes
The average dry standing crop of submersed macro-phytes of 92 g m−2 exceeded that of the planktonalgae at 3.7 g m−2 (Table 2). The periphyton made upabout 1.8% of the dry weight of the combined mac-rophytes and their attached algae, so that on averagethe plankton and periphyton biomasses (1.6 g m−2)are about the same. On the other hand, the aver-ages are not too useful, since the biomasses of both
229
Figure 7. Frequency distributions of total phosphorus, total nitrogen, chlorophyll and Secchi disk depths in macrophyte-dominated,algal-dominated, and intermediate lakes. Note a logarithmic scale is used for the variables.
plankton and macrophytes vary over several orders ofmagnitude (Table 2). The plot of plankton standingcrop versus submersed macrophyte standing crop ona linear scale (Fig. 9A) indicates that at the extremeswe have lakes that are primarily algal-dominated or
macrophyte-dominated. The highest standing crops ofsubmersed macrophytes are found at the lowest stand-ing crops of plankton algae and the highest algal cropstend to be found at low densities of submersed mac-rophytes. When we look at a double logarithmic plot

230
Figure 8.
Figure 8. (A) Relationship between algal chlorophylls and totalphosphorus with different symbols for algal-dominated, macro-phyte-dominated and intermediate lakes. (B) Relationship betweenSecchi disk depth and total phosphorus with different symbolsfor algal-dominated, macrophyte-dominated and intermediate lakes.(C) Relationship between Secchi disk depth and water columnphosphorus with different symbols for algal-dominated and macro-phyte-dominated lakes. Fitted regression lines are shown for the twolake types. Water column phosphorus includes phosphorus in and onthe submersed aquatic plants plus total phosphorus measured in thewater and suspended matter.
Figure 9. (A) Dry weight of plankton algae vs dry weight of sub-mersed plants in Florida lakes on a linear scale. (B) Same data as Abut on a logarithmic scale. Zero values of submersed plant biomassare plotted as 0.01 g m−2.
of the same data (Fig. 9B), we can see that most ofthe lakes do not have extreme values for either vari-able and there is no relationship between the two. Thebiomass of submersed macrophytes exceeds that ofthe plankton algae in 278 out of our sample of 434lake-years.
231
Discussion
What is the relationship between macrophyteabundance and trophic state?
Unlike the phytoplankton that showed strong correl-ations with trophic state indicators such as TP andTN, there was no predictable relationship betweenthe abundance of macrophytes and trophic state inour sample of Florida lakes. This was true for themeasured densities of emergent, floating leaved, andsubmersed plants as well as for more general meas-ures of plant density and coverage like PVI and PAC.The same was true for the presence or absence of sub-mersed plants in these lakes. It was only at the highestlevels of nutrient concentrations that submersed mac-rophytes were predictably absent and the lakes werealgal-dominated. Below these nutrient levels the mac-rophyte abundance could be high or low. This isprobably due to the fact that many macrophytes canobtain their nutrients from the sediments rather thanfrom the water, so that a low nutrient content in theopen water does not necessarily mean that the sed-iments have not accumulated sufficient nutrients tosupport a significant biomass of macrophytes. Watercolor, however, was one environmental variable thathad a decided effect on plant biomass. All lakes withwater color values of about 150 CO-Pt units and aboveshowed a distinct depression in the biomass of plank-ton algae and macrophytes. This is most likely due toreductions in light penetration caused by the stainedwater.
We considered if the lack of good correlationsbetween various measures of aquatic plant abundanceand trophic state indicators might be due to samplingerrors in estimating plant biomass, since a previousexamination of our sampling methods showed aver-age coefficients of variation for the individual lake-average standing crops of emergent, floating leafed,and submersed macrophytes were 60%, 120%, and86%, respectively (Canfield et al., 1990). These errorsshould not result in the observed lack of correlation,however, since in our surveys the various measures ofaquatic plant abundance varied by from 2 to 3 ordersof magnitude (Figs 2 and 3), a range much larger thanthe errors of measurement in the individual lakes.
We also found no relationship between the numberof species of macrophytes in a lake and the valuesfor the trophic state indicators. The best indicator ofspecies numbers was lake area though the relation-ship was weak. Other studies have shown that species
numbers of birds (Hoyer & Canfield, 1990) and fish(Bachmann et al., 1996) also increase with lake size inFlorida lakes.
The periphyton on the other hand did show a weakpattern of decreasing abundance in terms of dens-ity as trophic state indictors like phosphorus, nitro-gen, phytoplankton chlorophyll, and especially Secchidepth indicated increasing trophic state. This may bea reflection of lowered light intensities in the wa-ter column with increasing trophic state. Since theperiphyton are attached to one spot and cannot move inthe water column like suspended phytoplankton, theyare going to be subject to decreases in available light.It has been theorized that the loss of macrophytes witheutrophication in some lakes is due to the shading ef-fects of increasing loads of periphytic algae on thesurface of the plants (Phillips et al., 1978). Our res-ults would indicate that this is not likely in our Floridalakes, because we did not find a predictable increase inperiphyton with increases in nutrient concentrations.We note, however, that we did not find large growths offilamentous algae on the macrophytes that have beennoted in other studies (Phillips et al., 1978).
Alternative stable states
We examined the concept that macrophyte-dominatedlakes are clear and that algal-dominated lakes areturbid. When we compared what we considered tobe macrophyte-dominated lakes with algal-dominatedlakes, we did indeed find that there was a dif-ference in the average Secchi disk depth, howeverthere was a broad range of overlap between the twogroups. macrophyte-dominated lakes were not ne-cessarily clear and algal-dominated lakes were notnecessarily turbid. On the other hand individual lakesthat make the switch from the macrophyte state to thealgal state do show a decrease in water clarity whilethose switching from the algal state to the macrophytestate show an increase in transparency. This impliesthat in the theory of alternative stable states (Scheffer1998), the concept of a clear or turbid lake is a relativeone that applies to a single lake and not to aggregationsof macrophyte or algal-dominated lakes.
We also examined Scheffer’s theoretical explana-tion for the phenomenon of alternative stable states.His basic model (Scheffer, 1998) starts with three as-sumptions about the behavior of shallow lakes: (1)Turbidity increases with nutrient level, (2) Vegeta-tion reduces turbidity, and (3) Vegetation disappearsentirely when a critical turbidity is exceeded.

232
Our results support his first assumption. In theFlorida lakes as the concentration of nutrients in-creased, the turbidity increased as evidenced by theinverse relationship between total phosphorus andSecchi disk depth. The second assumption cannot betested directly, since our study looks at a cross-sectionof many lakes rather than following individual lakesthat have significant increases or decreases in mac-rophyte abundance through time. Even so, we canmake an indirect test by starting with a figure thatScheffer (1998, Fig. 5.34) uses to illustrate this as-sumption. His plot has turbidity on the vertical axisand nutrients on the horizontal axis with two paral-lel lines. The upper line shows turbidity increasingwith nutrients for lakes without vegetation while thelower line is for lakes with vegetation. Our data didnot show any significant effect of macrophyte biomasson the relationships between total phosphorus concen-tration and algal chlorophyll and only a very smalleffect of macrophytes on the relationship betweenphosphorus and Secchi disk transparency. On the otherhand, when we plotted Secchi disk depth versus watercolumn phosphorus (Fig 8C), we did find two differ-ent lines, one for algal-dominated lakes and the otherfor macrophyte-dominated lakes. Because the watercolumn phosphorus is defined as the sum of total phos-phorus in the water column and the phosphorus con-tained in and on the macrophyte community, these twolines reflect the partitioning of phosphorus betweenthe plankton community and the macrophytes withtheir associated periphyton. When there are few mac-rophytes, the phosphorus is concentrated in the plank-ton with a subsequent increase in turbidity. When mac-rophytes dominate, there is relatively less phosphorusto support the plankton community and transparencyis higher.
Our data would also be consistent with Scheffer’sfigure if the nutrient axis was taken to be nutrient load-ing rate rather than nutrient concentration. In otherwords, for a given loading, the amount of total phos-phorus in the water would be less if a large amountof macrophytes were present in the lake. Janse (1997)reached a similar conclusion using simulation mod-els of shallow lakes with and without macrophytes.Since turbidity is proportional to TP concentration inour lakes, the macrophytes would reduce the turbid-ity as well. The mechanisms by which macrophytesreduce phosphorus concentrations might be due to re-duced resuspension of phosphorus-bearing sediments,settling of phytoplankton to the lakebed due to re-duced turbulence within the plant beds, nutrient uptake
by macrophytes or by periphyton growing on theirsurfaces, or a change in the fish population with areduction in the sediment-disturbing benthivorous fishin the macrophyte-dominated lakes. The Lake Bald-win example supports this idea, since a change inmacrophyte coverage resulted in increases in totalphosphorus and chlorophyll and a decrease in watertransparency with no known change in nutrient load-ing. The use of vegetation-filled marshes to reducenutrient concentrations is well documented and alsosupports this approach. It would be desirable to testthis hypothesis with nutrient budget studies for lakeswith and without macrophytes or for lakes that haveundergone major changes in macrophyte abundance.Currently, we do not have such data for the Floridalakes.
We could not use our data to establish a criticalturbidity at which all macrophytes would be lost andabove which macrophytes would be abundant. Whilewe did find some relationships between plant abund-ance and Secchi depth, the correlations were weakand did not indicate a definite cutoff point. This isprobably due in part to differences in morphometry,for the critical extinction coefficient would be less fora deeper lake than for a shallower one, so there willbe differences from lake to lake. But even when weran multiple regressions with both Secchi depth andmean depth as independent variables, the correlationswere weak. Based on other studies showing that themaximum depth of plant colonization can be relatedto Secchi disk depth (Canfield et al., 1985), we hadexpected to find better relationships between light andmacrophyte abundance. The problem with this ap-proach is illustrated by our finding that the coverageof our lakebeds by plants did not necessarily corres-pond with that predicted by the maximum depth atwhich those plants were found. The macrophytes donot necessarily grow in all areas where there is suffi-cient light reaching the bottom. Scheffer et al. (1992)had reached the same conclusion after studying thesubmersed vegetation in a chain of shallow, eutrophiclakes. They found that it was only possible to useenvironmental factors to predict where macrophyteswould not grow in a lake, not where they would grow.This fact makes it very difficult to develop predictivemodels for macrophyte coverage in shallow lakes.
Cause and effect relationships
We started our analysis to see if plant nutrients meas-ured in lake water determined the abundance of macro-
233
phytes in the way that plant nutrients determine levelsof plankton algae. We failed to find such a relation-ship most likely because the sediments can play animportant role as a nutrient source to the macrophytesindependent of the water concentrations. Our resultssuggest that we were looking at the problem from thewrong direction. It is more likely that the macrophyteswere playing a role in modifying the nutrient concen-trations and other trophic indicators in the lakes. OurFigures 5 and 7 illustrate decreases in trophic stateindicators as the relative amounts of macrophytes inthe lakes increase. In the previous section, we notedseveral mechanisms by which significant macrophytegrowths can reduce nutrient concentrations and lead toreduced plankton and increased transparency.
It is important to note that throughout our discus-sion, we have used the traditional definition of trophicstate, which is based on only those plants that are sus-pended in the water column and ignores the biomassof the macrophytes. An argument can be made thatthe macrophytes should be included in trophic stateclassifications (Canfield et al., 1983), since their pro-ductivity also provides energy and materials to supportthe lake ecosystem.
Application to other lake regions
The Florida lakes in our study are primarily shallowand polymictic, so that our results should be useful forother shallow lake regions. However, our lakes are alsosubtropical and have no freezing period in the winterthat can cause a major setback to the macrophyteseach winter. This may make the Florida lakes lesslikely to switch from a macrophyte state to an algalstate than northern lakes during the spring period whenalgal shading may be a critical factor in preventing theregrowth of macrophytes.
Our results may also not reflect what happens inregions with much higher levels of plant nutrients.For example when Jeppesen et al. (1990) made plotsof Secchi disk depths against total phosphorus con-centrations for several Danish lakes with and withoutmacrophytes, they found greater Secchi disk transpar-encies for a given total phosphorus concentration forlakes with macrophytes than for those without sub-stantial aquatic vegetation. Our Florida lakes differedin this respect, perhaps because the Danish lakes stud-ied by Jeppesen et al. (1990) tended to have muchhigher levels of total phosphorus than our Floridalakes.
Acknowledgements
We thank Drs M. Allen, C. Cichra, and E. Jeppesenfor reviewing this manuscript and providing manyhelpful ideas for improvement. Journal Series No. R-08592 of the Florida Agricultural Experiment Station,Gainesville, FL.
References
Bachmann, R. W. & D. E. Canfield, Jr., 1996. Use of an alternativemethod for monitoring total nitrogen concentrations in Floridalakes. Hydrobiologia 323: 1–8.
Bachmann, R. W., B. L. Jones, D. D. Fox, M. V. Hoyer, L. A.Bull & D. E. Canfield Jr., 1996. Relations between trophic stateindicators and fish in Florida lakes. Can. J. Fish. aquat. Sci. 53:842–855.
Brown, C. D., M. V. Hoyer, R. W. Bachmann & D. E. Canfield,Jr., 2000. Nutrient–chlorophyll relationships: an evaluation ofempirical nutrient–chlorophyll models using Florida and north-temperate lake data. Can J. Fish. aquat. Sci. 57: 1574–1583.
Canfield, D. E., Jr., K. A. Langeland, M. J. Maceina, W. T. Haller, &J. V. Shireman, 1983. Trophic classification of lakes with aquaticmacrophytes. Can. J. Fish. aquat. Sci. 40: 1713–1718.
Canfield, D. E., Jr., J. V. Shireman, D. E. Collie, W. T. Haller, C. E.Watkins & M. J. Maceina, 1984. Prediction of chlorophyll a con-centrations in Florida lakes: Importance of aquatic macrophytes.Can. J. Fish. aquat. Sci. 41: 497–501.
Canfield, D. E., Jr., K. A. Langeland, S. B. Linda, & W. T. Haller,1985. Relations between water transparency and maximum depthof macrophyte colonization in lakes. J. Aquat. Plant Manage. 23:25–28.
Canfield, D. E. Jr., M. V. Hoyer, & C. M. Duarte, 1990. An empiricalmethod for characterizing standing crops of aquatic vegetation.J. Aquat. Plant Manage. 28: 64–69.
Canfield, D. E. Jr. & M. V. Hoyer 1992. Aquatic macrophytes andtheir relationship to the limnology of Florida lakes. University ofFlorida Library, SP115, Gainesville, FL: 599 pp.
Faafeng, B. A. & M. Mjelde, 1998. Clear and turbid water inshallow Norwegian lakes related to submerged vegetation. InJeppesen E., M. Søndergaard, M. Søndergaard & K. Christof-fersen (eds), The Structuring Role of Submerged Macrophytesin Lakes. Springer-Verlag, New York: 361–368.
Florida LAKEWATCH, 1999. Florida LAKEWATCH Data 1986–1999. Department of Fisheries and Aquatic Sciences, Universityof Florida/Institute of Food and Agricultural Sciences, Gaines-ville, FL.
Hasler, A. D. & E. Jones, 1949. Demonstrations of the antagonisticaction of large aquatic plants on algae and rotifers. Ecology 30:359–364.
Hoyer, M. V. & D. E. Canfield, Jr., 1990. Limnological factors in-fluencing bird abundance and species richness on Florida lakes.Lake & Res. Manage. 6: 133–141
Hoyer, M.V., D.E. Canfield, Jr., C.A. Horsburgh & K. Brown, 1996.Florida freshwater plants: a handbook of common aquatic plantsin Florida lakes. SP 189. University of Florida/Institute of Foodand Agricultural Sciences, Gainesville, FL: 264 pp.
Janse, J. H., 1997. A model of nutrient dynamics in shallow lakes inrelation to multiple stable states. Hydrobiologia 342/343: 1–8.
Jeppesen, E., J. P. Jensen, P. Kristensen, M. Søndergaard, E.Mortensen, O. Sortkjær & K. Olrik, 1990. Fish manipulation

234
as a lake restoration tool for shallow, eutrophic, temperatelakes 2: threshold levels, long-term stability and conclusions.Hydrobiologia 200/201: 219–227.
Jeppesen, E., M. Søndergaard, M. Søndergaard & K. Christoffersen(eds), 1998. The Structuring Role of Submerged Macrophytes inLakes. Springer-Verlag, New York: 423 pp.
Maceina, M. J. & J. V. Shireman, 1980. The use of a recordingfathometer for the determination of the distribution and biomassof hydrilla. J. Aquat. Plant Manage. 18: 34–39.
Menzel, D.W. & N. Corwin, 1965. The measurement of totalphosphorus in seawater based on the liberation of organicallybound fractions by persulfate oxidation. Limnol. Oceanogr. 10:280–282.
Moss, B., J. Madgwick & G. Phillips, 1996. A guide to the res-toration of nutrient-enriched shallow lakes. Broads Authority,Norwich, UK. 180 pp.
Murphy, J. & J. P. Riley, 1962. A modified single solution methodfor the determination of phosphate in natural waters. AnalyticaChimica Acta 27: 31–36.
Phillips, G. L., D. Eminison & B. Moss. 1978. A mechanism toaccount for macrophyte decline in progressively eutrophicatedfreshwaters. Aquatic Botany 4: 103–126.
Sartory, D. P. & J. U. Grobbelaar, 1984. Extraction of chlorophyll afrom freshwater phytoplankton for spectrophotometric analysis.Hydrobiologia 114: 117–187.
SAS Institute, 1994. JMP User’s Guide. SAS Institute Incorporated.Cary, North Carolina: 580 pp.
Scheffer, M., 1998. Ecology of Shallow Lakes. Chapman and Hall.London: 357 pp.
Scheffer, M., M. R. de Redelijkheid & F. Noppert, 1992. Distribu-tion and dynamics of submersed vegetation in a chain of shalloweutrophic lakes. Aquat. Bot. 42: 199–216.
Shireman, J. V., M. V. Hoyer, M. J. Maceina, & D. E. Canfield, Jr.,1985. The water quality and fishery of Lake Baldwin, Florida:four years after macrophyte removal by grass carp. Proc. of the4th Ann. Conf. & Int. Symp. on Lake and Reserv. Manage. Northamer. lake Manage. Soc., Merrifield, VA. 210–206.
Wetzel, R. G., 1983. Limnology, 2nd edn. Saunders CollegePublishing, Philadelphia: 767 pp.