relation of sediment transport capacity to stone cover and size in rain-impacted interrill flow
TRANSCRIPT

RELATION OF SEDIMENT TRANSPORT CAPACITY TO STONECOVER AND SIZE IN RAIN-IMPACTED INTERRILL FLOW
ATHOL D. ABRAHAMS1*, PENG GAO1 AND FRANK A. AEBLY2
1Department of Geography, State University of New York at Buffalo, Buffalo, NY 14261, USA2Michael Baker Corporation, 3601 Eisenhower Avenue, Suite 600, Alexandria, VA 22304, USA
Received 8 March 1999; Revised 4 August 1999; Accepted 12 October 1999
ABSTRACT
This study examines how the sediment transport capacity of interrill overland flow varies with stone cover and stone size attwo flow intensities. Six series of flume experiments were conducted on two slopes (2� and 10�) with stones of three sizes(28�0,45�5and91�3 mm)servingas roughness elements.Bedsediment size,waterdischargeandsimulated rainfall intensitywere the same in all experiments. It was found (1) that transport capacity is positively related to stone size, with the relationbecoming stronger as stone cover increases and flow intensity decreases; and (2) that transport capacity is negatively relatedto stone cover at the high flow intensity and curvilinearly related to stone cover at the low flow intensity. The curvilinearrelations are concave-upward with the lowest transport capacities occurring at stone covers between 0�40 and 0�60. Thehighest transport capacities are found at stone covers of 0 and 1,with the transport capacity being greater at the former stonecover than at the latter. Copyright# 2000 John Wiley & Sons, Ltd.
KEYWORDS: sediment transport; rain-flow transport; flow transport; overland flow; surface roughness; hillslopes
INTRODUCTION
Virtually all physically based soil erosion models developed during the past two decades contain an equationfor predicting the sediment transport capacity of overland flow. This is because transport capacity, inconjunction with the inflow of sediment from upslope, controls rates of hillslope erosion and deposition (e.g.Foster and Meyer, 1972; Foster et al., 1995; Smith et al., 1995; Morgan et al., 1998). The ability of presentand future models accurately to predict these rates is therefore contingent on the accuracy of the sedimenttransport equation they employ. The formulation of such an equation for overland flow is complicated by thefact that transport capacity is substantially reduced by surface roughness (Abrahams and Parsons, 1994;Atkinson et al., 2000). Yet there have been few studies of the effect of surface roughness on transport capacity(as distinct from sediment yield) (e.g. Foster, 1982; Foster et al., 1995; Govers and Rauws, 1986). The presentstudy contributes to the limited body of work on this subject by employing stones as roughness elements andexamining their effect on the transport capacity of interrill overland flow.Two studies of the influence of surface stones on the transport capacity of interrill overland flow have
recently been published by Abrahams et al. (1998) and Li and Abrahams (1999). Abrahams et al. (1998)investigated turbulent overland flow in a flume with a sandy bed and slopes of 2�7� to 10�. Experiments wereperformed both with and without simulated rainfall. Cylinders and miniature ornamental trees as well asstones were used as roughness elements. The stones ranged in cover up to 0�37 and in size up to 91�3 mm.Multiple regression indicated that transport capacity was negatively related to stone cover and positivelyrelated to stone size. Li and Abrahams (1999) examined the controls of transport capacity in laminar overlandflow in a flume with a sandy bed inclined at 2� to 10�. Experiments were conducted both with and withoutsimulated rainfall using stones as roughness elements. Stone cover ranged up to 0�25 and stone size up to
Earth Surface Processes and LandformsEarth Surf. Process. Landforms 25, 497±504 (2000)
Copyright # 2000 John Wiley & Sons, Ltd.
* Correspondence to: Prof. A. D. Abrahams, Department of Geography, State University of New York at Buffalo, Wilkeson Quad,Box 610023, Buffalo, New York 14261-0023, USA. E-mail: [email protected]. eduContract/grant sponsor: National Science Foundation

91�3 mm. Multiple regression again revealed that transport capacity was negatively related to stone cover andpositively related to stone size.Abrahams et al. (1998) and Li and Abrahams (1999) attributed the negative relation between transport
capacity and stone cover to flow resistance increasing with cover, causing flow velocity to decrease and flowdepth to increase. Transport capacity then decreases with flow velocity because shear on the bed (as opposedto that on the roughness elements) diminishes. At the same time, as stone cover increases, flow widthdecreases, causing both flow depth and flow velocity to increase. Thus, stone cover has a negative effect onflow velocity via flow resistance and a positive effect via flow width. Flume experiments conducted at a givendischarge and slope (e.g. Figure 4) generally indicate a negative relation between flow velocity and stonecover, which implies that the negative effect of stone cover on flow velocity via flow resistance outweighs thepositive effect via flow width.Figure 1 is a causal diagram that depicts the pathways whereby stone cover controls sediment transport
capacity. The transport processes involved are driven by two energy sources: flow energy and raindropenergy. The processes driven by flow energy are collectively termed flow transport (FT), whereas thosepowered by a combination of flow energy and raindrop energy are termed rain-flow transport (RFT). RFTrefers to the downslope movement of sediment by any mechanism induced by raindrop impact on overlandflow (Moss et al., 1979; Moss, 1980). Thus, RFT includes the movement of particles in suspension and byhopping, rolling and sliding so long as the motion is caused (at least in part) by raindrop impact. RFT refersstrictly to the transport of sediment; it does not include any form of particle detachment (Moss et al., 1979;Moss, 1980).As Figure 1 shows, there are three causal pathways linking transport capacity to stone cover. The first
involves FT and operates through flow velocity. The second is more complicated, as it involves RFT, which iscontrolled by flow depth and flow velocity on the one hand and the proportion of the bed exposed to RFT onthe other. Flow depth (which has a negative effect) and flow velocity (which has a positive effect) control theefficacy of the process, while the proportion of the bed exposed determines the area over which the processoperates. The third causal pathway in Figure 1 is due to horseshoe vortices that form on the stoss side ofstones (Bunte and Poesen, 1993, 1994). These vortices generate considerable turbulence which enhancestransport capacity by entraining and sustaining sediment in motion. This pathway, like pathway 1, involvesFT.Abrahams et al. (1998) and Li and Abrahams (1999) ascribed the positive relation between transport
capacity and stone size to three mechanisms. First, a given cover of large stones has a smaller wettedperimeter and, hence, offers less resistance to flow than does the same cover of small stones. Thus, flowvelocity increases with stone size, causing transport capacity to increase as shear on the bed (as opposed to
Figure 1. Causal diagram summarizing the pathways (or mechanisms) whereby stone cover affects the sediment transport capacity ofinterrill overland flow. Flow discharge, slope, sediment size and rainfall intensity (or energy) are constant and so are not included in thediagram. The notation is as follows:C = stone cover, 1±C = proportion of the bed exposed toRFT, f = resistance to flow, h = flow depth,NHSV = number of horseshoevortices,RFT = rain-flow transport,Tc = sediment transport capacity, u = mean flowvelocity, andw = flow
width
Copyright # 2000 John Wiley & Sons, Ltd. Earth Surf. Process. Landforms 25, 497±504 (2000)
498 A. D. ABRAHAMS ET AL.

that on the roughness elements) increases. Second, flow depth decreases as stone size increases. The increasein velocity and decrease in depth combine to enhance RFT and, hence, transport capacity. Third, large stonesdeflect greater quantities of water than small ones, thereby forming larger horseshoe vortices which transportlarger quantities of sediment. These three causal pathways are depicted in Figure 2, which shows thatpathways 1 and 3 involve FT, while pathway 2 involves RFT.Figures 1 and 2 summarize our knowledge of the ways in which stone cover and size affect transport
capacity. Pathways 1 and 2 in Figure 1 give rise to negative relations between stone cover and transportcapacity, whereas pathway 3 is expressed by a positive relation between these variables. All three pathways inFigure 2 produce positive relations between stone size and transport capacity. These causal pathways ormechanisms all operate simultaneously. So whether an observed relation between cover and transportcapacity is positive or negative depends on which pathways dominate.The studies by Abrahams et al. (1998) and Li and Abrahams (1999) indicate that transport capacity is
negatively related to stone cover and positively related to stone size. However, in the former study themaximum stone cover was 0�37, whereas in the latter it was 0�25. Higher stone covers occur in many parts ofthe world. For example, stone covers are typically 0�50 to 0�70 on desert hillslopes (Abrahams et al., 1986;Abrahams and Parsons, 1991) and may exceed 0�98 on desert pavements (Dury, 1968; Cooke, 1970; Bull,1991). Accordingly, the present study was undertaken to investigate the relation of transport capacity to stonecover and stone size over the cover range of 0 to 1. In the study, water discharge, rainfall intensity andsediment size are held constant, and stone size, stone cover and slope are varied. Slope is varied as a means ofaltering flow intensity without changing discharge.
SET-UP AND METHODS
The flume was 5�2 m long and 0�40 m wide with a smooth aluminium floor and plexiglas walls. It consisted oftwo parts: a lower part, 3�6 m long, which was covered with sand, and an upper steeper part, 1�6 m long. Forthe experiments the lower part of the flume was inclined at slopes of 2� and 10� and covered with a well sortedsand with a median diameter of 0�74 mm and a density of 2650 kg mÿ3. Sand of the same size was fed into theupper part of the flume from a vibrating hopper at a rate that was adjusted to maintain the sand cover over thelower part of the flume. Sediment transport capacity Tc (kg mÿ1 sÿ1) was determined by taking volumetricsamples of the water±sediment mixture leaving the flume, calculating the sediment discharge (kg sÿ1), anddividing this quantity by the flume width W (m).Water entered the flume by overflowing from a head tank. The inflow, which was measured by a rotameter,
was constant at 0�135� 10ÿ3 m3 sÿ1. The density of the water was assumed to be 1000 kg mÿ3, while the
Figure 2. Causal diagram summarizing the pathways (or mechanisms) whereby stone size affects the sediment transport capacity ofinterrill overland flow. Flow discharge, slope, sediment size and rainfall intensity (or energy) are constant and so are not included in thediagram.Thenotation is as follows:Ds = stone size andSHSV = sizeofhorseshoevortices.The remainingnotation isdefined in thecaption
to Figure 1
Copyright # 2000 John Wiley & Sons, Ltd. Earth Surf. Process. Landforms 25, 497±504 (2000)
SEDIMENT TRANSPORT CAPACITY IN INTERRILL FLOW 499

kinematic viscosity v (m2 sÿ1) was determined from water temperature. During the experiments, simulatedrainfall was applied from two Spaco-Lechler full-cone jet nozzles at an intensity of 108 mm hÿ1. The medianraindrop size determined by the flour pellet method was 2�0 mm, and the kinetic energy of the target intensitywas 0�65 J mÿ2 sÿ1, or 68 per cent of that for a natural rainstorm of the same intensity (Kinnell, 1973). Thewater discharge from the lower end of the flume Q (m3 sÿ1) was computed by adding together the waterinflow and the rainfall onto the flume.At the start of each experiment the water inflow rate was set and the sediment feed was adjusted to this rate.
Except for the experiments on the 10� slope when the stone cover was at or near zero, each experiment wasallowed to run for about 3 min before any measurements were taken. Two lines of evidence indicate thatsteady-state conditions existed at that time. First, visual observations suggested that the bed had stabilized.Second, in a special series of measurements, the flume outflow was sampled continuously once the flow hadbecome established. No trend could be detected in the measured sediment concentrations, signifying thatadjustment of the sediment transport rate to the flow had occurred before sampling began ± that is, withinseconds of the flow equilibrating. When the flume was inclined at 10� and had a stone cover at or near zero,the flow began to incise and form rills almost immediately. To minimize the effect of the rilling on thesediment transport rate (since this study is concerned with interrill flow), the flume bed was planed prior toeach experiment and measurements were taken as soon as practicable (typically within 30 to 60 s) after theflow was established.The roughness elements consisted of three groups of stones collected from a local river bed. The stones in
the three groups were similar in shape (with a mean shape factor c/(ab)1/2 ranging from 0�566 to 0�605) and inroundness (with all groups having a modal roundness index of 5 on (Powers' 1953) six-point scale) butdifferent in size. Because the stones were randomly placed in the flume with their a±b planes parallel to thebed, stone size was measured by (a� b)/2. The median values of this index Ds were 28�0, 45�5 and 91�3 mmfor the three groups. Stone cover C was determined by placing a 50 mm by 50 mm grid over the flume andcomputing the proportion of the grid intersection points underlain by stones. Because the stones were partlyburied in the sand with their c axes perpendicular to the bed, at high values of C the 28�0 mm stones werealmost completely covered by the flow, the 45�5 mm stones were mostly covered, and the smallest of the91�3 mm stones were partly covered.The mean flow velocity u (m sÿ1) was determined by a salt tracing technique described elsewhere (Li and
Abrahams, 1997). For the experiments with the 91�3 mm stones, the mean flow width w (m) was calculatedfrom w =W (1 ÿC) and the mean flow depth h (m) from h = Q/uw. Where the stones were partly inundated,the equivalent of C was the area of the stones protruding through the flow divided by the area of the bed.However, the area of protruding stones was not measured. As this area was needed to calculate w and h, thesehydraulic variables could not be computed for most of the experiments with the 28�0 mm and 45�5 mm stones,and so neither could the flow Reynolds number Re = 4uh/v or the Froude number F = u/(gh)1/2. For theexperiments with the 91�3 mm stones, 1627� Re� 14 882 and 0�148� F� 0�886 on the 2� slope, and1734� Re� 8682 and 0�392< F� 1�147 on the 10� slope.
RESULTS
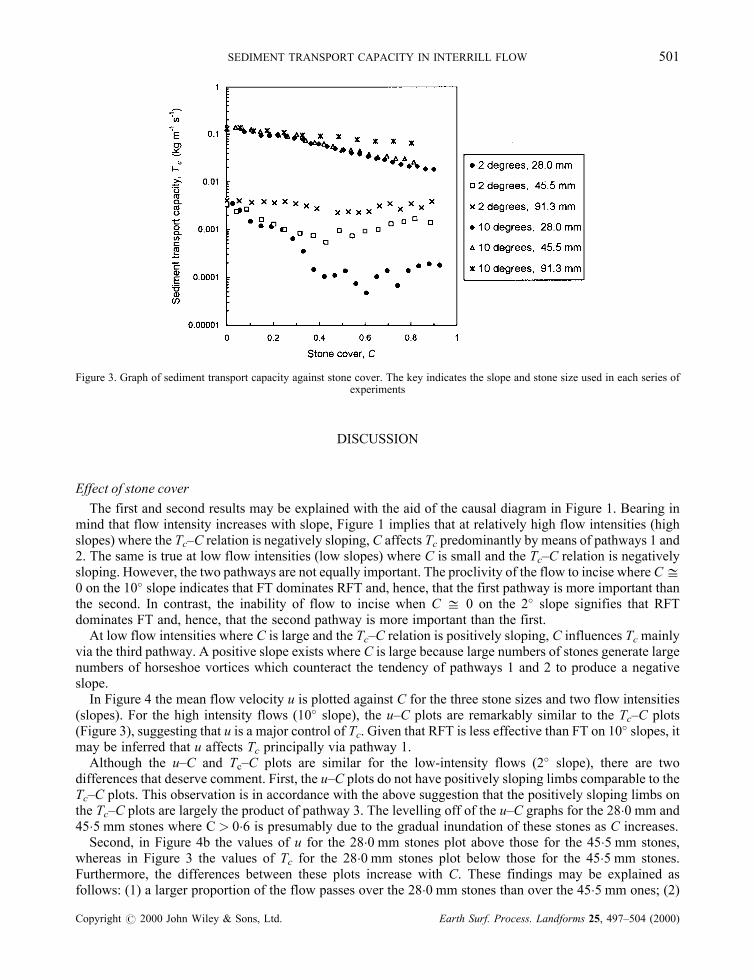
Six series of experiments were undertaken, one for each combination of the three stone sizes Ds (28�0, 45�5and 91�3 mm) and two slopes (2� and 10�). In each series C varied from 0 up to about 0�90, the latterproportion being the highest that could be achieved given the rounded corners of the stones. The results ofthese experiments are presented in Figure 3, which reveals the following.
(1) On the 2� slope the Tc±C relations for all three Ds have concave-upward trends. The minima of theserelations lie within the range 0�40< C< 0�60, whereas the maxima occur at C = 0. In other words,surface stones regardless of their cover cause Tc to decline below its value for the plane bed.
(2) On the 10� slope the Tc±C relations for all three Ds are negatively sloping.(3) On both the 2� and the 10� slopes, Tc tends to increase with Ds. The dependency of Tc on Ds increases as
slope decreases and as C increases.
Copyright # 2000 John Wiley & Sons, Ltd. Earth Surf. Process. Landforms 25, 497±504 (2000)
500 A. D. ABRAHAMS ET AL.
DISCUSSION
Effect of stone cover
The first and second results may be explained with the aid of the causal diagram in Figure 1. Bearing inmind that flow intensity increases with slope, Figure 1 implies that at relatively high flow intensities (highslopes) where the Tc±C relation is negatively sloping, C affects Tc predominantly by means of pathways 1 and2. The same is true at low flow intensities (low slopes) where C is small and the Tc±C relation is negativelysloping. However, the two pathways are not equally important. The proclivity of the flow to incise where C%0 on the 10� slope indicates that FT dominates RFT and, hence, that the first pathway is more important thanthe second. In contrast, the inability of flow to incise when C % 0 on the 2� slope signifies that RFTdominates FT and, hence, that the second pathway is more important than the first.At low flow intensities where C is large and the Tc±C relation is positively sloping, C influences Tc mainly
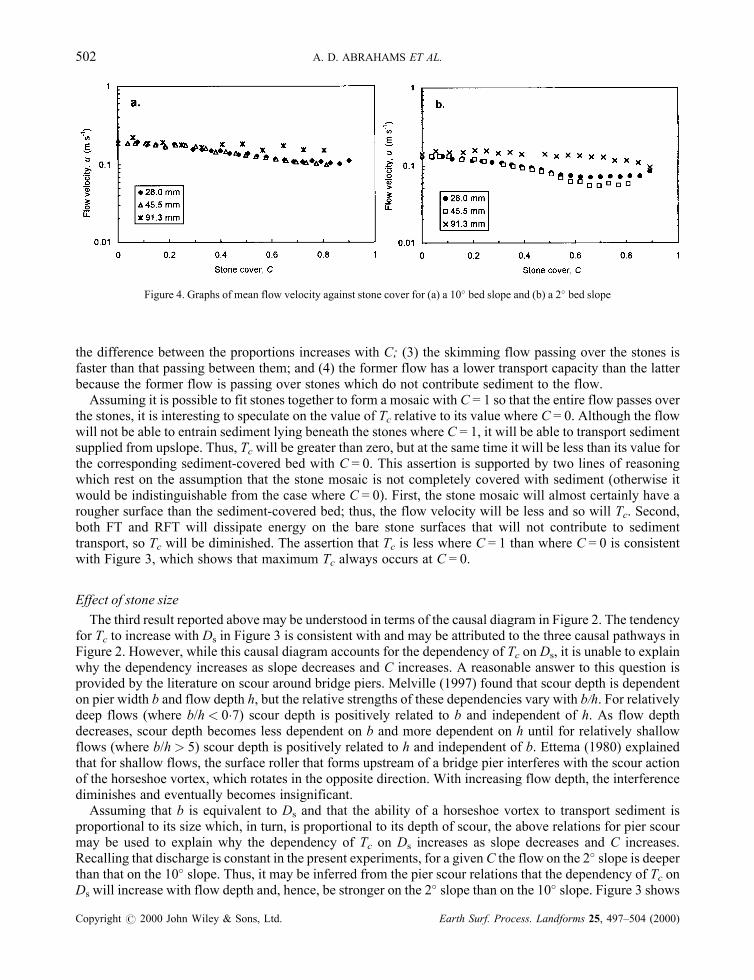
via the third pathway. A positive slope exists where C is large because large numbers of stones generate largenumbers of horseshoe vortices which counteract the tendency of pathways 1 and 2 to produce a negativeslope.In Figure 4 the mean flow velocity u is plotted against C for the three stone sizes and two flow intensities
(slopes). For the high intensity flows (10� slope), the u±C plots are remarkably similar to the Tc±C plots(Figure 3), suggesting that u is a major control of Tc. Given that RFT is less effective than FT on 10� slopes, itmay be inferred that u affects Tc principally via pathway 1.Although the u±C and Tc±C plots are similar for the low-intensity flows (2� slope), there are two
differences that deserve comment. First, the u±C plots do not have positively sloping limbs comparable to theTc±C plots. This observation is in accordance with the above suggestion that the positively sloping limbs onthe Tc±C plots are largely the product of pathway 3. The levelling off of the u±C graphs for the 28�0 mm and45�5 mm stones where C> 0�6 is presumably due to the gradual inundation of these stones as C increases.Second, in Figure 4b the values of u for the 28�0 mm stones plot above those for the 45�5 mm stones,
whereas in Figure 3 the values of Tc for the 28�0 mm stones plot below those for the 45�5 mm stones.Furthermore, the differences between these plots increase with C. These findings may be explained asfollows: (1) a larger proportion of the flow passes over the 28�0 mm stones than over the 45�5 mm ones; (2)
Figure 3. Graph of sediment transport capacity against stone cover. The key indicates the slope and stone size used in each series ofexperiments
Copyright # 2000 John Wiley & Sons, Ltd. Earth Surf. Process. Landforms 25, 497±504 (2000)
SEDIMENT TRANSPORT CAPACITY IN INTERRILL FLOW 501
the difference between the proportions increases with C; (3) the skimming flow passing over the stones isfaster than that passing between them; and (4) the former flow has a lower transport capacity than the latterbecause the former flow is passing over stones which do not contribute sediment to the flow.Assuming it is possible to fit stones together to form a mosaic with C = 1 so that the entire flow passes over
the stones, it is interesting to speculate on the value of Tc relative to its value where C = 0. Although the flowwill not be able to entrain sediment lying beneath the stones where C = 1, it will be able to transport sedimentsupplied from upslope. Thus, Tc will be greater than zero, but at the same time it will be less than its value forthe corresponding sediment-covered bed with C = 0. This assertion is supported by two lines of reasoningwhich rest on the assumption that the stone mosaic is not completely covered with sediment (otherwise itwould be indistinguishable from the case where C = 0). First, the stone mosaic will almost certainly have arougher surface than the sediment-covered bed; thus, the flow velocity will be less and so will Tc. Second,both FT and RFT will dissipate energy on the bare stone surfaces that will not contribute to sedimenttransport, so Tc will be diminished. The assertion that Tc is less where C = 1 than where C = 0 is consistentwith Figure 3, which shows that maximum Tc always occurs at C = 0.
Effect of stone size
The third result reported above may be understood in terms of the causal diagram in Figure 2. The tendencyfor Tc to increase with Ds in Figure 3 is consistent with and may be attributed to the three causal pathways inFigure 2. However, while this causal diagram accounts for the dependency of Tc on Ds, it is unable to explainwhy the dependency increases as slope decreases and C increases. A reasonable answer to this question isprovided by the literature on scour around bridge piers. Melville (1997) found that scour depth is dependenton pier width b and flow depth h, but the relative strengths of these dependencies vary with b/h. For relativelydeep flows (where b/h< 0�7) scour depth is positively related to b and independent of h. As flow depthdecreases, scour depth becomes less dependent on b and more dependent on h until for relatively shallowflows (where b/h> 5) scour depth is positively related to h and independent of b. Ettema (1980) explainedthat for shallow flows, the surface roller that forms upstream of a bridge pier interferes with the scour actionof the horseshoe vortex, which rotates in the opposite direction. With increasing flow depth, the interferencediminishes and eventually becomes insignificant.Assuming that b is equivalent to Ds and that the ability of a horseshoe vortex to transport sediment is
proportional to its size which, in turn, is proportional to its depth of scour, the above relations for pier scourmay be used to explain why the dependency of Tc on Ds increases as slope decreases and C increases.Recalling that discharge is constant in the present experiments, for a givenC the flow on the 2� slope is deeperthan that on the 10� slope. Thus, it may be inferred from the pier scour relations that the dependency of Tc onDs will increase with flow depth and, hence, be stronger on the 2� slope than on the 10� slope. Figure 3 shows
Figure 4. Graphs of mean flow velocity against stone cover for (a) a 10� bed slope and (b) a 2� bed slope
Copyright # 2000 John Wiley & Sons, Ltd. Earth Surf. Process. Landforms 25, 497±504 (2000)
502 A. D. ABRAHAMS ET AL.

that this is indeed the case. Likewise, on a given slope flow depth increases with C. It follows from the pierscour relations that as flow depth increases, Tc should become increasingly dependent on Ds. This is clearlyevident in Figure 3 for both the 2� and the 10� slopes.
CONCLUSION
This study examines how the sediment transport capacity of interrill overland flow varies with stone coverand stone size at two flow intensities. Transport capacity is positively related to stone size, with the relationbecoming stronger as stone cover increases and flow intensity decreases. The positive relation is attributed toflow resistance decreasing and the size of horseshoe vortices increasing as stone size increases. The variationin the strength of the relation is explained by referring to the literature on pier scour which implies that thedependency of transport capacity on stone size increases as flow depth increases, and flow depth increases asstone cover increases and slope decreases.Transport capacity is negatively related to stone cover at the high flow intensity and curvilinearly related to
it at the low flow intensity. The curvilinear relations are concave-upward with the lowest transport capacitiesat stone covers between 0�40 and 0�60. The highest transport capacities are found at stone covers of 0 and 1,with the transport capacity being greater at the former stone cover than at the latter because the bed issmoother at the former and the sediment cover is incomplete at the latter. Positively sloping transportcapacity±stone cover relations are attributed to horseshoe vortices increasing in number with stone cover,whereas negatively sloping relations are ascribed (1) to flow resistance increasing with stone cover causingflow velocity to decline, (2) to flow depth increasing with stone cover causing RFT to diminish, and (3) to theproportion of the bed exposed to RFT decreasing as stone cover increases.
ACKNOWLEDGEMENTS
This research was supported by the Geography and Regional Science and the Jornada Long-Term EcologicalResearch (LTER) programs of the National Science Foundation. We are grateful to Sean Coughlin and NicoleLove for their assistance with the experiments and to P.I.A. Kinnell for helpful comments on the manuscript.
REFERENCES
Abrahams, A. D., Parsons and A. J. 1991. Resistance to overland flow on desert pavement and its implications for sediment transportmodeling. Water Resources Research, 27, 1827±1836.
Abrahams, A. D. and Parsons, A. J. 1994. Hydraulics of interrill overland flow on stone-covered desert surfaces. Catena, 23, 111±140.Abrahams, A. D, Parsons, A. J. and Luk, S-H. 1986. Resistance to overland flow on desert hillslopes. Journal of Hydrology, 88, 343±363.
Abrahams, A. D., Li, G., Krishnan, C. and Atkinson, J. F. 1998. Predicting sediment transport by interrill overland flow on roughsurfaces. Earth Surface Processes and Landforms, 23, 481±492.
Atkinson, J. F., Abrahams, A. D., Krishnan, C. and Li, G. 2000. Shear stress partitioning and sediment transport by overland flow.Journal of Hydraulic Research, in press.
Bull, W. B. 1991. Geomorphic Responses to Climatic Change. Oxford University Press: Oxford.Bunte, K. and Poesen, J. W. 1993. Effects of rock fragment covers on erosion and transport of noncohesive sediment by shallowoverland flow. Water Resources Research, 29, 1415±1424.
Bunte, K. and Poesen, J. W. 1994. Effects of rock fragment size and cover on overland flow hydraulics, local turbulence and sedimentyield on an erodible soil surface. Earth Surface Processes and Landforms, 19, 115±135.
Cooke, R. U. 1970. Morphometric analysis of pediments and associated landforms in the western Mojave Desert, California. AmericanJournal of Science, 269, 26±38.
Dury, G. H. 1968. Gibber. In Encyclopedia of Geomorphology, Fairbridge, R. W. (ed.). Reinholt: New York: 424.Ettema, R. E. 1980. Scour at bridge piers. Report No. 236. School of Engineering, The University of Auckland; New Zealand.Foster, G. R. 1982. Modeling the erosion process. In Hydrologic Modeling of Small Watersheds, Hann, C. T. (ed.). American Societyof Agricultural Engineers: St. Joseph, Mich.; 297±380.
Foster, G. R. and Meyer, L. D. 1972. A closed-form soil erosion equation for upland areas. In Sedimentation, Shen, H. W. (ed.). H.W.Shen: Fort Collins, Colo.; 12-1±12-19.
Foster, G. R., Flanagan, D. C., Nearing, M. A., Lane, L. J., Risse, L. M. and Finkner, S. C. 1995. Hillslope erosion component. InUSDA-Water Erosion Prediction Project Hillslope Profile and Watershed Model Documentation. NSERL Report 10. National SoilErosion Research Laboratory: West Lafayette, Ind.; 11�1±11�12.
Govers, G. and Rauws, G. 1986. Transporting capacity of overland flow on plane and irregular beds. Earth Surface Processes andLandforms 11, 515±524.
Copyright # 2000 John Wiley & Sons, Ltd. Earth Surf. Process. Landforms 25, 497±504 (2000)
SEDIMENT TRANSPORT CAPACITY IN INTERRILL FLOW 503
Kinnell, P. I. A. 1973. The problem of assessing the erosive power of rainfall from meteorological observations. Soil Science Society ofAmerica Proceedings, 37, 617±621.
Li, G. and Abrahams, A. D. 1997. Effect of saltating sediment load on the determination of the mean velocity of overland flow.WaterResources Research, 33, 341±347.
Li, G. and Abrahams, A. D. 1999. Controls of sediment transport capacity in laminar interrill flow on stone-covered surfaces. WaterResources Research, 35, 305±310.
Melville, B. W. 1997. Pier and abutment scour: integrated approach. Journal of Hydraulic Engineering 123: 125±136.Morgan, R. P. C., Quinton, J. N., Smith, R. E., Govers, G., Poesen, J. W. A., Auerswald, K., Chisci, G., Torri, D. and Styczen, M. E.1998. The European Soil Erosion Model (EUROSEM): a dynamic approach for predicting sediment transport from fields and smallcatchments. Earth Surface Processes and Landforms, 23, 527±544.
Moss, A. J. 1980. Thin-flow transportation of solids in arid and non-arid areas: a comparison of processes. International Association ofHydrological Sciences Publication, 128, 435±445.
Moss, A. J,. Walker, P. H. and Hutka, J. 1979. Raindrop-stimulated transportation in shallow water flows: an experimental study.Sedimentary Geology, 22, 165±184.
Powers, M. C. 1953. A new roundness scale for sedimentary particles. Journal of Sedimentary Petrology, 23(2), 117±119.Smith, R. E., Goodrich, D. C., Woolhiser, D. A. and Unkrich, C. L. 1995. KINEROS ± A kinematic runoff and erosion model. InComputer Models of Watershed Hydrology, Singh, V. P. (ed.). Water Resources Publications: Highlands Ranch, Colo.; 697±732.
Copyright # 2000 John Wiley & Sons, Ltd. Earth Surf. Process. Landforms 25, 497±504 (2000)
504 A. D. ABRAHAMS ET AL.