relating plant diversity to biomass and soil erosion in a …€¦ · · 2017-06-04relating plant...
TRANSCRIPT

ARTICLE IN PRESSApplied Geography xxx (2010) 1–12
Contents lists available at ScienceDirect
Applied Geography
journal homepage: www.elsevier .com/locate/apgeog
Relating plant diversity to biomass and soil erosion in a cultivatedlandscape of the eastern seaboard region of Thailand
Rajendra P. Shrestha a,*, Dietrich Schmidt-Vogt b, Nalina Gnanavelrajah c
a School of Environment, Resources and Development, Asian Institute of Technology, P.O. Box 4, Klong Luang, Pathumthani 12120, Thailandb Centre for Mountain Ecosystem Studies, Kunming Institute of Botany, Heilongtan, Kunming 650204, PR Chinac Faculty of Agriculture, University of Jaffna, Thinnavey(NP), Sri Lanka
Keywords:Plant diversityAgricultural land usesBiomassErosionThailand
* Corresponding author. Tel.: þ66 2524 5602; faxE-mail address: [email protected] (R.P. Shrestha)
0143-6228/$ – see front matter � 2010 Elsevier Ltddoi:10.1016/j.apgeog.2010.01.005
Please cite this article in press as: Shrestlandscape of the eastern seaboard region o
a b s t r a c t
Plant diversity can affect ecological processes through effects on biomass and soil condi-tion. A study was carried out in an agricultural watershed of Thailand to document plantspecies richness of different agricultural land uses and to assess its relationship withbiomass and soil erosion. A nested sampling design of 20 � 20 m, 10 � 10 m, 5 � 5 m and1 � 1 m quadrats was employed to study species richness of three categories of plants:herbaceous plants, shrubs and trees. Interviews were conducted with farmers who ownedthe cultivated fields where sampling plots were located. Plant diversity was assessed bycomputing Shannon index, Simpson index, and Species richness. Species utility index,which is the percentage of species identified as useful, was also estimated for each landuse. Biomass was estimated using methodology recommended by FAO and soil erosion wasestimated using the universal soil loss equation (USLE). From among the different land usetypes, mixed orchard ranked first in terms of plant diversity while paddy ranked last. Landuses with monocropping of shrubs, such as cassava, pineapple and sugarcane had lowerplant diversity than land uses with monocropping of trees, such as coconut and pararubber. Monocropping of eucalyptus was an exception. Rotations of monocrops, namelypineapple–cassava and sugarcane–cassava, or intercropping, namely coconut–cassava, alsohad a higher plant diversity as compared to monocropping of shrubs. The highest speciesutility index of 61 was found in orchards, the lowest of 9 was found in Eucalyptus plan-tations. Plant diversity was found to have a significant positive correlation with biomassand a negative, though non-significant, correlation with soil erosion.
� 2010 Elsevier Ltd. All rights reserved.
Introduction
Agrobiodiversity has been recognized as an important factor in maintaining or enhancing agricultural sustainability(Brookfield, Padoch, Parsons, & Stocking, 2002). Agricultural biodiversity or ‘agrobiodiversity’ are now established terms intheir own right and are defined as ‘the variety and variability of animals, plants and microorganisms that are used directly orindirectly for food and agriculture, including crops, livestock, forestry and fisheries (FAO, 1999). Agricultural biodiversityincludes all components of biological diversity that are relevant for agricultural production (Thrupp, 1998). Agriculturalbiodiversity has multiple functions, such as contributing to food and livelihood security as well as to environmentalsustainability (FAO, 1997). Agricultural biodiversity can also assist in controlling land degradation (Stocking, 2002) and inincreasing nutrient use efficiency. Evidence from experimental intercropping systems has demonstrated that higher species
: þ66 2524 6431..
. All rights reserved.
ha, R. P., et al., Relating plant diversity to biomass and soil erosion in a cultivatedf Thailand, Applied Geography (2010), doi:10.1016/j.apgeog.2010.01.005

R.P. Shrestha et al. / Applied Geography xxx (2010) 1–122
ARTICLE IN PRESS
richness can be associated with increased crop yield (Tilman, 1996), possibly due to differences in nutrient cycling charac-teristics that regulate soil fertility (Ewel, Mazzarino, & Berish, 1991; Hooper & Vitousek, 1998; Vandermeer, 1988, 1990).
Agrobiodiversity, however, is being depleted in many agroecosystems, causing economic losses, which lead to a broadrange of social costs (Thrupp, 1998). Biodiversity conservation in agricultural land uses is one of the greatest challenges,especially in the tropics where rapid population growth, intensification of land use, and unplanned settlement and frag-mentation destroy fragile habitats and lead to a particularly rapid rate of biodiversity loss (NEMA, 2001). Thailand, where newopportunities have arisen through national and international market demand for industrial crops and commercial vegetablecrops, has been undergoing rapid changes in land use. Commercialized land uses focus mostly on a few or on only one speciesand commonly result in the disappearance of local varieties from farmers’ fields (Rerkasem & Rerkasem, 2000). Data forassessing agrobiodiversity are generally scarce (Dumanski & Pieri, 2000). However, declining agrobiodiversity can be deducedfrom preliminary indicators, for example from loss or fragmentation of natural habitat (Smith, 1996).
Plant diversity and biomass
Hypotheses on the link between diversity and energy in ecosystems suggest a positive relation between biomass andbiodiversity. Plants in more diverse communities may increase total resource capture and thus have a higher net primaryproduction (Hooper, 1998). Such an increase in net primary production with increasing plant diversity is mainly attributed toincreased nutrient and water uptake due to different depths of root systems (Berendse, 1979), increased leaf area index andlight capture due to differences in shoot architecture (Naeem, Thompson, Lawler, Lawton, & Woodfin, 1994; Tilman, 1996), andincreased efficiency of resource capture over time due to differences in phenology (Gulmon, Chiariello, Mooney, & Chu, 1983;Steiner, 1982).
Plant diversity and soil erosion
Almost one third of Thailand’s cultivated area is subject to severe land degradation, especially to water-induced soilerosion in sloping terrain and in upland areas. Soil erosion causes loss of soil productivity, degradation of water quality, andloss of organic carbon (Brown & Wolf, 1984; Lal, Kimble, Follet, & Cole, 1998; Walling, 1987). Vegetation cover plays animportant role in mitigating soil erosion. The protective capacity of vegetation cover is related to biomass and speciesdiversity. Biomass converted to soil organic matter can protect against soil erosion by stabilizing aggregates (Oades, 1993) andenhancing soil structure (Waters & Oades, 1991). Cardinale, Wright, Cadotte, Carroll, Hector, Srivastava, Loreau, & Weis (2007)reported that species mixtures can produce on average 1.7 times more biomass than species monocultures. Soil stabilitydepends also on the above- and below-ground structure of plant communities. Heterogeneity in the shoot and root archi-tecture of plant communities is capable of reducing both rainfall erosivity and soil erodibility. The greater the diversity of rootgrowth forms, the less likely it is that extreme events will lead to soil erosion (Beierkuhnlein & Jentsch, 2005). Hence, loss ofplant diversity in terms of both species diversity and structural complexity, and prevalence of monocultures can enhancesusceptibility to soil erosion (Power & Follett, 1987), especially in high mountains (Korner, 1999).
In Thailand, plant diversity in cultivated landscapes has been affected by the rapid commercialization of agriculture whichgoes hand in hand with increasing monocropping of food crops, commercial value crops (para rubber, eucalyptus), and, lately,biofuels. Commercial agricultural land use can also have an effect on soil erosion. The objective of this study was to assessplant diversity of various agricultural land uses of a cultivated watershed, and to explore how plant diversity relates withplant biomass and soil erosion. Plant diversity is in this study represented by plant species richness. A study like this can helpto identify land use types which promote plant diversity, and to maintain ecological integrity by better land use allocationwithin a watershed.
The study area
The study area, Khlong Yai watershed, is located between 12�
650–13�
140 N latitude and 101�030–101
�440 E longitude in the
eastern seaboard region of Thailand, and covers 170,175 ha (Fig. 1). The area is under the influence of a tropical monsoonalclimate with a rainy season extending from May to October. The average annual rainfall is 1383 mm in 120 average annualrainy days. The average annual temperature is 28.3 �C. More than 75% of the sub-watershed has flat or gently undulatingtopography suitable for upland cultivation. Slope complex (steep land) covers 10% of the total area of the watershed. Thedominant soil types in the area are Typic Paleudults and Oxic Paleustults.
Almost the entire area (80%) of the watershed is under agricultural cultivation. The range of agricultural land uses in thestudy area is rather broad; the main categories are: shrub monocrops, mixed orchards, tree monocrops, and tree–shrubintercrops. Mixed orchards and monocrops of para rubber (Hevea brasiliensis), pineapple (Ananas comosus) and cassava(Manihot esculenta) are the dominant land uses covering an area of 19.4, 16.3 12.9 and 12.1% of the total watershed,respectively. Paddy (Oryza sativa) covers about 4% of the total agricultural area. Other agricultural land uses in the area aremonocrops of coconut (Cocos nucifera), eucalyptus (Eucalyptus camaldulensis), and sugarcane (Saccharum officinarum),intercrops of coconut–cassava, and rotations of sugarcane–cassava and pineapple–cassava. The agricultural cultivation ismostly intensive and commercially-oriented.
Please cite this article in press as: Shrestha, R. P., et al., Relating plant diversity to biomass and soil erosion in a cultivatedlandscape of the eastern seaboard region of Thailand, Applied Geography (2010), doi:10.1016/j.apgeog.2010.01.005

Fig. 1. Location of the study area.
R.P. Shrestha et al. / Applied Geography xxx (2010) 1–12 3
ARTICLE IN PRESS
Materials and methods
Sampling design
The study was conducted according to the methodology and terminology suggested by Zarin, Huijun, and Enu-kwesi(2002). With respect to terminology, land use type refers to the dominant annual or perennial crop(s) and theirtemporal or spatial association in any given field. In this study, land use types were identified using the available landuse map. For the purpose of biomass estimation, land use types were identified as or subdivided into three layers: treelayer, shrub layer, and herb layer. However, results were presented at the level of land use types. Land use under mixedorchard, para rubber, eucalyptus and coconut were considered as tree layer land use as these crops grow to a height ofmore than 2 m. Land uses with pineapple, cassava and sugarcane are referred to as shrub layer as their height rangesbetween 0.5 and 2 m. Paddy rice is considered a herb layer, because rice is an annual plant, which does not producewoody tissue.
We used the nested plot/sub plot sampling design suggested by Avery and Burkhart (1983) with 20 � 20 m, 10 � 10 m,5 � 5 m and 1 � 1 m quadrats, nested within each other, as sampling units for plant diversity and biomass estimation. The20 � 20 m quadrats were used for morphometric measurements of the tree layer to estimate biomass, for tree speciesidentification, and for counting the number of individuals of each species, especially in land use types with large canopy treesand many species, e.g. mixed orchard. 10 � 10 m quadrats were used for land uses identified as tree layer with a greateruniformity of species, excluding mixed orchards. 5� 5 m quadrats were used for measurements in the shrub layer and 1�1 mquadrats were used for the herb layer. A stratified sampling design using land use type as strata with the number of samplingsites proportional to the size of the area covered by each land use class was employed as a sampling framework. The totalnumber of sampling quadrats was 75 with 4–12 quadrats in each land use category. When positioning sample quadrats, soiltype was considered in order to ensure representational coverage of the dominant soils of the study area. Field work wasconducted during September–November of 2006, i.e. at a time when annual crops have matured. Quadrats were sampled onlyonce. Farm households, who cultivated the fields where sample quadrats were located, were interviewed to collect relevantinformation, such as utility value of species and yield data.
Please cite this article in press as: Shrestha, R. P., et al., Relating plant diversity to biomass and soil erosion in a cultivatedlandscape of the eastern seaboard region of Thailand, Applied Geography (2010), doi:10.1016/j.apgeog.2010.01.005

R.P. Shrestha et al. / Applied Geography xxx (2010) 1–124
ARTICLE IN PRESS
Plant diversity assessment
For the assessment of biodiversity or, more narrowly, plant diversity, various methods and indices are available. In thisstudy, species richness, Shannon index, Simpson index, and Species utility index (Zarin et al., 2002) were used to estimateplant diversity for each land use type. The indices were calculated separately for herb layer, shrub layer and tree layer. Thestandardized methodology of linear scaling was adopted in order to combine different indices so that a single index could bederived to rank different land use types in terms of plant diversity.
In this paper, we focus on plant species richness as a measure for plant species diversity, including both crops andspontaneous vegetation. Species richness is a simple numerical count of the number of species found in a given sampling unit(Magurran, 1998), in our case the quadrat. The Shannon’s diversity index (H), ranging in theory from 0 to infinity, accounts forboth abundance and evenness of the species present. H increases as the number of species increases and individuals areevenly distributed. It is zero when only one species is present irrespective of its individuals. In the following equation,Shannon’s diversity index (H) calculates the proportion of species i relative to the total number of species (pi), and thenmultiplies by the natural logarithm of this proportion (lnpi). The resulting product is summed up across species, andmultiplied by �1 (Magurran, 1998).
H ¼ �XN
i¼1
pilnpi
Simpson’s index (Simpson, 1949) gives the probability of two randomly chosen individuals drawn from a populationbelonging to the same species. Simpson’s index was calculated by adding the sum of squares of proportional abundance ofeach species identified in the sampling quadrats. The higher the probability that individuals belong to the same species, thelower the diversity. The index was converted to (1-D) for easy interpretation, because a higher value of (1-D) also indicatesa higher diversity.
D ¼X
pi2
The species utility index was calculated by dividing the number of species identified as useful by the farmers by the totalnumber of identified species. The utility index was calculated by combining the species in all three layers. In addition, thenumber of layers was also taken as one index in order to incorporate the vertical aspect of diversity and to avoid bias due torichness in only one layer.
Plant diversity ranking
The land use types in the study area were heterogeneous in terms of crops grown, of management practices, and ofnumber of layers. Plant diversity should meaningfully be considered in both the horizontal and the vertical dimension. Giventhat the study area is a cultivated landscape, it is important that diversity be represented not only by the higher number ofplant species and their relative abundance but also by the utility value of the species to the farmers. It is therefore essential tocombine all indices into one index in order to compare the plant diversity of the different land uses. Linear scaling of thedifferent indices in different layers is thus suggested in order to obtain a single index for ranking plant diversity of thedifferent agricultural land uses. A min-max normalization technique as shown in the following equation was used to combineall indices into a single index for each land use type. This simple and commonly used normalization technique linearlyarranges observed data into a specified range.
R ¼ ½ðYi� YminÞ=ðYmax � YminÞ� � 10
where, R is rescaled diversity index. Yi is ith diversity index to rescale, Ymax is maximum value of ith diversity index amongland uses of the watershed, and Ymin is minimum value of ith diversity index among land uses. All the calculated indices werelinear scaled at a range of 10 and averaged to get a single plant diversity index. Land use types were then ranked according tothe calculated single plant diversity index.
Biomass estimation
We followed the methodology for biomass estimation suggested by FAO (1997) as described in Gnanavelrajah, Shrestha,Schmidt-Vogt, and Samarakoon (2008). The biomass of tree, shrub and herb layers of each land use type was estimatedseparately, using the data collected from nested-quadrat sampling in order to finally compute the total biomass per unit area.
Biomass was measured by summing up the biomass of all plants in a quadrat and eventually converting it to biomass perhectare. The biomass of the tree layer was estimated according to the method for estimating the biomass of palms describedby FAO (1997). The biomass of the shrub layer in the perennial tree crop land uses was estimated by measuring the stemvolume and multiplying this with the respective wood density values of each species. Since the contribution of foliage toshrub volume is considered negligible (Ponce-Hernandez, Koohafkan, & Antoin, 2004), foliage was not considered in the
Please cite this article in press as: Shrestha, R. P., et al., Relating plant diversity to biomass and soil erosion in a cultivatedlandscape of the eastern seaboard region of Thailand, Applied Geography (2010), doi:10.1016/j.apgeog.2010.01.005
R.P. Shrestha et al. / Applied Geography xxx (2010) 1–12 5
ARTICLE IN PRESS
overall estimation of total biomass. The biomass of shrub crops was estimated using the average yield data for each cropobtained from the household survey as well as the harvest index values of respective crops obtained from secondary sources(Bhattacharyya & Bhattacharyya, 1992; Howeler, 1985; Kawashima, Sumamal, Pholsen, Chaithiang, & Boonpakdee, 2001).Herb biomass was estimated in all land use types by harvesting the aboveground biomass and measuring its oven dry weight.The belowground biomass of each quadrat was considered equivalent to 30% of the aboveground biomass as suggested forbroad leaf vegetation by Ponce-Hernandez et al. (2004).
The total biomass was calculated by summing up the aboveground and belowground biomass for herb, shrub and treelayers. Land use-wise biomass was calculated by averaging the biomass of all quadrats surveyed in a particular land use type.Statistical tests such, as Analysis of Variance (ANOVA) and Duncan’s Multiple Range Test (DMRT) were carried out using SPSSver 10 software for land use type-specific biomass components and total biomass to examine the differences in biomassamong different land use types. The relation between plant diversity and biomass was examined by using simple correlationanalysis.
Soil erosion estimation
The universal soil loss equation (USLE) given by Wischmeier and Smith (1978) was used to model soil erosion. Theequation estimates the mean annual soil erosion in tons/ha/yr by multiplying six factors of soil erosion, namely rainfallerosivity (R), soil erodibility (K), slope length (L), slope steepness (S), crop management (C) and erosion control practice (P).Due to the complexity of tropical farming systems, there is high uncertainty in USLE parameters particularly with respect tothe C and P factors which can vary considerably between different cropping systems thus impacting the computed results onsoil erosion. In Thailand, the Land Development Department has recommended modification of USLE parameters including Cand P values for the various cropping systems of Thailand. Accordingly, each parameter was computed using the methodappropriate for local conditions encoded in GIS thematic layers of rainfall, soil, slope, and land use for computing the averageannual soil erosion as described in Gnanavelrajah (2007). Soil erosion was thus computed at the level of each mapping unit,which is a unique cartographic unit resulting from the overlaying of the aforementioned thematic layers.
Results and discussion
Plant diversity in herb, shrub and tree layer of different land uses
The plant species collected as described in the sampling design section were identified with the help of a specialist fromthe Office of Plant Herbarium, Department of Natural Resources, Thailand. Altogether 44 species in herbaceous layer, 22species in shrub layer and 20 species in tree layer were identified in all land use types of the study area (Appendix 1).
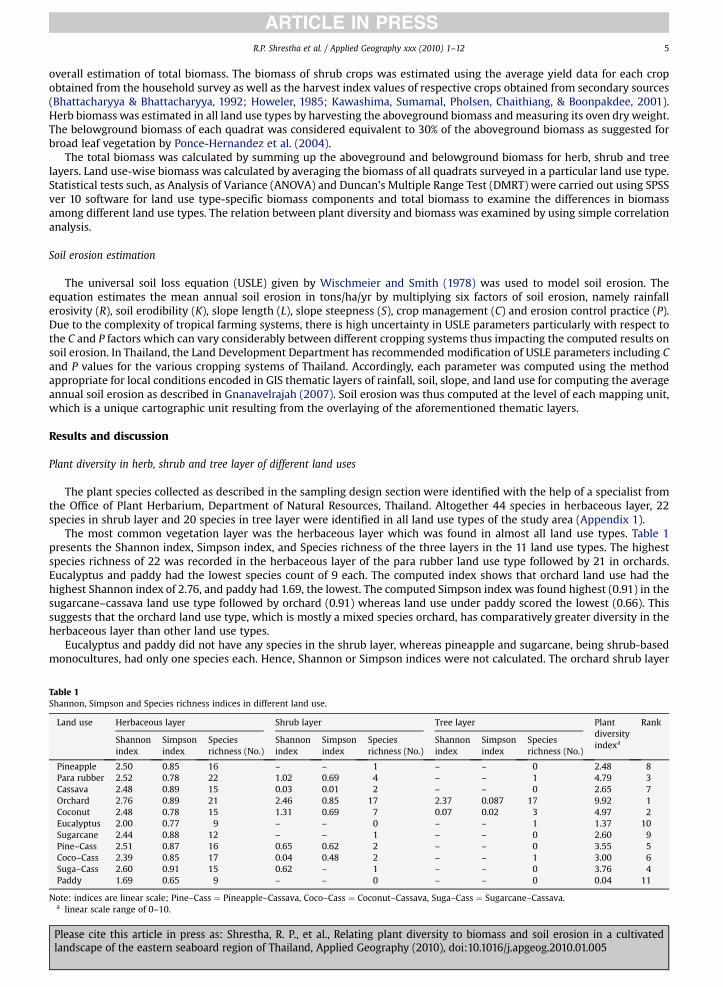
The most common vegetation layer was the herbaceous layer which was found in almost all land use types. Table 1presents the Shannon index, Simpson index, and Species richness of the three layers in the 11 land use types. The highestspecies richness of 22 was recorded in the herbaceous layer of the para rubber land use type followed by 21 in orchards.Eucalyptus and paddy had the lowest species count of 9 each. The computed index shows that orchard land use had thehighest Shannon index of 2.76, and paddy had 1.69, the lowest. The computed Simpson index was found highest (0.91) in thesugarcane–cassava land use type followed by orchard (0.91) whereas land use under paddy scored the lowest (0.66). Thissuggests that the orchard land use type, which is mostly a mixed species orchard, has comparatively greater diversity in theherbaceous layer than other land use types.
Eucalyptus and paddy did not have any species in the shrub layer, whereas pineapple and sugarcane, being shrub-basedmonocultures, had only one species each. Hence, Shannon or Simpson indices were not calculated. The orchard shrub layer
Table 1Shannon, Simpson and Species richness indices in different land use.
Land use Herbaceous layer Shrub layer Tree layer Plantdiversityindexa
Rank
Shannonindex
Simpsonindex
Speciesrichness (No.)
Shannonindex
Simpsonindex
Speciesrichness (No.)
Shannonindex
Simpsonindex
Speciesrichness (No.)
Pineapple 2.50 0.85 16 – – 1 – – 0 2.48 8Para rubber 2.52 0.78 22 1.02 0.69 4 – – 1 4.79 3Cassava 2.48 0.89 15 0.03 0.01 2 – – 0 2.65 7Orchard 2.76 0.89 21 2.46 0.85 17 2.37 0.087 17 9.92 1Coconut 2.48 0.78 15 1.31 0.69 7 0.07 0.02 3 4.97 2Eucalyptus 2.00 0.77 9 – – 0 – – 1 1.37 10Sugarcane 2.44 0.88 12 – – 1 – – 0 2.60 9Pine–Cass 2.51 0.87 16 0.65 0.62 2 – – 0 3.55 5Coco–Cass 2.39 0.85 17 0.04 0.48 2 – – 1 3.00 6Suga–Cass 2.60 0.91 15 0.62 – 1 – – 0 3.76 4Paddy 1.69 0.65 9 – – 0 – – 0 0.04 11
Note: indices are linear scale; Pine–Cass ¼ Pineapple–Cassava, Coco–Cass ¼ Coconut–Cassava, Suga–Cass ¼ Sugarcane–Cassava.a linear scale range of 0–10.
Please cite this article in press as: Shrestha, R. P., et al., Relating plant diversity to biomass and soil erosion in a cultivatedlandscape of the eastern seaboard region of Thailand, Applied Geography (2010), doi:10.1016/j.apgeog.2010.01.005

R.P. Shrestha et al. / Applied Geography xxx (2010) 1–126
ARTICLE IN PRESS
scored the highest diversity with corresponding computed indices of 2.34, 0.85 and 17 for Shannon index, Simpson index, andspecies richness, respectively (Table 1). Plant diversity in the shrub layer of coconut with indices of 1.31, 0.69, and in the shrublayer of para rubber with indices of 1.02, 0.69, 4.0 scored second and third rank. In addition to spontaneous species, orchardand coconut had also useful and cultivated species in this layer. Very young para rubber fields had cultivated species, such aspineapple, in their shrub layer.
The majority of land use types, namely pineapple, cassava, sugarcane, sugarcane–cassava, pineapple–cassava and paddydid not have any tree species in the fields. Land use types coconut–cassava, eucalyptus and para rubber had only one treespecies, coconut had three tree species, and orchard land use had a variety of tree species as shown by the higher speciesrichness of 18, Shannon index of 2.37, and Simpson index of 0.87.
Species utility index
The species utility index was computed on the basis of farmers’ opinion, however, no in-depth study was made onhow these species are used. The species identified as useful by the farmers are presented in Appendix 1. Three out of 45plant species, occurring in the herbaceous layer, were identified by farmers as useful species. In the shrub layer, on theother hand, 20 species were identified as useful out of a total of 22, and in the tree layer all 20 species were considereduseful.
In Table 2, the highest utility index (61%) was computed for orchard land use and the lowest (9%) for eucalyptus. The landuse types, coconut, coconut–cassava and sugarcane–cassava had utility indices of 29%, 24% and 23%, respectively. Coconutplots, in addition to coconut as the main crop, also contained other species, both cultivated and spontaneously growing. Landuses under coconut–cassava and sugarcane–cassava had more useful spontaneous species contributing to a higher utilityindex than other land uses.
Plant diversity in different land uses
Plant diversity in terms of number of different plant species was recorded for each land use and expressed as Shannonindex, Simpson index, and Species richness. The comparison between land use types shows that orchard land use had thehighest and paddy land use the lowest plant diversity (Table 1). The cropping pattern of orchard was mixed cropping witha variety of crops in all three layers, whereas the pattern of paddy land use was monocropping with intensive weedmanagement, which accounted for its lower plant diversity. Weeds in paddy fields are controlled by herbicides and otherchemicals; herbicides are not applied in orchards, only some insecticides. Aquatic plants, which may occur in paddy fields andwhich would increase plant diversity, were not considered in the study.
With respect to plant diversity, coconut and para rubber land uses ranked second and third place. Even though these aremonocropping land uses, due to the fact that they are based on perennial crops, farmers do not manage against weeds asintensively as they do in land uses based on annual crops. This results in a higher number of spontaneous plant species. Mixedland uses, such as sugarcane–cassava and pineapple–cassava ranked fourth and fifth, respectively. These two land uses aremonocrop rotations, and therefore have a higher diversity than monocrop land uses without rotations, such as cassava,pineapple or sugarcane. Coconut–cassava as an intercrop land use ranked sixth. In comparison to coconut monocrop,coconut–cassava intercrop was found to have less diversity because cassava as an annual crop requires complete tilling of thefield which suppresses the growth of spontaneous vegetation.
Ranks seven, eight, and nine were occupied by land uses with monocropping of shrubs. The plant diversity of eucalyptus,even though it is a tree-based land use with low management intensity, was even lower than the plant diversity of theseshrub monocrops. Similar findings of low plant species diversity in eucalyptus plantations when compared to plantationswith native species have been reported by Sangha and Jalota (2005). This is probably due to allelopathic effects, i.e. the toxicinfluence of certain biochemicals of eucalyptus (Verma & Totey, 1999), and to reduction of soil moisture by transpiration ofeucalyptus.
Table 2Species utility index of land use under different crops.
Land use Cropping system Species utility index (%)
Pineapple Annual monocrop 18Para rubber Perennial monocrop 21Cassava Annual monocrop 11Orchard Mixed crop 61Coconut Perennial monocrop 24Eucalyptus Perennial monocrop 9Sugarcane Monocrop 15Pineapple–cassava Monocrop–rotational 17Coconut–cassava Intercrop 31Sugarcane–cassava Monocrop–rotational 22Paddy Monocrop 11
Please cite this article in press as: Shrestha, R. P., et al., Relating plant diversity to biomass and soil erosion in a cultivatedlandscape of the eastern seaboard region of Thailand, Applied Geography (2010), doi:10.1016/j.apgeog.2010.01.005

R.P. Shrestha et al. / Applied Geography xxx (2010) 1–12 7
ARTICLE IN PRESS
Biomass of land uses
Average total biomass (Table 3) was highest under para rubber land use (247.89 tons/ha) and lowest under paddy(12.87 tons/ha). The total biomass of mixed orchard was slightly lower (189.43 tons/ha) than that of para rubber. Significantlylower total biomass was recorded for land use types without a tree layer, such as pineapple, cassava, pineapple–cassavarotation, sugarcane, and sugarcane–cassava rotation. Among the land uses with tree crops, coconut, coconut–cassava andeucalyptus had less total biomass than mixed orchard and para rubber, mainly due to greater plant spacing and less intensemanagement in coconut and eucalyptus plantations. Mixed orchard was highly variable depending on plant species, age, andmanagement.
Shrub biomass was highest in sugarcane (28.59 tons/ha). All perennial land uses except coconut–cassava intercrop scoredlow in the shrub biomass group. Shrub-based land uses had a lower biomass than tree-based land uses. Among the shrub-based land uses, sugarcane and pineapple had a lower herb biomass than others because of intense weed management, closespacing, and close canopy of these plants. Land use under cassava, pineapple–cassava rotation, and coconut–cassava intercrophad higher herb biomass compared to other shrub land uses because of less intense management of cassava leading to highweed growth.
Land use under trees had higher herb biomass than land use under shrubs due to less competition and less intense weedmanagement. Land uses under eucalyptus, coconut and coconut–cassava had less tree biomass than mixed orchard and pararubber due to lower biomass per individual plant, but also due to greater plant spacing. The biomass of sugarcane (37.79 tons/ha) in the study area is comparable to the value of 39.71 tons/ha reported by Rahman, Pal, and Alam (1992), but much lowerthan the biomass values 46.32–63.25 tons/ha reported for sugarcane by De Silva and De Costa (2004).
The rate of carbon sequestration varies according to tree species, soil type, regional climate, topography, land use change,and management practice (US EPA, 2006). No-till farming, for instance, sequesters more carbon than conventional tillagepractice (West & Post, 2002). While there is a need for location-specific information on the rate of carbon sequestration byplant species and land use practices, it is reported that trees and other perennials in agroforestry systems are capable ofretaining greater biomass, thus enhancing carbon sequestration (Scherr & Sthapit, 2009). The finding of this study that alltree-based land uses, including coconut–cassava intercrop, had higher biomass/ha than the shrub-based land uses indicatesthe importance of tree-based land uses for ecological functions, such as carbon sequestration.
Relationship between plant diversity and biomass
Considering all land uses and the biomass from all layers, this study found a significant positive correlation (Pearsoncorrelation, r¼ 0.646, r2¼ 0.418) between average plant diversity and biomass in the observed land uses (Fig. 2). This is in linewith the findings of Tilman, Knops, Wedin, Reich, Ritchie, and Siemann (1997) who reported that biomass increases withincreasing plant diversity. However, this does not mean that the highest plant diversity is necessarily correlated with thehighest biomass or vice versa as reported in studies by Hooper (1998), and Hooper and Vitousek (1998). In the category ofshrub crop land uses, biomass increases with increasing plant diversity in the case of pineapple, cassava, pineapple–cassavaand sugarcane–cassava. Sugarcane, on the other hand, which had the highest biomass of all shrub crop land uses, has a ratherlow plant diversity. Relations like this can be due to the fact that individual species differ from each other with respect to theirrelative efficiencies in converting resources into biomass depending on the degree of complementary and competitiveinteraction among species (Hooper, 1998).
Therefore, using species richness as a measure of biological diversity does not provide enough explanatory power, asecosystem processes are affected by the functional characteristics of organisms involved rather than by their taxonomicidentity. Moreover, the observation that increasing species diversity leads to increasing functional group diversity (Schmid,Joshi, & Schlapfer, 2001) in most natural ecosystems does not necessarily apply to agricultural systems. This may serve as an
Table 3Biomass of land use under different crops.
Land use Above ground Below-ground biomass Total biomass
Tree biomass Shrub biomass Herb biomass
Tons/ha
Pineapple 0 18.50b 0.85a 5.8a 25.17aPara rubber 187.53c 1.39a 1.75c 57.20d 247.89dCassava 0 20.36b 1.86c 6.66a 28.89aOrchard 141.76bc 1.31a 2.63d 43.71cd 189.43cdCoconut 100.70ab 4.81a 1.51bc 32.10bc 139.17bcEucalyptus 60.14a 0 1.80c 18.58b 80.52bcSugarcane 0 28.59c 0.47a 8.72a 37.79aPineapple–cassava 0 22.71b 1.25b 7.19a 31.15aCoconut–cassava 100.72ab 20.43b 1.20b 36.71bc 159.07bcSugarcane–cassava 0 21.36b 1.47bc 6.85a 29.69aPaddy 0 9.13a 0.77a 2.97a 12.87a
Means with similar letters along the columns are not statistically different according to Duncan Multiple Range Test.
Please cite this article in press as: Shrestha, R. P., et al., Relating plant diversity to biomass and soil erosion in a cultivatedlandscape of the eastern seaboard region of Thailand, Applied Geography (2010), doi:10.1016/j.apgeog.2010.01.005

Fig. 2. Land use-wise plant diversity and biomass.
R.P. Shrestha et al. / Applied Geography xxx (2010) 1–128
ARTICLE IN PRESS
explanation for cases mentioned in this study, when land uses with low plant diversity yield more biomass than land useswith higher plant diversity, such as in the case of sugarcane, which has a higher biomass than all other shrub crop land uses,but which is characterized by low plant diversity that is higher only than that of paddy. High biomass, in the case of sugarcane,is probably due to the fact that it is a C4 plant, which uses a more efficient method of carbon dioxide uptake, by whicha 4-carbon molecule instead of the two 3-carbon molecules as in C3 plants is formed. High plant diversity of other shrub cropland uses does not imply an increase in number of C4 plants, and thus does not necessarily lead to an increase in biomass.Similarly, while coconut had higher plant diversity than coconut–cassava, coconut–cassava had a higher biomass thancoconut, because the biomass production of cassava is higher than that of the spontaneous shrub species under coconut.
When it comes to the choice of commercial upland crops like cassava, sugarcane and pineapple, agricultural policy canplay a more important role than demand and supply. Another important factor is land tenure (Gnanavelrajah, 2007). Paddy iseconomically less attractive compared to other crops in the study area and in Thailand, and is grown in areas where culti-vation of upland crops is constrained by high soil moisture.
Soil erosion in different land uses
Potential soil erosion was assessed for each of the different land uses. 84% of the study area has a potential erosion rate of2 tons/ha/yr or below. A potential soil erosion rate of 2–4 and 4–12 tons/ha/yr was found in 6 and 7% of the total area,respectively. The flat to undulating terrain of the study area is not conducive to soil erosion, and the annual crop fields are undergood agricultural management practices in the study area. Only 3% of the study area was found to have an erosion rate exceedingthe maximum permissible limit of 12 tons/ha/yr. In Thailand, soil erosion of less than 12 tons/ha/yr is generally not considereda very serious problem. Soil erosion higher than the permissible limit was observed in land uses with upland crops (sugarcane,cassava), and plantation crops (eucalyptus, young para rubber) where ground cover during the early vegetation period is sparse.
Relationship between plant diversity and soil erosion
Soil erosion, though computed at the mapping unit of spatial scale, was aggregated at the land use level to examine therelationship between plant diversity and soil erosion. In general, the correlation between average soil erosion of land uses andtheir respective plant diversity was found to be negative as well as non-significant (Fig. 3). As soil erosion is a function ofrainfall, soil, topography, vegetation type and land management practices, it was difficult to get a clear and unambiguouscorrelation in this study. However, a comparison of individual land uses yielded some interesting information.
Please cite this article in press as: Shrestha, R. P., et al., Relating plant diversity to biomass and soil erosion in a cultivatedlandscape of the eastern seaboard region of Thailand, Applied Geography (2010), doi:10.1016/j.apgeog.2010.01.005

Fig. 3. Land use-wise plant diversity and soil erosion.
R.P. Shrestha et al. / Applied Geography xxx (2010) 1–12 9
ARTICLE IN PRESS
Higher average potential soil erosion was observed under sugarcane and eucalyptus, which are land uses characterized bylow plant diversity. Low soil erosion was observed in some land uses with higher plant diversity, for example mixed orchard,but not in others, as for instance, coconut, which has a relatively high plant diversity but also high soil erosion. This may bedue to the coconut canopy not providing sufficient protection against soil erosion. The lower average erosion under pararubber and pineapple can be attributed to the dense canopy structure, which more effectively reduces rainfall erosivity. In thecase of paddy, the lowest level of plant diversity was associated with the lowest average soil erosion rate. This can beexplained by the fact that paddy cultivation in the study area is practiced on flat terrain, which naturally is less prone to soilerosion.
Ground cover, canopy and mulch influence soil erosion substantially. It would have been interesting to examine therelation between soil erosion and vegetation biomass, but the present study did unfortunately not provide the scope for suchan examination.
Conclusions
This study in a landscape largely devoted to agriculture was carried out in an attempt to record plant diversity of differentagricultural land use types, and to understand its relationship with biomass and erosion, both of which connect to broaderissues of carbon sequestration and land conservation. In a cultivated landscape characterized by diversity of land uses as is thecase in the study area, different land use practices influence plant species diversity differently. The study found that land useunder orchard had the highest, and land use under paddy had the lowest plant diversity. Monocropping of shrubs, such ascassava, pineapple and sugarcane had lower plant diversities than monocropping of trees with the exception of eucalyptus.Rotational monocropping, such as pineapple–cassava and sugarcane–cassava, or intercropping, such as coconut–cassava, hada higher plant diversity than monocropping shrubs. These findings are in agreement with other observations on mono-cropping of shrubs reducing biodiversity (Brookfield, 2001; Thrupp, 1998). Tree monocrops, on the other hand, had a higherplant diversity than shrub crop rotations or tree–shrub intercrops. In terms of the relationship of plant diversity with biomassand soil erosion, a significant positive correlation was observed between biomass and plant diversity of the respective landuses. However, when comparing land uses individually, higher biomass of land uses was not always found to corresponddirectly with higher plant diversity and vice versa. Other factors, such as the metabolism of dominant plant species, and theecological relations between plant species may in some cases have a stronger effect on biomass than the plant speciesrichness of land uses. This highlights the limitations of species richness as a measure of plant diversity and the need forsupplementary methodology in studies devoted to exploring the linkages between plant diversity and other characteristics ofa plant cover. Soil erosion was found to be negatively correlated with plant diversity. The evidence for this, however, was notstrong due to the correlation being non-significant. In-depth studies with field measurements would help to better examinethe relation between plant diversity and erosion.
It can be concluded from the findings of this study that the trend towards monocropping of shrubs, which can be expectedto accelerate in Thailand due to the prioritization of export crops and, more recently, biofuels, will lead to a further reductionin plant diversity on a landscape level. The effects of this trend on carbon sequestration and soil erosion are either uncertain ormust be viewed in a differentiated manner as in the case of sugarcane. Land uses with a tree layer were found superior toother land uses in terms of both plant diversity and biomass. This is true even for monospecific tree plantations and includesthe much-maligned rubber plantations. From our findings, we therefore argue for conservation or promotion of land usesbased on or including the management of a tree layer. A further argument for land use based on perennials is the satisfaction
Please cite this article in press as: Shrestha, R. P., et al., Relating plant diversity to biomass and soil erosion in a cultivatedlandscape of the eastern seaboard region of Thailand, Applied Geography (2010), doi:10.1016/j.apgeog.2010.01.005

R.P. Shrestha et al. / Applied Geography xxx (2010) 1–1210
ARTICLE IN PRESS
of farmers expressed by the utility index. Choice of land use should be determined by the capacity of land uses to fulfill morethan only one function over a long time perspective. Multifunctionality on a landscape scale is, however, best maintained byretaining or enhancing the diversity of land uses which is so characteristic of Khlong Yai watershed.
Acknowledgements
The authors would like to thank the Asian Institute of Technology for providing the research grant to carry out the study.Thanks are also due to Ms Anisara Pensuk, Mr Piya Kosintharajitt, Ms Romanee Tongdara and Ms Charurin Pholhinkong fortheir assistance in the field. We would also like to thank those farmers who spent their valuable time responding thequestionnaire. We are thankful to the anonymous reviewers for their constructive comments on the manuscript.
Appendix 1. Species in herbaceous, shrub and tree layer identified in different land uses.
Species name Pineapple Cassava Pararubber
Orchard Coconut Eucalyptus Sugarcane Pine.–cassava
Suga.–cassava
Coco.–cassava
Paddy
Herbaceous layerAcalypha indica x xAchyranthes aspera x xAgeratum conyzoides x x x x x x x x xAbutilon indicum x x xAlternanthera sessilis x xAmaranthus viridis x x x x x x xAeschynomene aspera x xAzadirachta indica xBrachiaria reptans xCatharanthus roseus xCoccinia grandis x x xChloris barbata x x x x x x x x xCleome viscosa xCrotalaria striata x xCynodon dactylon x x x x x x xCyperus difformis xCyperus pulcherrimus xDactyloctenium aegyptium xDigitaria ascendens x x x xEchinochloa colonum xEchinochloa crus-galli x x xEleusine indica x x xEupatorium odoratum x x x x x x x x x xEupatorium sp. x xEuphorbia hirta x x x xEuphorbia geniculatum xGomphrena celosioides x x x x x x x x xHymenachne
pseudointerruptax
Ipomoea aquatica xIpomoea gracilis xLeptochloa chinensis x x xMimosa pudica x x x x x x x xOryza sativa xPanicum repens x xPhysalis angulata x x x xPhaseolus lathyroides x x x x x xPhyllanthus niruri x x x x x x x xPueraria phaseoloides x x x x x xRhynchelytrum repens x x xRuellia tuberosa x x x xSetaria geniculata x x x x x x x x x xTridax procumbens x x x x x x xTrianthema
protulacastrumx x
Veronica cinerea x x x x x x
Shrub layerAnanas comosus x xAzadirachta indica xCallotropis sp. x xCalamus sp xCapsicum annuum xCatharanthus roseus x
Please cite this article in press as: Shrestha, R. P., et al., Relating plant diversity to biomass and soil erosion in a cultivatedlandscape of the eastern seaboard region of Thailand, Applied Geography (2010), doi:10.1016/j.apgeog.2010.01.005

Citrus aurantifolia x xCitrullus lanatus xLantana camera x x xLeucaena leucocephala x x x xLuffa cylindrica xLycopersicon esculentum xManihot esculenta x x x x xMusa paradisiaca xPsophocarpus
tetragonolobusx
Saccharum officinarum x x xSolanum melongena xSolanum nigrumTectona grandis xVigna sinensis xZingiber officinale x xZiziphus jujuba x
Tree layerArecanut sp xAverrhoa carambola xAzadirachta indica x xArtocarpus heterophyllus xBouea macrophylla xCarica Papaya xCocos nucifera x x xDimocarpus longana xDurio zibethinus xEucalyptus camaldulensis xEugenia jambosa xHevea brasiliensis xGarcinia mangostana xMangifera indica xManilkara zapota xMoringa oleifera xNephelium lappaceum xPsidium guajavaTamarindus indica xTectona grandis x
Note: Species name in bold letters are those identified as useful by farmers, x ¼ presence; Pine. ¼ Pineapple,Suga. ¼ Sugarcane, Coco. ¼ Coconut.
R.P. Shrestha et al. / Applied Geography xxx (2010) 1–12 11
ARTICLE IN PRESS
References
Avery, T. E., & Burkhart, H. E. (1983). Forest measurements. New York: McGraw-Hill.Beierkuhnlein, C., & Jentsch, A. (2005). Ecological importance of species diversity. In R. J. Henry (Ed.), Plant diversity and evolution: Genotypic and phenotypic
variation in higher plants (pp. 249–285). Wallingford: CAB International.Berendse, F. (1979). Competition between plant populations with different rooting depths: theoretical considerations. (Berlin). Oecologia, 43, 19–26.Bhattacharyya, R. K., & Bhattacharyya, A. P. (1992). Crop production and harvest index of kew pineapple as affected by foliar application of micronutrients.
Acta Horticulturae, 296, 161–164.Brookfield, H. (2001). Exploring agrodiversity. New York: Columbia University Press.Brookfield, H., Padoch, C., Parsons, H., & Stocking, M. (2002). Cultivating biodiversity: Understanding, analyzing and using agricultural diversity. London: ITDG
Publishing.Brown, L. R., & Wolf, E. C. (1984). Soil erosion: Quiet crisis in the world economy. No. 60. Washington DC: World Watch.Cardinale, B. J., Wright, J. P., Cadotte, M. W., Carroll, I. T., Hector, A., Srivastava, D. S., et al. (2007). Impacts of plant diversity on biomass production increase
through time because of species complementarity. PNAS, 104(No. 46), 18123–18128.De Silva, A. L. C., & De Costa, W. A. J. M. (2004). Varietal variation in growth, physiology and yield of sugarcane under two contrasting water regimes. Tropical
Agricultural Research, 16, 1–12.Dumanski, J., & Pieri, C. (2000). Land quality indicators: research plan. Agriculture, Ecosystems and Environment, 81(2), 93–102.Ewel, J. J., Mazzarino, M. J., & Berish, C. W. (1991). Tropical soil fertility changes under monocultures and successional communities of different structure.
Ecological Applications, 1, 289–302.FAO. (1997). Estimating biomass and biomass change of tropical forests: A primer, forestry paper. No. 134. Rome: FAO.FAO (1999). Agricultural biodiversity. Multifunctional character of agriculture and land conference, Background paper 1, Maastricht, The Netherlands.Gnanavelrajah, N. (2007). Sustainable land use options for enhancing carbon sequestration, plant diversity and productivity: a case of Khlong Yai sub-
watershed, Thailand, PhD dissertation (unpublished), Bangkok: Asian Institute of Technology.Gnanavelrajah, N., Shrestha, R. P., Schmidt-Vogt, D., & Samarakoon, L. (2008). Assessment of carbon stock and soil carbon management in agricultural land
uses in Thailand. Land Degradation and Development., 19(3), 242–256.Gulmon, S. L., Chiariello, N. R., Mooney, H. A., & Chu, C. C. (1983). Phenology and resource use in three co-occuring grassland annuals. (Berlin). Oecologia, 58,
33–42.Hooper, D. U. (1998). The role of complementarity and competition in ecosystem responses to variation in plant diversity. Ecology, 79(2), 704–719.Hooper, D. U., & Vitousek, P. M. (1998). Effect of plant composition and diversity on nutrient cycling. Ecological Monographs, 68, 121–149.Howeler, R. H. (1985). Potassium nutrition of cassava. In. Proceedings of international Symposium on potassium in agriculture (pp. 819–841). Atlanta, GA, USA/
Madison, Wisconsin: ASA CSSA SSSA.
Please cite this article in press as: Shrestha, R. P., et al., Relating plant diversity to biomass and soil erosion in a cultivatedlandscape of the eastern seaboard region of Thailand, Applied Geography (2010), doi:10.1016/j.apgeog.2010.01.005
R.P. Shrestha et al. / Applied Geography xxx (2010) 1–1212
ARTICLE IN PRESS
Kawashima, T., Sumamal, W., Pholsen, P., Chaithiang, R., & Boonpakdee, W. (2001). Relative aerial biomass yield and changes in chemical composition aftercutting of sugarcane in Northeast Thailand. JIRCAS Journal, 9, 47–51.
Korner, C. (1999). Alpine plant life. Berlin: Springer.Lal, R., Kimble, J. M., Follet, R. F., & Cole, C. V. (1998). The potential of U.S. croplands sequester carbon and mitigate the green house effect. Chelsea, MI: Ann Arbor
Press.Magurran, A. E. (1998). Ecological diversity and its measurement. Princeton University Press.Naeem, S. L. J., Thompson, L. J., Lawler, S. P., Lawton, J. H., & Woodfin, R. M. (1994). Declining biodiversity can alter the performance of ecosystems. Nature,
368, 734–737.NEMA. (2001). State of the environment report for Uganda. Kampala: National Environment Management Authority, Ministry of Water Lands and
Environment.Oades, J. M. (1993). Role of biology in the formation, stabilization and degradation of soil structure. Geoderma, 56, 377–400.Ponce-Hernandez, R., Koohafkan, P., & Antoin, J. (2004). Assessing carbon stocks and modelling win–win scenarios of carbon sequestration through land use
changes. Rome: FAO.Power, J. F., & Follett, R. F. (1987). Monocultures: advantages, limitations, and alternatives. Scientific America, 256(3), 78–86.Rahman, M. H., Pal, S. K., & Alam, F. (1992). Effect of nitrogen, phosphorus, potassium, sulphur, zinc and manganese nutrients on yield and sucrose content of
sugarcane (Saccharum officinarum) in floodplain soils of Bangladesh. Indian Journal of Agricultural Sciences, 62, 450–455.Rerkasem, B., & Rerkasem, K. (2000). Agrodiversity for in situ conservation of Thailand’s native rice germplasm. CMU Journal, 1(2), 15–23.Sangha, K. K., & Jalota, R. J. (2005). Value of ecological services of exotic Eucalyptus tereticornis and native Albergia sissoo tree plantations of North-Western
India. Conservation and Society, 3(1), 92–105.Scherr, S. J., & Sthapit, S. (2009). Mitigating climate change through food and land use. Worldwatch report 179. Washington, DC: Worldwatch Institute.Schmid, B., Joshi, J., & Schlapfer, F. (2001). Empirical evidence for biodiversity-ecosystem functioning relationships. In A. P. Kinzing, S. W. Pacala, & D. Tilman
(Eds.), The functional consequences of biodiversity: Empirical progress and theoretical extension. Monographs in population biology (pp. 120–150). Princeton:Princeton University.
Simpson, E. H. (1949). Measurement of diversity. Nature, 163, 688.Smith, N. J. H. (1996). Effects of land use systems on the use and conservation of biodiversity. No. 11. In J. P. Srivastava, N. J. H. Smith, & D. A. Forno (Eds.),
Biodiversity and agricultural intensification: Partners for development and conservation. Environmentally sustainable development studies and monographs.Washington, DC: World Bank.
Steiner, K. (1982). Intercropping in tropical smallholder agriculture with special reference to West Africa. Eschborn: German Agency for Technical Cooperation(GTZ).
Stocking, M. (2002). Diversity: a new strategic direction for soil conservation. InSustainable utilization of global soil and water resources, proceedings of the12th international soil conservation conference,, Vol. 1 (pp. 53–58). Beijing: Tsinghua University Press.
Thrupp, L. (1998). Cultivating diversity: Agrobiodiversity and food security. Washington, DC: World Resources Institute.Tilman, D. (1996). Biodiversity: population versus ecosystem stability. Ecology, 77, 350–363.Tilman, D., Knops, J., Wedin, D., Reich, P., Ritchie, M., & Siemann, E. (1997). The influence of functional diversity and composition on ecosystem process.
Science, 277, 1300–1302.US EPA. (2006). Carbon sequestration in agriculture and forestry. http://www.epa.gov/sequestration/faq.html#3 Retrieved 06.11.09.Vandermeer, J. H. (1988). The ecology of intercropping. New York: Cambridge University Press.Vandermeer, J. H. (1990). Intercropping. In C. R. Carrol, J. H. Vandermeer, & P. M. Rosset (Eds.), Agroecology. New York: McGraw-Hill.Verma, R. K., & Totey, N. G. (1999). Biological diversity, medicinal potential of ground flora and improvement in soil quality under plantations raised on
degraded Bhata land. Advances in Forestry Research in India, 20, 37–69.Walling, D. E. (1987). Rainfall, runoff, and soil erosion of the land: a global review. In K. J. Gregory (Ed.), Energetics of the physical environment. London: John
Wiley & Sons Ltd.Waters, A. G., & Oades, J. M. (1991). Organic matter in water stable aggregates. In W. S. Wilson (Ed.), Advances in soil organic matter research: The impact of
agriculture and the environment. Cambridge: Royal Society of Chemistry.West, T. O., & Post, W. M. (2002). Soil organic carbon sequestration rates by tillage and crop rotation: a global data analysis. Soil Science Society of America
Journal, 66, 1930–1946.Wischmeier, W. H., & Smith, D. D. (1978). Predicting rainfall erosion losses: A guide to conservation planning. U.S. Department of Agriculture. Agricultural
handbook No. 537.Zarin, D. J., Huijun, G., & Enu-kwesi, L. (2002). Guidelines on the assessment of plant species diversity in agricultural landscapes. In H. Brookfield, C. Padoch,
H. Parsons, & M. Stocking (Eds.), Cultivating biodiversity: Understanding, analyzing and using agricultural diversity. London: ITDG Publishing.
Please cite this article in press as: Shrestha, R. P., et al., Relating plant diversity to biomass and soil erosion in a cultivatedlandscape of the eastern seaboard region of Thailand, Applied Geography (2010), doi:10.1016/j.apgeog.2010.01.005