related articles that may interest you
TRANSCRIPT
Interannual Influences of the Surface Potential Vorticity Forcing overthe Tibetan Plateau on East Asian Summer Rainfall※
Chen SHENG1,2, Bian HE*1,2, Guoxiong WU1,2, Yimin LIU1,2, and Shaoyu ZHANG1,2
1State Key Laboratory of Numerical Modeling for Atmospheric Sciences and Geophysical Fluid Dynamics (LASG),
Institute of Atmospheric Physics, Chinese Academy of Sciences, Beijing 100029, China2College of Earth and Planetary Sciences, University of Chinese Academy of Sciences, Beijing 100049, China
(Received 7 June 2021; revised 9 August 2021; accepted 13 September 2021)
ABSTRACT
The influences of interannual surface potential vorticity forcing over the Tibetan Plateau (TP) on East Asian summerrainfall (EASR) and upper-level circulation are explored in this study. The results show that the interannual EASR andassociated circulations are closely related to the surface potential vorticity negative uniform leading mode (PVNUM) overthe TP. When the PVNUM is in the positive phase, more rainfall occurs in the Yangtze River valley, South Korea, Japan,and part of northern China, less rainfall occurs in southern China, and vice versa. A possible mechanism by which PVNUMaffects EASR is proposed. Unstable air induced by the positive phase of PVNUM could stimulate significant upwardmotion and a lower-level anomalous cyclone over the TP. As a result, a dipole heating mode with anomalous cooling overthe southwestern TP and anomalous heating over the southeastern TP is generated. Sensitivity experiment results regardingthis dipole heating mode indicate that anomalous cooling over the southwestern TP leads to local and northeastern Asiannegative height anomalies, while anomalous heating over the southeastern TP leads to local positive height anomalies.These results greatly resemble the realistic circulation pattern associated with EASR. Further analysis indicates that theanomalous water vapor transport associated with this anomalous circulation pattern is responsible for the anomalous EASR.Consequently, changes in surface potential vorticity forcing over the TP can induce changes in EASR.
Key words: surface potential vorticity, East Asian summer monsoon, rainfall, the Tibetan Plateau
Citation: Sheng, C., B. He, G. X. Wu, Y. M. Liu, and S. Y. Zhang, 2022: Interannual influences of the surface potentialvorticity forcing over the Tibetan Plateau on East Asian summer rainfall. Adv. Atmos. Sci., https://doi.org/10.1007/s00376-021-1218-4.
Article Highlights:
• Potential vorticity (PV), inherently combining dynamics and thermodynamics, is an ideal indicator of the full forcing ofthe TP.
• The leading modes of EASR and upper-level circulation are closely related to the surface PV forcing over the TP.• We highlight that the dipole heating mode over the TP plays a critical role in the process where the TP’s surface PV
affects EASR.
1. Introduction
East Asian summer rainfall (EASR) affects East Asiancountries, including China, Japan, and Korea (Ding andChan, 2005; Kubota et al., 2016; Zhou et al., 2019). Thechanges and anomalies of EASR have caused frequent andsevere weather disasters, including droughts, floods, and heat-waves (Huang et al., 2007, 2019). Many studies have investig-
ated the possible driving factors of EASR. A basic con-sensus is that in addition to the El Niño-Southern Oscilla-tion (ENSO) (Wang and Zhang, 2002; Ding, 2007; Xie etal., 2016; Wen et al., 2019; Ding et al., 2020), the IndianOcean sea surface temperature anomaly (Yang et al., 2007;Xie et al., 2009), and the Indian summer monsoon rainfall(Kripalani and Kulkarni, 1997, 2001), the Tibetan Plateau(TP; e.g., Yeh et al., 1957; Ye and Gao, 1979; Yanai et al.,1992; Liu et al., 2020) plays an important and nonnegli-gible role in EASR anomalies.
The TP, as the highest and broadest plateau on Earth,has increasingly attracted the attention of climatologists dueto its large dynamic and thermodynamic effects on the cli-
※ This paper is a contribution to the special issue on Third Pole
Atmospheric Physics, Chemistry, and Hydrology* Corresponding author: Bian HE
Email: [email protected]
ADVANCES IN ATMOSPHERIC SCIENCES, 2022 • Original Paper •
© The Author(s) 2021. This article is published with open access at link.springer.com
IN PRESS

mate of Asia. Previous studies have demonstrated that thethermal forcing of the TP can greatly impact the Asian sum-mer monsoon system (e.g., Flohn, 1957; Yeh et al., 1957;Ye and Gao, 1979; Yanai et al., 1992; Wu et al., 1997,2007, 2012, 2018; Xu et al., 2015). For example, Wu et al.(1997, 2007) indicated that sensible heating over the TP isthe major driver of monsoon rainfall over the Asian contin-ent. The strong surface sensible heating over the TP duringboreal spring can affect the subsequent summer monsoon rain-fall (Zhao and Chen, 2001; Duan et al., 2005). The onset,formation, and evolution of the Asian summer monsoon areclosely related to the thermal forcing of the TP (Wu andZhang, 1998; Hsu and Liu, 2003). Moreover, some studieshave examined the mechanical effects of the TP on theAsian summer monsoon system. Hahn and Manabe (1975)documented that the South Asian summer monsoon wouldnot reach inland Asia if the TP were removed. More com-plex experiments, considering increasing TP heights fromzero to its contemporary height (Chen et al., 1999; Liu,1999; Kitoh, 2004; Jiang et al., 2008), have indicated thatAsian summer monsoon rainfall shifts northward from theIndian Ocean to inland Asia as TP height increases. Certainstudies (Liu and Yin, 2002; Liang et al., 2005) have illus-trated that the onset and evolution of the Asian summer mon-soon is also sensitive to the location and height of the TP.However, little insight is given about the intrinsic com-bined effects of dynamic and thermodynamic forcing of theTP in the literature.
Potential vorticity (PV; Rossby, 1940; Ertel, 1942),which inherently combines atmospheric dynamics and thermo-dynamics, is an ideal indicator of the combined dynamicand thermodynamic conditions of the TP. Most previous stud-ies have focused on atmospheric interior PV. Its impacts ongeneral circulation structure (e.g., Hoskins, 1991), rain-storms, and cold air activities (e.g., Wu et al., 1995; Wu andCai, 1997; Zhao and Ding, 2009) and its interannual rela-tion to ozone (Danielsen, 1968; Allaart et al., 1993; Folkinsand Appenzeller, 1996; Sandhya et al., 2015) and Rossbywave breaking (Folkins and Appenzeller, 1996; Ryoo et al.,2013; Bowley et al., 2019) are the main areas of interest.However, instead of atmospheric interior PV, some studies(e.g., Hoskins, 1991) highlight the importance of surfacePV, especially surface PV over the TP, based on the imper-meability theorem (Haynes and McIntyre, 1987, 1990). Forexample, the elevated TP is one of the most prominent sur-face PV sources in the world (Sheng et al., 2021). In particu-lar, the surface PV over the TP (TPPV) could exert a promin-ent influence on the TP vortex (Sheng et al., 2021) and down-stream rainfall and extreme cold events (Ma et al., 2019; Yuet al., 2019; Zhang et al., 2021). Although surface PV isknown to be of great importance, the influence of surfaceTPPV forcing on EASR is still a knowledge gap.
This study aims to illustrate the interannual impact onEASR of the surface TPPV forcing associated with theintrinsic combined effect of the dynamics and thermodynam-ics of the TP. The remainder of the paper is organized as fol-
lows. Section 2 presents the data, method, and model. In sec-tion 3, the relationships of surface TPPV forcing withEASR and EASR-related circulation are presented. Section4 analyzes the possible mechanism of how surface TPPV for-cing affects EASR. Finally, conclusions and discussion areprovided in section 5.
2. Data, method, and model
2.1. Data
Monthly mean data on the hybrid σ–p model levelobtained from MERRA2 (Rienecker et al., 2011; Lucchesi,2012) are used to calculate surface PV and surface static sta-bility. Variables include air temperature, zonal and meridi-onal wind, and pressure.
Additional data used in this study include monthly outgo-ing longwave radiation (OLR) from the polar-orbiting seriesof satellites of the National Oceanic and Atmospheric Admin-istration (Liebmann and Smith, 1996), monthly land precipita-tion from the Climatic Research Unit (Mitchell and Jones,2005), and monthly specific humidity and zonal, meridi-onal, and vertical wind on pressure level from MERRA2.
The study period is 1980–2017. The horizontal resolu-tion of all MERRA2 data is 0.625° × 0.5° (longitude × latit-ude). The horizontal resolutions of the OLR and precipita-tion data are 2.5° × 2.5° and 0.5° × 0.5°, respectively. Cli-mate mean values calculated over June, July, and August(JJA) are used to represent the boreal summer condition.
2.2. Method
Surface PV is calculated as follows (Sheng et al.,2021):
PV =αhξah · ∇hθ
= g[∂v∂p
(∂θ
∂x
)h− ∂u∂p
(∂θ
∂y
)h
]−g
[f +
(∂v∂x
)h−
(∂u∂y
)h
]∂θ
∂p,
αh ξah
θ
(u,v)
where and is the specific volume and absolute vorti-
city in the hybrid σ–p coordinate system, respectively. Theg is gravity, which is 9.8 m s−2, p is pressure, is potentialtemperature, f is the Coriolis parameter, is horizontalwind, and h indicates that the horizontal difference is car-ried out at the hybrid σ–p level. The surface PV is obtainedfrom the two bottom levels at the hybrid σ–p level. Moredetails about the calculation of surface PV can be found inSheng et al. (2021).
−∂θ/∂pθ p
The surface static stability is calculated as ,where and are obtained from the two bottom levels atthe hybrid σ–p level.
The horizontal water vapor flux (WVF) is calculated asfollows:
WVF = Vq = (uq,vq) ,
where q is specific humidity.Statistical methods, including linear regression, linear cor-
2 SURFACE PV OF TIBETAN PLATEAU AFFECTS EAST ASIAN SUMMER RAINFALL
IN PRESS
relation, Student’s t-test, empirical orthogonal function(EOF), and multivariate EOF (MVEOF), are used in thisstudy. The linear trends and decadal variation (more thannine years) in the data are removed to highlight the interan-nual variability.
2.3. Model
The linear baroclinic model (LBM) (Watanabe et al.,1999; Watanabe and Kimoto, 2000) is employed to investig-ate the responses of the upper-level circulation to the sur-face PV forcing over the TP. The model used in this studyhas 20 σ vertical levels. Each horizontal level is represen-ted by spherical harmonics with a resolution of T42. Moredetails about the model description can be found inWatanabe and Jin (2003). The LBM is a time-varyingmodel that linearizes the basic state based on primitive equa-tions. We take boreal summer climatology as the basic state
in this study. Since dissipation terms including biharmonichorizontal diffusion, weak vertical diffusion, Newtoniandamping, and Rayleigh friction are adopted, the modelresponse reaches its steady state at approximately 14 days.Therefore, we use the results averaged from the last 15 daysin the 30-day integration for analysis.
3. Results
3.1. Leading mode of surface TPPV, EASR, and upper-level circulation
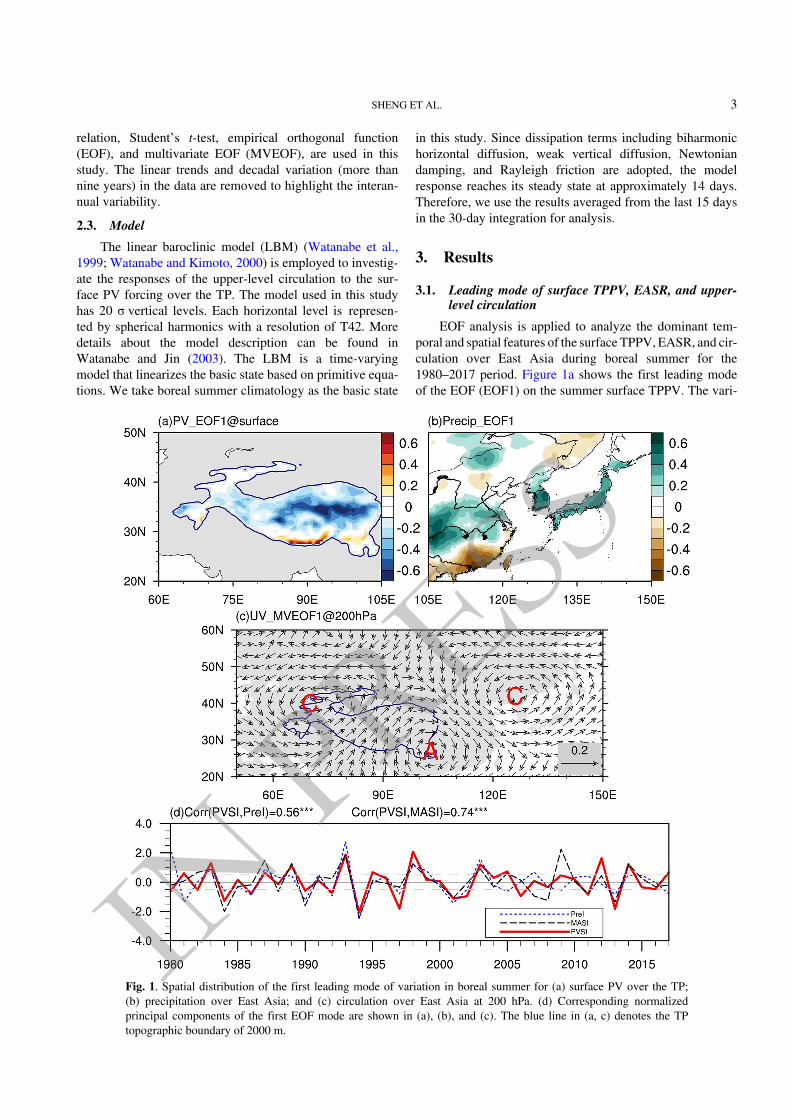
EOF analysis is applied to analyze the dominant tem-poral and spatial features of the surface TPPV, EASR, and cir-culation over East Asia during boreal summer for the1980–2017 period. Figure 1a shows the first leading modeof the EOF (EOF1) on the summer surface TPPV. The vari-
Fig. 1. Spatial distribution of the first leading mode of variation in boreal summer for (a) surface PV over the TP;(b) precipitation over East Asia; and (c) circulation over East Asia at 200 hPa. (d) Corresponding normalizedprincipal components of the first EOF mode are shown in (a), (b), and (c). The blue line in (a, c) denotes the TPtopographic boundary of 2000 m.
SHENG ET AL. 3
IN PRESS
ation in surface PV on the southern slope and in the southeast-ern corner of the TP has the opposite sign to that in the mainTP platform. Although the signs of the surface PV in thetwo areas are opposite, the southern area is quite small. In gen-eral, the distribution of EOF1 on surface PV shows a negat-ive uniform mode (PVNUM). The corresponding normal-ized first principal component of the EOF pattern (PC1) isdefined as the surface PV index (PVSI; red line), as shownin Fig. 1d. The variance percentage explained by the first lead-ing mode is 36%.
Figure 1b shows the EOF1 of EASR. The correspond-ing normalized PC1 is defined as the precipitation index(PreI; blue dashed line), as shown in Fig. 1d. The max-imum variation center of EASR occurs in the Yangtze Rivervalley, South Korea, Japan (YKJ), and southern China. Thevariation in EASR in YKJ has the opposite sign to that insouthern China. There is also a relatively weak dipole vari-ation mode in northern China. The dominant mode ofEASR obtained in this study is generally consistent withthat obtained by Zuo et al. (2011).
Using the NCEP-NCAR reanalysis over midlatitudeAsia in JJAS (i.e., June, July, August, and September) from1948 to 1998, Wu (2002) identified an interannual domin-ant pattern in the upper-level winds called the midlatitudeAsian summer (MAS) pattern. The MAS pattern in hisstudy features two anomalous cyclones, with one centeredat (37.5°N, 65°E) and the other centered at (42.5°N, 130°E).Following Wu (2002), we applied MVEOF analysis to the200-hPa wind anomaly to reveal the dominant circulationmode over midlatitude Asia during boreal summer. Thedomain for the MVEOF analysis is (20°–60°N, 50°–150°E),and the result is not sensitive to the domain. The first lead-ing mode of MVEOF (MVEOF1) is shown in Fig. 1c, andthe corresponding normalized PC1 is defined as the midlatit-ude Asian summer index (MASI; black dashed line) shownin Fig. 1d. Figure 1c shows two anomalous cyclones, onecentered northwest of the TP and one centered over northeast-ern Asia. In between the two large cyclones is an anticyc-lone over the southeastern corner of the TP. The anticyc-lone identified in this study is more prominent than that inWu (2002), which is partly because of the different reana-lysis data and partly because of the different periods. Fromhigh to low latitudes, the positive MAS generally shows a“CCA” pattern (i.e., cyclone–cyclone–anticyclone pattern).Correspondingly, the negative MAS generally shows an“AAC ” pattern (i.e., anticyclone–anticyclone–cyclone pat-tern).
To investigate the relationship of surface TPPV for-cing with the EASR and upper-level circulation over EastAsia, Fig. 1d shows the time series of PVSI, MASI, andPreI. PVSI shows significant correlations with PreI andMASI, with yield correlation coefficients of 0.56 and 0.74(both passing the 0.05 significance level), respectively.These results indicate that the EASR and the leading modeof circulation (i.e., MAS pattern) over East Asia are closelyrelated to the surface TPPV forcing.
3.2. Relationship of surface TPPV forcing with EASRand associated circulation
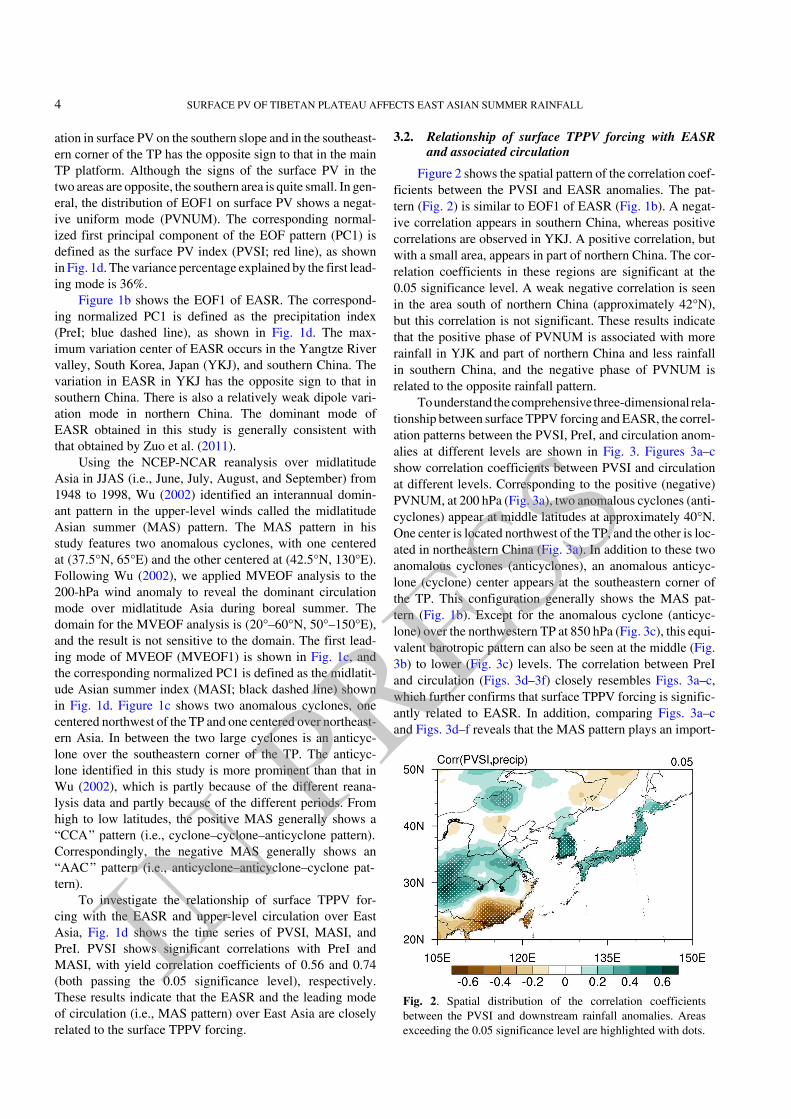
Figure 2 shows the spatial pattern of the correlation coef-ficients between the PVSI and EASR anomalies. The pat-tern (Fig. 2) is similar to EOF1 of EASR (Fig. 1b). A negat-ive correlation appears in southern China, whereas positivecorrelations are observed in YKJ. A positive correlation, butwith a small area, appears in part of northern China. The cor-relation coefficients in these regions are significant at the0.05 significance level. A weak negative correlation is seenin the area south of northern China (approximately 42°N),but this correlation is not significant. These results indicatethat the positive phase of PVNUM is associated with morerainfall in YJK and part of northern China and less rainfallin southern China, and the negative phase of PVNUM isrelated to the opposite rainfall pattern.
To understand the comprehensive three-dimensional rela-tionship between surface TPPV forcing and EASR, the correl-ation patterns between the PVSI, PreI, and circulation anom-alies at different levels are shown in Fig. 3. Figures 3a–cshow correlation coefficients between PVSI and circulationat different levels. Corresponding to the positive (negative)PVNUM, at 200 hPa (Fig. 3a), two anomalous cyclones (anti-cyclones) appear at middle latitudes at approximately 40°N.One center is located northwest of the TP, and the other is loc-ated in northeastern China (Fig. 3a). In addition to these twoanomalous cyclones (anticyclones), an anomalous anticyc-lone (cyclone) center appears at the southeastern corner ofthe TP. This configuration generally shows the MAS pat-tern (Fig. 1b). Except for the anomalous cyclone (anticyc-lone) over the northwestern TP at 850 hPa (Fig. 3c), this equi-valent barotropic pattern can also be seen at the middle (Fig.3b) to lower (Fig. 3c) levels. The correlation between PreIand circulation (Figs. 3d–3f) closely resembles Figs. 3a–c,which further confirms that surface TPPV forcing is signific-antly related to EASR. In addition, comparing Figs. 3a–cand Figs. 3d–f reveals that the MAS pattern plays an import-
Fig. 2. Spatial distribution of the correlation coefficientsbetween the PVSI and downstream rainfall anomalies. Areasexceeding the 0.05 significance level are highlighted with dots.
4 SURFACE PV OF TIBETAN PLATEAU AFFECTS EAST ASIAN SUMMER RAINFALL
IN PRESS

ant role in the connection between surface TPPV forcingand EASR.
4. Possible mechanism of the surface TPPVforcing affecting the EASR
To investigate the possible mechanism of surfaceTPPV forcing affecting EASR, the LBM is employed in thissection to examine the response of upper circulation to theanomalous heating related to surface TPPV forcing.
4.1. Diagnostic analysis
Surface PV is closely related to the static stabilitywithin the surface layer. Figure 4a shows the correlation coef-ficient between PVSI and static stability anomalies. The cor-relation between the PVSI and horizontal wind anomalies atthe surface and vertical motion (omega) anomalies at 500hPa are shown in Fig. 4b. Corresponding to the positivephase of PVNUM, the anomalous static stability over thewhole TP is significantly negative (Fig. 4a). This resultmeans that the air within the surface layer over the TP isanomalously statically unstable. As a result, the anomalousomega is significantly negative, accompanied by anomal-
ous upward motion occurring at the main body of the TP(Fig. 4b). Consequently, a significant anomalous cyclonic cir-culation is generated at the surface south of the TP (Fig. 4b).The negative phase of PVNUM corresponds to the oppositesituation of surface static stability and circulation pattern.
The anomalous south and north winds associated withthe anomalous circulation to the south of the TP (Fig. 4b)induced by surface TPPV forcing could lead to anomalousheating over the TP. Figure 5 shows the correlation coeffi-cient between PVSI and OLR (Fig. 5a) and regressed rain-fall anomalies against PVSI (Fig. 5b) to examine the distribu-tion of anomalous heating. A dipole mode of the OLR anom-alies is clearly observed in Fig. 5a. Corresponding to the posit-ive phase of PVNUM, positive OLR anomalies cover thesouthwestern TP to northern India. The highest negativeOLR anomalies mainly occur on the eastern TP, whereasthe highest positive OLR anomalies mainly occur on the west-ern TP. The anomalous cyclonic circulation (Fig. 4b), withcool and divergent flow to its western part and wet, warmflow to its eastern part, accounts for this clear dipole modeof the OLR (Fig. 5a). Consistent with the OLR, the rainfallanomalies also show a dipole mode (Fig. 5b) with less rain-fall over the southwestern TP and northern India and more
Fig. 3. Spatial distribution of the correlation coefficient between the PVSI and geopotential height anomalies (shading) andcirculation anomalies (vector, those passing the 0.05 significance level are shown) at (a) 200 hPa; (b) 500 hPa; and (c) 850hPa. Figures (d–f) are the same as Figs. (a–c), but for PreI. Areas exceeding the 0.05 significance level are highlighted withdots. The blue line denotes the TP topographic boundary of 3000 m.
SHENG ET AL. 5
IN PRESS

rainfall over the eastern TP. The rainfall anomalies indicatethat the strongest negative and positive condensational heat-ing anomalies occur at the southwestern TP to northernIndia and the eastern TP, respectively. Corresponding to thenegative phase of PVNUM, the situation is opposite.
4.2. Sensitivity experiments
The response of upper-level circulation to the negativeheating anomaly over northern India has been examined inWei et al. (2014). Because the lower latitude of the negat-ive heating anomaly over northern India (Fig. 5b) is faraway from the westerly jet (light green shading in Fig. 7) athigh latitudes in the north, the associated atmosphericresponse regarding the negative heating anomaly over north-ern India is trapped south of 40°N (Wei et al., 2014; seetheir Fig. 8), exhibiting a zonal dipole mode with an anomal-
ous cyclone to the west of 80°E and an anomalous anticyc-lone to the east of 80°E. There are some differencesbetween the circulation caused by the negative heating anom-aly over northern India (Wei et al., 2014; see their Fig. 8)and the MAS pattern (Fig. 3) related to EASR. Hence, regard-ing the negative heating anomalies centered on the southwest-ern TP and northern India, we focus on the southwestern TPin this study.
Based on the diagnostic analysis of heating anomaliesinduced by surface TPPV forcing, three groups of experi-ments are conducted. Expt1 is an experiment of positive heat-ing over the southeastern TP (Expt1, Figs. 6a–b). Expt2 isan experiment of negative heating over the southwestern TP(Expt2, Figs. 6c–d). Expt3 is an experiment of combined pos-itive and negative heating over the southeastern and south-western TP, respectively (Expt3, Fig. 6e). According to the
Fig. 4. Spatial distribution of the correlation coefficient between the PVSI and (a) surface static stability anomaliesand (b) horizontal wind anomalies at the surface (vector, those exceeding the 0.05 significance test are shown) and ωat 500 hPa (shading). Areas exceeding the 0.05 significance level are highlighted with dots. The blue line denotes theTP topographic boundary of 3000 m.
Fig. 5. Spatial distribution of the (a) correlation coefficient between the PVSI and OLR anomalies and (b) regressedrainfall anomalies against the PVSI (units: mm month−1). Areas exceeding the 0.05 significance level are highlightedwith dots. The blue line denotes the TP topographic boundary of 3000 m.
6 SURFACE PV OF TIBETAN PLATEAU AFFECTS EAST ASIAN SUMMER RAINFALL
IN PRESS

reanalysis, the heating centers are at 30°N, 99°E and 75°N,32°E in Expt1 and Expt2, respectively. The peaks of theideal heating profiles in Expt1 and Expt2 are 1.0 K d−1 and–1.0 K d−1, respectively. The peaks in the heating profile areat σ= 0.6 and σ= 0.4 in Expt1 and Expt2, respectively. Sincethe LBM is a linear model, the heating configuration(Fig. 6e) and atmospheric response (Fig. 7c) in Expt3 are lin-ear combinations of Expt1 and Expt2.
The atmospheric responses are shown in Fig. 7. InExpt1 (Fig. 7a), the positive heating anomaly over the east-ern TP triggers a local anomalous anticyclone and highheight at 200 hPa. The anomalous high is strengthened loc-ally with slight northward and westward dispersion. InExpt2 (Fig. 7b), the negative heating anomaly over the south-western TP stimulates a local anomalous cyclone and lowheight at 200 hPa. Compared with Wei et al. (2014),
because the location of the negative heating center over thesouthwestern TP is farther north than that over northernIndia, the anomalous cyclone could trigger waves in the west-erly jet and lead to an anomalous cyclone downstream overnortheastern China. In Expt3 (Fig. 7c), the response of atmo-spheric circulation with the “CCA” pattern is very similar tothe MAS pattern related to EASR (Figs. 3d–f). These res-ults indicate that the dipole heating mode induced by sur-face TPPV forcing can lead to a realistic MAS pattern,which is important for the formation of the anomalousEASR.
4.3. Influence of circulation anomalies on EASR
The above results indicate that surface TPPV forcingcan lead to the formation of the MAS pattern. In this sec-tion, we examine how the MAS pattern affects the EASR
Fig. 6. Specified ideal diabatic heating (units: K d−1) horizontal distribution in (a) Expt1; (c) Expt2; and (c) Expt3.Specified ideal diabatic heating (units: K d−1) profiles in (b) Expt1 and (d) Expt2. The blue line denotes the TPtopographic boundary of 3000 m.
SHENG ET AL. 7
IN PRESS

anomalies.Rainfall anomalies are related to water vapor transport
anomalies and their divergence at the lower level. Since atmo-spheric moisture is mainly concentrated at the middle tolower levels, Fig. 8 shows the correlation between PVSI andWVF and its divergence at 500 hPa (Fig. 8a) and 850 hPa(Fig. 8b). Generally, the anomalous WVF (Fig. 8) shows anequivalent barotropic structure. This equivalent barotropicstructure markedly resembles the MAS pattern. Correspond-ing to the positive phase of PVNUM, the anomalous cyc-lonic WVF (Fig. 8) over northeastern China embedded inthe MAS pattern converges water vapor over South Korea
and Japan and, cooperating with the southern anticyclonicWVF, converges the wet, warm southwesterly flow and dry,cold northerly wind to the Yangtze River valley. In addi-tion, an anomalous convergence of WVF (Fig. 8) occurs inpart of northern China. Hence, the EASR over YKJ and partof northern China is greater than normal (Fig. 2). Althoughthe WVF transfers water vapor to southern China, the WVFis divergent. Thus, the EASR over southern China is lowerthan normal (Fig. 2). Corresponding to the negative phaseof PVNUM, the situation is opposite. These results indicatethat the WVF anomalies related to the MAS pattern areresponsible for the EASR anomalies.
5. Conclusion and discussion
The present study investigates the relationship betweenthe surface PV forcing over the TP and EASR and the associ-ated circulation on the interannual timescale and the pos-sible mechanism. The main conclusions obtained from the res-ults are described as follows.
The correlation between the time series of the leadingmode of the surface PV forcing over the TP (i.e., PVNUM)and EASR and the leading mode of upper-level circulation(i.e., MAS pattern) are as high as 0.56 and 0.74, respect-ively. Moreover, the circulation related to PVNUM greatlyresembles the circulation associated with EASR. These res-ults indicated that the interannual EASR and related upper-level circulation over East Asia are closely linked to the sur-face PV forcing over the TP, and the MAS pattern plays animportant role in the PVNUM affecting EASR. Diagnosticanalysis indicates that the positive phase of PVNUM couldlead to unstable air within the surface layer over the TP. Asa result, anomalous upward motion and cyclonic circulationare generated over the TP. Induced by cyclonic circulation,a dipole heating mode with anomalous cooling over the south-western TP and anomalous heating over the southeastern TPappeared. Sensitivity experiments prove that the dipole heat-ing mode associated with the surface PV forcing over theTP can trigger the MAS pattern related to EASR anomalies.The MAS pattern converges water vapor to the YangtzeRiver valley, South Korea, Japan, and part of northernChina and diverges water vapor over southern China. There-fore, the EASR over the Yangtze River valley, South Korea,Japan, and part of northern China is greater than normal,and that over southern China is lower. The negative phaseof PVNUM is related to the opposite rainfall and circula-tion pattern. Consequently, the surface PV forcing over theTP exerts a significant influence on EASR by changing theair static stability within the surface layer over the TP andcausing the dipole heating mode and the subsequent anomal-ous water vapor transport related to the MAS pattern.
The aforementioned major mechanism is briefly shownschematically in Fig. 9. In summary, PVNUM triggerslower-level cyclonic circulation by reducing the surfacestatic stablity (Fig. 9b). The dipole heaing mode induced bythis cyclonic circulation could lead to anomalous circula-
Fig. 7. Responses of geopotential height (shading, units: gpm)and horizontal wind (vector, units: m s−1) at 200 hPa in (a)Expt1; (b) Expt2; and (c) Expt3. The blue line denotes the TPtopographic boundary of 3000 m. The light green shadingindicates a westerly jet with a zonal wind speed greater than20 m s−1 at 200 hPa. The “A” and “C” in Fig. 7c indicate theanomalous anticyclone and cyclone, respectively.
8 SURFACE PV OF TIBETAN PLATEAU AFFECTS EAST ASIAN SUMMER RAINFALL
IN PRESS

Fig. 8. Spatial distribution of the correlation coefficient between the PVSIand the divergence of WVF anomalies (shading) and WVF anomalies (vector,those passing the 0.05 significance level are shown) at (a) 500 hPa and(b) 850 hPa. Areas exceeding the 0.05 significance level are highlighted withdots. The blue line denotes the TP topographic boundary of 3000 m.
Fig. 9. Schematic showing the interannual surface TPPV influence on EASR. (a)Anomalous 200-hPa wind associated with surface TPPV forcing; (b) anomaloussurface TPPV; and (c) same as (a) but for rainfall anomalies. The red (blue) circleindicates diabatic heating (cooling). The green (red) vector indicates the lower-levelwind (upper-level Rossby wave propagation).
SHENG ET AL. 9
IN PRESS

tion at the upper level (Fig. 9a). As a result, the anomalouswater vapor transport (Fig. 8) embedded in the upper-levelanomalous circulation is responsible for EASR anomalies(Fig. 9c).
Previous studies (e.g., Wu, 2002) show that the MAS pat-tern is related to the Indian summer monsoon. We calcu-lated the concurrent correlation coefficient between theMASI and Indian summer monsoon index (defined byWang et al., 2001) and found that the correlation coeffi-cient reaches –0.45, passing the 0.05 significance test;however, when the index of the surface TPPV forcing (i.e.,PVSI, red line in Fig. 1d) is removed, it is reduced to –0.28,which does not pass the significance test. This result furtherconfirms the important role of surface TPPV forcing onEASR. ENSO is the most prominent interannual signal in cli-mate systems. We also calculated the correlation betweenthe summer PVSI and NINO3.4 index (SST averaged overthe region 5°S–5°N, 120°–170°W; https://psl.noaa.gov/data/climateindices/list/) in the preceding winter and concur-rent summer. The coefficients are 0.21 and –0.18, respect-ively, which do not pass the significance test, meaning thatthe relationship between surface TPPV forcing and EASR isunaffected by ENSO. It should be noted that some studies(e.g., Guan et al., 2015) suggested that North Atlantic Oscilla-tion, Pacific Decadal Oscillation, and Atlantic MultidecadalOscillation have great impact on surface air temperature,which is related to surface PV. The role of these decadal oscil-lations in the interdecadal variation of surface TPPV will beinvestigated in the future.
The present study only focuses on the impacts of theTP on monsoon rainfall over East Asia. The complicatedAsian summer monsoon system, greatly affected by the TP,includes the South Asian summer monsoon and the EastAsian summer monsoon. Research on the relationshipbetween the PV anomaly over the TP and monsoon rainfall,as well as wind fields over the Asian region will be conduc-ted in the future. In this study, although the simple model(e.g., LBM) clearly shows the impact of surface TPPV for-cing on EASR, it is still necessary to use a fully coupledmodel to examine the surface TPPV–rainfall–circulation feed-back to understand the interactions between the surface TPforcing and EASM system. Furthermore, with the help ofthe PV budget equation, the relative importance of dynamicPV advection, PV generation due to diabatic heating, and fric-tion effects to the variation of surface PV will be quantifica-tionally answered, which will greatly advance our understand-ing of the TP’s impacts.
Acknowledgements. We thank the reviewers for their con-structive suggestions and comments. This work is jointly suppor-ted by the National Natural Science Foundation of China (GrantNos. 91837101, 42122035, and 91937302) and the National KeyResearch and Development Program of China (Grant No.2018YFC1505706 and 2020YFA0608903).
Open Access This article is distributed under the terms of theCreative Commons Attribution 4.0 International License (http://cre-
ativecommons.org/licenses/by/4.0/), which permits unrestricteduse, distribution, and reproduction in any medium, provided yougive appropriate credit to the original author(s) and the source,provide a link to the Creative Commons license, and indicate ifchanges were made.
REFERENCES
Allaart, M. A. F., H. Kelder, and L. C. Heijboer, 1993: On the Rela-tion between Ozone and Potential Vorticity. Geophys. Res.Lett., 20, 811−814, https://doi.org/10.1029/93GL00822.
Bowley, K. A., J. R. Gyakum, and E. H. Atallah, 2019: A new per-spective toward cataloging northern hemisphere rossbywave breaking on the dynamic tropopause. Mon. Wea. Rev.,147, 409−431, https://doi.org/10.1175/MWR-D-18-0131.1.
Chen, L. X., J. P. Liu, X. J. Zhou, and P. X. Wang, 1999: Impactof uplift of Qinghai-Xizang Plateau and change of land-ocean distribution on climate over Asia. Quaternary Sci-ences, 314−329. (in Chinese with English abstract)
Danielsen, E. F., 1968: Stratospheric-tropospheric exchangebased on radioactivity, ozone and potential vorticity. J.Atmos. Sci., 25, 502−518, https://doi.org/10.1175/1520-0469(1968)025<0502:STEBOR>2.0.CO;2.
Ding, Y. H., 2007: The variability of the Asian summer mon-soon. J. Meteor. Soc. Japan, 85B, 21−54, https://doi.org/10.2151/jmsj.85B.21.
Ding, Y. H., and J. C. L. Chan, 2005: The East Asian summer mon-soon: An overview. Meteor. Atmos. Phys., 89, 117−142,https://doi.org/10.1007/s00703-005-0125-z.
Ding, Y. H., P. Liang, Y. J. Liu, and Y. C. Zhang, 2020:Multiscale variability of meiyu and its prediction: A newreview. J. Geophys. Res., 125, e2019JD031496, https://doi.org/10.1029/2019JD031496.
Duan, A. M., Y. M. Liu, and G. X. Wu, 2005: Heating status ofthe Tibetan Plateau from april to june and rainfall and atmo-spheric circulation anomaly over East Asia in midsummer. Sci-ence in China Series D: Earth Sciences, 48, 250−257, https://doi.org/10.1360/02yd0510.
Ertel, H., 1942: Ein neuer hydrodynamischer wirbelsatz. Meteorolo-gische Zeitschrift, 59, 271−281.
Flohn, H., 1957: Large-scale aspects of the “Summer Monsoon”in South and East Asia. J. Meteor. Soc. Japan, 35A,180−186, https://doi.org/10.2151/jmsj1923.35A.0_180.
Folkins, I., and C. Appenzeller, 1996: Ozone and potential vorti-city at the subtropical tropopause break. J. Geophys. Res.,101, 18787−18792, https://doi.org/10.1029/96JD01711.
Guan, X. D., J. P. Huang, R. X. Guo, and P. Lin, 2015: The roleof dynamically induced variability in the recent warmingtrend slowdown over the Northern Hemisphere. ScientificReports, 5, 12669, https://doi.org/10.1038/srep12669.
Hahn, D. G., and S. Manabe, 1975: The role of mountains in theSouth Asian monsoon circulation. J. Atmos. Sci., 32,1515−1541, https://doi.org/10.1175/1520-0469(1975)032<1515:TROMIT>2.0.CO;2.
Haynes, P. H., and M. E. McIntyre, 1987: On the evolution of vorti-city and potential vorticity in the presence of diabatic heat-ing and frictional or other forces. J. Atmos. Sci., 44,828−841, https://doi.org/10.1175/1520-0469(1987)044<0828:OTEOVA>2.0.CO;2.
Haynes, P. H., and M. E. McIntyre, 1990: On the conservationand impermeability theorems for potential vorticity. J.
10 SURFACE PV OF TIBETAN PLATEAU AFFECTS EAST ASIAN SUMMER RAINFALL
IN PRESS

Atmos. Sci., 47, 2021−2031, https://doi.org/10.1175/1520-0469(1990)047<2021:OTCAIT>2.0.CO;2.
Hoskins, B. J., 1991: Towards a PV-θ view of the general circula-tion. Tellus A, 43, 27−36, https://doi.org/10.3402/tellusa.v43i4.11936.
Hsu, H.-H., and X. Liu, 2003: Relationship between the TibetanPlateau heating and East Asian summer monsoon rainfall.Geophys. Res. Lett., 30, 2066, https://doi.org/10.1029/2003GL017909.
Huang, J. P., W. Chen, Z. P. Wen, G. J. Zhang, Z. X. Li, Z. Y.Zuo, and Q. Y. Zhao, 2019: Review of Chinese atmosphericscience research over the Past 70 Years: Climate and cli-mate change. Science China Earth Sciences, 62, 1514−1550,https://doi.org/10.1007/s11430-019-9483-5.
Huang, R. H., J. L. Chen, and G. Huang, 2007: Characteristicsand variations of the East Asian monsoon system and itsimpacts on climate disasters in China. Adv. Atmos. Sci., 24,993−1023, https://doi.org/10.1007/s00376-007-0993-x.
Jiang, D. B., Z. L. Ding, H. Drange, and Y. Q. Gao, 2008: Sensitiv-ity of East Asian climate to the progressive uplift and expan-sion of the Tibetan Plateau under the Mid-pliocene bound-ary conditions. Adv. Atmos. Sci., 25, 709−722, https://doi.org/10.1007/s00376-008-0709-x.
Kitoh, A., 2004: Effects of mountain uplift on East Asian sum-mer climate investigated by a coupled atmosphere-oceanGCM. J. Climate, 17, 783−802, https://doi.org/10.1175/1520-0442(2004)017<0783:EOMUOE>2.0.CO;2.
Kripalani, R. H., and A. Kulkarni, 1997: Climatic impact of ElNiño/La Niña on the Indian Monsoon: A new perspective.Weather, 52, 39−46, https://doi.org/10.1002/j.1477-8696.1997.tb06267.x.
Kripalani, R. H., and A. Kulkarni, 2001: Monsoon rainfall vari-ations and teleconnections over South and East Asia. Interna-tional Journal of Climatology, 21, 603−616, https://doi.org/10.1002/joc.625.
Kubota, H., Y. Kosaka, and S.-P. Xie, 2016: A 117-year longindex of the Pacific-Japan pattern with application to inter-decadal variability. International Journal of Climatology,36, 1575−1589, https://doi.org/10.1002/joc.4441.
Liang, X. Y., Y. M. Liu, and G. X. Wu, 2005: Effect of TibetanPlateau on the site of onset and intensity of the Asian sum-mer monsoon. Acta Meteorologica Sinica, 63, 799−805,https://doi.org/10.3321/j.issn:0577-6619.2005.05.023.(in Chinese with English abstract)
Liebmann, B., and C. A. Smith, 1996: Description of a complete(interpolated) outgoing longwave radiation dataset. Bull.Amer. Meteor. Soc., 77, 1275−1277.
Liu, X.-D., 1999: Influences of Qinghai-Xizang (Tibet) Plateauuplift on the atmospheric circulation, global climate and envir-onment changes. Plateau Meteorology, 18, 321−332, https://do i . o rg /10 .3321 / j . i s sn :1000-0534 .1999 .03 .008 .(in Chinese with English abstract)
Liu, X. D., and Z.-Y. Yin, 2002: Sensitivity of East Asian mon-soon climate to the uplift of the Tibetan Plateau. Palaeogeo-graphy, Palaeoclimatology, Palaeoecology, 183, 223−245,https://doi.org/10.1016/S0031-0182(01)00488-6.
Liu, Y. M., M. M. Lu, H. J. Yang, A. M. Duan, B. He, S. Yang,and G. X. Wu, 2020: Land-atmosphere-ocean coupling associ-ated with the Tibetan Plateau and its climate impacts.National Science Review, 7, 534−552, https://doi.org/10.1093/nsr/nwaa011.
Lucchesi, R., 2012: File specification for merra products. Gmao
Office Note No.1 (Version 2.3), 87 pp. Available fromhttps://gmao.gsfc.nasa.gov/pubs/docs/lucchesi528.pdf.
Ma, T. T., G. X. Wu, Y. M. Liu, Z. H. Jiang, and J. H. Yu, 2019:Impact of surface potential vorticity density forcing over theTibetan Plateau on the South China extreme precipitation inJanuary 2008. Part I: Data analysis. Journal of Meteorolo-gical Research, 33, 400−415, https://doi.org/10.1007/s13351-019-8604-1.
Mitchell, T. D., and P. D. Jones, 2005: An improved method of con-structing a database of monthly climate observations and asso-ciated high-resolution grids. International Journal of Climato-logy, 25, 693−712, https://doi.org/10.1002/joc.1181.
Rienecker, M. M., and Coauthors, 2011: MERRA: NASA's mod-ern-era retrospective analysis for research and applications. J.Climate, 24, 3624−3648, https://doi.org/10.1175/JCLI-D-11-00015.1.
Rossby, C.-G., 1940: Planetary flow patterns in the atmosphere.Quart. J. Roy. Meteor. Soc., 66, 68−87.
Ryoo, J.-M., Y. Kaspi, D. W. Waugh, G. N. Kiladis, D. E. Wal-iser, E. J. Fetzer, and J. Kim, 2013: Impact of rossby wavebreaking on U. S. west coast winter precipitation duringenso events. J. Climate, 26, 6360−6382, https://doi.org/10.1175/JCLI-D-12-00297.1.
Sandhya, M., S. Sridharan, M. I. Devi, and H. Gadhavi, 2015: Trop-ical upper tropospheric ozone enhancements due to poten-tial vorticity intrusions over Indian sector. Journal of Atmo-spheric and Solar-Terrestrial Physics, 132, 147−152, https://doi.org/10.1016/j.jastp.2015.07.014.
Sheng, C., and Coauthors, 2021: Characteristics of the potentialvorticity and its budget in the surface layer over the TibetanPlateau. International Journal of Climatology, 41, 439−455,https://doi.org/10.1002/joc.6629.
Wang, B., and Q. Zhang, 2002: Pacific-East Asian teleconnec-tion. Part II: How the philippine sea anomalous anticycloneis established during El Niño development. J. Climate, 15,3252−3265, https://doi.org/10.1175/1520-0442(2002)015<3252:PEATPI>2.0.CO;2.
Wang, B., R. G. Wu, and K.-M. Lau, 2001: Interannual variabil-ity of the Asian summer monsoon: Contrasts between theindian and the western North Pacific-East Asian monsoons.J. Climate, 14, 4073−4090, https://doi.org/10.1175/1520-0442(2001)014<4073:IVOTAS>2.0.CO;2.
Watanabe, M., and M. Kimoto, 2000: Atmosphere-ocean thermalcoupling in the North Atlantic: A positive feedback. Quart.J. Roy. Meteor. Soc., 126, 3343−3369, https://doi.org/10.1002/qj.49712657017.
Watanabe, M., and F.-F. Jin, 2003: A moist linear baroclinicmodel: Coupled dynamical-convective response to El Niño.J. Climate, 16, 1121−1139, https://doi.org/10.1175/1520-0442(2003)16<1121:AMLBMC>2.0.CO;2.
Watanabe, M., M. Kimoto, T. Nitta, and M. Kachi, 1999: A com-parison of decadal climate oscillations in the North Atlanticdetected in observations and a coupled GCM. J. Climate, 12,2920−2940, https://doi.org/10.1175/1520-0442(1999)012<2920:ACODCO>2.0.CO;2.
Wei, W., R. H. Zhang, M. Wen, X. Y. Rong, and T. Li, 2014:Impact of Indian summer monsoon on the South Asian highand its influence on summer rainfall over China. ClimateDyn., 43, 1257−1269, https://doi.org/10.1007/s00382-013-1938-y.
Wen, N., Z. Y. Liu, and L. Li, 2019: Direct ENSO impact on EastAsian summer precipitation in the developing summer. Cli-
SHENG ET AL. 11
IN PRESS

mate Dyn., 52, 6799−6815, https://doi.org/10.1007/s00382-018-4545-0.
Wu, G. X., and Y. P. Cai, 1997: Vertical wind shear and down-slid-ing slantwise vorticity development. Scientia Atmospheric Sin-ica, 21, 273−282, https://doi.org/10.3878/j.issn.1006-9895.1997.03.03. (in Chinese with English abstract)
Wu, G. X., and Y. S. Zhang, 1998: Tibetan Plateau forcing andthe timing of the monsoon onset over South Asia and theSouth China Sea. Mon. Wea. Rev., 126, 913−927, https://doi.org/10.1175/1520-0493(1998)126<0913:TPFATT>2.0.CO;2.
Wu, G. X., Y. P. Cai, and X. J. Tang, 1995: Moist potential vorti-city and slantwise vorticity development. Acta Meteorolo-gica Sinica, 53, 387−405, https://doi.org/10.11676/qxxb1995.045. (in Chinese with English abstract)
Wu, G. X., W. J. Li, and H. Guo, 1997: Sensible heat driven air-pump over the Tibetan Plateau and its impacts on the AsianSummer monsoon. Collections on the Memory of ZhaoJiuzhang, D. Z. Ye, Ed., Science Press, 116−126. (inChinese)
Wu, G. X., and Coauthors, 2007: The influence of mechanicaland thermal forcing by the Tibetan Plateau on Asian Cli-mate. Journal of Hydrometeorology, 8, 770−789, https://doi.org/10.1175/JHM609.1.
Wu, G. X., Y. M. Liu, B. W. Dong, X. Y. Liang, A. M. Duan, Q.Bao, and J. J. Yu, 2012: Revisiting Asian monsoon forma-tion and change associated with Tibetan Plateau forcing: I.Formation. Climate Dyn., 39, 1169−1181, https://doi.org/10.1007/s00382-012-1334-z.
Wu, G. X., Y. M. Liu, B. He, Q. Bao, and Z. Q. Wang, 2018:Review of the impact of the Tibetan Plateau sensible heatdriven air-pump on the Asian summer monsoon. ChineseJournal of Atmospheric Sciences, 42, 488−504, https://doi.org/10.3878/j.issn.1006-9895.1801.17279.
Wu, R. G., 2002: A Mid-Latitude Asian circulation anomaly pat-tern in boreal summer and its connection with the Indian andEast Asian summer monsoons. International Journal of Clima-tology, 22, 1879−1895, https://doi.org/10.1002/joc.845.
Xie, S.-P., K. M. Hu, J. Hafner, H. Tokinaga, Y. Du, G. Huang,and T. Sampe, 2009: Indian ocean capacitor effect on Indo-Western pacific climate during the summer following ElNiño. J. Climate, 22, 730−747, https://doi.org/10.1175/2008JCLI2544.1.
Xie, S.-P., Y. Kosaka, Y. Du, K. M. Hu, J. S. Chowdary, and G.Huang, 2016: Indo-Western pacific ocean capacitor and coher-ent climate anomalies in Post-ENSO summer: A review.Adv. Atmos. Sci., 33, 411−432, https://doi.org/10.1007/s00376-015-5192-6.
Xu, X. D., T. L. Zhao, X. H. Shi, and C. G. Lu, 2015: A study of
the role of the Tibetan Plateau's thermal forcing in modulat-ing rainband and moisture transport in Eastern China. ActaMeteorologica Sinica, 73, 20−35, https://doi.org/10.11676/qxxb2014.051. (in Chinese with English abstract)
Yanai, M., C. F. Li, and Z. S. Song, 1992: Seasonal heating of theTibetan Plateau and its effects on the evolution of the Asiansummer monsoon. J. Meteor. Soc. Japan, 70, 319−351,https://doi.org/10.2151/jmsj1965.70.1B_319.
Yang, J. L., Q. Y. Liu, S.-P. Xie, Z. Y. Liu, and L. X. Wu, 2007:Impact of the Indian ocean Sst basin mode on the Asian sum-mer monsoon. Geophys. Res. Lett., 34, L02708, https://doi.org/10.1029/2006GL028571.
Ye, D. Z., and Y. X. Gao, 1979: The meteorology (Tibet) Plat-eau. Science Press, 278 pp. (in Chinese)
Yeh, T.-C., S. W. Lo, and P. C. Chu, 1957: The wind structureand heat balance in the lower troposphere over Tibetan Plat-eau and its surrounding. Acta Meteorologica Sinica, 28,108−121, https://doi.org/10.11676/qxxb1957.010. (in Chinesewith English abstract)
Yu, J. H., Y. M. Liu, T. T. Ma, and G. X. Wu, 2019: Impact of sur-face potential vorticity density forcing over the Tibetan Plat-eau on the South China extreme precipitation in January2008. Part Ⅱ: Numerical simulation. Journal of Meteorolo-gical Research, 33, 416−432, https://doi.org/10.1007/s13351-019-8606-z.
Zhang, G. S., J. Y. Mao, G. X. Wu, and Y. M. Liu, 2021: Impactof potential vorticity anomalies around the Eastern TibetanPlateau on Quasi-Biweekly oscillations of summer rainfallwithin and South of the Yangtze Basin in 2016. ClimateDyn., 56, 813−835, https://doi.org/10.1007/s00382-020-05505-x.
Zhao, L. and Y. H. Ding, 2009: Potential vorticity analysis ofcold air activities during the East Asian summer monsoon.Chinese Journal of Atmospheric Sciences, 33, 359−374,https://doi.org/10.3878/j.issn.1006-9895.2009.02.14.(in Chinese with English abstract)
Zhao, P., and L. X. Chen, 2001: Climatic features of atmosphericheat source/sink over the Qinghai-Xizang Plateau in 35years and its relation to rainfall in China. Science in ChinaSeries D: Earth Sciences, 44, 858−864, https://doi.org/10.1007/BF02907098.
Zhou, X. Y., F. Liu, B. Wang, B. Q. Xiang, C. Xing, and H.Wang, 2019: Different responses of East Asian summer rain-fall to El Niño decays. Climate Dyn., 53, 1497−1515, https://doi.org/10.1007/s00382-019-04684-6.
Zuo, Z. Y., R. H. Zhang, and P. Zhao, 2011: The relation of vegeta-tion over the Tibetan Plateau to rainfall in China during theboreal summer. Climate Dyn., 36, 1207−1219, https://doi.org/10.1007/s00382-010-0863-6.
12 SURFACE PV OF TIBETAN PLATEAU AFFECTS EAST ASIAN SUMMER RAINFALL
IN PRESS